Estimating Market Potential Check-List
31
The University of Georgia Center for Agribusiness and Economic Development College of Agricultural and Environmental Sciences Estimating Market Potential Check-List Prepared by: Kent Wolfe Center Report 06-08 September, 2006
Transcript of Estimating Market Potential Check-List

The University of Georgia
Center for Agribusiness and Economic Development
College of Agricultural and Environmental Sciences
Estimating Market Potential Check-List
Prepared by: Kent WolfeCenter Report 06-08
September, 2006

TABLE OF CONTENTS
Estimating Market Potential Check-List. . . . . . . . . . . . . . . . . . . . . . . . . . . . . . . . . . . . . . . . . . . . 1
Market or Trade Area.. . . . . . . . . . . . . . . . . . . . . . . . . . . . . . . . . . . . . . . . . . . . . . . . . . . . . . . . . . 5
Market Size. . . . . . . . . . . . . . . . . . . . . . . . . . . . . . . . . . . . . . . . . . . . . . . . . . . . . . . . . . . . . . . . . . . 6
Competitor Analysis. . . . . . . . . . . . . . . . . . . . . . . . . . . . . . . . . . . . . . . . . . . . . . . . . . . . . . . . . . . . 7
Pricing. . . . . . . . . . . . . . . . . . . . . . . . . . . . . . . . . . . . . . . . . . . . . . . . . . . . . . . . . . . . . . . . . . . . . . . 8
Market Outlook. . . . . . . . . . . . . . . . . . . . . . . . . . . . . . . . . . . . . . . . . . . . . . . . . . . . . . . . . . . . . . . . 9
Market Share. . . . . . . . . . . . . . . . . . . . . . . . . . . . . . . . . . . . . . . . . . . . . . . . . . . . . . . . . . . . . . . . . 10
Appendix A: . . . . . . . . . . . . . . . . . . . . . . . . . . . . . . . . . . . . . . . . . . . . . . . . . . . . . . . . . . . . . . . . . 13
Sources of Demographic Information. . . . . . . . . . . . . . . . . . . . . . . . . . . . . . . . . . . . . . . . . . . . . . 14
Appendix B:. . . . . . . . . . . . . . . . . . . . . . . . . . . . . . . . . . . . . . . . . . . . . . . . . . . . . . . . . . . . . . . . . . 15
Sources of Lifestyle Information. . . . . . . . . . . . . . . . . . . . . . . . . . . . . . . . . . . . . . . . . . . . . . . . . 16
Appendix C:. . . . . . . . . . . . . . . . . . . . . . . . . . . . . . . . . . . . . . . . . . . . . . . . . . . . . . . . . . . . . . . . . . 17
Sources of Market Area Information. . . . . . . . . . . . . . . . . . . . . . . . . . . . . . . . . . . . . . . . . . . . . . . 18
Appendix D:.. . . . . . . . . . . . . . . . . . . . . . . . . . . . . . . . . . . . . . . . . . . . . . . . . . . . . . . . . . . . . . . . . 20
Sources of Consumption Information. . . . . . . . . . . . . . . . . . . . . . . . . . . . . . . . . . . . . . . . . . . . . . 21
Appendix E:. . . . . . . . . . . . . . . . . . . . . . . . . . . . . . . . . . . . . . . . . . . . . . . . . . . . . . . . . . . . . . . . . . 22
Sources of Competitor Information. . . . . . . . . . . . . . . . . . . . . . . . . . . . . . . . . . . . . . . . . . . . . . . . 23
Appendix F.. . . . . . . . . . . . . . . . . . . . . . . . . . . . . . . . . . . . . . . . . . . . . . . . . . . . . . . . . . . . . . . . . . 24
Market Potential Worksheet. . . . . . . . . . . . . . . . . . . . . . . . . . . . . . . . . . . . . . . . . . . . . . . . . . . . . 25
1
Estimating Market Potential Check-List
Estimating the market or market potential for a new business or business expansion is critical indetermining the economic feasibility of a venture. Estimating the market potential will determineif the market is large enough to support your businesses. This check-list will address a numberof questions that need to be answered before an estimate can be calculated.
What type of customer will buy the product or service?Where are these customers located?How many potential customers (N) are there?How often do they consume or use it?What is the Competition?What are people paying?What is the Potential for the Market to Develop?What is my share of the Market?
This check-list will walk you through estimating the market potential for your business and/orestimating the retail trade area market potential if you have a retail establishment by goingthrough these questions and providing examples.
Estimating Market PotentialEstimating the market potential for a business is critical in evaluating its viability and providesan estimate of the maximum total sales potential for a given market. Once the estimated marketpotential has been calculated, it is possible to determine if the market is large enough to sustainyour proposed business or sustain an addition competitor in the marketplace. It is important toremember that the estimated market potential sets an upper boundary on the market size and canbe expressed in either units and/or sales. Unless there are no direct or indirect competitors, abusiness will capture a share of the total estimated market potential not all of it. The following provide the steps and data necessary to estimate the market potential. These willbe discussed in detail later.
Key Steps in Estimating Market Potential: 1. Define your target market and market segments.
2. Define the geographic boundaries of your market.3. Derive an average selling price.4. Determine the average annual consumption.
Estimating the market potential for a business requires specific information on the number ofpeople or potential buyers, an average selling price, and an estimate of consumption or usage fora specific period of time. Once this information has been collected, it can be plugged into thefollowing formula to derive the estimated market potential.

2
Estimating Market Potential: ; Where:
MP = market potentialN = number of possible buyers P = average selling priceQ = average annual consumption
However, the better the information that is being plugged into the formula, the better the estimateof the market potential. The variables in the above formula will be described in more detail aswell as more specific information on the types of information required will be provided later.
Retail market potentialIf you are evaluating a retail establishment, a more refined method of calculating the retail tradearea market potential is available. The market potential for a retail establishment provided anestimate of the maximum total sales potential for a specific retail operation in a given market. Aswith the general market potential estimate, the market potential sets an upper boundary on themarket size and can be expressed in either units and/or sales. The following are the steps andinformation that are needed to estimate the retail trade area market potential.
Key Steps in Estimating Market Potential: 1. Define your target market and market segments.2. Define the geographic boundaries of your market.3. Derive average expenditures for the category.4. Determine the average household income for the area and state.5. Estimate market share.
As with estimating the market potential for any business, estimating the retail trade area marketpotential requires specific information on the number of people or potential buyers, an averageexpenditure figure for the retail category, area and state income figures, and an estimate ofmarket share. Once this information has been collected, it can be plugged into the followingformula to derive the estimated retail trade area market potential.
Trade Area Analysis is a mean of evaluating the potential retail sales for a specific retailoperation can be estimated by using a standard formula:
ES= P x EXP x (ADI/MDI) x MS, whereES = estimated salesP = market area populationEXP = average expenditures for retail outlet categoryADI = area estimated average household disposable incomeMDI = Georgia average household disposable incomeMS= estimated market share
The following material will provide direction and information needed to estimate the market
3
potential. There are a number of factors that need to be investigated in order to derive the bestestimate possible.
Target Market One of the most important components of estimating the market potential for a business is todetermine its target market. A target market can be thought of as the customers who are mostlikely to buy from you and generally are described using demographic variables (gender, age,education) as well as psychographic variables (lifestyle and belief system variables). In manycases, a business may have more than one target market. Think about the automobile industry,automobile manufactures have a number of target markets, i.e., truck buyers, luxury car buyers,economy buyers. Your business should be able to develop specific profiles for each of your targetmarkets using demographic and psychographic variables.
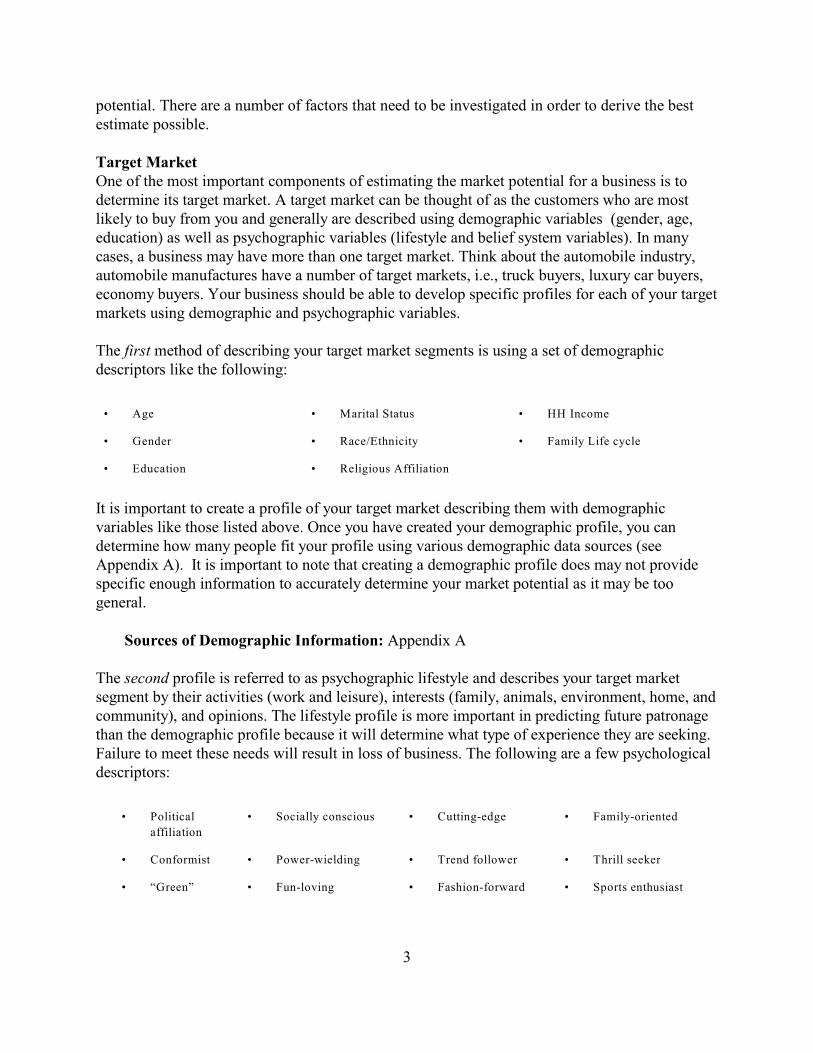
The first method of describing your target market segments is using a set of demographicdescriptors like the following:
• Age • Marital Status • HH Income
• Gender • Race/Ethnicity • Family Life cycle
• Education • Religious Affiliation
It is important to create a profile of your target market describing them with demographicvariables like those listed above. Once you have created your demographic profile, you candetermine how many people fit your profile using various demographic data sources (seeAppendix A). It is important to note that creating a demographic profile does may not providespecific enough information to accurately determine your market potential as it may be toogeneral.
Sources of Demographic Information: Appendix A
The second profile is referred to as psychographic lifestyle and describes your target marketsegment by their activities (work and leisure), interests (family, animals, environment, home, andcommunity), and opinions. The lifestyle profile is more important in predicting future patronagethan the demographic profile because it will determine what type of experience they are seeking.Failure to meet these needs will result in loss of business. The following are a few psychologicaldescriptors:
• Political
affiliation
• Socially conscious • Cutting-edge • Family-oriented
• Conformist • Power-wielding • Trend follower • Thrill seeker
• “Green” • Fun-loving • Fashion-forward • Sports enthusiast
4
Psychographic information is more difficult to obtain than demographic information. As a result,it is less frequently used when determining a target market profile.
Sources of Lifestyle Information: Appendix B
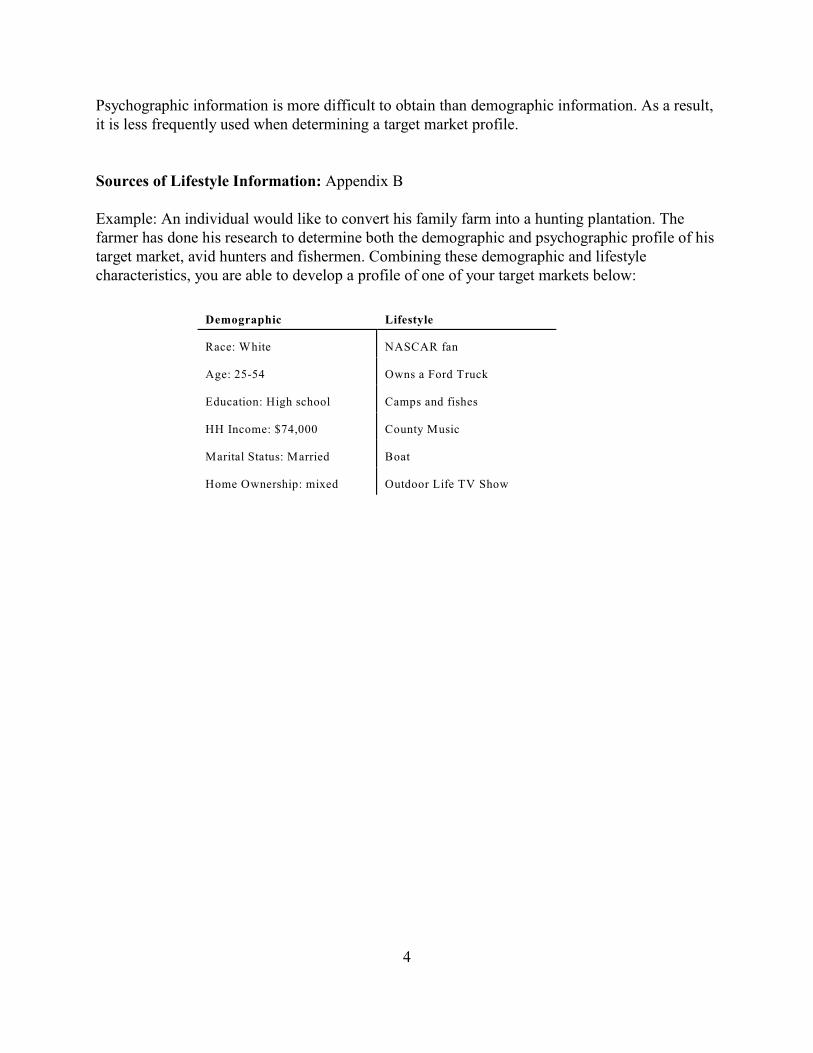
Example: An individual would like to convert his family farm into a hunting plantation. Thefarmer has done his research to determine both the demographic and psychographic profile of histarget market, avid hunters and fishermen. Combining these demographic and lifestylecharacteristics, you are able to develop a profile of one of your target markets below:
Demographic Lifestyle
Race: White NASCAR fan
Age: 25-54 Owns a Ford Truck
Education: High school Camps and fishes
HH Income: $74,000 County Music
Marital Status: Married Boat
Home Ownership: mixed Outdoor Life TV Show
5
Market or Trade AreaThe market area can be thought of as the geographic area where the business intends to operate,i.e., a city block, between the rivers or the globe. Defining the market area is important because itdefines the geographic area where potential consumers live and/or work. However, not everyonein the defined market area will be a customer. As a result, it is important to compare your targetmarket profile, generally described using demographics, to the population in the market area.There are a number of ways to define a market area, some are easy and others are more difficultand require the services of a marketing professional.
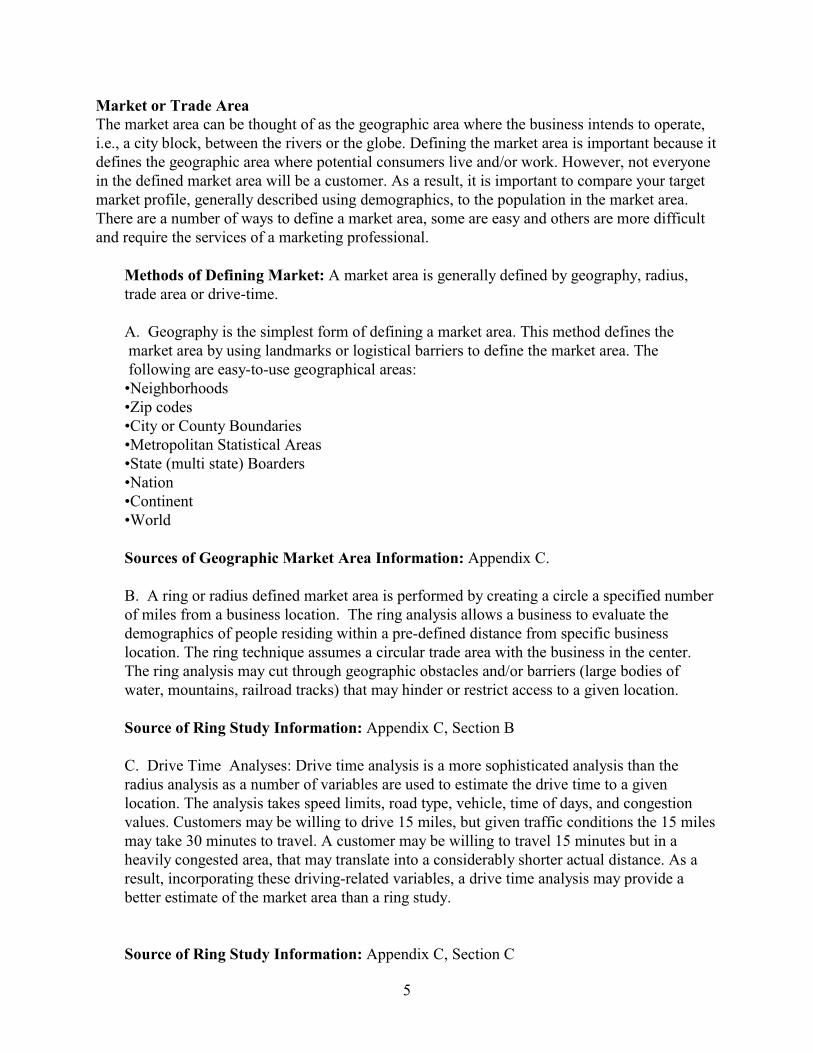
Methods of Defining Market: A market area is generally defined by geography, radius,trade area or drive-time.
A. Geography is the simplest form of defining a market area. This method defines the market area by using landmarks or logistical barriers to define the market area. The following are easy-to-use geographical areas:•Neighborhoods •Zip codes•City or County Boundaries•Metropolitan Statistical Areas•State (multi state) Boarders•Nation•Continent•World
Sources of Geographic Market Area Information: Appendix C.
B. A ring or radius defined market area is performed by creating a circle a specified numberof miles from a business location. The ring analysis allows a business to evaluate thedemographics of people residing within a pre-defined distance from specific businesslocation. The ring technique assumes a circular trade area with the business in the center.The ring analysis may cut through geographic obstacles and/or barriers (large bodies ofwater, mountains, railroad tracks) that may hinder or restrict access to a given location.
Source of Ring Study Information: Appendix C, Section B
C. Drive Time Analyses: Drive time analysis is a more sophisticated analysis than theradius analysis as a number of variables are used to estimate the drive time to a givenlocation. The analysis takes speed limits, road type, vehicle, time of days, and congestionvalues. Customers may be willing to drive 15 miles, but given traffic conditions the 15 milesmay take 30 minutes to travel. A customer may be willing to travel 15 minutes but in aheavily congested area, that may translate into a considerably shorter actual distance. As aresult, incorporating these driving-related variables, a drive time analysis may provide abetter estimate of the market area than a ring study.
Source of Ring Study Information: Appendix C, Section C

6
Market SizeOnce the market area and target market has been defined, it is possible to determine the numberof potential customers for your business. This will allow you to estimate the N (number ofpotential customers) in the market potential equation. This total market potential will typicallyhave to be adjusted downward to account for non-users. This information is readily available andfound in Appendix D in the Sources of Consumption Information Section.
Example: An agritourism operation has decided its will target its market towards children under9 years old. The business has concluded its market area is Wake County which has 101,768children under 9 years old. Therefore, N = 101,600 potential customers. These numbers wereobtained from the US Census Bureau.
However, not all children under 9 years of age will visit an agricultural facility. It is important toadjust these figures to get a more accurate estimate of the actual market potential. A survey ofelementary school teachers found that only 68% of kindergarten through 3 grade teachersrd
indicated they would take an agriculturally-related field trip in the next year.
As a result, the 101,600 kindergarten through 3 graders should be adjusted downward byrd
multiplying by 68%. This results in an adjusted market potential of 69,088 potential students.
Adjusted Market Potential = 101,600*68% = 69,088
Sources of Consumption Information: Appendix D
Consumption or Usage
You need to determine how often your target market segment uses your product or service. Thisfigure will have a significant impact on the estimated market potential. For instance, is theproduct purchased frequently, occasionally, or infrequently? Obviously the more frequently theproduct is purchased, the larger the market potential. Durable goods, products that can be usedover a long period of time, are purchased less frequently than perishable items. As a result, theannual consumption of apples is greater than the annual consumption of television sets. There isan abundance of consumption information from the government as well as industry tradeassociations. For example, the USDA collects volumes of disappearance data for commoditiesthat is converted into per capita annual usage estimates.
Example: It is important to determine how often these school groups will take an agriculturally-based field trip. A study of elementary school teachers indicated that they will take an average of1.25 agriculturally-based field trips per year. Therefore, we can use 1.25 as our usage orconsumption of agriculturally-based field trips, (Q = 1.25).
Estimating Market Potential:
Sources of Consumption Information: Appendix D
7
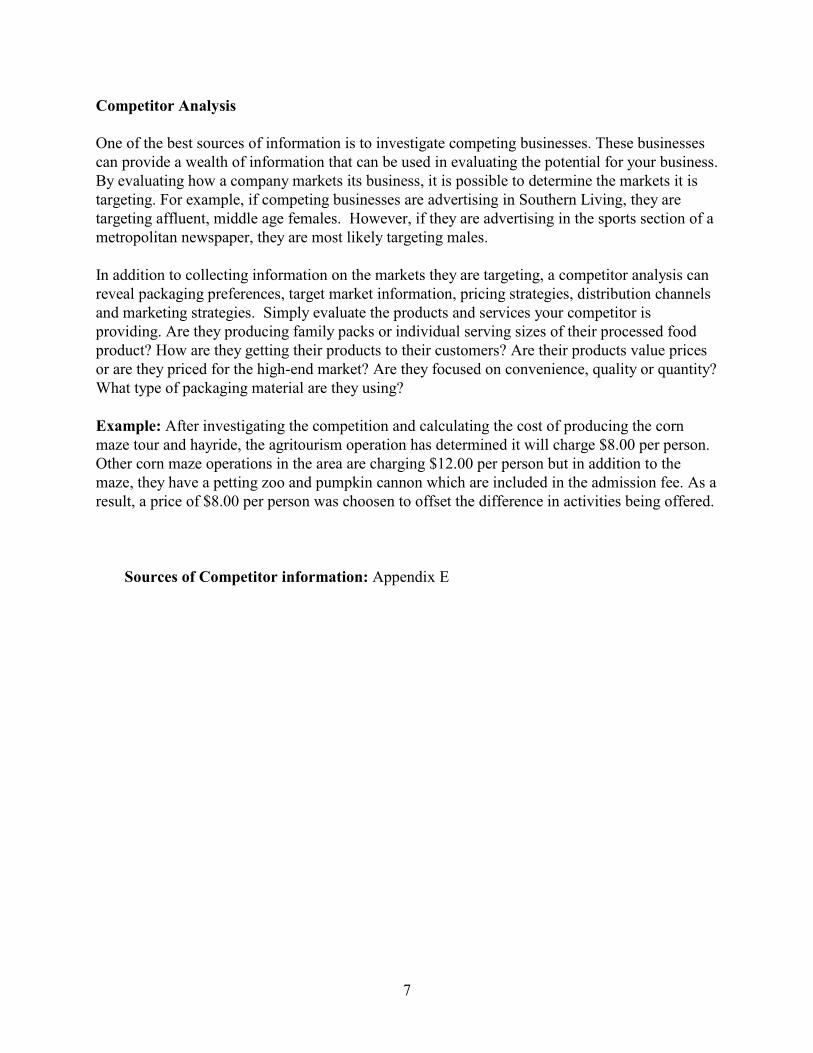
Competitor Analysis
One of the best sources of information is to investigate competing businesses. These businessescan provide a wealth of information that can be used in evaluating the potential for your business.By evaluating how a company markets its business, it is possible to determine the markets it istargeting. For example, if competing businesses are advertising in Southern Living, they aretargeting affluent, middle age females. However, if they are advertising in the sports section of ametropolitan newspaper, they are most likely targeting males.
In addition to collecting information on the markets they are targeting, a competitor analysis canreveal packaging preferences, target market information, pricing strategies, distribution channelsand marketing strategies. Simply evaluate the products and services your competitor isproviding. Are they producing family packs or individual serving sizes of their processed foodproduct? How are they getting their products to their customers? Are their products value pricesor are they priced for the high-end market? Are they focused on convenience, quality or quantity?What type of packaging material are they using?
Example: After investigating the competition and calculating the cost of producing the cornmaze tour and hayride, the agritourism operation has determined it will charge $8.00 per person.Other corn maze operations in the area are charging $12.00 per person but in addition to themaze, they have a petting zoo and pumpkin cannon which are included in the admission fee. As aresult, a price of $8.00 per person was choosen to offset the difference in activities being offered.
Sources of Competitor information: Appendix E
8
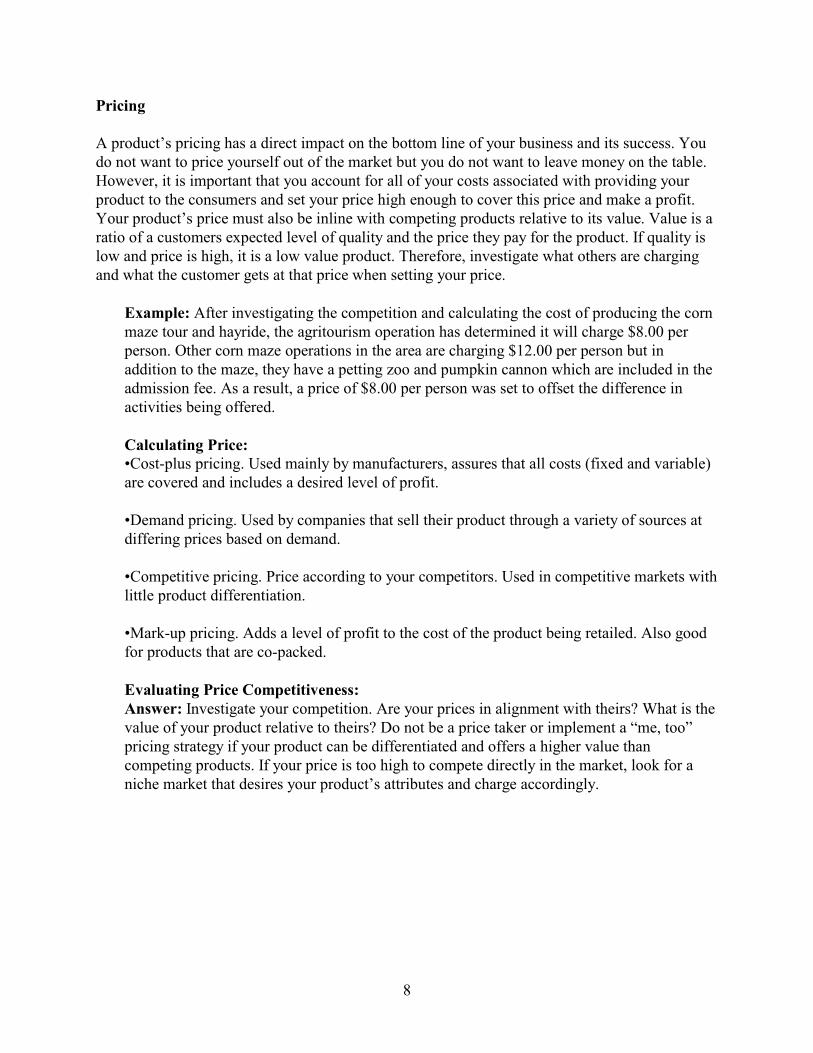
Pricing
A product’s pricing has a direct impact on the bottom line of your business and its success. Youdo not want to price yourself out of the market but you do not want to leave money on the table.However, it is important that you account for all of your costs associated with providing yourproduct to the consumers and set your price high enough to cover this price and make a profit.Your product’s price must also be inline with competing products relative to its value. Value is aratio of a customers expected level of quality and the price they pay for the product. If quality islow and price is high, it is a low value product. Therefore, investigate what others are chargingand what the customer gets at that price when setting your price.
Example: After investigating the competition and calculating the cost of producing the cornmaze tour and hayride, the agritourism operation has determined it will charge $8.00 perperson. Other corn maze operations in the area are charging $12.00 per person but inaddition to the maze, they have a petting zoo and pumpkin cannon which are included in theadmission fee. As a result, a price of $8.00 per person was set to offset the difference inactivities being offered.
Calculating Price:•Cost-plus pricing. Used mainly by manufacturers, assures that all costs (fixed and variable)are covered and includes a desired level of profit.
•Demand pricing. Used by companies that sell their product through a variety of sources atdiffering prices based on demand.
•Competitive pricing. Price according to your competitors. Used in competitive markets withlittle product differentiation.
•Mark-up pricing. Adds a level of profit to the cost of the product being retailed. Also goodfor products that are co-packed.
Evaluating Price Competitiveness:Answer: Investigate your competition. Are your prices in alignment with theirs? What is thevalue of your product relative to theirs? Do not be a price taker or implement a “me, too”pricing strategy if your product can be differentiated and offers a higher value thancompeting products. If your price is too high to compete directly in the market, look for aniche market that desires your product’s attributes and charge accordingly.

9
Market Outlook
The situational analysis can be thought of as a comprehensive investigation into the businessenvironment in which your company will be operating. This analysis will allow you to determinethe health of the industry, is it expanding, declining or stagnate. This should include an industryoverview focused on industry trends and should provide a general review of the industry as wellas research into regulatory and social implications that would directly or indirectly impact thedemand or perception of your business.
One important aspect is to determine if the market is saturated or if there is room for newbusinesses. Using the Market Development Index (MDI) it is possible to determine a product’slifecycle. The formula for estimating this is as follows:
MDI = (Current market demand ÷ Maximum Market Potential) * 100 • MDI < 33 (Considerable growth potential. High growth market, high prices and basic
benefits.
• MDI 33-67 Growth potential but need to offer more than basic product and compete at lowerprice.
• MDI > 67 Mature market, still room for growth but becoming commodity products. Need tohave very differentiated products to meet specific customer needs.
10
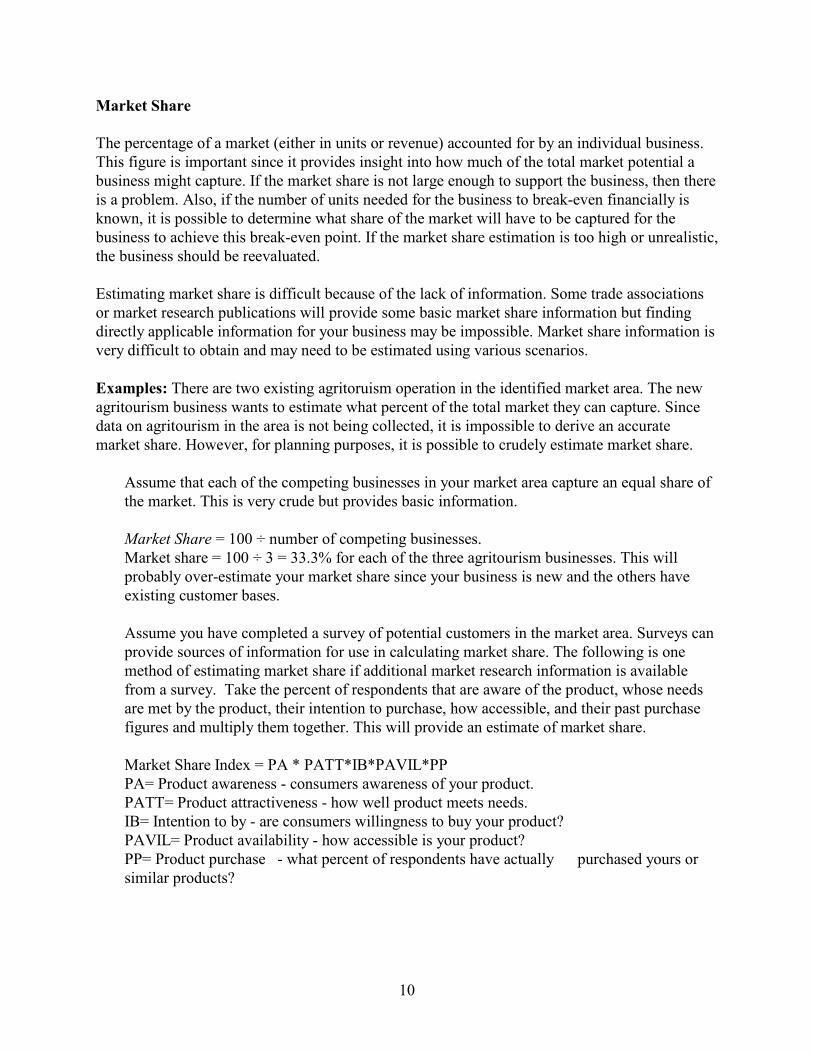
Market Share
The percentage of a market (either in units or revenue) accounted for by an individual business.This figure is important since it provides insight into how much of the total market potential abusiness might capture. If the market share is not large enough to support the business, then thereis a problem. Also, if the number of units needed for the business to break-even financially isknown, it is possible to determine what share of the market will have to be captured for thebusiness to achieve this break-even point. If the market share estimation is too high or unrealistic,the business should be reevaluated.
Estimating market share is difficult because of the lack of information. Some trade associationsor market research publications will provide some basic market share information but findingdirectly applicable information for your business may be impossible. Market share information isvery difficult to obtain and may need to be estimated using various scenarios.
Examples: There are two existing agritoruism operation in the identified market area. The newagritourism business wants to estimate what percent of the total market they can capture. Sincedata on agritourism in the area is not being collected, it is impossible to derive an accuratemarket share. However, for planning purposes, it is possible to crudely estimate market share.
Assume that each of the competing businesses in your market area capture an equal share ofthe market. This is very crude but provides basic information.
Market Share = 100 ÷ number of competing businesses.Market share = 100 ÷ 3 = 33.3% for each of the three agritourism businesses. This willprobably over-estimate your market share since your business is new and the others haveexisting customer bases.
Assume you have completed a survey of potential customers in the market area. Surveys canprovide sources of information for use in calculating market share. The following is onemethod of estimating market share if additional market research information is availablefrom a survey. Take the percent of respondents that are aware of the product, whose needsare met by the product, their intention to purchase, how accessible, and their past purchasefigures and multiply them together. This will provide an estimate of market share.
Market Share Index = PA * PATT*IB*PAVIL*PPPA= Product awareness - consumers awareness of your product. PATT= Product attractiveness - how well product meets needs.IB= Intention to by - are consumers willingness to buy your product?PAVIL= Product availability - how accessible is your product?PP= Product purchase - what percent of respondents have actually purchased yours orsimilar products?
11
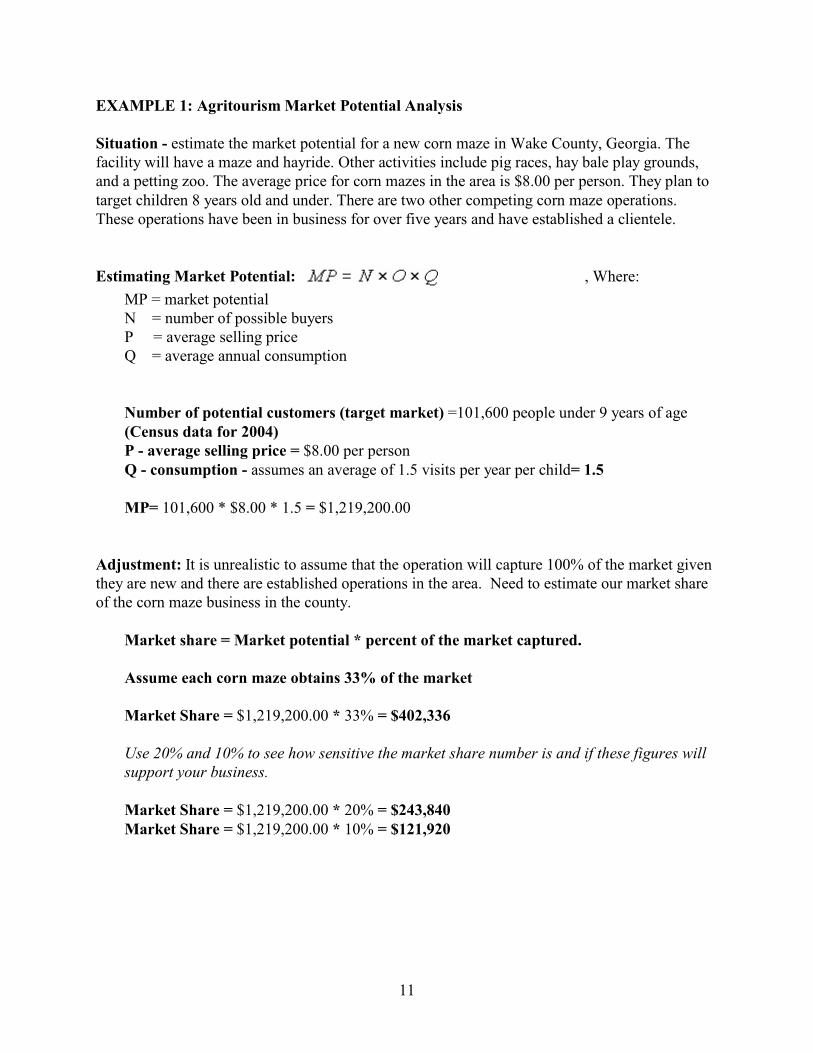
EXAMPLE 1: Agritourism Market Potential Analysis
Situation - estimate the market potential for a new corn maze in Wake County, Georgia. Thefacility will have a maze and hayride. Other activities include pig races, hay bale play grounds,and a petting zoo. The average price for corn mazes in the area is $8.00 per person. They plan totarget children 8 years old and under. There are two other competing corn maze operations.These operations have been in business for over five years and have established a clientele.
Estimating Market Potential: , Where:
MP = market potentialN = number of possible buyersP = average selling priceQ = average annual consumption
Number of potential customers (target market) =101,600 people under 9 years of age(Census data for 2004)P - average selling price = $8.00 per person Q - consumption - assumes an average of 1.5 visits per year per child= 1.5
MP= 101,600 * $8.00 * 1.5 = $1,219,200.00
Adjustment: It is unrealistic to assume that the operation will capture 100% of the market giventhey are new and there are established operations in the area. Need to estimate our market shareof the corn maze business in the county.
Market share = Market potential * percent of the market captured.
Assume each corn maze obtains 33% of the market
Market Share = $1,219,200.00 * 33% = $402,336
Use 20% and 10% to see how sensitive the market share number is and if these figures willsupport your business.
Market Share = $1,219,200.00 * 20% = $243,840Market Share = $1,219,200.00 * 10% = $121,920
12
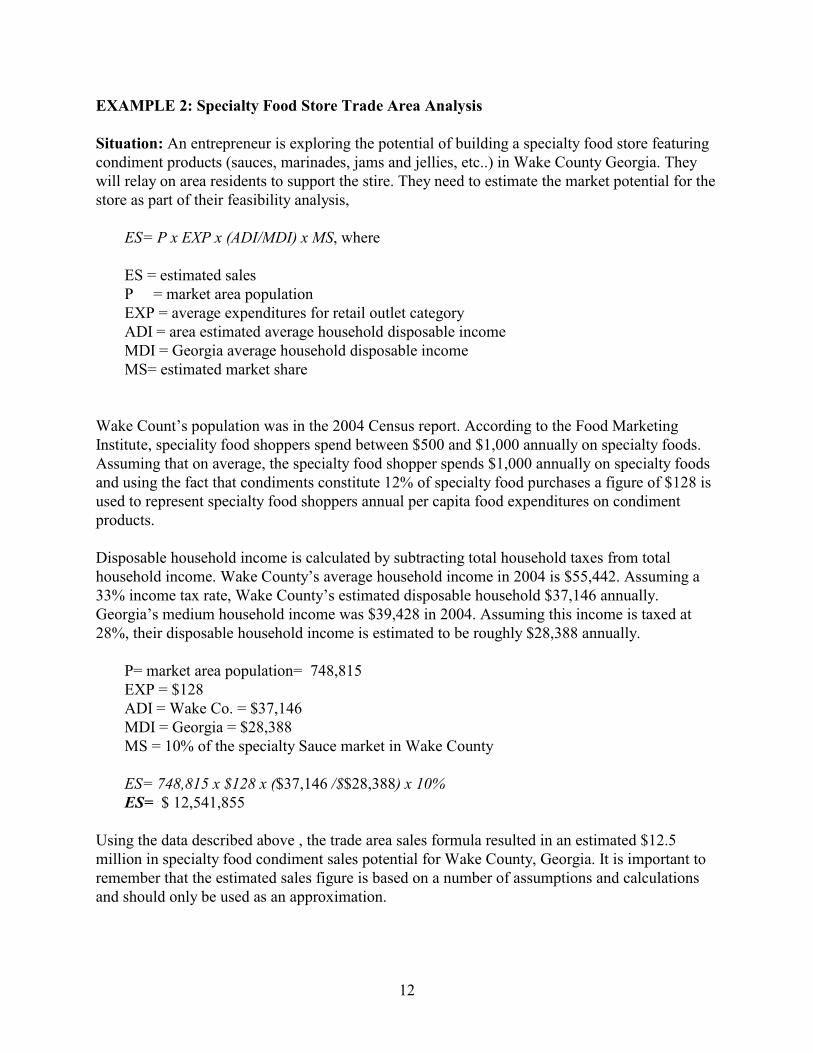
EXAMPLE 2: Specialty Food Store Trade Area Analysis
Situation: An entrepreneur is exploring the potential of building a specialty food store featuringcondiment products (sauces, marinades, jams and jellies, etc..) in Wake County Georgia. Theywill relay on area residents to support the stire. They need to estimate the market potential for thestore as part of their feasibility analysis,
ES= P x EXP x (ADI/MDI) x MS, where
ES = estimated salesP = market area populationEXP = average expenditures for retail outlet categoryADI = area estimated average household disposable incomeMDI = Georgia average household disposable incomeMS= estimated market share
Wake Count’s population was in the 2004 Census report. According to the Food MarketingInstitute, speciality food shoppers spend between $500 and $1,000 annually on specialty foods. Assuming that on average, the specialty food shopper spends $1,000 annually on specialty foodsand using the fact that condiments constitute 12% of specialty food purchases a figure of $128 isused to represent specialty food shoppers annual per capita food expenditures on condimentproducts.
Disposable household income is calculated by subtracting total household taxes from totalhousehold income. Wake County’s average household income in 2004 is $55,442. Assuming a33% income tax rate, Wake County’s estimated disposable household $37,146 annually. Georgia’s medium household income was $39,428 in 2004. Assuming this income is taxed at28%, their disposable household income is estimated to be roughly $28,388 annually.
P= market area population= 748,815EXP = $128ADI = Wake Co. = $37,146MDI = Georgia = $28,388
MS = 10% of the specialty Sauce market in Wake County
ES= 748,815 x $128 x ($37,146 /$$28,388) x 10%ES= $ 12,541,855
Using the data described above , the trade area sales formula resulted in an estimated $12.5million in specialty food condiment sales potential for Wake County, Georgia. It is important toremember that the estimated sales figure is based on a number of assumptions and calculationsand should only be used as an approximation.

13
Appendix A: Demographic Information
Sources

14
Sources of Demographic Information:• A Guide to Sources of Information - http://www.loc.gov/rr/business/marketing/
• Advertising Age -Database related to advertising - http://adage.com/datacenter/
• U.S. Census Bureau - www.census.gov..
• QuickFacts - http://quickfacts.census.gov/qfd/index.html
• American FactFinder.- http://factfinder.census.gov
• The Right Site offers numerous free demographic profiles.www.easidemographics.com/cgi-bin/login_free.asp
• Development Alliance - Religious affiliation - www.adherents.com
• Demographics USA - www.tradedimensions.com , published by Market StatisticsReference: DANA, KLMR REF HF5438.4.S87 Click on Demographics
• USADATA - fee based service- http://www.usadata.com/
• Surveys - you can survey people and collect this type of information.
• Trade Associations - Trade associations collect information on their members or thecustomer group their members are interested in. This information generally includeslifestyle information. Contact trade associations that represent your industry and inquire.
• Universities - Collect and publish applied research that includes lifestyle information.
• Electronic and Print Media - Collect information on their subscribers, including lifestyleinformation. Contact them and ask about the possibility of advertising with them andrequest a subscriber profile.

15
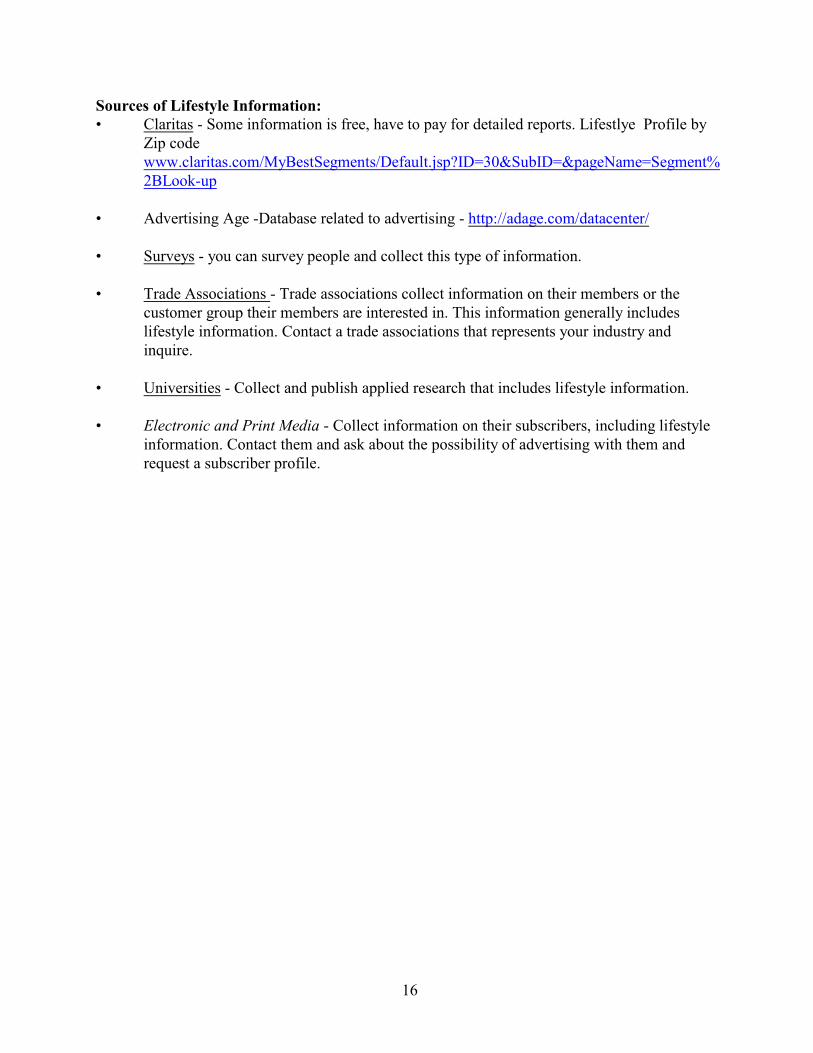
Appendix B:Sources of Lifestyle Information
16
Sources of Lifestyle Information:• Claritas - Some information is free, have to pay for detailed reports. Lifestlye Profile by
Zip codewww.claritas.com/MyBestSegments/Default.jsp?ID=30&SubID=&pageName=Segment%2BLook-up
• Advertising Age -Database related to advertising - http://adage.com/datacenter/
• Surveys - you can survey people and collect this type of information.
• Trade Associations - Trade associations collect information on their members or thecustomer group their members are interested in. This information generally includeslifestyle information. Contact a trade associations that represents your industry andinquire.
• Universities - Collect and publish applied research that includes lifestyle information.
• Electronic and Print Media - Collect information on their subscribers, including lifestyleinformation. Contact them and ask about the possibility of advertising with them andrequest a subscriber profile.

17
Appendix C: Sources of Geographic
Market Area Information
18
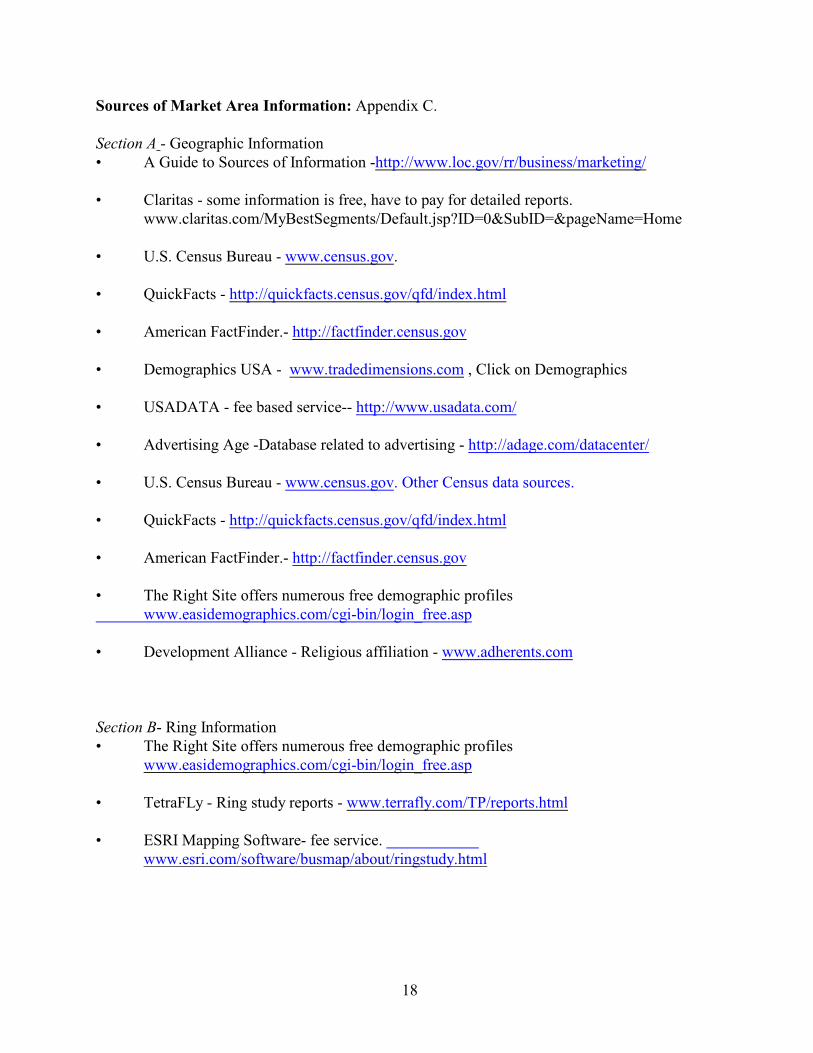
Sources of Market Area Information: Appendix C.
Section A - Geographic Information • A Guide to Sources of Information -http://www.loc.gov/rr/business/marketing/
• Claritas - some information is free, have to pay for detailed reports.www.claritas.com/MyBestSegments/Default.jsp?ID=0&SubID=&pageName=Home
• U.S. Census Bureau - www.census.gov.
• QuickFacts - http://quickfacts.census.gov/qfd/index.html
• American FactFinder.- http://factfinder.census.gov
• Demographics USA - www.tradedimensions.com , Click on Demographics
• USADATA - fee based service-- http://www.usadata.com/
• Advertising Age -Database related to advertising - http://adage.com/datacenter/
• U.S. Census Bureau - www.census.gov. Other Census data sources.
• QuickFacts - http://quickfacts.census.gov/qfd/index.html
• American FactFinder.- http://factfinder.census.gov
• The Right Site offers numerous free demographic profileswww.easidemographics.com/cgi-bin/login_free.asp
• Development Alliance - Religious affiliation - www.adherents.com
Section B- Ring Information• The Right Site offers numerous free demographic profiles
www.easidemographics.com/cgi-bin/login_free.asp
• TetraFLy - Ring study reports - www.terrafly.com/TP/reports.html
• ESRI Mapping Software- fee service. www.esri.com/software/busmap/about/ringstudy.html

19
Section C -Drive Time Analysis• Spatial Insights - fee based service
www.spatialinsights.com/catalog/default.aspx?category=18
• Empower Geographics- fee service. www.empower.com/pages/services_drive.htm
• Imaptools - demonstration service - more sophisticated for a fee. http://imaptools.com/demos1/?tab=3
• ESRI Mapping Software- fee service.www.esri.com/software/busmap/about/ringstudy.html

20
Appendix D:Sources of Consumption
Information

21
Sources of Consumption Information: Appendix D
• The U.S. Bureau of Labor Statistics - Consumer Expenditure Survey information onconsumers www.bls.gov/cex/
• Bureau of Economic Analysis - www.bea.gov
• Census Bureau's Survey of Income and Program Participation (SIPP)-www.sipp.census.gov/sipp/sipphome.htm
• The American Customer Satisfaction Index focuses on goods and services from majorcompanies in a limited industries- www.theacsi.org
• Surveys of Consumers - www.sca.isr.umich.edu
• Demographics USA - www.tradedimensions.com/prod_dus.aspis published by MarketStatistics Reference: DANA, KLMR REF HF5438.4.S87
• USADATA - fee based service- http://dtg.usadata.com/geography/
• USDA -Food consumption data setswww.ers.usda.gov/data/foodconsumption/FoodAvailSpreadsheets.htm/
• ERS -Food Consumption, Prices and Expenditureshttp://usda.mannlib.cornell.edu/data-sets/food/89015/
• ARS- What we eat in America - www.ars.usda.gov/is/pr/2004/040923.htm

22
Appendix E:Sources of Competitor
Information
23
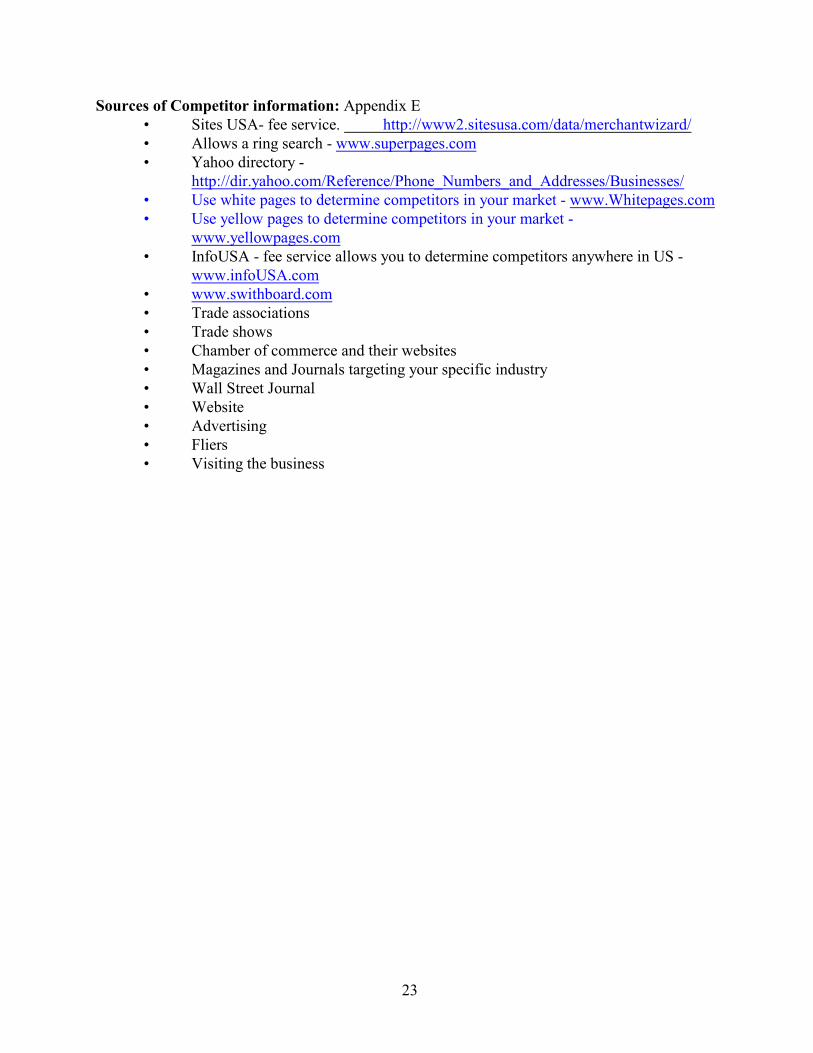
Sources of Competitor information: Appendix E• Sites USA- fee service. http://www2.sitesusa.com/data/merchantwizard/ • Allows a ring search - www.superpages.com• Yahoo directory -
http://dir.yahoo.com/Reference/Phone_Numbers_and_Addresses/Businesses/• Use white pages to determine competitors in your market - www.Whitepages.com• Use yellow pages to determine competitors in your market -
www.yellowpages.com• InfoUSA - fee service allows you to determine competitors anywhere in US -
www.infoUSA.com• www.swithboard.com• Trade associations• Trade shows• Chamber of commerce and their websites• Magazines and Journals targeting your specific industry• Wall Street Journal• Website• Advertising• Fliers• Visiting the business

24
Appendix F:Market Potential Worksheet
25
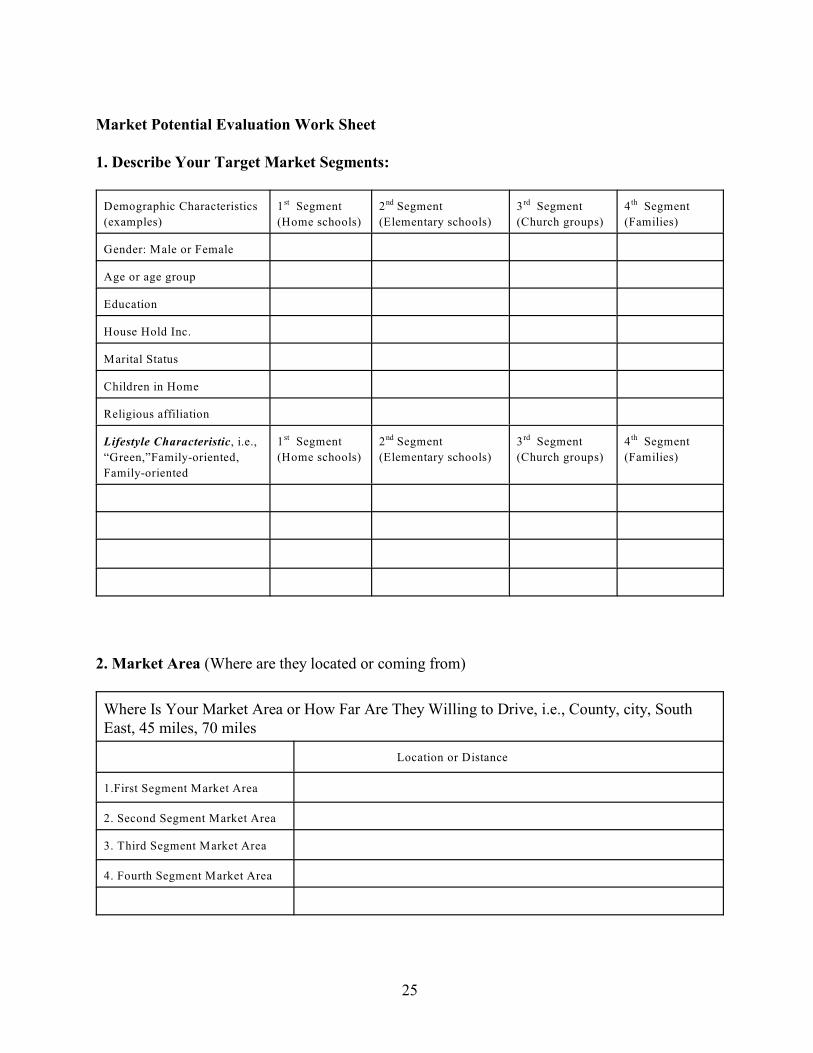
Market Potential Evaluation Work Sheet
1. Describe Your Target Market Segments:
Demographic Characteristics
(examples)
1 Segmentst
(Home schools)
2 Segmentnd
(Elementary schools)
3 Segmentrd
(Church groups)
4 Segmentth
(Families)
Gender: Male or Female
Age or age group
Education
House Hold Inc.
Marital Status
Children in Home
Religious affiliation
Lifestyle Characteristic, i.e.,
“Green,”Family-oriented,
Family-oriented
1 Segmentst
(Home schools)
2 Segmentnd
(Elementary schools)
3 Segmentrd
(Church groups)
4 Segmentth
(Families)
2. Market Area (Where are they located or coming from)
Where Is Your Market Area or How Far Are They Willing to Drive, i.e., County, city, SouthEast, 45 miles, 70 miles
Location or Distance
1.First Segment Market Area
2. Second Segment Market Area
3. Third Segment Market Area
4. Fourth Segment Market Area
26
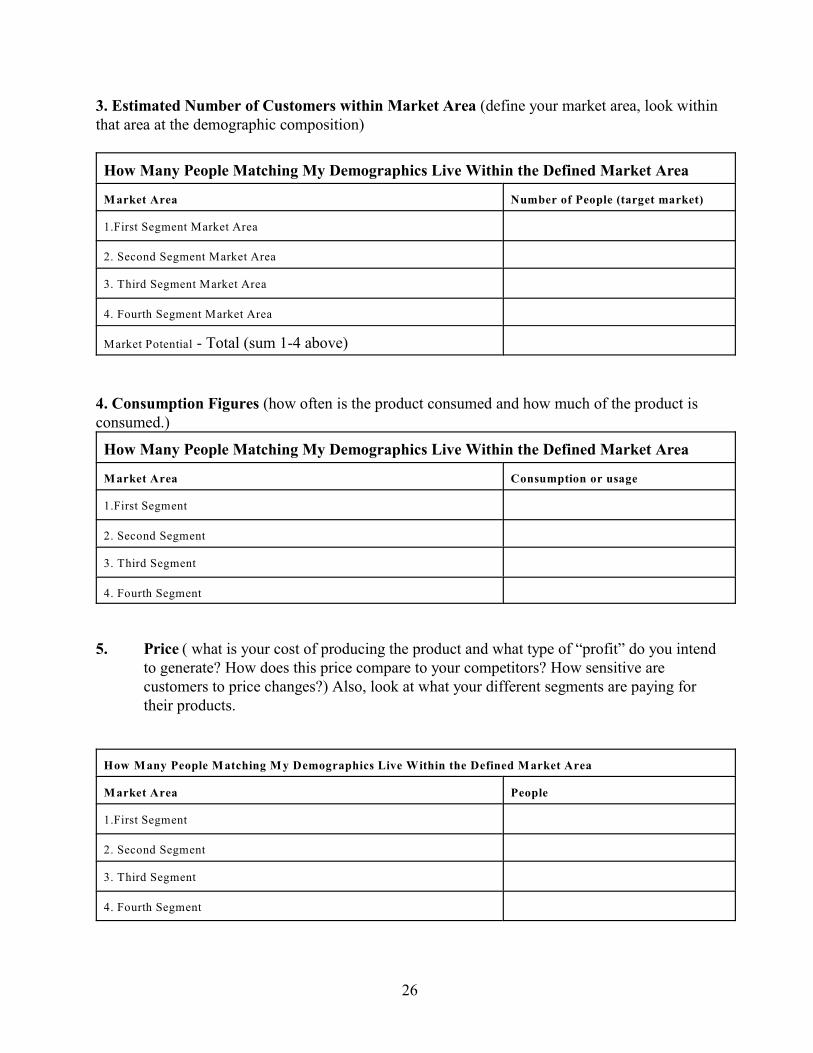
3. Estimated Number of Customers within Market Area (define your market area, look withinthat area at the demographic composition)
How Many People Matching My Demographics Live Within the Defined Market Area
Market Area Number of People (target market)
1.First Segment Market Area
2. Second Segment Market Area
3. Third Segment Market Area
4. Fourth Segment Market Area
Market Potential - Total (sum 1-4 above)
4. Consumption Figures (how often is the product consumed and how much of the product isconsumed.)
How Many People Matching My Demographics Live Within the Defined Market Area
Market Area Consumption or usage
1.First Segment
2. Second Segment
3. Third Segment
4. Fourth Segment
5. Price ( what is your cost of producing the product and what type of “profit” do you intendto generate? How does this price compare to your competitors? How sensitive arecustomers to price changes?) Also, look at what your different segments are paying fortheir products.
How Many People Matching M y Demographics Live Within the Defined Market Area
Market Area People
1.First Segment
2. Second Segment
3. Third Segment
4. Fourth Segment

27
Now you are ready to estimate your market potential.
Single Target Market:If you have only one target market or target market segment, plug your numbers into this formulaand you will have an estimate of your businesses market potential.
Estimating Market Potential: ,where:
MP = market potentialN = number of possible buyersP = average selling priceQ = average annual consumption
Multiple Target Markets: Estimate the market potential for each segment, (1 , 2 , 3 , 4 ) andst nd rd th
you will have an estimate of your total target Market.
1 Segment - st
2 Segment -nd
3 Segment -rd
4 Segment - th
Total Market Potential =
28
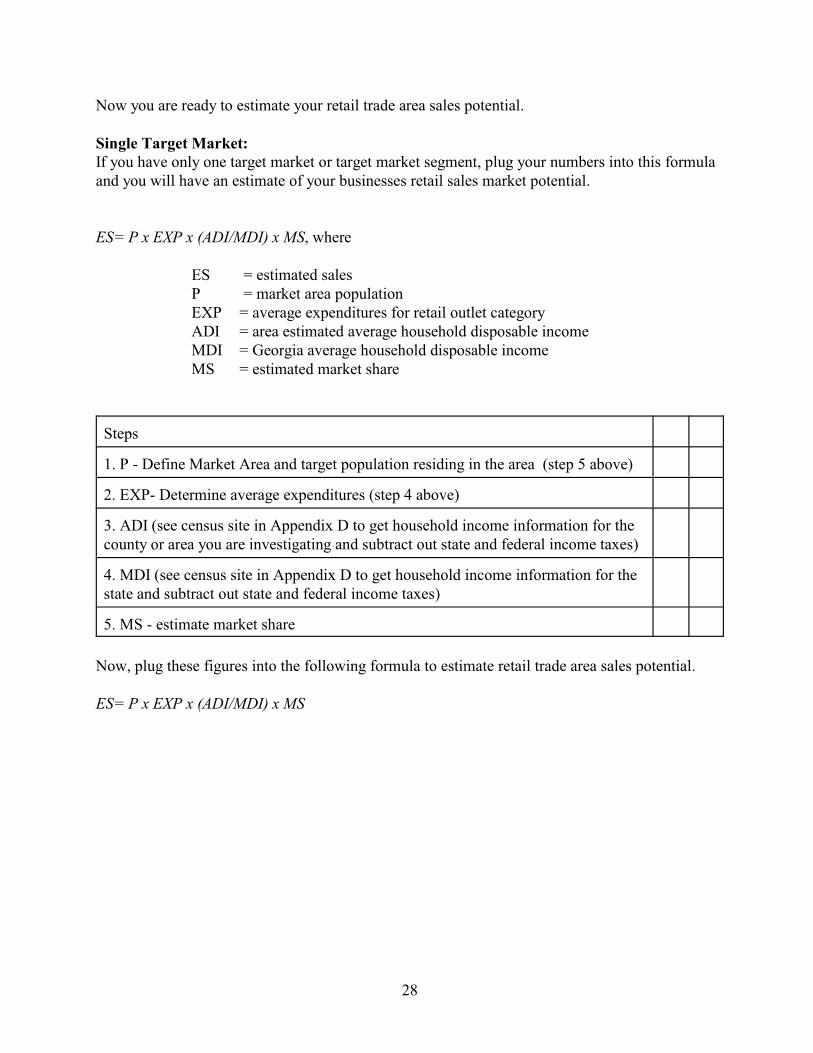
Now you are ready to estimate your retail trade area sales potential.
Single Target Market:If you have only one target market or target market segment, plug your numbers into this formulaand you will have an estimate of your businesses retail sales market potential.
ES= P x EXP x (ADI/MDI) x MS, where
ES = estimated salesP = market area populationEXP = average expenditures for retail outlet categoryADI = area estimated average household disposable incomeMDI = Georgia average household disposable incomeMS = estimated market share
Steps
1. P - Define Market Area and target population residing in the area (step 5 above)
2. EXP- Determine average expenditures (step 4 above)
3. ADI (see census site in Appendix D to get household income information for thecounty or area you are investigating and subtract out state and federal income taxes)
4. MDI (see census site in Appendix D to get household income information for thestate and subtract out state and federal income taxes)
5. MS - estimate market share
Now, plug these figures into the following formula to estimate retail trade area sales potential.
ES= P x EXP x (ADI/MDI) x MS

The Center for Agribusiness and Economic Development
The Center for Agribusiness and Economic Development is a unit of the College ofAgricultural and Environmental Sciences of the University of Georgia, combining themissions of research and extension. The Center has among its objectives:
< To provide feasibility and other short term studies for current or potential Georgiaagribusiness firms and/or emerging food and fiber industries.
< To provide agricultural, natural resource, and demographic data for private andpublic decision makers.
To find out more, visit our Web site at: http://caed.uga.edu
Or contact:John McKissick, Director
Center for Agribusiness and Economic DevelopmentLumpkin House
The University of GeorgiaAthens, Georgia 30602-7509
Phone (706)[email protected]
The University of Georgia and Fort Valley State University, and the U.S. Department of Agriculture and
counties of the state cooperating. The Cooperative Extension Service offers educational programs,
assistance and materials to all people without regard to race, color, national origin, age, sex or disability.
An equal opportunity/affirmative action organization committed to a diverse work force.
Center Report 06-08 September, 2006
Issued in furtherance of Cooperation Extension Acts of May 8 and June 30, 1914, the University of Georgia
College of Agricultural and Environmental Sciences, and the U.S. Department of Agriculture cooperating.
J. Scott Angle, Dean and Director