Estimating Hydraulic Conductivity of Highly …cdn.intechweb.org/pdfs/23454.pdfEstimating Hydraulic...
20
14 Estimating Hydraulic Conductivity of Highly Disturbed Clastic Rocks in Taiwan Cheng-Yu Ku 1 and Shih-Meng Hsu 2 1 National Taiwan Ocean University 2 Sinotech Engineering Consultants, Inc Taiwan 1. Introduction Understanding groundwater flow in fractured consolidated media has long been important when undertaking engineering tasks such as dam construction, mine development, the abstraction of petroleum, slope stabilization, and the construction of foundations. To study groundwater flow in support of these tasks, the focus of most hydrogeological investigations has been on the characterization of the hydraulic properties of the higher- permeability fractures in the rock mass. Taiwan is situated on the edge of the Eurasian and Philippine Sea plate. Plate tectonics have created numerous fault lines that crisscross the island. As a result of high density of faults, rock core data with fractures, soft and cohesive gouges, and various lithologies are extensive in boreholes. In general, the permeability of clay-rich gouges has extremely low values. On the contrary, the fractures often have higher permeability. The hydraulic properties of fractured rocks in Taiwan, therefore, vary with highly disturbed geological structures and lithology. To obtain hydraulic properties of fractured rocks in Taiwan, the investigation of vertical variation of the fractures in a borehole is of importance. This study utilized a high- resolution BoreHole acoustic TeleViewer (BHTV, Williams and Johnson, 2004) to scan images of the borehole. The information gathered from BHTV was used to characterize lithology and fractures for the borehole and was essential to conduct a proper measurement of rock mass hydraulic conductivity. The double packer systems were then used to determine the hydraulic conductivity in a portion of borehole using two inflatable packers. Although this type of test can directly measure the hydraulic parameter, costs of the testing are fairly high. Several studies (Black, 1987; Carlson and Olsson,1977; Louis, 1974; Burgess, 1977; Wei et al., 1995, Zhao, 1998) have proposed the estimation of rock mass hydraulic conductivity using different empirical equations. These empirical equations provide a great feature for characterizing rock mass hydraulic properties quickly and easily. However, the applicability of these equations in highly disturbed clastic sedimentary rocks in Taiwan is very limited. This study proposed the establishment of an empirical HC model for estimating rock mass hydraulic conductivity of highly disturbed clastic sedimentary rocks in Taiwan using the BHTV and the double packer hydraulic tests. Four geological parameters including rock quality designation (RQD), depth index (DI), gouge content designation (GCD), and www.intechopen.com
Transcript of Estimating Hydraulic Conductivity of Highly …cdn.intechweb.org/pdfs/23454.pdfEstimating Hydraulic...

14
Estimating Hydraulic Conductivity of Highly Disturbed Clastic Rocks in Taiwan
Cheng-Yu Ku1 and Shih-Meng Hsu2 1National Taiwan Ocean University
2Sinotech Engineering Consultants, Inc Taiwan
1. Introduction
Understanding groundwater flow in fractured consolidated media has long been important
when undertaking engineering tasks such as dam construction, mine development, the
abstraction of petroleum, slope stabilization, and the construction of foundations. To study
groundwater flow in support of these tasks, the focus of most hydrogeological
investigations has been on the characterization of the hydraulic properties of the higher-
permeability fractures in the rock mass.
Taiwan is situated on the edge of the Eurasian and Philippine Sea plate. Plate tectonics have
created numerous fault lines that crisscross the island. As a result of high density of faults,
rock core data with fractures, soft and cohesive gouges, and various lithologies are extensive
in boreholes. In general, the permeability of clay-rich gouges has extremely low values. On
the contrary, the fractures often have higher permeability. The hydraulic properties of
fractured rocks in Taiwan, therefore, vary with highly disturbed geological structures and
lithology. To obtain hydraulic properties of fractured rocks in Taiwan, the investigation of
vertical variation of the fractures in a borehole is of importance. This study utilized a high-
resolution BoreHole acoustic TeleViewer (BHTV, Williams and Johnson, 2004) to scan
images of the borehole. The information gathered from BHTV was used to characterize
lithology and fractures for the borehole and was essential to conduct a proper measurement
of rock mass hydraulic conductivity. The double packer systems were then used to
determine the hydraulic conductivity in a portion of borehole using two inflatable packers.
Although this type of test can directly measure the hydraulic parameter, costs of the
testing are fairly high. Several studies (Black, 1987; Carlson and Olsson,1977; Louis, 1974;
Burgess, 1977; Wei et al., 1995, Zhao, 1998) have proposed the estimation of rock mass
hydraulic conductivity using different empirical equations. These empirical equations
provide a great feature for characterizing rock mass hydraulic properties quickly and
easily. However, the applicability of these equations in highly disturbed clastic
sedimentary rocks in Taiwan is very limited.
This study proposed the establishment of an empirical HC model for estimating rock mass hydraulic conductivity of highly disturbed clastic sedimentary rocks in Taiwan using the BHTV and the double packer hydraulic tests. Four geological parameters including rock quality designation (RQD), depth index (DI), gouge content designation (GCD), and
www.intechopen.com

Hydraulic Conductivity – Issues, Determination and Applications
268
lithology permeability index (LPI) were adopted for establishing the empirical HC model. To verify rationality of the proposed HC model, 22 in-situ hydraulic tests were carried out to measure the hydraulic conductivity of the highly disturbed clastic sedimentary rocks in three boreholes at two different locations in Taiwan. Besides, the model verification using another borehole data with four additional in-situ hydraulic tests from similar clastic sedimentary rocks was also conducted to further verify the feasibility of the proposed empirical HC model. This paper presents the measured hydraulic conductivity results and the relationship among the hydraulic conductivity, RQD, DI, GCD, and LPI. The application of the proposed HC model was also addressed.
2. Description of study areas and boreholes
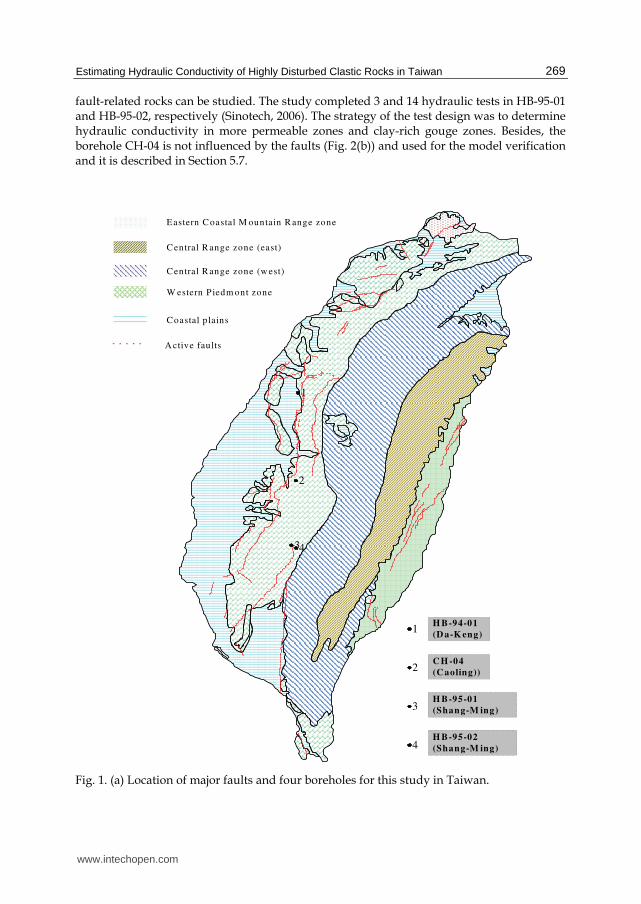
2.1 Description of study areas Taiwan's strata are distributed in long and narrow strips, almost parallel to the island's axis. Metamorphic rock lies under the Central and Snow Mountain Ranges. Sedimentary rock forms part of the island-wide piedmonts and coastal plains as well as the Coastal Mountain Range. The island of Taiwan has three geological zones divided by longitudinal faults: the Central Range, Western Piedmont and Eastern Coastal Mountain Range zones (Fig. 1(a)). About 26 hydraulic conductivity measurements were conducted in four boreholes in Western Piedmont, primarily at three sites: Da-Keng, Shang-Ming, and Caoling (Fig. 1(a)) in which borehole HB-94-01 is in the Da-Keng site, boreholes HB-95-01 and HB-95-02 are in the Shang-Ming site, and borehole CH-04 is in the Caoling site. Besides, the Da-Keng and Caoling sites are in central Taiwan and the Shang-Ming site is in southern Taiwan. The dominant rock strata of the Shang-Ming site include Miocene sedimentary rock with layers of sandstone or shale or their alternation. The major structures consist of a series of parallel easterly inclined thrust faults and folds, which often form local fractured zones, including geological structures such as the Pingshi fault, the Biauhu fault, and the Chin-Shan fault. Figure 1(b) presents the distribution of these geological strata and structures. In addition, borehole HB-94-01 in the Da-Keng site and borehole CH-04 in the Caoling site also have similar rock strata but without geological structures. Based on the loggings and geological analysis, HB-95-01 and HB-95-02 are strongly influenced by the faults; nevertheless, HB-94-01 and CH-04 are not.
2.2 Boreholes The depth of the borehole HB-94-01 is 110 m. The principal lithologic units for the borehole are sandstone and siltstone. The interval of 36 m to 44 m is a fractured zone compared to other depths in the borehole. A total of 8 hydraulic tests using a double packer system were carried out to determine hydraulic conductivity (Sinotech, 2006). The strategy of the test design from the drilling work was to determine hydraulic properties from different geological structures such as no fracture, a single fracture, or multiple fractures at different depths. The drilling depths of HB-95-01 and HB-95-02 are 250 m and 350 m, respectively. The principal lithologic units for HB-95-01 are sandstone, argillaceous sandstone, and sandy mudstone. The principal lithologic units for HB-95-02 are sandstone, argillaceous sandstone, and sandstone mixed with some mudstone. HB-95-01 and HB-95-02 are close to the Biauhu fault and Pingshi fault, respectively (Fig. 1(b)). Rock core photos (Fig. 2(a)) indicated soft and cohesive gouges are extensive in both boreholes in which the hydraulic properties of
www.intechopen.com
Estimating Hydraulic Conductivity of Highly Disturbed Clastic Rocks in Taiwan
269
fault-related rocks can be studied. The study completed 3 and 14 hydraulic tests in HB-95-01 and HB-95-02, respectively (Sinotech, 2006). The strategy of the test design was to determine hydraulic conductivity in more permeable zones and clay-rich gouge zones. Besides, the borehole CH-04 is not influenced by the faults (Fig. 2(b)) and used for the model verification and it is described in Section 5.7.
2
1
34
Eastern C oastal M ountain R ange zone
Central R ange zone (east)
Central R ange zone (w est)
Coastal plains
W estern P iedm ont zone
A ctive faults
H B-94-01
(D a-K eng)
H B-95-02
(Shang-M ing)
C H -04
(C aoling))
H B-95-01
(Shang-M ing)
4
3
2
1
Fig. 1. (a) Location of major faults and four boreholes for this study in Taiwan.
www.intechopen.com

Hydraulic Conductivity – Issues, Determination and Applications
270
SS/SH
SS-SHSS-SH
SS
SH MSS
SS/SHSS/SH
Chin-shan
fault
Biauhu
fault
Pingshi
fault
Chin-shan
river
Syncline Syncline
300
500
700
900
1100
1300
1500
Ele
vati
on HB-95-02 HB-95-01
04000 mDistance
SH: Shale
SS: Sandstone
SS/SH: Alternation of sandstone and shaleSS-SH: Sandstone interbedded with some shale
MSS: Massive sandstone
(m)
(m)
Fig. 1. (b) Detailed distribution of geological strata and structures of boreholes HB-95-01 and HB-95-02.
154
155
156
157
158
196
197
198
199
Soft and cohesive gouges
Fig. 2. (a) Rock core photos of borehole HB-95-2 with fault influence.
www.intechopen.com

Estimating Hydraulic Conductivity of Highly Disturbed Clastic Rocks in Taiwan
271
Fig. 2. (b) Rock core photos of borehole CH-04 without fault influence.
3. Hydraulic conductivity of fractured rock masses
It is widely recognized that fracturing plays a decisive role in rock hydraulics, especially
in low permeability rocks such as crystalline, volcanic and carbonate rocks, and in some
classic sedimentary formations, such as sandstones, shales, glacial tills and clays. In
highly disturbed fractured rocks, hydraulic properties depend on density, size, infillings
and interconnection of fractures. A distinction can be made between hydraulic
conductivity of fracture and of intergranular (matrix) material. Previous study (Lee and
Farmer, 1993) has proposed the hydraulic conductivity of a rock mass with three
orthogonal joint sets with similar spacing ad constant aperture in all directions. The effect
of stress on permeability is also of importance for estimating rock mass hydraulic
conductivity (Snow, 1969).
Several studies, shown in Table 1, have also pointed out that rock mass permeability may
decrease systematically with depth (Black, 1987; Carlson and Olsson,1977; Louis, 1974;
Burgess, 1977; Wei et al., 1995, Zhao, 1998). The decrease in permeability with depth in
fractured rocks is usually attributed to reduction in fracture aperture and fracture spacing.
The reduction is due to the effect of geostatic stresses, and thereby the permeability of
fractured rocks will be reduced. Accordingly, the depth may be considered as a factor in
evaluating rock mass permeability.
4. Measurement of rock mass hydraulic conductivity
For decades, the determination of hydraulic properties in fracture rocks has been
qualitatively estimated using the Lugeon test. It is now recognized that this approach is
not suitable in highly disturbed fractured rocks. The type of test only gives an average
value of hydraulic conductivity in a stratum and is not able to identify (1) aquifer’s type in
a required testing section; (2) storativity of an aquifer; and (3) relations between hydraulic
properties and geological structures such as water-bearing fractured zones. Results from
the test may be insufficient to characterize hydraulic properties for complex geological
environments. They may be subject to hazards such as extensive water inflow during
underground excavation.
To provide a better characterization of hydraulic properties of fractured rocks, a double
packer technique can be adopted and is often utilized to overcome the shortcomings of the
www.intechopen.com
Hydraulic Conductivity – Issues, Determination and Applications
272
Lugeon test. Packers can be used to isolate a portion of borehole for hydraulic testing.
Hydraulic properties for a single of fracture, a group of fractures, or an entire rock
formation can be easily identified by the technique.
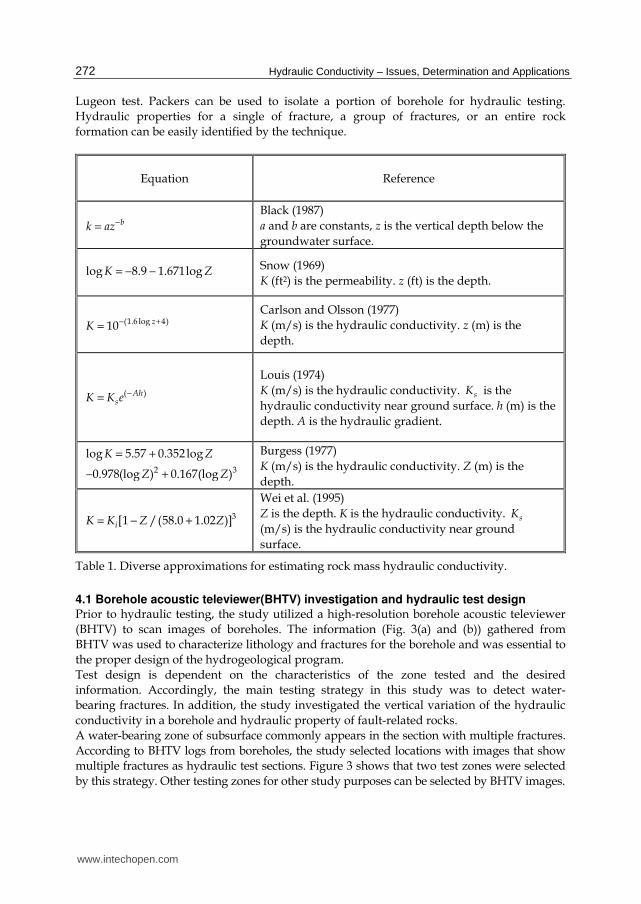
Equation Reference
bk az−=
Black (1987)
a and b are constants, z is the vertical depth below the
groundwater surface.
log 8.9 1.671logK Z= − − Snow (1969)
K (ft2) is the permeability. z (ft) is the depth.
(1.6 log 4)10 zK − +=
Carlson and Olsson (1977)
K (m/s) is the hydraulic conductivity. z (m) is the
depth.
( )AhsK K e −
=
Louis (1974)
K (m/s) is the hydraulic conductivity. sK is the
hydraulic conductivity near ground surface. h (m) is the
depth. A is the hydraulic gradient.
2 3
log 5.57 0.352 log
0.978(log ) 0.167(log )
K Z
Z Z
= +
− +
Burgess (1977)
K (m/s) is the hydraulic conductivity. Z (m) is the
depth.
3[1 /(58.0 1.02 )]iK K Z Z= − +
Wei et al. (1995)
Z is the depth. K is the hydraulic conductivity. sK
(m/s) is the hydraulic conductivity near ground
surface.
Table 1. Diverse approximations for estimating rock mass hydraulic conductivity.
4.1 Borehole acoustic televiewer(BHTV) investigation and hydraulic test design
Prior to hydraulic testing, the study utilized a high-resolution borehole acoustic televiewer (BHTV) to scan images of boreholes. The information (Fig. 3(a) and (b)) gathered from BHTV was used to characterize lithology and fractures for the borehole and was essential to the proper design of the hydrogeological program.
Test design is dependent on the characteristics of the zone tested and the desired information. Accordingly, the main testing strategy in this study was to detect water-bearing fractures. In addition, the study investigated the vertical variation of the hydraulic
conductivity in a borehole and hydraulic property of fault-related rocks. A water-bearing zone of subsurface commonly appears in the section with multiple fractures. According to BHTV logs from boreholes, the study selected locations with images that show multiple fractures as hydraulic test sections. Figure 3 shows that two test zones were selected
by this strategy. Other testing zones for other study purposes can be selected by BHTV images.
www.intechopen.com

Estimating Hydraulic Conductivity of Highly Disturbed Clastic Rocks in Taiwan
273
136
137
138
Bedding
Fracture0
0 20060
0 900
N0450
N3150
N E S W N
Fig. 3. (a) The pack-off zones and their corresponding BHTV images (depth 136m~138m, HB-95-01).
113
114
115
N E S W N
Bedding
Fracture00 200
600 900
N0450N3150
Fig. 3. (b) Identification of shear band from BHTV (depth 113m~115m, HB-95-02).
www.intechopen.com

Hydraulic Conductivity – Issues, Determination and Applications
274
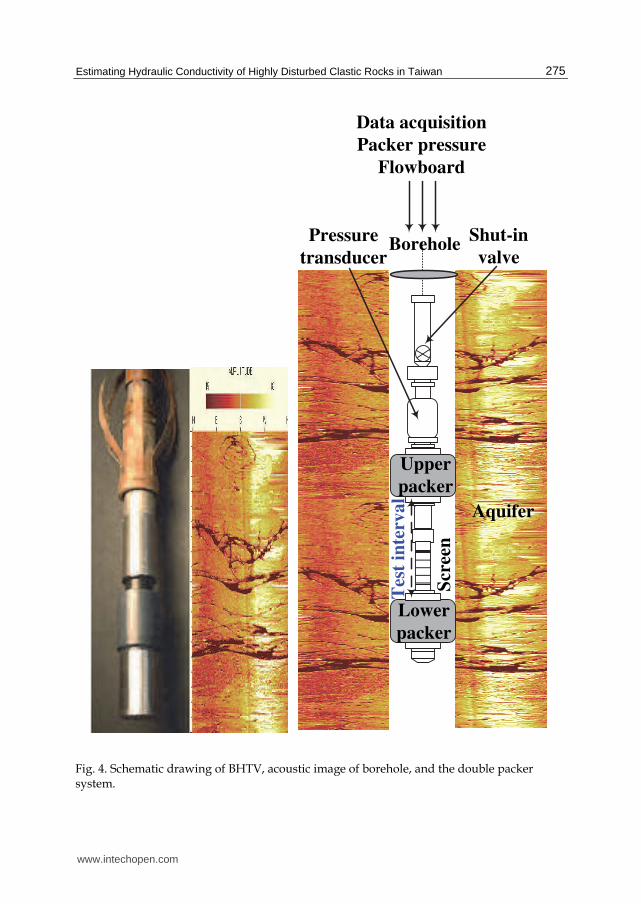
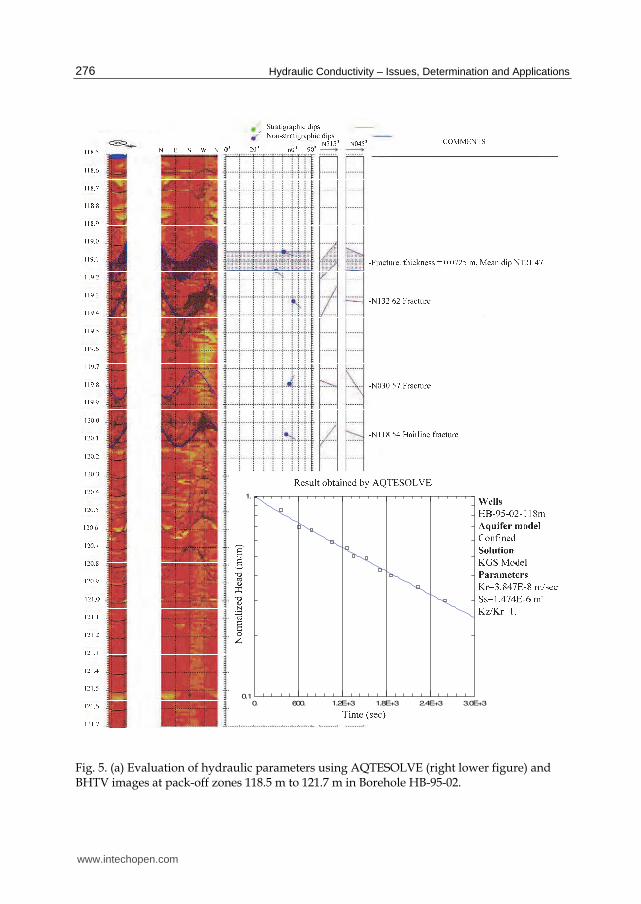
4.2 Double packer system Double packer systems are the most commonly used tools for hydrogeological testing in boreholes. They can be used to determine the hydraulic property in a section of borehole based on two inflatable packers. It is now recognized that this approach is appropriate to investigate the variability of a borehole as it intersects various hydrogeological units. The double packer system in this study (Fig. 4) consists of two inflatable rubber packers, a shut-in valve, a submersible pump, and pressure transducers for monitoring above and below the packers and the isolated interval. The shut-in valve can open or close the hydraulic connection between the pipe string and the test section. The rubber packers can be inflated using nitrogen delivered through a polyethylene air line. The pumping or injecting rate can be monitored at the land surface with a flow meter. To conduct each hydraulic test, the packers are inflated to isolate a section of borehole, and the rate of flow and/or pressure in the test interval over a period of time can be measured. The BHTV images for different test intervals in Boreholes HB-95-01 and HB-95-02 are shown in Fig. 5(a) and 5(b). It is obvious that the fractures can be identified clearly using our high-resolution BHTV. The intervals in the depth from 118.5 m to 121.7 m and from 134.8 m to 138.0 m were sealed by double packers for conducting a pressure pulse test and a constant head injection test, respectively. Figures 5(a) and 5(b) show the results of hydraulic tests which were conducted by different type of hydraulic tests by means of AQTESOLVE. The type of hydraulic test chosen in this study for each test interval was decided by a hydraulic diagnosis test which mainly detects permeability of the test interval prior to a normal test. For the test interval of 118.5 m to 121.7 m, although three fractures and a fracture zone of approximately 7.25 cm thickness were seen on the borehole image, lack of interconnectivity of fractures and soft and cohesive gouges existing at the fractures may reduce the permeability of rock masses. In addition, four types of tests, including pumping tests, injection tests, slug tests, and pressure pulse tests can be applied to the double packer system. Pumping tests involve pumping at a constant or variable rate and measuring changes in water levels during pumping. In injection tests, fluid is injected into a test interval while keeping the head of the test interval at a constant value. A slug test involves the abrupt removal, addition, or displacement of a known volume of water and the subsequent monitoring of changes in water level as equilibrium conditions return. In a pressure pulse test, an increment of pressure is applied to a packed zone. The pressure decay is monitored. Typically, the decision on which type of test to perform is based on the expected permeability of the test interval, the volume of rock to be sampled, and the availability of time and equipment (NRC, 1996). Hydraulic properties determined by slug tests or pressure pulse tests are representative only for the material in the immediate vicinity of the borehole. To obtain hydraulic conductivity over a large area, the procedure of a single-hole hydraulic test is to perform a pumping test at a test interval first. If the pumping test cannot be performed due to low permeability of the test section, a constant head injection test will be conducted instead. Once the flow rate cannot be measured by limitation of the flow meter (less than 0.11 l/min) during the injection test, a slug test or pressure pulse test can be performed. The duration of a pressure pulse test is much shorter than that of a slug test. For this reason, the pressure pulse test is commonly applied to test intervals of very low permeability. However, the volume of rock tested by a pressure pulse test is significantly smaller when compared to a slug test.
www.intechopen.com
Estimating Hydraulic Conductivity of Highly Disturbed Clastic Rocks in Taiwan
275
Aquifer
Upper
packer
Lower
packer
Scr
een
Tes
t in
terv
al
BoreholePressure
transducer
Shut-in
valve
Data acquisition
Packer pressure
Flowboard
Fig. 4. Schematic drawing of BHTV, acoustic image of borehole, and the double packer system.
www.intechopen.com
Hydraulic Conductivity – Issues, Determination and Applications
276
0. 600. 1.2E+3 1.8E+3 2.4E+3 3.0E+30.1
1.
Fig. 5. (a) Evaluation of hydraulic parameters using AQTESOLVE (right lower figure) and BHTV images at pack-off zones 118.5 m to 121.7 m in Borehole HB-95-02.
www.intechopen.com

Estimating Hydraulic Conductivity of Highly Disturbed Clastic Rocks in Taiwan
277
1. 10. 100.0.1
1.
Fig. 5. (b) Evaluation of hydraulic parameters using AQTESOLVE (right lower figure) and BHTV images at pack-off zones 134.8 m to 138 m in Borehole HB-95-02.
www.intechopen.com
Hydraulic Conductivity – Issues, Determination and Applications
278
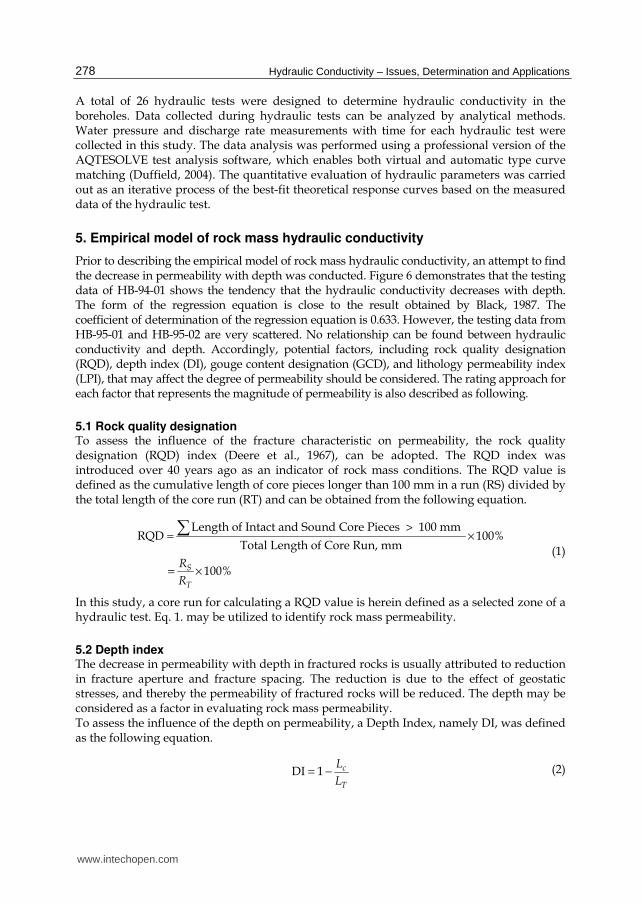
A total of 26 hydraulic tests were designed to determine hydraulic conductivity in the boreholes. Data collected during hydraulic tests can be analyzed by analytical methods. Water pressure and discharge rate measurements with time for each hydraulic test were collected in this study. The data analysis was performed using a professional version of the AQTESOLVE test analysis software, which enables both virtual and automatic type curve matching (Duffield, 2004). The quantitative evaluation of hydraulic parameters was carried out as an iterative process of the best-fit theoretical response curves based on the measured data of the hydraulic test.
5. Empirical model of rock mass hydraulic conductivity
Prior to describing the empirical model of rock mass hydraulic conductivity, an attempt to find the decrease in permeability with depth was conducted. Figure 6 demonstrates that the testing data of HB-94-01 shows the tendency that the hydraulic conductivity decreases with depth. The form of the regression equation is close to the result obtained by Black, 1987. The coefficient of determination of the regression equation is 0.633. However, the testing data from HB-95-01 and HB-95-02 are very scattered. No relationship can be found between hydraulic conductivity and depth. Accordingly, potential factors, including rock quality designation (RQD), depth index (DI), gouge content designation (GCD), and lithology permeability index (LPI), that may affect the degree of permeability should be considered. The rating approach for each factor that represents the magnitude of permeability is also described as following.
5.1 Rock quality designation To assess the influence of the fracture characteristic on permeability, the rock quality designation (RQD) index (Deere et al., 1967), can be adopted. The RQD index was introduced over 40 years ago as an indicator of rock mass conditions. The RQD value is defined as the cumulative length of core pieces longer than 100 mm in a run (RS) divided by the total length of the core run (RT) and can be obtained from the following equation.
Length of Intact and Sound Core Pieces 100 mm RQD 100%
Total Length of Core Run, mm
100%S
T
R
R
>= ×
= ×
(1)
In this study, a core run for calculating a RQD value is herein defined as a selected zone of a hydraulic test. Eq. 1. may be utilized to identify rock mass permeability.
5.2 Depth index The decrease in permeability with depth in fractured rocks is usually attributed to reduction in fracture aperture and fracture spacing. The reduction is due to the effect of geostatic stresses, and thereby the permeability of fractured rocks will be reduced. The depth may be considered as a factor in evaluating rock mass permeability. To assess the influence of the depth on permeability, a Depth Index, namely DI, was defined as the following equation.
DI 1 c
T
L
L= − (2)
www.intechopen.com
Estimating Hydraulic Conductivity of Highly Disturbed Clastic Rocks in Taiwan
279
633.0
34.9
2
106206.0
=
×=−
R
ZepthK
Rock mass hydraulic conductivity (m/sec)
Dep
th b
elo
w g
rou
nd
wat
er s
urf
ace
(m)
HB-94-01
HB-95-02
HB-95-01
350
300
250
200
150
100
50
0
10-11
10-10
10-9
10-8
10-7
10-6
10-5
10-4
Fig. 6. Relationship between hydraulic conductivity and depth.
in which LT is the total length of a borehole; LC is a depth which is located at the middle of a double packer test interval in the borehole. The value of DI is always greater than zero and less than one. The greater the DI value, the higher the permeability.
5.3 Gouge content designation The RQD value may decrease by an increase of fractures in a core run. If the fractures contain infillings such as gouges, permeability of the fractures will reduce. To assess the influence of the gouge materials on permeability, a Gouge Content Designation (GCD) index was defined as the following equation.
GCD G
T S
R
R R=
−, (3)
in which RG is the total length of gouge content. The value of GCD is always greater than zero and less than one. The greater GCD value stands for the more gouge content in a core run, and thereby it will reduce the permeability.
5.4 Lithology permeability index Lithology is the individual character of a rock in terms of mineral composition, grain size, texture, color, and so forth. For an intact rock, the magnitude of permeability depends largely on the individual character of the rock. It may be affected by the average size of the pores, which in turn is related to the distribution of particle sizes and particle shape. In sedimentary formations grain-size characteristics are most important because coarse-grained and well-sorted material will have high permeability as compared to fine-grained sediments like silt and clay. Thus, the lithology may be regarded as a factor in evaluating rock mass permeability.
www.intechopen.com
Hydraulic Conductivity – Issues, Determination and Applications
280
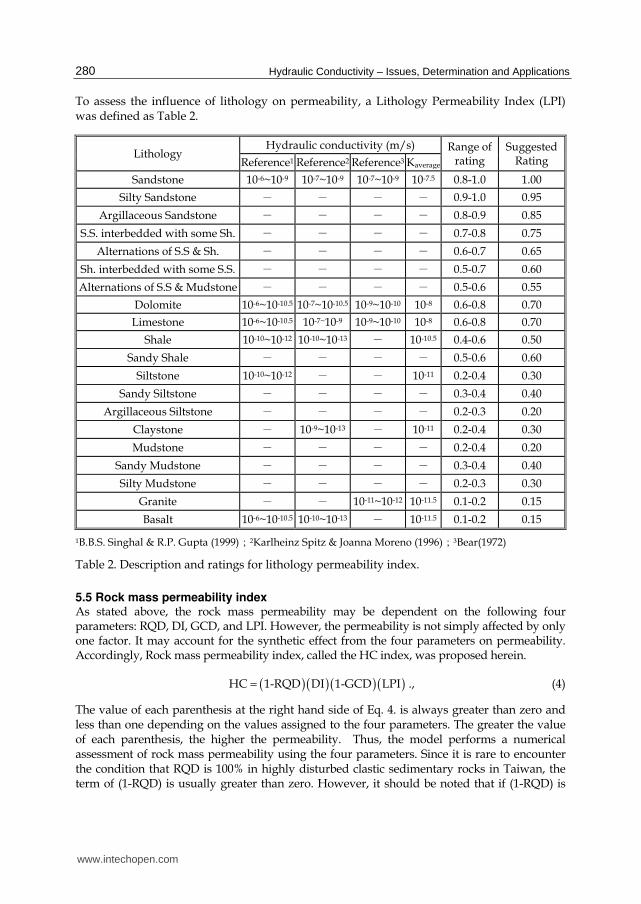
To assess the influence of lithology on permeability, a Lithology Permeability Index (LPI) was defined as Table 2.
Lithology Hydraulic conductivity (m/s) Range of
rating Suggested
Rating Reference1 Reference2 Reference3 Kaverage
Sandstone 10-6~10-9 10-7~10-9 10-7~10-9 10-7.5 0.8-1.0 1.00
Silty Sandstone - - - - 0.9-1.0 0.95
Argillaceous Sandstone - - - - 0.8-0.9 0.85
S.S. interbedded with some Sh. - - - - 0.7-0.8 0.75
Alternations of S.S & Sh. - - - - 0.6-0.7 0.65
Sh. interbedded with some S.S. - - - - 0.5-0.7 0.60
Alternations of S.S & Mudstone - - - - 0.5-0.6 0.55
Dolomite 10-6~10-10.5 10-7~10-10.5 10-9~10-10 10-8 0.6-0.8 0.70
Limestone 10-6~10-10.5 10-7~10-9 10-9~10-10 10-8 0.6-0.8 0.70
Shale 10-10~10-12 10-10~10-13 - 10-10.5 0.4-0.6 0.50
Sandy Shale - - - - 0.5-0.6 0.60
Siltstone 10-10~10-12 - - 10-11 0.2-0.4 0.30
Sandy Siltstone - - - - 0.3-0.4 0.40
Argillaceous Siltstone - - - - 0.2-0.3 0.20
Claystone - 10-9~10-13 - 10-11 0.2-0.4 0.30
Mudstone - - - - 0.2-0.4 0.20
Sandy Mudstone - - - - 0.3-0.4 0.40
Silty Mudstone - - - - 0.2-0.3 0.30
Granite - - 10-11~10-12 10-11.5 0.1-0.2 0.15
Basalt 10-6~10-10.5 10-10~10-13 - 10-11.5 0.1-0.2 0.15
1B.B.S. Singhal & R.P. Gupta (1999);2Karlheinz Spitz & Joanna Moreno (1996);3Bear(1972)
Table 2. Description and ratings for lithology permeability index.
5.5 Rock mass permeability index As stated above, the rock mass permeability may be dependent on the following four parameters: RQD, DI, GCD, and LPI. However, the permeability is not simply affected by only one factor. It may account for the synthetic effect from the four parameters on permeability. Accordingly, Rock mass permeability index, called the HC index, was proposed herein.
( )( )( )( )HC 1-RQD DI 1-GCD LPI= ., (4)
The value of each parenthesis at the right hand side of Eq. 4. is always greater than zero and less than one depending on the values assigned to the four parameters. The greater the value of each parenthesis, the higher the permeability. Thus, the model performs a numerical assessment of rock mass permeability using the four parameters. Since it is rare to encounter the condition that RQD is 100% in highly disturbed clastic sedimentary rocks in Taiwan, the term of (1-RQD) is usually greater than zero. However, it should be noted that if (1-RQD) is
www.intechopen.com

Estimating Hydraulic Conductivity of Highly Disturbed Clastic Rocks in Taiwan
281
zero, the value of 0.01 in the term of (1-RQD) is suggested to avoid the HC value to be zero. Currently, the study took the same weight for each factor in Eq. (4). In addition, Eq. (4) is limited in sedimentary rocks only and is only applied to vertical boreholes at present. With more testing data, a further study can be considered to assign a different weight for each factor to give a better correlation between the hydraulic conductivity and HC.
5.6 The empirical HC model Regression analysis was performed to estimate the dependence of HC on hydraulic conductivity. A total of 22 hydraulic test data were applied to the study. HC-values for the hydraulic tests can be computed from borehole image data and rock core data, in which the values of RQD and GCD at each test interval can be calculated from borehole image data and rock core data with Eqs. 1. and 3., respectively. The value of DI can be calculated using Eq. 2. The value of LPI for each test zone can be obtained from rock core data and Table 3. Table 3 shows the calculated results for the HC model based on the verified data. The regression results indicated that a power law relationship exists between the hydraulic conductivity and HC with a coefficient of determination of 0.866 as shown in Fig. 7. The empirical HC model is obtained as shown in Eq. 5.
( )1.380-6 2K 2.93 10 HC , 0.866R= × × = (5)
If only HB-94-01 testing data were adopted, a better correlation with the coefficient of determination of 0.905 can be obtained as shown in Eq. 6.
( )1.342-6 2K 2.31 10 HC , 0.905R= × × = (6)
All data included.Ro
ck m
ass
hy
dra
uli
c co
nd
uct
ivit
y (
m/s
ec)
HC value
905.0 ,1031.2
866.0 ,1093.2
2342.16
2380.16
=××=
=××=
−
−
RHCK
RHCK
HB-94-01
HB-95-02
HB-95-01
Only HB-94-01 data included.
0.00 0.05 0.10 0.15 0.20 0.25 0.30 0.35 0.40
10-10
10-9
10-8
10-7
10-6
10-5
Fig. 7. Relationship between hydraulic conductivity and HC-values.
www.intechopen.com

Hydraulic Conductivity – Issues, Determination and Applications
282
Boreholes Test intervals
(m) 1-RQD DI 1-GCD LPI HC K (m/s)
HB-94-01
34.7-36.3 0.094 0.677 1.000 1.000 0.0635 7.06E-08
36.4-38.0 0.438 0.662 1.000 1.000 0.2895 1.64E-06
56.7-58.3 0.063 0.477 1.000 0.950 0.0283 1.53E-08
74.6-76.2 0.500 0.315 1.000 0.400 0.0629 5.3E-08
77.2-78.8 0.010 0.291 1.000 0.400 0.0012 4.22E-10
82.6-84.2 0.125 0.242 1.000 0.400 0.0121 2.31E-09
90.2-91.8 0.010 0.173 1.000 0.400 0.0007 2.86E-10
94.2-95.8 0.500 0.136 1.000 0.400 0.0273 4.53E-09
HB-95-01
99.0-101.9 0.345 0.598 0.200 0.400 0.0165 9.8E-09
117.2-120.1 0.690 0.526 1.000 0.850 0.3081 9.76E-07
133.2-136.1 0.724 0.461 0.286 1.000 0.0954 4.68E-08
HB-95-02
88.6-91.4 0.071 0.743 1.000 0.600 0.0318 1.56E-07
96.0-99.2 0.031 0.721 1.000 0.600 0.0135 2.42E-08
118.5-121.7 0.219 0.657 0.071 0.700 0.0072 1.36E-09
134.8-138.0 0.344 0.610 0.727 0.700 0.1068 1.17E-07
154.8-158.0 0.938 0.553 0.103 0.700 0.0376 1.99E-08
173.0-176.2 0.938 0.501 0.103 0.700 0.0340 9.08E-09
189.8-193.0 0.594 0.453 1.000 0.700 0.1883 1.01E-06
196.6-199.8 0.563 0.434 0.500 1.000 0.1220 6.00E-08
213.2-216.0 0.679 0.387 1.000 1.000 0.2625 4.54E-07
249.0-251.8 0.393 0.285 0.091 0.700 0.0071 4.03E-09
272.0-274.8 0.214 0.219 1.000 0.700 0.0328 3.36E-08
Table 3. The calculated results for HC-system based on 22 hydraulic test data.
It should be noted that the values of (1-GCD) in HB-94-01 borehole are all equal to 1. The results of Eq. 6 demonstrate that the empirical HC model may also be more accurate for the estimation of the rock mass hydraulic conductivity if the fractures do not contain infillings. There are a few limitations that need to be noted for the use of Eq. 5. The data used to develop the equation are limited in number and in the lithologies represented. From the definition of DI, DI cannot be determined for inclined boreholes because the data collected were from vertical boreholes.
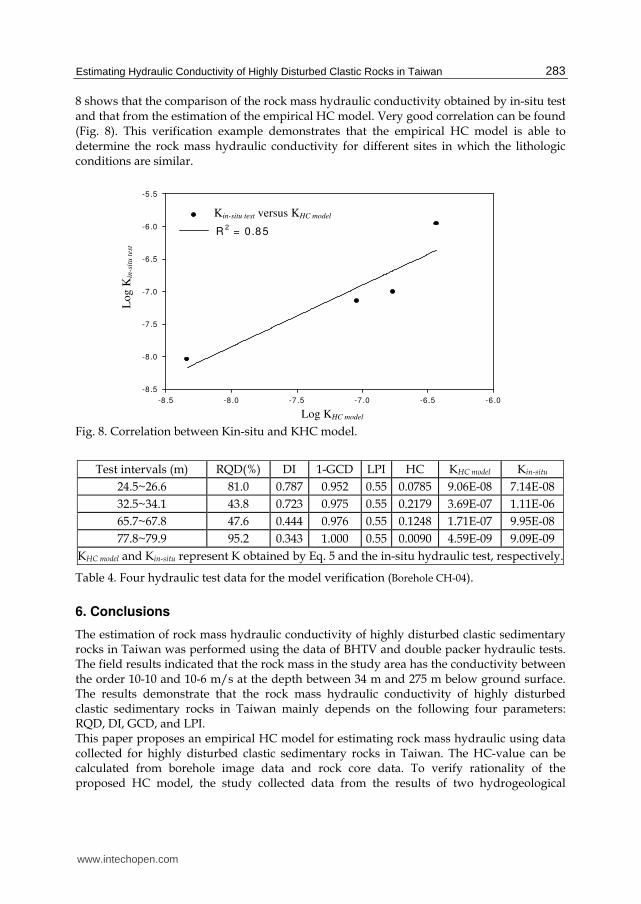
5.7 Model verification In order to further verify the feasibility of the proposed empirical HC model, the model verification is conducted. Another borehole data with the drilling depth of 120 m is adopted to verify the empirical HC model. The principal lithologic units of the borehole, namely CH-04, are mainly sandstone, shale, and sandstone with some thin shale. The depth from 24.5 m to 26.6 m, 32.5 m to 34.1 m, 65.7 m to 67.8 m, and 77.8 m to 79.9 m were sealed by double packers for conducting the hydraulic tests. The quantitative evaluation of hydraulic
parameters was then performed using AQTESOLVE which uses an iterative process of the best-fit theoretical response curves based on the measured data of the hydraulic test. Figure
www.intechopen.com
Estimating Hydraulic Conductivity of Highly Disturbed Clastic Rocks in Taiwan
283
8 shows that the comparison of the rock mass hydraulic conductivity obtained by in-situ test and that from the estimation of the empirical HC model. Very good correlation can be found (Fig. 8). This verification example demonstrates that the empirical HC model is able to determine the rock mass hydraulic conductivity for different sites in which the lithologic conditions are similar.
Log(Kest
)
-8 .5 -8.0 -7.5 -7.0 -6.5 -6.0
-8.5
-8.0
-7.5
-7.0
-6.5
-6.0
-5.5
Kes t
vs Kobs
R2 = 0.85
Kin-situ test versus KHC model
Log KHC model
Log
Kin
-sit
u t
est
Fig. 8. Correlation between Kin-situ and KHC model.
Test intervals (m) RQD(%) DI 1-GCD LPI HC KHC model Kin-situ
24.5~26.6 81.0 0.787 0.952 0.55 0.0785 9.06E-08 7.14E-08
32.5~34.1 43.8 0.723 0.975 0.55 0.2179 3.69E-07 1.11E-06
65.7~67.8 47.6 0.444 0.976 0.55 0.1248 1.71E-07 9.95E-08
77.8~79.9 95.2 0.343 1.000 0.55 0.0090 4.59E-09 9.09E-09
KHC model and Kin-situ represent K obtained by Eq. 5 and the in-situ hydraulic test, respectively.
Table 4. Four hydraulic test data for the model verification (Borehole CH-04).
6. Conclusions
The estimation of rock mass hydraulic conductivity of highly disturbed clastic sedimentary rocks in Taiwan was performed using the data of BHTV and double packer hydraulic tests. The field results indicated that the rock mass in the study area has the conductivity between the order 10-10 and 10-6 m/s at the depth between 34 m and 275 m below ground surface. The results demonstrate that the rock mass hydraulic conductivity of highly disturbed clastic sedimentary rocks in Taiwan mainly depends on the following four parameters: RQD, DI, GCD, and LPI. This paper proposes an empirical HC model for estimating rock mass hydraulic using data collected for highly disturbed clastic sedimentary rocks in Taiwan. The HC-value can be calculated from borehole image data and rock core data. To verify rationality of the proposed HC model, the study collected data from the results of two hydrogeological
www.intechopen.com

Hydraulic Conductivity – Issues, Determination and Applications
284
investigation programs in three boreholes to determine a relationship between hydraulic conductivity and HC. Besides, good correlation is found from the model verification which demonstrates that the empirical HC model is able to determine the rock mass hydraulic conductivity for different sites in which the lithologic conditions are similar. The regression results indicated that the relationship of a power law exists between the two variables with a coefficient of determination of 0.866. The empirical HC model may provide a useful tool to predict hydraulic conductivity of fractured rocks based on measured HC-values. By using this model, hydraulic conductivity data in a given site can be directly acquired, which removes the cost on hydraulic tests. For in-situ aquifer tests, the empirical HC model is valuable for preliminary assessment of the degree of permeability in a packed-off interval of a borehole.
7. References
Bear, J. (1972). Dynamics of Fluids in Porous Materials, American Elsevier. Black, J. H. (1987). Flow and flow mechanisms in crystalline rock, in Fluid Flow in
Sedimentary Basins and Aquifers. Geol. Soc. Special Publication No. 34, 186-200. Burgess, A. (1977). Groundwater Movements Around a Repository-Regional Groundwater
Analysis. Kaernbraenslesaekerhet, Stockholm, Sweden, 116. Carlson, A. & Olsson, T. (1977). Hydraulic properties of Swedish crystalline rocks-hydraulic
conductivity and its relation to depth. Bulletin of the Geological Institute, University of Uppsala 7, 71-84.
Deere, D. U.; Hendron, A. J.; Patton, F. D.& Cording, E. J. (1967). Design of surface and near surface construction in rock. Proceedings of 8th U.S. Symposium Rock Mechanics, AIME, New York 237-302.
Duffield, G. M. (2004). AQTESOLVE version 4 user’s guide, Developer of AQTESOLV HydroDOLVE, Inc., Reston, VA, USA.
Lee, C. H. & Farmer, I.(1993). Fluid flow in discontinuous rocks. Chapman&Hall, London, UK. Louis, C. (1974). Rock Hydraulics. in Rock Mechanics (ed. L. Muller), Springer Verlag, Vienna. National Research Council. (1996). Rock fractures and fluid flow: contemporary
understanding and applications. National Academy Press, Washington D. C., USA. Singhal, B. B. S. & Gupta, R. P.(1999). Applied hydrogeology of fractured rocks. Kluwer
Academic Publishers, The Netherlands, 400. Spitz, K. & Morena, J. (1996). A Practical Guide to Groundwater and Solute Transport
Modeling, Wiley. Sinotech Engineering Consultants, LTD. (2006). Tseng-Wen transbasin diversion tunnel
project-supplemental geology investigation, Southern Water Resources Office, Water Resources Agency, Ministry of Economic Affairs, Taiwan (in Chinese).
Snow, D. T. (1969). Anisotropic permeability of fractured media. Water Resources Research, 5(6), 1273-1289.
Wei, Z.Q., Egger, P., Descoeudres, F. (1995). Permeability predictions for jointed rock masses. International Journal of Rock Mechanics, Mineral Science and Geomechanics 32, 251-26l.
Williams, J. H. & Johnson, C. D. (2004). Acoustic and optical borehole-wall imaging for fractured-rock aquifer studies. Journal of Applied Geophysics, 55(1–2): 151–159.
Zhao, J. (1998). Rock mass hydraulic conductivity of the Bukit Timah granite, Singapor. Engineering Geology, V 50, 211-216.
www.intechopen.com

Hydraulic Conductivity - Issues, Determination and ApplicationsEdited by Prof. Lakshmanan Elango
ISBN 978-953-307-288-3Hard cover, 434 pagesPublisher InTechPublished online 23, November, 2011Published in print edition November, 2011
InTech EuropeUniversity Campus STeP Ri Slavka Krautzeka 83/A 51000 Rijeka, Croatia Phone: +385 (51) 770 447 Fax: +385 (51) 686 166www.intechopen.com
InTech ChinaUnit 405, Office Block, Hotel Equatorial Shanghai No.65, Yan An Road (West), Shanghai, 200040, China
Phone: +86-21-62489820 Fax: +86-21-62489821
There are several books on broad aspects of hydrogeology, groundwater hydrology and geohydrology, whichdo not discuss in detail on the intrigues of hydraulic conductivity elaborately. However, this book on HydraulicConductivity presents comprehensive reviews of new measurements and numerical techniques for estimatinghydraulic conductivity. This is achieved by the chapters written by various experts in this field of research into anumber of clustered themes covering different aspects of hydraulic conductivity. The sections in the book are:Hydraulic conductivity and its importance, Hydraulic conductivity and plant systems, Determination bymathematical and laboratory methods, Determination by field techniques and Modelling and hydraulicconductivity. Each of these sections of the book includes chapters highlighting the salient aspects and most ofthese chapters explain the facts with the help of some case studies. Thus this book has a good mix of chaptersdealing with various and vital aspects of hydraulic conductivity from various authors of different countries.
How to referenceIn order to correctly reference this scholarly work, feel free to copy and paste the following:
Cheng-Yu Ku and Shih-Meng Hsu (2011). Estimating Hydraulic Conductivity of Highly Disturbed Clastic Rocksin Taiwan, Hydraulic Conductivity - Issues, Determination and Applications, Prof. Lakshmanan Elango (Ed.),ISBN: 978-953-307-288-3, InTech, Available from: http://www.intechopen.com/books/hydraulic-conductivity-issues-determination-and-applications/estimating-hydraulic-conductivity-of-highly-disturbed-clastic-rocks-in-taiwan

© 2011 The Author(s). Licensee IntechOpen. This is an open access articledistributed under the terms of the Creative Commons Attribution 3.0License, which permits unrestricted use, distribution, and reproduction inany medium, provided the original work is properly cited.