
ESTIMATING HYDRAULIC CONDUCTIVITY OF COMPACTED CLAY...
26
ESTIMATING HYDRAULIC CONDUCTIVITY OF COMPACTED CLAY LINERS By Craig H. Benson, 1 Associate Member, ASCE, Huaming Zhai, 2 and Xiaodong Wang 3 ABSTRACT: A database is described that contains laboratory measurements of hydraulicconductivity and associated soil properties that were extracted from con- struction reports for compacted soil liners. The database contains measurements conducted on a wide variety of soils from 67 landfills in North America. The database was used to evaluate relationships between hydraulic conductivity, com- positional factors, and compaction variables and to identify minimum values for soil properties that are likely to yield a geometric mean hydraulic conductivity -<1 • 10-7 cm/s. m graphical analysis suggests that a geometric mean hydraulic con- ductivity -<1 • 10-7 cm/s can be achieved if the liquid limit ->20, the plasticity index ->7, the percent fines (<No. 200 sieve) ->30%, and the percent clay (<2 ixm) ->15%. A multivariate regression equation was also developed that can be used to estimate the geometric mean hydraulic conductivityas a function of soil composition and compaction conditions. INTRODUCTION Compacted soil liners are widely used as hydraulic barriers in waste- containment facilities. To be effective, a compacted soil liner should have low hydraulic conductivity, which in many cases is considered to be less than 1 • 10 -7 cm/s. In recent years, guidelines have been compiled for selecting appropriate soil properties and compaction methods that are likely to result in low hydraulic conductivity (Gordon et al. 1984; Daniel 1990). These guidelines are typically based on experience and generally include minimum values or acceptable ranges for properties that describe compo- sition of soil (e.g., Atterberg limits, particle-size distribution) and recom- mendations for selection of compaction criteria (i.e., control of water con- tent and dry unit weight) and compaction machinery. The purpose of this paper is to present data collected from actual soil liners that can be used to support and refine guidelines in current use. The paper is not meant to be a theoretical treatise on factors affecting hydraulic conductivity; numerous fundamental studies on hydraulic conductivity of compacted clay have been presented elsewhere (Lambe 1954; Mitchell et al. 1965; Garcia-Bengochea et al. 1979; Acar and Oliveri 1989; Benson and Daniel 1990). Instead, the paper is meant to be a practical guide that shows how basic soil properties and compaction conditions normally mon- itored during construction quality control of soil liners are related to hy- draulic conductivity. A database is used to explore the relationship between hydraulic con- 1Asst. Prof., Dept. of Civ. and Envir. Engrg., Univ. of Wisconsin, Madison, WI 53706. aRes. Assoc., Dept. of Civ. and Envir. Engrg., Univ. of Wisconsin, Madison, WI. 3Res. Scientist, Dept. of Civ. and Envir. Engrg., Univ. of Wisconsin, Madison, WI. Note. Discussion open until July 1, 1994. To extend the closing date one month, a written request must be filed with the ASCE Manager of Journals. The manuscript for this paper was submitted for review and possible publication on May 14, 1992. This paper is part of the Journal of Geotechnical Engineering, Vol. 120, No. 2, February, 1994. ISSN 0733-9410/94/0002-0366/$1.00 + $. 15 per page. Paper No. 4052. 366
Transcript of ESTIMATING HYDRAULIC CONDUCTIVITY OF COMPACTED CLAY...

E S T I M A T I N G H Y D R A U L I C C O N D U C T I V I T Y O F
C O M P A C T E D C L A Y L I N E R S
By Craig H. Benson, 1 Associate Member, ASCE, Huaming Zhai, 2 and Xiaodong Wang 3
ABSTRACT: A database is described that contains laboratory measurements of hydraulic conductivity and associated soil properties that were extracted from con- struction reports for compacted soil liners. The database contains measurements conducted on a wide variety of soils from 67 landfills in North America. The database was used to evaluate relationships between hydraulic conductivity, com- positional factors, and compaction variables and to identify minimum values for soil properties that are likely to yield a geometric mean hydraulic conductivity -<1 • 10 -7 cm/s. m graphical analysis suggests that a geometric mean hydraulic con- ductivity -<1 • 10 -7 cm/s can be achieved if the liquid limit ->20, the plasticity index ->7, the percent fines (<No. 200 sieve) ->30%, and the percent clay (<2 ixm) ->15%. A multivariate regression equation was also developed that can be used to estimate the geometric mean hydraulic conductivity as a function of soil composition and compaction conditions.
INTRODUCTION
Compacted soil liners are widely used as hydraulic barriers in waste- containment facilities. To be effective, a compacted soil l iner should have low hydraulic conductivity, which in many cases is considered to be less than 1 • 10 -7 cm/s. In recent years, guidelines have been compi led for selecting appropr ia te soil proper t ies and compact ion methods that are l ikely to result in low hydraulic conductivity (Gordon et al. 1984; Daniel 1990). These guidelines are typically based on experience and general ly include minimum values or acceptable ranges for proper t ies that describe compo- sition of soil (e.g. , At te rbe rg limits, particle-size distr ibution) and recom- mendations for selection of compact ion cri teria (i .e. , control of water con- tent and dry unit weight) and compact ion machinery.
The purpose of this paper is to present data collected from actual soil liners that can be used to support and refine guidelines in current use. The paper is not meant to be a theoret ical t reat ise on factors affecting hydraulic conductivity; numerous fundamenta l studies on hydraulic conductivity of compacted clay have been presented elsewhere (Lambe 1954; Mitchell et al. 1965; Garc ia-Bengochea et al. 1979; Aca r and Oliveri 1989; Benson and Daniel 1990). Instead, the paper is meant to be a practical guide that shows how basic soil proper t ies and compact ion conditions normal ly mon- i tored during construction quali ty control of soil liners are related to hy- draulic conductivity.
A database is used to explore the relat ionship between hydraulic con-
1Asst. Prof., Dept. of Civ. and Envir. Engrg., Univ. of Wisconsin, Madison, WI 53706.
aRes. Assoc., Dept. of Civ. and Envir. Engrg., Univ. of Wisconsin, Madison, WI.
3Res. Scientist, Dept. of Civ. and Envir. Engrg., Univ. of Wisconsin, Madison, WI.
Note. Discussion open until July 1, 1994. To extend the closing date one month, a written request must be filed with the ASCE Manager of Journals. The manuscript for this paper was submitted for review and possible publication on May 14, 1992. This paper is part of the Journal of Geotechnical Engineering, Vol. 120, No. 2, February, 1994. �9 ISSN 0733-9410/94/0002-0366/$1.00 + $. 15 per page. Paper No. 4052.
366
ductivity, compositional factors of the soil, and compaction conditions. The data were collected from 67 landfills at various locations in North America. Graphs and multivariate regression are used to identify compositional and compaction variables that correlate with hydraulic conductivity. Results of the graphical and regression analyses are used to: (1) Define minimum values for soil properties that will yield hydraulic conductivity - 1 x 10 -7 cm/s; (2) identify compaction conditions that yield low hydraulic conductivity; and (3) identify important variables to control during construction of soil liners.
FACTORS AFFECTING HYDRAULIC CONDUCTIVITY
In his initial studies on the engineering behavior of compacted clay, Lambe (1954) stated that five factors had the greatest influence on hydraulic con- ductivity: (1) Soil composition; (2) permeant characteristics; (3) void ratio; (4) structure; and (5) degree of saturation during permeation. Subsequently, numerous other investigators have studied these factors in detail (Lambe 1954; Bjerrum and Huder 1957; Mitchell et al. 1965; Barden and Sides 1970; Garcia-Bengochea et al. 1979; Acar and Oliveri 1989; Benson and Daniel 1990). The scope of this paper is focused primarily on two of these factors, namely soil composition and structure.
SOIL COMPOSITION
Atterberg Limits The Atterberg limits are indices of the quantity of clay-size particles and
their mineralogical composition. Typically, higher liquid limit and plasticity index are associated with soils having a greater quantity of clay particles or clay particles having higher surface activity (Mitchell 1976). Consequently, a relationship between hydraulic conductivity and the Atterberg limits is expected (Terzaghi 1925). In particular, all other factors being equal, more plastic clays (i.e., having higher liquid limit or plasticity index) should have lower hydraulic conductivity.
Lambe (1954) showed the sensitivity of hydraulic conductivity to plasticity by presenting hydraulic conductivities for several different clays. The hy- draulic conductivity measurements were conducted in consolidometers on normally consolidated sedimented specimens. The data showed that for a given void ratio monovalent montmorillonite (e.g., sodium) had the lowest hydraulic conductivity, followed by divalent montmorillonite (e.g., cal- cium), attapulgite, and kaolinite. Although Atterberg limits for the clays were not presented by Lambe (1954), their plasticity typically decreases in the following order: monovalent montmorillonite > divalent montmoril- lonite > attapulgite > kaolinite (Mitchell 1976).
A distinct trend of decreasing hydraulic conductivity with increasing plas- ticity was also presented by Mesri and Olson (1971). They investigated how the hydraulic conductivity of three clays was related to clay type, void ratio, and permeant chemistry. They back-calculated hydraulic conductivities from consolidation tests on normally consolidated specimens using Terzaghi's consolidation theory. The specimens were kaolinite, illite, or smectite and had plasticity indices of approximately 20, 60, and 500. The specimens were consolidated from homoionic slurries that were prepared by repeated wash- ing with concentrated solutions of sodium chloride or calcium chloride. At a void ratio of 2.0, they measured hydraulic conductivities (when permeated with water) of 1.5 x 10 -6 (kaolinite), 2 x 10 -9 (illite), and 1 x 10 -11 (montmorillonite) cm/s. They explained that the clays with a higher plasticity
367
index had smaller particles, less aggregation, and thicker double layers. These factors combined to yield lower hydraulic conductivity.
A similar relationship between hydraulic conductivity and plasticity should exist for clays compacted wet of optimum water content, where flow is affected primarily by the size and shape of microscale pores. Nevertheless, a trend of decreasing hydraulic conductivity with increasing plasticity cannot be assumed a priori, because sedimented clays and compacted clays are formed by vastly different processes. Ideally, data from studies in literature could be compiled to determine if a trend exists, but because procedures used for compaction and permeation have differed substantially over the years, a direct comparison between results obtained by various investigators is difficult to make.
Particle-Size Distribution The particle-size distribution of compacted clay affects hydraulic con-
ductivity because the size of voids conducting flow is affected by the relative proportions of large and small particle sizes. Low hydraulic conductivity is likely to be achieved when the soil is well graded and the clay fraction governs the hydraulic behavior of the matrix.
Percentage of Clay Daniel (1987) presented a graph of hydraulic conductivity versus percent
bentonite for a sand-bentonite mixture. He found that hydraulic conductivity decreased significantly (10 -4 to 10 -8 cm/s) as the percentage of bentonite was increased from 0% to 8%. At higher bentonite contents, however, little further reduction in hydraulic conductivity occurred. Similar results have been observed by Kenney et al. (1992), who compacted and permeated sand-bentonite mixtures at various molding water contents. For water con- tents wet of optimum, hydraulic conductivity was very sensitive to bentonite content when the bentonite content was less than 12% and insensitive for bentonite contents exceeding 12%.
The low hydraulic conductivities achieved at bentonite contents exceeding 8-12% occurred because clay-size particles filled voids between the sand particles and controlled the hydraulic behavior of the soil. Effectively, the soil was behaving hydraulically as a clay even though it was principally composed of sand size particles. This behavior is consistent with findings of Seed et al. (1964), who found that mixtures of sand and bentonite changed from nonplastic to plastic at bentonite contents near 10%.
Percentage of Fines D'Appolonia (1980) evaluated how the percentage of fines (particles smaller
than the No. 200 sieve) affected the hydraulic conductivity of soil-bentonite slurries. He found that hydraulic conductivity decreased as the percentage of fines increased even when the percentage of fines was substantial (>30%). He also found that slurries containing plastic fines typically had hydraulic conductivities one order of magnitude lower than slurries containing pri- marily nonplastic fines. Similar results have been presented by Ryan (1987).
D'Appolonia's results are consistent with changes in hydraulic conduc- tivity occurring by adding bentonite (Daniel 1987; Kenney et al. 1992) or increasing plasticity. Additional fines will fill pores between coarser parti- cles, reduce the size of pores controlling flow, and consequently decrease hydraulic conductivity. Furthermore, as the percentage of fines consisting
368
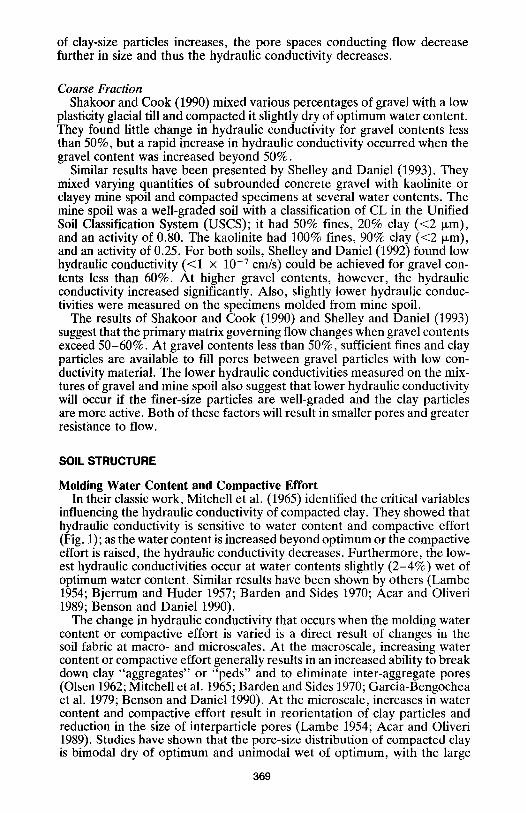
of clay-size particles increases, the pore spaces conducting flow decrease further in size and thus the hydraulic conductivity decreases.
Coarse Fraction Shakoor and Cook (1990) mixed various percentages of gravel with a low
plasticity glacial till and compacted it slightly dry of optimum water content. They found little change in hydraulic conductivity for gravel contents less than 50%, but a rapid increase in hydraulic conductivity occurred when the gravel content was increased beyond 50%.
Similar results have been presented by Shelley and Daniel (1993). They mixed varying quantities of subrounded concrete gravel with kaolinite or clayey mine spoil and compacted specimens at several water contents. The mine spoil was a well-graded soil with a classification of CL in the Unified Soil Classification System (USCS); it had 50% fines, 20% clay (<2 ~m), and an activity of 0.80. The kaolinite had 100% fines, 90% clay (<2 Ixm), and an activity of 0.25. For both soils, Shelley and Daniel (1992) found low hydraulic conductivity (<1 • 10 -7 cm/s) could be achieved for gravel con- tents less than 60%. At higher gravel contents, however, the hydraulic conductivity increased significantly. Also, slightly lower hydraulic conduc- tivities were measured on the specimens molded from mine spoil.
The results of Shakoor and Cook (1990) and Shelley and Daniel (1993) suggest that the primary matrix governing flow changes when gravel contents exceed 50-60%. At gravel contents less than 50%, sufficient fines and clay particles are available to fill pores between gravel particles with low con- ductivity material. The lower hydraulic conductivities measured on the mix- tures of gravel and mine spoil also suggest that lower hydraulic conductivity will occur if the finer-size particles are well-graded and the clay particles are more active. Both of these factors will result in smaller pores and greater resistance to flow.
SOIL STRUCTURE
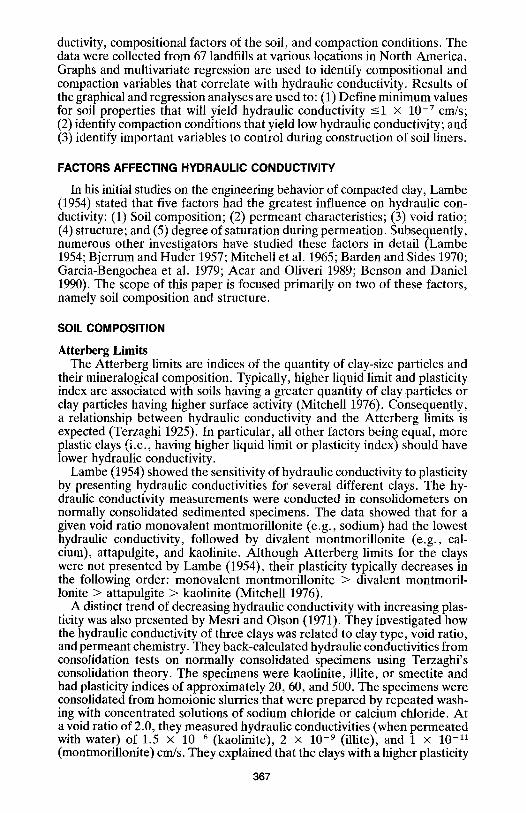
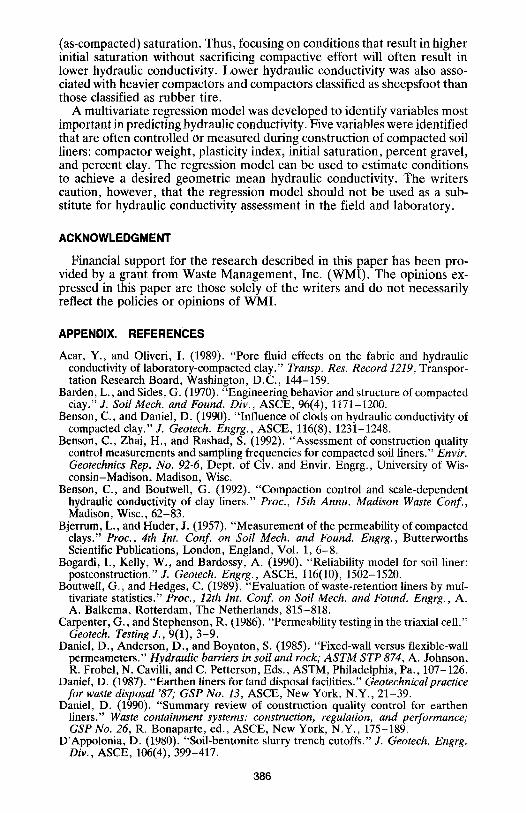
Molding Water Content and Compactive Effort In their classic work, Mitchell et al. (1965) identified the critical variables
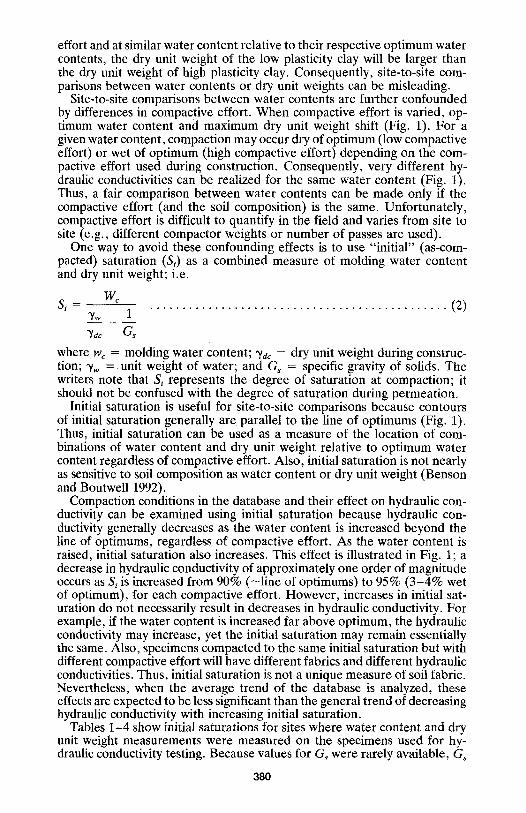
influencing the hydraulic conductivity of compacted clay. They showed that hydraulic conductivity is sensitive to water content and compactive effort (Fig. 1); as the water content is increased beyond optimum or the compactive effort is raised, the hydraulic conductivity decreases. Furthermore, the low- est hydraulic conductivities occur at water contents slightly (2-4%) wet of optimum water content. Similar results have been shown by others (Lambe 1954; Bjerrum and Huder 1957; Barden and Sides 1970; Acar and Oliveri 1989; Benson and Daniel 1990).
The change in hydraulic conductivity that occurs when the molding water content or compactive effort is varied is a direct result of changes in the soil fabric at macro- and microscales. At the macroscale, increasing water content or compactive effort generally results in an increased ability to break down clay "aggregates" or "peds" and to eliminate inter-aggregate pores (Olsen 1962; Mitchell et al. 1965; Barden and Sides 1970; Garcia-Bengochea et al. 1979; Benson and Daniel 1990). At the microscale, increases in water content and compactive effort result in reorientation of clay particles and reduction in the size of interparticle pores (Lambe 1954; Acar and Oliveri 1989). Studies have shown that the pore-size distribution of compacted clay is bimodal dry of optimum and unimodal wet of optimum, with the large
369

I 0 "3 I I I I I [
o E 10-5
T, - ~ Low
Mod. Effort ........... ~ .................................. ~o.. ............ .I. . . . . . . . . . . . . . . . . . . . . . . . . . . . . . . . . . . . . . . . . . . . . . .
.+, \- I E.ort \ /L U 10 .7 .................................. ~ . . . ........................ ~ Opt. Water
" 1 " a d a p t e d f
('a) 10 -9 iitchelletal.!1965) . . . . , I I I I
116 \ I \ i \ I ~ I k I
~" 112 High \ \ ~
. / ' ~ " ' ~ c ~ S i ' 1 0 0 %
"+ 104 Moder/ate \ , / / > < S ==~90~/~ ~ ._~:-- Effo. / ~ \ ' \ .~ D t00 , " ~ .
~' / Si=70% " \ " ,,~ a 96 Low
Effort \ \
(b) 92 I ~ B B = I 1 13 15 17 19 21 23 25
W a t e r Content (%)
FIG. 1. Relationship between Hydraulic Conductivity, Water Content, and Com- pactive Effort [Adapted from Mitchell et al. (1965)]
pore mode being eliminated when the molding water content is increased above optimum water content (Garcia-Bengochea et al. 1979; Acar and Oliveri 1989). Acar and Oliveri (1989) have also shown that increasing compactive effort decreases the frequency of large pores and can eliminate the large pore mode. These changes in pore size yield lower hydraulic conductivity.
C o m p a c t i o n M e t h o d
Mitchell et al. (1965) also found that compaction method affects hydraulic conductivity. Specimens of silty clay were compacted at various water con- tents using static and kneading compaction. The compactive effort was controlled so that both compaction methods resulted in the same dry unit weight for a given water content. Results of hydraulic conductivity tests on the specimens showed that kneading compaction yielded hydraulic conduc- tivities approximately half an order of magnitude lower than static com- paction when the clay was compacted wet of optimum water content. How-
370

ever, dry of optimum water content, similar hydraulic conductivities were obtained for both methods.
The lower hydraulic conductivity associated with kneading compaction has been attributed to larger shear strains that occur as the foot of the kneading compactor penetrates the soil (Mitchell et al. 1965). Wet of op- timum water content, shear strains induced by kneading compaction are more effective in remolding aggregates and reorienting the clay particles into a compact and oriented arrangement. Consequently, the size of pores controlling flow is reduced and the hydraulic conductivity decreases.
DATABASE
A database was compiled by extracting data from construction docu- mentation reports from 67 landfills in North America. Only compacted soil liners constructed with natural clays were considered; soil-bentonite liners, naturally occurring clay liners, and liners constructed with mine spoils or other waste materials were not included in the database. Care was exercised to exclude sites where scale-dependent hydraulic conductivities were known or likely to exist or where compaction dry of the line of optimums occurred. Thus, the database represents hydraulic conductivities for carefully com- pacted liners. Soil liners with construction defects or liners constructed with synthetic clay soils (soil-bentonite mixtures, mine tailings, etc.) may have much different hydraulic conductivity at field-scale than would be expected based on the data presented in this paper.
Selection Criteria When the data were extracted from the reports, care was taken to elim-
inate erroneous or ambiguous data. The primary screening criteria were the following.
Hydraulic conductivity measurements included in the database were lim- ited to tests performed on "undisturbed" specimens collected using thin- wall sampling (Shelby) tubes or as blocks. Remolded specimens were not included. Block specimens were collected from sites 15, 19, and 20 (see Tables 1-4). All other specimens were collected in 7-cm-diameter Shelby tubes. The block specimens were trimmed to a diameter of 7 cm for labo- ratory testing.
Hydraulic conductivity measurements included in the database were lim- ited to tests performed in flexible-waU permeameters, rigid-wall Shelby- tube permeameters, or consolidation cells equipped for direct measurement of hydraulic conductivity. Descriptions of these permeameters can be found in Olson and Daniel (1981), Carpenter and Stephenson (1986), and Daniel et al. (1985). Specimens tested at gradients exceeding 80 or at effective stresses exceeding 140 kPa were not included. Consolidation cells were used at sites 37=39, 43, 45, and 62-64, and Shelby-tube permeameters were used at sites 3, 5, 7, 36, 47, 61, and 64 (see Tables 1-4). Flexible-wall perme- ameters were used at all other sites. Provided no side-wall leakage occurs and the testing conditions (e.g., effective stress and gradient) are approx- imately the same, each of these permeameters will yield similar hydraulic conductivity for a given soil (Daniel et al. 1985).
Measurements of water content and dry unit weight were required for a site to be included in the database. The measurements were used to identify sites unlikely to have scale-dependent hydraulic conductivity (i.e., hydraulic conductivity sensitive to size of the test specimen) by ensuring at least 85%
371

TABLE 1. Summary of Data
Number Site K % % % %
number measured LL PI Activity Gravel Sand Fines Clay (1) (2) (3) (4) (5) (6) (7) (8) (9)
1 47 49 29 0.74 0,5 19.3 80.2 39.8 2 a 8 15 2 0.14 NA NA 56.1 13,9 3 9 87 57 0.64 0,0 0.0 100.0 70.3 4 5 48 26 0.56 0.0 14.6 87.4 46.4 5 b 87 51 34 0.71 0.0 15.3 84.7 48.2 6 a 24 41 23 0.80 1.5 20.1 78.3 28.3 7 13 39 21 0.54 4.0 17.3 79.0 39.1 8 10 30 12 NA NA NA 84.2 NA 9 27 46 31 0.68 0.0 17.1 83.4 45.4
10 36 38 22 0.62 0.0 22.2 78.2 35.1 11 82 47 32 0.70 0.0 16.2 84.3 44.8 12 33 57 29 0.55 4,7 13.6 82,1 51.9 13 6 63 32 0.45 2.5 10.3 87.2 70,7 14 12 19 7 0.33 5.8 39.4 54.7 20.5 15 50 67 44 0.76 0.0 5.4 95.4 58.3 16 8 84 58 0.77 0,0 0.0 100.0 74.4 17 35 83 60 0.80 0.2 1.6 98.2 74.8 18 6 64 39 0.71 4.0 9.8 86.1 55.3 19 b 11 82 55 0.78 0.0 0.0 100.0 70.2 20 ~ 15 61 41 0.74 0.0 9.8 90.1 55.4 21 ~ 12 34 12 0.45 22.2 33.5 44,3 26,3 22 13 42 25 0.85 2.6 17.4 80.0 30.1 23 a 5 41 25 0.75 1,9 17.7 80.8 32.6 24 14 50 33 0,73 0,3 14.7 85.2 4542 25 249 25 10 0.46 2.0 13.1 85.4 21,6 26 27 28 9 0.39 2.0 13.3 85.1 24.4 27 95 30 13 0.39 8.0 7.1 85.3 32.3 28 17 68 43 0,75 0.0 5.0 95,2 57.1 29 22 33 19 0.48 1.5 14.2 84.3 38.3 30 9 35 19 0.43 0.6 12.2 87.2 44.4 31 55 52 18 0.40 1.7 14.1 84.2 45.8 32 25 53 19 0.57 5.0 20.3 75.3 33.2 33 ~ 9 91 60 1.09 5.0 15,2 79.8 55.3 34 24 19 11 0.34 3.0 18.9 77.2 31.8 35 38 29 14 0.44 0.3 13.1 86.7 32,4
aMeasurement of water content and dry unit weight performed at independent loca- tions.
~ samples were used for testing.
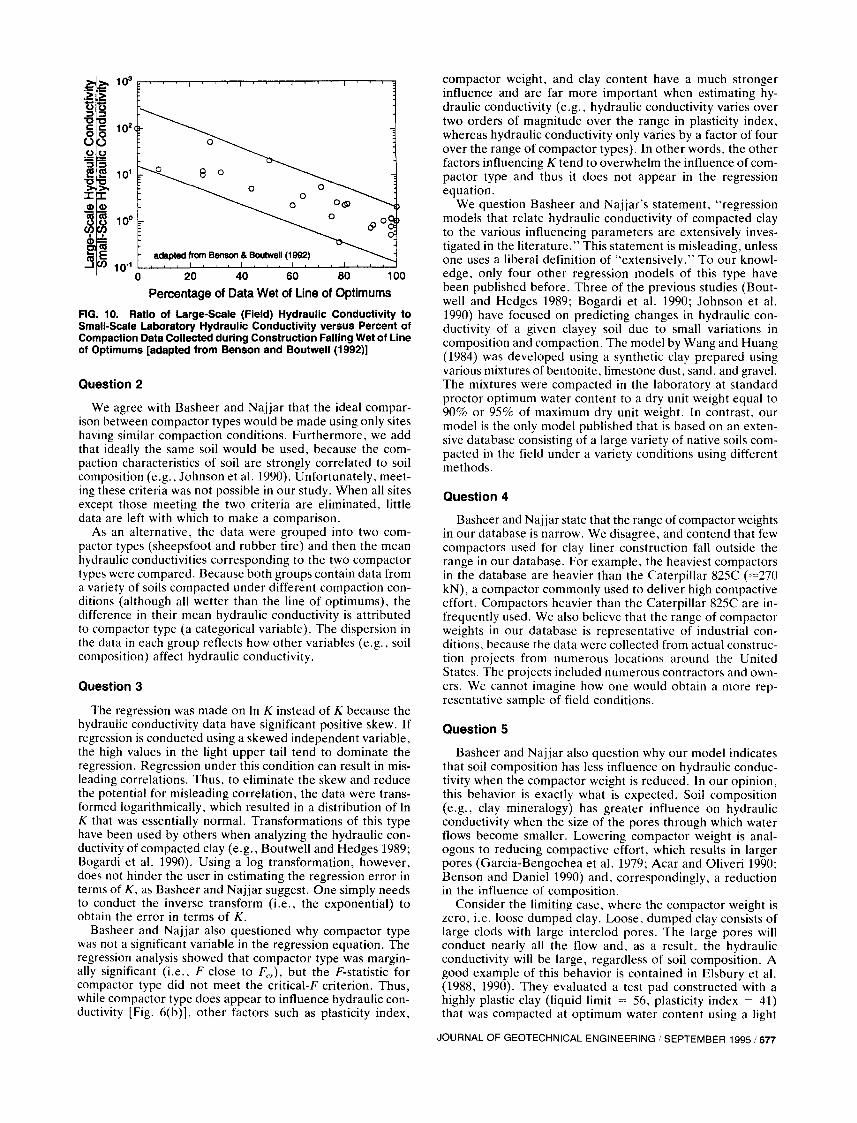
of the m e a s u r e m e n t s fell w e t o f t he l ine of o p t i m u m s . B e n s o n a n d B o u t w e l l (1992) h a v e s h o w n t h a t th is c r i t e r i on g e n e r a l l y r e su l t s in s imi la r h y d r a u l i c conduc t iv i ty at l a rge ( f ie ld) a n d sma l l ( l a b o r a t o r y ) scales.
M e a s u r e m e n t s of A t t e r b e r g l imits o r pa r t i c le - s ize d i s t r i b u t i o n w e r e re- qu i red for a si te to b e i n c l u d e d in t h e d a t a b a s e .
T h e fo r ego ing c r i t e r i a w e r e s e l ec t ed to e l i m i n a t e e r r o n e o u s o r a m b i g u o u s da ta , to r e d u c e va r i ab i l i ty c a u s e d by d i f f e r ences in d a t a co l l ec t ion a n d tes t -
372
TABLE 2. Summary of Data
Com- Dry unit Initial pactor Corn-
Site Water weight saturation Kg weight pactor number content (kN/m 3) (%) (cm/s) CvK (kN) type
(1) (2) (3) (4) (5) (6) (7) (8)
1 21.1 15.8 0.84 6.0E - 08 234 298 SF 2 a NA NA NA 1.0E - 07 63 165 RT 3 38.1 12.5 0,92 3.6E - 09 48 200 SF 4 21.5 17.0 1.04 4.9E - 09 32 320 SF 5 b 19.0 16.8 0.89 6.0E - 08 56 165 SF 6 a NA NA NA 1.7E - 08 128 267 RT 7 18.0 17.7 0.98 2.2E - 08 158 267 RT 8 13.0 18.8 0.86 5.8E - 08 63 NA NA 9 20.6 16.0 0.86 4.5E - 09 129 200 SF
10 19.4 16,2 0.82 1.3E - 08 151 200 SF l l 21.2 16.0 0.87 5.8E - 09 159 200 SF 12 NA NA NA 1.4E - 08 89 NA NA 13 29.8 14.2 0.93 2.8E - 08 27 200 SF 14 10.2 19.8 0.82 2.7E - 07 133 NA NA 15 20.9 16.3 0.90 6.7E - 09 150 200 SF 16 31.8 13.5 0.90 5.0E - 09 112 200 SF 17 27.7 14.7 0.93 3.4E - 09 106 200 SF 18 27.5 14.7 0.93 3.6E - 09 75 320 SF 19 ~ 26.7 15.2 0.98 1.2E - 08 92 200 SF 20 ~ 23.2 16.2 0.99 1.6E - 08 127 200 SF 21 ~ 12.4 18.4 0.77 4.9E - 07 227 NA NA 22 17.2 16.7 0.80 6.5E - 08 138 267 RT 23 a NA NA NA 1.0E - 08 75 267 SF 24 19.4 16.4 0.86 4.8E - 09 58 320 SF 25 14.0 19.1 0,98 9.7E - 09 94 338 SF 26 14.7 18.6 0.93 1.1E - 08 33 338 SF 27 15.4 18.5 0.97 9.0E - 09 34 338 SF 28 28.2 14.2 0.89 2.4E - 08 63 187 SF 29 16.3 18.3 0.99 2.4E - 08 68 320 SF 30 15.6 18.1 0.92 2.6E - 08 155 320 SF 31 24.5 15.3 0.90 1.3E - 07 116 187 SF
i
32 25.0 15.2 0.91 !2.6E - 07 277 187 SF 33 ~ 32.9 13.5 0.93 2.7E - 09 46 320 SF 34 17.8 17.5 0.94 2,8E - 08 66 311 SF 35 11.9 19.7 0.93 1.2E - 08 158 334 SF
aMeasurement of water content and dry unit weight performed at independent loca- tions.
~ samples were used for testing.
ing, a n d to i so la te h y d r a u l i c c o n d u c t i v i t i e s r e p r e s e n t a t i v e o f f i e ld -sca le con - di t ions . T h e w r i t e r s a d m i t , h o w e v e r , t h a t n u m e r o u s f a c t o r s a f f ec t i ng hy- draul ic c o n d u c t i v i t y ( e . g . , d i s t u r b a n c e d u r i n g s a m p l i n g a n d e x t r u s i o n , va r i a t i ons in e f fec t ive s t r e s s , a n d t e s t i n g e r r o r s ) a r e diff icul t t o i so l a t e f r o m the da t a a n d c o n s e q u e n t l y a r e diff icul t t o q u a n t i f y . H o w e v e r , t h e d a t a w e r e o b t a i n e d f r o m a l a rge n u m b e r o f s i tes w h e r e t e s t s w e r e p e r f o r m e d b y v a r i o u s
373
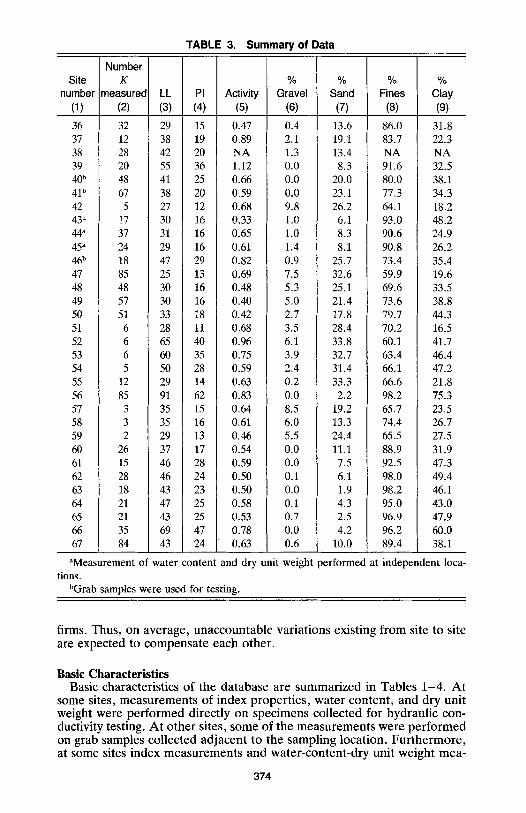
TABLE 3. Summary of Data
Number Site K % % % %
number measuredi LL PI Activity Gravel Sand Fines Clay (1) (2) (3) (4) (5) (6) (7) (8) (9)
36 32 29 15 0.47 0.4 13.6 86.0 31.8 37 12 38 19 0.89 2.1 19.1 83.7 22.3 38 28 42 20 NA 1.3 13.4 NA NA 39 20 55 36 1.12 0.0 8.3 91.6 32.5 40 b 48 41 25 0.66 0.0 20.0 80.0 38.1 41 b 67 38 20 0.59 0.0 23A 77.3 34.3 42 5 27 12 0.68 9.8 26.2 64.1 18.2 43 ~ 17 30 16 0.33 1,0 6.1 93,0 48.2 44 a 37 31 16 0.65 1.0 8.3 90.6 24.9 45 a 24 29 16 0.61 1.4 8.1 90.8 26.2 46 b 18 47 29 0.82 0.9 25.7 73.4 35.4 47 85 25 13 0.69 7.5 32.6 59.9 19.6 48 48 30 16 0.48 5.3 25.1 69.6 33.5 49 57 30 16 0.40 5.0 21.4 73.6 38.8 50 51 33 18 0.42 2.7 17.8 79.7 44.3 5t 6 28 11 0.68 3.5 28.4 70.2 16.5 52 6 65 40 0.96 6.1 33.8 60.1 41.7 53 6 60 35 0.75 3.9 32.7 63.4 46.4 54 5 50 28 0.59 2,4 31.4 66.1 47.2 55 12 29 14 0.63 0.2 33.3 66.6 21.8 56 85 91 62 0.83 0,0 2.2 98.2 75.3 57 3 35 15 0.64 8.5 19.2 65.7 23.5 58 3 35 16 0,61 6.0 13.3 74.4 26.7 59 2 29 13 0.46 5,5 24.4 65.5 27.5 60 26 37 17 0.54 0.0 11.1 88.9 31.9 61 15 46 28 0.59 0.0 7.5 92.5 47.3 62 28 46 24 O. 50 O. 1 6.1 98.0 49.4 63 18 43 23 0.50 0.0 1.9 98.2 46.1 64 21 47 25 0.58 0.1 4.3 95.0 43.0 65 21 43 25 0.53 0.7 2.5 96.9 47.9 66 35 69 47 0.78 0.0 4.2 96.2 60.0 67 84 43 24 0.63 0.6 10.0 89.4 38.1
aMeasurement of water content and dry unit weight performed at independent loca- tions.
bGrab samples were used for testing.
firms. Thus , o n ave rage , u n a c c o u n t a b l e v a r i a t i o n s ex is t ing f r o m si te to s i te are expec t ed to c o m p e n s a t e e a c h o t h e r .
Basic Characteristics Basic cha rac te r i s t i c s o f t he d a t a b a s e a re s u m m a r i z e d in T a b l e s 1 - 4 . A t
some sites, m e a s u r e m e n t s of i n d e x p r o p e r t i e s , w a t e r c o n t e n t , a n d d ry un i t weight we re p e r f o r m e d d i rec t ly o n s p e c i m e n s co l l ec t ed fo r h y d r a u l i c con- duct ivi ty tes t ing. A t o t h e r si tes, s o m e o f t he m e a s u r e m e n t s w e r e p e r f o r m e d on g rab samples co l l ec t ed a d j a c e n t to t h e s a m p l i n g loca t ion . F u r t h e r m o r e , at some si tes i ndex m e a s u r e m e n t s a n d w a t e r - c o n t e n t - d r y un i t w e i g h t m e a -
374
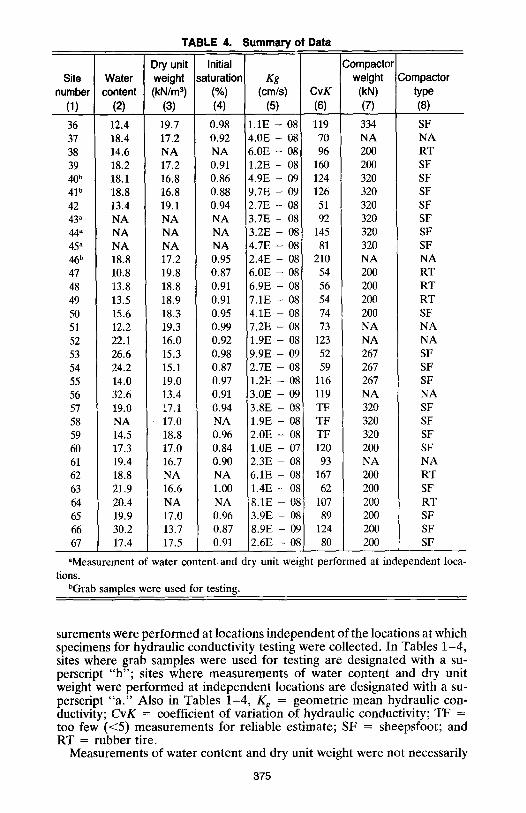
TABLE 4. Summary of Data
Dry unit Initial Compactor Site Wa te r weight saturation Kg weight Compactor
number content (kN/m ~) (%) (cm/s) CvK (kN) type (1) (2) (3) (4) (5) (6) (7) (8) 36 12.4 19.7 0.98 1.1E - 08 119 334 SF 37 18.4 17.2 0.92 4 .02 - 08 70 N A N A 38 14.6 NA N A 6.0E - 08 96 200 R T 39 18.2 17.2 0.91 1.2E - 08 160 200 SF 40 b 18.1 16.8 0.86 4.9E - 09 124 320 SF 41 b 18.8 16.8 0.88 9.7E - 09 126 320 SF 42 13.4 19.1 0.94 2.7E - 08 51 320 SF 43 a NA NA NA 3.7E - 08 92 320 SF 44 a NA N A NA 3.2E - 08 145 320 SF 45 a NA NA NA 4.7E - 08 81 320 SF 46 b 18.8 17.2 0.95 2.4E - 08 210 N A N A 47 10.8 19.8 0.87 6.0E - 08 54 200 R T 48 13.8 18.8 0.91 6.9E - 08 56 200 R T 49 13.5 18.9 0.91 7.1E - 08 54 200 R T 50 15.6 18.3 0.95 4.1E - 08 74 200 SF 51 12.2 19.3 0.99 7.2E - 08 73 NA N A 52 22.1 16.0 0.92 1.9E - 08 123 NA N A 53 26.6 15.3 0.98 9.9E - 09 52 267 SF 54 ] 24.2 15.1 0.87 2.7E - 08 59 267 SF 55 14.0 19.0 0.97 1.2E - 08 116 267 SF 56 32.6 13.4 0.91 3.0E - 09 119 N A N A 57 19.0 17.1 0.94 3.8E - 08 TF 320 SF 58 NA 17.0 N A 1.9E - 08 TF 320 SF 59 14.5 18.8 0.96 2.0E - 08 TF 320 SF 60 17.3 17.0 0.84 1.0E - 07 120 200 SF 61 19.4 16.7 0.90 2.3E - 08 93 N A N A 62 18.8 N A N A 6.1E - 08 167 200 R T 63 21.9 16.6 1.00 1.4E - 08 62 200 SF 64 20.4 N A N A 8 . IE - 08 107 200 R T 65 19.9 17.0 0.96 3.9E - 08 89 200 SF 66 30.2 13.7 0.87 8.9E - 09 124 200 SF 67 17.4 17.5 0.91 2.6E - 08 80 200 SF
aMeasurement of water con t en t and dry unit weight performed at independent loca- tions.
bGrab samples were used for testing.
s u r e m e n t s w e r e p e r f o r m e d a t l o c a t i o n s i n d e p e n d e n t o f t h e l o c a t i o n s a t w h i c h s p e c i m e n s f o r h y d r a u l i c c o n d u c t i v i t y t e s t i n g w e r e c o l l e c t e d . I n T a b l e s 1 - 4 , s i t e s w h e r e g r a b s a m p l e s w e r e u s e d f o r t e s t i n g a r e d e s i g n a t e d w i t h a su - p e r s c r i p t " b " ; s i t e s w h e r e m e a s u r e m e n t s o f w a t e r c o n t e n t a n d d r y u n i t w e i g h t w e r e p e r f o r m e d a t i n d e p e n d e n t l o c a t i o n s a r e d e s i g n a t e d w i t h a s u - p e r s c r i p t " a . " A l s o in T a b l e s 1 - 4 , K~ = g e o m e t r i c m e a n h y d r a u l i c c o n - d u c t i v i t y ; CvK = c o e f f i c i e n t o f v a r i a t i o n o f h y d r a u l i c c o n d u c t i v i t y ; T F = t o o f e w ( < 5 ) m e a s u r e m e n t s f o r r e l i a b l e e s t i m a t e ; S F = s h e e p s f o o t ; a n d R T = r u b b e r t i r e .
M e a s u r e m e n t s o f w a t e r c o n t e n t a n d d r y u n i t w e i g h t w e r e n o t n e c e s s a r i l y
375
performed directly on the specimens sampled for hydraulic conductivity testing. Because hydraulic conductivity is sensitive to molding water content and compactive effort (Fig. 1), the writers believed that including water contents or dry unit weights not directly measured on the specimens might be misleading. Thus, these measurements were not included in the database and are designated NA (not available). The measurements were used, how- ever, to ensure that scale-dependent hydraulic conductivities were not likely to exist (i.e., >85% of data falls wet of line of optimums). Missing mea- surements for index properties and particle size distribution are also des- ignated NA.
The final database contained a wide range of soils. For example, the plasticity index ranged from 2 to 62 with a mean of 45; the percentage fines (<No. 200 sieve) ranged from 44.3 to 100 with a mean of 81.9; and the percentage clay (<2 I~m) ranged from 13.9 to 75.3 with a mean of 40.5. Furthermore, the coefficient of variation for hydraulic conductivity varies substantially (27 to 277), which suggests that at some sites significant var- iability exists in the hydraulic conductivity measurements performed on individual specimens.
GRAPHICAL ANALYSIS
Graphs were constructed to determine which variables in the database were significantly correlated to hydraulic conductivity. For each site, the geometric mean hydraulic conductivity (Kg) and the arithmetic mean of each variable was computed. The geometric mean was used because results obtained with models of three-dimensional stochastic flow have shown that the geometric mean is a good approximation of the equivalent hydraulic conductivity of multilift compacted soil liners having heterogeneities in hy- draulic conductivity (Bogardi et al. 1990; Donald 1990; Benson et al. 1992). That is, the geometric mean of the hydraulic conductivity measurements is representative of the "overall" or "average" hydraulic conductivity of a compacted soil liner even though individual point measurements of hydraulic conductivity may vary by an order of magnitude or more.
Graphs of hydraulic conductivity versus the different variables were ex- amined for increasing or decreasing trends. The trends were tested for significance using linear regression and the F-statistic (Draper and Smith 1981). The F-statistic is the ratio
MSr F = s2 . . . . . . . . . . . . . . . . . . . . . . . . . . . . . . . . . . . . . . . . . . . . . . . . . . . (1)
where MSr = mean square due to regression; and s 2 = residual variance. The mean square due to regression is the component of the total variance that can be explained by the linear trend. Hence, trends with greater sig- nificance have a higher F.
The F statistic can be used to test the significance of the slope of the regression line and hence the statistical significance of trends. To test if the slope (or trend) is significant, the computed F is compared to tabulated values of F (called the critical F, For) for a given significance level (et). If the computed F exceeds For, then the probability of erroneously assuming the slope is significant is less than a and the slope (or trend) is deemed significant at the a significance level. For 'all analyses, a was specified as 0.05.
The significance level at failure (Otfail) is also useful in evaluating the trend
376

because it is the probability that the slope is erroneously deemed significant. It is determined by finding the value of e~ at which the computed F equals F~. As eq, i] becomes smaller, the significance of a trend increases.
Atterberg Limits Fig. 2 shows hydraulic conductivity as a function of liquid limit (LL) and
plasticity index (PI). The lines drawn in Fig. 2 were selected by eye to represent the trend and to provide upper and lower bounds that encompass most of the data. To test the significance of the trend, logK (base 10 log- arithm) was regressed linearly on LL and PI and a test of significance was conducted using the F statistic. The F-tests confirmed that the trends of logK with LL and PI are significant and have very low values for ~f~ (LL: F = 22.6; F~, = 3.99; eq,~ = 0.0000; PI: F = 33.4; F~ = 3.99, Otfail =
0.0000). The trends are consistent with the results of studies on sedimented clays;
i.e., on average, hydraulic conductivity decreases as the LL and PI increase. In particular, the hydraulic conductivity decreases quickly as the PI increases from 10 to 30, but then decreases more slowly as the PI is increased further.
Practical conclusions can also be drawn from the data. To estimate min- imum values for LL and PI that are needed to achieve hydraulic conduc- tivities -<1 x 10 -7 cm/s, the lower bound can be used; it represents the lowest hydraulic conductivity that is ordinarily achieved for a given LL or PI. Based on the lower bounds shown in Fig. 2, a geometric mean hydraulic conductivity -<1 x 10 .7 cm/s can be achieved if the LL -> 20 and the PI -> 7. The data also show, however, that the hydraulic conductivity will not necessarily be -<1 x 10 .7 cm/s if these criteria are met.
Particle Size Distribution Graphs of hydraulic conductivity versus percent gravel, sand, fines, and
clay are shown in Fig. 3. Definitions for gravel, sand, and fines were based on the USCS (Holtz and Kovacs 1981). Clay content was defined as the percentage of particles smaller than 2 p.m. The graphs show slight trends of increasing hydraulic conductivity with increasing percentage of gravel and sand and stronger trends of decreasing hydraulic conductivity with increasing percentage of fines and clay. Bounds encompassing most of the data have been drawn by eye to delineate the trends.
10 ~ 10-s
'o 10. 7
._o '-5 10 "s
?., I
10 -9
[] (a)
- Ioo .o,; -, 13 O 1 3
\ o
E10-7 >, 'N ~3 8
1 0 .8
"1"
FIG. 2.
109
(b) o
t . ~ ~ 6 \ 0 o
, p o \ oeO o 8, ~
~176 ~ o o ' ~ o ~
10 20 30 40 50 60 70 80 90 100 10 20 30 40 50 60 70
Liquid Limit Plasticity index
Hydraulic Conductivity versus: (a) Liquid Limit; and (b) Plasticity Index
377
10"6
10.7
.>
~- 10 "a
10-9
10 -s
El0 7
10-~
-r"
. I - ' - - " ' o
J i []C]O O~ []
,[]//4 /~
(a)
5 10 15 20 25
Percentage Gravel
A ~
".<.
(c) " ' "~
10-6
--~ 10.7
8 ~ "10" ~
lO-g 0
o
o o o DDOOD ~ 0 I~
0 0 O I~0
o o ~0oo o o 0 ~ o o ~ o
[] o~[] o ~
(b)
5 10 15 20 25 30 35 40 45 50
Percentage Sand
10 -~
~" 10.7
Clay Size S 2tun A
(d) 10 -g 10-g
30 40 50 60 70 80 90 100 10 20 30 40 50 60 70 80 90
Percentage Fines Percentage Clay
FIG. 3. Hydraulic Conductivity versus: (a) Percentage Gravel; (b) Percentage Sand; (c) Percentage Fines; and (d) Percentage Clay
Although the graphs show significant scatter, F-tests confirmed that all trends were significant at the 0.05 level (gravel: F = 14.1; For = 3.99; o/flai l = 0.0004; sand: F = 9.2; For = 4.0; 0~fai~ = 0.0036; Fines: F = 18.9; Fc, = 3.99, afail = 0.0001; clay: F = 19.8; For = 3.99; ~faiI = 0 . 0 0 0 0 ) . Never- theless, the trends evident in the graphs and the values of F and afai~ suggest that hydraulic conductivity is more sensitive to percentage of fines and percentage of clay than to percentage of sand or percentage of gravel. Furthermore, visual comparison of the graphs suggests that percentage of clay has the strongest correlation with hydraulic conductivity. However, soils in the database had sand contents -<39.4% and gravel contents ---22.2%. For soils with a greater percentage of coarse-size particles, stronger trends may exist between hydraulic conductivity and percentage of gravel or sand.
The bounds drawn by eye shown in Figs. 3(c and d) can be used to estimate minimum percentages of fines and clay that are needed to achieve hydraulic conductivity -<1 • 10 -7 cm/s. The lower bounds shown in Figs. 3(c and d) suggest that a geometric mean hydraulic conductivity -<1 • 10 -v cm/s can be achieved if the percentage fines ->30% and the percentage of clay -> 15%.
3 7 8

Activity Activity [PI/clay content; Skempton (1953)] is an index of the surface
activity of the clay fraction. Soils containing a greater quantity of highly swelling minerals generally have a larger PI for a given percentage of clay and thus have larger activity. Because clay minerals with greater activity are likely to consist of smaller particles having larger specific surface and thicker double layers, hydraulic conductivity should decrease with increasing activity.
Fig. 4 graphs hydraulic conductivity versus activity, which shows a trend of decreasing hydraulic conductivity with increasing activity. The bounds drawn by eye delineate this trend and the F-test confirms the trend is sig- nificant at the 0.05 level (F = 15.3; For = 3.99; O/flai 1 = 0.0002). Fig. 4 also shows that a geometric mean hydraulic conductivity -<1 • 10 - 7 cm/s was achieved in one case for an activity as low as 0.14. However, based on the lower bound, a minimum activity of 0.3 appears to be a better lower limit if a geometric mean hydraulic conductivity -<1 x 10 -7 cm/s is to be achieved.
COMPACTION VARIABLES
Water Content and Dry Unit Weight A direct comparison between measurements of water content or dry unit
weight at different sites is difficult to make because of shifts in optimum water content and maximum dry unit weight that occur as a result of changes in compositional characteristics. For example, as the plasticity index in- creases, optimum water content increases and the maximum dry unit weight decreases (Johnson et al. 1990). Thus, water contents wet of optimum water content for a soil with low plasticity index may be lower than water contents dry of optimum water content for a soil with higher plasticity index. Simi- larly, if low and high plasticity clays are compacted with the same compactive
10 "6 . . . . . .
O d~
E O
v
_z- ._>
"13 r
O
o r
"-1
"13
"1-
10 .7
10 .8
O
o ~ \ o O oO~ o
0 0 0 008 Oo o
OoOo
1 0 - 9 . . . . , i , i i
0.0 0.2 0.4 0.6 0.8 0.1
Activity
FIG. 4. Hydraul ic Conduct iv i ty versus Act iv i ty
1.2
379
effort and at similar water content relative to their respective optimum water contents, the dry unit weight of the low plasticity clay will be larger than the dry unit weight of high plasticity clay. Consequently, site-to-site com- parisons between water contents or dry unit weights can be misleading.
Site-to-site comparisons between water contents are further confounded by differences in compactive effort. When compactive effort is varied, op- timum water content and maximum dry unit weight shift (Fig. 1). For a given water content, compaction may occur dry of optimum (low compactive effort) or wet of optimum (high compactive effort) depending on the com- pactive effort used during construction. Consequently, very different hy- draulic conductivities can be realized for the same water content (Fig. 1). Thus, a fair comparison between water contents can be made only if the compactive effort (and the soil composition) is the same. Unfortunately, compactive effort is difficult to quantify in the field and varies from site to site (e.g., different compactor weights or number of passes are used).
One way to avoid these confounding effects is to use "initial" (as-com- pacted) saturation (Si) as a combined measure of molding water content and dry unit weight; i.e.
wc S i - - - . . . . . . . . . . . . . . . . . . . . . . . . . . . . . . . . . . . . . . . . . . . . . . (2)
~w 1 ~dc Gs
where wc = molding water content; ~/dc = dry unit weight during construc- tion; ~tw = unit weight of water; and Gs = specific gravity of solids. The writers note that S~ represents the degree of saturation at compaction; it should not be confused with the degree of saturation during permeation.
Initial saturation is useful for site-to-site comparisons because contours of initial saturation generally are parallel to the line of optimums (Fig. 1). Thus, initial saturation can be used as a measure of the location of com- binations of water content and dry unit weight relative to optimum water content regardless of compactive effort. Also, initial saturation is not nearly as sensitive to soil composition as water content or dry unit weight (Benson and Boutwell 1992).
Compaction conditions in the database and their effect on hydraulic con- ductivity can be examined using initial saturation because hydraulic con- ductivity generally decreases as the water content is increased beyond the line of optimums, regardless of compactive effort. As the water content is raised, initial saturation also increases. This effect is illustrated in Fig. 1; a decrease in hydraulic conductivity of approximately one order of magnitude occurs as S i is increased from 90% ( - l ine of optimums) to 95% (3-4% wet of optimum), for each compactive effort. However, increases in initial sat- uration do not necessarily result in decreases in hydraulic conductivity. For example, if the water content is increased far above optimum, the hydraulic conductivity may increase, yet the initial saturation may remain essentially the same. Also, specimens compacted to the same initial saturation but with different compactive effort will have different fabrics and different hydraulic conductivities. Thus, initial saturation is not a unique measure of soil fabric. Nevertheless, when the average trend of the database is analyzed, these effects are expected to be less significant than the general trend of decreasing hydraulic conductivity with increasing initial saturation.
Tables 1-4 show initial saturations for sites where water content and dry unit weight measurements were measured on the specimens used for hy- draulic conductivity testing. Because values for Gs were rarely available, G~
380

= 2.7 was used for all computations. In one case, this resulted in S i > 1.0, which is physically impossible for an average value of initial saturation. The writers believe, however, that using a single Gs was a consistent way to analyze the data without introducing artificial bias by variable and artificially selected values for G,.
Fig. 5 is a graph of hydraulic conductivity versus initial saturation; it shows a trend of decreasing hydraulic conductivity with increasing initial saturation. The data also exhibit significant variability (Fig. 5); for a given initial saturation, the hydraulic conductivity can vary by an order of mag- nitude or more. Variability is expected because soils of various composition comprise the database and initial saturation is not uniquely related to soil fabric or hydraulic conductivity. Nevertheless, the trend (Fig. 5) suggests that focusing on compaction conditions that result in higher initial saturation (i.e., increasing compactive effort and molding water content) will, on av- erage, tend to reduce hydraulic conductivity. The writers caution, however, that higher initial saturation should be obtained without decreasing com- pactive effort (i.e., compactor weight and number of passes). Decreases in compactive effort concurrent with increases in initial saturation may offset any benefits obtained by increasing initial saturation.
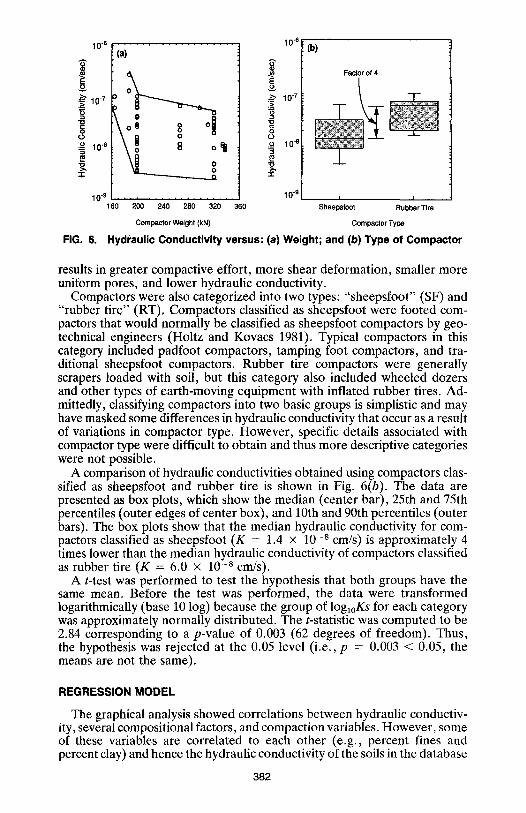
Weight and Type of Compactor The weight and type of compactor used at each site was extracted from
construction documentation reports or by interviewing persons involved in construction. In most cases, the weight of the compactor could be estimated based on the model type or on descriptions. Furthermore, in most cases, several compactors were used concurrently. In these cases, an average weight was used to describe the weight of the compactor.
Fig. 6(a) shows the relationship between hydraulic conductivity and weight of compactor. As expected, a wide range of hydraulic conductivities is realized for a given weight of compactor because numerous other factors (Atterberg limits, particle size distribution, water content, compactor type, etc.) affect hydraulic conductivity. Nevertheless, a trend of decreasing hy- draulic conductivity with increasing weight of compactor is evident. This trend is expected, because increasing the weight of the compactor generally
0
.-,t
" 0 C: 0
o 0
" 0
.1-
10 -6
10 .7
�9 . , , , . , .
O
o o oo 8 o ~ " \ o o
oo~ o o o oO~__ 0 oO0
10.8 o ~ o ~ o @ Oo~ ~ 1 7 6 X O 0
. Ooo0 o
10-9 . . . . . . . . . . . 0.75 0.80 0.85 0.90 0.95 1.00 1.05
Initial Saturation
FIG. 5. Hydraulic Conductivity versus Initial Saturation
381
rD o
s :Z
FIG. 6,
IO-B
10 .7
10 "s
10 e 16o
r iai . . . . . . . . . . . . .
\oe o o ol
200 240 280 320 360
>
O ._o
10 -6
! 0 -7
10 -a
10 .9
(b)
Factor of 4
i i Sheepsfoot Rubber Tire
Compactor Weight (kN) Compactor Type
Hydraulic Conductivity versus: (a) Weight; and (b) Type of Compactor
results in greater compactive effort, more shear deformation, smaller more uniform pores, and lower hydraulic conductivity.
Compactors were also categorized into two types: "sheepsfoot" (SF) and "rubber tire" (RT), Compactors classified as sheepsfoot were footed com- pactors that would normally be classified as sheepsfoot compactors by geo- technical engineers (Holtz and Kovacs 1981). Typical compactors in this category included padfoot compactors, tamping foot compactors, and tra- ditional sheepsfoot compactors. Rubber tire compactors were generally scrapers loaded with soil, but this category also included wheeled dozers and other types of earth-moving equipment with inflated rubber tires. Ad- mittedly, classifying compactors into two basic groups is simplistic and may have masked some differences in hydraulic conductivity that occur as a result of variations in compactor type. However, specific details associated with compactor type were difficult to obtain and thus more descriptive categories were not possible.
A comparison of hydraulic conductivities obtained using compactors clas- sified as sheepsfoot and rubber tire is shown in Fig. 6(b). The data are presented as box plots, which show the median (center bar), 25th and 75th percentiles (outer edges of center box), and 10th and 90th percentiles (outer bars). The box plots show that the median hydraulic conductivity for com- pactors classified as sheepsfoot (K = 1.4 x 10 -8 cm/s) is approximately 4 times lower than the median hydraulic conductivity of compactors classified as rubber tire (K = 6.0 • 10 -8 cm/s).
A t-test was performed to test the hypothesis that both groups have the same mean. Before the test was performed, the data were transformed logarithmically (base 10 log) because the group of lOgl0KS for each category was approximately normally distributed. The t-statistic was computed to be 2.84 corresponding to a p-value of 0.003 (62 degrees of freedom). Thus, the hypothesis was rejected at the 0.05 level (i.e., p = 0.003 < 0.05, the means are not the same).
REGRESSION MODEL
The graphical analysis showed correlations between hydraulic conductiv- ity, several compositional factors, and compaction variables. However, some of these variables are correlated to each other (e.g., percent fines and percent clay) and hence the hydraulic conductivity of the soils in the database
382

may be described using only a select subgroup of these variables. This subgroup was identified by multivariate regression. The regression model was developed for estimating hydraulic conductivities that can be obtained for different soil types and compaction conditions.
Stepwise Regression Stepwise linear regression was used to select the variables to be included
in the model and their coefficients. The model takes the form
lnKg = ao + a lX1 + a2X2 + �9 . . + a iXi + . . �9 + a , X , + e . . . . . . (3)
whet;e the ai = coefficients; Xi = independent variables; and e = a mean- zero Gaussian random error term.
In stepwise regression, a decision is made to add or delete an independent variable based on its correlation with the dependent variable and a statistic called the "partial-F." Variables are added to the model in accord with their correlation to In Kg; i.e., variables with greatest correlation to In Kg are added first whereas those with poorer correlation are added later. Two correlated independent variables will be included only if both variables independently provide significant information to explain variability of In Kg. Thus, using stepwise regression minimizes the effects of masking and overemphasis.
After a new variable is added to the model, its significance is checked with the partial-F statistic. The partial-F is a measure of the variance ex- plained by an additional variable relative to the residual error remaining in the data; it is similar to the F-statistic used to analyze trends [(1)]. If the partiaI-F is large enough, the variable is added to the equation. For the model described herein, the partial-F was required to exceed 4 for a variable to be incorporated in the model. A minimum partial-F of 4 corresponds to a significance level of 0.05, which is a consistent with the significance level used to analyze trends. Greater details regarding stepwise regression can be found in Draper and Smith (1981).
The model developed by stepwise regression is
894 In Kg = -18.35 + ~ - 0.08PI -2.87Si + 0.32~/-G + 0.02C + e . . . (4)
where Kg is in centimeters per second; W = compactor weight in kilonew- tons; G = percent gravel; C = percent clay; and S~ = initial saturation (decimal form, Gs = 2.7). Partial-Fs for the variables were compactor weight (F = 59.7), PI (F = 50.1), percentage gravel (F = 13.8), initial saturation (F = 5.1), and percentage clay (F = 4.9). Other functional forms for these variables could have been used (e.g., S~, log PI, etc.) as has been done by others (Wang and Huang 1984; Boutwell and Hedges 1989), but the writers found that these forms provided no improvement in fit. The model has an R 2 of 0.78, meaning that 78% of the variance in hydraulic conductivity is explained by the model. The error term (e) has a variance (~r~) of 0.25. Fit of the model was checked by comparing predicted and measured In Kg and by examining the residuals for normality and for correlation with predicted In Kg. Details of the validation procedure can be found in Benson et al. (1992).
Comment on Model Eq. (4) is a functional relationship between In Kg and five variables that
describe composition and compaction conditions for soils compiled in the
383
database. Other variables appearing significant in the graphical exploration could have been added to the regression, but they did not provide any additional information with statistical significance. Correlations and other functional relationships also exist among the "independent" variables used in the regression analysis. Hence, the linear model should be interpreted as a linear approximation.
Eq. (4) suggests that increasing compactor weight, PI, or initial saturation will result in lower geometric mean hydraulic conductivity. It also shows that increasing the quantity of gravel results in an increase in the geometric mean hydraulic conductivity. Similar trends were observed in the graphical analysis. The model also suggests that increasing clay content corresponds to higher hydraulic conductivity, a result directly opposite the trend shown in Fig. 3(d). An increase in hydraulic conductivity with increasing clay content occurs, however, only if all other variables are held constant. Hence, if PI is held constant and the clay content is increased, then the activity is decreasing. Increasing hydraulic conductivity with decreasing activity is con- sistent with the relationship between hydraulic conductivity and activity in the database (Fig. 4).
Practical Applications Eq. (4) can be used to make inferences from the database. For example,
if the properties of a candidate borrow soil are known and compaction conditions (initial saturation and compactor weight) are specified, then an estimate can be made of the hydraulic conductivity that can be achieved provided the liner is properly compacted (e.g., >85% of water content- dry unit weight measurements falling wet of the line of optimums, sufficient number of compactor passes, etc.). The probability of excessive hydraulic conductivity can also be computed using the normal distribution with mean = In Kg and variance = ~r~.
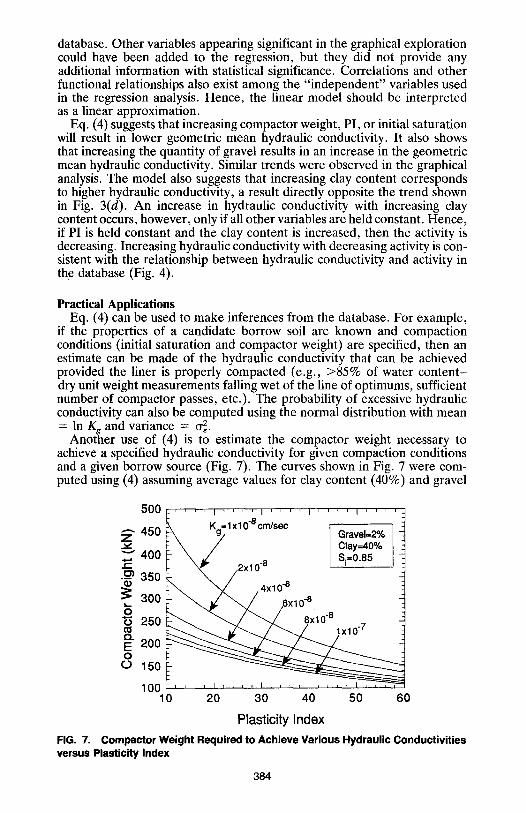
Another use of (4) is to estimate the compactor weight necessary to achieve a specified hydraulic conductivity for given compaction conditions and a given borrow source (Fig. 7). The curves shown in Fig. 7 were com- puted using (4) assuming average values for clay content (40%) and gravel
500 . . . . . . . . I . . . . = . . . . = . . . . ~- 450 lx10-8 cm/sec Gravel=2%
Clay=40% 400 ~ Si=O.85
2x 10 "s ._o~ 350 ~ _ _ . ~ / 0 4x 10 -8
300 . 6xl 0 "8
~. lx10 "7 E ~ 2oo
~ 150
100 10 20 30 40 50 60
Plasticity Index FIG. 7. Compactor Weight Required to Achieve Various Hydraulic Conductivities versus Plasticity Index
384
content (2%) and specifying Si = 0.85. If the plasticity index of the borrow soil is known, then the compactor weight necessary to achieve hydraulic conductivity below a specified threshold can be estimated. However, rea- sonable estimates can be obtained with (4) only if conditions existing during construction are consistent with the conditions at sites included in the da- tabase. That is, construction specifications must be stipulated that: (1) Re- quire compaction wet of the line of optimums; (2) ensure a sufficient number of compactor passes are applied to ensure complete remolding of the clay; and (3) address other factors necessary to ensure proper compaction (e.g., lift thickness, hydration time, documentation and testing, etc.). Further- more, the writers note that hydraulic conductivities computed using (4) are only estimates for use in preconstruction planning or for rapid construction quality control assessments; testing is necessary to ensure sufficiently low hydraulic conductivity is achieved.
CONCLUSION
In this paper, a database is described that contains laboratory-measured hydraulic conductivities and associated index measurements collected during construction of compacted soil liners. Screening was conducted to eliminate sites where scale-dependent hydraulic conductivities were known or likely to exist. Only liners compacted wet of the line of optimums were included. Thus, the following conclusions are relevant only for well-compacted soil liners constructed with naturally formed clays (i.e., liners constructed with soil-bentonite mixtures, mine tailings, etc. were excluded) such as those represented in the database. Soil liners with construction defects or liners constructed with soils not represented in the database may have much dif- ferent hydraulic conductivity at field-scale than would be expected based on the data presented in this paper.
The graphical and regression analyses showed that the geometric mean hydraulic conductivity is correlated to the Atterberg limits, the percentage of fines and clay, and activity. The analyses suggest that the index properties shown in Table 5 are likely to be necessary if a geometric mean hydraulic conductivity -<1 x 10 -7 cm/s is to be achieved. These properties are often correlated. Thus, soils satisfying one criterion may also satisfy the other criteria. The writers also note that, for a given site, significant variability in the individual measurements of hydraulic conductivity may exist, which reflects the significance of the multitude of factors affecting the hydraulic conductivity of compacted clay.
Hydraulic conductivity was also correlated to compaction conditions and methods. On average, lower hydraulic conductivity occurred at higher initial
TABLE 5. Soil Properties to Achieve Geometric Mean Hydraulic Conductivity -<1 x 10 -7 cm/s
Minimum for Property Kg -< 1 x 10 ~ cm/s
(1) (2)
Liquid limit 20 Plasticity index 7 % Fines 30 % Clay 15 Activity 0.3
385
(as-compacted) saturation. Thus, focusing on conditions that result in higher initial saturation without sacrificing compactive effort will often result in lower hydraulic conductivity. Lower hydraulic conductivity was also asso- ciated with heavier compactors and compactors classified as sheepsfoot than those classified as rubber tire.
A multivariate regression model was developed to identify variables most important in predicting hydraulic conductivity. Five variables were identified that are often controlled or measured during construction of compacted soil liners: compactor weight, plasticity index, initial saturation, percent gravel, and percent clay. The regression model can be used to estimate conditions to achieve a desired geometric mean hydraulic conductivity. The writers caution, however, that the regression model should not be used as a sub- stitute for hydraulic conductivity assessment in the field and laboratory.
ACKNOWLEDGMENT
Financial support for the research described in this paper has been pro- vided by a grant from Waste Management, Inc. (WMI). The opinions ex- pressed in this paper are those solely of the writers and do not necessarily reflect the policies or opinions of WMI.
APPENDIX. REFERENCES
Acar, Y., and Oliveri, I. (1989). "Pore fluid effects on the fabric and hydraulic conductivity of laboratory-compacted clay." Transp. Res. Record 1219, Transpor- tation Research Board, Washington, D.C., 144-159.
Barden, L., and Sides, G. (1970). "Engineering behavior and structure of compacted clay." J. Soil Mech. and Found. Div., ASCE, 96(4), 1171-1200.
Benson, C., and Daniel, D. (1990). "Influence of clods on hydraulic conductivity of compacted clay." J. Geotech. Engrg., ASCE, 116(8), 1231-1248.
Benson, C., Zhai, H., and Rashad, S. (1992). "Assessment of construction quality control measurements and sampling frequencies for compacted soil liners." Envir. Geotechnics Rep. No. 92-6, Dept. of Civ. and Envir. Engrg., University of Wis- consin-Madison, Madison, Wisc.
Benson, C., and Boutwell, G. (1992). "Compaction control and scale-dependent hydraulic conductivity of clay liners." Proc., 15th Annu. Madison Waste Conf., Madison, Wisc., 62-83.
Bjerrum, L., and Huder, J. (1957). "Measurement of the permeability of compacted clays." Proc., 4th Int. Conf. on Soil Mech. and Found. Engrg., Butterworths Scientific Publications, London, England, Vol. 1, 6-8.
Bogardi, I., Kelly, W., and Bardossy, A. (1990). "Reliability model for soil liner: postconstruction." J. Geotech. Engrg., ASCE, 116(10), 1502-1520.
Boutwell, G., and Hedges, C. (1989). "Evaluation of waste-retention liners by muI- tivariate statistics." Proc., 12th Int. Conf. on Soil Mech. and Found. Engrg., A. A. Balkema, Rotterdam, The Netherlands, 815-818,
Carpenter, G., and Stephenson, R. (1986). "Permeability testing in the triaxial cell." Geotech. Testing J., 9(1), 3-9.
Daniel, D., Anderson, D., and Boynton, S. (1985). "Fixed-wall versus flexible-wall permeameters." Hydraulic barriers in soil and rock; ASTM STP 874, A. Johnson, R. Frobel, N. Cavilli, and C. Petterson, Eds., ASTM, Philadelphia, Pa., 107-126.
Daniel, D. (1987). "Earthen liners for land disposal facilities." Geotechnicalpractice for waste disposal '87; GSP No. 13, ASCE, New York, N.Y., 21-39.
Daniel, D. (1990). "Summary review of construction quality control for earthen liners." Waste containment systems: construction, regulation, and performance; GSP No. 26, R. Bonaparte, ed., ASCE, New York, N.Y., 175-189.
D'Appolonia, D. (1980). "Soil-bentonite slurry trench cutoffs." J. Geotech. Engrg. Div., ASCE, 106(4), 399-417.
386
Donald, S. (1990). "Stochastic analysis of compacted clay landfill liners," MASC thesis, University of Waterloo, Waterloo, Ontario, Canada.
Draper, N., and Smith, H. (1981). Applied regression analysis. John Wiley and Sons, Inc., New York, N.Y.
Garcia-Bengochea, I., Lovell, C., and Altschaeffl, A. (1979). "Pore distribution and permeability of silty clays." J. Geotech. Engrg. Div., ASCE, 105(7), 839-856.
Gordon, M., Huebner, P., and Kmet, P. (1984). "An evaluation of the performance of four clay-lined landfills in Wisconsin." Proc., 7th Annu. Madison Waste Conf., University of Wisconsin-Madison, Madison, Wisconsin, 399-460.
Holtz, R., and Kovacs, W. (1981). An introduction to geotechnical engineering. Prentice-Hall, Inc., Englewood Cliffs, N.J.
Johnson, G., Crumbley, W., and Boutwell, G. (1990). "Field verification of clay liner hydraulic conductivity." Waste containment systems: construction, regulation, and performance; GSP No. 26; R. Bonaparte, ed., ASCE, New York, N.Y., 226- 245.
Kenney, T., van Veen, M., Swallow, M., and Sungaila, M. (1992). "Hydraulic conductivity of compacted bentonite-sand mixtures." Can. Geotech. J., 29(3), 364- 374.
Lambe, T. (1954). "The permeability of compacted fine-grained soils." Spec. Tech. Publ. No. 163, American Society of Testing and Materials (ASTM), Philadelphia, Pa., 56-67.
Mesri, G., and Olson, R. (1971), "Mechanisms controlling the permeability of clays." Clays and Clay Minerals, Vol. 19, 151-158.
Mitchell, J. (1976). Fundamentals of soil behavior. John Wiley and Sons, New York, N.Y.
Mitchell, J., Hooper, D., and Campanella, R. (1965). "Permeability of compacted clay." J. Soil Mech. and Found. Div., ASCE, 91(4), 41-65.
Olsen, H. (1962)~ "Hydraulic flow through saturated clays." Clay and Clay Minerals, Vol. 11,131-161.
Olson, R., and Daniel, D. (1981). "Measurement of the hydraulic conductivity of fine-grained soils." Permeability and Groundwater Containment Transport: ASTM STP 746, T. Zimmie and C. Riggs, eds., American Society for Testing and Ma- terials (ASTM), Philadelphia, Pa., 18-64.
Ryan, C. (1987). "Vertical barriers in soil for pollution containment." Geotechnical practice for waste disposal '87; GSP No. 13, ASCE, New York, N.Y., 182-204.
Seed, H., Woodward, R., and Lundgren, R. (1964). "Clay mineralogical aspects of the Atterberg limits." J. Soil Mech. and Found. Div., ASCE, 90(4), 107-131.
Shakoor, A., and Cook, B. (1990). "The effect of stone content, size, and shape on the engineering properties of a compacted silty clay." Bull. of Assoc. of Engrg. Geologists, XXVII (2), 245-253.
Shelley, T., and Daniel, D. (1993). "Effect of gravel on hydraulic conductivity of compacted soil liners." J. Geotech. Engrg., ASCE, 119(1), 54-68.
Skempton, A. (1953). "The colloidal activity of clay." Proc., 3rd Int. Conf. on Soil Mech. and Found. Engrg., Butterworths Scientific Publication, London, England, Vol. 1, 57-61.
Terzaghi, K. (1925). "Simplified soil tests for subgrades and their physical signifi- cance." Public Roads, (Oct.), 31-35.
Wang, M., and Huang, C. (1984). "Soil compaction and permeability prediction models." J. Envir. Engrg., ASCE, 110(6), 1063-1083.
387


![On yield stress of compacted clays - Springer · 2018-12-12 · ries require high plastic clays to be compacted for the formation of earth fill barri-[4 , 5].According to clay barriers](https://static.fdocuments.net/doc/165x107/5fa09869c21d5e76532f8c14/on-yield-stress-of-compacted-clays-springer-2018-12-12-ries-require-high-plastic.jpg)


![[27] (41030748) Influence of Salt Solutions on the Swelling Pressure and Hydraulic Conductivity of Compacted GMZ01 Bentonite](https://static.fdocuments.net/doc/165x107/55cf868d550346484b98c0a7/27-41030748-influence-of-salt-solutions-on-the-swelling-pressure-and-hydraulic.jpg)


