Estimating flushing time in Citarum River Estuary ... · the average monthly water discharge of...
8
AES Bioflux, 2018, Volume 10, Issue 3. http://www.aes.bioflux.com.ro 209 Estimating flushing time in Citarum River Estuary, Indonesia by using empirical and numerical methods 1 Susanna Nurdjaman, 1 Muhammad N. Burhanuddin, 2 Tetsuo Yanagi, 1 Ivonne M. Radjawane, 1 Totok Suprijo 1 Oceanography Department, Faculty of Earth Sciences and Technology, Institut Teknologi Bandung, Ganesha 10 Bandung, West Java, Indonesia; 2 International Center for Environmental Management Wof Enclosed Coastal Seas DRI East 5F 5-2 Wakinohama- kainandori 1-chome Chuo-ku Kobe 6510073, Japan. Corresponding author: S. Nurdjaman, [email protected] Abstract. This study aims to estimate the value of flushing time in Citarum Estuary, West Java, Indonesia. Calculation of the value of flushing time on this research uses empirical and numerical methods. Flushing time value is influenced by physical parameter values that exist in the estuary, such as tides, salinity, river discharge, and topography of Citarum River Estuary. The data is sourced from the observation conducted by Oceanography Department, Bandung Institute of Technology in March and September, 2013. The flushing time value during the wet season is shorter than the value of the flushing time during the dry season, it is influenced by discharge of river water that occurs in two seasons. Flushing time in the wet season using empirical method is 2.20 hours while that using numerical method is 4.75 hours. In the dry season the result of calculation using empirical method is 8.25 hours whereas that using numerical method is 17.75 hours. Key Words: Citarum Estuary, flushing time, wet season, dry season, empirical method, numerical method. Introduction. The Citarum River is the longest river in West Java, which extends for 269 kilometers. Upstream of the river is located in Wayang Mountain of South Bandung and the downstream into the north of the island of Java in Bekasi. The Citarum River Estuary has a length of about 10 kilometers where the estuary is still influenced by the physical properties of the ocean such as tide and ocean salinity. Citarum River Estuary has the mouth which is located in Muara Bendera, with width of hundreds of meters (Siregar 2013). Many problems occur in Citarum area such as sedimentation (Poerbandono et al 2006), water pollution, salt intrusion (Atmosudirdjo 2014), degradation of catchment area and flooding (Siregar 2018). Estuaries are defined as semi-enclosed waters that have a direct relationship with the sea, where fresh water from rivers and the sea salt water meet. Estuary is a part of the river system which is experiencing the direct impact of the physical properties of the sea such as tides, currents, waves, salinity, and others (Nguyen 2008; Bianchi 2013). One of the physical parameters in the estuary is the flushing time or so-called the time necessary to drain the fresh water in the estuary. In general the flushing time can be defined as the length of time needed to replace the existing fresh water in an estuary at a rate equal to the discharge of the river (Hadi & Mihardja 1987). One of the tools of estuary management is flushing time concept (Tomczak 1998). The benefits of flushing time are to know how long will it take for the estuary to exchange with open ocean water or how much do we have to reduce pollutants in order to protect the marine environment in coastal sea (Yanagi 1999). Flushing time concept was applied for some cases at some estuaries, bays and other waters (Choi & Lee 2004; Sachoemar et al 2009; Andutta et al 2013). Furthermore, in determining the value of a flusing time, there are two methods,
Transcript of Estimating flushing time in Citarum River Estuary ... · the average monthly water discharge of...
AES Bioflux, 2018, Volume 10, Issue 3. http://www.aes.bioflux.com.ro
209
Estimating flushing time in Citarum River Estuary, Indonesia by using empirical and numerical methods 1Susanna Nurdjaman, 1Muhammad N. Burhanuddin, 2Tetsuo Yanagi, 1Ivonne M. Radjawane, 1Totok Suprijo
1 Oceanography Department, Faculty of Earth Sciences and Technology, Institut Teknologi
Bandung, Ganesha 10 Bandung, West Java, Indonesia; 2 International Center for Environmental Management Wof Enclosed Coastal Seas DRI East 5F 5-2 Wakinohama-
kainandori 1-chome Chuo-ku Kobe 6510073, Japan. Corresponding author: S. Nurdjaman, [email protected]
Abstract. This study aims to estimate the value of flushing time in Citarum Estuary, West Java, Indonesia. Calculation of the value of flushing time on this research uses empirical and numerical methods. Flushing time value is influenced by physical parameter values that exist in the estuary, such as tides, salinity, river discharge, and topography of Citarum River Estuary. The data is sourced from the observation conducted by Oceanography Department, Bandung Institute of Technology in March and September, 2013. The flushing time value during the wet season is shorter than the value of the flushing time during the dry season, it is influenced by discharge of river water that occurs in two seasons. Flushing time in the wet season using empirical method is 2.20 hours while that using numerical method is 4.75 hours. In the dry season the result of calculation using empirical method is 8.25 hours whereas that using numerical method is 17.75 hours. Key Words: Citarum Estuary, flushing time, wet season, dry season, empirical method, numerical method.
Introduction. The Citarum River is the longest river in West Java, which extends for 269 kilometers. Upstream of the river is located in Wayang Mountain of South Bandung and the downstream into the north of the island of Java in Bekasi. The Citarum River Estuary has a length of about 10 kilometers where the estuary is still influenced by the physical properties of the ocean such as tide and ocean salinity. Citarum River Estuary has the mouth which is located in Muara Bendera, with width of hundreds of meters (Siregar 2013). Many problems occur in Citarum area such as sedimentation (Poerbandono et al 2006), water pollution, salt intrusion (Atmosudirdjo 2014), degradation of catchment area and flooding (Siregar 2018).
Estuaries are defined as semi-enclosed waters that have a direct relationship with the sea, where fresh water from rivers and the sea salt water meet. Estuary is a part of the river system which is experiencing the direct impact of the physical properties of the sea such as tides, currents, waves, salinity, and others (Nguyen 2008; Bianchi 2013). One of the physical parameters in the estuary is the flushing time or so-called the time necessary to drain the fresh water in the estuary. In general the flushing time can be defined as the length of time needed to replace the existing fresh water in an estuary at a rate equal to the discharge of the river (Hadi & Mihardja 1987). One of the tools of estuary management is flushing time concept (Tomczak 1998). The benefits of flushing time are to know how long will it take for the estuary to exchange with open ocean water or how much do we have to reduce pollutants in order to protect the marine environment in coastal sea (Yanagi 1999). Flushing time concept was applied for some cases at some estuaries, bays and other waters (Choi & Lee 2004; Sachoemar et al 2009; Andutta et al 2013). Furthermore, in determining the value of a flusing time, there are two methods,

AES Bioflux, 2018, Volume 10, Issue 3. http://www.aes.bioflux.com.ro
210
that is, empirical and numerical methods. Both methods perform a different approach in determining the value of a flushing that occurs in the estuary. The aim of this reseach is to determine the flushing time near mouth of Citarum River Estuary by using empirical and numerical methods.
Material and Method. Reseach area in this study was located at Citarum River Estuary which was located at northern part of Java Island and east of Jakarta Bay (Figure 1). The data used in this study was the current speed, sea level water, salinity data and topographic data to determine the total volume of the estuary. The data was obtained from the field observation conducted in April 2013 (wet season) and September 2013 (dry season). There were 6 observation stations for both seasons (Figures 2 and 3). In this research, there are two methods of data processing to determine the flushing time, namely: empirical and numerical methods.
Figure 1. Research area of Citarum River Estuary (Source: Google earth).
Figure 2. Observation stations during the wet season (Source: Google earth).
AES Bioflux, 2018, Volume 10, Issue 3. http://www.aes.bioflux.com.ro
211
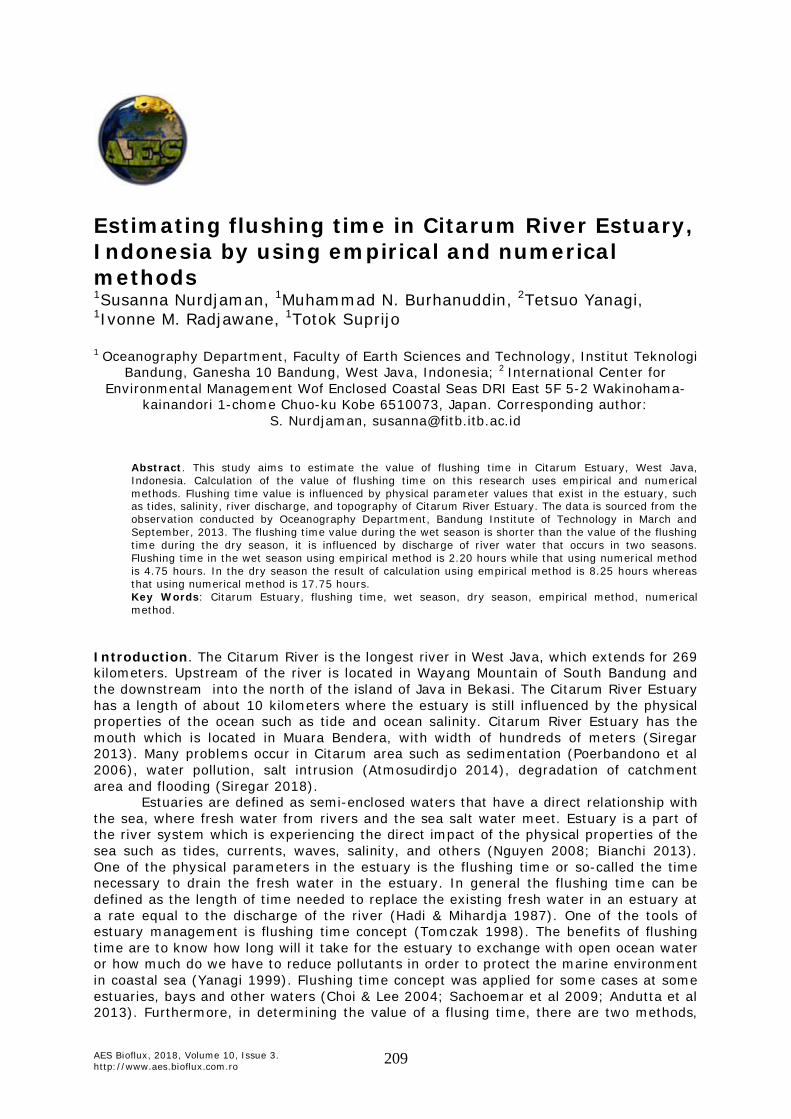
Figure 3. Observation stations during dry season (Source: Google earth).
Empirical method. Mathematically flushing time can be formulated in equation (1) as follows (Tomczak 1998):
(1)
where: tf = flushing time (second); V = volume of water in estuary (m3); = the average fraction of fresh water;
R = runoff from river (river discharge) (m3 s-1)
The volume of freshwater Vf is expressed by the observed salinity data in the estuary. When mixing occurs in areas of estuariny, it can be determined by mathematically linear mixing, and the fraction of freshwater f (pers. 1) in a water sample can be expressed by:
(2) So is the salinity of sea water near the mouth of estuary, in this study the value of
salinity of the ocean water north of Java, where Citarum River flows in, was 33 psu. The value of S included in the formulation of fresh water fraction above is the value of average salinity measured at all stations.
Flushing time calculation using this method requires a survey of field data on topography of estuary, river water flow data measurements R (which can be obtained at one point in the estuary) and the estuary salinity distribution itself. Flushing time changes to variation of river water flow and inversely proportional to 1/R. Numerical method. For verification of transport models of flushing time, researchers used software Mike 21. Simulation of horizontal movement uses 2-D hydrodynamic model MIKE 21 Flow Model FM to know the speed and pattern of the current circulation. The following 2-D hydrodynamic equations are used in MIKE 21 Flow Model FM (DHI 2007):
(3) where h is actual depth, is water elevation and d is water depth from mean sea level.
The continuity equation formulated as follows:

AES Bioflux, 2018, Volume 10, Issue 3. http://www.aes.bioflux.com.ro
212
(4)
The momentum equations (Navier-Stokes) are:
(5)
and
(6)
With average velocity each depth: (7)
Lateral shear stress including viscosity friction, turbulent friction and advection
approximated by:
Where: t = time (s); ƞ = surface elevation (m); d = depth (m); u, v, w = velocities (m s-1); f = Coriolis parameter; Sxx, Sxy, Syx, Syy = stress radiation tensor; ρ = water density (kg m-3);
is eddy viscosity (m2 s-1).
The principle on flushing time by numerical method is calculated as the time where it takes the mass of water in the estuary to get out of the mouth of the estuary. The estuary mouth has a specific vertical cross-sectional area and the velocity change with time which we know from the simulation model. Mathematically it can be written as follows:
(8)
where: tf = flushing time; V(t) = current speed at estuary mouth as function of time (m s-1); A = area of vertical cross section at mouth of estuary (m2);
t = iteration time (second); f = fraction of fresh water (as eq 2); Vol = volume of water in estuary.
The calculation using the above formula is carried out by the iterated calculation at each current velocity change every 15 minutes. Iteration of this calculation will be finished if the amount of fresh water mass through the mouth of the estuary with a certain speed has reached the value of the volume of freshwater mass present in the estuary. In other words, the freshwater mass in the estuary has gone all its way to the open sea through the mouth of the estuary within the iteration time. Then the value of the numerical method is obtained when the whole freshwater mass in the estuary is completely depleted, during the iteration of speed at a given time. In the calculation of the numerical method, several assumptions are needed, such as the value of the current

AES Bioflux, 2018, Volume 10, Issue 3. http://www.aes.bioflux.com.ro
213
velocity in the mouth must be uniform. In addition, it is similar to the assumptions made on the empirical method that the calculation of the brewing time is only done at low tide. Then the current velocity data used is the current velocity at the tidal condition of receding where the current velocity towards the outer estuary is faster. Results and Discussion Calculation of flushing time with empirical method. The value of flushing time in the dry season is longer than the time in the rainy season. This difference is due to significant difference of river water flow between the two seasons. In the rainy season the average monthly water discharge of Citarum River reaches 249.8 m3 s-1, while in the dry season the average monthly one is only 37.6 m3 s-1 (Supangat & Paimin 2007 in Siregar 2013). . The rainfall that occurs during the rainy season along the Citarum River basin water mass produces very abundant, so the distinction of river dischage is very significant.
In addition to the discharge, the influence of salinity in estuary is very large. In the rainy season tidal influence that brings water mass with high salinity is not large in deeper estuary upstream. Whereas in the dry season mixing of water masses with high salinity can reach several kilometers upstream from the estuary. Table 1 compares the flushing time in the wet season and the dry season.
Table 1
Comparison of flushing time with empirical methods at wet and dry seasons
Seasons S (ppt)
So (ppt)
f (fresh water
fraction)
Lenght (m)
Width (m)
Depth (m)
Volume (m3)
Discharge (m3 s-1)
Flushing time
(hour)
Wet 15.82 33 0.52 10,162 86.2 4.35 3,810,445 249.8 2.20 Dry 19.17 33 0.42 10,507 84.4 3 2,663,334 37.6 8.25
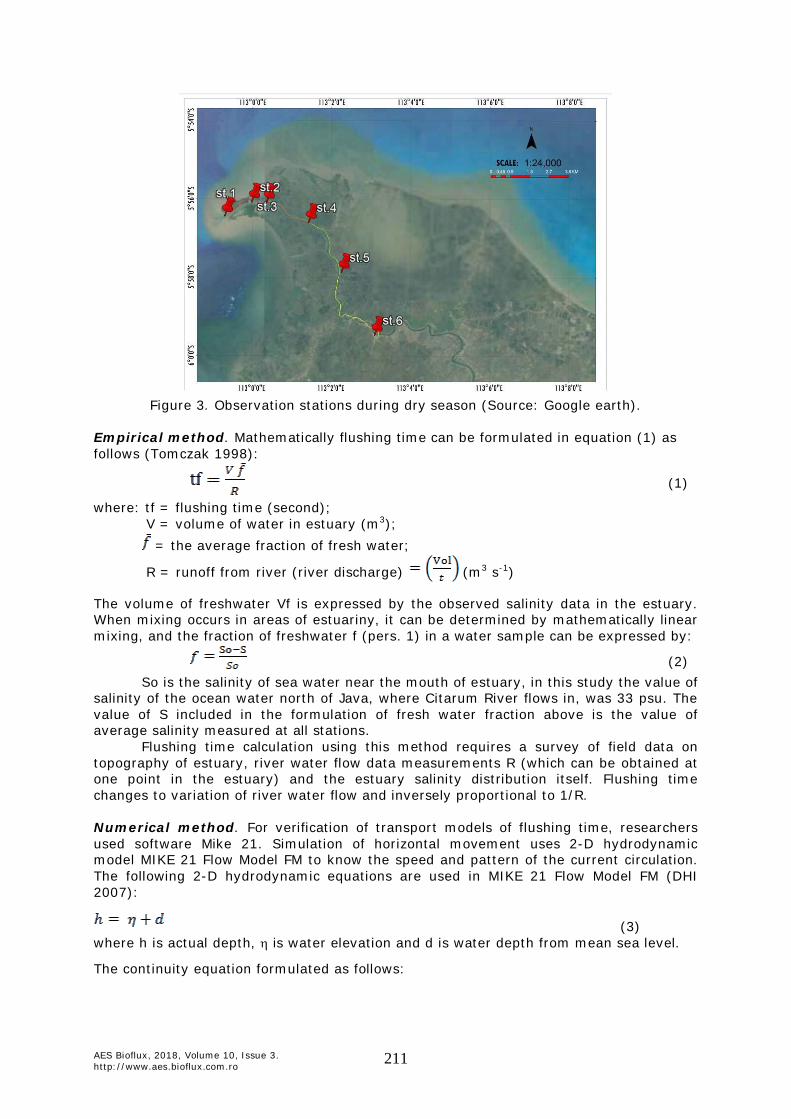
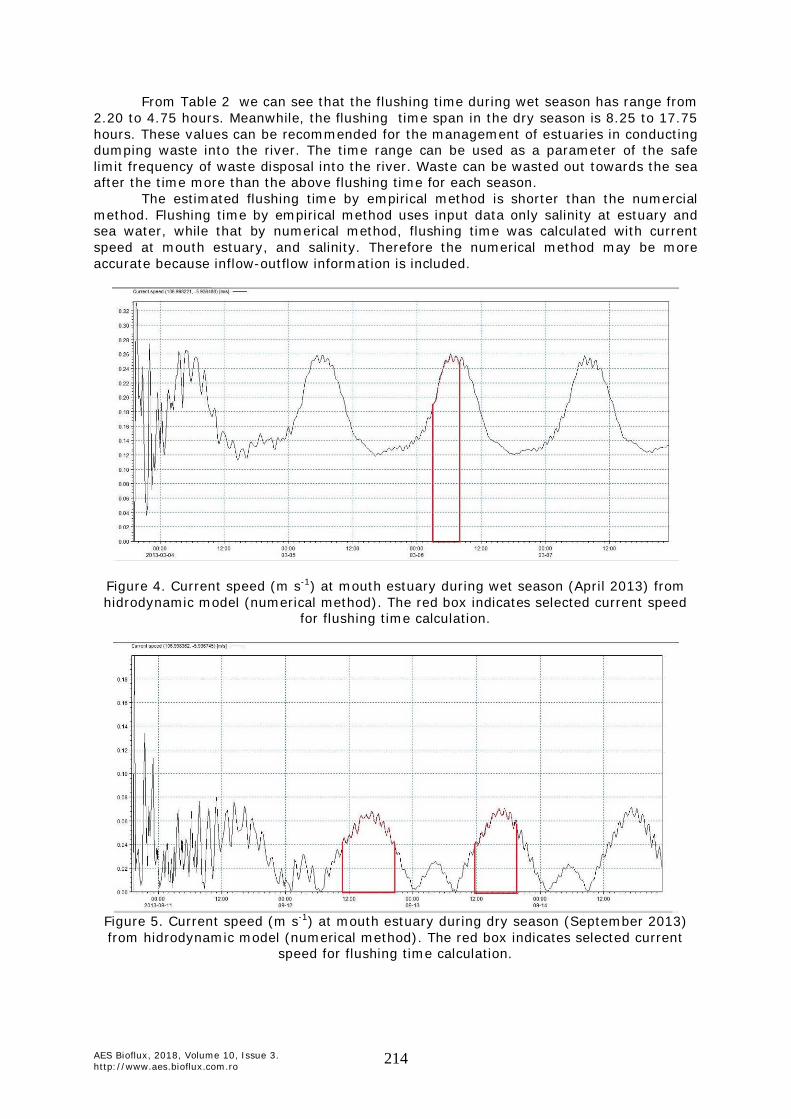
Calculation of flushing time with numerical method. In this numerical method, computed value of flushing time obtained in the wet season is shorter than that in the dry season. The value of flushing time with numerical method in the wet season is 4.75 hours while during the dry season the flushing time value is 17.75 hours (Table 2). Difference in the flushing time values on numerical method is influenced by the flow velocity that occurs at the mouth of the estuary. In the wet season the current speed can reach 0.25 m sec-1, while during the dry season maximum current speed reaches only 0.07 m sec-1 (Figures 4 and 5). Current speed affects the speed of the water mass movement in the estuary towards the sea. The following flow velocity during the wet season and the dry season in the Citarum River Estuary shows the difference betwen both seasons (Figures 4 and 5).
The flushing times obtained from the two methods of calculation show the same results, that is, the flushing time in the wet season is faster than that in the dry season. However the results of both methods have different time values. This difference between the two methods is due to the different approaches in calculating the flushing time value. The following comparison of flushing time value is derived from empirical and numerical methods (Table 2).
Table 2
Comparison of flushing time beetween empirical and numerical methods
Method Season Flushing time (hours) Wet 2.20 Empirical Dry 8.25 Wet 4.75 Numerical Dry 17.75
AES Bioflux, 2018, Volume 10, Issue 3. http://www.aes.bioflux.com.ro
214
From Table 2 we can see that the flushing time during wet season has range from 2.20 to 4.75 hours. Meanwhile, the flushing time span in the dry season is 8.25 to 17.75 hours. These values can be recommended for the management of estuaries in conducting dumping waste into the river. The time range can be used as a parameter of the safe limit frequency of waste disposal into the river. Waste can be wasted out towards the sea after the time more than the above flushing time for each season.
The estimated flushing time by empirical method is shorter than the numercial method. Flushing time by empirical method uses input data only salinity at estuary and sea water, while that by numerical method, flushing time was calculated with current speed at mouth estuary, and salinity. Therefore the numerical method may be more accurate because inflow-outflow information is included.
Figure 4. Current speed (m s-1) at mouth estuary during wet season (April 2013) from hidrodynamic model (numerical method). The red box indicates selected current speed
for flushing time calculation.
Figure 5. Current speed (m s-1) at mouth estuary during dry season (September 2013) from hidrodynamic model (numerical method). The red box indicates selected current
speed for flushing time calculation.

AES Bioflux, 2018, Volume 10, Issue 3. http://www.aes.bioflux.com.ro
215
Effect of physical parameters to flushing time. Flushing time is a physical parameter which is strongly associated with other physical conditions that occur in an area (Tomczak 1998). The flushing time obtained above are affected by three factors as follows. Effect of tide. The type of tide in Citarum River Estuary is diurnal, and the range of sea water elevation was -0.39 – 0.31 m or with tidal amplitude 0.35 m (Siregar 2013). It means that the effect of tide in this area is weak. The flushing time is mainly dominated by river discharge than tide. Effect of salinity through estuary. Salinity profiles in the estuary is determined by two types of water masses, sea water and river water masses. At the time of the calculation of drain which refers to the salinity value, the basic principle of the calculation is to compare the salinity value at each point in the estuary with salinity of sea water. Flushing time value can be determined from the mass movement of water with low salinity until it approaching to seawater. Mass of sea water with high salinity will enter the estuary during the flooding tide and then mix with the flow of river water whose salinity is close to zero, and water mass will be formed between the layer of water mass stratification which is dependent on this movement and two water masses (Dyer 1997).
In the both methods of calculation of the flushing time, salinity values are needed to determine the freshwater mass fraction through total volume of estuary. The mass fraction of freshwater is a representation of mass quantity of fresh water to the total mass of water in the estuary. Effect of salinity value of the mass of water in the estuary caused by the mass of sea water, with the information of the fraction, therefore we can separate the volume of fresh water and sea water masses in the estuary. The high value of freshwater fraction has physical meaning that the mass of fresh water is abundant. In other words, the greater the value of the fraction of fresh water, then the freshwater mass will be more abundant and flushing time required will be longer.
Effect of Citarum River discharge. Citarum River water discharge plays a role in moving the fresh water mass to the estuary area, and greatly affects the flushing time that happened in the estuary. The greater the flow of river water, the faster is also the flushing time. Citarum River discharge is influenced by rainfall that occurred along the watershed along 269 kilometers. The mass of accumulated rain water will flow in the watershed.
From the Table 2, we can see that the difference in the value of Citarum River discharge in the wet season and the dry season is very significant. In the wet season of March the river discarge reaches 249.8 m3 s-1, the value of the Citarum River water discharge is a potential for flooding. In conditions of huge river discharge, the flushing time becomes very short, i.e. 2.20 to 4.75 hours. Otherwise during the dry season of September, the value is only 37.6 m3 s-1. At the small river water discharge conditions like this time, the draining becomes longer, namely 8.25 to 17.5 hours. Flushing time value is inversely proportional to the value of river discharge. The greater the discharge in the river, the shorter the flushing time, in the contrary, the smaller river discharge therefore the longer flushing time. Conclusions. The result of the calculation of flushing time shows that the flushing time in the dry season is longer than the wet season. By using empirical method, the flushing time is 2.20 hours in the wet season, while it is 8.25 hours in the dry season.
Calculation using a numerical method has the advantage that the flow speed in the mouth of the estuary is a function of time. The flushing time during the wet season is 4.75 hours, while it is 17.75 hours in the dry season.
Range for flushing time during the wet season is 2.2-4.75 hours, and 8.25-17.75 hours during the dry season. The range value can be recommended for safe limits of the range of waste disposal in the management of the estuary.
AES Bioflux, 2018, Volume 10, Issue 3. http://www.aes.bioflux.com.ro
216
The physical factors that affect the value of the flushing time in the estuary area are river discharge, salinity, and the tide. River discharge has stronger influence than salinity and tide especially in wet season. References Andutta F. P., Ridd P. V, Wolanski E., 2013 The age and the flushing time of the Great
Barrier Reef waters. Continental Shelf Research 53:11-19. Atmosudirdjo A., 2014 [Study of salt transport at Citarum River]. Oceanography Study
Programme, Faculty of Earth Sciences and Technology, Institut Teknologi Bandung. [in Indonesian]
Bianchi T., 2013 Estuaries: where the river meets the sea. Nature Education Knowledge 4(4):12.
Choi K. W., Lee J. H. W., 2004 Numerical determination of flushing time for stratified water bodies. Journal of Marine Systems 50:263-281.
DHI Water & Environment, 2007 MIKE 11 - a modelling system for rivers and channels. DHI Water & Environment, Denmark, 88 pp.
Dyer K. R., 1997 Estuaries: a physical introduction. 2nd edition, Wiley, 195 pp. Hadi S., Mihardja D. K., 1987 [The dynamics of estuary]. Fluid Mechanic and
Hydrodynamic Laboratory, Institut Teknologi Bandung. [in Indonesian] Nguyen A. D., 2008 Salt intrusion, tides and mixing in multi-channel estuaries. PhD
Thesis, Delft University of Technology, Netherland, 156 pp. Poerbandono P., Basyar A., Harto A. B., 2006 Spatial modelling of sediment transport
over the upper Citarum cathment. Journal of Engineering and Technological Sciences 38(1):11-28.
Sachoemar S. I., Yanagi T., Muawanah, 2009 Seasonal variation in fresh water residence time and its impact on the water quality at Harun Bay, South Sumatera, Indonesia. La mer 46:65-75.
Siregar I., 2013 [Characteristic of Oceanography at Citarum River Estuary, West Java]. Study Programme of Oceanography, Faculty of Earth Sciences and Technology, Institut Teknologi Bandung. [in Indonesian]
Siregar R. I., 2018 Numerical analysis of flood modelling of upper Citarum River under extreme flood condition. IOP Conference Series: Materials Science and Engineering 308:012023.
Supangat, Paimin, 2007 [Study of reservoir as natural water quality control]. Research Center of Forestry, Solo. [in Indonesian]
Tomczak M., 1998 Shelf and coastal oceanography. Lecture notes, Flinders University of South Australia.
Yanagi T., 1999 Coastal oceanography. Terra Scientific Publishing Company, Kluwer Academic Publishers, 162 pp.
Received: 11 September 2018. Accepted: 30 October 2018. Published online: 19 December 2018. Authors: Susanna Nurdjaman, Oceanography Department, Faculty of Earth Sciences and Technology, Institut Teknologi Bandung, Ganesha 10 Bandung, West Java, Indonesia 40132, e-mail: [email protected] Muhammad Nur Burhanuddin, Oceanography Department, Faculty of Earth Sciences and Technology, Institut Teknologi Bandung, Ganesha 10 Bandung, West Java, Indonesia 40132, e-mail: [email protected] Tetsuo Yanagi, International Center for Environmental Management Wof Enclosed Coastal Seas DRI East 5F 5-2 Wakinohama-kainandori 1-chome Chuo-ku Kobe 6510073 Japan, e-mail: [email protected] Ivonne M. Radjawane, Oceanography Department, Faculty of Earth Sciences and Technology, Institut Teknologi Bandung, Ganesha 10 Bandung, West Java, Indonesia 40132, e-mail: [email protected] Totok Suprijo, Oceanography Department, Faculty of Earth Sciences and Technology, Institut Teknologi Bandung, Ganesha 10 Bandung, West Java, Indonesia 40132, e-mail: [email protected] This is an open-access article distributed under the terms of the Creative Commons Attribution License, which permits unrestricted use, distribution and reproduction in any medium, provided the original author and source are credited. How to cite this article: Nurdjaman S., Burhanuddin M. N., Yanagi T., Radjawane I. M., Suprijo T., 2018 Estimating flushing time in Citarum River Estuary, Indonesia by using empirical and numerical methods. AES Bioflux 10(3):209-216.