Estimates ofRelative Food Consumption by Fish and ... · PAULY, D., V. SAMBILAY, JR. and S. OPITZ....
16
236 Abstract PAULY, D., V. SAMBILAY, JR. and S. OPITZ. 1993. Estimates of relative food consumption by fish and invertebrate populations, required for modelling the Bolinao reef ecosystem, Philippines, p. 236-251. In V. Christensen and D. Pauly (eds.) Trophic models of aquatic ecosystems. ICLARM Conf. Proc. 26, 390 p. are relevant aspects of ecosystem and multispecies fisheries management (Palomares and Pauly 1989 and see contributions in this volume). This paper (of which Sambilay et al. 1992 is a summary version) prdvides estimates of the food consumption of some fish and invertebrate groups occurring in Bolinao Reef in Lingayen Gulf, Pangasinan, Philippines. The results can be used as initial estimates of input parameters to an ecosystem model as constructed using the ECOPATH or ECOPATH II models and software. Details of the procedures on .how these estimates were obtained are also provided to serve as example for approaches such as used here for taxa and/or areas not considered here. Estimates of food consumption per unit biomass in five important invertebrate groups and eight species of fish are presented for taxa which either occur or can be used to represent major elements of the coral reef ecosystem of Bolinao, Pangasinan, Philippines. A brief discussion is presented on how these estimates can be used to construct a steady-state trophic model of the Bolinao reef ecosystem, and of the application of the methods used therein to other taxa and/or ecosystems. Estimates of Relative Food Consumption by Fish and Invertebrate Populations, Required for Modelling the Bolinao Reef Ecosystem, Philippines* D. PAULya, v. SAMBILAY, JR.a and S. OPITZb alnternational Center for Living Aquatic Resources Management MCPO Box 2631, 0718 Makati Metro Manila, Philippines blnstitut fur Meereskunde Universitat Kiel Duesternbrooker Weg 20 D-2300 Kiel 1, Germany Introduction *ICLARM Contribution No. 619. Presented at the UPMSII UNDP First National Symposium in Marine Science, 16-18 May 1990. When studying the trophic structure, i.e., energy flow and predator-prey relationships of coral reef ecosystems, it is of vital importance to relate the food consumption (Q), biomass (B) and production (P) of each reef 'organism to the production of its food resource (Winberg and Duncan 1971; Mann 1978; Polovina 1984; Olson and Mullen 1986). Furthermore, the evaluation of the magnitude and nature of these interactions
Transcript of Estimates ofRelative Food Consumption by Fish and ... · PAULY, D., V. SAMBILAY, JR. and S. OPITZ....

236
Abstract
PAULY, D., V. SAMBILAY, JR. and S. OPITZ. 1993. Estimates of relative food consumption by fish andinvertebrate populations, required for modelling the Bolinao reef ecosystem, Philippines, p. 236-251. In V.Christensen and D. Pauly (eds.) Trophic models of aquatic ecosystems. ICLARM Conf. Proc. 26, 390 p.
are relevant aspects of ecosystem andmultispecies fisheries management (Palomaresand Pauly 1989 and see contributions in thisvolume).
This paper (of which Sambilay et al. 1992 isa summary version) prdvides estimates of thefood consumption of some fish and invertebrategroups occurring in Bolinao Reef in LingayenGulf, Pangasinan, Philippines. The results can beused as initial estimates of input parameters toan ecosystem model as constructed using theECOPATH or ECOPATH II models and software.Details of the procedures on .how these estimateswere obtained are also provided to serve asexample for approaches such as used here fortaxa and/or areas not considered here.
Estimates of food consumption per unit biomass in five important invertebrate groups and eight speciesof fish are presented for taxa which either occur or can be used to represent major elements of the coral reefecosystem of Bolinao, Pangasinan, Philippines. A brief discussion is presented on how these estimates can beused to construct a steady-state trophic model of the Bolinao reef ecosystem, and of the application of themethods used therein to other taxa and/or ecosystems.
Estimates of Relative Food Consumptionby Fish and Invertebrate Populations,
Required for Modellingthe Bolinao Reef Ecosystem, Philippines*
D. PAULya, v. SAMBILAY, JR.a and S. OPITZbalnternational Center for LivingAquatic Resources ManagementMCPO Box 2631, 0718 Makati
Metro Manila, Philippines
blnstitut fur MeereskundeUniversitat Kiel
Duesternbrooker Weg 20D-2300 Kiel 1, Germany
Introduction
*ICLARM Contribution No. 619. Presented at the UPMSIIUNDP First National Symposium in Marine Science, 16-18May 1990.
When studying the trophic structure, i.e.,energy flow and predator-prey relationships ofcoral reef ecosystems, it is of vital importance torelate the food consumption (Q), biomass (B) andproduction (P) of each reef 'organism to theproduction of its food resource (Winberg andDuncan 1971; Mann 1978; Polovina 1984; Olsonand Mullen 1986). Furthermore, the evaluation ofthe magnitude and nature of these interactions
m.campbell
Text Box
Pauly, D., S. Samiblya, Jr. and S. Opitz. 1993. Estimates of relative food consumption by fish and invertebrate populations, required for modelling the Bolinao Reef Ecosystem, Philippines, p. 236-251 In: V. Christensen and D. Pauly (eds.), Trophic models of aquatic ecosystems. ICLARM Conference Proceedings 26.
237
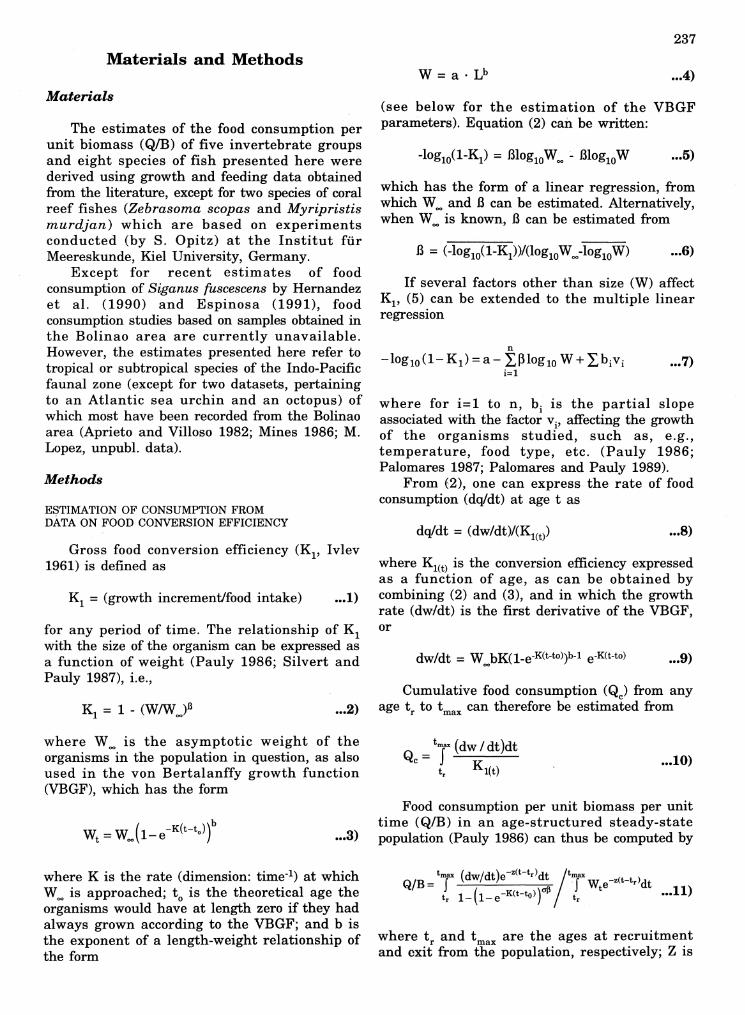
Materials and MethodsW = a· Lb •••4)
•••8)dq/dt = (dw/dt)/(K1(t»
dw/dt = WoobK(l-e-K(t-to»b-l e-K(t-to) ...9)
which has the form of a linear regression, fromwhich Woo and 13 can be estimated. Alternatively,when Woo is known, 13 can be estimated from
n
-loglO(l- K 1) = a - L~loglO W + L biVi ...7)i=l
(see below for the estimation of the VBGFparameters). Equation (2) can be written:
If several factors other than size (W) affectK1, (5) can be extended to the multiple linearregression
where for i=l to n, bi is the partial slopeassociated with the factor vi' affecting the growthof the organisms studied, such as, e.g.,temperature, food type, etc. (Pauly 1986;Palomares 1987; Palomares and Pauly 1989).
From (2), one can express the rate of foodconsumption (dq/dt) at age t as
where K1(t) is the conversion efficiency expressedas a function of age, as can be obtained bycombining (2) and (3), and in which the growthrate (dw/dt) is the first derivative of the VBGF,or
Cumulative food consumption (Qc) from any•••2) age t r to t max can therefore be estimated fromK = 1 - (WIW )131 00
K1 = (growth increment/food intake) .••1)
Materials
The estimates of the food consumption perunit biomass (Q/B) of five invertebrate groupsand eight species of fish presented here werederived using growth and feeding data obtainedfrom the literature, except for two species of coralreef fishes (Zebrasoma scopas and Myripristismurdjan) which are based on experimentsconducted (by S. Opitz) at the Institut furMeereskunde, Kiel University, Germany.
Except for recent estimates of foodconsumption of Siganus fuscescens by Hernandezet ale (1990) and Espinosa (1991), foodconsumption studies based on samples obtained inthe Bolinao area are currently unavailable.However, the estimates presented here refer totropical or subtropical species of the Indo-Pacificfaunal zone (except for two datasets, pertainingto an Atlantic sea urchin and an octopus) ofwhich most have been recorded from the Bolinaoarea (Aprieto and Villoso 1982; Mines 1986; M.Lopez, unpubl. data).
E~TIMATIONOF CONSUMPTION FROMDATA ON FOOD CONVERSION EFFICIENCY
Gross food conversion efficiency (K1, Ivlev1961) is defined as
Methods
for any period of time. The relationship of K1with the size of the organism can be expressed asa function of weight (Pauly 1986; Silvert andPauly 1987), i.e.,
where Woo is the asymptotic weight of theorganisms in the population in question, as alsoused in the von Bertalanffy growth function(VBGF), which has the form
•••3)
•••10)
Food consumption per unit biomass per unittime (Q/B) in an age-structured steady-statepopulation (Pauly 1986) can thus be computed by
where K is the rate (dimension: time-~) at whichWoo is approached; to is the theoretical age theorganisms would have at length zero if they hadalways grown according to the VBGF; and b isthe exponent of a length-weight relationship ofthe form
trnax (d /dt) -z(t-tr)dt /tmaxQ/B = J w e 'J Wte-z(t-tr)dt
tr l_(l_e-K(t-to»)~ tr •••11)
where t r and t max are the ages at recruitmentand exit from the population, respectively; Z is
...15)
•••16)
•••17)
Estimates of the parameters of the VBGFwere obtained predominantly from literature dataand a number of conversions. Of these, theconversion of estimates of asymptotic length (Loo)to asymptotic weight (Woo) was the mostimportant. This was performed based on (4), withapproximate values of Loo estimated from
In this, ~' is the mean of several values of
loglO(-to) = - 0.40 - 0.28 logloLoo+ 1.04 loglOK ...18)
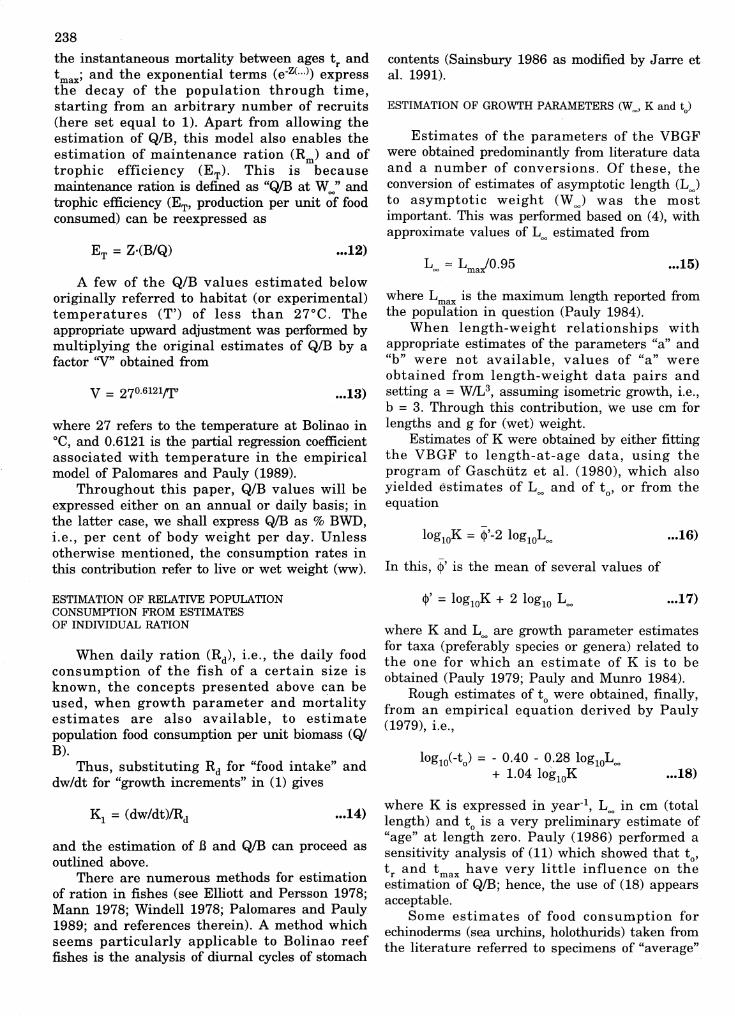
contents (Sainsbury 1986 as modified by J arre etal. 1991).
ESTIMATION OF GROWTH PARAMETERS (Woo, K and to)
where Lmax is the maximum length reported fromthe population in question (Pauly 1984).
When length-weight relationships withappropriate estimates of the parameters "a" and"b" were not available, values of "a" wereobtained from length-weight data pairs andsetting a = W/L3, assuming isometric growth, i.e.,b = 3. Through this contribution, we use cm forlengths and g for (wet) weight.
Estimates of K were obtained by either fittingthe VBGF to length-at-age data, using theprogram of Gaschiitz et ale (1980), which alsoyielded estimates of L and of t , or from the
00 0
equation
where K is expressed in year-I, Loo
in cm (totallength) and to is a very preliminary estimate of"age" at length zero. Pauly (1986) performed asensitivity analysis of (11) which showed that to't r and t max have very little influence on theestimation of Q/B; hence, the use of (18) appearsacceptable.
Some estimates of food consumption forechinoderms (sea urchins, holothurids) taken fromthe literature referred to specimens of "average"
where K and Loo are growth parameter estimatesfor taxa (preferably species or genera) related tothe one for which an estimate of K is to beobtained (Pauly 1979; Pauly and Munro 1984).
Rough estimates of to were obtained, finally,from an empirical equation derived by Pauly(1979), i.e.,
•••12)
•••14)
.•.13)
ET = Z·(B/Q)
v = 270.6I2Itr'
238
the instantaneous mortality between ages t r andt max; and the exponential terms (e-z(.,,») expressthe decay of the population through time,starting from an arbitrary number of recruits(here set equal to 1). Apart from allowing theestimation of Q/B, this model also enables theestimation of maintenance ration (R ) and ofmtrophic efficiency (ET). This is becausemaintenance ration is defined as "Q/B at Woo" andtrophic efficiency (ET, production per unit of foodconsumed) can be reexpressed as
ESTIMATION OF RELATIVE POPULATIONCONSUMPTION FROM ESTIMATESOF INDIVIDUAL RATION
A few of the Q/B values estimated beloworiginally referred to habitat (or experimental)temperatures (T') of less than 27°C. Theappropriate upward adjustment was performed bymultiplying the original estimates of Q/B by afactor ''V'' obtained from
and the estimation of .B and Q/B can proceed asoutlined above.
There are numerous methods for estimationof ration in fishes (see Elliott and Persson 1978;Mann 1978; Windell 1978; Palomares and Pauly1989; and references therein). A method whichseems particularly applicable to Bolinao reeffishes is the analysis of diurnal cycles of stomach
where 27 refers to the temperature at Bolinao in°C, and 0.6121 is the partial regression coefficientassociated with temperature in the empiricalmodel of Palomares and Pauly (1989).
Throughout this paper, Q/B values will beexpressed either on an annual or daily basis; inthe latter case, we shall express Q/B as % BWD,i.e., per cent of body weight per day. Unlessotherwise mentioned, the consumption rates inthis contribution refer to live or wet weight (ww).
When daily ration (Rd), i.e., the daily foodconsumption of the fish of a certain size isknown, the concepts presented above can beused, when growth parameter and mortalityestimates are also available, to estimatepopulation food consumption per unit biomass (Q/B).
Thus, substituting Rd for "food intake" anddw/dt for "growth increments" in (1) gives
size. We have assumed this to correspond to halfthe asymptotic length.
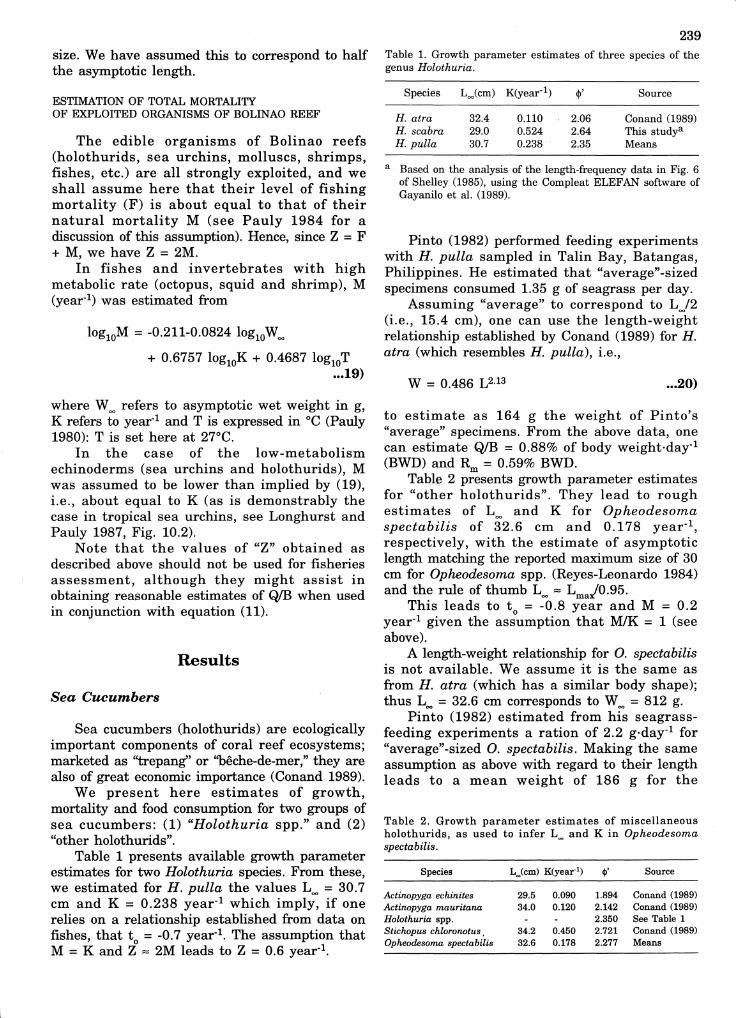
239Table 1. Growth parameter estimates of three species of thegenus Holothuria.
a Based on the analysis of the length-frequency data in Fig. 6of Shelley (1985), using the Compleat ELEFAN software ofGayanilo et al. (1989).
Species Loo(cm) K(year-1) <1>' Source
H. atra 32.4 0.110 2.06 Conand (1989)H. scabra 29.0 0.524 2.64 This studyaH. pulla 30.7 0.238 2.35 Means
Pinto (1982) performed feeding experimentswith H. pulla sampled in Talin Bay, Batangas,Philippines. He estimated that "average"-sizedspecimens consumed 1.35 g of seagrass per day.
Assuming "average" to correspond to Loo/2(i.e., 15.4 cm), one can use the length-weightrelationship established by Conand (1989) for H.atra (which resembles H. pulla), i.e.,
ESTIMATION OF TOTAL MORTALITYOF EXPLOITED ORGANISMS OF BOLINAO REEF
The edible organisms of Bolinao reefs(holothurids, sea urchins, molluscs, shrimps,fishes, etc.) are all strongly exploited, and weshall assume here that their level of fishingmortality (F) is about equal to that of theirnatural mortality M (see Pauly 1984 for adiscussion of this assumption). Hence, since Z = F+ M, we have Z = 2M.
In fishes and invertebrates with highmetabolic rate (octopus, squid and shrimp), M(year-I) was estimated from
log10M =-0.211-0.0824 log10Woo
+ 0.6757 log10K + 0.4687 log10T•••19)
W = 0.486 L2.13 •••20)
where Woo refers to asymptotic wet weight in g,K refers to year-1 and T is expressed in °C (Pauly1980): T is set here at 27°C.
In the case of the low-metabolismechinoderms (sea urchins and holothurids), Mwas assumed to be lower than implied by (19),i.e., about equal to- K (as is demonstrably thecase in tropical sea urchins, see Longhurst andPauly 1987, Fig. 10.2).
Note that the values of "Z" obtained asdescribed above should not be used for fisheriesassessment, although they might assist inobtaining reasonable estimates of Q!B when usedin conjunction with equation (11).
Results
Sea Cucumbers
Sea cucumbers (holothurids) are ecologicallyimportant components of coral reef ecosystems;marketed as "trepang" or ''beche-de-mer,'' they arealso of great economic importance (Conand 1989).
We present here estimates of growth,mortality and food consumption for two groups ofsea cucumbers: (1) "Holothuria spp." and (2)"other holothurids".
Table 1 presents available growth parameterestimates for two Holothuria species. From these,we estimated for H. pulla the values Loo = 30.7cm and K = 0.238 year-1 which imply, if onerelies on a relationship established from data onfishes, that to = -0.7 year-I. The assumption thatM = K and Z ~ 2M leads toZ = 0.6 year-I.
to estimate as 164 g the weight of Pinto's"average" specimens. From the above data, onecan estimate QIB = 0.88% of body weight·day-l(BWD) and Rm = 0.59% BWD.
Tabl~ 2 presents growth parameter estimatesfor "other holothurids". They lead to roughestimates of Loo and K for Opheodesomaspectabilis of 32.6 cm and 0.178 year-I,respectively, with the estimate of asymptoticlength matching the reported maximum size of 30cm for Opheodesoma spp. (Reyes-Leonardo 1984)and the rule of thumb Loo ~ Lma/0.95.
This leads to to = -0.8 year and M = 0.2year-1 given the assumption that M/K = 1 (seeabove).
A length-weight relationship for o. spectabilisis not available. We assume it is the same asfrom H. atra (which has a similar body shape);thus Loo = 32.6 cm corresponds to Woo = 812 g.
Pinto (1982) estimated from his seagrassfeeding experiments a ration of 2.2 g·day-l for"average"-sized O. spectabilis. Making the sameassumption as above with regard to their lengthleads to a mean weight of 186 g for the
Table 2. Growth parameter estimates of miscellaneousholothurids, as used to infer L
ooand K in Opheodesoma
spectabilis.
Species L...,(cm) K(year-1) <1>' Source
Actinopyga echinites 29.5 0.090 1.894 Conand (1989)Actinopyga mauritana 34.0 0.120 2.142 Conand (1989)Holothuria spp. 2.350 See Table 1Stichopus chloronotus. 34.2 0.450 2.721 Conand (1989)Opheodesoma spectabilis 32.6 0.178 2.277 Means
1.0 •
...22)
4.40 (ww) 2.49 Ebert (1975)1.44 (dw) 0.61a Tertsching (1989)
Feeding rate Rd(g'day-l) (% BWD) Source
[EVOCUation rate = 1.91 day-I
177742
ww(g)
W = 0.959 L2.62
0.8
-CJ)
+- 0.6..c:CJ)
Q)
~
+- 0.4::JCJ)
c-.J
0.2
7.512.1
S(cm)
0 1I..- ..L--__----l1L--__---l.1 ---J1
o 2 4 6 8
Starvation time (h)
aComputed from dry weight equivalent of 742 g, Le., sea urchins areassumed to contain 68% water (see Appendix 1).
4. Eehinometra pieta. Pinto (1982) presentedan estimate of seagrass consumption by"average"-sized E. pieta which, if combined withappropriate growth parameters and Z estimates,leads to QIB > 90% BWD. This is unrealisticallyhigh and will not be considered in furtheranalyses.
Hence, combining (1), (2) and (3), values of Q/B = 0.98% BWD and Rm = 0.64% BWD can besuggested for sea urchins as an ecological group.
Combining the available growth and mortality..estimates with the ration estimate in Table 3gives B = 0.276, and hence, Q/B = 1.34% BWDand Rm = 0.83% BWD.
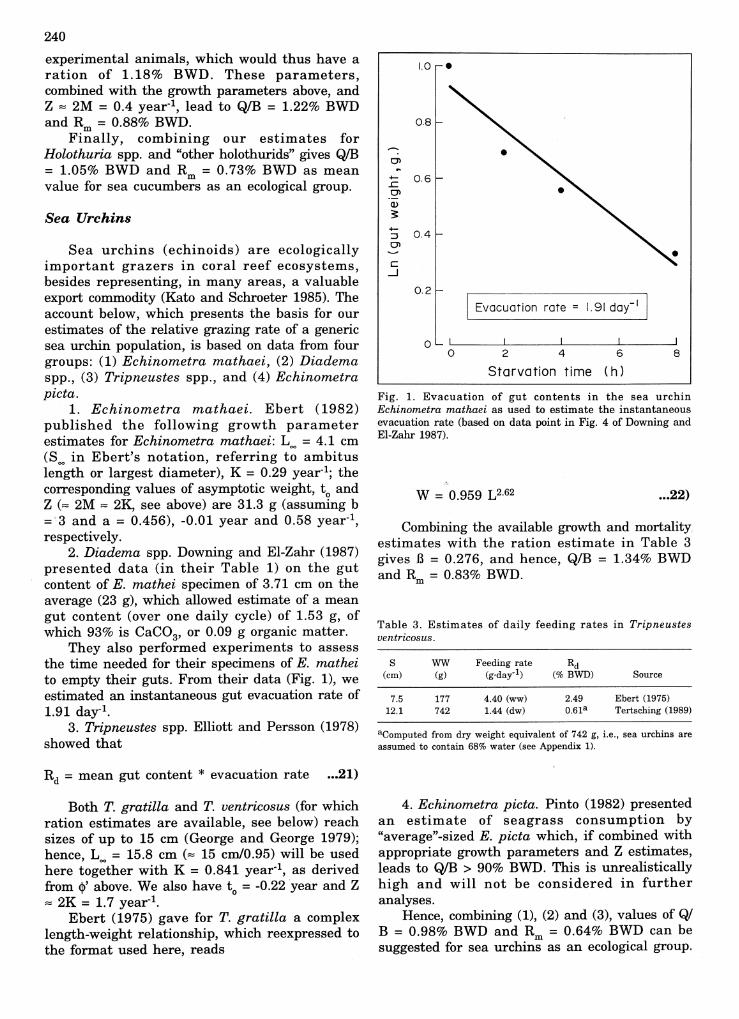
Fig. 1. Evacuation of gut contents in the sea urchinEchinometra mathaei as used to estimate the instantaneousevacuation rate (based on data point in Fig. 4 of Downing andEI-Zahr 1987).
Table 3. Estimates of daily feeding rates in Tripneustesventricosus.
240
Rd = mean gut content * evacuation rate ...21)
Sea urchins (echinoids) are ecologicallyimportant grazers in coral reef ecosystems,besides representing, in many areas, a valuableexport commodity (Kato and Schroeter 1985). Theaccount below, which presents the basis for ourestimates of the relative grazing rate of a genericsea urchin population, is based on data from fourgroups: (1) Eehinometra mathaei, (2) Diademaspp., (3) Tripneustes spp., and (4) Eehinometrapieta.
1. Eehinometra mathaei. Ebert (1982)published the following growth parameterestimates for Eehinometra mathaei: L = 4.1 cm(Soo in Ebert's notation, referring t~ ambituslength or largest diameter), K = 0.29 year-I; thecorresponding values of asymptotic weight, to andZ (~ 2M ~ 2K, see above) are 31.3 g (assuming b='3 and a = 0.456), -0.01 year and 0.58 year-I,respectively.
2. Diadema spp. Downing and EI-Zahr (1987)presented data (in their Table 1) on the gutcontent of E. mathei specimen of 3.71 cm on theaverage (23 g), which allowed estimate of a meangut content (over one daily cycle) of 1.53 g, ofwhich 93% is CaC03, or 0.09 g organic matter.
They also performed experiments to assessthe time needed for their specimens of E. matheito empty their guts. From their data (Fig. 1), weestimated an instantaneous gut evacuation rate of1.91 day-I.
3. Tripneustes spp. Elliott and Persson (1978)showed that
Both T. gratilla and T. ventrieosus (for whichration estimates are available, see below) reachsizes of up to 15 cm (George and George 1979);hence, Loo = 15.8 cm (~ 15 cmlO.95) will be usedhere together with K = 0.841 year-I, as derivedfrom <1>' above. We also have to = -0.22 year and Z~ 2K = 1.7 year-I.
Ebert (1975) gave for T. gratilla a complexlength-weight relationship, which reexpressed tothe format used here, reads
experimental animals, which would thus have aration of 1.18% BWD. These parameters,combined with the growth parameters above, andZ ~ 2M = 0.4 year-I, lead to QIB = 1.22% BWDand Rm =0.88% BWD.
Finally, combining our estimates forHolothuria spp. and "other holothurids" gives Q/B::;: 1.05% BWD and Rm = 0.73% BWD as meanvalue for sea cucumbers as an ecological group.
Sea Urchins
Table 5. Some estimates of growth parameters in Metapenaeusspp. (from Pauly et al. 1984).
241genus Metapenaeus and the correspondingestimates of <1>' (Table 5).
This resulted in K = 0.67 year- I and therelated estimates of to = -0.27, and Z ::::: 2M = 3.2year-I. Asymptotic weight w:as derived via (23)and equaled 47 g.
TLoo K(cm) (year-I) epl
13.3 0.93 2.21614.2 0.90 2.26217.5 1.20 2.56514.0 1.15 2.35314.0 1.20 2.37113.5 1.05 2.28213.8 1.10 2.32118.0 0.67 2.338
M. affinisM. kutchensis
Metapenaeus brevicornis
Species
M. monoceros
Penaeid Shrimps
Various crustaceans occur in or about coralreefs. The account below aims at providing anestimate of the relative food consumption of apopulation of penaeid shrimps, as represented by(1) Penaeus monodon and (2) Metapenaeusmonoceros.
1. Penaeus monodon. This species is reportedto reach 33.6 cm total length (Holthuis 1980),and hence we shall use, for Lma/0.95 ::::: Loo' anasymptotic length of 35 cm. Direct estimates ofthe value of the parameter K were not available,and hence, we estimated it via <1>' and the datafor Penaeus spp. in Table 4, as 0.35 year-I.
Table 4. Growth parameters of miscellaneous penaeid shrimpsas used to estimate ep' and K values for Penaeus monodon. M= male, F = female (adapted from Pauly et al. 1984).
For the length-to-weight conversion, we usedthe generalized relationship for penaeid shrimpsof Pauly et al. (1984)
TLoo KSpecies (c:m) (year-I) ep'
Penaeus duorarum (M) 17.6 1.45 2.65217.6 1.20 2.570
P. kerathurus (F) 21.0 0.80 2.548(M) 18.0 0.90 2.465
P. setiferus (F) 22.5 1.25 2.801(M) 19.2 1.55 2.757
P. monodon (-) 35.0 0.35a 2.632b
aSee text.bMean of other values.
W = 0.008(TL)3 •••23)
Table 6 summarizes the results of feedingexperiments with M. monoceros used here. Asmight be seen, the wide variety of feeds andexperiment conditions led to widely varyingvalues of KI, even after adjusting for the effect ofbody weig~t on KI. Here, we have ignored thisvariability and derived a single value of B =0.0249, applicable to intermediate food andexperimental conditions.
This value of B, combined with the growthparameters above, leads to QlB = 11.38% BWDand Rm = 7.37% BWD.
Based on the estimates for the two speciesabove, "shrimp" as an ecological group, have a QIB = 7.93% BWD and Rm = 4.98% BWD.
which provides Woo = 343 g. The other estimatesused here are t = -0.46 year, Z ::::: 2M = 1.8
oyear-I.
Vijayaraghavan et ale (1988) fed juvenile P.monodon of 0.15 g mean weight with Artemiacysts and nauplii. The mean observed weightincrement and amount of feed ingested were0.197 g and 0.790 g, respectively, and hence KI =0.25.
From (6), B = 0.0371; the QlB value derivedfrom (11) is 4.48% BWD; maintenance ration is2.58% BWD.
2. Metapenaeus monoceros. This is reported toreach 17.25 cm total length, from which,according to (15), Loo ::::: 18 cm. No direct estimateof K is available, and hence we have estimatedthis parameter indirectly, using growthparameter estimates for other species of the
Octopus
Various species of octopus occur on tropicalreefs, inclusive of Philippine coral reefs (Roper etale 1984). It is not certain whether Octopusvulgaris, the "common octopus," which is reportedfor the South and East China Seas, actuallyoccurs on Philippine coral r~efs but it is possible,given that "this species, or species-complex iswidely distributed around the world (with)taxonomic and geographic parameters (that) stillare not precisely defined" (Roper et al. 1984).
Growth parameters for O. vulgaris have beenpublished by Guerra (1979) based on samplescollected off Northwest Africa and in theMediterranean (near Barcelona). We used thelatter sets of parameters because these refer towarmer waters and hence, more akin to thecondition prevailing in the Philippines.
242
Table 6. Food intake of M. monoceros on different diets.
dw (g) dw (g) Food wwb
No.a Diet initial final (g dw) K1 mean
1. mangrove leaves 0.091 0.124 0.321 0.103 0.442. mangrove leaves 0.089 0.114 0.251 0.100 0.423. mangrove leaves 0.085 0.117 0.225 0.142 0.414.e dry pellets 12.746 13.697 2.512 0.379d 13.225.e dry pellets 3.653 4.292 2.051 0.311d 3.976.e dry pellets 5.303 8.953 3.443 1.060d 7.137.e dry pellets 5.546 8.992 6.805 0.506d 7.278.e dry pellets 4.787 8.029 5.547 0.584d 6.419.e dry pellets 2.741 5.130 4.237 0.564d 3.94
10. trash fish 0.507 0.562 0.418 0.132 2.1911. low protein pellets 0.096 0.111 0.228 0.066 0.4212. Artemia 0.103 0.189 0.287 0.300 0.6013. Formula 5 0.167 0.271 0.851 0.122 0.9014. Formula 7 0.099 0.175 0.462 0.164 0.5615. Formula 8 0.072 0.136 0.471 0.136 0.4216. fish meal 0.200 0.201 0.465 0.002 0.8217. fish meal 0.239 0.299 1.010 0.060 1.1018. fish meal 0.394 0.505 2.104 0.053 1.8419. Cooper 6 0.185 0.192 0.521 0.014 0.7720. Cooper 6 0.253 0.337 1.175 0.071 1.2121. Cooper 6 0.407 0.500 2.750 0.034 0.6422. Formula 10 0.259 0.365 0.985 0.108 1.2823. Formula 10 0.443 0.630 2.970 0.063 2.2024. Tamil Nadu 0.156 0.148 0.505 -0.017d 0.3025. pellet 7 0.262 0.299 1.532 0.024 1.1526. pellet 7 0.392 0.466 4.515 0.016 1.76
a Nos. 1-3, Ramadhas and Vijayaraghavan (1979); 4-15, Royan et al. (1977); 16-26,Vijayaraghavan et al. (1978).
b Weight conversion based on body water composition of M. monoceros = 75.6% (see Appendix 1).e Originally presented as ww.d Not used, unrealistically high (or negative).
•••24) Squids
The growth parameter estimates are Loo = 30cm (mantle length, ML), K = 0.72 year-I and to =-0.25. Guerra (1979) also presented a lengthweight relation.ship for western Mediterraneanspecimens of O. vulgaris, i.e.,
W = 0.42 (ML)2.987
Hence, Woo = 10,850 g. From this, M = 0.82year-I and Z ~. 1.64 year-I.
. Some estimates of K I for O. vulgaris aregiven in Table 7.
Combined with the growth parameterestimates presented above, this leads to B =0.2312, which,when used in conjunction withthe estimate of Z above, leads to Q/B = 1.39%
Table 7. Estimated conversion efficiencies of O. vulgaris(from O'Dor and Wells 1987, based on experiments byMangold and Boletzky 1973).
-Weight range W Temperature K1
(g) (g) (OC)
112-1,267 690 20 0.4882-450 266 15 0.5580-461 271 10 0.56
BWD and Rm = 0.856% BWD, both of whichpertain to a mean temperature of 15°C.Conversion to the temperature prevailing atBolinao leads to Q/B z 2.0% BWD and Rm Z
1.23% BWD for octopus as an ecological group.
Squids occur in the pelagic areas of andaround coral reefs, including Bolinao reef (Balgos1990) and can be expected to consume a sizeableproportion of the secondary production of suchareas, as is also the case in other ecosystemsthey inhabit (see contributions in Boyle 1987).
Estimates of food consumption of squidspresented here are based on parameter estimatesadapted from Longhurst and Pauly (1987), whocombined population data pertaining to tropicalwith experimental data pertaining to temperatesquids (Table 8).
These estimates, however, refer to lowtemperatures and thus need to be adjusted suchthat increased metabolism at highertemperatures, i.e., tropical reef areas, isaccounted for. The adjusted estimates of Q!B andRm are 6.53% BWD and 4.23% BWD for L.
Saurida undosquamis
Table 8. Parameters used in the estimation of Q!B and Rm ofsquids (adapted from Longhurst and Pauly 1987).
duvaucelli and 2.60% BWD and 1.60% BWD forS. lessoniana.
Combining these results in QIB = 4.56% BWDand R = 2.92% BWD for squids as an ecologicalmgroup.
243
0.42 g2.43 g (=1.04% BWD)
12h24'23h42'0.16 g·h- l
0.35 h-l
0.4410.3171.1990.2640.0900.362
Mean stomachcontents (g)aTime
01h30'05h30'09h30'13h30'17h30'21h30'
• Start of second feeding period• End of second feeding period• Food ingestion rate• Stomach evacuation rate• Asymptotic weight
of stoIIlach contents• Daily ration
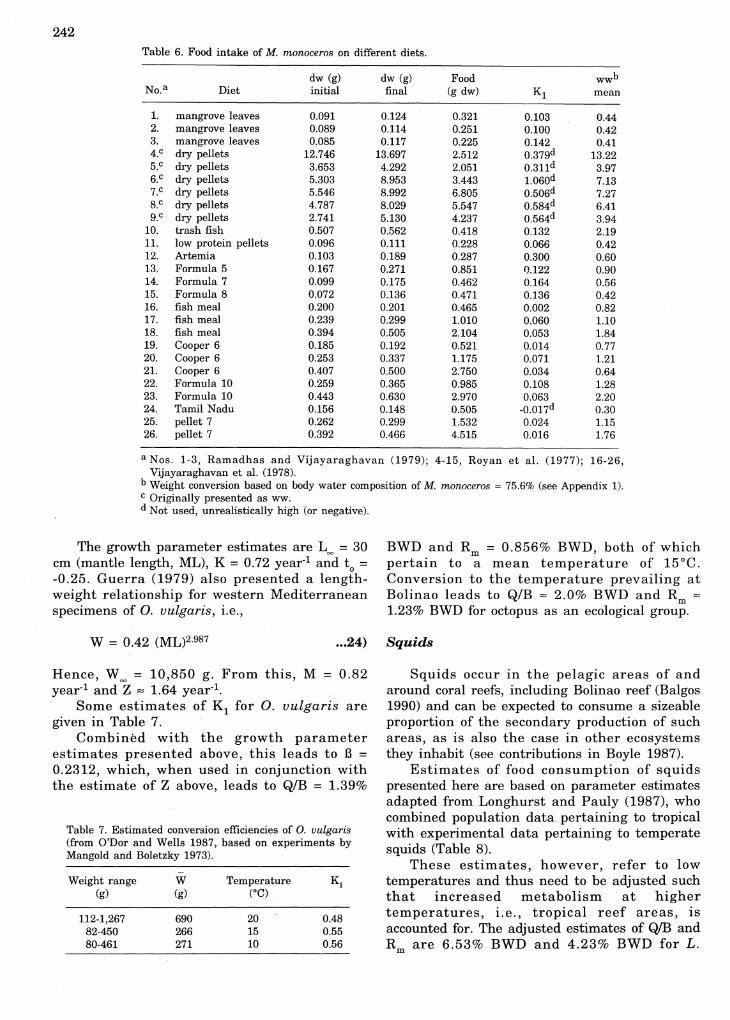
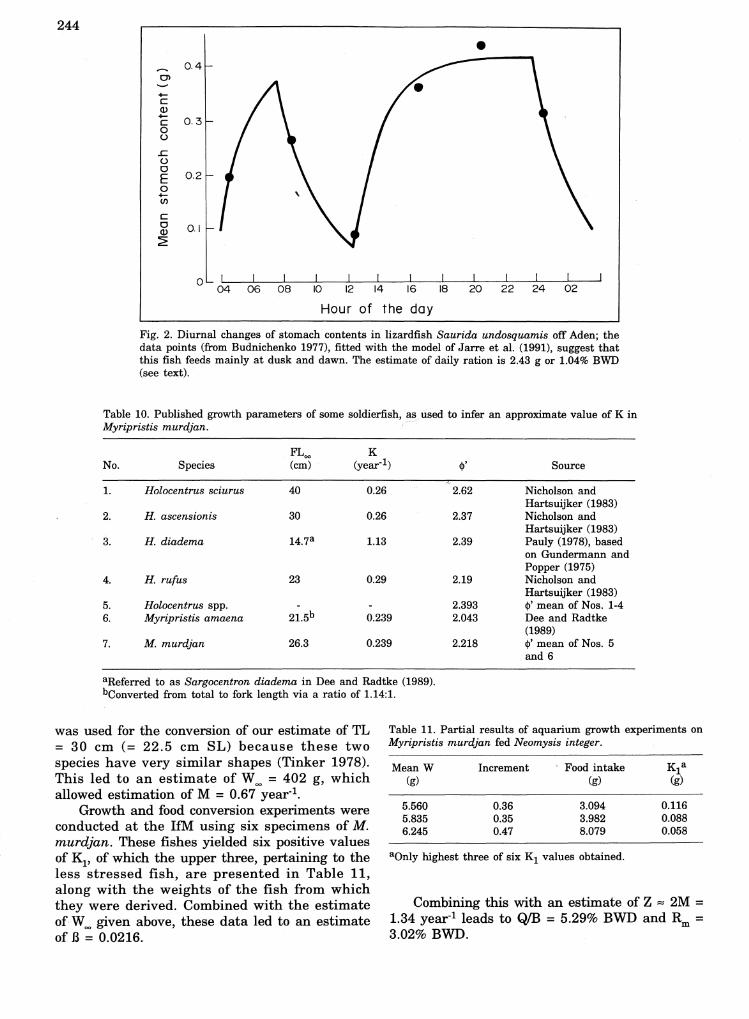
A graph showing the fit of the model to thedata is given as Fig. 2. As might be seen, the fitis "good," but there are few data points, and theresults are thus tentative.
The ration estimates, combined with thegrowth and mortality parameters given above,lead to QIB = 1.17% BWD and Rm = 0.49% BWD.
a Converted from relative weights (in %);the value for 13h30' is a mean of twoobserved stomach content weights takenduring this period.
Myripristis murdjan
The big-eye soldierfish Myripristis murdjan '(Holocentridae) feeds at night on largezooplankton and small fishes; it reaches a lengthof about 30 cm (De Graaf 1977) which shall beused here as estimate of asymptotic (total) length.
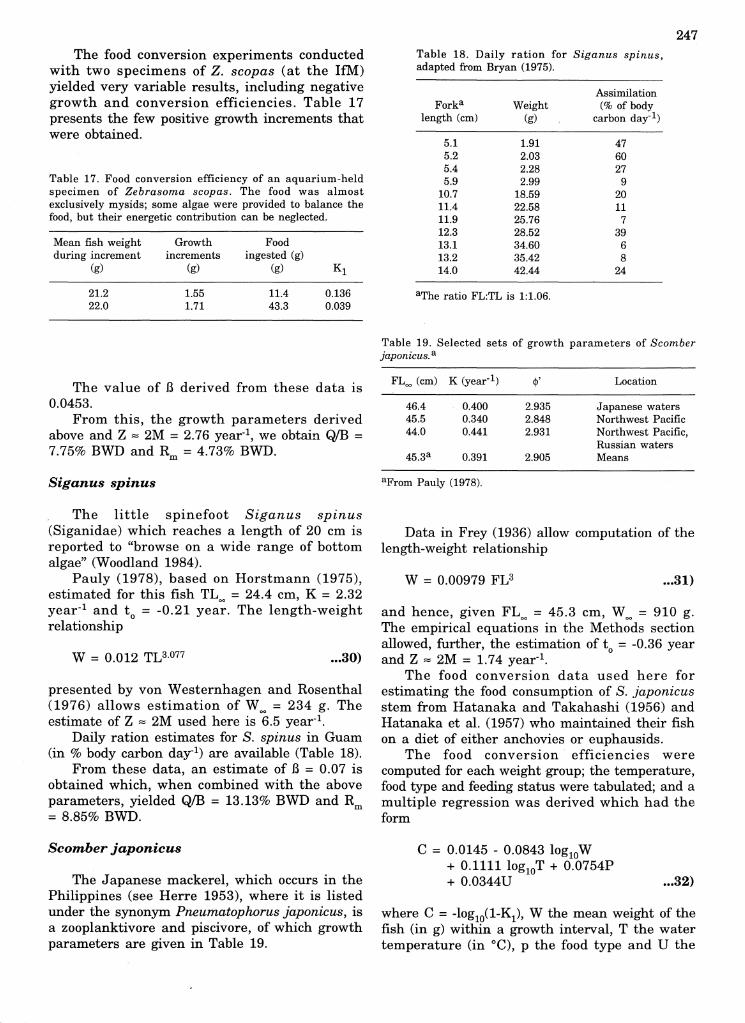
Growth data for this species are not available,but growth parameter estimates for the relatedM. amaena are given in Dee and Radtke (1989).However, they suggest a much slower growththan in other holocentrids, which may be anartifact of the method they used for ageing(otolith microstructures presumed to be daily). Forthis reason, we have used, for the estimation of Kfrom Loo ' a value of <1>' estimated as the mean ofthe single value for M. amaena and that forHolocentrus spp. (see Table 1d). This yielded, forTL = 30 cm, the estimate of K = 0.239 year-I.
00These estimates allow computation of to =-0.69 year. The length-weight relationship of M.amaena derived by Dee and Radtke (1989), of theform
Table 9. Data on the diel cycle of stomachcontent of Saurida undosquamis sampledoff Oman (adapted from Budnichenko1977, Fig. 2).
•••25)
27.00650.00
0.73set = 0
1.70'0.2301.4140.869
10.0
Sepioteuthis Zessoniana IIllex illecebrosus
29.00150.00
1.00set = 0
3.160.0835.0943.300
18.0
LoZigo duvaucellilL. opaZescens
W = 0.043 (TL)3
Parameterunits
MLoo (cm)Woo (g)K (year-I)to (year)Z (=2M, year-I)BQ!B (% BWD)Rm (% BWD)Temp. (OC)
The brushtooth lizardfish Sauridaundosquamis (Synodontidae) is reported to reach"about 40 cm (and) to feed on bottom-feedinginvertebrates and fishes" (Abe and Pathansali1974).
The growth parameters of S. undosquamispopulation in the Visayan Sea, Philippines, wereestimated by Ingles and Pauly (1984) as FL
oo=
30.5 cm (TL = 33.7 cm) and K = 0.8 year-I. Thecorresponding estimate of to = -0.2 year. .
Data in SEAFDEC (1979) allowed estImatesof the length-weight relationship
which combined with the estimate of asymptoticlength, yields W~ = 1,646 g. From this, M = 1.35year-I, and hence, Z ::::: 2.7 year-I.
Data on the diel feeding pattern of S.undosquamis off Oman coast were presented byBudnichenko (1977). These data, reproduced hereas Table 9, suggest that S. undosquamis, likenumerous other piscivores, feeds mainly at duskand dawn (Hobson 1972).
Jarre et ale (1991) presented a method toanalyze such data. The presentation of theirmodel would require too much space for inclusionhere, and we refer therefore to their paper andthe accompanying software. Some of the resultsobtained from the analysis of Table 9 andpertaining to fishes with a mean standard lengthof 15 cm (=17.6 cm TL; 234 g) are:
• Start of first feeding period• End of first feeding period
03h48': 07h30' W ~ 0.031 (SL)3.042 •••26)
aReferred to as Sargocentron diadema in Dee and Radtke (1989).bConverted from total to fork length via a ratio of 1.14:1.
Fig. 2. Diurnal changes of stomach contents in lizardfish Saurida undosquamis off Aden; thedata points (from Budnichenko 1977), fitted with the model of Jarre et al. (1991), suggest thatthis fish feeds mainly at dusk and dawn. The estimate of daily ration is 2.43 g or 1.04% BWD(see text).
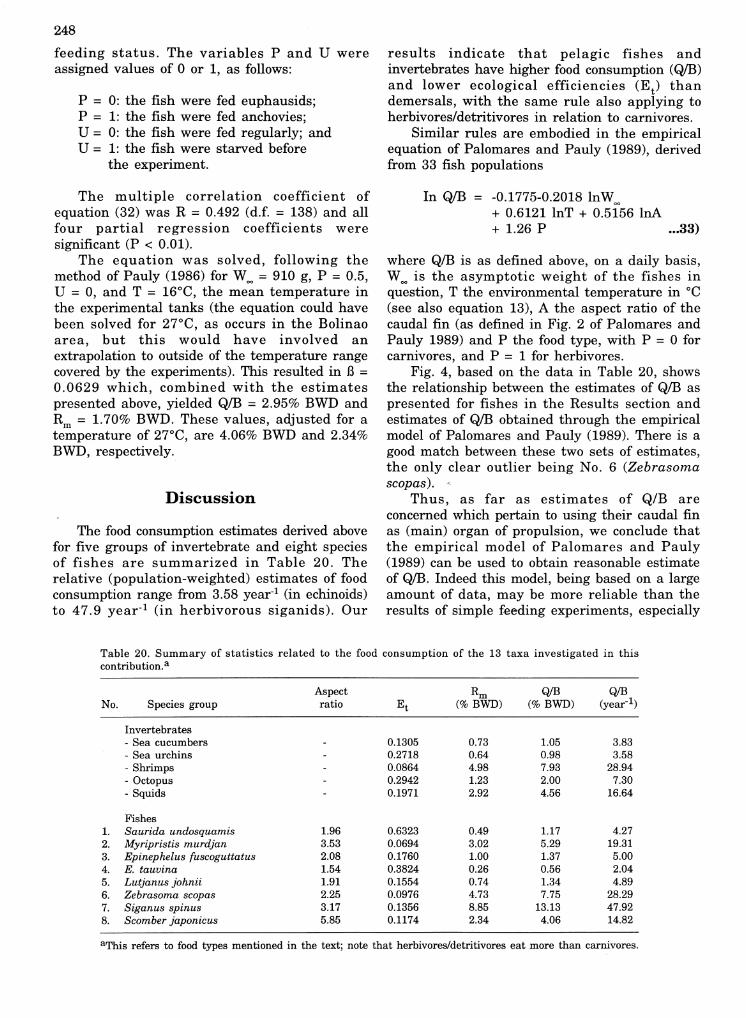
Mean W Increment Food intake KIa(g) (g) (g)
5.560 0.36 3.094 0.1165.835 0.35 3.982 0.0886.245 0.47 8.079 0.058
aOnly highest three of six KI values obtained.
Combining this with an estimate of Z ~ 2M =1.34 year-I leads to Q!B = 5.29% BWD and Rm =3.02% BWD.
Table 11. Partial results of aquarium growth experiments onMyripristis murdjan fed Neomysis integer.
Table 10. Published growth parameters of some soldierfish, ~~/ used to infer an approximate value of K inMyripristis murdjan.
FLoo KNo. Species (em) (year-I) <1>' Source
1. Holocentrus sciurus 40 0.26 2.62 Nicholson andHartsuijker (1983)
2. H. ascensionis 30 0.26 2.37 Nicholson andHartsuijker (1983)
3. H. diadema 14.7a 1.13 2.39 Pauly (1978), basedon Gundermann andPopper (1975)
4. H. rufus 23 0.29 2.19 Nicholson andHartsuijker (1983)
5. Holocentrus spp. 2.393 <1>' mean of Nos. 1-46. Myripristis amaena 21.5b 0.239 2.043 Dee and Radtke
(1989)7. M. murdjan 26.3 0.239 2.218 <1>' mean of Nos. 5
and 6
244
•0.4
en+-eQ)+- 0.3e0()
.c()
00.2E
0+-CJ)
e0 0.1Q)
~
0 I I I I I I I I I I I I04 06 08 10 12 14 16 18 20 22 24 02
Hour of the day
was used for the conversion of our estimate of TL= 30 cm (= 22.5 cm SL) because these twospecies have very similar shapes (Tinker 1978).This led to an estimate of Woo = 402 g, whichallowed estimation of M = 0.67 year-I.
Growth and food conversion experiments wereconducted at the IfM using six specimens of M.murdjan. These fishes yielded six positive valuesof Kl' of which the upper three, pertaining to theless stressed fish, are presented in Table 11,along with the weights of the fish from whichthey were derived. Combined with the estimateof Woo given above, these data led to an estimateof .B = 0.0216.

Epinephelus tauvina
Epinephelus fuscoguttatus
The greasy grouper Epinephelus tauvina(Serranidae), which mainly feeds on "bottomliving crustaceans and fishes," is reported toreach up to 150 cm (Chan et al. 1974). Availableestimates of asymptotic length are much lower,however, and their mean is 69 cm (Table 12).
The other growth parameter estimates usedhere are Woo = 4,135, estimated from W = 0.0151L2.96 (C. Pagdilao, unpubl. data), K = 0.145 year-1
(see Table 12) and to = -0.94.
where C = -log10(I-K1); W is the mean weight ofthe fish during each of the 14 growth incrementsused to derive the model; and R1 is the foodingested. Palomares and Pagdilao (1988) showedhow this model led, after some manipulations, toQ!B = 1.1% BWD, for Z ~ M = 0.44 year-I, as wellas to Rm = 0.8% BWD. Palomares and Pagdilao(1988) also performed some simulations showingthe dependence of Q/B on Z. From their Fig. 3,one can estimate, for Z ~ 2M, an approximatevalue of QIB = 5 year-I, or 1.37% BWD.
•••28)W = 0.007678L3.147
Body weight (g)aNo. Food type W· Wf W K11
1. "Formula I" 0.940 16.0 8.5 0.35312. "Formula 2" 0.887 16.6 8.8 0.36113. "Formula 3" 0.854 15.1 8.0 0.69694. Minced fish 0.953 11.0 6.0 0.25295. Sardinella 110.000 1,619.0 865.0 0.13166. Sardinella 730.00 2,349.0 1,540.0 0.19607. trash fish 129.00 248.0 188.5 0.20168. trash fish 195.00 395.0 295.0 0.12999. trash fish 266.00 411.0 338.5 0.1212
10. trash fish 789.00 1,080.0 934.5 0.2616
aWi = initial; Wf = final; W = mean.
derived from data in Druzhinin (1970).
245
Table 13 presents the results of three cagegrowth experiments with greasy groupers, forwhich we derived ten pairs of W, K1 data.
These data, together with the estimate of Wabove, lead to an estimate of B = 0.154 (see Fig~3). Combining this with Z ~ 2M = 0.78 year-1
yields an estimate of QIB = 0.56% BWD and Rm= 0.26% BWD.
Table 13. Weight and gross food conversion efficiency (K1) ofEpinephelus tauvina in three separate feeding experiments: 14, from Tanomkiat and Pimoljinda (1986); 5 and 6, fromSugama et al. (1986b); and 7-10, from Danakusumah et al.(unpubl. data).
John's snapper Lutjanus johnii (Lutjanidae) isreported to reach a maximum of 70 cm inSoutheast Asia and to feed on "bottom-livinginvertebrates and fishes" (Talbot and Chan 1974).Estimates of Loo and K were derived here fromlength-at-(relative)age data in Druzhinin (1970)for females and males separately, along withindirect estimates of to; means over both sexeswere computed directly to Looand to' andindirectly (via <1>') for K (Table 14). The meanvalue of L oo = 84.35 cm was converted to anestimate of Woo = 8,844 g using
Lutjanus johnii
•.•27)C = 0.2838 - 0.05188 log10W
- 0.00933 R1
The brown-marbled grouper Epinephelusfuscoguttatus (Serranidae) is reported to reach120 cm and to feed on ''bottom-living crustaceansand fishes" (Chan et ale 1974). The growthparameters for a Philippine population wereestimated, using a combination of original andcomparative data, as TLoo = 91.7 cm, Woo =12,338 g, K = 0.19 year-I, to = -0.66 year(Palomares and Pagdilao 1988).
Cage experiments conducted in Guiuan,Eastern Samar, Philippines, with E.fuscoguttatus fed chopped trash fish led to amultiple regression for predicting food conversionefficiency from weight and food ingested, andcorresponding to equation (7), of the form
Table 12. Growth parameters for Epinephelus tauvina.
Loo K(TL, cm) (year-I) ep' Source
36.0a 0.292 2.578 Loubens (1980)102.0 0.121 3.100 Mathews and Samuel (1985)
69.0b 0.145 2.839b (Means)
aFrom TL = 1.16 SL (Chan et al. 1974), SLoo = 30.7 cm.bMean values.
Table 14. Growth parameter estimates for Lutjanus johnii, asobtained from length-at-age data in Druzhinin (1970).
Loo K toSex (cm) (year-I) (year) $'
Males 94.00 0.122 -1.440 3.033Females 74.70 0.195 -0.678 3.037Means 84.35 0.152 -0.845 3.035

Table 15. Summary of growth and feeding data on Lutjanus FLoo Kjohnii, as obtained by Sugama et al. (1986a). Species (cm) (year-I) cj>'
Body weight (g)a Z. veliferum 25 0.330 2.31Ingested
W· Wf W food (g)b K11
145.0 206.2 175.6 442 0.1385 Z. scopas 19 0.876 2.50206.2 306.0 256.1 584 0.170930.6.0 472.0 389.0 814 0.2039472.0 601.3 536.6 1,102 0.1173601.3 752.8 677.0 1,200 0.1262752.8 915.0 833.9 1,286 0.1261915.0 1,128.0 1,021.5 1,661 0.1282
Z. scopas 20 0.628 2.40
246
•••29)
Source/remarks
Intermediate valuesused in this study
Dalzell (1989) settingLmax z Loo ' and usingthe mean cj>' of allacanthurids for whichhe had growthestimates
From R. Withrow,Waikiki Aquarium,Hawaii, pers. comm.to Dalzell (1989)
W = 0.123 · FL2.41
Fig. 3. Relationship between food conversionefficiency (K1) and body weight (g·ww) in greasygrouper Epinephelus tauvina, as used to estimatethe parameter ~ = 0.154. Dotted lines represents aType I linear regression; solid line is forcedthrough mean of x, y values and external estimateof asymptotic weight (based on data in Table 13;see text).
from which W was estimated as 168 g; thisleads to M = 1.38 year-I.
The estimate of TLoo
= 20 cm, combined withthe estimate of K, allows the estimation of to =-0.285 year.
Dalzell (1989) derived for Z. scopas thelength-weight relationship
Table 16. Preliminary growth parameter estimates in twospecies of Zebrasoma.
average growth parameters in acanthurids, and(2) growth parameter estimates reported from therelated Z. veliferum and a set value of L
oo(Table
16).
•
I Woo=4,135; f3 =0. 154 1
•
Body weight (g)
0.1
'Y.-I 0.5
-""0(j)-
.QI
0.6
~()c(1)
~ 0.3'+(1)
co.~ 0.2
~co()
-0
~
aWi = initial; Wf = final; W = mean.bSardinella spp. fed twice daily to satiation.
The blue-line sailfin-tang Zebrasoma scopas(Acanthuridae), of which Z. flavescens is acommonly used synonym, is reported to feed,near Okinawa, on filamentous microalgae (Sanoet ale 1984). Direct estimates of growthparameters for this fish, which reaches about 20cm, do not appear to have been published.
Following an initial attempt by Dalzell (1989),we estimated a value of K for Z. scopas from (1)
The results of the floating cage growth andfeeding experiments used here to obtain W, K1data are summarized in Table 15.
They lead to an estimate of B = 0.0535which, combined with Z ~ 0.76 year-I, yields QIB= 1.34% BWD, and Rm = 0.74% BWD.
Zebrasoma scopas
247Table 18. Daily ration for Siganus spinus,adapted from Bryan (1975).
aThe ratio FL:TL is 1:1.06.
The food conversion experiments conductedwith two specimens of Z. scopas (at the IfM)yielded very variable results, including negativegrowth and conversion efficiencies. Table 17presents the few positive growth increments thatwere obtained.
Table 17. Food conversion efficiency of an aquarium-heldspecimen of Zebrasoma scopas. The food was almostexclusively mysids; some algae were provided to balance thefood, but their energetic contribution can be neglected.
Mean fish weight Growth Foodduring increment increments ingested (g)
(g) (g) (g) KI
21.2 1.55 11.4 0.13622.0 1.71 43.3 0.039
Forka
length (cm)
5.15.25.45.9
10.711.411.912.313.113.214.0
Weight(g)
1.912.032.282.99
18.5922.5825.7628.5234.6035.4242.44
Assimilation(% of body
carbon day-I)
476027
92011
739
68
24
Table 19. Selected sets of growth parameters of Scomberjaponicus. a
The value of B derived from these data is0.0453.
From this, the growth parameters derivedabove and Z ~ 2M = 2.76 year-I, we obtain QIB =7.75% BWD and Rm = 4.73% BWD.
Siganus spinus
FLoo (cm) K (year-I) <1>' Location
46.4 0.400 2.935 Japanese waters45.5 0.340 2.848 Northwest Pacific44.0 0.441 2.931 Northwest Pacific,
Russian waters45.3a 0.391 2.905 Means
aFrom Pauly (1978).
Scomber japonicus
The Japanese mackerel, which occurs in thePhilippines (see Herre 1953), where it is listedunder the synonym Pneumatophorus japonicus, isa zooplanktivore and piscivore, of which growthparameters are given in Table 19.
The little spinefoot Siganus spinus(Siganidae) which reaches a length of 20 cm isreported to "browse on a wide range of bottomalgae" (Woodland 1984).
Pauly (1978), based on Horstmann (1975),estimated for this fish TLoo = 24.4 cm, K = 2.32year-I and to = -0.21 year. The length-weightrelationship
•••32)
...31)
C = 0.0145 - 0.0843 loglOW+ 0.1111 logloT + 0.0754P+ 0.0344U
W = 0.00979 FL3
where C = -logIO(l-KI), W the mean weight of thefish (in g) within a growth interval, T the watertemperature (in °C), p the food type and U the
and hence, given FLoo = 45.3 cm, Woo = 910 g.The empirical equations in the Methods sectionallowed, further, the estimation of to = -0.36 yearand Z ~ 2M = 1.74 year-I .
The food conversion data used here forestimating the food consumption of S. japonicusstem from Hatanaka and Takahashi (1956) andHatanaka et al. (1957) who maintained their fishon a diet of either anchovies or euphausids.
The food conversion efficiencies werecomputed for each weight 'group; the temperature,food type and feeding status were tabulated; and amultiple regression was derived which had theform
Data in Frey (1936) allow computation of thelength-weight relationship
•••30)W = 0.012 TL3.o77
presented by von Westernhagen and Rosenthal(1976) allows estimation of Woo = 234 g. Theestimate of Z ~ 2M used here is 6.5 year-I.
Daily ration estimates for S. spinus in Guam(in % body carbon day-I) are available (Table 18).
From these data, an estimate of B = 0.07 isobtained which, when combined with the aboveparameters, yielded QIB = 13.13% BWD and Rm= 8.85% BWD.
•
results indicate that pelagic fishes andinvertebrates have higher food consumption (QIB)and lower ecological efficiencies (Et ) thandemersals, with the same rule also applying toherbivores/detritivores in relation to carnivores.
Similar rules are embodied in the empiricalequation of Palomares and Pauly (1989), derivedfrom 33 fish populations
In QIB = -0.1775-0.2018 InWoo+ 0.6121 InT + 0.5156 InA+ 1.26 P ...33)
where Q/B is as defined above, on a daily basis,Woo is the asymptotic weight of the fishes inquestion, T the environmental temperature in °C(see also equation 13), A the aspect ratio of thecaudal fin (as defined in Fig. 2 of Palomares andPauly 1989) and P the food type, with P = 0 forcarnivores, and P = 1 for herbivores.
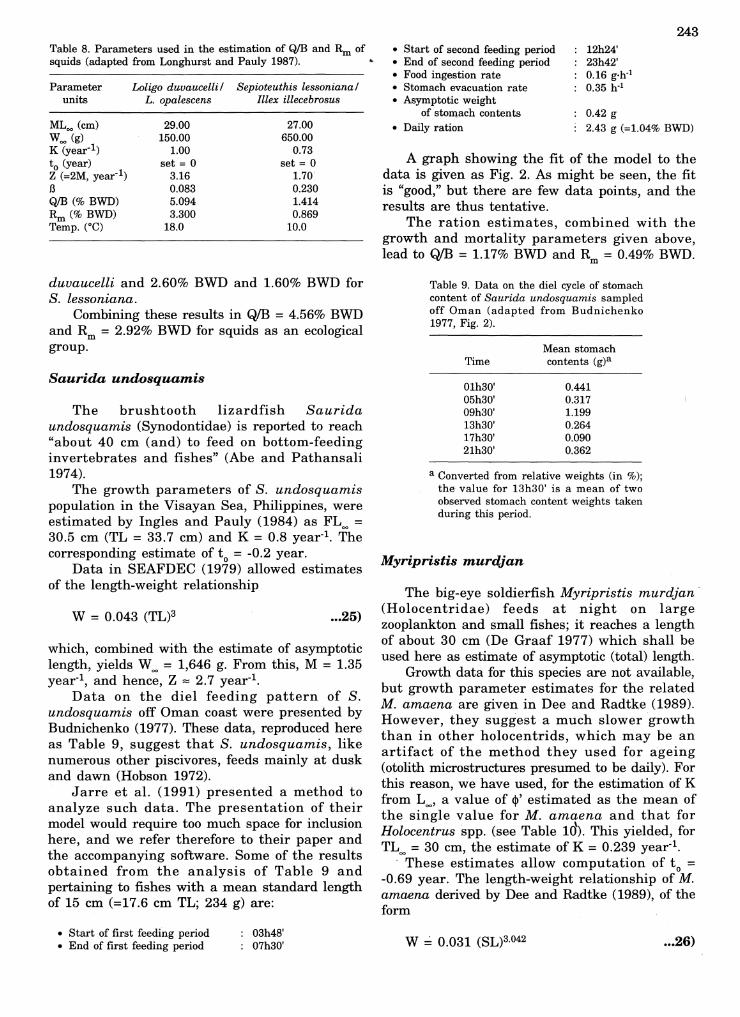
Fig. 4, based on the data in Table 20, showsthe relationship between the estimates of Q/B aspresented for fishes in the Results section andestimates of QIB obtained through the empiricalmodel of Palomares and Pauly (1989). There is agood match between these two sets of estimates,the only clear outlier being No.6 (Zebrasomascopas).
Thus, as far as estimates of Q/Bareconcerned which pertain to using their caudal finas (main) organ of propulsion, we conclude thatthe empirical model of Palomares and Pauly(1989) can be used to obtain reasonable estimateof QIB. Indeed this model, being based on a largeamount of data, may be more reliable than theresults of simple fee-ding experiments, especially
•Table 20. Summary of statistics related to the food consumption of the 13 taxa investigated in thiscontribution.a •
Aspect Rm QIB QIBNo. Species group ratio Et (% BWD) (% BWD) (year-I)
Invertebrates •- Sea cucumbers 0.1305 0.73 1.05 3.83- Sea urchins 0.2718 0.64 0.98 3.58 •- Shrimps 0.0864 4.98 7.93 28.94- Octopus 0.2942 1.23 2.00 7.30 •- Squids 0.1971 2.92 4.56 16.64
tFishes
1. Saurida undosquamis 1.96 0.6323 0.49 1.17 4.27 •2. Myripristis murdjan 3.53 0.0694 3.02 5.29 19.313. Epinephelus fuscoguttatus 2.08 0.1760 1.00 1.37 5.00 •4. E. tauvina 1.54 0.3824 0.26 0.56 2.045. Lutjanus johnii 1.91 0.1554 0.74 1.34 4.896. Zebrasoma scopas 2.25 0.0976 4.73 7.75 28.297. Siganus spinus 3.17 0.1356 8.85 13.13 47.928. Scomber japonicus 5.85 0.1174 2.34 4.06 14.82
Discussion
feeding status. The variables P and U wereassigned values of 0 or 1, as follows:
aThis refers to food types mentioned in the text; note that herbivores/detritivores eat more than carnivores.
The multiple correlation coefficient ofequation (32) was R = 0.492 (d.f. = 138) and allfour partial regression coefficients weresignificant (P < 0.01).
The equation was solved, following themethod of Pauly (1986) for Woo = 910 g, P = 0.5,U = 0, and T = 16°C, the mean temperature inthe experimental tanks (the equation could havebeen solved for 27°C, as occurs in the Bolinaoarea, but this would have involved anextrapolation to outside of the temperature rangecovered by the experiments). This resulted in B =0.0629 which, combined with the estimatespresented above, yielded Q/B = 2.95% BWD andRm = 1.70% BWD. These values, adjusted for atemperature of 27°C, are 4.06% BWD and 2.34%BWD, respectively.
P = 0: the fish were fed euphausids;P = 1: the fish were fed anchovies;U = 0: the fish were fed regularly; andU = 1: the fish were starved before
the experiment.
248
The food consumption estimates derived abovefor five groups of invertebrate and eight speciesof fishes are summarized in Table 20. Therelative (population-weighted) estimates of foodconsumption range from 3.58 year-I (in echinoids)to 47.9 year- I (in herbivorous siganids). Our

Fig. 4. Plot of the estimated food consumption (QIB) of the fishes in Table 20 vs. QIBvalues obtained through the empirical model of Palomares and Pauly (1989).
249
Aprieto, V.L. and E.P. Villoso. 1982. Demersal fish resources ofLingayen Gulf. Fish. Res. J. Philipp. 7(2): 39-48.
Balgos, M.C. 1990. Age and growth of the squid Sepioteuthislessoniana Lesson, 1830 in Bolinao, Pangasinan bystatolith observation and length frequency analysis.University of the Philippines, Diliman, Quezon City. 78 p.M.S. thesis.
Boyle, P.R., editor. 1987. Cephalopod life cycles. Vol. II.Academic Press, London.
Bryan, P.G. 1975. Food habits, functional digestive morphologyand assimilation efficiency of the rabbitfish Siganusspinus (Pisces, Siganidae) on Guam. Pac. Sci. 29(3): 269277.
Budnichenko, V.A. 1977. The feeding of Saurida undosquamisand Saurida tumbil (Synodontidae) along the OmanCoast. J. Ichthyol. 14(2): 267-272.
Calumpong, H.P. 1979. Some aspects of the ecology of the seahare, Dolabella auricularia (Lightfoot) in Central Visayas,Philippines. Silliman J. 26(2&4):134-146.
Carefoot, T.H. 1967. Growth and nutrition of three species ofopisthobranch molluscs. Compo Biochem. Physiol. 21: 627652..
Chan, W., D. Carlsson and N. Lohakarn. 1974. Serranidae. InW. Fischer and P.J.P. Whitehead (eds.) FAO speciesidentification sheets for fishery purposes. Eastern IndianOcean (Fishing area 57) and Western Central Pacific(Fishing area 71). Vol. IV. FAO, Rome.
Conand, C. 1989. Les holothuries aspidochirotes du lagon deNouvelle-Caledonie. Institut Fran~ais de RechercheScientifique pour Ie Developpment en Cooperation,Editions de l'ORSTOM. 393 p.
Dalzell, P. 1989. The biology of surgeonfishes (Family:Acanthuridae) with particular emphasis on Acanthurusnigricauda and A. xanthopterus from Northern PapuaNew Guinea. Department of Biology, University ofNewcastle upon Tyne, United Kingdom. M.Phil. thesis.
Dee, A.J. and R.L. Radtke. 1989. Age and growth of the bricksoldierfish Myripristis amaena. Coral Reefs 8: 79-85.
De Graaf, F. 1977. Tropische Zierfische imMeerwasseraquarium. Verlag J. Meumann-Neudamm,Melsungen. 468 p.
5 I4
3
coE.~E::J(J)c8 20'UoJ2'0 10~aE+=(J)
W Ol.-.-----~---_.....L-----~-----L.-..-------J
10 20 30 40 50
Food consumption predicted byempirical model (QIB j year-I)
...:- 50IL-aQ)>.
~40o
References
Abe, T. and D. Pathansali. 1974. Synodontidae. In W. Fischerand P.J.P. Whitehead (eds.) FAO species identificationsheets for fishery purposes. Eastern Indian Ocean(Fishing area 57) and Western Central Pacific (Fishingarea 71). Vol. IV. FAO, Rome.
for active,easilystressed fishes such as Z.scopas, Dascyllus trimaculatus (Palomares 1987)or Holacanthus bermudensis (Menzel 1958).
The invertebrate groups in Table 20 do notrepresent all groups, or even the major groups in terms of energy throughput - of coral reefecosystems such as those near Bolinao. Thus, itwill be necessary, when constructing a model ofsuch reef, to consider the metabolic requirementsof several taxa not considered here. An exampleof such group, to which the methodologypresented above would be particularly applicable,are the sea hare (Family Aplysiidae), whosegrowth and mortality were reported upon byPauly and Calumpong (1984), and whose feedingand general biology were studied by Carefoot(1967), Calumpong (1979), Kandel (1979) andothers.
On the long run, however, empiricalrelationships linking Q/B and other rates, and/orwith their shape will be required for majormarine invertebrate groups, if coral reefmodelling is to advance more rapidly than hashitherto been the case.
•
•
•
•
•
250
Downing, N. and C.R. EI-Zahr. 1987. Gut evacuation and fillingrates in the rock-boring sea urchin, Echinometra mathaei.Bull. Mar. Sci. 41(2): 579-584.
Druzhinin, A.D. 1970. The range and biology of snappers (Fam.Lutjanidae). J. Ichthyol. 10(6): 717-735.
Ebert, T.A. 1975. Growth and mortality of post-larval echinoids.Am. Zool. 15: 755-775.
Ebert, T.A. 1982. Longevity, life history, and relative body wallsize in sea urchins. Ecol. Monogr. 52(4): 353-394.
Elliott, J.M. and L. Persson. 1978. The estimation of daily ratesof food consumption for fish. J. Anim. Ecol. 47: 977-991.
Espinosa, J. 1991. Aspects of the feeding biology of juveniles ofthe white-spotted spinefoot, Siganus fuscescens. MarineScience Institute, University of the Philippines, QuezonCity. M.S. thesis.
Frey, D.H. 1936. A preliminary summary of the life history ofthe Pacific mackerel. Calif. Fish Game 22(1):30-39.
Gaschiitz, G., D. Pauly and N. David. 1980. A versatile BASICprogram for fitting weight and seasonally oscillatinglength growth data. ICES CM 1980/D:6. Statistics Cttee.14 p.
Gayanilo, F.C., M. Soriano and D. Pauly. 1989. A draft guideto the compleat ELEFAN. ICLARM Software 2, 67 p.
George, D. and J. George. 1979. Marine life: an illustratedencyclopedia of invertebrates in the sea. John Wiley, NewYork. 288 p.
Guerra, A. 1979. Fitting a von Bertalanffy expression toOctopus vulgaris growth. Invest. Pesq. 43(1): 319-326.
Gundermann, N. and D. Popper. 1975. Some aspects ofrecolonization of coral rock in Eilat (Gulf of Aqaba) by fishpopulations after poisoning. Mar. BioI. 33: 109-117.
Hatanaka, M. and M. Takahashi. 1956. Utilization of food bymackerel Pneumatophorus japonicus (Houttuyn). TokohuJ. Agric. Res. 7(1): 51-57.
Hatanaka, M., K. Sekino, M. Takahashi and T. Ichimura. 1957.Growth and food consumption in young mackerel,Pneumatophorus japonicus (Houttuyn). Tohoku J. Agric.Res. 7(4): 351-368.
Hernandez, H.B., P.M. Alino and A. Jarre. 1990. The dailyfood consumption of Siganus fuscescens, an importantherbivore in seagrass communities at Bolinao, PangasinanProvince, Philippines. ICES CM 1990/G:16. 10 p.
Herre, A.W. 1953. Checklist of Philippine fishes. Res. Rep. 20.977 p. U.S. Fish and Wildlife Service.
Hobson, E.S. 1972. Activity of Hawaiian reef fishes during theevening and morning transitions between daylight anddarkness. U.S. Fish. Bull. 70(3): 715-740.
Holthuis, L.B. 1980. Shrimps and prawns of the world. FAOspecies catalogue. Vol. I. 271 p.
Horstmann, U. 1975. Some aspects of the mariculture ofdifferent siganid species in the Philippines. Philipp. Sci.12: 5-20.
Ingles, J. and D. Pauly. 1984. An atlas of the growth, mortalitya;nd recruitment of Philippine fishes. ICLARM Tech. Rep.13, 127 p.
Ivlev, V.S. 1961. Experimental ecology of fishes. New Haven,Yale University Press. 301 p.
Jarre, A., M.L. Palomares, M.L. Soriano, V.C. Sambilay, Jr. andD. Pauly. 1991. Some new analytical and comparativemethods for estimating the food consumption of fish. ICESMar. Sci. Symp. 193: 99-108.
Kandel, E.R. 1979. Behavioral biology of Aplysia. W.H.Freeman, San Francisco. 463 p.
Kato, S. and S.C. Schroeter. 1985. Biology of the red seaurchin Strongylocentrotus franciscanus and its fishery inCalifornia. Mar. Fish. Rev. 47(3): 1-20.
Longhurst, A.R. and D. Pauly. 1987. Ecology of tropical oceans.Academic Press, San Diego, California.
Loubens, G. 1980. Biologie de quelques especes de poissons dulagon neo-caledonien. III. Croissance. Cah. Indo-Pac. 2(2):101-153.
Mangold, K. and S.V. Boletzky. 1973. New data onreproductive biology and growth of Octopus vulgaris. Mar.BioI. 19: 7-12.
Mann, K.H. 1978. Estimating the food consumption of fish innature, p. 250-273. In S.D. Gerking (ed.) Ecology offreshwater fish production. Blackwell ScientificPublications, Oxford. 520 p.
Mathews, C.P. and M. Samuel. 1985. Stock assessment andmanagement of newaiby, hamoor and hamra in Kuwait, p.67-115. In C.P. Mathews (ed.) Final Report - Proceedingsof the 1984 Shrimp and Fin Fisheries ManagementWorkshop. Kuwait Institute for Scientific Research,Kuwait, MB-51. 200 p.
Menzel, D.W. 1958. Utilization of algae for growth by theangelfish Holacanthus bermudensis. J. Cons. ClEM 24:308-313.
Mines, A.N. 1986. An assessment of the fisheries of LingayenGulf. PCARRDINSTA-UPV Program. College of Fisheries,University of the Philippines in the Visayas.
Nicholson, W. and L. Hartsuijker. 1983. The state of thefisheries resources of the Pedro Bank and South Jamaicashelf. FAO Fish. Rep. 278 (Suppl.): 215-254.
O'Dor, R.K. and M.J. Wells. 1987. Energy and nutrient flow, p.109-133. In Cephalopod life cycles. Vol II. Academic Press,London.
Olson, R.J. and A.J. Mullen. 1986. Recent developments formaking gastric evacuation and daily rationdeterminations. Environ. BioI. Fish. 16(1-3): 183-191.
Palomares, M.L.D. 1987. Comparative studies on the foodconsumption of marine fishes with emphasis on speciesoccurring in the Philippines. Institute of Biology,University of the Philippines, Quezon City. M.S. thesis.
Palomares, M.L.D. and C.R. Pagdilao. 1988. Estimating thefood consumption per unit biomass of a population ofEpinephelus fuscoguttatus (Pisces: Serranidae), p. 432-442.In S.C. Venema, J.M. Christensen and D. Pauly (eds.)Contributions to tropical fisheries biology. FAG Fish. Rep.No. 389. 519 p.
Palomares, M.L. and D. Pauly. 1989. A multiple regressionmodel for predicting the food consumption of marine fishpopulations. Aust. J. Mar. Freshwat. Res. 40: 259-273.
Pauly, D. 1978. A preliminary compilation of fish lengthgrowth parameters. Ber. Inst. Meereskd. ChristianAlbrechts-Univ. Kiel. 55. 200 p.
Pauly, D. 1979. Theory and management of tropicalmultispecies stocks: a review with emphasis on thesoutheast Asian demersal fisheries. ICLARM Stud. Rev. 1,35 p.
Pauly, D. 1980. On the interrelationships between naturalmortality, growth parameters and mean environmentaltemperature in 175 fish stocks. J. Cons. ClEM 39(3): 175192.
Pauly, D. 1984. Fish population dynamics in tropical waters: amanual for use with programmable calculators. ICLARMStud. Rev. 8, 325 p. .
Pauly, D. 1986. A simple method for estimating the foodconsumption of fish populations from growth data andfood conversion experiments. U.S. Fish. Bull. 84(4): 827840.
Pauly, D. and H. Calumpong. 1984. Growth, reproduction andmortality of the sea hare Dolabella auricularia(Gastropoda: Aplysiidae) in the Central Visayas,Philippines. Mar. BioI. 79: 289-293.
Pauly, D. and J.L. Munro. 1984. Once more on growthcomparison in fish and invertebrates. Fishbyte 2(1): 21.
Pauly, D., J. Ingles and R. Neal. 1984. Application to shrimpstocks of objective methods for the estimation of growth,mortality and recruitment-related parameters from lengthfrequency data (ELEFAN I and II), p. 220-234. In J.A.Gulland and B.J. Rothschild (eds.). Penaeid shrimps their biology and management. Fishing News Books,Farnham, Surrey, England. 308 p.
Pinto, L. 1982. Gut content and food consumption of someechinoderms at Talin Bay, Batangas, Philippines.Kalikasan, Philipp. J. BioI. 11(2-3): 302-308.
Polovina, J.J. 1984. Model of a coral reef ecosystem. Part I: theECOPATH model and its application to French FrigateShoals. Coral Reefs 3: 1-11.
Ramadhas, V. and S. Vijayaraghavan. 1979. Efficiency ofenergy utilization in the shrimp, Metapenaeus monocerosfed mangrove leaves. Indian J. Mar. Sci. 8: 114-115.
Reyes-Leonardo, L.D. 1984. A taxonomic report of shallowwater holothurians of Calatagan, Batangas. Philipp. J. Sci.113(3-4): 137.
Roper, C.F.E., M.J. Sweeney and C.E. Nauen. 1984. FAaspecies catalogue. Vol. 3. Cephalopods of the world. Anannotated and illustrated catalogue of species of interestto fisheries. FAa Fish. Synop. (125). 277 p.
Royan, J.P., S. Vijayaraghavan and M.V.M Wafar. 1977. Foodconversion efficiency in the shrimp Metapenaeusmonoceros (Fabricius) fed on different foods. Indian J.Mar. Sci. 6: 100-102.
Sainsbury, K.J. 1986. Estimation of food consumption fromfield observations of fish feeding cycles. J. Fish BioI. 29:23-36.
Sambilay, V.C., M.L. Palomares, S. Opitz and D. Pauly. 1992.Toward modelling a coral reef ecosystem: relative foodconsumption estimates for some Bolinao reef fishes,Pangasinan, Philippines, p. 215-233 In A. Alcala and L.T.McManus (eds.) Proceedings of the first NationalSymposium in Marine Science, 16-18 May 1990. Bolinao,Pangasinan, Philippines. Marine Science Institute,University of the Philippines, Quezon City.
Sano, M., M. Shimizu and Y. Nose. 1984. Food habits ofTeleostean reef fishes in Okinawa Island, southern Japan.Univ. Mus. Univ. Tokyo Bull. (25). Vol. 7. 128 p.
SEAFDEC. 1979. Marine Fisheries Research Departmentannual report. Southeast Asian Fisheries DevelopmentCenter, Singapore. 31 p.
·Shelley, C. 1985. Growth of Actinopyga echinites andHolothuria scabra (Holothuriidea: Echinodermata) andtheir fisheries potential (as beche-de-mer) in Papua NewGuinea, p. 297-302. In Proceedings of the FifthInternational Coral Reef Congress.
Silvert, W. and D. Pauly. 1987. On the compatibility of a newexpression for gross conversion efficiency with the vonBertalanffy growth equation. U.S. Fish. Bull. 85(1): 139140.
Sugama, K., H. Tanaka and H. Eda. 1986a. Preliminary studyon rearing of golden snapper, Lutjanus johnii in the
251floating net-cage, p. 201-208. In Final Report ofMariculture Research and Development Proj ect,Bojonegara-Serang Research Station, Indonesia.
Sugama, K., Waspada and H. Tanaka. 1986b. Perbandinganlaju pertumbuha beberapa jenis ikan kerapu Epinephelusspp. dalam kurung-kurung apung [Growth comparison ofsome species of groupers, Epinephelus spp. cultured infloating net-cages], p. 211-219. In Final Report ofMariculture Research and Development Project,Bojonegara-Serang Research Station, Indonesia.
Talbot, F. and W. Chan. 1974. Lutjanidae. In W. Fischer andP.J.P. Whitehead (eds.) FAa species identification sheetsfor fishery purposes. Eastern Indian Ocean (Fishing area57) and Western Central Pacific (Fishing area 71). Vol. II.FAa, Rome.
Tanomkiat, T. and T. Pimoljinda. 1986. Experiments onnursing brown spotted grouper (Epinephelus tauvinaForskal) fed with artificial diets in various levels andminced fish. Thai Fish. Gaz. 39(6):603-614.
Tertsching, W.P. 1989. Diel activity patterns and foragingdynamics of the sea urchin Tripneustes ventricosus, in atropical seagrass community and a reef environment(Virgin Islands). Mar. Ecol. 10(1): 3-21.
Tinker, S.W. 1978. Fishes of Hawaii. Hawaiian Service, Inc.,Honolulu. 532 p.
Vijayaraghavan, S., L.K. Kumari and J.P. Royan. 1988. Foodconversion by Penaeus monodon (Fabricius) fed ondecapsulated cysts of Artemia. Indian J. Mar. Sci. 17: 172173.
Vijayaraghavan, S., M.V.M. Wafar and J.P. Royan. 1978.Feeding experiments with the shrimps Metapenaeusmonoceros (Fabricius). Indian J. Mar. Sci. 7: 195-197.
von Westernhagen, H. and H. Rosenthal. 1976. Some aspects ofthe suitability of various Philippine siganid species(Siganidae) for mariculture. Aquaculture 9: 297-311.
Winberg, G.G. and A. Duncan. 1971. Methods for theestimation of production of aquatic animals. AcademicPress, New York. 175 p.
Windell, J.T. 1978. Estimating food consumption rates of fishpopulations, p. 227-254. In T. Bagenal (ed.) Methods forthe assessment of fish production in fresh waters. IBPHandbook No.3. Blackwell Scientific Publication, Oxford.
Woodland, D.J. 1984. Siganidae. In W. Fischer and G. Bianchi(eds.) FAa species identification sheets for fisherypurposes. Western Indian Ocean (Fishing Area 51). Vol IV.FAa, Rome.