Estimated atmospheric emissions from biodiesel and ... · Estimated atmospheric emissions from...
13
An Acad Bras Cienc (2012) 84 (3) Estimated atmospheric emissions from biodiesel and characterization of pollutants in the metropolitan area of Porto Alegre-RS ELBA C. TEIXEIRA, CAMILA D.P. MATTIUZI, SABRINA FELTES, FLAVIO WIEGAND and EDUARDO R.R. SANTANA Fundação Estadual de Proteção Ambiental Henrique Luis Roessler, Rua Carlos Chagas, 55/802 90030-020 Porto Alegre, RS, Brasil Manuscript received on July 7, 2010; accepted for publication on November 29, 2011 ABSTRACT The purpose of the present study was to estimate emissions of some pollutants (CO, NO X , HC, SO X , and PM) in diesel fleet due to the addition of biodiesel in different blends, as well as to assess atmospheric pollutant concentrations in the metropolitan area of Porto Alegre (MAPA). The methodology was based on inventories from mobile sources based on US EPA’s technical report. Regarding air quality the following parameters were determined: PM 10 , PM 2.5 , CO, NO X , O 3 , SO 2 , HC and PAHs. The results showed a decrease for emissions PM, CO, and HC, and a slight increase for NO X . The characterization of atmospheric pollutants in the metropolitan area of Porto Alegre showed that they are influenced by mobile sources, particularly diesel vehicles. The diagnosis of ratios analysis that was applied to facilitate the identification of sources of PAHs, indicated an influence of diesel oil. Key words: air quality, biodiesel, diesel, emissions. Correspondence to: Elba Calesso Teixeira E-mail: [email protected] INTRODUCTION The worldwide expansion of the number of vehicles on the roads has been responsible for the increase in pollutant emissions into the atmosphere, thus frequently contributing to worsening air quality, particularly in large urban areas. Vehicular emissions are one of the major primary sources of fine particles emission, and they might be responsible for approximately 15-50% of the total aerosol mass in urban areas (Sheesley et al. 2007 and references therein). Emissions from diesel engines are chemically complex and contain hundreds of chemical substances divided into gaseous and particulates phases. These emissions contain more particles than those from gasoline engines, with polycyclic aromatic hydrocarbons (PAHs) being their major organic compound (Desantes et al. 2005, Maricq 2007, Phuleria et al. 2007, Ravindra et al. 2008). Particle size from diesel engines ranges between 20-130 nm, and between 20-60 nm when derived from gasoline engines (Harris and Maricq 2001, Ristovski et al. 2006). The use of alternative fuels, such as biodiesel, is being widely discussed in several countries due to an increased environmental awareness and higher petrodiesel prices. Currently, many countries use biodiesel and petrodiesel blends in their cars, e.g. USA, Japan, Brazil, India, and others. Anais da Academia Brasileira de Ciências (2012) 84(3): 655-667 (Annals of the Brazilian Academy of Sciences) Printed version ISSN 0001-3765 / Online version ISSN 1678-2690 www.scielo.br/aabc
Transcript of Estimated atmospheric emissions from biodiesel and ... · Estimated atmospheric emissions from...
An Acad Bras Cienc (2012) 84 (3)
Estimated atmospheric emissions from biodiesel and characterization of pollutants in the metropolitan area of Porto Alegre-RS
ELBA C. TEIXEIRA, CAMILA D.P. MATTIUZI, SABRINA FELTES, FLAVIO WIEGAND and EDUARDO R.R. SANTANA
Fundação Estadual de Proteção Ambiental Henrique Luis Roessler, Rua Carlos Chagas, 55/802 90030-020 Porto Alegre, RS, Brasil
Manuscript received on July 7, 2010; accepted for publication on November 29, 2011
ABSTRACTThe purpose of the present study was to estimate emissions of some pollutants (CO, NOX, HC, SOX, and PM) in diesel fleet due to the addition of biodiesel in different blends, as well as to assess atmospheric pollutant concentrations in the metropolitan area of Porto Alegre (MAPA). The methodology was based on inventories from mobile sources based on US EPA’s technical report. Regarding air quality the following parameters were determined: PM10, PM2.5, CO, NOX, O3, SO2, HC and PAHs. The results showed a decrease for emissions PM, CO, and HC, and a slight increase for NOX. The characterization of atmospheric pollutants in the metropolitan area of Porto Alegre showed that they are influenced by mobile sources, particularly diesel vehicles. The diagnosis of ratios analysis that was applied to facilitate the identification of sources of PAHs, indicated an influence of diesel oil.
Key words: air quality, biodiesel, diesel, emissions.
Correspondence to: Elba Calesso TeixeiraE-mail: [email protected]
INTRODUCTION
The worldwide expansion of the number of vehicles on the roads has been responsible for the increase in pollutant emissions into the atmosphere, thus frequently contributing to worsening air quality, particularly in large urban areas.
Vehicular emissions are one of the major primary sources of fine particles emission, and they might be responsible for approximately 15-50% of the total aerosol mass in urban areas (Sheesley et al. 2007 and references therein). Emissions from diesel engines are chemically complex and contain hundreds of chemical substances divided into gaseous
and parti culates phases. These emissions contain more particles than those from gasoline engines, with polycyclic aromatic hydrocarbons (PAHs) being their major organic compound (Desantes et al. 2005, Maricq 2007, Phuleria et al. 2007, Ravindra et al. 2008).
Particle size from diesel engines ranges between 20-130 nm, and between 20-60 nm when derived from gasoline engines (Harris and Maricq 2001, Ristovski et al. 2006).
The use of alternative fuels, such as biodiesel, is being widely discussed in several countries due to an increased environmental awareness and higher petrodiesel prices. Currently, many countries use biodiesel and petrodiesel blends in their cars, e.g. USA, Japan, Brazil, India, and others.
Anais da Academia Brasileira de Ciências (2012) 84(3): 655-667(Annals of the Brazilian Academy of Sciences)Printed version ISSN 0001-3765 / Online version ISSN 1678-2690www.scielo.br/aabc

An Acad Bras Cienc (2012) 84 (3)
656 ELBA C. TEIXEIRA et al.
Biodiesel might be used as a fuel alternative in diesel engines to improve combustion efficiency and reduce emissions of pollutants as hydrocarbons (HC), carbon monoxide (CO), sulfur oxides (SOx), and particulate matter (PM). Only the emissions of nitrogen oxides (NOx) show a handicap with regard to adding biodiesel to petroleum diesel, as this increases its emission levels (Wang et al. 2000, Monyem and Van Gerpen 2001, Cardone et al. 2002, Antolin et al. 2002, Durbin and Norbeck 2002, Beer et al. 2002, kalam et al. 2003, Dorado et al. 2003, kalligeros et al. 2003, Lin CH et al. 2006, Lin YC et al. 2006).
In Brazil, to comply with law 11.097/2005, the use of B2 blend, i.e. 2% biodiesel in petroleum diesel, is mandatory as of January 2008. In January 2010, this mandated level increased to 5% (B5). There is a further possibility of enforcing blends with higher levels or even 100% biodiesel (B100), pending authorization of Brazil's National Oil Agency (ANP).
The present study aims to estimate vehicle emissions of the pollutants CO, NOX, HC, SOX, and PM from the addition of biodiesel to diesel in several blends, as well as to assess atmospheric pollutant concentrations in the metropolitan area of Porto Alegre (MAPA), located in the state of Rio Grande do Sul, Brazil.
AREA OF STUDY
The area chosen for this study was the metropolitan area of Porto Alegre (MAPA), at 29°30’S – 30°30’S / 50°25’W – 51°55’W, in the east part of Rio Grande do Sul, located in the south of Brazil. With a total area of 9,800 km2, representing 3.76% of the total area of the state, it includes 31 counties, which are the most urbanized area of Rio Grande do Sul. The counties comprising the MAPA are: Alvorada, Araricá, Arroio dos Ratos, Cachoeirinha, Campo Bom, Canoas, Capela de Santana, Charqueadas, Dois Irmãos, Eldorado do Sul, Estância Velha, Esteio, Glorinha, Gravataí, Guaíba, Ivoti, Mon-tenegro, Nova Hartz, Nova Santa Rita, Novo Hamburgo,
Parobé, Portão, Porto Alegre, Santo Antônio da Patrulha, São Jerônimo, São Leopoldo, Sapiranga, Sapucaia do Sul, Taquara, Triunfo and Viamão.
The area is characterized by different industrial typologies, including several stationary sources such as the Alberto Pasqualini oil refinery, two steel mills (Siderúrgica Riograndense and Aços Finos Piratini), the petrochemical industrial complex, and two coal-fired power plants (Termochar and São Jerônimo). Despite the different industrial sources around Porto Alegre contributing to the total emissions, the major contributions come from an estimated 620,000 vehicles on the roads, representing 20% of the total 3.1 million vehicles of the state (Teixeira et al. 2008).
Due to its location, winter in the MAPA is strongly influenced by cold air masses migrating from polar regions. The seasons are well defined and the rain is evenly distributed all over the year. According to Köppen’s international system of climate classification, the area under study is a type Cfa, i.e. a humid subtropical climate with well-distributed rains all over the year and an average temperature above 22.0°C during the warmest month (Livi 1999). The prevailing wind directions are east (E), east southeast (ESE), and southeast (SE) (Livi 1999). During the day, wind reaches its lowest speed at dawn and early morning, and highest speed in the late afternoon, between 5-7 p.m. This pattern is related to energy availability at the surface (sensible heat) during the day, intensifying local and mesoscale atmospheric circulations. The prevailing wind results from interactions of mesoscale phenomena, especially sea/land breezes (from the Atlantic Ocean and the Patos Lagoon) and valley/mountain breezes (from the nearby Serra Geral mountains to the north of the MAPA).
METHODS
EMISSION ESTIMATION
The methodology used to estimate the atmospheric emissions in the MAPA was based on the United States Environmental Protection Agency’s methods

An Acad Bras Cienc (2012) 84 (3)
657ESTIMATED ATMOSPHERIC EMISSIONS FROM BIODIESEL
for vehicular emissions inventories (US EPA 2002). Atmospheric emission scenarios with biodiesel added to diesel in different blends - 0% (D100), 2% (B2), 5% (B5), 10% (B10) and 20% (B20) - were applied to the methodology for 2008 and 2010. This allowed a forecast of pollutant emissions, quantifi ed for carbon monoxide (CO), hydrocarbons (HC), sulfur oxides (SOX), nitrogen oxides (NOX), and particulate matter (PM) emissions.
The working method of the present study consisted of two steps:1. Data collecting and organization2. Intermediate calculations to generate the variables for the general equation (1).
E = pollutant emission rate (ton/year)Fe = pollutant emission factor (g/km)N= number of vehiclesC = fuel consumption (L/year)A = vehicle autonomy (km/L)
All steps of calculations were developed by using Microsoft Offi ce Excel software. Initially, the diesel fl eet was subdivided into two classes: trucks, vans and pickups, and buses and minibuses, with their corresponding values for kilometers driven and autonomy.
The fi rst step consisted of collecting data about the fl eet and fuel consumption of the 31 counties of the MAPA region, which was provided by the Traffi c Department of Rio Grande do Sul (DETRAN/RS) and the Brazilian Oil Agency (ANP), respectively.
The second step consisted of calculating the fuel consumption and the emission factor based on data provided by ANP and the Brazilian Institute of Geography and Statistics (IBGE), and by the São Paulo State Environmental Company (CETESB) and US EPA, respectively.
As it is not possible to affi rm that a vehicle refueling in a given county will circulate only within
that area, it may exist a signifi cant discrepancy between the volume of fuel given by ANP and the fuel volume used in the county. In order to obtain a more realistic fuel consumption profi le of that area, a weighting was done with respect to the urban and rural population of each county using statistical data from IBGE.
Emission factors are applied to calculate the estimated atmospheric emissions. In this study emission factors were provided by CETESB (CETESB 2008). These values are obtained in function of average speed, air temperature, and vehicle technology, amongst other variables. According to the Brazilian regulations, CETESB performs annual calculations of emission factors, which are then used as reference for all studies conducted in Brazil in this fi eld. In this study the emissions factors were adjusted with the numbers of diesel vehicles on the roads in 2008 and 2010 and their fuel consumption.
In the present study, the exponential correlation referring to the emission of biodiesel was taken into account (Figure 1). Calculation adjustment to biodiesel was done by applying equation 2 added of the values of coeffi cient "a" (Table I) and, by considering variables "b" to be close to null, transforming the second term in a unit value. This equation considers the percentage of the biodiesel blend, and it was obtained on US EPA’s technical reports. (US EPA 2002).
year-modelEpollutant, year = Σ (Fe x N x C x A x 10-6) (1)
Fig. 1 - Average pollutant emissions at different biodiesel blends in diesel engines (US EPA 2002).
An Acad Bras Cienc (2012) 84 (3)
658 ELBA C. TEIXEIRA et al.
Epolluant, year = exp [a x (vol%iodiesel)] x exp b (2)
AIR QUALITY
The following locations within the MAPA were chosen for sampling the atmospheric pollutants: Porto Alegre, Canoas, Esteio and Sapucaia do Sul.
Coeffi cient “a”NOX 0.0009794PM -0.006384HC -0.011195CO -0.006561
TABLE IValues of coeffi cient "a".
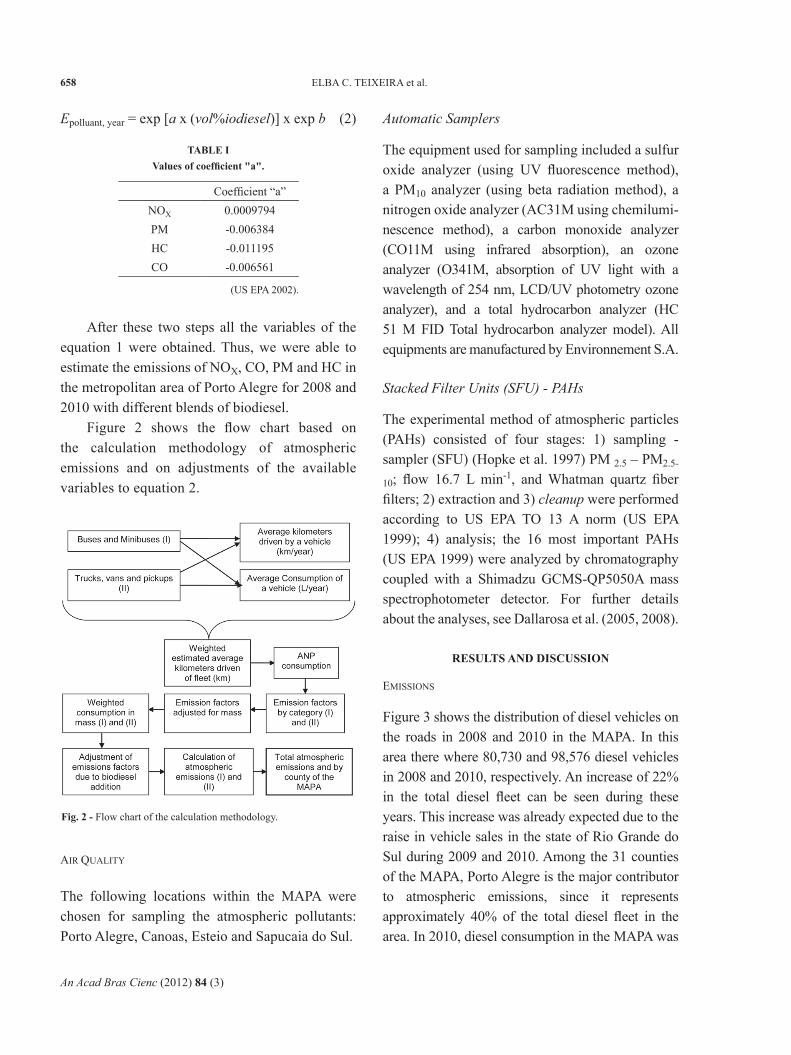
Fig. 2 - Flow chart of the calculation methodology.
After these two steps all the variables of the equation 1 were obtained. Thus, we were able to estimate the emissions of NOX, CO, PM and HC in the metropolitan area of Porto Alegre for 2008 and 2010 with different blends of biodiesel.
Figure 2 shows the fl ow chart based on the calculation methodology of atmospheric emissions and on adjustments of the available variables to equation 2.
(US EPA 2002).
Automatic Samplers
The equipment used for sampling included a sulfur oxide analyzer (using UV fl uorescence method), a PM10 analyzer (using beta radiation method), a nitrogen oxide analyzer (AC31M using chemilumi-nescence method), a carbon monoxide analyzer (CO11M using infrared absorption), an ozone analyzer (O341M, absorption of UV light with a wavelength of 254 nm, LCD/UV photometry ozone analyzer), and a total hydrocarbon analyzer (HC 51 M FID Total hydrocarbon analyzer model). All equipments are manufactured by Environnement S.A.
Stacked Filter Units (SFU) - PAHs
The experimental method of atmospheric particles (PAHs) consisted of four stages: 1) sampling - sampler (SFU) (Hopke et al. 1997) PM 2.5 – PM2.5-
10; fl ow 16.7 L min-1, and Whatman quartz fi ber fi lters; 2) extraction and 3) cleanup were performed according to US EPA TO 13 A norm (US EPA 1999); 4) analysis; the 16 most important PAHs (US EPA 1999) were analyzed by chromatography coupled with a Shimadzu GCMS-QP5050A mass spectrophotometer detector. For further details about the analyses, see Dallarosa et al. (2005, 2008).
RESULTS AND DISCUSSION
EMISSIONS
Figure 3 shows the distribution of diesel vehicles on the roads in 2008 and 2010 in the MAPA. In this area there where 80,730 and 98,576 diesel vehicles in 2008 and 2010, respectively. An increase of 22% in the total diesel fl eet can be seen during these years. This increase was already expected due to the raise in vehicle sales in the state of Rio Grande do Sul during 2009 and 2010. Among the 31 counties of the MAPA, Porto Alegre is the major contributor to atmospheric emissions, since it represents approximately 40% of the total diesel fl eet in the area. In 2010, diesel consumption in the MAPA was

An Acad Bras Cienc (2012) 84 (3)
659ESTIMATED ATMOSPHERIC EMISSIONS FROM BIODIESEL
836,838 m3 compared to 736,611 m3 in 2008, and in Porto Alegre it was 305,396 m3 and 268,819 m3 in 2010 and 2008, respectively.
are higher, boosting the formation of larger amounts of nitrogen oxides in engines running on biodiesel, by combining oxygen with the nitrogen present in the air (Coronado et al. 2009).
Fig. 3 - Distribution of diesel vehicles on the roads in 2008 and 2010 in the MAPA.
ton/year D100 B2 B5 B10 B20
2008
NOX
MAPA 18479 18516 18570 18661 18845
PA 6703 6716 6735 6769 6835
COMAPA 2550 2518 2470 2392 2244
PA 925 913 896 868 814
HCMAPA 870 851 823 778 695
PA 316 309 298 282 252
PMMAPA 360 355 348 337 316
PA 131 129 126 122 115
2010
NOXMAPA 18974 19037 19067 19160 19352
PA 6908 6922 6942 6976 7045
COMAPA 2618 2588 2536 2456 2305
PA 953 941 923 894 839
HCMAPA 893 875 845 799 714
PA 325 318 307 291 260
PMMAPA 370 365 358 346 324
PA 135 133 130 126 118
TABLE II Estimated atmospheric emissions for biodiesel blends for the vehicles on the road in 2008 and 2010 in Porto Alegre (PA) and in the MAPA.
D100 – blend of 0% biodiesel; B2 - blend of 2% biodiesel; B5 – blend of 5% biodiesel; B10 – blend of 10% biodiesel; B20 – blend of 20% biodiesel.
Table II shows the estimated atmospheric emissions for different biodiesel amounts added to diesel: 2, 5, 10, and 20%. The data refer to the MAPA and Porto Alegre in 2008 and 2010. Porto Alegre, as expected, represents about 36-40% of the emissions. It can be observed that PM, CO, and HC emissions decreased, while NOX shows a slight increase. The emissions in the year 2010 are higher in the MAPA and PA when compared to the emissions in 2008; this can be explained by the growth of the diesel fleet circulating in the MAPA during 2009 and 2010, as mentioned previously.
The variation of atmospheric emissions of each type of pollutant for different biodiesel blends added to diesel for 2008 and 2010 are shown in Figure 4 and 5, respectively. As the methodology remains the same, the variation in percentage is the same in both years (2008 and 2010). The changes can be seen in the amount of mass of pollutant that is emitted: with an increase in the vehicular fleet, the quantity mass emitted will raise as well, as seen in Table II.
In both Figures 4 and 5 it is observed an increase in NOX emissions with the addition of biodiesel. This might be explained due to high oxygen levels in biodiesel molecules and improved combustion conditions – temperature and pressure in the combustion chamber
Fig. 4 - Variation of atmospheric emissions at different biodiesel blends added to diesel oil in 2008 in the MAPA.

An Acad Bras Cienc (2012) 84 (3)
660 ELBA C. TEIXEIRA et al.
Carbon monoxide emissions decreased 40-50% compared to common diesel due to the oxygen present in biodiesel molecules, allowing a more efficient combustion by moving the direction of the combustion reaction toward the production of CO2
(Maziero et al. 2006).The higher oxygen levels present in the bio-
diesel molecule allow the complete burning of the fuel. Consequently, there is a decrease in particulate matter emissions. The absence of sulfur in biodiesel contributes to less sulfate particles formed during combustion, thus contributing even more to a decrease in particulate matter emissions (Dwivedi et al. 2006).
The decrease in emissions of unburned hydro-carbons by the addition of biodiesel to the diesel results from the complete combustion of the fuel, during which CO2 and water are mainly formed, as opposed to what occurs during diesel combustion (Coronado et al. 2009).
Although the variation of SOX emissions with the addition of biodiesel is not provided in the present study, these emissions decreased proportionally to the percent of diesel added to the blend. This occurs because biodiesel is a vegetable-derived fuel and it is free of sulfur (Coronado et al. 2009).
On the National Biodiesel Board (NBB) website there is a tool that calculates the variations in mass of the emissions of some pollutants, according to the addition of biodiesel in different blends (NBB 2010). Table III shows a comparison of the variations, in mass, of the emissions estimated in the present study and the results obtained on the NBB website for the parameters PM, CO, HC and NOX in Porto Alegre and the MAPA. It can be seen that data for HC and NOX show higher agreement, while there is a significant difference in PM and especially in CO emissions. This might occur because both compounds depend directly on combustion, and the variables used to consider NBB’s calculation were probably at different conditions as those used in the present study.
Fig. 5 - Variation of atmospheric emissions at different biodiesel blends added to diesel oil in 2010 in the MAPA.
Ton/yearB2 B5 B10 B20
Estimated NBB Estimated NBB Estimated NBB Estimated NBB
NOX MAPA 63 30 93 74 186 148 378 299PA 14 11 34 26 68 54 137 109
CO MAPA -30 -150 -82 -374 -162 -735 -313 -1424PA -12 -55 -30 -136 -59 -268 -114 -519
HC MAPA -18 -19 -48 -46 -94 -89 -179 -168PA -7 -7 -18 -16 -34 -32 -65 -61
PM MAPA -5 -14 -12 -33 -24 -66 -46 -128PA -2 -5 -5 -12 -9 -24 -17 -47
TABLE IIIComparison of the variations on estimated atmospheric emissions of blends of
biodiesel in Porto Alegre and the MAPA, with NBB calculation chart.
B2 - blend of 2% biodiesel ; B5 – blend of 5% biodiesel; B10 – blend of 10% biodiesel; B20 – blend of 20% biodiesel.

An Acad Bras Cienc (2012) 84 (3)
661ESTIMATED ATMOSPHERIC EMISSIONS FROM BIODIESEL
The results of several authors on pollutant emissions from diesel oil added of different biodiesel blends are show in Table IV. The results are expressed in percentage variation of the emissions of NOX, CO, HC, PM and SOX. Results reported by Morris et al. (2003) and by the National Biodiesel Board (NBB 2010) showed higher agreement with the estimated emission values for B20 in the present study. At lower percents of biodiesel in diesel, results did not show significant variations, with only slight variations in the values found. This might indicate a change of trend. The error margin of the estimated and measured values is sometimes greater than the absolute values found.
B2
Pollutant CO HC NOX PM SOX
MAPA (2010) -1.3 -2.2 0.2 -1.3 -
Corrêa (2005) -0.1 -0.4 -1.3 - -
B5
Pollutant CO HC NOX PM SOX
MAPA -3.1 -5.4 0.5 -3.2 -
Corrêa (2005) -0.2 -0.6 -1.3 - -
Oliveira and Costa (2002)
- - 0.7 -2.5 -5
B10
Pollutant CO HC NOX PM SOX
MAPA -6.2 -10 1 -6.4 -
Corrêa (2005) -0.3 -1.1 -3.7 - -
Oliveira and Costa (2002)
- - 1.3 -5 -9.5
B20
Pollutant CO HC NOX PM SOX
MAPA -12 -20 2 -12 -
NBB (2010) -12 -20 2 -12 -
Park et al. (2009) -20 -35 3.7 -20 -
Oliveira and Costa (2002)
- - 2.5 -10 -19
Morris et al. (2003) -13 - 2.4 -8.9 -20
TABLE IV Compared results (%) of various studies on pollutant emissions
from diesel oil added of different biodiesel rates.
B2 - blend of 2% biodiesel ; B5 – blend of 5% biodiesel; B10 – blend of 10% biodiesel; B20 – blend of 20% biodiesel.
AIR QUALITY
It is important to note that data will be here presented from 2006, 2007 and 2008. Table V shows the total average concentrations of PM10, PM2.5, CO, NOx, O3, SO2, HC and PAHs measured in the MAPA during 2006, 2007 and 2008. There was a decrease in CO in the atmosphere in 2008. This compound is originated mostly from mobile sources that operate on the Otto cycle. This gasoline fleet is responsible for the emission of 160,000,000 ton/year of CO in the MAPA (Teixeira et al. 2010). Despite the greater number of vehicles on the roads in recent years, the addition of catalytic converters to automobiles has substantially reduced CO emissions from the combustion of common gasoline. However, CO emissions during the ‘‘cold start’’ of engines, when the catalyst is cold and has not reached operating temperature, can still be substantial, even for those vehicles that are equipped with catalytic converters (Gaffney and Marley 2009). Higher biodiesel blends foreseen to be added to diesel will allow a decrease in emissions and concomitantly a decrease of this compound in the atmosphere (Figure 5). Studies about macro-regions of Rio Grande do Sul (Teixeira et al. 2010) showed that the MAPA had higher CO concentration in the air due to gasoline-fueled vehicles. However, even if the annual mean concentration of CO is decreasing, there are concerns about an increase in the number of vehicles on the roads and, consequently, in fuel consumption (Teixeira et al. 2010).
SO2 has shown an increase in 2006 and 2007, with a slight decrease in 2008. Despite vehicles have been showing to be major contributors to SO2 emissions in the MAPA, some stationary sources located in the area, e.g. an oil refinery and coal-fired power plants, are probably also related to SO2 emissions and contribute to higher emission levels measured in 2007. Some authors (Geng et al. 2009) have reported SO2 in urban areas from vehicles and coal-fired power plants. These activities might speed up SO2 concentration in the atmosphere (Nguyen and kim 2006).

An Acad Bras Cienc (2012) 84 (3)
662 ELBA C. TEIXEIRA et al.
Year PM10 PM2.5 CO NOX O3 SO2 HC PAHs *µg.m-3 µg.m-3 mg.m-3 µg.m-3 µg.m-3 µg.m-3 µg.m-3 ng.m-3
2006 34.96 15.4 0.80 45.03 27.32 9.48 --- 7.81332007 30.0 --- 0.848 45.79 30.78 24.40 1.97 ----2008 30.22 12.5 0.32 36.38 26.69 13.26 1.50 5.1201
TABLE VAverage pollutants concentrations in the MAPA in 2006, 2007 and 2008.
* PAHs: data only from 2006 and 2008.
Table V shows NOX levels in 2006, 2007 and 2008. A slight decrease in NOX concentration from vehicular emissions from 2006 to 2008 can be observed. In recent years, despite the higher number of vehicles on the roads, there has been an improvement in fuel and lubricant oil quality, vehicle maintenance and operating conditions. Not all diesel vehicles had electronic injection until 2008, therefore they were probably contributing to a higher concentration of NOX in the atmosphere. Diesel vehicles on the roads are a major source of NOX. Studies (Gaffney and Marley 2009) have estimated that diesel engines produce five times the amount of NOX per mass of fuel burned when compared to gasoline vehicles.
Exhaust gases from motor vehicles can contribute significantly to atmospheric particles emissions, mainly those of an aerodynamic diameter of less than 10 µm (künzli et al. 2000). In urban areas, traffic is one of the major contributors to atmospheric particles such as PM2.5 (Heinrich et al. 2005), but mainly the PM1.0 fractions (Gaffney and Marley 2009). Table V shows PM10 and PM2.5 average concentrations in the MAPA from 2006 to 2008. The area studied herein (MAPA) has a heavy traffic of heavy diesel trucks, and just in Porto Alegre diesel consumption was 259,181 m3 and 268,819 m3 in 2007 and 2008, respectively. The heavy traffic of diesel engines significantly contributes to produce ultrafine particles (Vallius et al. 2000) and more carbonaceous particulate matter (Gaffney and Marley 2009). These ultrafine particles have a very large surface area onto which the organic contaminants present in the diesel exhaust can adsorb. The emission
depends on a number of factors such as vehicle age, engine design and operating conditions, lubricant oil and fuel quality, as well as environmental conditions (Maricq 2007, Yanowitz et al. 2000). It is believed that, with the higher percent of biodiesel added to diesel, there will be a significant decrease in ultrafine particles emissions and, consequently, the quality of air will improve (zhang et al. 2011).
These organic contaminants emitted by vehi-cles, especially by diesel engines, can be polycyclic aromatic hydrocarbons. Some of these compounds have shown carcinogenic and mutagenic properties (Chang et al. 2006, kawanaka et al. 2004, Villalobos-Pietrini et al. 2007). Studies on PAHs in fine particles conducted by several authors (Dallarosa et al. 2008, Bourotte et al. 2005, Hays et al. 2003, Sheu and Lee 1997) have shown that the highest concentration of these compounds is found in fine particles. Along with their small size, these particles have a very large surface area onto which other organic contaminants present in the diesel exhaust can adsorb. Polycyclic organic matter compounds with more than three aromatic rings are usually associated with diesel particulates.
Table V shows the total average concentration of PAHs associated with atmospheric particles in the MAPA. Between 2006 and 2008 a small decrease was observed in concentration of PAHs. As mentioned before, during this period not all diesel vehicles had electronic injection, therefore a contribution in order to reduce the concentration of PAHs in the atmosphere did not exist. In the MAPA the alcohol fleet corresponds to only 4% (Teixeira et al. 2010),
An Acad Bras Cienc (2012) 84 (3)
663ESTIMATED ATMOSPHERIC EMISSIONS FROM BIODIESEL
and besides that, according to some authors (Allen et al. 2008), the emission of PAHs, from the use of hydrated alcohol, is almost negligible compared to gasoline. Other authors (Abrantes et al. 2009) reported that the emission of PAHs ethanol from vehicles were on average 92% lower than PAHs emission from the gasohol vehicle.
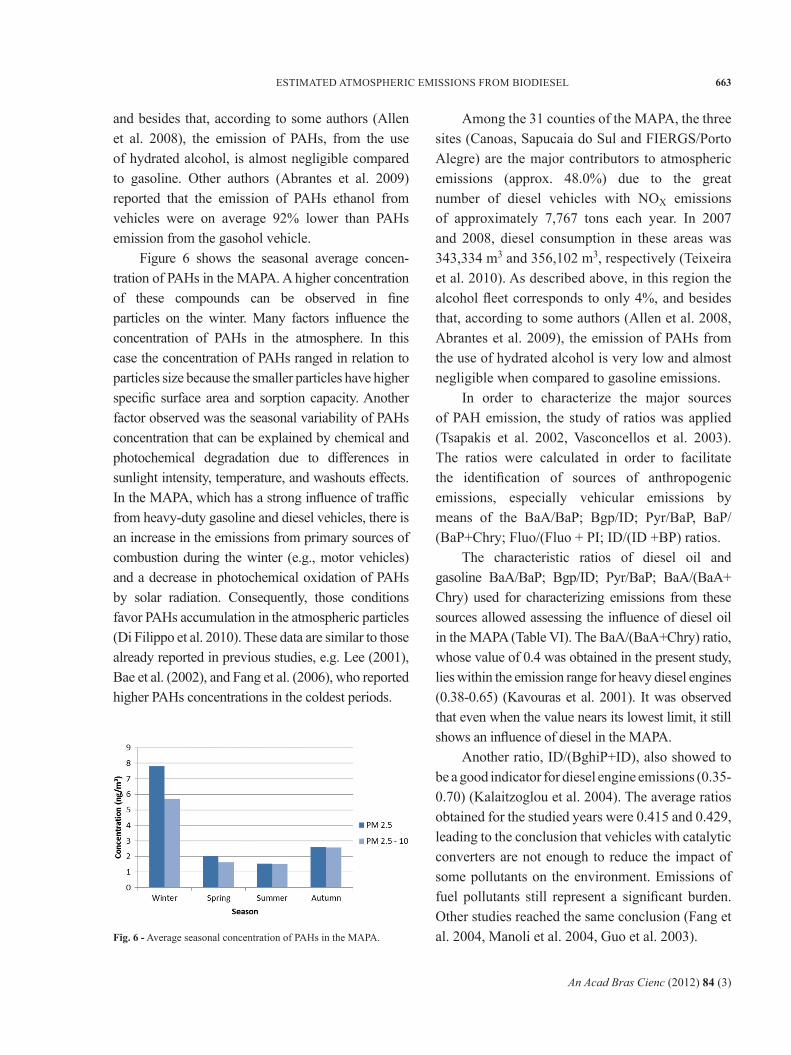
Figure 6 shows the seasonal average concen-tration of PAHs in the MAPA. A higher concentration of these compounds can be observed in fine particles on the winter. Many factors influence the concentration of PAHs in the atmosphere. In this case the concentration of PAHs ranged in relation to particles size because the smaller particles have higher specific surface area and sorption capacity. Another factor observed was the seasonal variability of PAHs concentration that can be explained by chemical and photochemical degradation due to differences in sunlight intensity, temperature, and washouts effects. In the MAPA, which has a strong influence of traffic from heavy-duty gasoline and diesel vehicles, there is an increase in the emissions from primary sources of combustion during the winter (e.g., motor vehicles) and a decrease in photochemical oxidation of PAHs by solar radiation. Consequently, those conditions favor PAHs accumu lation in the atmospheric particles (Di Filippo et al. 2010). These data are similar to those already reported in previous studies, e.g. Lee (2001), Bae et al. (2002), and Fang et al. (2006), who reported higher PAHs concentrations in the coldest periods.
Among the 31 counties of the MAPA, the three sites (Canoas, Sapucaia do Sul and FIERGS/Porto Alegre) are the major contributors to atmospheric emissions (approx. 48.0%) due to the great number of diesel vehicles with NOX emissions of approximately 7,767 tons each year. In 2007 and 2008, diesel consumption in these areas was 343,334 m3 and 356,102 m3, respectively (Teixeira et al. 2010). As described above, in this region the alcohol fleet corresponds to only 4%, and besides that, according to some authors (Allen et al. 2008, Abrantes et al. 2009), the emission of PAHs from the use of hydrated alcohol is very low and almost negligible when compared to gasoline emissions.
In order to characterize the major sources of PAH emission, the study of ratios was applied (Tsapakis et al. 2002, Vasconcellos et al. 2003). The ratios were calculated in order to facilitate the identification of sources of anthropogenic emissions, especially vehicular emissions by means of the BaA/BaP; Bgp/ID; Pyr/BaP, BaP/(BaP+Chry; Fluo/(Fluo + PI; ID/(ID +BP) ratios.
The characteristic ratios of diesel oil and gasoline BaA/BaP; Bgp/ID; Pyr/BaP; BaA/(BaA+ Chry) used for characterizing emissions from these sources allowed assessing the influence of diesel oil in the MAPA (Table VI). The BaA/(BaA+Chry) ratio, whose value of 0.4 was obtained in the present study, lies within the emission range for heavy diesel engines (0.38-0.65) (kavouras et al. 2001). It was observed that even when the value nears its lowest limit, it still shows an influence of diesel in the MAPA.
Another ratio, ID/(BghiP+ID), also showed to be a good indicator for diesel engine emissions (0.35-0.70) (kalaitzoglou et al. 2004). The average ratios obtained for the studied years were 0.415 and 0.429, leading to the conclusion that vehicles with catalytic converters are not enough to reduce the impact of some pollutants on the environment. Emissions of fuel pollutants still represent a significant burden. Other studies reached the same conclusion (Fang et al. 2004, Manoli et al. 2004, Guo et al. 2003).Fig. 6 - Average seasonal concentration of PAHs in the MAPA.

An Acad Bras Cienc (2012) 84 (3)
664 ELBA C. TEIXEIRA et al.
Table VII shows the correlation matrix of the studied pollutants. PM10 correlates with CO and CO correlates with NOX. These results evidence the influence of vehicular emissions in the MAPA. This table shows that NOX and O3 have a significant negative correlation. The negative correlation of NOX with O3 confirms the so-called ‘titration effect’ of NO on O3; NO reacts with O3 to produce NO2 (NO + O3 → NO2 + O2). The correlation of NOX with PAHs and the negative correlation with O3 evidence the influence of mobile sources, particularly emissions from diesel engines in the area of study.
CONCLUSION
The major benefit of biodiesel to the environment is the significant decrease in atmospheric pollutant emissions compared to petroleum diesel oil. Estimated data on biodiesel addition to diesel oil indicate a decrease in pollutant levels, particularly for B20. Pollutant emissions showed a decrease in PM, CO, and HC, while NOX experienced a slight increase.
Vehicle emissions were usually the most significant source of air pollution in the MAPA. This was intensified by emissions from diesel engines.
YearFluo/
(Fluo + Py)
ID/(ID +BP)
BaA/BaP
BaP/(BaP + CRI)
BGP/ID
Pyr/BaP
2006 0.629 0.415 1.28 0.480 2.37 1.11
2008 0.514 0.429 0.95 0.495 1.88 2.02
TABLE VIPAHs ratios for the years 2006 and 2008.
NOX O3 PM SO2 CO PAHs
NOX 1.00 -0.55 0.43 -0.75 0.46 0.55
O3 -0.55 1.00 0.20 0.23 0.45 -0.54
PM 0.33 0.28 1.0 -0.10 0.49 -0.43
SO2 -0.75 0.23 -0.10 1.0 0.31 -0.40
CO 0.46 0.45 0.49 0.31 1.0 -0.32
PAHs 0.55 -0.54 -0.43 -0.40 0.32 1.00
TABLE VIICorrelations of the atmospheric pollutants in the MAPA.
The characterization of atmospheric pollutants in the MAPA showed that they are influenced by mobile sources, particularly diesel engines.
Even with more vehicles on the roads in recent years, the average concentration of the atmospheric pollutants (PM10, PM2.5, CO, NOX, O3, SO2, HC and PAHs) from vehicles, particularly those with diesel engines, decreased in 2006, 2007 and 2008 in the MAPA. This is confirmed by the correlation of PM10 with CO, and of NOX with CO and PAHs.
There is evidence that biodiesel would increase the NOX emissions, but the measures of the concentrations of air quality indicated little difference and a decrease for NOX. There is the need to introduce more studies in the future, when a higher content of biodiesel can confirm this trend or not.
ACKNOWLEDGMENTS
We are grateful to Financiadora de Estudos e Projetos (FINEP)/ Fundação de Amparo à Pesquisa do Estado do Rio Grande do Sul (FAPERGS) for their financial support and to FEPAM's (Fundação Estadual de Proteção Ambiental Henrique Luis Roessler, RS) air quality monitoring network for their contribution to the present study.
RESUMO
O objetivo do presente estudo foi estimar as emissões de alguns poluentes (CO, NOX, HC, SOX e MP) na frota diesel devido à adição de biodiesel em diferentes misturas, bem como avaliar as concentrações de poluentes atmosféricos na região metropolitana de Porto Alegre (MAPA). A metodologia foi fundamentada em inventários de fontes móveis baseados em relatórios técnicos da US EPA. Em relação à qualidade do ar foram determinado os seguintes parâmetros: PM10, MP2,5, CO, NOX, O3, SO2, HC e HPAs. Os resultados mostraram uma diminuição das emissões de PM, CO e HC e um ligeiro aumento de NOX. A caracterização dos poluentes atmosféricos na região metropolitana de Porto Alegre mostrou que eles são influenciados por fontes móveis, principalmente, por veículos a diesel.

An Acad Bras Cienc (2012) 84 (3)
665ESTIMATED ATMOSPHERIC EMISSIONS FROM BIODIESEL
A análise de diagnóstico das razões, que foi aplicada para facilitar a identificação das fontes de HPAs, indicou influência de óleo diesel.
Palavras-chave: qualidade do ar, biodiesel, diesel, emissões.
REFERENCES
ABRANTES R, ASSUNçÃO JV, PESQUERO CR, BRUNS RE ANDNÓBREGA RP. 2009. Emission of polycyclic aromatic hydrocarbons from gasohol and ethanol vehicles. Atmos Environ 43: 6458-654.
ALLEN AG, ROCHA GO, CARDOSO AA, PARTERLINI WC, MACHADO CMD AND ANDRADE JB. 2008. Atmospheric particulate polycyclic aromatic hydrocarbons from road transport in southeast Brazil. Transp. Res.: Part D: Transport Environ 13: 483-490.
ANTOLIN G, TINAUT FV, BRICENO Y, CASTANO V, PEREz CAND RAMIREz AI. 2002. Optimization of biodiesel production by sunflower oil transesterification. Bioresour Technol 83: 111-114.
BAE SY, YI SM AND kIM YP. 2002. Temporal and spatial varia-tions of the particle size distribution of PAHs and their dry deposition fluxes in Korea. Atmos Environ 36: 5491-5500.
BEER T, GRANT T, WILLIAMS D AND WATSON H. 2002. Fuel-cycle greenhouse gas emissions from alternative fuels in Australian heavy vehicles. Atmos Environ 36: 753-763.
BOUROTTE C, FORTI MC, TANIGUCHI S, BÍCEGO MC ANDLOTUFO PA. 2005. A wintertime study of PAHs in fine and coarse aerosols in São Paulo city, Brazil. Atmos Environ 39: 3799-3811.
CARDONE M, PRATI MV, ROCCO V, SEGGIANI M, SENATOREA AND VITOLO S. 2002. Brassica carinata as an alternative oil crop for the production of biodiesel in Italy: engine performance and regulated and unregulated exhaust emission. Environ Sci Technol 36: 4656-4662.
CETESB - COMPANHIA DE TECNOLOGIA DE SANEAMENTO AMBIENTAL DO ESTADO DE SÃO PAULO. 2008. Relatório de qualidade do ar no Estado de São Paulo em 2007. Available in: <http://www.cetesb.sp.gov.br>
CHANG SY, FANG GC, CHOU CCk AND CHEN WN. 2006. Sourceidentifications of PM10 aerosols depending on hourly measurements of soluble components characterization among different events in Taipei Basin during spring season of 2004. Chemosphere 65: 792-801.
CORONADO CR, CARVALHO JA AND SILVEIRA JL. 2009. BiodieselCO2 emissions: A comparison with the main fuels in the Brazilian market. Fuel Process Technol 90: 204-211.
CORRêA SM. 2005. Impacto do biodiesel na qualidade doar da cidade do Rio de Janeiro. In: XXV Encontro Nacional de Engenharia de Produção – ENEGEP, 25, Porto Alegre, RS.
DALLAROSA JB, TEIXEIRA EC, MEIRA L AND WIEGAND F.2008. Study of the chemical elements and polycyclic aromatic hydrocarbons in atmospheric particles of PM10 and PM2.5 in the urban and rural areas of South Brazil. Atmos Res 89: 76–92.
DALLAROSA JB, TEIXEIRA EC, PIRES M AND FACHEL J. 2005.Study of the profile of polycyclic aromatic hydrocarbons in atmospheric particles (PM10) using multivariate methods. Atmos Environ 39: 6587-6596.
DESANTES JM, BERRMúDEz V, GARCIA JM AND FUENTES E.2005. Effects of current engine strategies on the exhaust aerosol particle size distribution from a Heavy-Duty Diesel Engine. J Sci Aerosol 36: 1251-1276.
DI FILIPPO P, RICCARDI C, POMATA D AND BUIARELLI F. 2010.Concentrations of PAHs, and nitro- and methyl- derivatives associated with a size-segregated urban aerosol. Atmos Environ 44: 2742-2749.
DORADO MP, BALLESTEROS E, ARNAL JM, GÓMEz J ANDGIMéNEz FJL. 2003. Testing waste olive oil metil ester as a fuel in a diesel engine. Energ Fuel 17: 1560-565.
DURBIN TD AND NORBECk JM. 2002. The effects of biodieselblends and ARCO EC-Diesel on emissions from light heavy-duty diesel vehicles. Environ Sci Technol 36: 1686-1691.
DWIVEDI D, AGARWAL Ak AND SHARMA M. 2006. Particulateemission characterization of a biodiesel vs. diesel-fuelled compression ignition transport engine: A comparative study. Atmos Environ 40: 5586-5595.
FANG GC, CHANG kF, LU C AND BAI H. 2004. Estimation ofPAHs dry deposition and BaP toxic equivalency factors (TEFs) study at Urban, Industry Park and rural sampling sites in central Taiwan, Taichung. Chemosphere 55: 787-796.
FANG GC, WU YS, CHEN JC, CHANG CN AND HO TT. 2006.Characteristic of polycyclic aromatic hydrocarbon concentrations and source identification for fine and coarse particulates at Taichung Harbor near Taiwan Strait during 2004–2005. Sci Total Environ 366: 729-738.
GAFFNEY JS AND MARLEY NA. 2009. The impacts ofcombustion emissions on air quality and climate – From coal to biofuels and beyond. Atmos Environ 43: 23–36.
GENG H, JUNG HJ, PARk YM, HWANG HJ, kIM Hk, kIM YJ,SUNWOOD Y AND RO CU. 2009. Morphological and chemical composition characteristics of summertime atmospheric particles collected at Tokchok Island, korea. Atmos Environ 43: 3364-3373.
GUO zG, SHENG LF, FENG JL AND FANG M. 2003. Seasonalvariation of solvent extractable organic compounds in the aerosols in Qingdao, China. Atmos Environ 37: 1825-1834.
HARRIS SJ AND MARICQ MM. 2001. Signature size distributionsfor diesel and gasoline engine exhaust particulate matter. J Sci Aerosol 32: 749-764.
HAYS MD, SMITH ND, kINSEY J, DONG Y AND kARIHER P. 2003.Polycyclic aromatic hydrocarbon size distributions in aerosols from appliances of residential wood combustion as determined by direct thermal desorption-GC/MS. J Aerosol Sci 34: 1061-1084.
HEINRICH J, TOPP R, GEHRING U AND THEFELD W. 2005. Trafficat residential address, respiratory health, and atopy in adults: the National German Health Survey 1998. Environ Res 98: 240-249.
HOPkE Pk, XIE Y, RAUNEMA T, BIEGALSkI S, LANDSBERGERS, MAENHAUT W, ARTAXO P AND COHEN D. 1997. Characterization of the gent staked filter unit PM10 sampler. Aerosol Sci Tech 27: 726-735.
An Acad Bras Cienc (2012) 84 (3)
666 ELBA C. TEIXEIRA et al.
kALAITzOGLOU M, TERzI E AND SAMARA C. 2004. Patternsand sources of particle-phase aliphatic and polycyclic aromatic hydrocarbons in urban and rural sites of western Greece. Atmos Environ 38: 2545–2560.
kALAM MA, HUSNAWAN M AND MASJUkI HH. 2003. Exhaustemission and combustion evaluation of coconut oil-powered indirect injection diesel engine. Renew Energ 28: 2405-2415.
kALLIGEROS S, zANNIkOS F, STOURNAS S, LOIS E, TEAS C ANDSAkELLAROPULOS F. 2003. An investigation of using biodiesel/marine diesel blends on the performance of a stationary diesel engine. Biomass Bioenerg 24: 141-149.
kAVOURAS IG, kOUTRAkIS P, LAGOUDAkI E, TSAPAkIS E,STEPHANOU EG, OYOLA P AND VON BAER D. 2001. Source apportionment of urban particulate aliphatic and polynuclear aromatic hydrocarbons (PAHs) using multivariate methods. Environ Sci Technol 35: 2288-2294.
kAWANAkA Y, MATSUMOTO E, SAkAMOTO k, WANG N ANDYUN SJ. 2004. Size distributions of mutagenic compounds and mutagenicity in atmospheric particulate matter collected with a low-pressure cascade impactor. Atmos Environ 38: 2125-2132.
küNzLI N ET AL. 2000. Public-health impact of outdoor andtraffic-related air pollution: a European assessment. The Lancet 356: 795-801.
LEE Hk. 2001. Chapter 2: Modern techniques for the analysis of polycyclic aromatic hydrocarbons. In: kleibohmer W. Environ Analysis (Handbook of Analytical Separations), p. 39-74.
LIN CH, WU YL AND LAI CH. 2006. Quality assurance auditand data analysis of southern particulate matter supersite. EPA-95-FA01-03-A031. Taiwan Environ. Prot. Adm. Taipei, Taiwan.
LIN YC, CHENG MT, TING WY AND YEH CR. 2006. Characte-ristics of gaseous HNO2, HNO3, NH3 and particulate ammonium nitrate in an urban city of central Taiwan. Atmos Environ 40: 4725-4733.
LIVI FP. 1999. Elementos do Clima: o contraste de tempos friose quentes. In: MENEGAT R. Atlas Ambiental de Porto Alegre. 2ª ed., Porto Alegre: Editora da Universidade Federal do Rio Grande do Sul, p. 73-74.
MANOLI E, kOURAS A AND SAMARA C. 2004. Profile analysisof ambient and source emitted particle-bound polycyclic aromatic hydrocarbons from three sites in northern Greece. Chemosphere 56: 867-878.
MARICQ MM. 2007. Chemical characterization of particulateemissions from diesel engines: A review. J Sci Aerosol 38: 1079-1118.
MAzIERO JVG, CORRêA IM, TRIELLI MA, BERNARDI JA ANDD’AGOSTINI MF. 2006. Avaliação de emissões poluentes de um motor diesel utilizando biodiesel de girassol como combustível. Eng Agric 14: 287-292.
MONYEM A AND VAN GERPEN JH. 2001. The effect of biodieseloxidation on engine performance and emissions. Biomass Bioenerg 20: 317-325.
MORRIS RE, POLLACk Ak, MANSELL GE, LINDHJEM C, JIAY AND WILSON G. 2003. Impact of biodiesel fuels on air quality and human health. Summary Report: National Renewable Energy Laboratory.
NBB - NATIONAL BIODIESEL BOARD. 2010. Emissions Calculator.Available in: < http://www.biodiesel.org/tools/calculator/>
NGUYEN HT AND kIM kH. 2006. Evaluation of SO2 pollutionlevels between four different types of air quality monitoring stations. Atmos Environ 40: 7066-7081.
OLIVEIRA LB AND COSTA AO. 2002. Biodiesel – Uma expe-riência de desenvolvimento sustentável. Rio de Janeiro: IVIG/COPPE/UFRJ, 14 p.
PARk S, kIM H AND CHOI B. 2009. Emission characteristics ofexhaust gases and nanoparticles from a diesel engine with biodiesel-diesel blended fuel (BD20). J Mech Sci Technol 23: 2555-2564.
PHULERIA HC, SHEESLEY RJ, SCHAUER JJ, FINE PM ANDSIOUTAS C. 2007. Roadside measurements of size-segregated particulate organic compounds near gasoline and diesel-dominated freeways in Los Angeles, CA. Atmos Environ 41: 4653-4671.
RAVINDRA k, SOkHI R AND GRIEkEN RV. 2008. Atmosphericpolycyclic aromatic hydrocarbons: Source attribution, emi-ssion factors and regulation. Atmos Environ 42: 2895-2921.
RISTOVSkI zD, JAYARATNE ER, LIM M, AYOkO GA ANDMORAWSkA L. 2006. Influence of diesel fuel sulphur on nanoparticle emissions from city buses. Environ Sci Technol 40: 1314-1320.
SHEESLEY RJ, SCHAUER JJ, zHENG M AND WANG B. 2007. Sensitivity of molecular marker-based CMB models to biomass burning source profiles. Atmos Environ 41: 9050-9063.
SHEU HL AND LEE WJ. 1997. Particle size distributions ofPAH content on the dry deposition materials. J Sci Aerosol 28: 587-588.
TEIXEIRA EC, FELTES S AND SANTANA E. 2008. Estudo dasemissões de fontes móveis na região metropolitana de Porto Alegre, Rio Grande do Sul. Quim Nova 31: 244-248.
TEIXEIRA EC, SANTANA E, WIEGAND F, FELTES S, MATTIUzIC AND PALAGI A. 2010. 1º Inventário das emissões atmos-féricas de fontes móveis do Estado do Rio Grande do Sul. Fundação Estadual de Proteção Ambiental Henrique Luís Roessler – FEPAM/RS, ISBN 978-85-98053-09-7.
TSAPAkIS M, LAGOUDAkI E, STEPHANOU EG, kAVOURAS IG,kOUTRAkIS P, OYOLA P AND VON BAER D. 2002.The composition and sources of HV PM10,2.5 organic aerosol in two urban areas of Chile. Atmos Environ 36: 3851–3863.
US EPA - UNITED STATES ENVIRONMENTAL PROTECTIONAGENCY. 1999. Compendium of methods for the deter-mination of toxic organic compounds in ambient air: determination of polycyclic aromatic hydrocarbons (PAHs) in ambient air using gas chromatograph/ mass spectrometer (GC/MS). Method TO-13A. Environmental Protection Agency. U.S. Government Printing Office Washington DC.
US EPA - UNITED STATES ENVIRONMENTAL PROTECTION AGENCY. 2002. A comprehensive analysis of biodiesel impacts on exhaust emissions. Available in: <http://www.epa.gov/>.
VALLIUS MJ, RUUSkANEN J, MIRME A AND PEkkANEN J.2000. Concentrations and estimated soot content of PM1, PM2.5, and PM10 in a subarctic urban atmosphere. Environ Sci Technol 34: 1919–1925.
An Acad Bras Cienc (2012) 84 (3)
667ESTIMATED ATMOSPHERIC EMISSIONS FROM BIODIESEL
VASCONCELLOS PC, zACARIAS D, PIRES MAF, POOL CS ANDCARVALHO LRF. 2003. Measurements of polycyclic aromatic hydrocarbons in airborne particles from the metropolitan area of São Paulo City, Brazil. Atmos Environ 37: 3009–3018.
VILLALOBOS-PIETRINI R ET AL. 2007. Biodirected mutagenicchemical assay of PM10 extractable organic matter in Southwest Mexico City. Mutat Res-Gen Tox En 634: 192-204.
WANG WG, LYONS DW, CLARk NN, GAUTHAM M AND NORTANPM. 2000. Emissions from nine heavy duty trucks fuelled by diesel and biodiesel blend without engine modification. Environ Sci Technol 34: 933-939.
YANOWITz J, MCCORMICk RL AND GRABOSkI MS. 2000. In-use emissions from heavy-duty diesel vehicles. Environ Sci Technol 34: 729–740.
zHANG N, HUANG z, WANG X AND zHENG B. 2011. Acomparative study of two kinds of biodiesels and biodiesel-DEE blends in common rail diesel engine. J Fuels Lubric 4: 96-109.