Estimate of Burden and Direct Healthcare Cost of ...
60
140 Emerging Infectious Diseases • www.cdc.gov/eid • Vol. 27, No. 1, January 2021 A t the beginning of the 20th century, diseases commonly transmitted by water, such as cholera and typhoid, were major causes of death in the Unit- ed States (1). Reliable provision of treated, safe drink- ing water dramatically reduced the burden of these diseases and has been recognized as one of the great- est public health achievements of the 20th century (2). Despite this achievement, waterborne disease in the United States persists (3–5). In the United States, outbreaks associated with large public drinking water systems have sharply de- clined in the past 40 years (3,6), likely the result of improvements in regulation and operation. However, transmission of disease via drinking water systems still occurs, often attributable to aging infrastructure, operational challenges, and the private or unregu- lated water systems (e.g., private wells) that serve an estimated 43 million persons (7). At the same time, the complexity and scope of water use has increased; drinking, sanitation, hygiene, cooling, and heating needs are supported by 6 million miles of plumbing inside US buildings (i.e., premise plumbing) (8,9). Premise plumbing water quality can be compromised by long water residency times, reduced disinfectant levels, and inadequate hot water temperatures, creat- ing environments where pathogens (e.g., nontubercu- lous mycobacteria [NTM], Pseudomonas, and Legionel- la) can amplify in biofilms (10). People can be exposed to these pathogens through contact, ingestion, or in- halation of aerosols (e.g., from showerheads, building cooling towers, or decorative fountains). As leisure time has increased, swimming pools, waterparks, water playgrounds, and hot tubs have proliferated (5). These venues rely largely on chlori- nation as the major barrier against disease transmis- sion. Cryptosporidium has emerged as the major cause of outbreaks associated with treated aquatic venues because it is extremely chlorine resistant and has a low infectious dose (5,11,12). Warmer oceans have led to Vibrio-associated wound infections farther north than previously documented (13). Estimates of the overall burden of foodborne dis- ease in the United States, including both known and un- known agents, have been useful in directing prevention Estimate of Burden and Direct Healthcare Cost of Infectious Waterborne Disease in the United States Sarah A. Collier, Li Deng, Elizabeth A. Adam, Katharine M. Benedict, Elizabeth M. Beshearse, Anna J. Blackstock, Beau B. Bruce, Gordana Derado, Chris Edens, Kathleen E. Fullerton, Julia W. Gargano, Aimee L. Geissler, Aron J. Hall, Arie H. Havelaar, Vincent R. Hill, Robert M. Hoekstra, Sujan C. Reddy, Elaine Scallan, Erin K. Stokes, Jonathan S. Yoder, Michael J. Beach Author affiliation: Centers for Disease Control and Prevention, Atlanta, Georgia, USA DOI: https://doi.org/10.3201/eid2701.190676 Provision of safe drinking water in the United States is a great public health achievement. However, new wa- terborne disease challenges have emerged (e.g., ag- ing infrastructure, chlorine-tolerant and biofilm-related pathogens, increased recreational water use). Compre- hensive estimates of the health burden for all water ex- posure routes (ingestion, contact, inhalation) and sourc- es (drinking, recreational, environmental) are needed. We estimated total illnesses, emergency department (ED) visits, hospitalizations, deaths, and direct health- care costs for 17 waterborne infectious diseases. About 7.15 million waterborne illnesses occur annually (95% credible interval [CrI] 3.88 million–12.0 million), results in 601,000 ED visits (95% CrI 364,000–866,000), 118,000 hospitalizations (95% CrI 86,800–150,000), and 6,630 deaths (95% CrI 4,520–8,870) and incurring US $3.33 billion (95% CrI 1.37 billion–8.77 billion) in direct health- care costs. Otitis externa and norovirus infection were the most common illnesses. Most hospitalizations and deaths were caused by biofilm-associated pathogens (nontuberculous mycobacteria, Pseudomonas, Legio- nella), costing US $2.39 billion annually.
Transcript of Estimate of Burden and Direct Healthcare Cost of ...

140 Emerging Infectious Diseases • www.cdc.gov/eid • Vol. 27, No. 1, January 2021
At the beginning of the 20th century, diseases commonly transmitted by water, such as cholera
and typhoid, were major causes of death in the Unit-ed States (1). Reliable provision of treated, safe drink-ing water dramatically reduced the burden of these diseases and has been recognized as one of the great-est public health achievements of the 20th century (2). Despite this achievement, waterborne disease in the United States persists (3–5).
In the United States, outbreaks associated with large public drinking water systems have sharply de-clined in the past 40 years (3,6), likely the result of improvements in regulation and operation. However, transmission of disease via drinking water systems still occurs, often attributable to aging infrastructure, operational challenges, and the private or unregu-lated water systems (e.g., private wells) that serve an estimated 43 million persons (7). At the same time, the complexity and scope of water use has increased; drinking, sanitation, hygiene, cooling, and heating needs are supported by 6 million miles of plumbing inside US buildings (i.e., premise plumbing) (8,9). Premise plumbing water quality can be compromised by long water residency times, reduced disinfectant levels, and inadequate hot water temperatures, creat-ing environments where pathogens (e.g., nontubercu-lous mycobacteria [NTM], Pseudomonas, and Legionel-la) can amplify in biofilms (10). People can be exposed to these pathogens through contact, ingestion, or in-halation of aerosols (e.g., from showerheads, building cooling towers, or decorative fountains).
As leisure time has increased, swimming pools, waterparks, water playgrounds, and hot tubs have proliferated (5). These venues rely largely on chlori-nation as the major barrier against disease transmis-sion. Cryptosporidium has emerged as the major cause of outbreaks associated with treated aquatic venues because it is extremely chlorine resistant and has a low infectious dose (5,11,12). Warmer oceans have led to Vibrio-associated wound infections farther north than previously documented (13).
Estimates of the overall burden of foodborne dis-ease in the United States, including both known and un-known agents, have been useful in directing prevention
Estimate of Burden and Direct Healthcare Cost of
Infectious Waterborne Disease in the United States
Sarah A. Collier, Li Deng, Elizabeth A. Adam, Katharine M. Benedict, Elizabeth M. Beshearse, Anna J. Blackstock, Beau B. Bruce, Gordana Derado, Chris Edens, Kathleen E. Fullerton,
Julia W. Gargano, Aimee L. Geissler, Aron J. Hall, Arie H. Havelaar, Vincent R. Hill, Robert M. Hoekstra, Sujan C. Reddy, Elaine Scallan, Erin K. Stokes, Jonathan S. Yoder, Michael J. Beach
Author affiliation: Centers for Disease Control and Prevention, Atlanta, Georgia, USA
DOI: https://doi.org/10.3201/eid2701.190676
Provision of safe drinking water in the United States is a great public health achievement. However, new wa-terborne disease challenges have emerged (e.g., ag-ing infrastructure, chlorine-tolerant and biofilm-related pathogens, increased recreational water use). Compre-hensive estimates of the health burden for all water ex-posure routes (ingestion, contact, inhalation) and sourc-es (drinking, recreational, environmental) are needed. We estimated total illnesses, emergency department (ED) visits, hospitalizations, deaths, and direct health-care costs for 17 waterborne infectious diseases. About 7.15 million waterborne illnesses occur annually (95% credible interval [CrI] 3.88 million–12.0 million), results in 601,000 ED visits (95% CrI 364,000–866,000), 118,000 hospitalizations (95% CrI 86,800–150,000), and 6,630 deaths (95% CrI 4,520–8,870) and incurring US $3.33 billion (95% CrI 1.37 billion–8.77 billion) in direct health-care costs. Otitis externa and norovirus infection were the most common illnesses. Most hospitalizations and deaths were caused by biofilm-associated pathogens (nontuberculous mycobacteria, Pseudomonas, Legio-nella), costing US $2.39 billion annually.

Emerging Infectious Diseases • www.cdc.gov/eid • Vol. 27, No. 1, January 2021 141
activities and setting public health goals (14,15). Quanti-fying the burden of infectious waterborne disease in the United States would also be beneficial.
Previous studies have attempted to estimate the burden of gastrointestinal illness (16,17) or all illness as-sociated with drinking water (18) and untreated recre-ational water (19) in the United States, but the burden of disease from all water sources (drinking, recreational, environmental) and exposure routes (ingestion, contact, inhalation) has not been estimated. We present an esti-mate of the burden of waterborne disease in the United States that includes gastrointestinal, respiratory, and systemic disease; accounts for underdiagnosis; and in-cludes all water sources and exposure routes.
MethodsWe defined waterborne disease as disease in which water was the proximate vehicle for exposure to an infectious pathogen. Thus, diseases such as Legion-naires’ disease (typically transmitted via inhaled wa-ter droplets containing Legionella bacteria) were con-sidered waterborne. In contrast, arboviral diseases like malaria, for which standing water can increase the population of mosquitoes that transmit the parasite that causes malaria, were not considered waterborne. Algal toxins and chemical exposures were not consid-ered. We determined the proportion of disease totals that were attributed to domestic waterborne exposure.
For this estimate, we chose diseases for which sur-veillance data, administrative data, or literature reports indicated that waterborne transmission for the disease in the United States was plausible, the disease was like-ly to cause substantial illness or death, and data were available to quantify associated health outcomes. Dis-eases included in this analysis were campylobacterio-sis, cryptosporidiosis, giardiasis, Legionnaires’ disease, NTM infection, norovirus infection, acute otitis ex-terna, Pseudomonas pneumonia and septicemia, Shiga toxin–producing Escherichia coli (STEC) infection sero-type O157, non-O157 serotype STEC infection, salmo-nellosis, shigellosis, and vibriosis (including infection by Vibrio alginolyticus, V. parahaemolyticus, V. vulnificus, and other species). To aid in quantifying the burden of respiratory diseases and enteric disease separately, we considered Legionnaires’ disease, NTM infection, and Pseudomonas pneumonia primarily respiratory diseases, whereas we considered campylobacteriosis, cryptosporidiosis, giardiasis, norovirus infection, sal-monellosis, and shigellosis primarily enteric diseases.
We employed methods similar to those of Scallan et al. (14,15) to estimate the number of illnesses, treat-and-release emergency department (ED) visits (i.e., visits in which the person was not admitted to the hospital),
hospitalizations, and deaths attributed to waterborne transmission in the United States. We also quantified the direct healthcare costs of treat-and-release ED vis-its and hospitalizations, as measured by insurer and out-of-pocket payments. Our overall methods are de-scribed here; detailed methods are described in Appen-dices 1–3 (https://wwwnc.cdc.gov/EID/article/27/1/ 19-0676-App1.pdf; https://wwwnc.cdc.gov/EID/ article/ 27/1/19-0676-App2.pdf; https://wwwnc.cdc.gov/EID/ article/27/1/19-0676-App3.pdf).
Data were for 2000–2015. All estimates were based on the 2014 US population (318.6 million per-sons); 2014 was the most recent year for which data were available for all surveillance sources. Estimates were derived from statistical models; each model in-put had uncertainty represented by a distribution of plausible values. Inputs are described in Appendix 1 and more details on the modeling process are de-scribed in Appendix 2. All estimates were rounded to 3 significant figures.
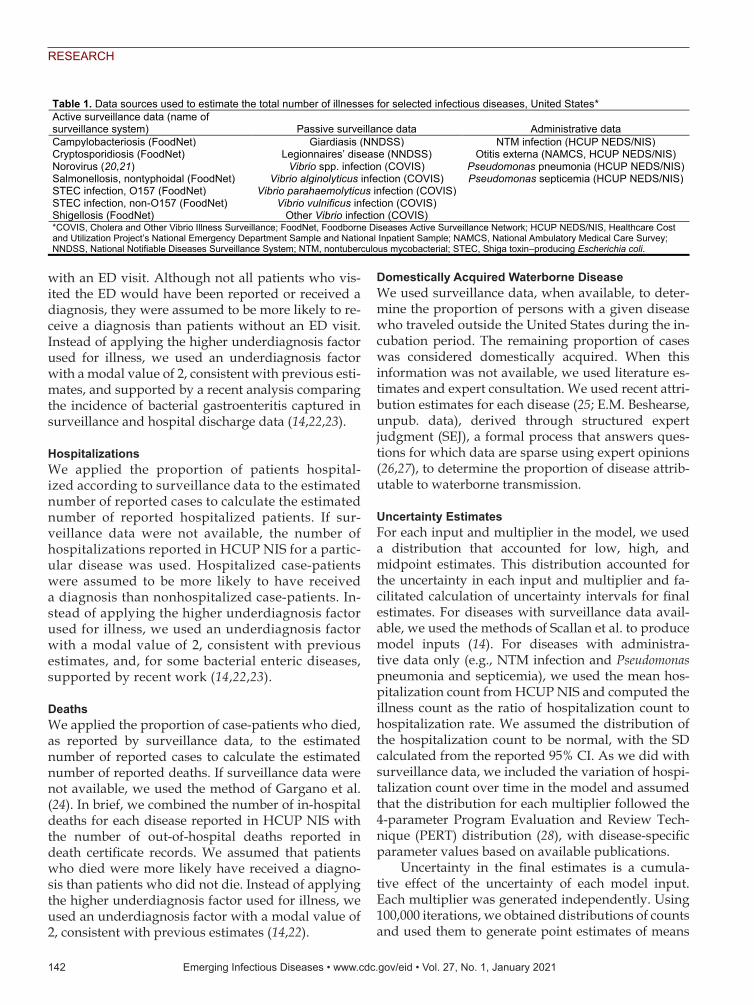
IllnessesThe initial model input was the number of reported or documented cases of illness for each disease, selected hi-erarchically: data from active surveillance systems were preferred, passive surveillance data were used if active surveillance data were not available, and administra-tive data were used if no active or passive surveillance system for the disease existed (Table 1). Administrative data sources included the Health Care Utilization Proj-ect (HCUP) National Inpatient Sample (HCUP NIS) hos-pitalization database, the HCUP National Emergency Department Sample (HCUP NEDS) ED visit database, and, in the case of otitis externa, the National Ambulato-ry Medical Care Survey (NAMCS), which surveys visits to physicians’ offices. These administrative data sources use complex sample survey weighting methods and are considered nationally representative. We multiplied the initial reported or documented number of cases for each disease by a series of multipliers that accounted for underreporting and underdiagnosis (including illness severity, medical care-seeking, likelihood of specimen submission, proportion of laboratories capable of per-forming a diagnostic test, and test sensitivity).
Emergency Department VisitsThe surveillance systems used do not tally treat-and-release ED visits but do capture the proportion of pa-tients hospitalized with a given disease; we combined this proportion with the ratio of treat-and-release ED visits for each disease (reported in HCUP NEDS) to hospitalizations for that disease (in HCUP NIS) to calculate the estimated proportion of reported cases
Burden and Cost of Infectious Waterborne Disease
RESEARCH
142 Emerging Infectious Diseases • www.cdc.gov/eid • Vol. 27, No. 1, January 2021
with an ED visit. Although not all patients who vis-ited the ED would have been reported or received a diagnosis, they were assumed to be more likely to re-ceive a diagnosis than patients without an ED visit. Instead of applying the higher underdiagnosis factor used for illness, we used an underdiagnosis factor with a modal value of 2, consistent with previous esti-mates, and supported by a recent analysis comparing the incidence of bacterial gastroenteritis captured in surveillance and hospital discharge data (14,22,23).
HospitalizationsWe applied the proportion of patients hospital-ized according to surveillance data to the estimated number of reported cases to calculate the estimated number of reported hospitalized patients. If sur-veillance data were not available, the number of hospitalizations reported in HCUP NIS for a partic-ular disease was used. Hospitalized case-patients were assumed to be more likely to have received a diagnosis than nonhospitalized case-patients. In-stead of applying the higher underdiagnosis factor used for illness, we used an underdiagnosis factor with a modal value of 2, consistent with previous estimates, and, for some bacterial enteric diseases, supported by recent work (14,22,23).
DeathsWe applied the proportion of case-patients who died, as reported by surveillance data, to the estimated number of reported cases to calculate the estimated number of reported deaths. If surveillance data were not available, we used the method of Gargano et al. (24). In brief, we combined the number of in-hospital deaths for each disease reported in HCUP NIS with the number of out-of-hospital deaths reported in death certificate records. We assumed that patients who died were more likely have received a diagno-sis than patients who did not die. Instead of applying the higher underdiagnosis factor used for illness, we used an underdiagnosis factor with a modal value of 2, consistent with previous estimates (14,22).
Domestically Acquired Waterborne DiseaseWe used surveillance data, when available, to deter-mine the proportion of persons with a given disease who traveled outside the United States during the in-cubation period. The remaining proportion of cases was considered domestically acquired. When this information was not available, we used literature es-timates and expert consultation. We used recent attri-bution estimates for each disease (25; E.M. Beshearse, unpub. data), derived through structured expert judgment (SEJ), a formal process that answers ques-tions for which data are sparse using expert opinions (26,27), to determine the proportion of disease attrib-utable to waterborne transmission.
Uncertainty EstimatesFor each input and multiplier in the model, we used a distribution that accounted for low, high, and midpoint estimates. This distribution accounted for the uncertainty in each input and multiplier and fa-cilitated calculation of uncertainty intervals for final estimates. For diseases with surveillance data avail-able, we used the methods of Scallan et al. to produce model inputs (14). For diseases with administra-tive data only (e.g., NTM infection and Pseudomonas pneumonia and septicemia), we used the mean hos-pitalization count from HCUP NIS and computed the illness count as the ratio of hospitalization count to hospitalization rate. We assumed the distribution of the hospitalization count to be normal, with the SD calculated from the reported 95% CI. As we did with surveillance data, we included the variation of hospi-talization count over time in the model and assumed that the distribution for each multiplier followed the 4-parameter Program Evaluation and Review Tech-nique (PERT) distribution (28), with disease-specific parameter values based on available publications.
Uncertainty in the final estimates is a cumula-tive effect of the uncertainty of each model input. Each multiplier was generated independently. Using 100,000 iterations, we obtained distributions of counts and used them to generate point estimates of means
Table 1. Data sources used to estimate the total number of illnesses for selected infectious diseases, United States* Active surveillance data (name of surveillance system) Passive surveillance data Administrative data Campylobacteriosis (FoodNet) Giardiasis (NNDSS) NTM infection (HCUP NEDS/NIS) Cryptosporidiosis (FoodNet) Legionnaires’ disease (NNDSS) Otitis externa (NAMCS, HCUP NEDS/NIS) Norovirus (20,21) Vibrio spp. infection (COVIS) Pseudomonas pneumonia (HCUP NEDS/NIS) Salmonellosis, nontyphoidal (FoodNet) Vibrio alginolyticus infection (COVIS) Pseudomonas septicemia (HCUP NEDS/NIS) STEC infection, O157 (FoodNet) Vibrio parahaemolyticus infection (COVIS) STEC infection, non-O157 (FoodNet) Vibrio vulnificus infection (COVIS) Shigellosis (FoodNet) Other Vibrio infection (COVIS) *COVIS, Cholera and Other Vibrio Illness Surveillance; FoodNet, Foodborne Diseases Active Surveillance Network; HCUP NEDS/NIS, Healthcare Cost and Utilization Project’s National Emergency Department Sample and National Inpatient Sample; NAMCS, National Ambulatory Medical Care Survey; NNDSS, National Notifiable Diseases Surveillance System; NTM, nontuberculous mycobacterial; STEC, Shiga toxin–producing Escherichia coli.

Emerging Infectious Diseases • www.cdc.gov/eid • Vol. 27, No. 1, January 2021 143
Burden and Cost of Infectious Waterborne Disease
and the corresponding 95% credible interval (CrI, the 2.5th percentile through the 97.5th percentile of the empirical distribution). We generated all-disease totals for each outcome by sampling from the distri-butions generated for each individual disease, using SAS 9.4 (https://www.sas.com) and R 3.5.1 (29).
Direct Healthcare Cost per ED Visit and HospitalizationWe used methods described previously (30,31) to cal-culate the direct cost of healthcare for ED visits and hospitalizations, using the 2012–2013 MarketScan re-search databases (IBM Watson Health, https://www.ibm.com/watson-health). These databases contain de-identified insurance billing data for tens of millions of persons covered by private, Medicare (which cov-ers primarily persons >65 years of age), and Medicaid (which covers primarily persons with low incomes or disabilities) health insurance plans and contain infor-mation on insurance and out-of-pocket payments for hospitalizations, ED visits, doctors’ office visits, labo-ratory testing, and outpatient drug prescriptions. We used these data to calculate the sum of insurer and out-of-pocket payments per hospitalization or visit, by insurance source. We calculated a weighted cost per hospitalization or visit by multiplying the mean total payments for each insurance source by the propor-tion of cases with the insurance source in HCUP NIS or HCUP NEDS. We assumed that persons with other sources of health insurance (e.g., Tricare, the US mili-tary health insurance plan) or no health insurance have the same costs as persons with private insurance. For ED visit costs, we used the data described by Adam et al. (30), except for norovirus infection (not examined by Adam et al.) and STEC O157 and non-O157 (catego-rized differently by Adam et al.) (Appendix 1).
Total Direct Health Care Costs of Domestically Acquired Waterborne Hospitalizations and ED VisitsWe estimated the total direct healthcare cost of ED visits and hospitalizations attributed to waterborne transmission in the United States using the total number of ED visits and hospitalizations attributed to waterborne transmission in the United States. We multiplied these figures by the weighted average cost per ED visit or hospitalization, using 100,000 it-erations, with uncertainty distributions as described (Appendix 1).
Results
IllnessesWe estimate that 33,600,000 (95% CrI 23,500,000–48,000,000) illnesses from the diseases in this anal-
ysis occurred in 2014, and of those, 7,150,000 (95% CrI 3,880,000–12,000,000; 21.3%) were attributed to waterborne transmission in the United States (Table 2). The diseases that caused the greatest number of domestically acquired waterborne illnesses were otitis externa (4,670,000 illnesses; 95% CrI 2,350,000–7,290,000) and norovirus infection (1,330,000 ill-nesses; 95% Cr 5,310–5,510,000), followed by giar-diasis (415,000 illnesses; 95% CrI 140,000–816,000) and cryptosporidiosis (322,000 illnesses; 95% CrI 61,700–993,000). An estimated 96,000 domestically acquired waterborne respiratory illnesses occurred, and 2,330,000 domestically acquired waterborne en-teric illnesses occurred.
Emergency Department VisitsAn estimated 601,000 (95% CrI 364,000–866,000) treat-and-release emergency department visits for the in-cluded diseases were attributed to waterborne trans-mission in the United States in 2014 (Table 3). Otitis externa caused the largest number of visits (567,000; 95% CrI 337,000–823,000).
HospitalizationsWe estimate that these diseases were responsible for 118,000 (95% CrI 86,800–150,000) hospitaliza-tions attributed to waterborne transmission in the United States (Table 3). The diseases with the largest number of hospitalizations were NTM in-fection (51,400 hospitalizations; 95% CrI 26,800–74,100), otitis externa (23,200 hospitalizations; 95% CrI 13,900–33,600), and Pseudomonas pneumonia (15,500 hospitalizations; 95% CrI 4,130–28,100). An estimated 77,700 respiratory hospitalizations were attributed to waterborne transmission, and 10,900 enteric hospitalizations were attributed to waterborne transmission.
DeathsThe diseases examined in this analysis were re-sponsible for 6,630 deaths (95% CrI 4,520–8,870) attributed to waterborne transmission in the Unit-ed States in 2014 (Table 3). The diseases with the largest number of deaths attributed to waterborne transmission in the United States were NTM in-fection (3,800, 95% CrI 1,950–5,620), Legionnaires’ disease (995, 95% CrI 655–1,310), and Pseudomo-nas pneumonia (730, 95% CrI 185–1,460). An esti-mated 5,530 deaths from respiratory disease were attributed to waterborne transmission (83% of all domestically acquired waterborne deaths), and 131 deaths from enteric diseases were attributed to wa-terborne transmission.

RESEARCH
144 Emerging Infectious Diseases • www.cdc.gov/eid • Vol. 27, No. 1, January 2021
Direct Healthcare Costs of ED Visits and Hospitalizations Pseudomonas septicemia had the highest cost per hospital stay ($38,200; 95% CrI $6,340–$172,000), followed by Legionnaires’ disease ($37,300, CrI $7,950–$149,000) (Table 4). Payments for ED visits and hospitalizations attributed to waterborne trans-mission in the United States totaled US $3.33 billion (95% CrI $1.37–$8.77 billion) in 2014 dollars (Table 5). This amount included $1.33 billion (95% CrI $361 million–$4.44 billion) in commercial insurer payments, $1.52 billion (95% CrI $338 million–$5.84 billion) in Medicare payments, and $284 million
(95% CrI $62.7 million–$906 million) in Medicaid payments (Appendix 3 Tables 1–3). The costliest diseases were NTM infection ($1.53 billion; 95% CrI $272 million–$6.38 billion), otitis externa ($564 mil-lion; 95% CrI $187 million–$1.57 billion), and Pseu-domonas pneumonia ($453 million; 95% CrI $49.9 million–$1.95 billion). An estimated $2.39 billion in direct healthcare costs from domestically acquired waterborne respiratory disease were incurred (72% of all costs from domestically acquired waterborne disease), as were $160 million in direct healthcare costs from domestically acquired waterborne en-teric diseases.
Table 2. Estimated number of total cases of domestically acquired waterborne illness in 2014 for selected infectious diseases, United States*
Disease or syndrome
Estimated confirmed
cases
Multipliers Estimated total cases (95% CrI)
International travel, %
Waterborne, % (95% CrI)
Domestically acquired waterborne,
no. (95% CrI) Under-
reporting Under-
diagnosis Campylobacteriosis 54,000 1.0 28.3 1,540,000
(597,000–3,250,000) 14.4 13
(1–31) 171,000
(13,900–586,000) Cryptosporidiosis 8,450 1.0 97.3 823,000
(243,000–2,160,000) 9.9 43
(17–73) 322,000
(61,700–993,000) Giardiasis 17,900 1.30 45.9 1,070,000
(727,000–1,560,000) 12.3 44
(16–78) 415,000
(140,000–816,000) Legionnaires’ disease 5,030 1.0 2.3 11,400
(8,920–13,600) 1.0 97
(67–100) 11,000
(7,430–13,300) NTM infection 25,700 1.0 3.8 97,000
(75,700–122,000) 1.0 72
(39–94) 68,900
(35,800–100,000) Norovirus NA 1.0 NA 21,800,000
(12,100,000–36,000,000)
1.1 6 (0–25)
1,330,000 (5,310–5,510,000)
Otitis externa† 1,720,000 1.0 3.4 5,980,000 (3,200,000–8,880,000)
1.3 79 (67–95)†
4,670,000 (2,350,000–7,290,000)
Pseudomonas pneumonia
15,800 1.0 2.0 31,700 (19,300–46,000)
1.0 51 (14–80)
15,900 (4,240–29,000)
Pseudomonas septicemia
13,000 1.0 2.0 26,100 (16,700–35,900)
1.0 22 (3–53)
5,760 (743–14,400)
Salmonellosis, nontyphoidal
46,400 1.0 29.1 1,350,000 (733,000–2,450,000)
9.7 6 (0–22)
77,000 (5,640–277,000)
STEC infection, serotype O157
3,530 1.0 18.2 64,200 (13,000–188,000)
4.0 5 (1–13)
3,360 (336–12,900)
STEC infection, serotype non-O157
4,550 1.0 48.1 219,000 (80,000–493,000)
15.3 6 (0–17)
11,400 (0–43,900)
Shigellosis 13,600 1.0 33.1 449,000 (97,800–1,350,000)
7.8 4 (1–21)
17,300 (1,080–77,500)
Vibrio spp. infection 1,230 NA NA 172,000 (126,000–231,000)
NA NA 34,600 (17,600–56,900)
V. alginolyticus 234 1.1 142.8 36,700 (23,600–54,800)
6.5 37 (13–71)
12,700 (4,100–25,400)
V. parahaemolyticus 593 1.1 141.6 92,400 (55,000–144,000)
6.7 24 (7–38)
20,800 (6,000–39,000)
V. vulnificus 133 1.1 1.7 249 (178–340)
1.5 77 (40–91)
188 (93–277)
Other Vibrio 271 1.1 142.8 42,600 (25,500–66,500)
14.4 2 (0–23)
879 (3–8,490)
Total illness NA NA NA 33,600,000 (23,500,000–48,000,000)
NA NA 7,150,000 (3,880,000–12,000,000)
*Estimates rounded to 3 significant figures. CrI, credible interval; NA, not applicable; NTM, nontuberculous mycobacteria; STEC, Shiga toxin–producing Escherichia coli. †Combines the waterborne source attribution (25) for Pseudomonas spp. otitis externa (81%) and Staphylococcus aureus (75%) in a ratio of 2:1. More details provided in Appendix 1 (https://wwwnc.cdc.gov/EID/article/27/1/19-0676-App1.pdf).

Emerging Infectious Diseases • www.cdc.gov/eid • Vol. 27, No. 1, January 2021 145
Burden and Cost of Infectious Waterborne Disease
DiscussionDomestic waterborne transmission of 17 diseases in the United States caused ≈7.15 million (95% CrI 3.88–12.0 million) waterborne illnesses to occur an-nually during the study period, including 601,000
ED visits (95% CrI 364,000–866,000), 118,000 hos-pitalizations (95% CrI 86,800–150,000), and 6,630 deaths (95% CrI 4,520–8,870), and incurred $3.33 bil-lion (95% CrI $1.31–$8.71 billion) in hospitalization and ED visit costs. This estimate includes drinking,
Table 3. Estimated number of treat-and-release emergency department visits, hospitalizations, and deaths from domestically acquired waterborne transmission in 2014 for selected infectious diseases, United States*
Disease or syndrome
Treat-and-release ED visits†
Hospitalizations
Deaths
Total visits (95% CrI)
Domestic waterborne visits (95%
CrI)
% Admitted
to hospital
Total stays (95% CrI)
Domestic waterborne stays (95%
CrI) %
Deaths
Total deaths
(95% CrI)
Domestic waterborne
deaths (95% CrI)
Campylobacteriosis 2,900 (1,620–4,630)
319 (31–966)
19.5 19,300 (8,790–34,900)
2,150 (192–6,900)
0.2 242 (0–1,150)
27 (0–146)
Cryptosporidiosis 1,260 (742–1,880)
492 (167–957)
19.2 2,870 (439–8,060)
1,120 (102–3,550)
0.3 61 (0–320)
24 (0–136)
Giardiasis 1,460 (902–2,090)
567 (185–1,120)
7.9 2,830 (1,760–4,070)
1,100 (364–2,180)
<0.1 4 (0–11)
1 (0–5)
Legionnaires’ disease 691 (316–1,220)
667 (289–1,200)
98.1 11,200 (8,750–13,300)
10,800 (7,280–13,100)
9.0 1,030 (762–1,330)
995 (655–1,310)
NTM infection 7,150 (5,110–9,620)
5,080 (2,560–7,750)
74.8 72,400 (57,300–89,700)
51,400 (26,800–74,100)
5.5 5,350 (4,020–6,920)
3,800 (1,950–5,620)
Norovirus 429,000‡
(318,000–605,000)
26,300‡ (105–
106,000)
0.4 78,100 (58,500–104,000)
4,780 (19–19,300)
<0.1 885 (742–1,120)
54 (0–219)
Otitis externa 726,000 (466,000–994,000)
567,000 (337,000–823,000)
0.9 29,700 (19,200–40,600)
23,200 (13,900–33,600)
<0.1 280 (144–452)
219 (107–367)
Pseudomonas pneumonia
580 (321–902)
291 (75–552)
97.2 30,800 (18,700–44,700)
15,500 (4,130–28,100)
4.6 1,450 (786–2,420)
730 (185–1,460)
Pseudomonas septicemia
164 (36–326)
36 (2–106)
97.2 25,300 (16,300–34,800)
5,590 (722–14,000)
12.1 3,140 (1,990–4,430)
695 (89–1,740)
Salmonellosis, nontyphoidal
3,410 (2,100–4,900)
194 (15–671)
28.4 26,600 (11,400–52,800)
1,520 (100–5,660)
0.5 421 (0–1,140)
24 (0–103)
STEC infection, serotype O157
252 (92–465)
12 (2–35)
38.5 2,640 (487–7,630)
138 (14–503)
0.7 36 (0–314)
2 (0–17)
STEC infection, serotype non-O157
75 (12–171)
4 (0–16)
16.0 1,420 (264–3,810)
74 (0–308)
0.2 16 (0–184)
1 (0–12)
Shigellosis 1,650 (540–2,870)
64 (5–311)
24.4 6,380 (929–20,300)
245 (12–1,140)
0.1 26 (0–218)
1 (0–9)
Vibrio spp. infection 366 (122–700)
76 (14–166)
NA 782 (567–1,030)
251 (153–362)
NA 113 (67–156)
60 (27–92)
V. alginolyticus NA§ NA§ 15.9 74 (38–141)
26 (8–58)
0.8 4 (0–11)
1 (0–5)
V. parahaemolyticus NA§ NA§ 22.3 264 (136–410)
60 (16–112)
1.4 16 (7–32)
4 (1–9)
V. vulnificus NA§ NA‡ 85.4 213 (147–297)
161 (79–241)
28.8 72 (38–104)
54 (24–85)
Other Vibrio NA§ NA§ 42.5 231 (134–350)
5 (0–46)
3.8 20 (11–33)
0 (0–4)
Total 1,180,000 (877,000–1,490,000)
601,000 (364,000–866,000)
NA 310,000 (263,000–360,000)
118,000 (86,800–150,000)
NA 13,100 (10,600–15,900)
6,630 (4,520–8,870)
*Estimates rounded to 3 significant figures. CrI, credible interval; ED, emergency department; NA, not applicable; NTM, nontuberculous mycobacterial; STEC, Shiga toxin–producing Escherichia coli. †Treat-and-release ED visits were defined as visits in which the person was not admitted to the hospital. ‡For norovirus infection only, ED visits in which the person was admitted to the hospital were included, for consistency with previous published estimates. §No International Classification of Diseases, 9th Revision, Clinical Modification, codes are available for Vibrio spp. infections, only a general code for “Vibriosis and cholera.” ED visit estimates relied on administrative data that used these codes, and thus are presented only for Vibrio infection overall.

RESEARCH
146 Emerging Infectious Diseases • www.cdc.gov/eid • Vol. 27, No. 1, January 2021
recreational, and environmental water exposures. Although the risk of illness from enteric pathogens readily controlled by water treatment processes still exists, this analysis highlights the expanding role of environmental pathogens (e.g., mycobacteria, Pseu-domonas, Legionella) that can grow in drinking water distribution systems; plumbing in hospitals, homes, and other buildings; recreational water venues; and industrial water systems (e.g., cooling towers). This snapshot of waterborne disease transmission in the United States circa 2014 contrasts with historical wa-terborne disease transmission before the implementa-tion of drinking water treatment and sanitation sys-tems (e.g., cholera, typhoid fever, and other enteric pathogens) (1).
Few comparable waterborne disease burden esti-mates exist for the United States or other high-income countries. The World Health Organization (WHO) has estimated water, sanitation, and hygiene-related disease and injury (i.e., diarrhea, drowning, malnutri-tion) (32). WHO’s estimated 6,600 annual US deaths from nondiarrheal infectious diseases is within the range of our estimate, although the infectious dis-eases included were not specified, making direct comparison difficult. Work from Australia used the WHO estimates to calculate the waterborne burden of 5 enteric pathogens, whereas estimates from Canada assessed the burden of AGI from drinking water and the burden of 5 enteric pathogens from private wells and small water systems (33–35). Work in Europe es-timated the proportion of 9 primarily enteric diseases
attributable to water (36). Prior estimates of the bur-den of waterborne disease in the United States focused on the burden of gastrointestinal illness associated with drinking water and an estimated 4–32 million cases of illness each year (16–18). Our estimate dif-fers from previous work because it focuses on specific pathogens, includes nongastrointestinal diseases, and considers all waterborne exposure routes.
A previous estimate of foodborne disease found fewer illness, hospitalizations, and deaths from food-borne disease due to known pathogens (14), although it found more illness when unspecified agents were considered (15). For pathogens included in both esti-mates, underdiagnosis multipliers did not differ sub-stantially, except for decreases in STEC multipliers because of improved laboratory capacity. The higher totals in this analysis reflect the diseases selected for inclusion, some of which cause severe respiratory diseases more likely to result in hospitalization and death than the diseases with primarily enteric ef-fects that were included in the foodborne estimate. When estimates for the enteric pathogens included in both analyses are compared, the waterborne burden is lower than the foodborne burden. This difference could be because drinking and treated recreational water systems were designed to prevent enteric ill-ness, and the intervention (disinfection) is relatively simple compared with the manifold interventions needed to prevent foodborne illness.
This work is subject to several limitations. First, we used a series of multipliers to generate estimates of
Table 4. Cost per hospital stay for selected diseases that can be transmitted by water, 2012–2013 IBM MarketScan health insurance databases, United States*
Disease/syndrome Cost in 2014 US dollars (95% CrI)
Commercial insurance Medicare Medicaid Overall Campylobacteriosis 15,200 (1,520–47,100) 15,100 (1,630–55,300) 5,900 (85–29,000) 13,600 (3,850–35,800) Cryptosporidiosis 17,900 (1,560–82,700) 17,300 (1,800–79,400) 10,700 (22–64,200) 16,100 (4,360–55,400) Giardiasis 25,300 (1,790–168,000) 22,300 (1,890–96,900) 14,300 (159–88,000) 21,800 (6,160–99,200) Legionnaires’ disease 45,900 (2,320–306,000) 33,600 (4,210–183,000) 18,700 (17–99,300) 37,100 (7,950–149,000) NTM infection 44,100 (1,650–244,000) 27,600 (1,720–152,000) 14,800 (49–69,100) 29,600 (6,350–120,000) Norovirus infection† 6,080 Otitis externa 13,800 (1,480–56,500) 14,400 (1,490–65,100) 6,680 (43–36,900) 12,200 (3,320–42,400) Pseudomonas pneumonia 45,100 (1,510–193,000) 28,200 (1,890–146,000) 11,600 (18–53,200) 29,300 (5,910–114,000) Pseudomonas septicemia 63,600 (1,450–386,000) 34,400 (2,200–181,000) 19,800 (47–113,000) 38,200 (6,340–172,000) Salmonellosis, nontyphoidal 17,200 (2,010–73,600) 17,100 (1,400–62,700) 6,940 (70–26,300) 14,900 (4,300–46,900) STEC infection, serotype O157
25,900 (2,410–150,000) 17,200 (1,860–82,200) 4,530 (3–30,200) 19,000 (3,790–85,000)
STEC infection, serotype non-O157
23,600 (1,390–95,700) 31,900 (2,620–250,000) 5,020 (458–32,000) 24,200 (4,780–138,000)
Shigellosis 19,000 (2,910–85,300) 13,500 (1,610–39,600) 7,710 (37–51,300) 14,200 (4,130–48,000) Vibrio spp. infection 17,400 (2,260–50,500) 18,400 (0,977–78,700) 4,600 (13–46,000) 16,000 (3,780–39,900) *Estimates rounded to 3 significant figures. Overall cost calculated using the sum of insurer and out-of-pocket payments per stay for each payment source multiplied by the proportion of persons in the Health Care Utilization Project’s Nationwide Inpatient Sample with each payment source, for the corresponding disease or syndrome. This produces a weighted average cost per stay that reflects the differing proportion of payment sources for each disease or syndrome. Persons who had a payment source other than commercial insurance, Medicare, or Medicaid (i.e., persons covered by Tricare (the healthcare plan for persons affiliated with the US armed services, who were uninsured, or who had an unknown source of insurance) were assumed to have a cost per stay equivalent to the commercial insurance cost per stay. NTM, nontuberculous mycobacterial; STEC, Shiga toxin–producing Escherichia coli. †Norovirus costs were derived from previously published estimates that did not specify cost per insurance source or include uncertainty intervals.

Emerging Infectious Diseases • www.cdc.gov/eid • Vol. 27, No. 1, January 2021 147
Burden and Cost of Infectious Waterborne Disease
disease, and accuracy of these estimates relies on the accuracy of the multipliers. Although we attempted to account for the uncertainty of each data point using uncertainty intervals, any systematic errors in multi-pliers will produce a biased estimate. For example, wa-terborne transmission is not the sole route of transmis-sion for any of the diseases in this work; many of the included diseases can be transmitted through multiple pathways (e.g., cryptosporidiosis can be waterborne, foodborne, or transmitted directly from animals or hu-mans). We also relied on structured expert judgment (SEJ) to estimate the proportions of diseases attributed
to waterborne transmission. SEJ is an approach used when primary data are not available, and is subject to limitations including expert bias (26,27). For norovirus infection, the uncertainty interval for the waterborne at-tribution percentage was large, reflecting a lack of con-sensus among experts, and resulting in an estimate of illness with a wide credibility interval (1,330,000 [95% CrI 5,310–5,510,000] illnesses). Second, this analysis is limited to 17 infectious diseases with adequate surveil-lance or administrative data available and does not in-clude all disease associated with waterborne transmis-sion in the United States. Insufficient data were available
Table 5. Total direct healthcare cost of ED visits and hospitalizations from domestically acquired waterborne transmission of selected infectious diseases, United States, 2014*
Disease or syndrome
Value (95% CrI) Treat-and-release ED visits†
Hospitalization Direct healthcare
cost, millions Cost per visit Total no.
visits Total cost,
millions Cost per
stay Total no. hospital
stays Total cost,
millions Campylobacteriosis 1,710
(137–5,810) 319
(31–966) 0.545
(0.0177–2.61) 13,600
(3,850–35,800)
2,150 (192–6,900)
30.0 (1.71–121)
30.5 (2.10–121)
Cryptosporidiosis 1,960 (238–6,270)
492 (167–957)
0.963 (0.0802–3.44)
16,100 (4,360–55,400)
1,120 (102–3,550)
17.9 (1.10–79.5)
18.9 (1.82–80.4)
Giardiasis 1,620 (196–7,510)
567 (185–1,120)
0.917 (0.0861–3.78)
21,800 (6,160–99,200)
1,100 (364–2,180)
23.9 (3.53–104)
24.8 (4.21–105)
Legionnaires’ disease
691 (288–1,390)
667 (289–1,200)
0.460 (0.127–1.13)
37,100 (7,950–149,000)
10,800 (7,280–13,100)
401 (79.0–1,690)
402 (79.5–1,690)
NTM infection 1,610 (129–6,430)
5,080 (2,560–7,750)
8.17 (0.584–34.0)
29,600 (6,350–120,000)
51,400 (26,800–74,100)
1,520 (266–6,370)
1,530 (272–6,380)
Norovirus‡ 1,140 26,300 30.1 6,080 4,780 29 59.1 Otitis externa 494
(120–1,430) 567,000
(337,000–823,000)
280 (60.2–846)
12,200 (3,320–42,400)
23,200 (13,900–33,600)
285 (67.8–1,040)
564 (187–1,570)
Pseudomonas pneumonia
856 (89–4,190)
291 (75–552)
0.249 (0.0162–1.27)
29,300 (5,910–114,000)
15,500 (4,130–28,100)
452 (49.8–1,950)
453 (49.9– 1,950)
Pseudomonas septicemia
923 (95–3,190)
36 (2–106)
0.0334 (0.000716–
0.186)
38,200 (6,340–172,000)
5,590 (722–14,000)
214 (11.4–1,030)
214 (11.4–1,030)
Salmonellosis, nontyphoidal
1,230 (161–4,500)
194 (15–671)
0.240 (0.00734–1.24)
14,900 (4,300–46,900)
1,520 (100–5,660)
22.6 (0.870–110)
22.8 (1.08–110)
STEC infection, serotype O157
1,070 (109–2,350)
12 (2–35)
0.0130 (0.00734–
0.051)
19,000 (3,790–85,000)
138 (14–503)
2.67 (0.129–14.5)
2.68 (0.141–14.5)
STEC infection, serotype non-O157
1,070 (109–2,350)
4 (0–16)
0.00440 (0–0.0223)
24,200 (4,780–138,000)
74 (0–308)
1.76 (0–11.0)
1.76 (0.00186–
11.0) Shigellosis 952
(115–3,980) 64
(5–311) 0.0609
(0.00171–0.349)
14,200 (4,130–48,000)
245 (13–1,140)
3.41 (0.106–18.9)
3.47 (0.140–19.0)
Vibrio spp. infection 1,030 (293–3,330)
76 (14–166)
0.0777 (0.00765–
0.276)
16,000 (3,780–39,900)
251 (153–362)
4.02 (0.811–10.7)
4.10 (0.891–10.8)
Total cost
322 (100–889)
3,010 (1,120–8,410)
3,330 (1,370–8,770)
*Values are 2004 US dollars except as indicated. Estimates rounded to 3 significant figures. CrI, credible interval; ED, emergency department; NTM, nontuberculous mycobacterial; STEC, Shiga toxin-producing E. coli. †Treat-and-release ED visits were defined as visits in which the person was not admitted to the hospital. ‡For norovirus only, costs were derived from previously published estimates that did not include uncertainty intervals. In addition, the number of ED visits includes visits in which the patient was admitted to the hospital.

RESEARCH
148 Emerging Infectious Diseases • www.cdc.gov/eid • Vol. 27, No. 1, January 2021
to quantify the contribution of many viral diseases, including sapovirus, rotavirus, and astrovirus; or free-living ameba infections, which cause deaths in the United States each year (5). Noninfectious diseases (e.g., from exposure to harmful algal blooms, heavy metals, disinfection byproducts) were not considered. Third, these estimates used administrative data and relied on coding from the International Classification of Diseases, 9th Revision, Clinical Modification, which might not accurately capture the actual disease of the ill person. Fourth, the cost estimates consider only out-of-pocket and insurer payments and do not account for the total amount of time or wages lost to ill health, dis-ability, early death, or other indirect costs. Physicians’ office visits were not included, because data were not available. Payment totals might not reflect the actual cost incurred by healthcare providers. Fifth, this work did not make separate estimates for different age, de-mographic, or risk groups. Risks could differ by group (e.g., children swim more often and have higher rates of cryptosporidiosis), resulting in over- or underesti-mation of waterborne disease (37,38). Cost estimates did not consider the contribution of immunosup-pressing conditions or other concurrent conditions to the healthcare costs incurred. Finally, some estimates used data from FoodNet. In 2007, Hispanic persons were underrepresented in FoodNet sites (39). Appen-dix 1 contains additional pathogen-specific limitations. Analytic strengths of these burden estimates include the use of active surveillance data when possible, es-timates from a comprehensive structured expert judg-ment, and credible intervals to acknowledge the inher-ent uncertainty in the model inputs and outputs.
The data presented here reflect the changing pic-ture of waterborne disease in the United States and underscore the role of environmental pathogens that grow in biofilms. An estimated 7.15 million (95% CrI 3.88 million–12.0 million) domestically acquired wa-terborne illnesses occur in the United States each year, highlighting the need to focus public health resources on the prevention and control of these diseases, in-cluding surveillance for the diseases in this estimate that do not have a dedicated national case surveil-lance system (e.g., NTM infections). These findings should serve as a foundation for improved disease surveillance, inform waterborne disease prevention priorities, and help measure progress in the preven-tion of waterborne disease in the United States.AcknowledgmentsThe authors thank Jennifer Cope, Michele Hlavsa, Jennifer Huang, Mary Patrick, Logan Ray, Danielle Tack, Patricia Griffin, Tina Nane, Shelly Gleason, John Person, and Aubrey Gilliland for their assistance.
About the AuthorMs. Collier is an analytic epidemiologist in the National Center for Emerging and Zoonotic Infectious Diseases at the Centers for Disease Control and Prevention, Atlanta, Georgia, USA. Her research focuses on describing and quantifying the impact of waterborne disease in the United States and often incorporates data from large healthcare databases.
References 1. Armstrong GL, Conn LA, Pinner RW. Trends in infec-
tious disease mortality in the United States during the 20th century. JAMA. 1999;281:61–6. https://doi.org/10.1001/jama.281.1.61
2. Centers for Disease Control and Prevention. Achievements in public health, 1900–1999: control of infectious diseases. MMWR Morb Mortal Wkly Rep. 1999;48:621–9.
3. Benedict KM, Reses H, Vigar M, Roth DM, Roberts VA, Mattioli M, et al. Surveillance for waterborne disease outbreaks associated with drinking water—United States, 2013–2014. MMWR Morb Mortal Wkly Rep. 2017;66:1216–21. https://doi.org/10.15585/mmwr.mm6644a3
4. McClung RP, Roth DM, Vigar M, Roberts VA, Kahler AM, Cooley LA, et al. Waterborne disease outbreaks associated with environmental and undetermined exposures to water—United States, 2013–2014. MMWR Morb Mortal Wkly Rep. 2017;66:1222–5. https://doi.org/10.15585/mmwr.mm6644a4
5. Hlavsa MC, Cikesh BL, Roberts VA, Kahler AM, Vigar M, Hilborn ED, et al. Outbreaks associated with treated recreational water—United States, 2000–2014. MMWR Morb Mortal Wkly Rep. 2018;67:547–51. https://doi.org/10.15585/mmwr.mm6719a3
6. Craun GF, Brunkard JM, Yoder JS, Roberts VA, Carpenter J, Wade T, et al. Causes of outbreaks associated with drinking water in the United States from 1971 to 2006. Clin Microbiol Rev. 2010;23:507–28. https://doi.org/10.1128/CMR.00077-09
7. Dieter CA, Maupin MA, Caldwell RR, Harris MA, Ivahnenko TI. Estimated use of water in the United States in 2015. US Geological Survey; 2018 [cited 2020 Sep 24]. https://doi.org/ 10.3133/cir1441
8. US Environmental Protection Agency. Community water system survey 2000. Volume 1: overview. 2002 [cited 2020 Sep 24]. https://nepis.epa.gov/Exe/tiff2png.cgi/20001ZK5.PNG?-r+75+-g+7+D%3A%5CZYFILES%5CINDEX%20DATA%5C00THRU05%5CTIFF%5C00000455%5C20001ZK5.TIF
9. US National Research Council. Committee on Public Water Supply Distribution Systems: Water Science and Technology Board. Drinking water distribution systems: assessing and reducing risks. Washington (DC): National Academies Press; 2006.
10. Falkinham JO III, Hilborn ED, Arduino MJ, Pruden A, Edwards MA. Epidemiology and ecology of opportunistic premise plumbing pathogens: Legionella pneumophila, Mycobacterium avium, and Pseudomonas aeruginosa. Environ Health Perspect. 2015;123:749–58. https://doi.org/10.1289/ehp.1408692
11. Shields JM, Hill VR, Arrowood MJ, Beach MJ. Inactivation of Cryptosporidium parvum under chlorinated recreational water conditions. J Water Health. 2008;6:513–20. https://doi.org/10.2166/wh.2008.068
12. Chappell CL, Okhuysen PC, Langer-Curry R, Widmer G, Akiyoshi DE, Tanriverdi S, et al. Cryptosporidium hominis: experimental challenge of healthy adults. Am J Trop

Emerging Infectious Diseases • www.cdc.gov/eid • Vol. 27, No. 1, January 2021 149
Burden and Cost of Infectious Waterborne Disease
Med Hyg. 2006;75:851–7. https://doi.org/10.4269/ ajtmh.2006.75.851
13. Paranjpye RN, Nilsson WB, Liermann M, Hilborn ED, George BJ, Li Q, et al. Environmental influences on the seasonal distribution of Vibrio parahaemolyticus in the Pacific Northwest of the USA. FEMS Microbiol Ecol. 2015;91:fiv121. https://doi.org/10.1093/femsec/fiv121
14. Scallan E, Hoekstra RM, Angulo FJ, Tauxe RV, Widdowson MA, Roy SL, et al. Foodborne illness acquired in the United States—major pathogens. Emerg Infect Dis. 2011;17:7–15. https://doi.org/10.3201/eid1701.P11101
15. Scallan E, Griffin PM, Angulo FJ, Tauxe RV, Hoekstra RM. Foodborne illness acquired in the United States— unspecified agents. Emerg Infect Dis. 2011;17:16–22. https://doi.org/10.3201/eid1701.P21101
16. Colford JM Jr, Roy S, Beach MJ, Hightower A, Shaw SE, Wade TJ. A review of household drinking water intervention trials and an approach to the estimation of endemic water-borne gastroenteritis in the United States. J Water Health. 2006;4(Suppl 2):71–88. https://doi.org/10.2166/wh.2006.018
17. Messner M, Shaw S, Regli S, Rotert K, Blank V, Soller J. An approach for developing a national estimate of waterborne disease due to drinking water and a national estimate model application. J Water Health. 2006;4(Suppl 2):201–40. https://doi.org/10.2166/wh.2006.024
18. Reynolds KA, Mena KD, Gerba CP. Risk of waterborne ill-ness via drinking water in the United States. Rev Environ Contam Toxicol. 2008;192:117–58. https://doi.org/ 10.1007/978-0-387-71724-1_4
19. DeFlorio-Barker S, Wade TJ, Jones RM, Friedman LS, Wing C, Dorevitch S. Estimated costs of sporadic gastrointestinal illness associated with surface water recreation: a combined analysis of data from NEEAR and CHEERS studies. Environ Health Perspect. 2017;125:215–22. https://doi.org/10.1289/EHP130
20. Grytdal SP, DeBess E, Lee LE, Blythe D, Ryan P, Biggs C, et al. Incidence of norovirus and other viral pathogens that cause acute gastroenteritis (AGE) among Kaiser Permanente member populations in the United States, 2012–2013. PLoS One. 2016;11:e0148395. https://doi.org/10.1371/journal.pone.0148395
21. Hall AJ, Rosenthal M, Gregoricus N, Greene SA, Ferguson J, Henao OL, et al. Incidence of acute gastroenteritis and role of norovirus, Georgia, USA, 2004–2005. Emerg Infect Dis. 2011;17:1381–8. https://doi.org/10.3201/eid1708.101533
22. Mead PS, Slutsker L, Dietz V, McCaig LF, Bresee JS, Shapiro C, et al. Food-related illness and death in the United States. Emerg Infect Dis. 1999;5:607–25. https://doi.org/10.3201/eid0505.990502
23. Scallan E, Griffin PM, McLean HQ, Mahon BE. Hospitalisations due to bacterial gastroenteritis: a comparison of surveillance and hospital discharge data. Epidemiol Infect. 2018;146:954–60. https://doi.org/10.1017/S0950268818000882
24. Gargano JW, Adam EA, Collier SA, Fullerton KE, Feinman SJ, Beach MJ. Mortality from selected diseases that can be transmitted by water—United States, 2003–2009. J Water Health. 2017;15:438–50. https://doi.org/10.2166/wh.2017.301
25. Beshearse E, Bruce BB, Nane GF, Cooke RM, Aspinall W, Hald T, et al. Using structured expert judgment for attribution of foodborne and waterborne illnesses to comprehensive transmission pathways, United States. Emerg Infect Dis. 2021 Jan [in press]. https://doi.org/10.3201/eid2701.200316
26. Aspinall WP, Cooke RM, Havelaar AH, Hoffmann S, Hald T. Evaluation of a performance-based expert elicitation:
WHO global attribution of foodborne diseases. PLoS One. 2016;11:e0149817. https://doi.org/10.1371/journal.pone.0149817
27. Cooke RM, Goossens LHJ; European Commission Directorate-General for Research and Innovation. Procedures guide for structured expert judgement. Brussels: Directorate-General for Research; 2000.
28. Vose D. Risk analysis: a quantitative guide. 3rd ed. Hoboken (NJ): Wiley; 2008.
29. R Core Team. R: A language and environment for statistical computing. Vienna: R Foundation for Statistical Computing; 2018.
30. Adam EA, Collier SA, Fullerton KE, Gargano JW, Beach MJ. Prevalence and direct costs of emergency department visits and hospitalizations for selected diseases that can be transmitted by water, United States. J Water Health. 2017;15:673–83. https://doi.org/10.2166/wh.2017.083
31. Collier SA, Stockman LJ, Hicks LA, Garrison LE, Zhou FJ, Beach MJ. Direct healthcare costs of selected diseases primarily or partially transmitted by water. Epidemiol Infect. 2012;140:2003–13. https:/doi.org/10.1017/S0950268811002858
32. Prüss-Ustün A, Bos R, Gore F, Bartram J; World Health Organization. Safer water, better health: costs, benefits and sustainability of interventions to protect and promote health. Geneva: The Organization; 2008.
33. Gibney KB, O’Toole J, Sinclair M, Leder K. Burden of disease attributed to waterborne transmission of selected enteric pathogens, Australia, 2010. Am J Trop Med Hyg. 2017;96:1400–3. https://doi.org/10.4269/ajtmh.16-0907
34. Murphy HM, Thomas MK, Medeiros DT, McFadyen S, Pintar KD. Estimating the number of cases of acute gastrointestinal illness (AGI) associated with Canadian municipal drinking water systems. Epidemiol Infect. 2016; 144:1371–85. https://doi.org/10.1017/S0950268815002083
35. Murphy HM, Thomas MK, Schmidt PJ, Medeiros DT, McFadyen S, Pintar KD. Estimating the burden of acute gastrointestinal illness due to Giardia, Cryptosporidium, Campylobacter, E. coli O157 and norovirus associated with private wells and small water systems in Canada. Epidemiol Infect. 2016;144:1355–70. https://doi.org/ 10.1017/S0950268815002071
36. Cassini A, Colzani E, Kramarz P, Kretzschmar ME, Takkinen J. Impact of food and water-borne diseases on European population health. Curr Opin Food Sci. 2016;12:21–9. https://doi.org/10.1016/j.cofs.2016.06.002
37. Collier SA, Wade TJ, Sams EA, Hlavsa MC, Dufour AP, Beach MJ. Swimming in the USA: beachgoer characteristics and health outcomes at US marine and freshwater beaches. J Water Health. 2015;13:531–43. https://doi.org/10.2166/wh.2014.095
38. Centers for Disease Control and Prevention. Cryptosporidiosis summary report—National Notifiable Diseases Surveillance System, United States, 2017; 2019 [cited 2020 Sep 24]. https://www.cdc.gov/healthywater/surveillance/pdf/2017-Cryptosporidiosis-NNDSS- Report-508.pdf
39. Angulo FJ, Scallan E. Activities, achievements, and lessons learned during the first 10 years of the Foodborne Diseases Active Surveillance Network: 1996–2005. Clin Infect Dis. 2007;44:718–25. https://doi.org/10.1086/511648
Address for correspondence: Sarah Collier, Centers for Disease Control and Prevention, 1600 Clifton Road NE, Mailstop H24-9, Atlanta, GA 30029-4027, USA; email: [email protected]

Page 1 of 27
Article DOI: https://doi.org/10.3201/eid2701.190676
Estimate of Burden and Direct Healthcare Cost of Infectious Waterborne Disease in the United States
Appendix 1
Estimation and Uncertainty Model Inputs for Selected Diseases Transmitted through Water
Appendix 1 Table 1. Estimation and uncertainty model inputs for selected diseases transmitted through water, United States Pathogen: Campylobacter spp. Model input Data source(s) Distribution* Parameters Reported/projected US illnesses
Number of illnesses caused by Campylobacter spp. infection reported to CDC’s Foodborne Diseases Active Surveillance Network (FoodNet) by FoodNet site (n = 10) and year (2012–2015) (1) scaled up to the US population (the FoodNet catchment area covers 10 sites around the United States and represented 15.3% of the US population in the study time period.)
Empirical By site and year (2012–2015), Appendix 1 Table 2
Population adjustment (year) Incidence of Campylobacter infection in each FoodNet site by year applied to 2014 US Census population estimates (2).
Degenerate Adjustment by year (2012–2015): 1.01, 1.0, 1.0, 0.99
Underreporting No underreporting multiplier; we assumed that all laboratory-confirmed Campylobacter illnesses were enumerated by FoodNet active surveillance.
Underdiagnosis (for number of illnesses) Proportion severe Proportion of cases reporting bloody diarrhea from FoodNet surveillance of laboratory-confirmed
Campylobacter infections (3). We used the same lower and upper endpoints derived from Scallan et al. (3).
PERT Low, modal, high values: 0.36, 0.45, 0.52
Medical care seeking (severe) Proportion (and 95% confidence interval [CI]) of survey respondents with bloody diarrhea who sought medical care, from FoodNet Population Surveys (2000–2001, 2002–2003, 2006–2007) (3).
PERT Low, modal, high values: 0.19, 0.35, 0.51
Medical care seeking (mild) Proportion (and 95% CI) of survey respondents with non-bloody diarrhea who sought medical care, from FoodNet Population Surveys (2000–2001, 2002–2003, 2006–2007) (3).
PERT Low, modal, high values: 0.15, 0.18, 0.20
Specimen submission (severe) Proportion (and 95% CI) of survey respondents who submitted a fecal specimen among persons with bloody diarrhea who sought medical care, from FoodNet Population Surveys (2000–2001, 2002–2003, 2006–2007) (3).
PERT Low, modal, high values: 0.11, 0.36, 0.62
Specimen submission (mild) Proportion (and 95% CI) of survey respondents who submitted a fecal specimen among persons with non-bloody diarrhea who sought medical care, from FoodNet Population Surveys (2000–2001, 2002–2003, 2006–2007) (3).
PERT Low, modal, high values: 0.12, 0.19, 0.25
Laboratory testing Proportion of clinical laboratories routinely testing fecal samples for Campylobacter, from the FoodNet Laboratory Survey (4). Uncertainty with this proportion (97%) was based on a 50% relative increase/decrease from 0.97 on an odds scale.
PERT Low, modal, high values: 0.94, 0.97, 1.00
Positive predictive value Because a substantial proportion of Campylobacter cases in 2014 were diagnosed by culture-independent diagnostic test (CIDT) only (5), and CIDTs have a lower specificity than culture-based methods, it was necessary to account for possible false-positive results from CIDT-only cases. For reported cases that were confirmed by CIDT alone, we used the positive predictive value (PPV) to convert CIDT cases to culture-confirmed cases. The PPV was defined as the probability of having a positive result in a culture-based test given a positive CIDT test. Further, because the PPV of PCR-
PERT PCR: Low, modal, high values: 0.80, 0.85, 0.90 Non-PCR: Low, modal, high values: 0.37, 0.52, 0.73

Page 2 of 27
Pathogen: Campylobacter spp. Model input Data source(s) Distribution* Parameters
based tests differ from non-PCR CIDT methods, we used separate PPVs for PCR and non-PCR CIDTs. Cases based on CIDT tests only were grouped into PCR and non-PCR. PPVs were derived from a previous publication that used data from FoodNet sites (6). Once CIDT-only cases were adjusted using the PPV to convert CIDT cases to the equivalent number of culture-confirmed cases, they were added to the number of reported culture-confirmed cases to obtain the adjusted total number of culture-confirmed cases. The PPVs were assumed to follow the PERT distribution.
Culture-based test sensitivity We used a laboratory test sensitivity rate of 70% based on studies of Salmonella (7,8) for the equivalent number of culture-confirmed cases. We assumed a lower bound of 60% and an upper bound of 90%.
PERT Low, modal, high values: 0.60, 0.70, 0.90
Proportion with treat-and-release ED visit
Proportion of treat-and-release emergency department (ED) visits (i.e., visits where the person was not admitted to the hospital) in the 2012–2014 Healthcare Cost and Utilization Project’s National Emergency Department Sample (HCUP NEDS) for International Classification of Diseases, 9th Edition, Clinical Modification (ICD-9-CM) code 008.43 (campylobacteriosis) compared with hospitalizations in the 2012–2014 HCUP National Inpatient Sample (HCUP NIS) for ICD-9-CM code 008.43. This proportion was multiplied by the number of patients with FoodNet cases of Campylobacter infection who were hospitalized.
Empirical ratio
HCUP ED visits by year (2012–2014): 1,173, 1,636, 1,501 HCUP hospitalizations (2012–2014): 5,915, 6,515, 6,090 Proportion by year, 2012–2014: 0.20, 0.26, 0.25
Proportion hospitalized Proportion of case-patients with FoodNet cases of Campylobacter infection who were hospitalized. Empirical By site and year (2012–2015); Table 3 Proportion who died Proportion of case-patients with FoodNet cases of Campylobacter infection who died. Empirical By site and year (2012–2015); Table 4 Underdiagnosis (ED visits, hospitalizations, deaths)
Number of ED visits, hospitalizations, and deaths doubled to account for underdiagnosis. PERT Low, modal, high values: 1, 2, 3
Proportion travel-related Proportion of case-patients with FoodNet cases of Campylobacter infection who reported travel outside the United States within 7 d of illness onset (2012–2015). Uncertainty with this proportion (15%) was based on a 50% relative increase/decrease on an odds scale.
PERT Low, modal, high values: 0.10, 0.15, 0.21
Proportion waterborne Structured expert judgement estimate for Campylobacter infection (9). Empirical 2.5th percentile, median, mean, 97.5th percentile: 0.01, 0.11, 0.13, 0.31
Cost of treat-and-release ED visits
Sum of insurer and out-of-pocket payments for treat-and-release emergency department visits for ICD-9-CM code 008.43 (campylobacteriosis), in 2014 US dollars, in 2012–2013 IBM MarketScan research databases, as reported by Adam et al. (10).
Empirical Mean (2.5th percentile, 97.5th percentile): 1,710 (137–5,810)
Cost of hospitalizations Sum of insurer and out-of-pocket payments for hospitalizations for ICD-9-CM code 008.43 (campylobacteriosis), in 2014 US dollars, in 2012–2013 IBM MarketScan research databases
Empirical Mean (2.5th percentile, 97.5th percentile): 13,600 (3,850–35,800)
Pathogen-specific limitations and discussion
Diagnostic testing for campylobacteriosis is changing rapidly and the proportion of reported cases diagnosed by culture-independent diagnostic test alone is increasing. The positive predictive value of CIDTs varies by method (PCR vs. non-PCR) and by brand. We attempted to account for variation by method but were unable to account for variation by brand. The proportion of laboratories routinely testing for Campylobacter is based on a survey conducted from 1995 to 2000. It is likely that laboratory testing practices have changed since 2000. However, after consultation with CDC enteric disease experts, updated data were not available, and it was agreed that 97% of laboratories routinely testing for Campylobacter was a conservative estimate (because the higher the proportion of laboratories routinely testing for a pathogen, the lower the underdiagnosis multiplier).
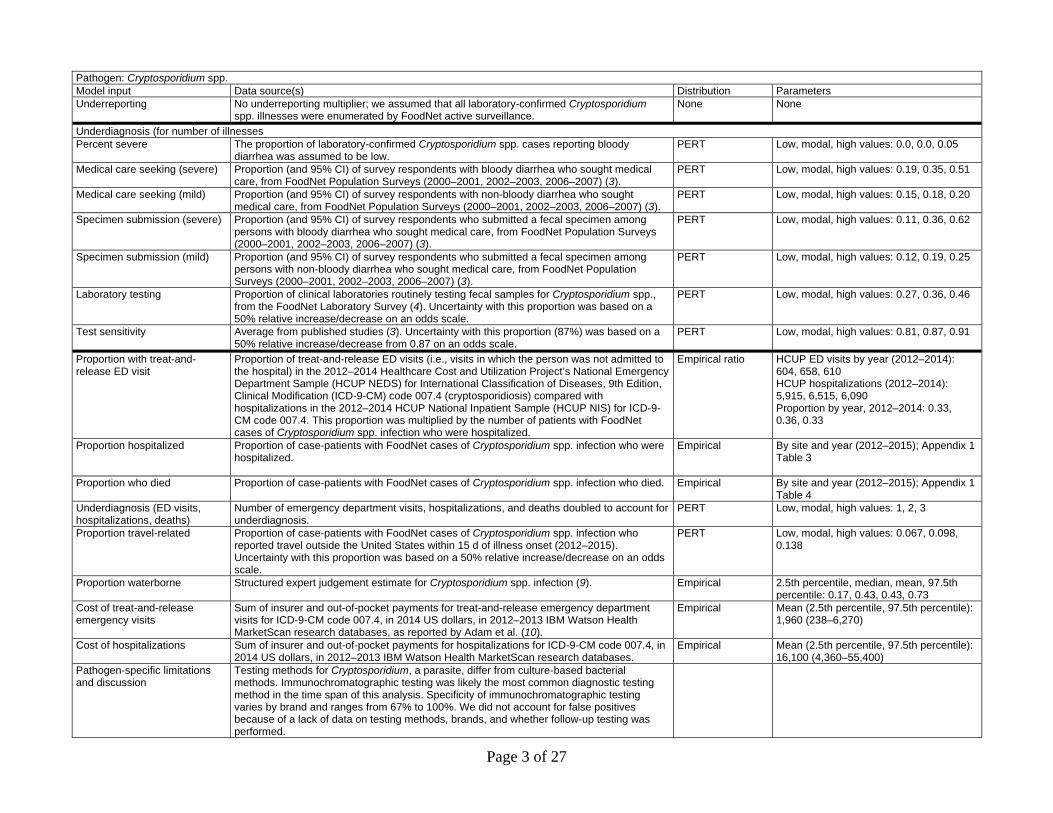
Pathogen: Cryptosporidium spp. Model input Data source(s) Distribution Parameters Reported illnesses Number of illnesses caused by Cryptosporidium spp. infection reported to CDC’s Foodborne
Diseases Active Surveillance Network (FoodNet) by FoodNet site (n = 10) and year (2012–2015) (1); scaled up to the US population (the FoodNet catchment area covers 10 sites around the United States and represented 15.3% of the US population in the study time period).
Empirical By site and year (2012–2015); Appendix 1 Table 2
Population adjustment (year) Incidence of Cryptosporidium spp. infection in each FoodNet site by year applied to 2014 US Census population estimates (2).
Degenerate Adjustment by year (2012–2015): 1.01, 1.0, 1.0, 0.99
Page 3 of 27
Pathogen: Cryptosporidium spp. Model input Data source(s) Distribution Parameters Underreporting No underreporting multiplier; we assumed that all laboratory-confirmed Cryptosporidium
spp. illnesses were enumerated by FoodNet active surveillance. None None
Underdiagnosis (for number of illnesses Percent severe The proportion of laboratory-confirmed Cryptosporidium spp. cases reporting bloody
diarrhea was assumed to be low. PERT Low, modal, high values: 0.0, 0.0, 0.05
Medical care seeking (severe) Proportion (and 95% CI) of survey respondents with bloody diarrhea who sought medical care, from FoodNet Population Surveys (2000–2001, 2002–2003, 2006–2007) (3).
PERT Low, modal, high values: 0.19, 0.35, 0.51
Medical care seeking (mild) Proportion (and 95% CI) of survey respondents with non-bloody diarrhea who sought medical care, from FoodNet Population Surveys (2000–2001, 2002–2003, 2006–2007) (3).
PERT Low, modal, high values: 0.15, 0.18, 0.20
Specimen submission (severe) Proportion (and 95% CI) of survey respondents who submitted a fecal specimen among persons with bloody diarrhea who sought medical care, from FoodNet Population Surveys (2000–2001, 2002–2003, 2006–2007) (3).
PERT Low, modal, high values: 0.11, 0.36, 0.62
Specimen submission (mild) Proportion (and 95% CI) of survey respondents who submitted a fecal specimen among persons with non-bloody diarrhea who sought medical care, from FoodNet Population Surveys (2000–2001, 2002–2003, 2006–2007) (3).
PERT Low, modal, high values: 0.12, 0.19, 0.25
Laboratory testing Proportion of clinical laboratories routinely testing fecal samples for Cryptosporidium spp., from the FoodNet Laboratory Survey (4). Uncertainty with this proportion was based on a 50% relative increase/decrease on an odds scale.
PERT Low, modal, high values: 0.27, 0.36, 0.46
Test sensitivity Average from published studies (3). Uncertainty with this proportion (87%) was based on a 50% relative increase/decrease from 0.87 on an odds scale.
PERT Low, modal, high values: 0.81, 0.87, 0.91
Proportion with treat-and-release ED visit
Proportion of treat-and-release ED visits (i.e., visits in which the person was not admitted to the hospital) in the 2012–2014 Healthcare Cost and Utilization Project’s National Emergency Department Sample (HCUP NEDS) for International Classification of Diseases, 9th Edition, Clinical Modification (ICD-9-CM) code 007.4 (cryptosporidiosis) compared with hospitalizations in the 2012–2014 HCUP National Inpatient Sample (HCUP NIS) for ICD-9-CM code 007.4. This proportion was multiplied by the number of patients with FoodNet cases of Cryptosporidium spp. infection who were hospitalized.
Empirical ratio HCUP ED visits by year (2012–2014): 604, 658, 610 HCUP hospitalizations (2012–2014): 5,915, 6,515, 6,090 Proportion by year, 2012–2014: 0.33, 0.36, 0.33
Proportion hospitalized Proportion of case-patients with FoodNet cases of Cryptosporidium spp. infection who were hospitalized.
Empirical By site and year (2012–2015); Appendix 1 Table 3
Proportion who died Proportion of case-patients with FoodNet cases of Cryptosporidium spp. infection who died. Empirical By site and year (2012–2015); Appendix 1 Table 4
Underdiagnosis (ED visits, hospitalizations, deaths)
Number of emergency department visits, hospitalizations, and deaths doubled to account for underdiagnosis.
PERT Low, modal, high values: 1, 2, 3
Proportion travel-related Proportion of case-patients with FoodNet cases of Cryptosporidium spp. infection who reported travel outside the United States within 15 d of illness onset (2012–2015). Uncertainty with this proportion was based on a 50% relative increase/decrease on an odds scale.
PERT Low, modal, high values: 0.067, 0.098, 0.138
Proportion waterborne Structured expert judgement estimate for Cryptosporidium spp. infection (9). Empirical 2.5th percentile, median, mean, 97.5th percentile: 0.17, 0.43, 0.43, 0.73
Cost of treat-and-release emergency visits
Sum of insurer and out-of-pocket payments for treat-and-release emergency department visits for ICD-9-CM code 007.4, in 2014 US dollars, in 2012–2013 IBM Watson Health MarketScan research databases, as reported by Adam et al. (10).
Empirical Mean (2.5th percentile, 97.5th percentile): 1,960 (238–6,270)
Cost of hospitalizations Sum of insurer and out-of-pocket payments for hospitalizations for ICD-9-CM code 007.4, in 2014 US dollars, in 2012–2013 IBM Watson Health MarketScan research databases.
Empirical Mean (2.5th percentile, 97.5th percentile): 16,100 (4,360–55,400)
Pathogen-specific limitations and discussion
Testing methods for Cryptosporidium, a parasite, differ from culture-based bacterial methods. Immunochromatographic testing was likely the most common diagnostic testing method in the time span of this analysis. Specificity of immunochromatographic testing varies by brand and ranges from 67% to 100%. We did not account for false positives because of a lack of data on testing methods, brands, and whether follow-up testing was performed.

Page 4 of 27
Pathogen: Giardia duodenalis Model input Data source(s) Distribution Parameters Reported illnesses Number of illnesses caused by Giardia duodenalis reported to CDC’s National Notifiable
Diseases Surveillance System (NNDSS) (2008–2015) (11). Because not all states report giardiasis to NNDSS, estimates were scaled up to the total US population.
Empirical By year (2008–2015): 19,153, 19,562, 19,984, 16,870, 15,224, 15,318, 14,657, 14,678
Population adjustment (year) Population ratios applied to each year from 2008–2014 based on US Census population estimates for states that report giardiasis to NNDSS (2)
Degenerate Adjustment by year (2008–2014): 1.05, 1.04, 1.03, 1.02, 1.01, 1.0, 1.0
Underreporting Passive surveillance multiplier used to adjust for underreporting (3) PERT Low, modal, high values: 1.0, 1.3, 1.6 Underdiagnosis (for number of illnesses) Percent severe Assumed to be mostly mild (12). PERT Low, modal, high values: 0.0, 0.0, 0.05 Medical care seeking (severe) Proportion (and 95% CI) of survey respondents with bloody diarrhea who sought medical
care, from FoodNet Population Surveys (2000–2001, 2002–2003, 2006–2007) (3) PERT Low, modal, high values: 0.19, 0.35, 0.51
Medical care seeking (mild) Proportion (and 95% CI) of survey respondents with non-bloody diarrhea who sought medical care, from FoodNet Population Surveys (2000–2001, 2002–2003, 2006–2007) (3).
PERT Low, modal, high values: 0.15, 0.18, 0.20
Specimen submission (severe) Proportion (and 95% CI) of survey respondents who submitted a fecal specimen among persons with bloody diarrhea who sought medical care, from FoodNet Population Surveys (2000–2001, 2002–2003, 2006–2007) (3).
PERT Low, modal, high values: 0.11, 0.36, 0.62
Specimen submission (mild) Proportion (and 95% CI) of survey respondents who submitted a fecal specimen among persons with non-bloody diarrhea who sought medical care, from FoodNet Population Surveys (2000–2001, 2002–2003, 2006–2007) (3).
PERT Low, modal, high values: 0.12, 0.19, 0.25
Laboratory testing Used the parameter generated by Scallan et al. (3), which was based on consultations with clinical and billing code experts. Uncertainty with this proportion (80%) was based on a 50% relative increase/decrease from 0.80 on an odds scale.
PERT Low, modal, high values: 0.73, 0.80, 0.86
Test sensitivity Average from published studies (3). We used uniform minimum variance unbiased (UMVU) estimators for lower and upper endpoints.
PERT Low, modal, high values: 0.72, 0.83, 0.93
Proportion with treat-and-release ED visit
Proportion of treat-and-release ED visits (in which the person was not admitted to the hospital) in the 2012–2014 Healthcare Cost and Utilization Project’s National Emergency Department Sample (HCUP NEDS) for International Classification of Diseases, 9th Edition, Clinical Modification (ICD-9-CM) code 007.1 (giardiasis) compared with hospitalizations in the 2012–2014 HCUP National Inpatient Sample (HCUP NIS) for ICD-9-CM code 007.1.
Empirical ratio HCUP ED visits by year (2012–2014): 713, 712, 746 HCUP hospitalizations (2012–2014): 1,430, 1,425, 1,415 Proportion by year, 2012–2014: 0.5, 0.5, 0.53
Proportion hospitalized Proportion of case-patients hospitalized, estimated using annual national estimates of hospitalization from the National Inpatient Sample (NIS) (2008–2014) using ICD-9-CM code 007.1 (giardiasis) compared with the number of illnesses reported in NNDSS (11).
Empirical By year (2008–2014): 0.098, 0.094, 0.089, 0.094, 0.093, 0.097
Proportion who died Proportion of case-patients who died, estimated using annual national estimates of in-hospital deaths from the NIS (2008–2015) using ICD-9-CM code 007.1 (giardiasis) compared with the total number of cases from NNDSS.
Empirical Number of deaths by year (2008–2014): 2, 0, 1, 5, 3, 1, 2, 1 Proportion by year (per 100,000 cases): 10.4, 0, 5, 29.6, 19.7, 6.5, 13.6, 6.8
Underdiagnosis (ED visits, hospitalizations, deaths)
Number of ED visits, hospitalizations, and deaths doubled to account for underdiagnosis. PERT Low, modal, high values: 1, 2, 3
Proportion travel-related 12.1% based on a published study (13). Uncertainty with this proportion was based on a 50% relative increase/decrease on an odds scale
PERT Low, modal, high values: 0.08, 0.12, 0.17
Proportion waterborne Structured expert judgment estimate for giardiasis infection (9) Empirical 2.5th percentile, median, mean, 97.5th percentile: 0.16, 0.43, 0.44, 0.78
Cost of treat-and-release emergency visits
Sum of insurer and out-of-pocket payments for treat-and-release emergency department visits for ICD-9-CM code 007.1, in 2014 US dollars, in 2012–2013 IBM Watson Health MarketScan research databases, as reported by Adam et al. (10)
Empirical Mean (2.5th percentile, 97.5th percentile): 1,620 (196–7,510)
Cost of hospitalizations Sum of insurer and out-of-pocket payments for hospitalizations for ICD-9-CM code 007.1, in 2014 US dollars, in 2012–2013 IBM Watson Health MarketScan research databases.
Empirical Mean (2.5th percentile, 97.5th percentile): 21,800 (6,160–99,200)

Page 5 of 27
Pathogen: Giardia duodenalis Model input Data source(s) Distribution Parameters Pathogen-specific limitations and discussion
Giardiasis is a nationally notifiable disease. However, each state has its own laws and regulations defining which diseases are reportable (https://wwwn.cdc.gov/nndss/data-collection.html). Clinical detection and diagnosis are challenging because many physicians lack familiarity with giardiasis, many symptoms (e.g., diarrhea) are nonspecific, and standard bacterial fecal cultures will not detect Giardia (14–16).
Pathogen: Legionella Model input Data source(s) Distribution Distribution values Reported illnesses Incidence of Legionella infection resulting in Legionnaires’ disease reported to CDC’s
National Notifiable Diseases Surveillance System (NNDSS, 2008–2014 [17]). Empirical By year: 3181, 3522, 3346, 4202, 3688,
4954, 5166 Population adjustment (year) Population ratios applied to each year from 2008–2014 based on US Census population
estimates (2) and adjusted for increasing trend Degenerate Adjustment by year (2008–2014): 1.05,
1.04, 1.03, 1.02, 1.01, 1.0, 1.0 Underreporting All cases assumed to be reported Constant 100% Percent severe All cases of infection assumed to be severe Constant 100% Underdiagnosis (for number of illnesses) Medical care seeking Assumed to have a high rate of medical care seeking (97.9% hospitalized in cases
reported to CDC’s Active Bacterial Core surveillance program, 2011–2015) (18). PERT Low, modal, high values: 0.99, 0.995, 1.0
Specimen submission In one healthcare system where universal testing of patients with community-acquired pneumonia for Legionnaires’ disease was implemented, 56% of patients with Legionnaires’ disease would have been tested using standard guidelines (19).
PERT Low, modal, high values: 0.46, 0.56, 0.66
Laboratory testing We assumed that all facilities would have access to laboratories capable of performing the urinary antigen test for Legionella pneumophila serogroup 1.
Constant 100%
Laboratory test sensitivity 71% based on published study of sensitivity of urinary antigen test for all Legionella species and serogroups (20)
PERT Low, modal, high values: 0.791, 0.794, 0.797
Proportion with a treat-and-release ED visit
Ratio of treat-and-release ED visits to hospitalizations from the Health Care Utilization Project’s National Emergency Department Sample and National Inpatient Sample, 2012–2014, using ICD-9-CM code 482.84 (Legionnaires’ disease). This proportion was multiplied by the number of case-patients with NNDSS cases of Legionnaires’ disease who were hospitalized.
Empirical ratio HCUP ED visits by year (2012–2014): 333, 445, 250 HCUP hospitalizations (2012–2014): 3,680, 4,810, 4,170 Proportion by year, 2012–2014: 0.09, 0.09, 0.06
Proportion hospitalized Proportion hospitalized (97.9%) in cases reported to CDC’s Active Bacterial Core surveillance program, 2011–2013 (18)
Empirical By year (2008–2014): 0.981, 0.981, 0.981, 0.980, 0.976, 0.987, 0.980
Proportion who died Proportion of case-patients who died, reported to CDC’s Active Bacterial Core surveillance program, 2011–2015 (18)
Empirical By year: 0.096, 0.1058, 0.0843, 0.0775
Underdiagnosis (ED visits, hospitalizations, deaths)
Because nearly all case-patients were hospitalized, the underdiagnosis multiplier for ED visits, hospitalizations, and deaths was assumed to be the same as the underdiagnosis multiplier for illnesses.
PERT Low, modal, high values: 1.9, 2.3, 2.8
Proportion travel-related Proportion of persons with Legionnaires’ disease who reported travel outside the United States within 10 d of illness onset (2005–2014) in CDC’s Supplemental Legionnaires’ Disease Surveillance System (14). Uncertainty with this proportion (1%) was based on a 50% relative increase/decrease from 0.01 on an odds scale.
PERT Low, modal, high values: 0.0067, 0.01, 0.0149
Proportion waterborne Structured expert judgment estimate for Legionnaires’ disease (9). Empirical 2.5th percentile, median, mean, 97.5th percentile: 0.67, 1, 0.97, 1
Cost of treat-and-release ED visits
Sum of insurer and out-of-pocket payments for treat-and-release ED visits for ICD-9-CM code 482.84, in 2014 US dollars, in 2012–2013 IBM Watson Health MarketScan research databases, from data reported by Adam et al. (10).
Empirical Mean (2.5th percentile, 97.5th percentile): 691 (288–1,390)
Cost of hospitalizations Sum of insurer and out-of-pocket payments for hospitalizations for ICD-9-CM code 482.84, in 2014 US dollars, in 2012–2013 IBM Watson Health MarketScan research databases.
Empirical Mean (2.5th percentile, 97.5th percentile): 37,100 (7,950–149,000)
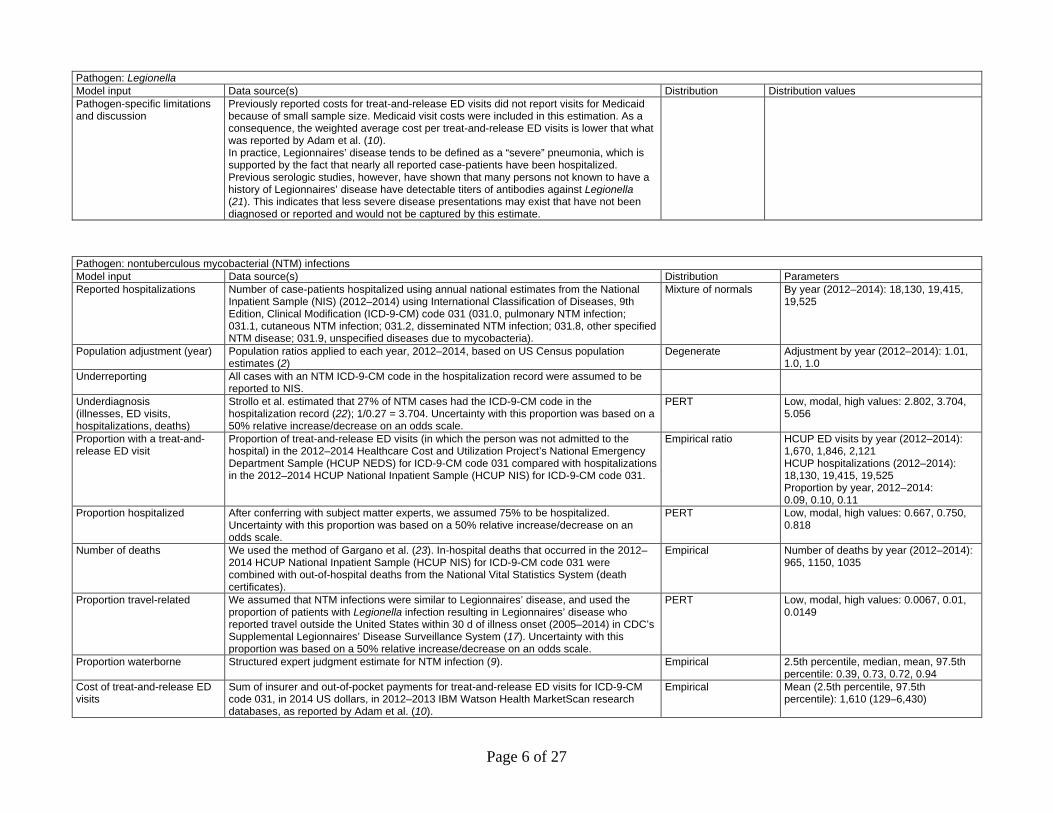
Page 6 of 27
Pathogen: Legionella Model input Data source(s) Distribution Distribution values Pathogen-specific limitations and discussion
Previously reported costs for treat-and-release ED visits did not report visits for Medicaid because of small sample size. Medicaid visit costs were included in this estimation. As a consequence, the weighted average cost per treat-and-release ED visits is lower that what was reported by Adam et al. (10). In practice, Legionnaires’ disease tends to be defined as a “severe” pneumonia, which is supported by the fact that nearly all reported case-patients have been hospitalized. Previous serologic studies, however, have shown that many persons not known to have a history of Legionnaires’ disease have detectable titers of antibodies against Legionella (21). This indicates that less severe disease presentations may exist that have not been diagnosed or reported and would not be captured by this estimate.
Pathogen: nontuberculous mycobacterial (NTM) infections Model input Data source(s) Distribution Parameters Reported hospitalizations Number of case-patients hospitalized using annual national estimates from the National
Inpatient Sample (NIS) (2012–2014) using International Classification of Diseases, 9th Edition, Clinical Modification (ICD-9-CM) code 031 (031.0, pulmonary NTM infection; 031.1, cutaneous NTM infection; 031.2, disseminated NTM infection; 031.8, other specified NTM disease; 031.9, unspecified diseases due to mycobacteria).
Mixture of normals By year (2012–2014): 18,130, 19,415, 19,525
Population adjustment (year) Population ratios applied to each year, 2012–2014, based on US Census population estimates (2)
Degenerate Adjustment by year (2012–2014): 1.01, 1.0, 1.0
Underreporting All cases with an NTM ICD-9-CM code in the hospitalization record were assumed to be reported to NIS.
Underdiagnosis (illnesses, ED visits, hospitalizations, deaths)
Strollo et al. estimated that 27% of NTM cases had the ICD-9-CM code in the hospitalization record (22); 1/0.27 = 3.704. Uncertainty with this proportion was based on a 50% relative increase/decrease on an odds scale.
PERT Low, modal, high values: 2.802, 3.704, 5.056
Proportion with a treat-and-release ED visit
Proportion of treat-and-release ED visits (in which the person was not admitted to the hospital) in the 2012–2014 Healthcare Cost and Utilization Project’s National Emergency Department Sample (HCUP NEDS) for ICD-9-CM code 031 compared with hospitalizations in the 2012–2014 HCUP National Inpatient Sample (HCUP NIS) for ICD-9-CM code 031.
Empirical ratio HCUP ED visits by year (2012–2014): 1,670, 1,846, 2,121 HCUP hospitalizations (2012–2014): 18,130, 19,415, 19,525 Proportion by year, 2012–2014: 0.09, 0.10, 0.11
Proportion hospitalized After conferring with subject matter experts, we assumed 75% to be hospitalized. Uncertainty with this proportion was based on a 50% relative increase/decrease on an odds scale.
PERT Low, modal, high values: 0.667, 0.750, 0.818
Number of deaths We used the method of Gargano et al. (23). In-hospital deaths that occurred in the 2012–2014 HCUP National Inpatient Sample (HCUP NIS) for ICD-9-CM code 031 were combined with out-of-hospital deaths from the National Vital Statistics System (death certificates).
Empirical Number of deaths by year (2012–2014): 965, 1150, 1035
Proportion travel-related We assumed that NTM infections were similar to Legionnaires’ disease, and used the proportion of patients with Legionella infection resulting in Legionnaires’ disease who reported travel outside the United States within 30 d of illness onset (2005–2014) in CDC’s Supplemental Legionnaires’ Disease Surveillance System (17). Uncertainty with this proportion was based on a 50% relative increase/decrease on an odds scale.
PERT Low, modal, high values: 0.0067, 0.01, 0.0149
Proportion waterborne Structured expert judgment estimate for NTM infection (9). Empirical 2.5th percentile, median, mean, 97.5th percentile: 0.39, 0.73, 0.72, 0.94
Cost of treat-and-release ED visits
Sum of insurer and out-of-pocket payments for treat-and-release ED visits for ICD-9-CM code 031, in 2014 US dollars, in 2012–2013 IBM Watson Health MarketScan research databases, as reported by Adam et al. (10).
Empirical Mean (2.5th percentile, 97.5th percentile): 1,610 (129–6,430)

Page 7 of 27
Pathogen: nontuberculous mycobacterial (NTM) infections Model input Data source(s) Distribution Parameters Cost of hospitalizations Sum of insurer and out-of-pocket payments for hospitalizations for ICD-9-CM code 031, in
2014 US dollars, in 2012–2013 IBM Watson Health MarketScan research databases. Empirical Mean (2.5th percentile, 97.5th
percentile): 29,600 (6,350–120,000) Pathogen-specific limitations and discussion
Pulmonary NTM infections are believed to be the most common manifestation of NTM infection (≈90% of infections are thought to be pulmonary). NTM diagnosis codes are not an exact match to manifestations because the wording for the pulmonary and disseminated codes contain both the manifestation and a species, so they might not accurately capture the true course of illness if clinicians choose the code for the species and not the manifestation. In the Marketscan databases we have observed that persons will often have a disseminated code for one hospitalization and a pulmonary code for the next hospitalization, or vice versa. We chose to not present numbers by individual diagnosis code because we believe the overall numbers are more reliable. The total cost of an NTM infection is likely higher than the cost per hospitalization reported here, because a single infection can have multiple hospitalizations. Because data on the proportion of persons with an NTM infection who have traveled outside of the United States recently were not available, we used the proportion from Legionnaires’ disease surveillance. Dedicated surveillance for NTM infectious would address these data gaps. The illness and cost estimates in this work are in the range of with previous work. Previous estimates of the number of NTM infections in 2014 range from 50,976 (24) to 181,037 cases (22). We estimated 96,953 illnesses occurred (95% CrI 75,739–121,633). Strollo et al. estimated the US cost of pulmonary NTM infections in 2014 to be $1.7 billion, close to the $1.5 billion we estimated for all NTM infections (22).
Pathogen: norovirus Model input Data source(s) Distribution Parameters Reported illnesses Incidence of illnesses caused by norovirus infection reported to 3 sites (Georgia, Maryland/DC,
and Oregon) in the Kaiser Permanente health system (25,26). Mixture of PERTs 69.5/1,000 person-years (Georgia),
76.9/1000 person-years (Oregon), 61.8/1000 person-years (metro DC area)
Population adjustment (year)
Scaled up to the 2014 US population (2).
Underreporting Assumed to be equivalent to active surveillance during the study period. – – Underdiagnosis (for number of illnesses) Medical care seeking The Hall and Grytdal incidence estimates were adjusted for the proportion (and 95% CI) of
survey respondents among persons with diarrhea who sought medical care, from CDC’s Foodborne Diseases Active Surveillance Network (FoodNet) Population Surveys (2000–2001, 2002–2003, 2006–2007) (3). No further adjustment was made.
NA
Specimen submission The Grytdal et al. estimate was adjusted for the proportion of persons with diarrhea who submitted a fecal sample for bacterial laboratory testing in the Kaiser Permanente health system, while the Hall et al. estimate was adjusted for the proportion (and 95% CI) of survey respondents who submitted a fecal specimen among persons with diarrhea who sought medical care, from FoodNet Population Surveys (2000–2001, 2002–2003, 2006–2007) (3). No further adjustment was made.
Proportion with an ED visit Estimated annual rate of ED visits per 1,000 persons, from Gastañaduy et al. (27). Unlike other diseases in this analysis, the ED visit estimate for norovirus infection includes visits in which the person was admitted to the hospital.
PERT Low, modal, high values: 0.8, 1.35, 1.89
Number hospitalized Estimated annual rate of hospitalizations per 100,000 person-years, from Lopman et al. (28), applied to the 2014 US population to produce the annual number of hospitalizations.
Empirical By year (1997–2007): 45354, 53608, 67250, 56827, 51306, 69571, 86794, 62477, 67010, 112566, 108927

Page 8 of 27
Pathogen: norovirus Model input Data source(s) Distribution Parameters Number who died Estimated annual rate of deaths per 1,000 persons, from Hall et al. (29), applied to the 2014 US
population. Empirical By year (1999–2007): 346, 850, 723, 857,
826, 668, 714, 717, 640 Proportion travel-related Assumed to be low within the incubation period for norovirus. Low, modal, high values: 0.005, 0.01,
0.02 Proportion waterborne Structured expert judgment estimate for norovirus (9). Empirical 2.5th percentile, median, mean, 97.5th
percentile: 0, 0.03, 0.06, 0.25 Cost of treat-and-release ED visits
Previously reported costs for ED visits, converted to 2014 dollars (27).
Cost of hospitalizations Previously reported costs for hospitalizations, converted to 2014 dollars (28). Pathogen-specific limitations and discussion
For norovirus only, costs were derived from previously published costs that did not provide uncertainty intervals. Thus, cost estimates for norovirus do not include credible intervals. The previously published costs were not specifically calculated for norovirus infection and depend on the assumption that costs for norovirus infection are similar to costs for other causes of acute gastroenteritis. The proportion of persons with international travel during the incubation period for norovirus infection was assumed to be low and was not based on information from surveillance. The credible interval for the number of norovirus illnesses that are domestically acquired and waterborne is very wide, reflecting some uncertainty about the true proportion of norovirus infection that is waterborne. For norovirus only, ED visits that resulted in admission to the hospital were included in the count and cost calculation of ED visits. For other diseases, costs of ED visits that resulted in hospitalization were included in hospitalization costs, and not included in emergency visit costs. There were 4,778 hospitalizations for waterborne norovirus (some of these patients could have been admitted to the hospital without an ED visit) and 26,279 ED visits (both treat-and-release and admitted) for waterborne norovirus. If all hospitalizations are assumed to have originated with an ED visit (to estimate the largest possible effect of this double-counting), there could have been as few as 26,279 – 4,778 = 21,501 treat-and-release ED visits, and total costs for norovirus ED visits would be lower by $6,079 × 4,778 = $5,466,032.
Syndrome: otitis externa Model input Data source(s) Distribution Parameters Total illnesses Calculated using the total number of doctors’ office visits and ED visits (both treat-and-
release and admitted to the hospital) for otitis externa without concurrent otitis media, and the proportion of persons with otitis externa believed to seek medical care.
Nonparametric Sum of physician office visits and ED visits
Population adjustment (year) Population ratios applied to each year, 2012–2014, based on US Census population estimates (2).
Degenerate Adjustment by year (2012–2014): 1.01, 1.0, 1.0
Underreporting All doctors’ office visits and ED visits that received an ICD-9-CM code of interest were assumed to be reported to NAMCS and HCUP NEDS.
– –
Medical care seeking (under-diagnosis factor for illnesses)
A study of >50,000 beachgoers reported that, of beachgoers experiencing an earache after their beach visit, 29.55% sought medical care of any kind (30).
PERT Low, modal, high values: 0.2185, 0.2955, 0.3861
Number of doctors’ office visits Because no national case surveillance system for otitis externa exists, most patients were not expected to be hospitalized, and because diagnosis of otitis externa does not generally rely on laboratory testing, we used the number of doctors’ office visits for otitis externa as 1 initial input for the number of total illnesses. All visits in the National Ambulatory Medical Care Survey (for International Classification of Diseases, 9th Edition, Clinical Modification (ICD-9-CM) codes 380.10 (infective otitis externa, unspecified); 380.12 (acute swimmers' ear); and 380.14 (malignant otitis externa). Because it can be difficult to distinguish otitis externa from otitis media and a conservative estimate was desired, all visits with a concurrent diagnosis of
Mixture of normals By year (2012–2014): 1,648,338; 1,484,991; 909,753

Page 9 of 27
Syndrome: otitis externa Model input Data source(s) Distribution Parameters
ICD-9-CM code 381 (nonsuppurative otitis media and Eustachian tube disorders) or 382 (suppurative and unspecified otitis media) were excluded.
Number of ED visits (both treat-and-release and admitted to the hospital; used for total illness estimate)
All ED visits (in which the person was not admitted to the hospital) in the 2012–2014 Healthcare Cost and Utilization Project’s National Emergency Department Sample (HCUP NEDS) for ICD-9-CM codes 380.10, 380.12, and 380.14 (excluding visits with a concurrent ICD-9-CM code of 381 or 382).
Mixture of normals By year (2012–2014): 378,880; 375,869; 361,076
Number of treat-and-release ED visits
Treat-and-release ED visits (in which the person was not admitted to the hospital) in the 2012–2014 Healthcare Cost and Utilization Project’s National Emergency Department Sample (HCUP NEDS) for ICD-9-CM codes 380.10, 380.12, and 380.14 (excluding visits with a concurrent ICD-9-CM code of 381 or 382).
Nonparametric By year (2012–2014): 367,049; 364,500; 349,206
Number hospitalized Number of hospitalizations, from the Health Care Utilization Project’s National Inpatient Sample, 2012–2014, for ICD-9-CM codes 380.10, 380.12, and 380.14 (excluding hospitalizations with a concurrent ICD-9-CM code of 381 or 382).
Empirical By year (2012–2014): 15,110; 14,785; 14,400
Number who died We used the method of Gargano et al. to estimate deaths (23). Briefly, in-hospital deaths for otitis externa without concurrent otitis media that occurred in the 2012–2014 HCUP National Inpatient Sample (HCUP NIS) were combined with out-of-hospital deaths from the National Vital Statistics System.
Empirical By year (2012–2014):115, 130, 150
Underdiagnosis (ED visits, hospitalizations, deaths)
Number of ED visits, hospitalizations, and deaths doubled to account for underdiagnosis. PERT Low, modal, high values: 1, 2, 3
Proportion travel-related We assumed 7% of persons had traveled in the past week before developing otitis externa. Uncertainty with this proportion was based on a 50% relative increase/decrease on an odds scale.
PERT Low, modal, high values: 0.048, 0.07, 0.10
Proportion waterborne One study estimated 50% of otitis externa is caused by Pseudomonas and 25% by Staphylococcus aureus (31). We used the structured expert judgment estimates for Pseudomonas otitis externa and Staphylococcus aureus otitis externa (9) and averaged the water attribution rates with a weight ratio of 2:1.
Nonparametric 2.5th percentile, median, mean, 97.5th percentile: 0.67, 0.8, 0.79, 0.95
Cost of treat-and-release ED visits
Sum of insurer and out-of-pocket payments for treat-and-release ED visits for ICD-9-CM codes 380.10, 380.12, and 380.14 (excluding visits with a concurrent ICD-9-CM code of 381 or 382), in 2014 US dollars, in 2012–2013 IBM Watson Health MarketScan research databases, as reported by Adam et al. (10).
Empirical Mean (2.5th percentile, 97.5th percentile): 494 (120–1,430)
Cost of hospitalizations Sum of insurer and out-of-pocket payments for hospitalizations for ICD-9-CM codes ICD-9-CM codes 380.10, 380.12, and 380.14 (excluding hospitalizations with a concurrent ICD-9-CM code of 381 or 382), in 2014 US dollars, in 2012–2013 IBM Watson Health MarketScan research databases.
Empirical Mean (2.5th percentile, 97.5th percentile): 12,200 (3,320–42,400)
Pathogen-specific limitations and discussion
We excluded all ED and doctors’ office visits with any report of otitis media (because otitis media and otitis externa can be difficult to distinguish clinically) so these numbers are likely an underestimate. Risk of otitis externa (commonly known as “swimmer’s ear”) is correlated with levels of Pseudomonas and other pathogens in water, and increases with bather load in recreational water venues (32,33). Risk of otitis externa in beachgoers who enter the water is 1.8 times higher than in beachgoers who do not enter the water (30). Otitis externa can be acutely painful and is also a public health problem. Swimming in natural waters has been estimated to cause nearly 1 million excess cases of swimmer’s ear in the United States every year (34). Otitis externa represents a burden on the healthcare system (an estimated 2.4 million healthcare visits, and nearly half a million hours of clinician time each year [35]). Otitis externa also represents a possible source of antimicrobial overuse. Despite clinical guidelines recommending topical treatment for uncomplicated acute otitis externa, one third of outpatient visits involved prescription of systemic antimicrobials for this preventable condition (36). Finally, otitis externa is preventable, through keeping ears as dry as possible while swimming, and by making sure the ear is dry after swimming. Ear drops or a hair dryer set on low and held several inches away from the ear can aid in this process.

Page 10 of 27
Pathogen: Pseudomonas pneumonia Model input Data source(s) Distribution Parameters Reported hospitalizations Number of patients hospitalized, using annual national estimates from the National Inpatient
Sample (NIS) (2012–2014) with a primary diagnosis of International Classification of Diseases, 9th Edition, Clinical Modification (ICD-9-CM) code 482.1 (pneumonia due to Pseudomonas).
Mixture of normals By year (2012–2014): 17,040; 15,540; 13,240
Population adjustment (year) Population ratios applied to each year during 2012–2014 based on US Census population estimates (2).
Degenerate Adjustment by year (2012–2014): 1.01, 1.0, 1.0
Underreporting All cases with a primary diagnosis of Pseudomonas pneumonia in the hospital billing record were assumed to be reported to NIS.
– –
Underdiagnosis (illnesses, ED visits, hospitalizations, deaths)
Number of ED visits, hospitalizations, and deaths doubled to account for underdiagnosis. PERT Low, modal, high values: 1, 2, 3
Proportion hospitalized After conferring with subject matter experts, we assumed 97% to be hospitalized. Uncertainty with this proportion was based on a 50% relative increase/decrease on an odds scale.
PERT Low, modal, high values: 0.95, 0.97, 0.99
Proportion with a treat-and-release ED visit
Proportion of treat-and-release ED visits (in which the person was not admitted to the hospital) in the 2012–2014 Healthcare Cost and Utilization Project’s National Emergency Department Sample (HCUP NEDS) with a primary diagnosis of ICD-9-CM code 482.1.
Empirical ratio HCUP ED visits by year (2012–2014): 259, 296, 309 HCUP hospitalizations (2012–2014): 17,040; 15,540; 13,240 Proportion by year, 2012–2014: 0.02, 0.02, 0.02
Proportion who died We used the method of Gargano et al. (26). In-hospital deaths that occurred in the 2012–2014 HCUP National Inpatient Sample (HCUP NIS) with a primary diagnosis of ICD-9-CM code 482.1 were combined with out-of-hospital deaths from the National Vital Statistics System (death certificates).
Empirical By year (2012–2014): 790, 555, 450
Proportion travel-related We assumed Pseudomonas pneumonia was similar to Legionnaires’ disease, and used the proportion of case-patients with Legionella infection resulting in Legionnaires’ disease who reported travel outside the United States within 30 d of illness onset (2005–2014) in CDC’s Supplemental Legionnaires’ Disease Surveillance System (17). Uncertainty with this proportion was based on a 50% relative increase/decrease on an odds scale.
PERT Low, modal, high values: 0.0067, 0.01, 0.0149
Proportion waterborne Structured expert judgment estimate for Pseudomonas pneumonia (9). Empirical 2.5th percentile, median, mean, 97.5th percentile: 0.14, 0.52, 0.51, 0.8
Cost of treat-and-release ED visits
Sum of insurer and out-of-pocket payments for treat-and-release ED visits with a primary diagnosis of ICD-9-CM code 482.1, in 2014 US dollars, in 2012–2013 IBM Watson Health MarketScan research databases, as reported by Adam et al. (10).
Empirical Mean (2.5th percentile, 97.5th percentile): 856 (89–4,190)
Cost of hospitalizations Sum of insurer and out-of-pocket payments for hospitalizations with a primary diagnosis of ICD-9-CM code 482.1, in 2014 US dollars, in 2012–2013 IBM Watson Health MarketScan research databases.
Empirical Mean (2.5th percentile, 97.5th percentile): 29,300 (5,910–114,000)
Pathogen-specific limitations and discussion
Because data on the proportion of persons with Pseudomonas pneumonia who have traveled outside the United States recently were not available, we used the proportion from Legionnaires’ disease surveillance. Because a conservative estimate was desired, we included only hospitalizations and ED visits with a primary diagnosis of Pseudomonas pneumonia, which could have excluded some hospitalizations and visits because of waterborne transmission.

Page 11 of 27
Pathogen: Pseudomonas septicemia Model input Data source(s) Distribution Parameters Reported hospitalizations Number of case-patients hospitalized using annual national estimates from the National
Inpatient Sample (NIS) (2012–2014) with a primary diagnosis of International Classification of Diseases, 9th Edition, Clinical Modification (ICD-9-CM) code 038.43 (Septicemia due to other gram-negative organisms – Pseudomonas).
Mixture of normals By year (2012-2014): 17,040; 15,540; 13,240
Population adjustment (year) Population ratios applied to each year from 2012–2014 based on US Census population estimates (2).
Degenerate Adjustment by year (2012–2014): 1.01, 1.0, 1.0
Underreporting All cases with a primary diagnosis of Pseudomonas septicemia in their hospitalization record were assumed to be reported to NIS.
– –
Underdiagnosis (illnesses, ED visits, hospitalizations, deaths)
Number of ED visits, hospitalizations, and deaths doubled to account for underdiagnosis. PERT Low, modal, high values: 1, 2, 3
Proportion hospitalized After conferring with CDC experts, we assumed 97% to be hospitalized. Uncertainty with this proportion was based on a 50% relative increase/decrease on an odds scale.
PERT Low, modal, high values: 0.95, 0.97, 0.99
Proportion with a treat-and-release ED visit
Proportion of treat-and-release ED visits (in which the person was not admitted to the hospital) in the 2012–2014 Healthcare Cost and Utilization Project’s National Emergency Department Sample (HCUP NEDS) with a primary diagnosis of ICD-9-CM code 038.43
Empirical ratio HCUP ED visits by year (2012–2014): 79, 65, 100 HCUP hospitalizations (2012–2014): 11,865, 12,570, 13,300 Proportion by year, 2012–2014: 0.01, 0.01, 0.01
Proportion who died We used the method of Gargano et al (23). In-hospital deaths that occurred in the 2012–2014 HCUP National Inpatient Sample (HCUP NIS) with a primary diagnosis of ICD-9-CM code 482.1 were combined with out-of-hospital deaths from the National Vital Statistics System (death certificates). Because death certificate data do not contain a specific code for Pseudomonas septicemia, we multiplied the number of deaths from “septicemia from other gram-negative organisms” by the proportion of septicemia from other gram-negative organisms attributed to Pseudomonas septicemia in HCUP NIS data.
Empirical By year (2012–2014): 790, 555, 450
Proportion travel-related We assumed Pseudomonas septicemia was similar to Legionnaires’ disease, and used the proportion of patients with Legionella infection resulting in Legionnaires’ disease who reported travel outside the United States within 30 d of illness onset (2005–2014) in CDC’s Supplemental Legionnaires’ Disease Surveillance System (17). Uncertainty with this proportion was based on a 50% relative increase/decrease on an odds scale.
PERT Low, modal, high values: 0.0067, 0.01, 0.0149
Proportion waterborne Structured expert judgment estimate for Pseudomonas septicemia (9). Empirical 2.5th percentile, median, mean, 97.5th percentile: 0.03, 0.21, 0.22, 0.53
Cost of treat-and-release ED visits
Sum of insurer and out-of-pocket payments for treat-and-release ED visits with a primary diagnosis of ICD-9-CM code 482.1, in 2014 US dollars, in 2012–2013 IBM Watson Health MarketScan research databases, as reported by Adam et al. (10).
Empirical Mean (2.5th percentile, 97.5th percentile): 923 (95–3,190)
Cost of hospitalizations Sum of insurer and out-of-pocket payments for hospitalizations with a primary diagnosis of ICD-9-CM code 482.1, in 2014 US dollars, in 2012–2013 IBM Watson Health MarketScan research databases.
Empirical Mean (2.5th percentile, 97.5th percentile): 38,200 (6,340–172,000)
Pathogen-specific limitations and discussion
Because data on the proportion of persons with Pseudomonas septicemia who have traveled outside the United States recently were not available, we used the proportion from Legionnaires’ disease surveillance. Because a conservative estimate was desired, we included only hospitalizations and ED visits with a primary diagnosis of Pseudomonas septicemia, which could have excluded some hospitalizations and visits resulting from waterborne transmission.
Pathogen: Salmonella, nontyphoidal serotypes Model input Data source(s) Distribution Parameters Reported illnesses Incidence of Salmonella infections excluding serotype Typhi reported to CDC’s Foodborne
Diseases Active Surveillance Network (FoodNet) by FoodNet site (n = 10) and year (2012–Empirical By site and year (2012–2015); Appendix
1 Table 2

Page 12 of 27
Pathogen: Salmonella, nontyphoidal serotypes Model input Data source(s) Distribution Parameters
2015) (1); scaled up to the US population (the FoodNet catchment area covers 10 sites around the United States and represented 15.3% of the US population in the study time period).
Population adjustment (year) Incidence of nontyphoidal Salmonella in each FoodNet site by year applied to 2014 US Census population estimates (2).
Degenerate Adjustment by year (2012–2015): 1.01, 1.0, 1.0, 0.99
Underreporting No underreporting multiplier; we assumed that all laboratory-confirmed nontyphoidal Salmonella illnesses were enumerated by FoodNet active surveillance.
– –
Underdiagnosis (for number of illnesses) Percent severe Proportion of cases reporting bloody diarrhea in FoodNet case-control studies of sporadic
laboratory-confirmed Salmonella infections (3). We used uniform minimum variance unbiased (UMVU) estimators for lower and upper endpoints.
PERT Low, modal, high values: 0.35, 0.45, 0.71
Medical care seeking (severe) Proportion (and 95% confidence interval (CI)) of survey respondents with bloody diarrhea who sought medical care, from FoodNet Population Surveys (2000–2001, 2002–2003, 2006–2007) (3)
PERT Low, modal, high values: 0.19, 0.35, 0.51
Medical care seeking (mild) Proportion (and 95% CI) of survey respondents with a non-bloody diarrhea who sought medical care, from FoodNet Population Surveys (2000–2001, 2002–2003, 2006–2007) (3).
PERT Low, modal, high values: 0.15, 0.18, 0.20
Specimen submission (severe)
Proportion (and 95% CI) of survey respondents who submitted a fecal specimen among persons with bloody diarrhea who sought medical care, from FoodNet Population Surveys (2000–2001, 2002–2003, 2006–2007) (3).
PERT Low, modal, high values: 0.11, 0.36, 0.62
Specimen submission (mild) Proportion (and 95% CI) of survey respondents who submitted a fecal specimen among persons with non-bloody diarrhea who sought medical care, from FoodNet Population Surveys (2000–2001, 2002–2003, 2006–2007) (3).
PERT Low, modal, high values: 0.12, 0.19, 0.25
Laboratory testing 100% of clinical laboratories reported routinely testing fecal samples for Salmonella in the FoodNet Laboratory Survey (4). As Scallan et al. did (3), we assumed a slightly lower rate of 97%; uncertainty with this proportion was based on a 50% relative increase/decrease from 0.97 on an odds scale.
PERT Low, modal, high values: 0.94, 0.97, 1.00
Laboratory test sensitivity We assumed a laboratory test sensitivity rate of 70% based on studies of Salmonella (7,8). We assumed a lower bound of 60% and an upper bound of 90%.
PERT Low, modal, high values: 0.60, 0.70, 0.90
Proportion with a treat-and-release ED visit
Proportion of treat-and-release ED visits (in which the person was not admitted to the hospital) in the 2012–2014 Healthcare Cost and Utilization Project’s National Emergency Department Sample (HCUP NEDS) for International Classification of Diseases, 9th Edition, Clinical Modification (ICD-9-CM) code 003 (salmonellosis) compared with hospitalizations in the 2012–2014 HCUP National Inpatient Sample (HCUP NIS) for ICD-9-CM code 003. This proportion was multiplied by the number of FoodNet case-patients with nontyphoidal Salmonella infection who were hospitalized.
Empirical ratio HCUP ED visits by year (2012–2014): 1,769, 1,554, 1,742 HCUP hospitalizations (2012–2014): 10,255, 9,470, 10,260 Proportion by year, 2012–2014: 0.17, 0.16, 0.17
Proportion hospitalized Proportion of FoodNet case-patients with nontyphoidal Salmonella infection who were hospitalized (2012–2015).
Empirical By site and year (2012–2015), Appendix 1 Table 3
Proportion who died Proportion of FoodNet case-patients with nontyphoidal Salmonella infection who died (2012–2015).
Empirical By site and year (2012–2015), Appendix 1 Table 4
Underdiagnosis (ED visits, hospitalizations, deaths)
Number of ED visits, hospitalizations, and deaths doubled to account for underdiagnosis. PERT Low, modal, high values: 1, 2, 3
Proportion travel-related Proportion of FoodNet case-patients with nontyphoidal Salmonella infection who reported travel outside the United States within 7 days of illness onset (2012–2015). Uncertainty with this proportion was based on a 50% relative increase/decrease on an odds scale.
PERT Low, modal, high values: 0.06, 0.096, 0.14
Proportion waterborne Structured expert judgment estimate for nontyphoidal Salmonella infection (9). Empirical 2.5th percentile, median, mean, 97.5th percentile: 0, 0.04, 0.06, 0.22
Cost of treat-and-release ED visits
Sum of insurer and out-of-pocket payments for treat-and-release ED visits for ICD-9-CM code 003 (salmonellosis), in 2014 US dollars, in 2012–2013 IBM Watson Health MarketScan research databases, as reported by Adam et al. (10).
Empirical Mean (2.5th percentile, 97.5th percentile): 1,230 (161–4,500)
Cost of hospitalizations Sum of insurer and out-of-pocket payments for hospitalizations for ICD-9-CM code 003 (salmonellosis), in 2014 US dollars, in 2012–2013 IBM Watson Health MarketScan research databases.
Empirical Mean (2.5th percentile, 97.5th percentile): 14,900 (4,300–46,900)

Page 13 of 27
Pathogen: Salmonella, nontyphoidal serotypes Model input Data source(s) Distribution Parameters Pathogen-specific limitations and discussion
Emergency department visits used ICD-9-CM codes, which might not fully capture all diagnosed nontyphoidal Salmonella infections. The proportion of persons with bloody and non-bloody diarrhea was based on data collected during 2000–2007. Healthcare-seeking behaviors might have changed over time.
Pathogen: Shiga toxin-producing (STEC) Escherichia coli infection, serotype O157 Model input Data source(s) Distribution Parameters Reported illnesses Number of illnesses caused by STEC O157 infection reported to CDC’s Foodborne Diseases
Active Surveillance Network (FoodNet) by FoodNet site (n = 10) and year (2012–2015) (1); scaled up to the US population (the FoodNet catchment area covers 10 sites around the United States and represented 15.3% of the US population in the study time period).
Empirical By site and year (2012–2015), Appendix 1 Table 2
Population adjustment (year) Incidence of STEC O157 infection in each FoodNet site by year applied to 2014 US Census population estimates (2).
Degenerate Adjustment by year (2012–2015): 1.01, 1.0, 1.0, 0.99
Underreporting No underreporting multiplier; we assumed that all laboratory-confirmed STEC O157 illnesses were enumerated by FoodNet active surveillance.
– –
Underdiagnosis (for number of illnesses) Percent severe Proportion of case-patients by site reporting bloody diarrhea from FoodNet case-control
study of sporadic laboratory-confirmed STEC O157 infections (37). We used the same lower and upper endpoints derived from Scallan et al. (3).
PERT Low, modal, high values: 0.85, 0.90, 1.00
Medical care seeking (severe) Proportion (and 95% CI) of survey respondents with bloody diarrhea who sought medical care, from FoodNet Population Surveys (2000–2001, 2002–2003, 2006–2007) (3).
PERT Low, modal, high values: 0.19, 0.35, 0.51
Medical care seeking (mild) Proportion (and 95% CI) of survey respondents with non-bloody diarrhea who sought medical care, from FoodNet Population Surveys (2000–2001, 2002–2003, 2006–2007) (3).
PERT Low, modal, high values: 0.15, 0.18, 0.20
Specimen submission (severe) Proportion (and 95% CI) of survey respondents who submitted a fecal specimen among persons with bloody diarrhea who sought medical care, from FoodNet Population Surveys (2000–2001, 2002–2003, 2006–2007) (3).
PERT Low, modal, high values: 0.11, 0.36, 0.62
Specimen submission (mild) Proportion (and 95% CI) of survey respondents who submitted a fecal specimen among persons with non-bloody diarrhea who sought medical care, from FoodNet Population Surveys (2000–2001, 2002–2003, 2006–2007) (3).
PERT Low, modal, high values: 0.12, 0.19, 0.25
Laboratory testing Among clinical laboratories that performed on-site testing, proportion that used a method that would isolate STEC O157 in 2014, FoodNet Laboratory Survey (B.B. Bruce, pers. comm. Methods for the FoodNet Laboratory Survey were described by Hoefer et al. [38]). Uncertainty with this proportion was based on a 50% relative increase/decrease on an odds scale.
PERT Low, modal, high values: 0.78, 0.84, 0.89
Test sensitivity We used a laboratory test sensitivity rate of 70% based on studies of Salmonella (7,8). We assumed a lower bound of 60% and an upper bound of 90%.
PERT Low, modal, high values: 0.60, 0.70, 0.90
Proportion with treat-and-release ED visit
Proportion of treat-and-release ED visits (in which the person was not admitted to the hospital) in the 2012–2014 Healthcare Cost and Utilization Project’s National Emergency Department Sample (HCUP NEDS) for International Classification of Diseases, 9th Edition, Clinical Modification (ICD-9-CM) code 041.41 (STEC O157 infection) compared to hospitalizations in the 2012–2014 HCUP National Inpatient Sample (HCUP NIS) for ICD-9-CM code 041.41. This proportion was multiplied by the number of FoodNet case-patients with STEC O157 infection who were hospitalized.
Empirical ratio HCUP ED visits by year (2012–2014): 118, 134, 124 HCUP hospitalizations (2012–2014): 770, 880, 695 Proportion by year, 2012–2014: 0.15, 0.15, 0.18
Proportion hospitalized Proportion of FoodNet case-patients with STEC O157 infection who were hospitalized. Empirical By site and year (2012–2015), Appendix 1 Table 3
Proportion who died Proportion of FoodNet case-patients with STEC O157 infection who died. Empirical By site and year (2012–2015), Appendix 1 Table 4

Page 14 of 27
Pathogen: Shiga toxin-producing (STEC) Escherichia coli infection, serotype O157 Model input Data source(s) Distribution Parameters Underdiagnosis (ED visits, hospitalizations, deaths)
Number of ED visits, hospitalizations and deaths doubled to account for underdiagnosis. PERT Low, modal, high values: 1, 2, 3
Proportion travel-related Proportion of FoodNet case-patients with STEC O157 infection who reported travel outside the United States within 7 d of illness onset (2012–2015). Uncertainty with this proportion was based on a 50% relative increase/decrease on an odds scale.
PERT Low, modal, high values: 0.05, 0.10, 0.21
Proportion waterborne Structured expert judgment estimate for STEC O157 infection (9). Empirical 2.5th percentile, median, mean, 97.5th percentile: 0.01, 0.05, 0.05, 0.13
Cost of treat-and-release ED visits
Sum of insurer and out-of-pocket payments for treat-and-release ED visits for ICD-9-CM codes 041.41 and 041.42, in 2014 US dollars, in 2012–2013 IBM Watson Health MarketScan research databases. Costs for STEC O157 and STEC non-O157 were combined and payer proportion was derived from all ED visits instead of treat-and-release visits because of small sample size.
Empirical Mean (2.5th percentile, 97.5th percentile): 1,070 (109–2,350)
Cost of hospitalizations Sum of insurer and out-of-pocket payments for hospitalizations for ICD-9-CM code 041.41, in 2014 US dollars, in 2012–2013 IBM Watson Health MarketScan research databases.
Empirical Mean (2.5th percentile, 97.5th percentile): 19,000 (3,790–85,000)
Pathogen-specific limitations and discussion
Scallan et al. (3) used the proportion of laboratories routinely testing for STEC O157, but we used the proportion of laboratories that could perform a test that would isolate STEC O157, whether they tested fecal samples routinely or upon physician request. We did this because a conservative estimate was desired, and because laboratory testing capability could have changed over time. Infections caused by STEC O157 have decreased in the past 10 y (1). The increasing use of culture-independent diagnostic tests (CIDTs) makes interpretation of trends in STEC infections difficult because CIDTs do not indicate which STEC serogroup caused the infection. The number of CIDT positive–only infections reported to FoodNet has been increasing markedly since 2013, as more clinical laboratories adopt CIDTs. Initially, increases were primarily limited to Campylobacter and STEC.
Pathogen: Shiga toxin-producing Escherichia coli (STEC) infection, serotype non-O157 Model input Data source(s) Distribution Parameters Reported illnesses Number of illnesses caused by STEC non-O157 infection reported to CDC’s Foodborne
Diseases Active Surveillance Network (FoodNet) by FoodNet site (n = 10) and year (2012–2015) (1); scaled up to the US population (the FoodNet catchment area covers 10 sites around the United States and represented 15.3% of the US population in the study time period).
Empirical By site and year (2012–2015), Appendix 1 Table 2
Population adjustment (year) Incidence of STEC non-O157 infection in each FoodNet site by year, applied to 2014 US Census population estimates (2).
Degenerate Adjustment by year (2012–2015): 1.01, 1.0, 1.0, 0.99
Underreporting No underreporting multiplier; we assumed that all laboratory-confirmed non-O157 STEC illnesses were enumerated by FoodNet active surveillance.
– –
Underdiagnosis (for number of illnesses) Percent severe Proportion of non-O157 STEC cases of infection with bloody diarrhea from published studies
in FoodNet sites (39,40). Uncertainty with this proportion (54%) was based on a 50% relative increase/decrease from 0.54 on an odds scale.
PERT Low, modal, high values: 0.44, 0.54, 0.64
Medical care seeking (severe) Proportion (and 95% CI) of survey respondents with bloody diarrhea who sought medical care, from FoodNet Population Surveys (2000–2001, 2002–2003, 2006–2007) (3).
PERT Low, modal, high values: 0.19, 0.35, 0.51
Medical care seeking (mild) Proportion (and 95% CI) of survey respondents with a non-bloody diarrhea who sought medical care, from FoodNet Population Surveys (2000–2001, 2002–2003, 2006–2007) (3).
PERT Low, modal, high values: 0.15, 0.18, 0.20
Specimen submission (severe) Proportion (and 95% CI) of survey respondents who submitted a fecal specimen among persons with bloody diarrhea who sought medical care, from FoodNet Population Surveys (2000–2001, 2002–2003, 2006–2007) (3).
PERT Low, modal, high values: 0.11, 0.36, 0.62
Specimen submission (mild) Proportion (and 95% CI) of survey respondents who submitted a fecal specimen among persons with non-bloody diarrhea who sought medical care, from FoodNet Population Surveys (2000–2001, 2002–2003, 2006–7) (3).
PERT Low, modal, high values: 0.12, 0.19, 0.25

Page 15 of 27
Pathogen: Shiga toxin-producing Escherichia coli (STEC) infection, serotype non-O157 Model input Data source(s) Distribution Parameters Laboratory testing Among clinical laboratories that performed on-site testing, proportion that used a method that
would isolate STEC non-O157 in 2014, from a FoodNet Laboratory Survey (B.B. Bruce, pers. comm.). Methods for the FoodNet Laboratory Survey were described by Hoefer et al. (38). Uncertainty with this proportion was based on a 50% relative increase/decrease on an odds scale.
PERT Low, modal, high values: 0.45, 0.55, 0.65
Test sensitivity We used a laboratory test sensitivity rate of 70% based on studies of Salmonella (7,8). We assumed a lower bound of 60% and an upper bound of 90%.
PERT Low, modal, high values: 0.60, 0.70, 0.90
Proportion with treat-and-release ED visit
Proportion of treat-and-release ED visits (in which the person was not admitted to the hospital) in the 2012–2014 Healthcare Cost and Utilization Project’s National Emergency Department Sample (HCUP NEDS) for International Classification of Diseases, 9th Edition, Clinical Modification (ICD-9-CM) code 041.42 (STEC O157 infection) compared with hospitalizations in the 2012–2014 HCUP National Inpatient Sample (HCUP NIS) for ICD-9-CM code 041.42. This proportion was multiplied by the number of FoodNet case-patients with STEC non-O157 infection who were hospitalized.
Empirical ratio HCUP ED visits by year (2012–2014): 48, 38, 25 HCUP hospitalizations (2012–2014): 160, 305, 255 Proportion by year, 2012–2014: 0.30, 0.12, 0.10
Proportion hospitalized Proportion of FoodNet case-patients with non-O157 STEC infection who were hospitalized. Empirical By site and year (2012–2015), Appendix 1 Table 3
Proportion who died Proportion of FoodNet case-patients with non-O157 STEC infection who died. Empirical By site and year (2012–2015), Appendix 1 Table 4
Underdiagnosis (ED visits, hospitalizations, deaths)
Number of ED visits, hospitalizations, and deaths doubled to account for underdiagnosis. PERT Low, modal, high values: 1, 2, 3
Proportion travel-related Proportion of FoodNet case-patients with non-O157 STEC infection who reported travel outside the United States within 7 d of illness onset (2012–2015). Uncertainty with this proportion was based on a 50% relative increase/decrease on an odds scale.
PERT Low, modal, high values: 0.05, 0.095, 0.21
Proportion waterborne Structured expert judgment estimate for non-O157 STEC infection (9). Empirical 2.5th percentile, median, mean, 97.5th percentile: 0, 0.05, 0.06, 0.17
Cost of treat-and-release ED visits
Sum of insurer and out-of-pocket payments for treat-and-release ED visits for ICD-9-CM codes 041.41 and 041.42, in 2014 US dollars, in 2012–2013 IBM Watson Health MarketScan research databases. Costs for STEC O157 and STEC non-O157 were combined and payer proportion was derived from all ED visits instead of treat-and-release visits because of small sample size.
Empirical Mean (2.5th percentile, 97.5th percentile): 1,070 (109–2,350)
Cost of hospitalizations Sum of insurer and out-of-pocket payments for hospitalizations for ICD-9-CM code 041.42, in 2014 US dollars, in 2012–2013 IBM Watson Health MarketScan research databases.
Empirical Mean (2.5th percentile, 97.5th percentile): 24,200 (4,780–138,000)
Pathogen-specific limitations and discussion
The increase in STEC incidence is driven by the increase in STEC non-O157, which is not typically included in routine fecal culture testing because it requires specialized methods (1). Routine fecal cultures performed in clinical laboratories typically include methods that identify only Salmonella, Campylobacter, Shigella, and, for some laboratories, STEC O157. The increased use of the syndrome panel tests might increase identification, and, thus, improve incidence estimates of pathogens for which testing was previously limited.
Pathogen: Shigella spp. Model input Data source(s) Distribution Parameters Reported illnesses Number of illnesses caused by Shigella spp. infection reported to CDC’s Foodborne Diseases
Active Surveillance Network (FoodNet) by FoodNet site (n = 10) and year (2012–2015) (1); scaled up to the US population (the FoodNet catchment area covers 10 sites around the United States and represented 15.3% of the US population in the study time period).
Empirical By site and year (2012–2015), Appendix 1 Table 2
Population adjustment (year) Incidence of Shigella spp. infection in each FoodNet site by year applied to 2014 US Census population estimates (2).
Degenerate Adjustment by year (2012–2015): 1.01, 1.0, 1.0, 0.99

Page 16 of 27
Pathogen: Shigella spp. Model input Data source(s) Distribution Parameters Underreporting No underreporting multiplier; we assumed that all laboratory-confirmed Shigella spp. illnesses
were enumerated by FoodNet active surveillance. – –
Underdiagnosis (for number of illnesses) Percent severe Percent of laboratory-confirmed cases of Shigella spp. infection with bloody diarrhea reported
to FoodNet surveillance in Minnesota and New York (3). We used uniform minimum variance unbiased (UMVU) estimators for lower and upper endpoints.
PERT Low, modal, high values: 0.17, 0.35, 0.53
Medical care seeking (severe) Proportion (and 95% CI) of survey respondents with bloody diarrhea who sought medical care, from FoodNet Population Surveys (2000–2001, 2002–2003, 2006–2007) (3).
PERT Low, modal, high values: 0.19, 0.35, 0.51
Medical care seeking (mild) Proportion (and 95% CI) of survey respondents with a non-bloody diarrhea who sought medical care, from FoodNet Population Surveys (2000–2001, 2002–2003, 2006–2007) (3).
PERT Low, modal, high values: 0.15, 0.18, 0.20
Specimen submission (severe) Proportion (and 95% CI) of survey respondents who submitted a fecal specimen among persons with bloody diarrhea who sought medical care, from FoodNet Population Surveys (2000–2001, 2002–2003, 2006–2007) (3).
PERT Low, modal, high values: 0.11 0.36, 0.62
Specimen submission (mild) Proportion (and 95% CI) of survey respondents who submitted a fecal specimen among persons with non-bloody diarrhea who sought medical care, from FoodNet Population Surveys (2000–2001, 2002–2003, 2006–2007) (3).
PERT Low, modal, high values: 0.12, 0.19, 0.25
Laboratory testing Proportion of clinical laboratories routinely testing fecal samples for Shigella spp., from the FoodNet Laboratory Survey (4). We assumed a slightly lower rate of 97%; uncertainty with this proportion was based on a 50% relative increase/decrease from 0.97 on an odds scale.
PERT Low, modal, high values: 0.94, 0.97, 1.00
Test sensitivity We used a laboratory test sensitivity rate of 70% based on studies of Salmonella (7,8). We assumed a lower bound of 60% and an upper bound of 90%.
PERT Low, modal, high values: 0.60, 0.70, 0.90
Proportion with a treat-and-release ED visit
Proportion of treat-and-release ED visits (in which the person was not admitted to the hospital) in the 2012–2014 Healthcare Cost and Utilization Project’s National Emergency Department Sample (HCUP NEDS) for International Classification of Diseases, 9th Edition, Clinical Modification (ICD-9-CM) code 004 (shigellosis) compared with hospitalizations in the 2012–2014 HCUP National Inpatient Sample (HCUP NIS) for ICD-9-CM code 004. This proportion was multiplied by the number of FoodNet case-patients with Shigella spp. infection who were hospitalized.
Empirical ratio HCUP ED visits by year (2012–2014): 867, 652, 935 HCUP hospitalizations (2012–2014): 1,650, 1,405, 2,075 Proportion by year, 2012–2014: 0.53, 0.46, 0.46
Proportion hospitalized Proportion of FoodNet case-patients with Shigella spp. infection who were hospitalized (2012–2015).
Empirical By site and year (2012–2015), Appendix 1 Table 3
Proportion who died Proportion of FoodNet case-patients with Shigella spp. infection who died (2012–2015). Empirical By site and year (2012–2015), Appendix 1 Table 4
Underdiagnosis (ED visits, hospitalizations, deaths)
Number of ED visits, hospitalizations and deaths doubled to account for underdiagnosis. PERT Low, modal, high values: 1, 2, 3
Proportion travel-related Proportion of FoodNet case-patients with Shigella spp. infection who reported travel outside the United States within 7 d of illness onset (2012–2015). Uncertainty with this proportion was based on a 50% relative increase/decrease on an odds scale.
PERT Low, modal, high values: 0.05, 0.078, 0.11
Proportion waterborne Structured expert judgment estimate for Shigella spp. infection (9). Empirical 2.5th percentile, median, mean, 97.5th percentile: 0.01, 0.03, 0.04, 0.21
Cost of treat-and-release ED visits
Sum of insurer and out-of-pocket payments for treat-and-release emergency department visits for ICD-9-CM code 004 (shigellosis), in 2014 US dollars, in 2012–2013 IBM Watson Health MarketScan research databases, as reported in Adam et al. (10).
Empirical Mean (2.5th percentile, 97.5th percentile): 952 (115–3,980)
Cost of hospitalizations Sum of insurer and out-of-pocket payments for hospitalizations for ICD-9-CM code 004, in 2014 US dollars, in 2012–2013 IBM Watson Health MarketScan research databases.
Empirical Mean (2.5th percentile, 97.5th percentile): 14,200 (4,130–48,000)
Pathogen-specific limitations and discussion
The majority of Shigella spp. transmission in the United States is fecal–oral, transmitted person to person or through contaminated food.

Page 17 of 27
Pathogen: Vibrio spp., all Model input Data source(s) Distribution Parameters Reported illnesses Sum of illnesses caused by Vibrio spp. including V. alginolyticus, V. vulnificus, V.
parahaemolyticus, and other species reported to CDC’s Cholera and Other Vibrio Illness Surveillance (COVIS) System (2008–2014) (41). Because of an apparent trend over time, linear regression was used to estimate the projected illness for reference year 2014. The uncertainty around the estimated illness was based on the residuals from linear regression (see Appendix 2 for more information).
Empirical By year (2008–2014): 599, 825, 927, 853, 944, 1176, 1252
Population adjustment (year) Population ratios applied to each year during 2008–2014 based on US Census population estimates (2).
Degenerate Adjustment by year (2008–2014): 1.05, 1.04, 1.03, 1.02, 1.01, 1.0, 1.0
Underreporting Passive surveillance multiplier used to adjust for underreporting (3). PERT Low, modal, high values: 0.9, 1.1, 1.3 Underdiagnosis (for number of illnesses) Percent severe Assumed to be a similar illness to non-typhoidal Salmonella infection. PERT Low, modal, high values: 0.35, 0.45, 0.71 Medical care seeking (severe) Proportion (and 95% CI) of survey respondents with bloody diarrhea who sought medical
care, from FoodNet Population Surveys (2000–2001, 2002–2003, 2006–2007) (3) PERT Low, modal, high values: 0.19, 0.35, 0.51
Medical care seeking (mild) Proportion (and 95% CI) of survey respondents with non-bloody diarrhea who sought medical care, from FoodNet Population Surveys (2000–2001, 2002–2003, 2006–2007) (3).
PERT Low, modal, high values: 0.15, 0.18, 0.20
Specimen submission (severe) Proportion (and 95% CI) of survey respondents who submitted a fecal specimen among persons with bloody diarrhea who sought medical care, from FoodNet Population Surveys (2000–2001, 2002–2003, 2006–2007) (3).
PERT Low, modal, high values: 0.10, 0.36, 0.62
Specimen submission (mild) Proportion (and 95% CI) of survey respondents who submitted a fecal specimen among persons with a non-bloody diarrhea who sought medical care from FoodNet Population Surveys (2000–2001, 2002–2003, 2006–2007) (3).
PERT Low, modal, high values: 0.12, 0.19, 0.25
Laboratory testing Proportion of clinical laboratories routinely testing fecal samples for Vibrio spp., from the FoodNet Laboratory Survey (4).
PERT Low, modal, high values: 0.41, 0.51, 0.61
Test sensitivity Proportion of clinical laboratories using appropriate diagnostic tests to test fecal samples for Vibrio spp., from the FoodNet Laboratory Survey (4).
PERT Low, modal, high values: 0.21, 0.28, 0.37
Proportion with a treat-and-release ED visit
Proportion of treat-and-release ED visits (in which the person was not admitted to the hospital) in the 2012–2014 Healthcare Cost and Utilization Project’s National Emergency Department Sample (HCUP NEDS) for International Classification of Diseases, 9th Edition, Clinical Modification (ICD-9-CM) code 001.0 (cholera due to Vibrio cholerae), 001.1 (cholera due to Vibrio cholera El Tor), 001.9 (cholera, unspecified), 005.4 (food poisoning due to Vibrio parahaemolyticus), and 005.81 (food poisoning due to Vibrio vulnificus) compared to hospitalizations in the 2012–2014 HCUP National Inpatient Sample (HCUP NIS) for the same ICD-9-CM codes.
Empirical ratio HCUP ED visits by year (2012–2014): 155, 197, 191 HCUP hospitalizations (2012–2014): 100, 175, 80 Proportion by year, 2012–2014: 1.55, 1.13, 2.39
Proportion hospitalized Proportion of case-patients with Vibrio spp. infection reported to COVIS who were hospitalized (2008–2014).
Empirical By year (2008–2014): 0.40, 0.36, 0.32, 0.34, 0.35, 0.35, 0.27
Proportion who died Proportion of case-patients with Vibrio spp. infection reported to COVIS who died (2008–2014).
Empirical By year (2008–2014): 0.06, 0.06, 0.06, 0.06, 0.06, 0.04, 0.04
Underdiagnosis (ED visits, hospitalizations, deaths)
Number of ED visits, hospitalizations, and deaths doubled to account for underdiagnosis. PERT Low, modal, high values: 1, 2, 3
Proportion travel-related Based on proportion of case-patients with Vibrio spp. infection reported to COVIS who acquired the infection while traveling outside the United States in the 7 d before illness onset (2008–2014).
PERT Low, modal, high values: 0.0992, 0.1339, 0.2275
Proportion waterborne Structured expert judgment estimate for Vibrio spp. infection (9). Empirical 2.5th percentile, median, mean, 97.5th percentile: 0.07, 0.24, 0.24, 0.38
Cost of treat-and-release ED visits
Sum of insurer and out-of-pocket payments for treat-and-release emergency department visits for ICD-9-CM codes 001, 005.4, and 005.81, in 2014 US dollars, in 2012–2013 IBM Watson Health MarketScan research databases, as reported by Adam et al. (10).
Empirical Mean (2.5th percentile, 97.5th percentile): 1,030 (293–3,330)
Cost of hospitalizations Sum of insurer and out-of-pocket payments for hospitalizations for ICD-9-CM codes 001, 005.4, and 005.81, in 2014 US dollars, in 2012–2013 IBM Watson Health MarketScan research databases.
Empirical Mean (2.5th percentile, 97.5th percentile): 16,000 (3,780–39,900)

Page 18 of 27
Pathogen: Vibrio spp., all Model input Data source(s) Distribution Parameters Pathogen-specific limitations and discussion
Vibrio spp. infection manifests in many different ways (e.g., acute gastrointestinal illness, wound infection, bacteremia). Medical care-seeking proportions likely differ for different manifestations, but the medical care-seeking proportions for acute gastrointestinal illness were used, because data were not available for other manifestations.
Pathogen: Vibrio alginolyticus Model input Data source(s) Distribution Parameters Reported illnesses Number of illnesses caused by V. alginolyticus reported to CDC’s Cholera and Other Vibrio
Illness Surveillance (COVIS) System (2008–2014) (41). Because of an apparent trend over time, linear regression was used to estimate the projected illness for reference year 2014. The uncertainty around the estimated illness was based on the residuals from linear regression (see Appendix 2 for more information).
Empirical By year (2008–2014): 103, 129, 152, 157, 188, 205, 241
Population adjustment (year) Population ratios applied to each year during 2008–2014 based on US Census population estimates (2).
Degenerate Adjustment by year (2008–2014): 1.05, 1.04, 1.03, 1.02, 1.01, 1.0, 1.0
Underreporting Passive surveillance multiplier used to adjust for underreporting (3). PERT Low, modal, high values: 0.9, 1.1, 1.3 Underdiagnosis (for number of illnesses) Percent severe Assumed to be a similar illness to nontyphoidal Salmonella infection. PERT Low, modal, high values: 0.35, 0.45, 0.71 Medical care seeking (severe) Proportion (and 95% CI) of survey respondents with bloody diarrhea who sought medical
care, from FoodNet Population Surveys (2000–2001, 2002–2003, 2006–2007) (3) PERT Low, modal, high values: 0.19, 0.35, 0.51
Medical care seeking (mild) Proportion (and 95% CI) of survey respondents with a non-bloody diarrhea who sought medical care, from FoodNet Population Surveys (2000–2001, 2002–2003, 2006–2007) (3).
PERT Low, modal, high values: 0.15, 0.18, 0.20
Specimen submission (severe) Proportion (and 95% CI) of survey respondents who submitted a fecal specimen among persons with bloody diarrhea who sought medical care, from FoodNet Population Surveys (2000–2001, 2002–2003, 2006–2007) (3).
PERT Low, modal, high values: 0.11, 0.36, 0.62
Specimen submission (mild) Proportion (and 95% CI) of survey respondents who submitted a fecal specimen among persons with a non-bloody diarrhea who sought medical care, from FoodNet Population Surveys (2000–2001, 2002–2003, 2006–2007) (3).
PERT Low, modal, high values: 0.12, 0.19, 0.25
Laboratory testing Proportion of clinical laboratories routinely testing fecal samples for Vibrio spp., from the FoodNet Laboratory Survey (4).
PERT Low, modal, high values: 0.41, 0.51, 0.61
Test sensitivity Proportion of clinical laboratories using appropriate diagnostic tests to test fecal samples for Vibrio spp., from the FoodNet Laboratory Survey (4).
PERT Low, modal, high values: 0.21, 0.28, 0.37
Proportion with a treat-and-release ED visit
Could not calculate because there is no V. alginolyticus-specific International Classification of Diseases, 9th Edition, Clinical Modification (ICD-9-CM) code.
Proportion hospitalized Proportion of case-patients with Vibrio alginolyticus infection reported to COVIS who were hospitalized (2008–2014).
Empirical By year (2008–2014): 0.25, 0.13, 0.14, 0.11, 0.13, 0.21, 0.14
Proportion who died Proportion of case-patients with Vibrio alginolyticus reported to COVIS who died (2008–2014).
Empirical By year (2008–2014): 0.02, 0.02, 0.01, 0.00, 0.01, 0.01, 0.00
Underdiagnosis (ED visits, hospitalizations, deaths)
Number of hospitalizations and deaths doubled to account for underdiagnosis. PERT Low, modal, high values: 1, 2, 3
Proportion travel-related Based on proportion of case-patients with Vibrio alginolyticus infection reported to COVIS who acquired the infection while traveling outside the United States in the 7 d before illness onset (2008–2014).
PERT Low, modal, high values: 0.0367, 0.0667, 0.0838
Proportion waterborne Structured expert judgment estimate for Vibrio alginolyticus infection (9). Empirical 2.5th percentile, median, mean, 97.5th percentile: 0.13, 0.36, 0.37, 0.71
Cost of treat-and-release ED visits
Could not calculate because there is no V. alginolyticus-specific ICD-9-CM code.
Cost of hospitalizations Could not calculate because there is no V. alginolyticus-specific ICD-9-CM code. Pathogen-specific limitations and discussion
Could not calculate costs because of poor ICD-9 code fit.
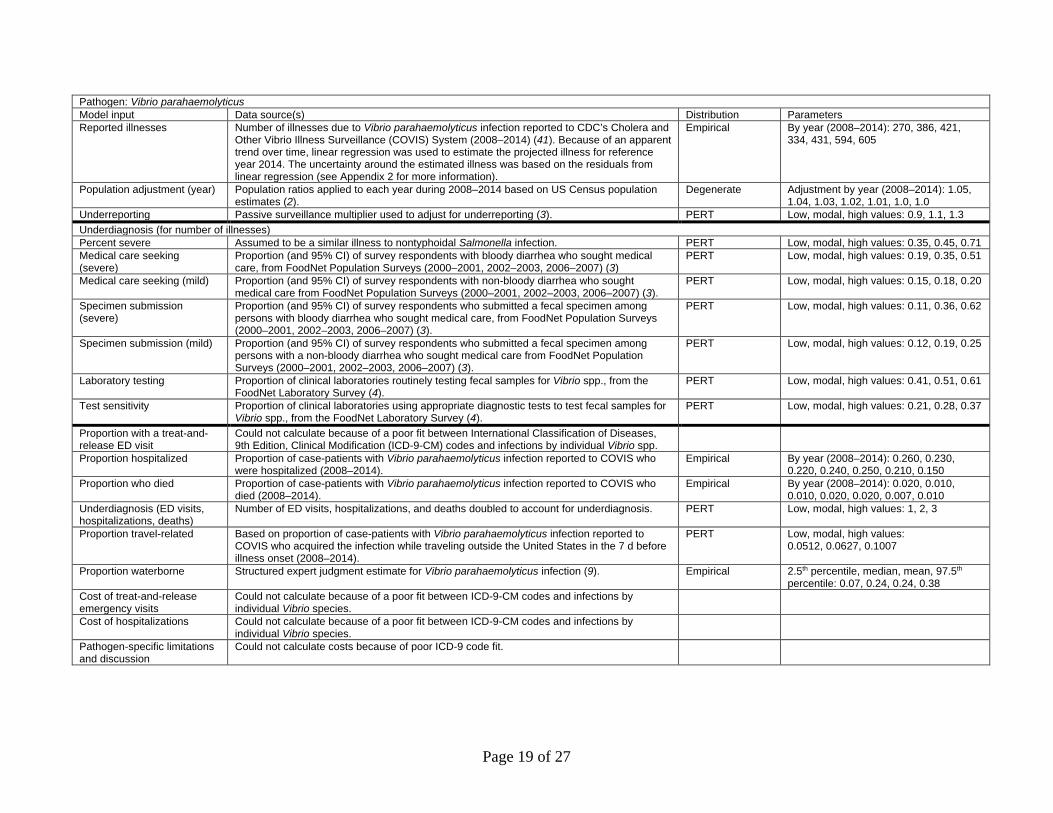
Page 19 of 27
Pathogen: Vibrio parahaemolyticus Model input Data source(s) Distribution Parameters Reported illnesses Number of illnesses due to Vibrio parahaemolyticus infection reported to CDC’s Cholera and
Other Vibrio Illness Surveillance (COVIS) System (2008–2014) (41). Because of an apparent trend over time, linear regression was used to estimate the projected illness for reference year 2014. The uncertainty around the estimated illness was based on the residuals from linear regression (see Appendix 2 for more information).
Empirical By year (2008–2014): 270, 386, 421, 334, 431, 594, 605
Population adjustment (year) Population ratios applied to each year during 2008–2014 based on US Census population estimates (2).
Degenerate Adjustment by year (2008–2014): 1.05, 1.04, 1.03, 1.02, 1.01, 1.0, 1.0
Underreporting Passive surveillance multiplier used to adjust for underreporting (3). PERT Low, modal, high values: 0.9, 1.1, 1.3 Underdiagnosis (for number of illnesses) Percent severe Assumed to be a similar illness to nontyphoidal Salmonella infection. PERT Low, modal, high values: 0.35, 0.45, 0.71 Medical care seeking (severe)
Proportion (and 95% CI) of survey respondents with bloody diarrhea who sought medical care, from FoodNet Population Surveys (2000–2001, 2002–2003, 2006–2007) (3)
PERT Low, modal, high values: 0.19, 0.35, 0.51
Medical care seeking (mild) Proportion (and 95% CI) of survey respondents with non-bloody diarrhea who sought medical care from FoodNet Population Surveys (2000–2001, 2002–2003, 2006–2007) (3).
PERT Low, modal, high values: 0.15, 0.18, 0.20
Specimen submission (severe)
Proportion (and 95% CI) of survey respondents who submitted a fecal specimen among persons with bloody diarrhea who sought medical care, from FoodNet Population Surveys (2000–2001, 2002–2003, 2006–2007) (3).
PERT Low, modal, high values: 0.11, 0.36, 0.62
Specimen submission (mild) Proportion (and 95% CI) of survey respondents who submitted a fecal specimen among persons with a non-bloody diarrhea who sought medical care from FoodNet Population Surveys (2000–2001, 2002–2003, 2006–2007) (3).
PERT Low, modal, high values: 0.12, 0.19, 0.25
Laboratory testing Proportion of clinical laboratories routinely testing fecal samples for Vibrio spp., from the FoodNet Laboratory Survey (4).
PERT Low, modal, high values: 0.41, 0.51, 0.61
Test sensitivity Proportion of clinical laboratories using appropriate diagnostic tests to test fecal samples for Vibrio spp., from the FoodNet Laboratory Survey (4).
PERT Low, modal, high values: 0.21, 0.28, 0.37
Proportion with a treat-and-release ED visit
Could not calculate because of a poor fit between International Classification of Diseases, 9th Edition, Clinical Modification (ICD-9-CM) codes and infections by individual Vibrio spp.
Proportion hospitalized Proportion of case-patients with Vibrio parahaemolyticus infection reported to COVIS who were hospitalized (2008–2014).
Empirical By year (2008–2014): 0.260, 0.230, 0.220, 0.240, 0.250, 0.210, 0.150
Proportion who died Proportion of case-patients with Vibrio parahaemolyticus infection reported to COVIS who died (2008–2014).
Empirical By year (2008–2014): 0.020, 0.010, 0.010, 0.020, 0.020, 0.007, 0.010
Underdiagnosis (ED visits, hospitalizations, deaths)
Number of ED visits, hospitalizations, and deaths doubled to account for underdiagnosis. PERT Low, modal, high values: 1, 2, 3
Proportion travel-related Based on proportion of case-patients with Vibrio parahaemolyticus infection reported to COVIS who acquired the infection while traveling outside the United States in the 7 d before illness onset (2008–2014).
PERT Low, modal, high values: 0.0512, 0.0627, 0.1007
Proportion waterborne Structured expert judgment estimate for Vibrio parahaemolyticus infection (9). Empirical 2.5th percentile, median, mean, 97.5th percentile: 0.07, 0.24, 0.24, 0.38
Cost of treat-and-release emergency visits
Could not calculate because of a poor fit between ICD-9-CM codes and infections by individual Vibrio species.
Cost of hospitalizations Could not calculate because of a poor fit between ICD-9-CM codes and infections by individual Vibrio species.
Pathogen-specific limitations and discussion
Could not calculate costs because of poor ICD-9 code fit.

Page 20 of 27
Pathogen: Vibrio vulnificus Model input Data source(s) Distribution Parameters Reported illnesses Number of illnesses caused by Vibrio vulnificus infection reported to CDC’s Cholera and
Other Vibrio Illness Surveillance (COVIS) System (2008–2014) (41). Because of an apparent trend over time, linear regression was used to estimate the projected illness for reference year 2014. The uncertainty around the estimated illness was based on the residuals from linear regression (see Appendix 2 for more information).
Empirical By year (2008–2014): 85, 107, 133, 113, 119, 137, 124
Population adjustment (year) Population ratios applied to each year during 2008–2014 based on US Census population estimates (2).
Degenerate Adjustment by year (2008–2014): 1.05, 1.04, 1.03, 1.02, 1.01, 1.0, 1.0
Underreporting Passive surveillance multiplier used to adjust for underreporting (3). PERT Low, modal, high values: 0.9, 1.1, 1.3 Underdiagnosis (for number of illnesses) Percent severe Almost all cases assumed to be severe. PERT Low, modal, high values: 0.95, 1, 1 Medical care seeking (severe) Assumed to have a high rate of medical care seeking. PERT Low, modal, high values: 0.80, 0.90, 1.00 Medical care seeking (mild) Assumed to have a high rate of medical care seeking. PERT Low, modal, high values: 0.80, 0.90, 1.00 Specimen submission (severe) Assumed to have a high rate of specimen submission. PERT Low, modal, high values: 0.70, 0.80, 0.90 Specimen submission (mild) Assumed to have a high rate of specimen submission. PERT Low, modal, high values: 0.70, 0.80, 0.90 Laboratory testing We assumed that most persons with Vibrio vulnificus who submitted a specimen for testing
would be tested. PERT Low, modal, high values: 0.94, 0.97, 1.00
Test sensitivity Based on sensitivity of blood cultures (42,43). PERT Low, modal, high values: 0.70, 0.85, 1.00 Proportion with a treat-and-release ED visit
Could not calculate because of a poor fit between International Classification of Diseases, 9th Edition, Clinical Modification (ICD-9-CM) codes and infections by individual Vibrio species
Proportion hospitalized Proportion of case-patients with Vibrio vulnificus infection reported to COVIS who were hospitalized (2008–2014).
Empirical By year (2008–2014): 0.86, 0.90, 0.75, 0.87, 0.87, 0.94, 0.79
Proportion who died Proportion of case-patients with Vibrio vulnificus infection reported to COVIS who died (2008–2014).
Empirical By year (2008–2014): 0.30, 0.32, 0.31, 0.31, 0.32, 0.28, 0.18
Underdiagnosis (ED visits, hospitalizations, deaths)
Underdiagnosis/reporting for hospitalizations and deaths (UDR H/D) were set to be the product of underdiagnosis for illness and under-reporting for illness. Underdiagnosis/ reporting for ED visit was set using a PERT distribution with parameters of (1, 2, 3).
Empirical UDR H/D: 2.5%, median and 97.5%: 1.483, 1.855, 2.321
Proportion travel-related Based on proportion of case-patients with Vibrio vulnificus infection reported to COVIS who acquired the infection while traveling outside the United States in the 7 d before illness onset (2008–2014).
PERT Low, modal, high values: 0, 0.0111, 0.045
Proportion waterborne Structured expert judgment estimate for Vibrio vulnificus infection (9). Empirical 2.5th percentile, median, mean, 97.5th percentile: 0.4, 0.8, 0.77, 0.91
Cost of treat-and-release ED visits
Could not calculate because of a poor fit between ICD-9-CM codes and infections by individual Vibrio species.
Cost of hospitalizations Could not calculate because of a poor fit between ICD-9-CM codes and infections by individual Vibrio species.
Pathogen-specific limitations and discussion
Could not calculate costs because of poor ICD-9 code fit.
Pathogen: Vibrio spp., other Model input Data source(s) Distribution Parameters Reported illnesses Number of illnesses due to Vibrio spp. other than V. alginolyticus, V. vulnificus, and V.
parahaemolyticus reported to CDC’s Cholera and Other Vibrio Illness Surveillance (COVIS) System (2008–2014) (41). Because of an apparent trend over time, linear regression was used to estimate the projected illness for reference year 2014. The uncertainty around the estimated illness was based on the residuals from linear regression (see Appendix 2 for more information).
Empirical By year (2008–2014): 141, 203, 221, 249, 206, 240, 282
Population adjustment (year) Population ratios applied to each year from 2008–2014 based on US Census population estimates (2).
Degenerate Adjustment by year (2008–2014): 1.05, 1.04, 1.03, 1.02, 1.01, 1.0, 1.0

Page 21 of 27
Pathogen: Vibrio spp., other Model input Data source(s) Distribution Parameters Underreporting Passive surveillance multiplier used to adjust for underreporting (3). PERT Low, modal, high values: 0.9, 1.1, 1.3 Underdiagnosis (for number of illnesses) Percent severe Assumed to be a similar illness to non-typhoidal Salmonella infection. PERT Low, modal, high values: 0.35, 0.45, 0.71 Medical care seeking (severe) Proportion (and 95% CI) of survey respondents with bloody diarrhea who sought medical
care ,from FoodNet Population Surveys (2000–2001, 2002–2003, 2006–2007) (3) PERT Low, modal, high values: 0.19, 0.35, 0.51
Medical care seeking (mild) Proportion (and 95% CI) of survey respondents with non-bloody diarrhea who sought medical care, from FoodNet Population Surveys (2000–2001, 2002–2003, 2006–2007) (3).
PERT Low, modal, high values: 0.15, 0.18, 0.20
Specimen submission (severe) Proportion (and 95% CI) of survey respondents who submitted a fecal specimen among persons with bloody diarrhea who sought medical care from FoodNet Population Surveys (2000–2001, 2002–2003, 2006–2007) (3).,
PERT Low, modal, high values: 0.11, 0.36, 0.62
Specimen submission (mild) Proportion (and 95% CI) of survey respondents who submitted a fecal specimen among persons with a non-bloody diarrhea who sought medical care, from FoodNet Population Surveys (2000–2001, 2002–2003, 2006–2007) (3).
PERT Low, modal, high values: 0.12, 0.19, 0.25
Laboratory testing Proportion of clinical laboratories routinely testing fecal samples for Vibrio spp., from the FoodNet Laboratory Survey (4).
PERT Low, modal, high values: 0.41, 0.51, 0.61
Test sensitivity Proportion of clinical laboratories using appropriate diagnostic tests to test fecal samples for Vibrio spp., from the FoodNet Laboratory Survey (4).
PERT Low, modal, high values: 0.21, 0.28, 0.37
Proportion with a treat-and-release ED visit
Could not calculate because of a poor fit between International Classification of Diseases, 9th Edition, Clinical Modification (ICD-9-CM) codes and infections by individual Vibrio species
Proportion hospitalized Proportion of case-patients with Vibrio, other infection reported to COVIS who were hospitalized (2008–2014).
Empirical By year (2008–2014): 0.48, 0.45, 0.38, 0.36, 0.44, 0.46, 0.41
Proportion who died Proportion of case-patients with Vibrio, other infection reported to COVIS who died (2008–2014).
Empirical By year (2008–2014): 0.04, 0.05, 0.03, 0.03, 0.04, 0.03, 0.04
Underdiagnosis (ED visits, hospitalizations, deaths)
Number of emergency department visits, hospitalizations, and deaths doubled to account for underdiagnosis.
PERT Low, modal, high values: 1, 2, 3
Proportion travel-related Based on proportion of case-patients with Vibrio, other infection reported to COVIS who acquired the infection while traveling outside the United States in the 7 d before illness onset (2008–2014).
PERT Low, modal, high values: 0.0992, 0.1339, 0.2275
Proportion waterborne Structured expert judgment estimate for Vibrio, other infection (9). Empirical 2.5th percentile, median, mean, 97.5th percentile: 0, 0.01, 0.02, 0.23
Cost of treat-and-release ED visits
Could not calculate because of a poor fit between ICD-9-CM codes and infections by individual Vibrio species.
Cost of hospitalizations Could not calculate because of a poor fit between ICD-9-CM codes and infections by individual Vibrio species.
Pathogen-specific limitations and discussion
Could not calculate costs because of poor ICD-9 code fit.
* A note on the descriptions of the distributions used here: The term “empirical” used here (as in Empirical Cumulative Density Function [ECDF]) refers to using a “finite sample” to construct a distribution to approximate the true underlying distribution/theoretical distribution. In this sense, bootstrapping observed data by simulation and simulating pseudodata for the burden outcomes are both empirical. “Degenerate” in probability terms means a constant here, in contrast to a random variable. In other words, it refers to a random variable that has a single possible value (a constant with probability 1). NA, not applicable; PERT, Program Evaluation and Review Technique.

Page 22 of 27
Appendix 1 Table 2. Number of cases of illness reported to CDC’s Foodborne Diseases Active Surveillance Network (FoodNet) by pathogen, year, and FoodNet site FoodNet site Pathogen Year CA CO CT GA MD MN NM NY OR TN Campylobacter spp. 2012 1189 414 600 1058 662 1192 399 614 907 660 Campylobacter spp. 2013 1076 344 694 983 708 1190 415 673 870 741 Campylobacter spp. 2014 1040 330 812 946 729 1082 431 708 906 679 Campylobacter spp. 2015 1245 451 783 1090 772 1411 463 636 884 759 Cryptosporidium spp. 2012 48 26 41 275 83 340 94 50 230 71 Cryptosporidium spp. 2013 46 51 38 302 65 324 47 79 177 88 Cryptosporidium spp. 2014 32 26 44 269 76 337 80 88 113 124 Cryptosporidium spp. 2015 63 69 82 406 103 319 54 99 197 266 E. coli, STEC O157 2012 39 37 19 34 33 123 15 69 95 69 E. coli, STEC O157 2013 64 26 32 48 28 144 11 42 105 54 E. coli, STEC O157 2014 51 19 17 25 20 128 14 29 72 69 E. coli, STEC O157 2015 47 38 27 27 24 114 7 27 108 47 E. coli, STEC non-O157 2012 23 42 31 91 37 110 41 43 72 50 E. coli, STEC non-O157 2013 26 70 36 66 34 127 18 45 58 66 E. coli, STEC non-O157 2014 57 67 40 64 44 164 33 48 86 72 E. coli, STEC non-O157 2015 114 69 53 76 53 110 26 57 107 116 Salmonella spp. 2012 484 264 455 2681 906 781 327 501 387 1057 Salmonella spp. 2013 586 323 446 2288 829 811 350 451 364 859 Salmonella spp. 2014 618 332 464 2247 897 722 327 503 376 953 Salmonella spp. 2015 601 316 450 2113 935 974 429 486 518 897 Shigella spp. 2012 215 56 44 666 181 391 96 211 78 203 Shigella spp 2013 193 90 59 907 105 133 61 68 52 665 Shigella spp 2014 345 55 65 1038 248 93 63 42 45 780 Shigella spp 2015 299 66 60 1301 198 292 72 43 106 208
Appendix 1 Table 3. Proportion of case-patients hospitalized, from CDC’s Foodborne Diseases Active Surveillance Network (FoodNet) by pathogen, year, and FoodNet site FoodNet sites Pathogen Year CA CO CT GA MD MN NM NY OR TN Campylobacter spp. 2012 0.1490 0.1418 0.1760 0.2375 0.1755 0.2097 0.2532 0.1800 0.0907 0.2931 Campylobacter spp. 2013 0.1157 0.1462 0.1879 0.2810 0.2193 0.1630 0.2029 0.1985 0.0820 0.3175 Campylobacter spp. 2014 0.1360 0.1311 0.2145 0.2804 0.1886 0.1867 0.2266 0.2201 0.1199 0.3002 Campylobacter spp. 2015 0.1165 0.1496 0.1826 0.2922 0.2011 0.1979 0.2078 0.2208 0.1017 0.3225 Cryptosporidium spp. 2012 0.1795 0.2000 0.1220 0.3187 0.4691 0.1088 0.2903 0.1000 0.0437 0.2941 Cryptosporidium spp. 2013 0.1282 0.1765 0.0263 0.3199 0.3860 0.1296 0.3043 0.1899 0.0739 0.3125 Cryptosporidium spp. 2014 0.2069 0.2308 0.1591 0.3529 0.2917 0.1335 0.1125 0.1494 0.0545 0.1933 Cryptosporidium spp. 2015 0.2931 0.1159 0.1481 0.2926 0.2059 0.0909 0.1296 0.1429 0.0663 0.1587 E. coli, STEC O157 2012 0.2821 0.4167 0.3158 0.4706 0.4242 0.3171 0.4000 0.3676 0.3158 0.4478 E. coli, STEC O157 2013 0.3548 0.3077 0.3438 0.2766 0.3571 0.3542 0.3636 0.5476 0.4571 0.4118 E. coli, STEC O157 2014 0.3265 0.2632 0.5882 0.3200 0.4500 0.2969 0.4286 0.3793 0.2917 0.4559 E. coli, STEC O157 2015 0.3696 0.3421 0.4074 0.2800 0.4583 0.3158 0.4286 0.6296 0.4206 0.4419 E. coli, STEC non-O157 2012 0.1500 0.1220 0.2581 0.0769 0.2162 0.1455 0.3171 0.2326 0.1389 0.1042 E. coli, STEC non-O157 2013 0.0833 0.0571 0.1714 0.0606 0.1250 0.1654 0.3333 0.2667 0.0877 0.1563 E. coli, STEC non-O157 2014 0.0800 0.0758 0.1282 0.0702 0.1905 0.1707 0.2121 0.1250 0.1279 0.3676 E. coli, STEC non-O157 2015 0.1273 0.1471 0.1698 0.1757 0.1132 0.2545 0.1923 0.1754 0.1028 0.1415 Salmonella spp. 2012 0.2249 0.2727 0.2539 0.2986 0.3464 0.2586 0.3137 0.3353 0.2506 0.3834 Salmonella spp. 2013 0.2246 0.2755 0.2320 0.2896 0.3350 0.2762 0.2607 0.3073 0.2149 0.3522 Salmonella spp. 2014 0.2147 0.2515 0.3218 0.3169 0.3546 0.2645 0.2936 0.3153 0.2139 0.3297 Salmonella spp. 2015 0.2255 0.2283 0.2978 0.2938 0.2971 0.2710 0.3380 0.2934 0.2058 0.3184 Shigella spp. 2012 0.2100 0.1964 0.2727 0.2606 0.2652 0.1432 0.3053 0.2559 0.1538 0.3094 Shigella spp 2013 0.2640 0.1778 0.2712 0.1674 0.4043 0.2556 0.2131 0.2794 0.2885 0.1866 Shigella spp 2014 0.3526 0.3091 0.2462 0.2133 0.2544 0.2151 0.3016 0.1190 0.1778 0.1397 Shigella spp 2015 0.2955 0.2576 0.2167 0.2311 0.2974 0.2158 0.1806 0.3256 0.3113 0.2402

Page 23 of 27
Appendix 1 Table 4. Proportion of case-patients who died, from CDC’s Foodborne Diseases Active Surveillance Network (FoodNet) by pathogen, year, and FoodNet site FoodNet sites Pathogen Year CA CO CT GA MD MN NM NY OR TN Campylobacter spp. 2012 0.0000 0.0024 0.0000 0.0042 0.0016 0.0034 0.0026 0.0016 0.0000 0.0016 Campylobacter spp. 2013 0.0000 0.0000 0.0000 0.0083 0.0015 0.0042 0.0000 0.0045 0.0011 0.0014 Campylobacter spp. 2014 0.0000 0.0000 0.0000 0.0012 0.0000 0.0046 0.0023 0.0028 0.0033 0.0030 Campylobacter spp. 2015 0.0082 0.0022 0.0013 0.0080 0.0013 0.0064 0.0043 0.0016 0.0011 0.0040 Cryptosporidium spp. 2012 0.0000 0.0000 0.0000 0.0000 0.0366 0.0029 0.0108 0.0000 0.0043 0.0000 Cryptosporidium spp. 2013 0.0000 0.0196 0.0000 0.0066 0.0000 0.0031 0.0000 0.0000 0.0000 0.0000 Cryptosporidium spp. 2014 0.0000 0.0000 0.0000 0.0040 0.0000 0.0059 0.0000 0.0000 0.0000 0.0082 Cryptosporidium spp. 2015 0.0000 0.0145 0.0000 0.0076 0.0000 0.0000 0.0000 0.0000 0.0051 0.0038 E. coli, STEC O157 2012 0.0000 0.0000 0.0000 0.0323 0.0000 0.0000 0.0000 0.0000 0.0000 0.0000 E. coli, STEC O157 2013 0.0000 0.0000 0.0000 0.0000 0.0000 0.0000 0.0000 0.0000 0.0190 0.0000 E. coli, STEC O157 2014 0.0000 0.0000 0.0000 0.0000 0.0000 0.0078 0.0000 0.0000 0.0139 0.0145 E. coli, STEC O157 2015 0.0000 0.0000 0.0370 0.0000 0.0000 0.0000 0.1429 0.0000 0.0093 0.0000 E. coli, STEC non-O157 2012 0.0476 0.0000 0.0000 0.0000 0.0000 0.0000 0.0000 0.0000 0.0000 0.0000 E. coli, STEC non-O157 2013 0.0000 0.0000 0.0000 0.0000 0.0000 0.0079 0.0000 0.0000 0.0000 0.0000 E. coli, STEC non-O157 2014 0.0000 0.0000 0.0000 0.0000 0.0000 0.0000 0.0000 0.0208 0.0000 0.0000 E. coli, STEC non-O157 2015 0.0000 0.0000 0.0000 0.0000 0.0000 0.0000 0.0000 0.0000 0.0093 0.0000 Salmonella spp. 2012 0.0022 0.0038 0.0066 0.0035 0.0034 0.0038 0.0031 0.0080 0.0103 0.0030 Salmonella spp. 2013 0.0036 0.0093 0.0090 0.0026 0.0062 0.0012 0.0000 0.0044 0.0055 0.0061 Salmonella spp. 2014 0.0051 0.0091 0.0043 0.0049 0.0033 0.0042 0.0061 0.0020 0.0027 0.0043 Salmonella spp. 2015 0.0018 0.0032 0.0044 0.0059 0.0053 0.0010 0.0140 0.0000 0.0039 0.0023 Shigella spp. 2012 0.0000 0.0000 0.0000 0.0017 0.0055 0.0026 0.0000 0.0000 0.0000 0.0000 Shigella spp 2013 0.0000 0.0000 0.0000 0.0011 0.0000 0.0000 0.0000 0.0000 0.0000 0.0032 Shigella spp 2014 0.0032 0.0000 0.0000 0.0031 0.0000 0.0000 0.0000 0.0000 0.0000 0.0000 Shigella spp 2015 0.0000 0.0000 0.0000 0.0008 0.0000 0.0000 0.0000 0.0000 0.0000 0.0000
References
1. Marder EP, Griffin PM, Cieslak PR, Dunn J, Hurd S, Jervis R, et al. Preliminary incidence and trends of
infections with pathogens transmitted commonly through food—Foodborne Diseases Active Surveillance
Network, 10 US Sites, 2006–2017. MMWR Morb Mortal Wkly Rep. 2018;67:324–8. PubMed
https://doi.org/10.15585/mmwr.mm6711a3
2. US Census Bureau Population Division. Annual estimates of the resident population: April 1, 2010 to July 1,
2019 [cited 2020 Sep 24]. https://www2.census.gov/programs-surveys/popest/tables/2010-
2019/state/totals/nst-est2019-01.xlsx
3. Scallan E, Hoekstra RM, Angulo FJ, Tauxe RV, Widdowson MA, Roy SL, et al. Foodborne illness acquired in
the United States—major pathogens. Emerg Infect Dis. 2011;17:7–15. PubMed
https://doi.org/10.3201/eid1701.P11101
4. Voetsch AC, Angulo FJ, Rabatsky-Ehr T, Shallow S, Cassidy M, Thomas SM, et al.; Emerging Infections
Program FoodNet Working Group. Laboratory practices for stool-specimen culture for bacterial
pathogens, including Escherichia coli O157:H7, in the FoodNet sites, 1995–2000. Clin Infect Dis.
2004;38(Suppl 3):S190–7. PubMed https://doi.org/10.1086/381586
5. Geissler AL, Bustos Carrillo F, Swanson K, Patrick ME, Fullerton KE, Bennett C, et al. Increasing
Campylobacter infections, outbreaks, and antimicrobial resistance in the United States, 2004–2012. Clin
Infect Dis. 2017;65:1624–31. PubMed https://doi.org/10.1093/cid/cix624

Page 24 of 27
6. Gu W, Dutta V, Patrick M, Bruce BB, Geissler A, Huang J, et al. Statistical adjustment of culture-independent
diagnostic tests for trend analysis in the Foodborne Diseases Active Surveillance Network (FoodNet),
USA. Int J Epidemiol. 2018;47:1613–22. PubMed
7. Chalker RB, Blaser MJ. A review of human salmonellosis: III. Magnitude of Salmonella infection in the United
States. Rev Infect Dis. 1988;10:111–24. PubMed https://doi.org/10.1093/clinids/10.1.111
8. Voetsch AC, Van Gilder TJ, Angulo FJ, Farley MM, Shallow S, Marcus R, et al.; Emerging Infections Program
FoodNet Working Group. FoodNet estimate of the burden of illness caused by nontyphoidal Salmonella
infections in the United States. Clin Infect Dis. 2004;38(Suppl 3):S127–34. PubMed
https://doi.org/10.1086/381578
9. Beshearse E, Bruce BB, Nane GF, Cooke RM, Aspinall W, Hald T, et al. Using structured expert judgment for
attribution of foodborne and waterborne illnesses to comprehensive transmission pathways, United States.
Emerg Infect Dis. 2021 Jan [in press]. https://doi.org/10.3201/eid2701.200316
10. Adam EA, Collier SA, Fullerton KE, Gargano JW, Beach MJ. Prevalence and direct costs of emergency
department visits and hospitalizations for selected diseases that can be transmitted by water, United
States. J Water Health. 2017;15:673–83. PubMed https://doi.org/10.2166/wh.2017.083
11. Painter JE, Gargano JW, Collier SA, Yoder JS; Centers for Disease Control and Prevention. Giardiasis
surveillance—United States, 2011–2012. MMWR Suppl. 2015;64:15–25.
12. Huang DB, White AC. An updated review on Cryptosporidium and Giardia. Gastroenterol Clin North Am.
2006;35:291–314, viii. PubMed https://doi.org/10.1016/j.gtc.2006.03.006
13. Reses HE, Gargano JW, Liang JL, Cronquist A, Smith K, Collier SA, et al. Risk factors for sporadic Giardia
infection in the USA: a case-control study in Colorado and Minnesota. Epidemiol Infect. 2018;146:1071–
8. PubMed https://doi.org/10.1017/S0950268818001073
14. Beer KD, Collier SA, Du F, Gargano JW. Giardiasis diagnosis and treatment practices among commercially
insured persons in the United States. Clin Infect Dis. 2017;64:1244–50. PubMed
https://doi.org/10.1093/cid/cix138
15. Hennessy TW, Marcus R, Deneen V, Reddy S, Vugia D, Townes J, et al.; Emerging Infections Program
FoodNet Working Group. Survey of physician diagnostic practices for patients with acute diarrhea:
clinical and public health implications. Clin Infect Dis. 2004;38(Suppl 3):S203–11. PubMed
https://doi.org/10.1086/381588
16. Polage CR, Stoddard GJ, Rolfs RT, Petti CA. Physician use of parasite tests in the United States from 1997 to
2006 and in a Utah Cryptosporidium outbreak in 2007. J Clin Microbiol. 2011;49:591–6. PubMed
https://doi.org/10.1128/JCM.01806-10

Page 25 of 27
17. Centers for Disease Control and Prevention. Legionnaires’ disease surveillance summary report, 2014–2015;
2018 [cited 2018 Nov 14]. https://www.cdc.gov/legionella/health-depts/surv-reporting/2014-15-surv-
report-508.pdf
18. Dooling KL, Toews KA, Hicks LA, Garrison LE, Bachaus B, Zansky S, et al. Active bacterial core
surveillance for legionellosis—United States, 2011–2013. MMWR Morb Mortal Wkly Rep.
2015;64:1190–3. PubMed https://doi.org/10.15585/mmwr.mm6442a2
19. Decker BK, Harris PL, Muder RR, Hong JH, Singh N, Sonel AF, et al. Improving the diagnosis of Legionella
pneumonia within a healthcare system through a systematic consultation and testing program. Ann Am
Thorac Soc. 2016;13:1289–93. PubMed https://doi.org/10.1513/AnnalsATS.201510-715BC
20. Helbig JH, Uldum SA, Lück PC, Harrison TG. Detection of Legionella pneumophila antigen in urine samples
by the BinaxNOW immunochromatographic assay and comparison with both Binax Legionella Urinary
Enzyme Immunoassay (EIA) and Biotest Legionella Urin Antigen EIA. J Med Microbiol. 2001;50:509–
16. PubMed https://doi.org/10.1099/0022-1317-50-6-509
21. Valcina O, Pūle D, Lucenko I, Krastina D, Šteingolde Ž, Krūmina A, et al. Legionella pneumophila
seropositivity-associated factors in Latvian blood donors. Int J Environ Res Public Health. 2015;13:58.
https://doi.org/10.3390/ijerph13010058
22. Strollo SE, Adjemian J, Adjemian MK, Prevots DR. The burden of pulmonary nontuberculous mycobacterial
disease in the United States. Ann Am Thorac Soc. 2015;12:1458–64. PubMed
https://doi.org/10.1513/AnnalsATS.201503-173OC
23. Gargano JW, Adam EA, Collier SA, Fullerton KE, Feinman SJ, Beach MJ. Mortality from selected diseases
that can be transmitted by water—United States, 2003–2009. J Water Health. 2017;15:438–50. PubMed
https://doi.org/10.2166/wh.2017.301
24. Donohue MJ. Increasing nontuberculous mycobacteria reporting rates and species diversity identified in
clinical laboratory reports. BMC Infect Dis. 2018;18:163. PubMed https://doi.org/10.1186/s12879-018-
3043-7
25. Grytdal SP, DeBess E, Lee LE, Blythe D, Ryan P, Biggs C, et al. Incidence of norovirus and other viral
pathogens that cause acute gastroenteritis (AGE) among Kaiser Permanente member populations in the
United States, 2012–2013. PLoS One. 2016;11:e0148395. PubMed
https://doi.org/10.1371/journal.pone.0148395
26. Hall AJ, Rosenthal M, Gregoricus N, Greene SA, Ferguson J, Henao OL, et al. Incidence of acute
gastroenteritis and role of norovirus, Georgia, USA, 2004–2005. Emerg Infect Dis. 2011;17:1381–8.
PubMed https://doi.org/10.3201/eid1708.101533
Page 26 of 27
27. Gastañaduy PA, Hall AJ, Curns AT, Parashar UD, Lopman BA. Burden of norovirus gastroenteritis in the
ambulatory setting—United States, 2001–2009. J Infect Dis. 2013;207:1058–65. PubMed
https://doi.org/10.1093/infdis/jis942
28. Lopman BA, Hall AJ, Curns AT, Parashar UD. Increasing rates of gastroenteritis hospital discharges in US
adults and the contribution of norovirus, 1996–2007. Clin Infect Dis. 2011;52:466–74. PubMed
https://doi.org/10.1093/cid/ciq163
29. Hall AJ, Lopman BA, Payne DC, Patel MM, Gastañaduy PA, Vinjé J, et al. Norovirus disease in the United
States. Emerg Infect Dis. 2013;19:1198–205. PubMed https://doi.org/10.3201/eid1908.130465
30. Collier SA, Wade TJ, Sams EA, Hlavsa MC, Dufour AP, Beach MJ. Swimming in the USA: beachgoer
characteristics and health outcomes at US marine and freshwater beaches. J Water Health. 2015;13:531–
43. PubMed https://doi.org/10.2166/wh.2014.095
31. Roland PS, Stroman DW. Microbiology of acute otitis externa. Laryngoscope. 2002;112:1166–77. PubMed
https://doi.org/10.1097/00005537-200207000-00005
32. van Asperen IA, de Rover CM, Schijven JF, Oetomo SB, Schellekens JF, van Leeuwen NJ, et al. Risk of otitis
externa after swimming in recreational fresh water lakes containing Pseudomonas aeruginosa. BMJ.
1995;311:1407–10. PubMed https://doi.org/10.1136/bmj.311.7017.1407
33. Hajjartabar M. Poor-quality water in swimming pools associated with a substantial risk of otitis externa due to
Pseudomonas aeruginosa. Water Sci Technol. 2004;50:63–7. PubMed
https://doi.org/10.2166/wst.2004.0020
34. Wade TJ, Sams EA, Beach MJ, Collier SA, Dufour AP. The incidence and health burden of earaches
attributable to recreational swimming in natural waters: a prospective cohort study. Environ Health.
2013;12:67. PubMed https://doi.org/10.1186/1476-069X-12-67
35. Centers for Disease Control and Prevention (CDC). Estimated burden of acute otitis externa—United States,
2003–2007. MMWR Morb Mortal Wkly Rep. 2011;60:605–9. PubMed
36. Collier SA, Hlavsa MC, Piercefield EW, Beach MJ. Antimicrobial and analgesic prescribing patterns for acute
otitis externa, 2004–2010. Otolaryngol Head Neck Surg. 2013;148:128–34. PubMed
https://doi.org/10.1177/0194599812467000
37. Voetsch AC, Kennedy MH, Keene WE, Smith KE, Rabatsky-Ehr T, Zansky S, et al. Risk factors for sporadic
Shiga toxin-producing Escherichia coli O157 infections in FoodNet sites, 1999–2000. Epidemiol Infect.
2007;135:993–1000. PubMed https://doi.org/10.1017/S0950268806007564
38. Hoefer D, Hurd S, Medus C, Cronquist A, Hanna S, Hatch J, et al.; Emerging Infections Program FoodNet
Working Group. Laboratory practices for the identification of Shiga toxin-producing Escherichia coli in

Page 27 of 27
the United States, FoodNet sites, 2007. Foodborne Pathog Dis. 2011;8:555–60. PubMed
https://doi.org/10.1089/fpd.2010.0764
39. Gould LH, Mody RK, Ong KL, Clogher P, Cronquist AB, Garman KN, et al.; Emerging Infections Program
Foodnet Working Group. Increased recognition of non-O157 Shiga toxin-producing Escherichia coli
infections in the United States during 2000–2010: epidemiologic features and comparison with E. coli
O157 infections. Foodborne Pathog Dis. 2013;10:453–60. PubMed https://doi.org/10.1089/fpd.2012.1401
40. Hedican EB, Medus C, Besser JM, Juni BA, Koziol B, Taylor C, et al. Characteristics of O157 versus non-
O157 Shiga toxin-producing Escherichia coli infections in Minnesota, 2000–2006. Clin Infect Dis.
2009;49:358–64. PubMed https://doi.org/10.1086/600302
41. Centers for Disease Control and Prevention. National Enteric Disease Surveillance: COVIS Annual Summary,
2014; 2016 [cited 2018 Nov 14]. https://www.cdc.gov/nationalsurveillance/pdfs/covis-annual-summary-
2014-508c.pdf
42. Cockerill FR III, Wilson JW, Vetter EA, Goodman KM, Torgerson CA, Harmsen WS, et al. Optimal testing
parameters for blood cultures. Clin Infect Dis. 2004;38:1724–30. PubMed https://doi.org/10.1086/421087
43. Lee A, Mirrett S, Reller LB, Weinstein MP. Detection of bloodstream infections in adults: how many blood
cultures are needed? J Clin Microbiol. 2007;45:3546–8. PubMed https://doi.org/10.1128/JCM.01555-07

Page 1 of 18
Article DOI: https://doi.org/10.3201/eid2701.190676
Estimate of Burden and Direct Healthcare Cost of Infectious Waterborne Disease in
the United States Appendix 2
Model Types Used to Make Estimates
The process of estimating the burden of waterborne illness requires the use of disparate
data sources and making subjective decisions on how to combine them. Briefly, after we
identified our illnesses of interest, we combined data from available data sources (surveillance
data systems, administrative data, or data from the literature) and applied multipliers to account
for population standardization, underreporting, underdiagnosis, proportion domestically
acquired, and proportion attributable to waterborne transmission. For pathogens with
surveillance data, we adapted an approach laid out previously to estimate the burden of
foodborne illness (1), with some modifications and differences, detailed in this appendix. For
pathogens with administrative or literature data only, we developed new models to estimate the
burden of waterborne illness. The summary statistics are based on distributions constructed from
Monte Carlo simulation records. We report the mean and 95% credible interval (CrI), a range
that covers 95% of the sample.
Burden Outcomes
We used the estimated annual total number of illnesses, hospitalizations, deaths,
emergency department (ED) visits, total health care cost for hospitalizations, and total health
care cost for ED visits to measure the burden of waterborne diseases in the United States.
Model Structures
We used 3 broad model types to estimate the burden outcomes, except health care cost
burdens, for 17 known waterborne pathogens. Variations exist within each model type depending

Page 2 of 18
on the pathogen, the diagnostic test type, severity of the disease, availability of input data, and
choices made on multiplier values. Details on the variations by pathogen are available in
Appendix 1.
Model type A was used for surveillance data. This model scales counts of laboratory-
confirmed (reported) illnesses up to an estimated number of illnesses, accounting for both
underreporting and underdiagnosis factors that contribute to illnesses not being reported to
surveillance systems. This model was applied to both active and passive surveillance data
(Appendix 2 Table).
Model type B was used for administrative data. This model scales hospitalization counts
reported in administrative datasets up to an estimated number of illness, accounting for both
hospitalization rate and underreporting and underdiagnosis factors that contribute to an illness
not being seen in a hospital or reported to hospital discharge databases (Appendix 2 Table).
Model type C was used for publication-based data. This model scales populations at risk
down to an estimated number of illnesses using publication reported incidence rates (Appendix 2
Table).
Model Type A: Burden Estimate for Pathogens Reported from Surveillance Systems
Model inputs (illnesses, hospitalizations, and deaths) were assigned distributions using
previously defined methods (1). For pathogens reported in the active surveillance system
(FoodNet) (2), data from different sites or years were treated as representatives from distinct
populations. We chose to treat, for example, FoodNet confirmed case counts from 10 sites over 4
years (2012–2015) as representing 40 distinct population means. Each population contributes to
the empirical distribution with equal probability. For pathogens reported in the passive
surveillance systems, linear regression was applied to fit multiyear (2008–2014) national data
and to estimate the average burden count for the reference year 2014. Residuals from all 7 years
were randomly sampled with equal chance and then used in the calculation of the uncertainty of
the predicted count, simulating the distribution of reported count.
All model inputs are multiplicative. Each multiplier either expands or contracts the
observed/reported burden counts to produce the final burden estimate. We assume all multipliers
in model type A to be mutually independent except for the ones associated with the

Page 3 of 18
underdiagnosis of illness, where the multipliers associated with care-seeking and specimen
submission rate depend on the severity of cases.
The distributions of model outputs were obtained via Monte Carlo simulation. During
each simulation run, a random sample was drawn from the theoretical/empirical distribution of
each model input; then they were multiplied sequentially depending on their positions in the
model. The final product of all factors yielded the burden estimate. The empirical distribution
pooled from a large number of simulated records (100,000 iterations) allowed us to estimate the
uncertainty of the burden outcomes.
Only a fraction of cases whose records passed a series of stages in the reporting process
could be seen in our surveillance system. Each multiplier value refers to the proportion of case
records advancing to the next stage (e.g., the proportion of patients seeking medical care), and
these multiplier values are all <1. To estimate the burden of illness, we use the reciprocal of
these multiplier values, called expansive factors, to scale up the number of reported cases from
the surveillance system (Appendix 2 Figure 1 and Figure 2, panel B). Appendix 2 Figure 1
describes the modeling process of scaling up reported confirmed cases by surveillance system up
(model type A) in a mathematical format. The order of the multiplication does not matter, as the
factors are commutative. The diagram shows 9 primary model outputs, identified in the box in
the middle and obtained by inclusion of elements from vectors (column [1 or H or D] and row [1
or Dom or W]). For example, a combination of choosing D, Dom, and W yields the output for
domestic waterborne deaths. Each of these factors is either a random variable, following an
empirical distribution constructed from observed or estimated data or a parametric distribution,
or a constant, such as the year adjustment factor to the 2014 population size. As illustrated in
Appendix 2 Figures 2 and 3, the central location and spread of each model output reflects not
only the multiplicative effect of its components but also the cumulative and joint effect of their
uncertainties.
For all multipliers except the water attribution rate, we assumed the same distribution
properties as those in the foodborne burden paper (1). We updated the distribution parameters
whenever new data or information were available. For the waterborne attribution proportion, a
calibrated and synthesized distribution for each pathogen was obtained from elicitation results of
a panel of experts (3). The same assumptions about multiplier distributions were made among all

Page 4 of 18
model types (A, B, and C). The underdiagnosis/underreporting factors for ED visits,
hospitalizations, and deaths were set as beta/PERT distributions (4) with values of (min, mode,
max)= (1, 2, 3). This rule was applied to all pathogens in the surveillance systems unless
otherwise stated. Details of the choices made to define the distributions of model inputs by
pathogen are available in Appendix 1.
Appendix 2 Figures 2 and 3 demonstrate the distributions involved in constructing
estimates for Shigella, including the annual illness estimate (Appendix 2 Figure 2, panel A), the
underdiagnosis multiplier (Appendix 2 Figure 2, panel B) and the hospitalization estimate
(Appendix 2 Figure 3). The empirical and discrete nature of the source data is apparent in the
first panel of Appendix 2 Figure 2, panel A. The right skewness in the water attribution rate
dominates the distribution of the domestic waterborne illness. As shown in Appendix 2 Figure 2,
panel B, a series of multipliers contributed to illnesses not being seen or verified or reported.
These multipliers expanded the laboratory reported case counts in a multiplicative fashion and
their impacts were passed onto the combined underdiagnosis multiplier in the main model
(Appendix 2 Figure 2, panel A). The hospitalization estimate, as shown in Appendix 2 Figure 3,
was similar to the illness estimate.
Model Type B: Burden Estimate for Pathogens/Data Reported from Administrative Systems and ED Visits for All Pathogens
Pathogens for which model type B was used did not have data available from national
surveillance systems. Instead, data from the Agency for Healthcare Research and Quality Health
Care Utilization Project’s National Inpatient Sample (HCUP NIS) (5) and National Emergency
Department Sample (HCUP NEDS) (6) were used. The NIS is the largest publicly available US
hospital discharge database that includes all sources of payment (i.e., private insurance, public
insurance, and the uninsured). HCUP NIS is a complex sample survey that produces weighted
national estimates from a stratified sample of about 20% of hospital stays from community
hospitals in the United States. Similarly, HCUP NEDS is a complex sample survey that produces
weighted national estimates of emergency department visits. Appendix 2 Figure 4 shows the
estimation steps for model type B pathogens. Each of these factors is either a random variable,
following a parametric distribution (e.g., normal distribution or beta/PERT distribution), or a
constant (year adjustment factor). Unlike pathogens in surveillance systems (model type A), here

Page 5 of 18
hospitalization counts served as the initial model input. They were scaled up to estimate the
number of illnesses by dividing by the hospitalization rate.
For ED visits, hospitalizations, and death counts reported in HCUP datasets, we assumed
a mixture of 3 normal distributions with equal probability, with each year of data providing the
parameters of a mixture component. Each individual year represented 1 normal population. The
associated parameter mean was taken from the weighted nationwide frequency count and the
standard deviation was calculated from the lower and upper limits assuming a normal
distribution was used in the confidence interval construction.
The death counts were derived from 2 sources. The total death count is the sum of in-
hospital deaths and out-of-hospital deaths, as described by Gargano et al. (7). In-hospital deaths
were obtained using the number of hospitalizations for a particular illness in the HCUP NIS
database that ended in death. Out-of-hospital deaths were obtained from out-of-hospital deaths
reported for a particular illness in the National Vital Statistics System (NVSS) (8), which
contains information on all death certificates filed in the United States. No uncertainty was
reported for the out-of-hospital death count. Here we used it as a constant rather than a
distribution. The model outputs and the distributions were quantified via Monte Carlo
simulation.
Special treatments were employed in the simulation algorithms to ensure that the
biological or clinical constraints of the model outputs were met. First, when a negative number
occurred in the simulation under a normal distribution, it was replaced with zero. Second, for
pathogens with high hospitalization rates (>75%), the 3 underdiagnosis factors (for illnesses,
hospitalizations, and deaths) were set to be the same for each simulated record. This treatment
ensured that the number of illness was greater than the number of hospitalizations and the
number of deaths, true not only for the mean value but also for each simulated individual record.
The multiplicative impact of each factor on the final burden estimate was illustrated in
Appendix 2 Figure 5. Details of the choices made on the multipliers and their parameters are
provided in Appendix 1.
Appendix 2 Figure 5 demonstrates the distributions involved in constructing estimates of
annual illnesses for Pseudomonas pneumonia. As shown previously, the hospitalization was a
mixture of 3 normal distributions with variable mean values. Although the annual illness was

Page 6 of 18
multimodal, the other multipliers followed 1-mode beta/PERT-distribution, spreading narrowly
around their modes. The resulting smoothed distribution of domestically acquired waterborne
illness was unimodal. The estimations for hospitalizations, deaths, and ED visits were modeled
in a similar way except that the hospitalization rate component (the third panel) was removed
from the equation.
Model Type C: Burden Estimate for Pathogen Reported from Literature Data
Model type C was used for 1 pathogen, norovirus. For norovirus, instead of using acute
gastrointestinal illness (AGI) as a starting point for the estimate (1), we used incidence estimates
(already adjusted for underdiagnosis) from 2 studies (9,10). The Hall et al. study (9) was
conducted at 1 site of the Kaiser Permanente health care system. The Grytdal et al. study (10)
was conducted at 2 additional sites of the Kaiser Permanente health care system. To combine the
studies, the reported 3-number summary statistics (mean, lower, and upper limit) for incidence
rate at each site were fit to a 4-parameter PERT distribution with the variation parameter fixed,
while minimizing the overall distance between the 3 summary statistics and the model predicted
values. The process was repeated for different values of the variation parameter. The
corresponding parameter combination under the best fit, verified by subject matter experts via
visual examinations, was assigned as the PERT distribution parameters for that site. The
sampling distribution for the annual incidence rate was a mixture of the 3 beta distributions with
1 distribution representing 1 site. Each site had an equal probability of being drawn. We chose
beta/PERT distribution to describe the incidence rate for the following reasons. First, the
reported confidence intervals were asymmetric, making the normal distribution not immediately
applicable. Second, the original datasets used to produce CIs in the publications were not
available to us. Third, the beta distribution family has the capacity to accommodate left-skewed,
right-skewed, and symmetric confidence intervals or distributions. Fourth, incidence rate takes
values on a range with an upper and lower bound. The generalized beta/PERT distribution has
the flexibility to set a range on incidence rates. In addition, we selected a different value from the
default setup for the variation parameter of the PERT distribution, the same strategy used in the
previous foodborne burden paper (11) because it gave us a fit with a narrower range and a more
realistic distribution spread than the fit under the default value.
The most recent published norovirus hospitalization rate estimates were obtained by
fitting a complex statistical model to multiyear (1996–2007) HCUP data (12). Although the data

Page 7 of 18
showed a trend of increase in hospitalization rates during 1996–2007, we cannot say whether this
trend continued or not, nor can we estimate the hospitalization rate in the reference year 2014
without additional data. Instead, we assumed that the reported multiyear hospitalization rates
were a random sample from 1 homogeneous population following a beta/PERT distribution. The
minimum, maximum, and mode of the multiyear rates were assigned as the input parameters for
the PERT distribution. The same strategy was applied to death rates (13) and ED visits (14).
Appendix 2 Figure 6 describes the modeling process for norovirus for which populations
at risk of illness were scaled down to estimate burden outcomes. As in model type A and B, all
model inputs are assumed to be independent and multiplicative.
Appendix 2 Figures 7 and 8 demonstrate the distributions involved in constructing
estimates for norovirus including the annual illness estimate (Appendix 2 Figure 7) and the
annual hospitalization estimation (Appendix 2 Figure 8). The deaths and ED visits were
estimated in the same way as hospitalizations. The norovirus model estimates start with
population size and incidence rate. As shown in Appendix 2 Figure 7, a mixture of 3 beta/PERT-
distributions from 3 sites of the Kaiser studies was used to describe the incidence rate for
illnesses. Consequently, the multimodal feature was presented in the annual illness estimate
(second panel in Appendix 2 Figure 7). There was no underdiagnosis adjustment for illness, as
the publication already took that into account. Although the estimated annual illness distribution
was multimodal, the long tail of the water attribution rate dominated in the final output. The
resulting distribution of domestic waterborne illness was right-skewed with an extended right
tail. The only difference in the estimation equation between hospitalizations (Appendix 2 Figure
8), deaths, or ED visits and the illnesses was that the incidence rate consisted of only 1
beta/PERT distribution instead of a mixture of PERT distributions.
Discussion
In selecting data sources for the burden estimate, we chose an active surveillance system
over a passive one when both were available, as there is a greater nonstatistical uncertainty
around passive estimates. In the case of Vibrio estimates, we used data reported in Cholera and
Other Vibrio Illness Surveillance (COVIS) (15) instead of FoodNet because most Vibrio cases
occur in Gulf states, and FoodNet sites do not include any of those states.

Page 8 of 18
Previously, 90% CrIs were reported in the foodborne burden paper (1,11). A 90% CrI
adds less uncertainty in more extreme quantile distributions, is a more robust estimate, and is
narrower compared with a 95% CrI. Here, we chose to report 95% CrIs to be consistent with the
coverable probability (95%) commonly used in publications. In all models, we assumed that the
factors are stochastically independent. In some circumstances, this assumption may not hold.
In the determination of distribution parameters for multipliers, we relied on statistics
reported in previous publications or statistics calculated based on updated data. In the absence of
new data, we applied the same parameter values as those used in the foodborne burden paper (1).
When only a point estimate was available for PERT distribution (e.g., international travel rate),
we estimated the range based on a 50% relative increase/decrease from the mode/point estimate
on an odds scale for proportion parameters. In general, the information on
underdiagnosis/underreporting for hospitalizations, deaths, and ED visits is lacking. A factor of 2
was assumed in previous publications on burden estimation (1,16). We applied the factor of 2
and expanded the range by 1 (i.e., 2 + 1). There are alternatives of modeling uncertainty, such as
using multiplicative models or/and applying different magnitudes of variability. We chose the
aforementioned strategies because, overall, the approach produced reasonable estimates.
In model B, we treated the out-of-hospital death count as a constant because the
variability associated with the point estimate was not available. Because the number of out-of-
hospital deaths is much smaller than number of in-hospital deaths, the contribution of its
uncertainty to the uncertainty of total number of deaths is negligible. During the simulation of all
4 burden outcomes, we took special measures to ensure the counts to be nonnegative by
assigning zeros to negative values. Most of the simulated counts were >0, with a few exceptions
that occurred in the ED visit simulation. Overall, the proportion of negative values was very
small (<0.81%). Therefore, the impact of truncating a normal distribution is considered
negligible.
In this study, we took a different approach for norovirus from the one employed in the
foodborne disease burden study (1) by modeling the incidence rates, hospitalization rates, death
rates, and ED rates as following a PERT distribution. The distribution parameters were extracted
from statistics reported in recent publications. Despite the differences in the modeling process,

Page 9 of 18
data sources, time coverage, population coverage of the data, and the nonstatistical uncertainties
(11) compared with our estimate, the burden estimates for norovirus illnesses were comparable.
References
1. Scallan E, Hoekstra RM, Angulo FJ, Tauxe RV, Widdowson MA, Roy SL, et al. Foodborne illness
acquired in the United States—major pathogens. Emerg Infect Dis. 2011;17:7–15. PubMed
https://doi.org/10.3201/eid1701.P11101
2. Foodborne Diseases Active Surveillance Network (FoodNet). FoodNet 2015 surveillance report (final
Data). 2017 [cited 2020 Sep 24]. https://www.cdc.gov/foodnet/reports/annual-reports-2015.html
<jrn>3. Beshearse E, Bruce BB, Nane GF, Cooke RM, Aspinall W, Hald T, et al. Using structured expert
judgment for attribution of foodborne and waterborne illnesses to comprehensive transmission
pathways, United States. Emerg Infect Dis. 2021 Jan [in press].
https://doi.org/10.3201/eid2701.200316
4. Vose D. Risk analysis: a quantitative guide. Chichester (England); Hoboken (NJ): John Wiley; 2008.
5. Healthcare Cost and Utilization Project (HCUP). NIS overview; 2018 [cited 2020 Sep 24].
https://hcup-us.ahrq.gov/nisoverview.jsp
6. Healthcare Cost and Utilization Project (HCUP). NEDS overview; 2018 [cited 2020 Sep 24].
https://hcup-us.ahrq.gov/nedsoverview.jsp.
7. Gargano JW, Adam EA, Collier SA, Fullerton KE, Feinman SJ, Beach MJ. Mortality from selected
diseases that can be transmitted by water—United States, 2003–2009. J Water Health.
2017;15:438–50. PubMed https://doi.org/10.2166/wh.2017.301
8. National Center for Health Statistics. National Vital Statistics System—mortality statistics. 2018 [cited
2020 Sep 24]. https://www.cdc.gov/nchs/nvss/deaths.htm.
9. Hall AJ, Rosenthal M, Gregoricus N, Greene SA, Ferguson J, Henao OL, et al. Incidence of acute
gastroenteritis and role of norovirus, Georgia, USA, 2004–2005. Emerg Infect Dis.
2011;17:1381–8. PubMed https://doi.org/10.3201/eid1708.101533
10. Grytdal SP, DeBess E, Lee LE, Blythe D, Ryan P, Biggs C, et al. Incidence of norovirus and other
viral pathogens that cause acute gastroenteritis (AGE) among Kaiser Permanente member
populations in the United States, 2012–2013. PLoS One. 2016;11:e0148395. PubMed
https://doi.org/10.1371/journal.pone.0148395

Page 10 of 18
11. Scallan E, Griffin PM, Angulo FJ, Tauxe RV, Hoekstra RM. Foodborne illness acquired in the United
States—unspecified agents. Emerg Infect Dis. 2011;17:16–22. PubMed
https://doi.org/10.3201/eid1701.P21101
12. Lopman BA, Hall AJ, Curns AT, Parashar UD. Increasing rates of gastroenteritis hospital discharges
in US adults and the contribution of norovirus, 1996–2007. Clin Infect Dis. 2011;52:466–74.
PubMed https://doi.org/10.1093/cid/ciq163
13. Hall AJ, Curns AT, McDonald LC, Parashar UD, Lopman BA. The roles of Clostridium difficile and
norovirus among gastroenteritis-associated deaths in the United States, 1999–2007. Clin Infect
Dis. 2012;55:216–23. PubMed https://doi.org/10.1093/cid/cis386
14. Gastañaduy PA, Hall AJ, Curns AT, Parashar UD, Lopman BA. Burden of norovirus gastroenteritis in
the ambulatory setting—United States, 2001–2009. J Infect Dis. 2013;207:1058–65. PubMed
https://doi.org/10.1093/infdis/jis942
15. Centers for Disease Control and Prevention. Cholera and Other Vibrio Illness Surveillance (COVIS);
2018 [cited 2018 Dec 4]. https://www.cdc.gov/vibrio/surveillance.html
16. Mead PS, Slutsker L, Dietz V, McCaig LF, Bresee JS, Shapiro C, et al. Food-related illness and death
in the United States. Emerg Infect Dis. 1999;5:607–25. PubMed
https://doi.org/10.3201/eid0505.990502
Appendix 2 Table. Model types for burden estimate of waterborne diseases, by pathogen Model Burden outcomes Pathogen Illness Hospitalization Death ED visits Campylobacter spp. Model type A Model type A Model type A Model type B Cryptosporidium spp. Model type A Model type A Model type A Model type B Shiga toxin-producing Escherichia coli (STEC) O157 Model type A Model type A Model type A Model type B Shiga toxin-producing E. coli (STEC), non-O157 Model type A Model type A Model type A Model type B Giardia duodenalis Model type A Model type A Model type A Model type B Legionella Model type A Model type A Model type A Model type B Norovirus Model type C Model type C Model type C Model type C Nontuberculous mycobacteria Model type B Model type B Model type B Model type B Otitis externa Model type B Model type B Model type B Model type B Pseudomonas pneumonia Model type B Model type B Model type B Model type B Pseudomonas septicemia Model type B Model type B Model type B Model type B Salmonella, nontyphoidal Model type A Model type A Model type A Model type B Shigella spp. Model type A Model type A Model type A Model type B Vibrio alginolyticus Model type A Model type A Model type A Model type B Vibrio parahaemolyticus Model type A Model type A Model type A Model type B Vibrio spp., other Model type A Model type A Model type A Model type B Vibrio vulnificus Model type A Model type A Model type A Model type B

Page 11 of 18
Appendix 2 Figure 1. Schematic illustration of model type A, which scales case counts up, and is based
on surveillance data (11). Count refers to data in the form of cases of reported illnesses. Year is a
deterministic factor to standardize non-2014 counts to 2014 (applied as needed). Geo is a deterministic
expansive factor to scale FoodNet counts up to the entire US population (applied as needed). UR is an
expansive factor to scale passive surveillance case counts up to active surveillance counts to account for
underreporting (applied as needed). UD is an expansive factor to scale laboratory-confirmed cases to
illnesses not being reported to the surveillance system to account for underdiagnosis. †UR and UD: for
hospitalization or death or ED visits, there was only 1 factor accounting for both underreporting and
underdiagnosis. This multiplier follows PERT distribution with mode 2. CS is an expansive factor to scale
care seekers up to all ill, with severe and mild illness versions. It is the reciprocal of the proportion of
cases seeking care. SS is an expansive factor to scale submitted samples up to all ill visits, with severe
and mild illness versions. It is the reciprocal of the proportion of specimen submitted for laboratory testing.
P(S) is the proportion of actual illness that is severe. LT is an expansive factor to scale tests performed
up to samples submitted. It is the reciprocal of the proportion of specimen being tested. LS is an
expansive factor to scale positive tests up to true positive specimens. It is the reciprocal of sensitivity. H is
a contractive factor to scale illnesses down to hospitalized illnesses. D is a contractive factor to scale
illnesses down to deaths. Dom is a contractive factor to scale total counts down to counts that are
domestically acquired (applied as needed). W is a contractive factor to scale overall counts down to
counts that are waterborne.

Page 12 of 18
Appendix 2 Figure 2. A) Schematic diagram of the estimation of annual illnesses for Shigella. X axes
show the relative frequency of observed or simulated values for each input or multiplier. Year is a
deterministic factor to standardize non-2014 counts to 2014 (applied as needed). Geo is a deterministic
expansive factor to scale FoodNet counts up to the entire U.S. population (applied as needed). B) Schematic diagram of underdiagnosis of illnesses for Shigella. X axes show the relative frequency of
observed or simulated values for each input or multiplier.

Page 13 of 18
Appendix 2 Figure 3. Schematic diagram of the estimation of hospitalizations for Shigella. X axes show
the relative frequency of observed or simulated values for each input or multiplier.

Page 14 of 18
Appendix 2 Figure 4. Schematic illustration of model type B, which scales hospitalization counts up, and
is based on administrative data. Hospitalization count, death counts, and ED visit counts refer to counts
reported in HCUP NIS or HCUP NEDS datasets. Year is a deterministic factor to standardize non-2014
counts to 2014 (applied as needed). 1/Hospitalization rate is an expansive factor to scale the
hospitalization count up to the illness count. UR is an expansive factor to scale passive surveillance case
counts up to active surveillance counts to account for underreporting (applied as needed). UD is an
expansive factor to scale laboratory-confirmed cases to illnesses not being reported to the surveillance
system to account for underdiagnosis. UR and UD: for hospitalization or death or ED visits, only 1 factor
accounted for both underreporting and underdiagnosis. This multiplier follows PERT distribution with
mode 2. Dom is a contractive factor to scale total counts down to counts that are domestically acquired
(applied as needed). W is a contractive factor to scale overall counts down to counts that are waterborne.

Page 15 of 18
Appendix 2 Figure 5. Schematic diagram of the estimation of annual illness for Pseudomonas
pneumonia. X axes show the relative frequency of observed or simulated values for each input or
multiplier. Year adj is a deterministic factor to standardize non-2014 counts to 2014 (applied as needed).

Page 16 of 18
Appendix 2 Figure 6. Schematic illustration of model type C, which scales the population at risk down,
and is based on literature reported summary statistics. Illness incidence rate: the proportion of ill persons
relative to the whole population at risk. Hospitalization incidence rate and Death incidence rate are the
proportion of patients who were hospitalized or died relative to the whole population at risk. ED visit
incidence rate is the proportion of patients who had ED visits (including both treated-and-released and
admitted) relative to the whole population at risk. Dom is a contractive factor to scale total counts down to
counts that are domestically acquired (applied as needed). W is a contractive factor to scale overall
counts down to counts that are waterborne.

Page 17 of 18
Appendix 2 Figure 7. Schematic diagram of the estimation of annual illnesses for norovirus. X axes
show the relative frequency of observed or simulated values for each input or multiplier.

Page 18 of 18
Appendix 2 Figure 8. Schematic diagram of the estimation of hospitalizations for norovirus. X axes show
the relative frequency of observed or simulated values for each input or multiplier.

Page 1 of 5
Article DOI: https://doi.org/10.3201/eid2701.190676
Estimate of Burden and Direct Healthcare Cost of Infectious Waterborne Disease in the United States
Appendix 3
Additional Tables
Appendix 3 Table 1. Total annual cost to commercial insurers (sum of insurer payments, in 2014 US dollars) of emergency department visits and hospitalizations from waterborne transmission of selected infections, 2014, United States
Disease
Treat-and-release ED visit Hospitalization Total
Mean insurer payment per visit
(95% CrI)
Annual number of commercial visits paid
due to waterborne transmission (95% CrI)
Total insurer cost of treat-and-release ED visits
because of waterborne disease (95% CrI)
Mean insurer payment per stay
(95% CrI)
Total annual number of stays because of
waterborne transmission (95% CrI)
Total insurer cost of hospitalizations for waterborne disease
(95% CrI)
Total annual insurer cost for waterborne disease (95% CrI)
Campylobacteriosis 2,120 (21–8,730) 190 (19–577) 402,000 (2,190–2,200,000)
14,100 (1,250–47,100)
944 (84–3,030) 13,000,000 (354,000–
57,400,000)
13,400,000 (589,000–57,800,000)
Cryptosporidiosis 1,910 (16–9,280) 310 (105–603) 593,000 (5,050–2,800,000)
16,900 (1,560–82,700)
522 (48–1,650) 8,830,000 (217,000–
47,000,000)
9,420,000 (588,000–47,500,000)
Giardiasis 1,800 (43–9,280) 365 (119–722) 656,000 (10,100–3,210,000)
24,100 (1,320–167,000)
503 (167–999) 12,100,000 (553,000–
81,000,000)
12,800,000 (979,000–81,300,000)
Legionnaires' disease 1,230 (79–2,960) 275 (120–495) 338,000 (20,700–991,000) 44,900 (1,500–293,000)
4,610 (3,110–5,590) 207,000,000 (7,280,000–
1,340,000,000)
208,000,000 (7,640,000–
1,340,000,000) Nontuberculous mycobacterial (NTM) infection
1,480 (34–6,460) 1,460 (739–2,240) 2,170,000 (40,600–9,380,000)
43,600 (1,320–243,000)
13,500 (7,030–19,400) 587,000,000 (16,400,000–
3,340,000,000)
589,000,000 (18,900,000–
3,340,000,000) Otitis externa 517 (12–2,030) 324,000 (193,000–
470,000) 167,000,000 (3,660,000–
682,000,000) 13,100 (1,300–
57,600) 8,750 (5,230–12,700) 114,000,000
(9,700,000–522,000,000)
282,000,000 (44,500,000–994,000,000)
Pseudomonas pneumonia
1,710 (34–8,890) 81 (21–153) 138,000 (2,240–819,000) 44,400 (1,300–192,000)
2,980 (795–5,420) 132,000,000 (2,750,000–
640,000,000)
132,000,000 (2,870,000–
640,000,000) Pseudomonas septicemia
2,590 (161–11,800)
9 (1–26) 23,300 (228–169,000) 62,900 (1,330–385,000)
1,020 (131–2,540) 64,000,000 (732,000–
397,000,000)
64,000,000 (742,000–397,000,000)
Salmonellosis, nontyphoidal
1,520 (56–7,900) 107 (8–372) 165,000 (1,540–977,000) 16,200 (1,360–74,100)
661 (44–2,470) 10,600,000 (173,000–
59,100,000)
10,700,000 (276,000–59,300,000)
Shiga toxin-producing E. coli infection, O157
1,570 (3–5,390)* 5 (1–14) 7,870 (15–37,300) 24,800 (1,700–148,000)
69 (7–250) 1,720,000 (36,600–11,400,000)
1,730,000 (43,500–11,400,000)

Page 2 of 5
Disease
Treat-and-release ED visit Hospitalization Total
Mean insurer payment per visit
(95% CrI)
Annual number of commercial visits paid
due to waterborne transmission (95% CrI)
Total insurer cost of treat-and-release ED visits
because of waterborne disease (95% CrI)
Mean insurer payment per stay
(95% CrI)
Total annual number of stays because of
waterborne transmission (95% CrI)
Total insurer cost of hospitalizations for waterborne disease
(95% CrI)
Total annual insurer cost for waterborne disease (95% CrI)
Shiga toxin-producing E. coli infection, non-O157
1,570 (3–5,390)* 2 (0–06) 2,650 (00–15,600) 22,900 (1,140–95,700)
19 (0–77) 431,000 (00–2,990,000)
433,000 (644–3,000,000)
Shigellosis 1,960 (09–12,400) 24 (2–115) 46,600 (124–289,000) 17,700 (1,220–84,100)
113 (6–524) 1,920,000 (31,100–12,100,000)
1,960,000 (50,900–12,100,000)
Vibrio spp. infection 1,280 (300–4,440) 51 (10–112) 65,300 (4,150–262,000) 16,400 (399–49,200)
110 (67–158) 1,790,000 (37,300–6,290,000)
1,860,000 (134,000–6,380,000)
Total cost
172,000,000 (7,840,000–686,000,000)
1,160,000,000 (268,000,000–4,210,000,000)
1,330,000,000 (361,000,000–4,440,000,000)
*For emergency department (ED) visits only, costs for STEC O157 and STEC non-O157 were combined and payer proportion was derived from all ED visits instead of treat-and-release visits because of small sample size.

Page 3 of 5
Appendix 3 Table 2. Total annual cost to Medicare (sum of Medicare payments, in 2014 US dollars) of emergency department visits and hospitalizations from waterborne transmission of selected infections, 2014, United States
Disease
Treat-and-release ED visit Hospitalization Total
Mean insurer payment per visit
(95% CrI)
Annual number of commercial visits paid because of waterborne transmission (95% CrI)
Total insurer cost of treat-and-release ED visits for waterborne disease (95% CrI)
Mean insurer payment per
stay (95% CrI)
Total annual number of stays because of
waterborne transmission (95% CrI)
Total insurer cost of hospitalizations for
waterborne disease (95% CrI)
Total annual insurer cost for waterborne disease
(95% CrI) Campylobacteriosis 1,190 (92–9,290) 51 (5–155) 60,500 (959–519,000) 13,700 (404–
57,400) 842 (75–2,700) 11,500,000 (154,000–
61,000,000) 11,500,000 (212,000–
61,000,000) Cryptosporidiosis 4,110 (129–
18,000) 58 (20–113) 238,000 (4,250–
1,270,000) 16,900 (00–
155,000) 339 (31–1,080) 5,750,000 (9–39,400,000) 5,990,000 (142,000–
39,500,000) Giardiasis 1,040 (51–2,640) 76 (25–150) 78,800 (2,390–274,000) 22,900 (388–
118,000) 341 (113–677) 7,790,000 (186,000–
38,600,000) 7,870,000 (286,000–
38,600,000) Legionnaires' disease
626 (135–2,160) 43 (19–78) 27,200 (3,160–131,000) 32,800 (1,080–181,000)
4,930 (3,330–5,980) 162,000,000 (5,750,000–908,000,000)
162,000,000 (5,770,000–908,000,000)
Nontuberculous mycobacterial (NTM) infection
1,960 (47–10,000)
2,800 (1,420–4,280) 5,490,000 (81,200–33,400,000)
26,800 (647–159,000)
28,700 (15,000–41,400) 771,000,000 (17,200,000–4,440,000,000)
777,000,000 (19,500,000–4,440,000,000)
Otitis externa 421 (34–2,500) 43,600 (25,900–63,300) 18,400,000 (1,330,000–111,000,000)
13,500 (632–63,800)
8,740 (5,230–12,700) 118,000,000 (5,130,000–605,000,000)
136,000,000 (13,700,000–644,000,000)
Pseudomonas pneumonia
411 (54–1,970) 166 (43–315) 68,200 (4,490–393,000) 26,500 (572–145,000)
10,500 (2,790–19,000) 278,000,000 (3,880,000–1,530,000,000)
278,000,000 (3,940,000–1,530,000,000)
Pseudomonas septicemia
213 (67–529) 23 (1–68) 4,920 (188–20,100) 32,800 (768–179,000)
4,000 (516–9,990) 131,000,000 (1,410,000–783,000,000)
131,000,000 (1,410,000–783,000,000)
Salmonellosis, nontyphoidal
1,470 (79–8,960) 24 (2–82) 34,700 (391–257,000) 17,100 (474–80,900)
515 (34–1,920) 8,870,000 (64,400–50,300,000)
8,900,000 (84,500–50,300,000)
Shiga toxin-producing E. coli infection, O157
555 (84–1,510)* 5 (1–14) 2,790 (124–13,500) 16,600 (291–88,200)
42 (4–153) 700,000 (866–4,320,000) 702,000 (2,760–4,320,000)
Shiga toxin-producing E. coli infection, non-O157
555 (84–1,510)* 2 (0–06) 940 (0–5,710) 33,200 (1,040–243,000)
40 (0–167) 1,320,000 (0–11,000,000) 1,320,000 (274–11,000,000)
Shigellosis 297 (139–570) 3 (0–15) 892 (49–3,900) 10,200 (194–38,200)
54 (3–252) 546,000 (2,690–3,320,000)
547,000 (3,380–3,320,000)
Vibrio spp. infection 374 (269–479) 8 (2–18) 3,090 (528–7,690) 21,600 (5,280–76,300)
106 (65–153) 2,290,000 (457,000–8,750,000)
2,290,000 (461,000–8,750,000)
Total cost
24,400,000 (2,710,000–121,000,000)
1,500,000,000 (319,000,000–5,820,000,000)
1,520,000,000 (338,000,000–5,840,000,000)
*For emergency department (ED) visits only, costs for STEC O157 and STEC non-O157 were combined and payer proportion was derived from all ED visits instead of treat-and-release visits because of small sample size.
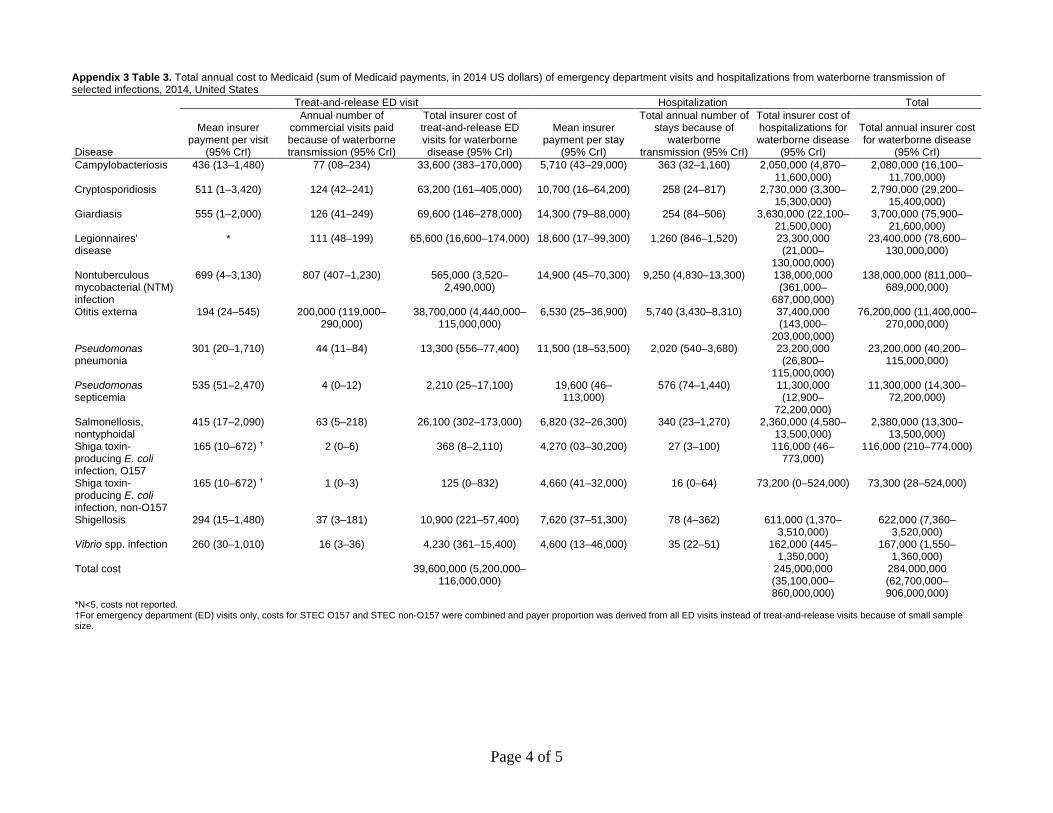
Page 4 of 5
Appendix 3 Table 3. Total annual cost to Medicaid (sum of Medicaid payments, in 2014 US dollars) of emergency department visits and hospitalizations from waterborne transmission of selected infections, 2014, United States
Disease
Treat-and-release ED visit Hospitalization Total
Mean insurer payment per visit
(95% CrI)
Annual number of commercial visits paid because of waterborne transmission (95% CrI)
Total insurer cost of treat-and-release ED visits for waterborne disease (95% CrI)
Mean insurer payment per stay
(95% CrI)
Total annual number of stays because of
waterborne transmission (95% CrI)
Total insurer cost of hospitalizations for waterborne disease
(95% CrI)
Total annual insurer cost for waterborne disease
(95% CrI) Campylobacteriosis 436 (13–1,480) 77 (08–234) 33,600 (383–170,000) 5,710 (43–29,000) 363 (32–1,160) 2,050,000 (4,870–
11,600,000) 2,080,000 (16,100–
11,700,000) Cryptosporidiosis 511 (1–3,420) 124 (42–241) 63,200 (161–405,000) 10,700 (16–64,200) 258 (24–817) 2,730,000 (3,300–
15,300,000) 2,790,000 (29,200–
15,400,000) Giardiasis 555 (1–2,000) 126 (41–249) 69,600 (146–278,000) 14,300 (79–88,000) 254 (84–506) 3,630,000 (22,100–
21,500,000) 3,700,000 (75,900–
21,600,000) Legionnaires' disease
* 111 (48–199) 65,600 (16,600–174,000) 18,600 (17–99,300) 1,260 (846–1,520) 23,300,000 (21,000–
130,000,000)
23,400,000 (78,600–130,000,000)
Nontuberculous mycobacterial (NTM) infection
699 (4–3,130) 807 (407–1,230) 565,000 (3,520–2,490,000)
14,900 (45–70,300) 9,250 (4,830–13,300) 138,000,000 (361,000–
687,000,000)
138,000,000 (811,000–689,000,000)
Otitis externa 194 (24–545) 200,000 (119,000–290,000)
38,700,000 (4,440,000–115,000,000)
6,530 (25–36,900) 5,740 (3,430–8,310) 37,400,000 (143,000–
203,000,000)
76,200,000 (11,400,000–270,000,000)
Pseudomonas pneumonia
301 (20–1,710) 44 (11–84) 13,300 (556–77,400) 11,500 (18–53,500) 2,020 (540–3,680) 23,200,000 (26,800–
115,000,000)
23,200,000 (40,200–115,000,000)
Pseudomonas septicemia
535 (51–2,470) 4 (0–12) 2,210 (25–17,100) 19,600 (46–113,000)
576 (74–1,440) 11,300,000 (12,900–
72,200,000)
11,300,000 (14,300–72,200,000)
Salmonellosis, nontyphoidal
415 (17–2,090) 63 (5–218) 26,100 (302–173,000) 6,820 (32–26,300) 340 (23–1,270) 2,360,000 (4,580–13,500,000)
2,380,000 (13,300–13,500,000)
Shiga toxin-producing E. coli infection, O157
165 (10–672) † 2 (0–6) 368 (8–2,110) 4,270 (03–30,200) 27 (3–100) 116,000 (46–773,000)
116,000 (210–774,000)
Shiga toxin-producing E. coli infection, non-O157
165 (10–672) † 1 (0–3) 125 (0–832) 4,660 (41–32,000) 16 (0–64) 73,200 (0–524,000) 73,300 (28–524,000)
Shigellosis 294 (15–1,480) 37 (3–181) 10,900 (221–57,400) 7,620 (37–51,300) 78 (4–362) 611,000 (1,370–3,510,000)
622,000 (7,360–3,520,000)
Vibrio spp. infection 260 (30–1,010) 16 (3–36) 4,230 (361–15,400) 4,600 (13–46,000) 35 (22–51) 162,000 (445–1,350,000)
167,000 (1,550–1,360,000)
Total cost
39,600,000 (5,200,000–116,000,000)
245,000,000 (35,100,000–860,000,000)
284,000,000 (62,700,000–906,000,000)
*N<5, costs not reported. †For emergency department (ED) visits only, costs for STEC O157 and STEC non-O157 were combined and payer proportion was derived from all ED visits instead of treat-and-release visits because of small sample size.

Page 5 of 5
Appendix 3 Table 4. Total annual cost (in 2014 US dollars) of emergency department visits and hospitalizations from all transmission routes of selected diseases, 2014, United States
Disease or syndrome
Treat-and-release ED visit Hospitalization Total
Cost per visit (95% CrI)
Total annual number of treat-and-release ED visits because of all transmission
routes (95% CrI)
Total cost of treat-and-release ED visits for selected diseases
(95% CrI) Cost per stay
(95% CrI)
Total annual number of stays because of all transmission routes
(95% CrI)
Total cost of hospitalizations for selected diseases
(95% CrI)
Total annual direct healthcare cost of selected diseases
(95% CrI) Campylobacteriosis 1,710 (137–5,810) 2900 (1620–4630) 4,950,000 (398,000–
18,700,000) 13,600 (3,850–
35,800) 19,300 (8790–34,900) 261,000,000
(56,800,000–790,000,000)
266,000,000 (61,500,000–794,000,000)
Cryptosporidiosis 1,960 (238–6,270) 1260 (742–1880) 2,460,000 (257,000–8,150,000)
16,100 (4,360–55,400)
2,860 (439–8,060) 45,900,000 (3,710,000–
195,000,000)
48,400,000 (5,670,000–
197,000,000) Giardiasis 1,620 (196–7,510) 1460 (902–2,090) 2,360,000 (284,000–
9,880,000) 21,800 (6,160–
99,200) 2,830 (1760–4,070) 61,800,000
(14,300,000–265,000,000)
64,200,000 (16,200,000–267,000,000)
Legionnaires’ disease 691 (288–1,390) 691 (316–1,220) 477,000 (137,000–1,160,000)
37,100 (7,950–149,000)
11,200 (8,750–13,300) 416,000,000 (84,800,000–
1,740,000,000)
416,000,000 (85,400,000–
1,740,000,000) Nontuberculous mycobacterial (NTM) infection
1,610 (129–6,430) 7,150 (5110–9,620) 11,500,000 (892,000–46,100,000)
29,600 (6,350–120,000)
72,400 (57,300–89,700)
2,140,000,000 (436,000,000–8,720,000,000)
2,160,000,000 (448,000,000–8,730,000,000)
Norovirus* 1,140 429,000 491,000,000 6,080 78,100 475,000,000 966,000,000
Otitis externa 494 (120–1,430) 726,000 (466,000–994,000) 358,000,000 (79,600,000–
1,070,000,000)
12,200 (3,320–42,400)
29,700 (19,200–40,600)
365,000,000 (89,900,000–
1,330,000,000)
723,000,000 (250,000,000–1,990,000,000)
Pseudomonas pneumonia
856 (89–4,190) 580 (321–902) 496,000 (45,500–2,440,000)
29,300 (5,910–114,000)
30,800 (18,700–44,700)
901,000,000 (164,000,000–3,710,000,000)
901,000,000 (165,000,000–3,710,000,000)
Pseudomonas septicemia
923 (95–3,190) 164 (36–326) 151,000 (9140–731,000)
38,200 (6,340–172,000)
25,300 (16300–34,800)
968,000,000 (149,000,000–4,240,000,000)
968,000,000 (149,000,000–4,240,000,000)
Salmonellosis, nontyphoidal
1,230 (161–4,500) 3400 (2100–4900) 4,200,000 (510,000–16,000,000)
14,900 (4,300–46,900)
26,600 (11400–52,800)
395,000,000 (79,500,000–
1,410,000,000)
400,000,000 (83,300,000–
1,420,000,000) Shiga toxin-producing E. coli infection, O157†
1,070 (109–2,350) 252 (92–465) 269,000 (16600–794,000)
19,000 (3,790–85,000)
2640 (487–7630) 50,400,000 (4,270,000–
244,000,000)
50,700,000 (4,530,000–
244,000,000) Shiga toxin-producing E. coli infection, non-O157†
1,070 (109–2,350) 75 (12–171) 79,600 (3090–274,000)
24,200 (4,780–138,000)
1420 (264–3810) 34,500,000 (2490000–
223,000,000)
34,600,000 (2,570,000–
223,000,000) Shigellosis 952 (115–3,980) 1650 (540–2860) 1,570,000 (123,000–
7,420,000) 14,200 (4,130–
48,000) 6380 (929–20,300) 90,700,000
(8,170,000–398,000,000)
92,300,000 (9,280,000–
400,000,000) Vibrio spp. infection 1,030 (293–3,330) 366 (122–700) 376,000 (53,700–
1,270,000) 16,000 (3,780–
39,900) 782 (567–1030) 12,500,000
(2,620,000–32,300,000)
12,900,000 (3,010,000–32,800,000)
Total cost
878,000,000 (596,000,000–1,590,000,000)
6,220,000,000 (2,980,000,000–15,400,000,000)
7,100,000,000 (3,770,000,000–16,300,000,000)
*For norovirus only, costs were derived from previously published estimates that did not include uncertainty intervals. In addition, the number of emergency department visits includes visits in which the patient was admitted to the hospital. †For emergency department (ED) visits only, costs for STEC O157 and STEC non-O157 were combined and payer proportion was derived from all ED visits instead of treat-and-release visits because of small sample size.