
ESTCP Cost and Performance Report - CLU-IN
45
Site Characterization and Analysis Penetrometer System (SCAPS) Heavy Metal Sensors April 2003 ESTCP Cost and Performance Report ENVIRONMENTAL SECURITY TECHNOLOGY CERTIFICATION PROGRAM U.S. Department of Defense (CU-9716)
Transcript of ESTCP Cost and Performance Report - CLU-IN
Site Characterization and Analysis Penetrometer System(SCAPS) Heavy Metal Sensors
April 2003
ESTCPCost and Performance Report
ENVIRONMENTAL SECURITYTECHNOLOGY CERTIFICATION PROGRAM
U.S. Department of Defense
(CU-9716)

i
COST & PERFORMANCE REPORTESTCP Project: CU-9716
TABLE OF CONTENTS
Page
1.0 EXECUTIVE SUMMARY . . . . . . . . . . . . . . . . . . . . . . . . . . . . . . . . . . . . . . . . . . . . . . . . 11.1 BACKGROUND . . . . . . . . . . . . . . . . . . . . . . . . . . . . . . . . . . . . . . . . . . . . . . . . . . 11.2 OBJECTIVES OF THE DEMONSTRATION . . . . . . . . . . . . . . . . . . . . . . . . . . . 11.3 DEMONSTRATION RESULTS . . . . . . . . . . . . . . . . . . . . . . . . . . . . . . . . . . . . . . 11.4 STAKEHOLDER/END-USER ISSUES . . . . . . . . . . . . . . . . . . . . . . . . . . . . . . . . 1
2.0 TECHNOLOGY DESCRIPTION . . . . . . . . . . . . . . . . . . . . . . . . . . . . . . . . . . . . . . . . . . . 32.1 TECHNOLOGY DEVELOPMENT AND APPLICATION . . . . . . . . . . . . . . . . . 3
2.1.1 Background . . . . . . . . . . . . . . . . . . . . . . . . . . . . . . . . . . . . . . . . . . . . . . . . 32.1.2 Laser Induced Breakdown Spectroscopy (LIBS) . . . . . . . . . . . . . . . . . . . 3
2.1.2.1 The FO-LIBS Sensor . . . . . . . . . . . . . . . . . . . . . . . . . . . . . . . . . . 42.1.2.2 The DL-LIBS Sensor . . . . . . . . . . . . . . . . . . . . . . . . . . . . . . . . . . 5
2.1.2 The X-Ray Fluorescence (XRF) Sensor . . . . . . . . . . . . . . . . . . . . . . . . . . 62.2 PROCESS DESCRIPTION . . . . . . . . . . . . . . . . . . . . . . . . . . . . . . . . . . . . . . . . . . 92.3 PREVIOUS TESTING OF THE TECHNOLOGY . . . . . . . . . . . . . . . . . . . . . . . 102.4 ADVANTAGES AND LIMITATIONS OF THE TECHNOLOGY . . . . . . . . . . 10
2.4.1 Advantages of the Technology . . . . . . . . . . . . . . . . . . . . . . . . . . . . . . . . . 102.4.1.1 Sensor Advantages . . . . . . . . . . . . . . . . . . . . . . . . . . . . . . . . . . . 11
2.4.2 Limitations of the Technology . . . . . . . . . . . . . . . . . . . . . . . . . . . . . . . . . 112.4.2.1 CPT Limitations . . . . . . . . . . . . . . . . . . . . . . . . . . . . . . . . . . . . . 112.4.2.2 Sensor Limitations . . . . . . . . . . . . . . . . . . . . . . . . . . . . . . . . . . . 112.4.2.3 Matrix and Moisture Effects . . . . . . . . . . . . . . . . . . . . . . . . . . . . 12
3.0 DEMONSTRATION DESIGN . . . . . . . . . . . . . . . . . . . . . . . . . . . . . . . . . . . . . . . . . . . . 153.1 PERFORMANCE OBJECTIVES . . . . . . . . . . . . . . . . . . . . . . . . . . . . . . . . . . . . 153.2 SELECTION OF TEST SITE(S) . . . . . . . . . . . . . . . . . . . . . . . . . . . . . . . . . . . . . 163.3 TEST SITE HISTORY AND CHARACTERISTICS . . . . . . . . . . . . . . . . . . . . . 16
3.3.1 Lake City Army Ammunition Plant, Independence, Missouri . . . . . . . . 173.3.2 IWTP at Naval Air Station, North Island, California . . . . . . . . . . . . . . . 173.3.3 The Former Ship Repair Area (Parcel D), Hunters Point
Shipyard, San Francisco, California . . . . . . . . . . . . . . . . . . . . . . . . . . . . 183.3.4 Camp Keller Small Arms Range, Keesler Air Force Base,
Biloxi, Mississippi . . . . . . . . . . . . . . . . . . . . . . . . . . . . . . . . . . . . . . . . . . 193.4 PHYSICAL SET-UP AND OPERATION . . . . . . . . . . . . . . . . . . . . . . . . . . . . . 203.5 SAMPLING/MONITORING PROCEDURES . . . . . . . . . . . . . . . . . . . . . . . . . . 203.6 ANALYTICAL PROCEDURES . . . . . . . . . . . . . . . . . . . . . . . . . . . . . . . . . . . . . 21

TABLE OF CONTENTS (continued)
Page
ii
4.0 PERFORMANCE ASSESSMENT . . . . . . . . . . . . . . . . . . . . . . . . . . . . . . . . . . . . . . . . . 234.1 PERFORMANCE DATA . . . . . . . . . . . . . . . . . . . . . . . . . . . . . . . . . . . . . . . . . . 234.2 PERFORMANCE CRITERIA . . . . . . . . . . . . . . . . . . . . . . . . . . . . . . . . . . . . . . . 244.3 DATA ASSESSMENT . . . . . . . . . . . . . . . . . . . . . . . . . . . . . . . . . . . . . . . . . . . . 254.4 TECHNOLOGY COMPARISON . . . . . . . . . . . . . . . . . . . . . . . . . . . . . . . . . . . . 25
5.0 COST ASSESSMENT . . . . . . . . . . . . . . . . . . . . . . . . . . . . . . . . . . . . . . . . . . . . . . . . . . . 275.1 COST REPORTING . . . . . . . . . . . . . . . . . . . . . . . . . . . . . . . . . . . . . . . . . . . . . . 275.2 COST ANALYSIS . . . . . . . . . . . . . . . . . . . . . . . . . . . . . . . . . . . . . . . . . . . . . . . . 275.3 COST COMPARISON . . . . . . . . . . . . . . . . . . . . . . . . . . . . . . . . . . . . . . . . . . . . 28
6.0 IMPLEMENTATION ISSUES . . . . . . . . . . . . . . . . . . . . . . . . . . . . . . . . . . . . . . . . . . . . 316.1 COST OBSERVATIONS . . . . . . . . . . . . . . . . . . . . . . . . . . . . . . . . . . . . . . . . . . 316.2 PERFORMANCE OBSERVATIONS . . . . . . . . . . . . . . . . . . . . . . . . . . . . . . . . . 316.3 SCALE-UP . . . . . . . . . . . . . . . . . . . . . . . . . . . . . . . . . . . . . . . . . . . . . . . . . . . . . 316.4 OTHER SIGNIFICANT OBSERVATIONS . . . . . . . . . . . . . . . . . . . . . . . . . . . . 316.5 LESSONS LEARNED . . . . . . . . . . . . . . . . . . . . . . . . . . . . . . . . . . . . . . . . . . . . . 326.6 END-USER ISSUES . . . . . . . . . . . . . . . . . . . . . . . . . . . . . . . . . . . . . . . . . . . . . . 326.7 APPROACHES TO REGULATORY COMPLIANCE
AND ACCEPTANCE . . . . . . . . . . . . . . . . . . . . . . . . . . . . . . . . . . . . . . . . . . . . . 32
7.0 REFERENCES . . . . . . . . . . . . . . . . . . . . . . . . . . . . . . . . . . . . . . . . . . . . . . . . . . . . . . . . 35
APPENDIX A POINTS OF CONTACT . . . . . . . . . . . . . . . . . . . . . . . . . . . . . . . . . . . A-1

iii
LIST OF FIGURES
Page
Figure 1. Schematic of Fiber Optic LIBS (FO-LIBS) System . . . . . . . . . . . . . . . . . . . . . . . 4Figure 2. Schematic of Downhole Laser LIBS (DL-LIBS) System . . . . . . . . . . . . . . . . . . . 6Figure 3. Schematic of the XRF Sensor . . . . . . . . . . . . . . . . . . . . . . . . . . . . . . . . . . . . . . . . 7Figure 4. Photograph of Navy Cone Penetrometer Test (CPT) Vehicle . . . . . . . . . . . . . . . . 9Figure 5. Contingency Plot Analysis where DLT is the Detection Limit Threshold . . . . . 23
LIST OF TABLES
Page
Table 1. Metal Sensor Test Sites and Target Contaminant . . . . . . . . . . . . . . . . . . . . . . . . 16Table 2. Summary of Contingency Analysis Results for Comparison of Benchtop
Laboratory Data Obtained by the Three Sensors with ICP Results for the Four Site Demonstrations . . . . . . . . . . . . . . . . . . . . . . . . . . . . . . . . . . . . . . . . . . 24
Table 3. Precision Results for Replicate ICP Analyses of Soil Samples from Each Test Site . . . . . . . . . . . . . . . . . . . . . . . . . . . . . . . . . . . . . . . . . . . . . . . . . . . . . . . . 25
Table 4 Capital Equipment Costs for the Three SCAPS Metal Sensor Systems and a Commercial LIF System . . . . . . . . . . . . . . . . . . . . . . . . . . . . . . . . . . . . . . . . . . . 28
Table 5. Cost Comparison of SCAPS Metal Sensors with Conventional Sampling and Direct Push Sampling . . . . . . . . . . . . . . . . . . . . . . . . . . . . . . . . . . . . . . . . . . 29

iv
LIST OF ACRONYMS
:sec microsecondAs Arsenic
bgs below ground surface
Cal Cert California EPA Department of Toxic Control’s Technology CertificationProgram
cm CentimeterCPT Cone Penetrometer Test
DL-LIBS Downhole Laser – Laser-Induced Breakdown SpectroscopyDLT Detection Limit ThresholdDOE Department of EnergyDOIT Demonstrating Onsite Innovative TechnologyDOT Department of Transportation
EPA Environmental Protection AgencyERDC U.S. Army Engineer Research and Development CenterESTCP Environmental Security Technology Certification Program
Fe IronFO-LIBS Fiber Optic – Laser-Induced Breakdown Spectroscopyft feet
g gramGW/cm2 gigawatts per square centimeter
Hg Mercuryhr hourHz Hertz
ICP Inductively-Coupled-PlasmaITRC Interstate Technology Regulatory Cooperation IWTP Industrial Waste Treatment Plant
kV kilovolt
LIBS Laser-Induced Breakdown SpectroscopyLIF Laser-Induced Fluorescence
m metermsl mean sea level

LIST OF ACRONYMS (continued)
v
Nd NeodymiumNd:YAG Neodymium: Yttrium Aluminum GarnetNRL Navy Research Lab
PIN P-type/Intrinsic/N-type diodeppm parts per millionPTO power take off
SCAPS Site Characterization and Analysis Penetrometer Systemsec secondSERDP Strategic Environmental Research and Development ProgramSi SiliconSSC Space and Naval Warfare System Center
TSTG Technology Specific Task Group
U.S. EPA United State Environmental Protection Agency
WGA Western Governors Association
XRF X-Ray Fluorescence
YAG Yttrium Aluminum Garnet

vi
ACKNOWLEDGMENTS
The following individuals (listed in alphabetical order) contributed to this report:
Mr. John Ballard, U.S. Army Engineer Research and Development Center.Dr. Pamela Boss, SPAWAR Systems Center, San Diego.Mr. Javier Cortes, U.S. Army Engineer Research and Development Center.Dr. W. Tim Elam, Naval Research Lab.Dr. Stephen Lieberman, SPAWAR Systems Center, San Diego.Mr. George Robitaille, Army Environmental Center.
Technical material contained in this report has been approved for public release.
1
1.0 EXECUTIVE SUMMARY
1.1 BACKGROUND
The contamination at a hazardous waste site must first be delineated before clean up of the site canbegin. Site characterization can be very costly, accounting for a third or more of the total cleanupcost. Until recently, the most common method in determining the extent of subsurface cleanup wasto collect samples from either soil borings or monitoring wells, then sending them to a laboratoryfor analysis. This approach is inefficient and expensive.
1.2 OBJECTIVES OF THE DEMONSTRATION
The Site Characterization and Analysis Penetrometer System (SCAPS) was developed to addressrequirements for improved subsurface measurement of contaminants. SCAPS combines traditionalcone penetrometer technology with real-time direct push chemical sensors to rapidly delineate thesubsurface distribution of contaminants and hydrogeological conditions. In order to broaden theapplicability of SCAPS, the Strategic Environmental Research and Development Program(SERDP) funded the development of several real-time in situ sensor technologies for screening ofheavy metal contamination in soils. This technology demonstration report documents theperformance and cost evaluation of three direct push metal sensor technologies conducted as partof a series of comprehensive side-by-side, field and laboratory evaluations supported by theEnvironmental Security Technology Certification Program (ESTCP). The technologies include twosensor systems based on Laser-Induced Breakdown Spectroscopy (LIBS) and one system based onX-Ray fluorescence (XRF).
1.3 DEMONSTRATION RESULTS
Field evaluations were conducted at four different sites selected to reflect varying hydrogeologicalconditions, metal contaminants, and modes of introduction of the metal contaminant into theenvironment (e.g., dissolved vs. particulate). Test sites included the Lake City Army AmmunitionPlant in Independence, MO; Naval Air Station North Island at North Island, CA; Hunters PointShipyard in San Francisco, CA; and Camp Keller in Biloxi, MS. Performance assessments in whichresults from the three sensors were compared against inductively-coupled-plasma (ICP) laboratoryanalysis of discrete samples showed mean accuracy of 91.7%, 97%, and 97%, respectively for XRF,Fiber Optic LIBS (FO-LIBS), and Downhole Laser LIBS (DL-LIBS) for the four sitedemonstrations. Cost comparison between SCAPS Metal Sensors with conventional Sampling andDiscrete Push Sampling with off-site chemical analyses showed a cost advantage for the direct pushsensors, on a cost per sample basis, of 98% compared with conventional soil borings and 95%compared to direct push sampling methods.
1.4 STAKEHOLDER/END-USER ISSUES
As a field-screening tool, the direct push metal sensor can delineate the distribution and boundariesof the contaminant source. At sites where the technology is applicable, results can be used tooptimize the location, as well as reduce the number of soil borings and monitoring wells necessaryto characterize a site. This information can significantly reduce both the overall number of samples

2
that need to be submitted for costly and time-consuming laboratory analyses and the costs associatedwith multiple and/or iterative field investigations.

3
2.0 TECHNOLOGY DESCRIPTION
2.1 TECHNOLOGY DEVELOPMENT AND APPLICATION
Three different direct push metal sensors are described in this report: Fiber Optic LIBS (FO-LIBS),Downhole Laser LIBS (DL-LIBS), and XRF. The following sections describe the motivation,technical details and use of the three-sensor systems.
2.1.1 Background
The contamination at a hazardous waste site must first be delineated before clean up of the site canbegin. Site characterization can be very costly, accounting for a third or more of the total clean-upcost. Until recently, the most common way to determine the extent of subsurface contamination wasto collect samples from soil borings or monitoring wells and send them to a laboratory for analysis.This approach has proven to be inefficient and expensive. Risk based clean-up strategies maydictate that the clean-up process will not require removal and/or treatment, but rather long-termmonitoring to insure that there is no unexpected migration of the contaminant. Consequently,improved methods of monitoring contaminants in the subsurface are important for both thecharacterization and remediation of a site.
SCAPS (Site Characterization and Analysis Penetrometer System) was developed to address thisrequirement for improved subsurface measurement of contaminants. SCAPS combines traditionalcone penetrometer technology with real-time chemical sensors to rapidly delineate the subsurfacedistribution of contaminants and hydrogeological conditions. The first chemical sensor fielded withSCAPS, the laser-induced fluorescence (LIF) sensor for petroleum, oils, and lubricants (POLs) hasnow been successfully commercialized. It also has achieved acceptance by the regulatorycommunity as evidenced by its certification by the California Environmental Protection Agency(EPA), and verification by the U.S. EPA as well as numerous states via the Interstate TechnologyRegulatory Cooperation (ITRC) group.
In order to broaden the applicability of SCAPS, the Strategic Environmental Research andDevelopment Program (SERDP) funded the development of sensor technologies for othercontaminants. In particular, sensor systems have been developed for real-time in situ field screeningof heavy metal contamination in soils. These three heavy metal sensor technologies include twosensor systems that are based on laser-induced breakdown spectroscopy (LIBS) and a thirdtechnology based on X-ray fluorescence (XRF). All three technologies emerged from the SERDPsponsored Accelerated Tri-Service SCAPS Sensor Development Program. This report describes thedemonstration and validation of the capabilities of these three SCAPS metal sensing technologiesto rapidly screen sites for the distribution of subsurface heavy metal contamination.
2.1.2 Laser Induced Breakdown Spectroscopy (LIBS)
LIBS involves the analysis of the spectral emission from a laser-induced spark. The spark isgenerated by focusing the high power emission from a pulsed laser onto a small spot on a samplematerial, resulting in a power density on the sample in excess of several gigawatts per squarecentimeter (GW/cm2). Within the small volume about the focal point, rapid heating, vaporization,and ionization of a small amount of the sample material occurs. The subsequent laser-induced

4
Figure 1. Schematic of Fiber Optic LIBS (FO-LIBS) System.
plasma emission is spectroscopically analyzed to yield qualitative and quantitative information aboutthe elemental species present in the sample.
The LIBS technique has been used successfully in the laboratory to identify and quantify elementalspecies in solids, liquids, and gases. The method is well suited to in situ detection of heavy metalcontamination in soil because it is highly sensitive while requiring no sample preparation. Becausethe emission of different elements occurs at unique wavelengths, the method can be used forsimultaneous analysis of multiple components.
The two LIBS probes developed under SERDP funding differ in the method of delivery of theexcitation beam used to generate the laser-induced spark. The first configuration, fiber optic LIBS(FO-LIBS), utilizes optical fibers to deliver the excitation energy from a laser located in the truckto the sample. In the second configuration, downhole-laser LIBS (DL-LIBS), the laser is physicallylocated in the CPT probe.
LIBS can generally be used to excite emission spectra from any atomic species with speciesdependant efficiency. In order to perform LIBS measurements remotely and in real time, as requiredby CPT-based sensor systems, several operational and design tradeoffs must be made betweenanalytical precision/accuracy and timeliness of data collection. Because the two LIBS techniquesevaluated in this study both use optical fibers to deliver the emitted spectra to an up-hole detectionsystem, the choice of spectral lines used to characterize the species under study must fall in aspectral range that is consistent with the transmission capability of the optical fiber. Also, since theLIBS measurements are done in situ, there are matrix effects due to grain size or moisture content,which can affect the intensity of the response of the LIBS systems.
2.1.2.1 The FO-LIBS Sensor
The FO-LIBS sensor, shownschematically in Figure 1,utilizes the Q-switchedoutput of a Nd:YAG laseroperating at 30 Hz at 1064nm which is delivered via afused-silica fiber to theprobe. A low f/# opticalsystem (f/# ~1) is used in theprobe to focus the laseroutput. This minimizes thesize of the focused image ofthe optical fiber face on thesample and provides a powerdensity at the sample that issufficient to generate alaser-induced plasma.
Details of the FO-LIBS probeare described in the ESTCP final report (Lieberman et al., 2001). Briefly, the light emitted from thefiber in the probe is collimated, turned by a quartz prism, and focused by a short-focal-length quartz

5
lens through a sapphire window in the probe. Because the soil is pressed against the window, thelens-to-sample distance is held fixed. Contamination is not an issue because the probe is entirelysealed, allowing for operation below the water table.
It was observed that after several thousand laser pulses, the sapphire window became pitted by theLIBS spark, resulting in degradation of window transmission; therefore, a system was designed toreposition the spark on the window surface (Theriault et al., 1998). This design incorporates twostepping motors to drive a block that houses the optics and provides two-axis control of the positionof the spark on the window surface. Due to the relatively small size of the focused spot, comparedto the size of the sapphire window, the number of discrete positions available is in excess of 1,000.After the window surface has been completely scanned (typically one week), a new window isinserted in the probe window housing at a replacement cost of $17.00.
The excitation and emission light are decoupled using the configuration shown in Figure 1. Theexcitation beam is focused by a 25-cm focal length lens through a 2-inch aluminum mirrorcontaining a small hole at 45°. Since the returning LIBS signal fills the entire numerical apertureof the fiber, most of the return signal is turned 90° by the mirror with only a small loss (~5%)through the hole. Like the probe design, this configuration is robust and can be operated over a largespectral range allowing the analysis of different spectral regions with no system adjustment orcomponent substitution.
The spark emission is fiber-optically coupled to a spectrograph that disperses the light onto atime-gated, intensified, linear detector array. The time gating of the detector during data collectionis crucial due to the initial broadband background continuum during the evolution of the plasma.Resolution of the signal from the metal emission is enhanced by delaying the application of the gatepulse to the detector until after the short-lived broadband background has decayed. The durationof the gate pulse is chosen to correspond with the duration of the metal emission to optimize thesignal-to-noise ratio.
In order to reduce the standard deviation of the data, signal averaging is used. Typically, eachmeasurement is the result of 300 single-shot spectra which are accumulated in the memory of thedetector controller. For a laser with a 30Hz repetition rate, acquisition of 300 spectra requires 10seconds. Depth resolution can be controlled by the operator and is typically 1 inch.
Detection limits for LIBS in general, and the FO-LIBS sensor in particular, are a function of severalvariables, including the intensity of the emission line(s) for a specific metal, plasma temperature,and detector signal to noise, etc. For in situ measurements, soil type and moisture content are alsoimportant variables. For dry soil, with a grain size of 600-800 :M, typical detection limits for theFO-LIBS sensor of 0.7, 5.2, and 19 ppm for lead, chromium and cadmium, respectively, have beenreported (Theriault et al., 1998).
2.1.2.2 The DL-LIBS Sensor
There are two significant design differences between the FO-LIBS sensor and the DL-LIBS sensorsystem.
6
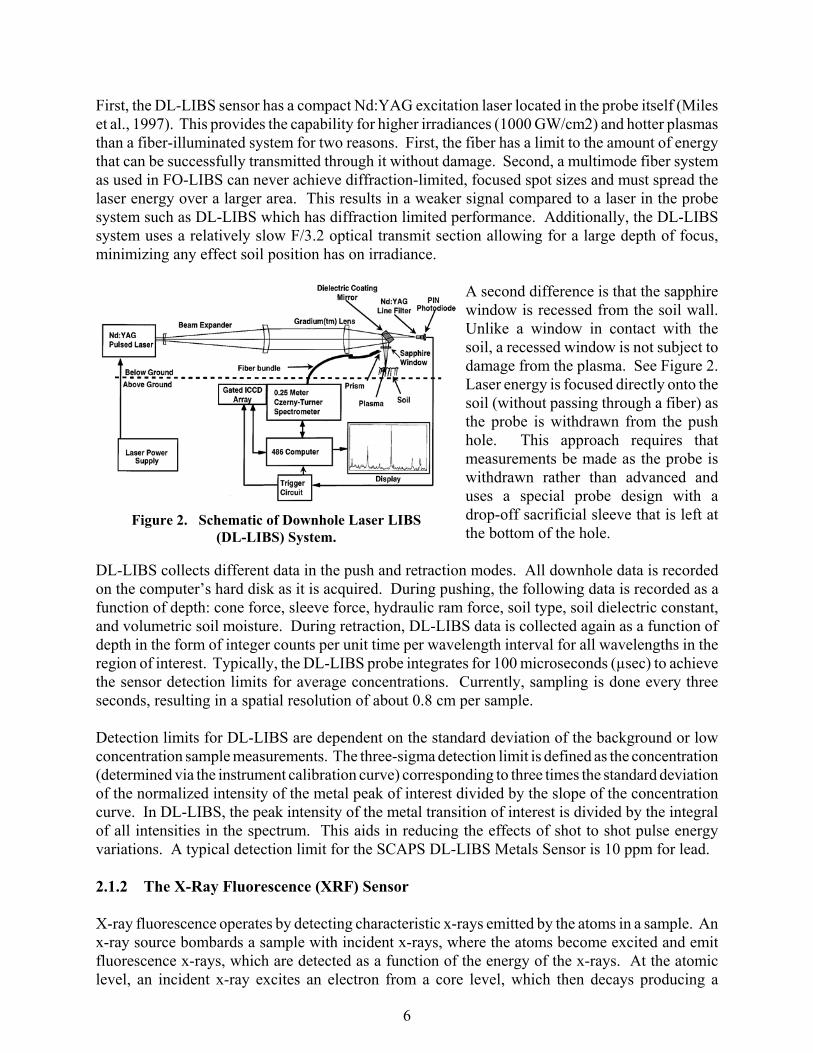
Figure 2. Schematic of Downhole Laser LIBS(DL-LIBS) System.
First, the DL-LIBS sensor has a compact Nd:YAG excitation laser located in the probe itself (Mileset al., 1997). This provides the capability for higher irradiances (1000 GW/cm2) and hotter plasmasthan a fiber-illuminated system for two reasons. First, the fiber has a limit to the amount of energythat can be successfully transmitted through it without damage. Second, a multimode fiber systemas used in FO-LIBS can never achieve diffraction-limited, focused spot sizes and must spread thelaser energy over a larger area. This results in a weaker signal compared to a laser in the probesystem such as DL-LIBS which has diffraction limited performance. Additionally, the DL-LIBSsystem uses a relatively slow F/3.2 optical transmit section allowing for a large depth of focus,minimizing any effect soil position has on irradiance.
A second difference is that the sapphirewindow is recessed from the soil wall.Unlike a window in contact with thesoil, a recessed window is not subject todamage from the plasma. See Figure 2.Laser energy is focused directly onto thesoil (without passing through a fiber) asthe probe is withdrawn from the pushhole. This approach requires thatmeasurements be made as the probe iswithdrawn rather than advanced anduses a special probe design with adrop-off sacrificial sleeve that is left atthe bottom of the hole.
DL-LIBS collects different data in the push and retraction modes. All downhole data is recordedon the computer’s hard disk as it is acquired. During pushing, the following data is recorded as afunction of depth: cone force, sleeve force, hydraulic ram force, soil type, soil dielectric constant,and volumetric soil moisture. During retraction, DL-LIBS data is collected again as a function ofdepth in the form of integer counts per unit time per wavelength interval for all wavelengths in theregion of interest. Typically, the DL-LIBS probe integrates for 100 microseconds (µsec) to achievethe sensor detection limits for average concentrations. Currently, sampling is done every threeseconds, resulting in a spatial resolution of about 0.8 cm per sample.
Detection limits for DL-LIBS are dependent on the standard deviation of the background or lowconcentration sample measurements. The three-sigma detection limit is defined as the concentration(determined via the instrument calibration curve) corresponding to three times the standard deviationof the normalized intensity of the metal peak of interest divided by the slope of the concentrationcurve. In DL-LIBS, the peak intensity of the metal transition of interest is divided by the integralof all intensities in the spectrum. This aids in reducing the effects of shot to shot pulse energyvariations. A typical detection limit for the SCAPS DL-LIBS Metals Sensor is 10 ppm for lead.
2.1.2 The X-Ray Fluorescence (XRF) Sensor
X-ray fluorescence operates by detecting characteristic x-rays emitted by the atoms in a sample. Anx-ray source bombards a sample with incident x-rays, where the atoms become excited and emitfluorescence x-rays, which are detected as a function of the energy of the x-rays. At the atomiclevel, an incident x-ray excites an electron from a core level, which then decays producing a

7
fluorescence x-ray. Since the electron energy states producing a fluorescence x-ray are entirelywithin the atom, the x-ray is produced with a constant and well known energy (different for eachtype of atom).
X-ray fluorescence is a well-established, non-destructive method of determining elementalconcentrations at part per million (ppm) levels in complex samples. It operates with no samplepreparation and is currently used as a laboratory analysis method for samples obtained fromhazardous waste sites. Its characteristics are ideally suited to field analysis.
Recent advances in instrumentation have allowed the construction of a spectrometer, which willmeet the size restrictions imposed by the diameter of the cone penetrometer probe. Thisconfiguration is shown in Figure 3. High sensitivities can be achieved while the head is stationaryfor several minutes. Continuous monitoring at lower sensitivities is possible, depending on descentrates, contaminant concentration, and soil type.
The XRF metals sensor consists of three subsystems (refer to Figure 3): the actual below-groundprobe, the umbilical cable, and the above-ground electronics package (Elam et al., 1998). The probecontains the x-ray source, detector and preamp, appropriate x-ray optics, the mounting system, andthe rugged x-ray window. A sealed x-ray tube is used as the excitation source, both to achieveadequate detection limits in the allotted time and to avoid the licensing and safety problems of aradioactive source. The detector is a silicon P-type/Intrinsic/N-type (Si-PIN) diode in a small case

8
with self-contained cooling, connected to a low-noise preamp in close proximity. The preampprovides sufficient signal to drive the umbilical cable. The x-ray window is 1 mm thick boroncarbide, a low atomic number material that is relatively transparent to x-rays in the relevant energyrange.
The umbilical cable conducts high voltage and filament power required by the x-ray tube, theelectronics and cooling power for the detector and preamp, and the signal pulses from the detector.It is fully shielded both for noise immunity and high voltage safety. It also contains signal cablesfor stratigraphy sensors. The sensor has provisions for routing signal cables and grouting tubesthrough the sensor.
The above ground electronics package contains the x-ray tube power supply with safety interlocksand the driver electronics for the detector. The x-ray power supply for the x-ray tube providesadjustable high voltage (to 30kV) and filament voltage, which is regulated to provide constantemission current and thus constant x-ray output. The detector’s electronics provides the necessarypower supplies and contains pulse-shaping circuitry. Its output connects to a standard multichannelanalyzer for data collection and analysis. The electronics package connects to an interlock shieldinsuring that the probe is inserted into the ground before the x-ray tube is energized. This shield alsoallows test samples to be measured above ground via a sample introduction port. This port allowscalibration samples, blanks, and test samples to be run during field operations. The remainder ofthe above ground system consists of a multichannel analyzer and a portable computer to collect,interpret, and display the data.
Once the sensor window is brought into contact with the subsurface soils, the x-ray tube is energizedand an XRF spectrum is collected for 100 seconds. This spectrum is then stored and analyzed inaccordance with the methods outlined below. This takes a few seconds while the sensor is movedto a new depth, and the process repeated. This provides the best detection limits but requirescollecting data at each depth. The sensor can also be used in a continuous mode where data iscollected during descent. Any hot spots will be visible as rapid changes in the spectrum, and canbe investigated as desired. The entire 100-second spectrum gives an indication of the averageanalyte concentration throughout the depth covered during spectrum collection. This provides acompromise between detection limits, quantitation, and rapid survey coverage. Experiments havedetermined that a push rate of 0.5 cm/sec is ideal for this purpose. Hot spots above 2000 ppm canbe detected on-the-fly (Unsell, 1998) while the ability to achieve the sensor detection limits foraverage concentrations is retained.
Detection limits for x-ray fluorescence spectra depend almost entirely on counting statistics in thespectrum. The three-sigma detection limit is defined as the concentration (determined via theinstrument calibration curve) corresponding to three times the standard deviation of the backgroundintensity under the peak (measured on a low concentration sample or on the same region of thespectrum from a blank). The standard deviation is the square root of the number of x-ray counts.This method provides a reliable limit for detection by automated peak calculation algorithms. Thelimit of quantitation is ten times this standard deviation. A typical detection limit for the SCAPSXRF Metals Sensor is 100 ppm for lead.
XRF is a well-developed and widely accepted method for measuring metal content. Its capabilitiesare well known and its comparability to laboratory analysis results have been documented(MCDONALD et al., 1996). Matrix and interference effects are thoroughly understood and it is the

9
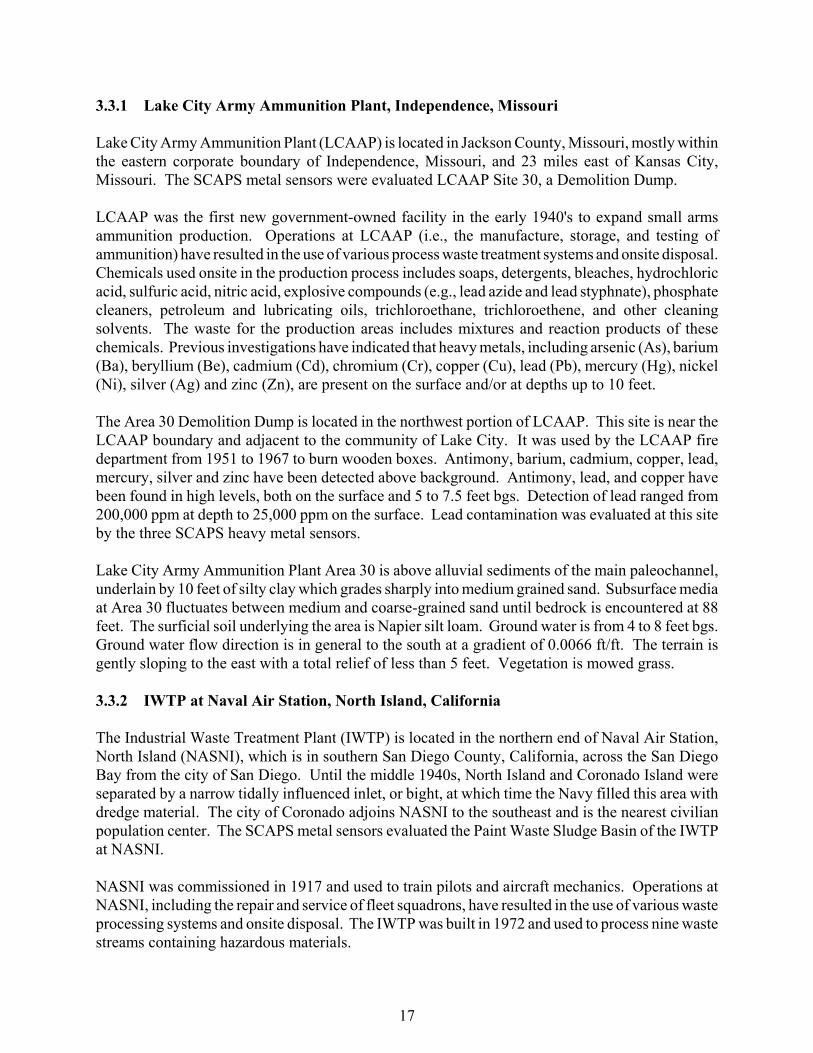
Figure 4. Photograph of Navy Cone Penetrometer Test(CPT) Vehicle.
subject of a draft EPA method entitled “Field Portable X-ray Fluorescence Spectrometry for theDetermination of Elemental Concentrations in Soil and Sediment” (FORDHAM, 1997). Its onlyweakness is that detection limits for most metals are in the 10 ppm range with current instruments.
2.2 PROCESS DESCRIPTION
All three sensors were designed fordeployment with a standard 20-toncone penetrometer platform (Figure4). Cone penetrometery has longbeen used to characterize soil forgeotechnical parameters, includingsoil classification, strength, andliquefaction potential. This isaccomplished by advancing(pushing) an instrumented probe intothe ground using a truck mountedhydraulic system. The hydraulicsystem translates the weight of thetruck (reaction mass) into pushingforce. A standard 20-ton system can
advance a 1 meter-long by 3.57-cm diameter probe into the ground at a rate of approximately 1meter per minute in accordance with American Society of Testing and Materials (ASTM) MethodD3441 (American Society for Testing and Materials, 2001). Probes can be pushed to depths inexcess of 50-m in normally compacted soils. Because the cone penetrometer vehicle is designed asa stand-alone mobile system, the truck can be driven to the site and simply positioned over theselected push location. A generator operated off the truck diesel engine and regulated through anuninterruptible power supply with a battery bank supplies all power for equipment. Other thanclearing the push location for utilities and obtaining “drilling” permits (requirements vary bylocality), there are no other set-up requirements. After the sensor probe is withdrawn, the push holecan be grouted using a second probe containing an umbilical through which grout is pumped,thereby hydraulically sealing the push hole.
Typically, a minimum crew of at least three people is required for most field operations. Thisincludes the sensor operator and two push room personnel. The required training for the push roompersonnel are similar to that required for the standard geotechnical cone penetrometer test (CPT).The sensor operator should be computer savvy, have a background in science or engineering, andhave detailed system component training in order to diagnose and correct field equipment problems.All personnel conducting field investigations at potentially contaminated sites are required tocomplete the 40-hr. Hazardous Waste Worker Training and receive annual 8-hr Hazardous WasteWorker Update training.

10
2.3 PREVIOUS TESTING OF THE TECHNOLOGY
The sensitivities of all three technical approaches have been documented at or below the regulatorylimits for metal contaminated soils under laboratory conditions. The FO-LIBS probe wassuccessfully field tested in January, 1996. The tested probe used a ‘fixed focal point’ design (i.e.,laser ablation occurred at the same place on the window). The initial test consisted of six pushesat uncontaminated sites with soils that ranged from medium to coarse grain silty sand. The emissionof naturally occurring Fe in the soil was profiled at depths up to 20 ft. The spectra obtained froma pure Fe powder was shown to overlay with the emission lines observed from the in situ soilmeasurements in the region from 390 nm to 440 nm. In these initial tests, the same probe andwindow were used for the duration of the experiment and withstood several thousand laser pulseswith no measurable loss in transmission. Subsequent tests encountered difficulties with severetransmission losses due to pitting of the sapphire window. The probe was redesigned to provide acapability to reposition the focusing optics onto an undamaged portion of the window. This‘scanning’ FO-LIBS probe was field tested at a lead battery dumpsite at Mare Island Naval Shipyardin April 1997. The distribution of the battery waste at the site was variable. Several contaminatedlocations were identified that coincided with plastic battery casings and metal at the surface.
After fabrication of the DL-LIBS probe in 1996, it was installed in the SCAPS truck, and systemchecks were conducted at the ERDC to ensure system operability. The DL-LIBS probe was thentested at the Louisiana Army Ammunition Plant. Nine pushes were performed in a landfill, whichwas primarily used to dump chromium-bearing sludge. Chromium was readily detected in all holespushed at the landfill. Field investigations also showed that no meaningful data could be obtainedwhen the probe was pushed below the water table. In August of 1997, the DL-LIBS probeconducted field investigations at the Joliet Army Ammunition Plant in Joliet, IL. The DL-LIBSsensor detected lead contamination from lead azide, which was used during fuse manufacturing.Depth profiles indicated a high degree of lead contamination at 2 feet below ground surface (bgs).These field tests demonstrated the probe’s capabilities in soil media ranging from sandy soil toexpansive clay soil and its ability to detect two target metals of DoD concern: chromium and lead.
The XRF probe was also tested at the Joliet Army Ammunition Plant in 1997. Eleven pushes wereperformed. Acceptable data were obtained for all the holes pushed.
In these previous testing of the three sensors, confirmational laboratory data were not obtained. Thepurpose of these initial field investigations was (1) to demonstrate that the LIBS and XRF sensorsystems had the capability to obtain field-screening data, and (2) to show that the probeconfigurations were robust.
2.4 ADVANTAGES AND LIMITATIONS OF THE TECHNOLOGY
2.4.1 Advantages of the Technology
The direct-push metal sensors were developed to provide real-time in situ measurements ofsubsurface metal contamination at hazardous waste sites. The method is not intended as a competereplacement for traditional soil borings and monitoring wells. Instead, the metals sensors are in situfiled screening techniques for qualitatively characterizing the pattern of subsurface metalcontamination prior to the installation of groundwater monitoring wells or soil borings.

11
Subsequently, the site can be further characterized with limited numbers of carefully placed stabsamplings, borings, or wells. In addition, characterization can be expedited based on immediateavailability of results minimizing or eliminating the need for return sampling efforts to compete thedelineation zone of contamination. Finally, direct-push sensors facilitated the characterization ofcontaminated sites with minimal exposure for site personnel and the community to toxiccontaminants while minimizing the volume of investigation-derived waste normally generated byconventional site characterization activities.
2.4.1.1 Sensor Advantages
In general, the detection limits are lower for LIBS than XRF based sensors for on-the-flymeasurements (approx 1-10 ppm for LBS vs. approx 1000 ppm for XRF). However, XRF detectionlimits can be improved to 100 ppm or better by using longer integration times.
It has been suggested that because of the very high irradiances (1000 GW/cm2) that can be achievedwith the down-hole laser used in the DL-LIBS system that the system would be expected to hotterplasmas and hence improved detection capabilities over fiber optic systems (Miles et al., 1997).However, recent evidence appears to indicate that optimal results are obtained using laser pulseswith 20-50 mJ pulses of 5-20 ns duration to produce peak powers of a few megawatts (Winefordner,2000).
The major advantage of XRF over LIBS technique is that the XRF method integrates a larger samplearea (volume) than the LIBS methods.
2.4.2 Limitations of the Technology
2.4.2.1 CPT Limitations
The three sensor technologies were designed for cone penetrometer truck deployment.Consequently, all are subject to the push limits of this particular type of CPT platform. Thedimensions of the truck require a minimum access width of 10 feet, and a height clearance of 15 feetThe access limits for a 20-ton CPT vehicle are similar to those for conventional drill rigs and otherheavy excavation equipment. The CPT sensors and sampling tools may be difficult to advance insubsurface lithologies containing cemented sands and clays, buried debris, gravel, cobbles, boulders,and shallow bedrock. As with all intrusive site characterization methods, it is extremely importantthat all underground utilities and structures be located before undertaking site characterizationactivities.
2.4.2.2 Sensor Limitations
Because of the high specificity of the line spectra obtainable from LIBS measurements, the methodis, in general, qualitatively very good for identification of most metal contaminants. The primarylimitation on the qualitative in situ identification of a particular species is the presence of otherspecies that may have interfering spectra. For example, a naturally occurring species that containsa high density of lines throughout the visible spectrum is iron. Resolution of the spectrum of a givencontaminant above the background (primarily iron) is a matter of using a spectrometer with adequatedispersion in the spectral region of interest and is not generally a problem. Because of the manner

12
in which the two LIBS methods ablate a small sample (typically ~10-9g) of soil per measurement,they are essentially point measurement methods that are subject to sampling errors which can bereduced by spatial signal averaging. This can be achieved by sampling with high spatial resolution.Also, due to the relatively high standard deviation associated with a single LIBS measurement,temporal signal averaging is utilized to reduce the detection limit. Variation in soil matrix is anotherfactor that potentially limits the analytical precision and accuracy associated with LIBSmeasurements. As discussed in Section 5 of this report, site-specific calibration curves are used tominimize the affect of variations in the soil matrix. Another potential limitation of using opticalfibers for transmitting the emission signal to the detector system is the relatively high attenuationof the optical fibers in the deep ultra-violet spectral range. This may limit the use of some emissionlines for some elements. However, most elements have multiple emission lines and provide usablelines within the working range of the fiber.
The major limitation of the FO-LIBS sensor was degradation of the window that was overcome useof the scanning optical system. There are no specific limitations other than those typical of LIBSby in general, as listed in the previous section.
Because DL-LIBS utilizes a compact laser in the probe, it has certain restrictions due to itsultra-small size. The primary limitation is pulse rate where the laser is currently limited to 1/3 Hzwith ambient laser cooling. If the laser is cooled by liquid, the pulse rate can reach 1-2 Hz. For thecurrent DL-LIBS configuration, the lifetime of the laser will be dramatically reduced if pulse ratesexceed 1/3 Hz.
The optical window, which protects the interior of the DL-LIBS probe from water leakage, isrecessed. The laser energy used to create the micro plasma is focused in front of this window.Consequently, there is a gap between the focal point and the optical window. Should the probe bepushed into non-cohesive soil (e.g., free-flowing water borne soils in the saturated zone orfree-flowing soils in the vadose zone), this slot may fill with soil and the sensor may not be able toobtain data.
Certain x-ray lines from different elements occur at energies very close in energy and thus overlapin the spectrum. The cooled Si-PIN detector in the SCAPS XRF Metals Sensor has an energyresolution of 250 eV, which resolves all but the most severe overlaps. A typical example is theoverlap of the K-beta line of an element with the K-alpha line of an element with one lower atomicnumber. Since the interfering K-beta line is 5 to 10 times weaker than the K-alpha line, theinterfering metal must be present at large concentrations to cause a problem. Another example isthe lead (Pb) L-alpha line interference with the Arsenic (As) K-alpha line. Lead can be measuredusing the L-beta line to avoid interference with little or no loss of sensitivity. In the presence oflarge amounts of lead, arsenic must be measured with the As K-beta line, whose lower intensitycauses a corresponding loss of sensitivity.
2.4.2.3 Matrix and Moisture Effects
XRF sensor response is affected to some extent by the composition and particle size of the soilmatrix, but the effect is not serious for field screening usage. For the XRF sensor, soil moistureeffects for zero to about 20% moisture are negligible. For saturated soils the effect is about 20%.The most significant effects are from other heavy metals present and from the size of the metal

13
particles. Since lead oxide is 98% lead by weight, lead present in the form of lead oxide particleswill absorb x-rays depending on their size and affect the signal accordingly. For example, leadsulfide with a particle size of 12 microns reduces the signal by about 20% (Criss, 1976). If the leadis dispersed on the soil then the signal is not affected. Since the soil consists mostly of low atomicnumber materials, the particle size of the soil has little effect.
Matrix and moisture also affect the LIBS technology sensors. The primary variables affectingquantification of the LIBS measurement are soil moisture and soil grain size ((Miles et al., 1992),(Theriault et al., 1999)). Specifically, given two soils with the same contamination level, a clay soilwill exhibit a weaker LIBS signal than a sandy soil. Likewise, a wet soil will exhibit a weakersignal than a dry soil of the same contamination. For these reasons, LIBS sensor responses are moreaccurate in dry soil and when the effects of soil moisture and soil grain size are monitored and usedin the calibration algorithms. Other research has indicated that soil pH may also have an effect onLIBS signals (Cortes et al., 1996).
The presence of complex mixtures of contaminants (e.g., a site where organic contaminants arepresent along with heavy metals) is not expected to significantly affect the performance of either theLIBS or XRF metal sensors. Both sensor technologies are highly specific for the target analytes.In addition, because extremely high temperatures are generated during plasma in the LIBS analysis,it is expected that organic compounds will be broken down to elemental species during the analysis.In fact, LIBS has been used successfully to quantify metals directly in oil (Fichet et al., 2001). ForXRF, the presence of organic contaminants, in addition to heavy metals, would not impact thedetection abilities of the XRF sensor significantly. High levels of organics may cause as much as10 to 15% errors in quantitation due to the difference in matrix absorption versus typical(aluminosilicate) soils.
Physical “smearing” or “drag-down” of contamination by either the LIBS sapphire window or theXRF boron carbide window is not a problem (even when the probe is pushed through layers of freeproduct) as long as the window is properly designed (i.e., the window must not be recessed relativeto the surface of the probe). Both sapphire and boron carbide are very hard materials (nearly as hardas diamond) and do not tend to absorb contaminants. Years of experience with Laser-InducedFluorescence (LIF) probes employing sapphire window has shown that there is no memory effectwhen the probe is pushed through thin layers of soil heavily impacted with POLs (petroleum, oilsand lubricants) (Lieberman et al., 1991). Similarly, measurements with the XRF probe showed thatwhen the probe is pushed through a layer containing greater than 10% lead oxide, the signal returnsto below detection limit a few centimeters past the layer. Finally, visual data collected with a videoimaging probe equipped with a sapphire window, show conclusively that even when a probe ispushed through a layer of free product consisting of petroleum hydrocarbons and chlorinatedsolvents, there is no “smearing” of the window by the contaminant (Lieberman et al., 1998).

This page left blank intentionally.

15
3.0 DEMONSTRATION DESIGN
3.1 PERFORMANCE OBJECTIVES
The primary performance objective for each of the metal sensors tested in this evaluation is that theyprovide semi-quantitative data on the in situ presence of heavy metal contamination. Specific claimsfor the three SCAPS metal sensors are noted below.
1. Near continuous measurements generated by the sensor provide detailed mapping of thedistribution of subsurface heavy metal contamination. These three metal sensors typicallycollect data at 0.2 ft intervals.
2. Good qualitative agreement with the pattern of contamination derived from analyticalmeasurements (EPA Method 6010) of semi continuous soil samples.
3. Direct comparison of sensor data with samples collected using conventional CPT soilsampler tools by pushing in close proximity to the metal sensors’ pushes show goodagreement with conventional laboratory methods (EPA Method 6010).
4. Collection and storage of multi-channel atomic emission spectra throughout each push.
5. Data from the three SCAPS metal sensors is available in real time as the sensor is advancedinto the ground or retracted from the subsurface. This allows real time decisions on howdeep to collect verification samples on the site.
6. The location of future pushes can also be decided in real time at the site using theinformation available from previous pushes. This can greatly speed the delineation of thecontamination plumes.
7. The three SCAPS metal sensors can detect the presence of heavy metals which includes, butmay not be limited to, lead, cadmium, chromium, mercury, arsenic, zinc and copper in thebulk soil matrix.
8. Measurements can be made to depths up to 150 feet in normally compacted soil, when thethree SCAPS metal sensors are used in conjunction with an industry-standard 20-tonpenetrometer push vehicle.
9. Geotechnical sensors (cone pressure, sleeve friction) may be integrated with the threeSCAPS metal sensors to provide simultaneous continuous geotechnical and stratigraphicinformation to aid in interpreting contaminant distributions.
10. The in situ nature of the three SCAPS metal sensors minimizes possibilities forcontaminating or altering soil samples that are inherent with traditional collection, transportand analysis procedures.
11. The three SCAPS metal sensors provide more accurate measurement of the depth of thecontaminant because the three SCAPS metal sensors do not suffer from sampling difficulties

16
encountered by other common methods such as soil boring/split spoon sampling and stabsampling.
12. The SCAPS sensor probes produce minimal IDW. A typical 6-meter push with the SCAPSprobes produces approximately 40 liters of water IDW (used to clean the push rods). Atypical 6-meter boring produces 210-285 liters of soil IDW as well as 40 liters of water usedto clean the augers. Furthermore, the penetrometer rods are steam cleaned directly uponremoval from the ground, reducing potential contamination hazards to site personnel.
3.2 SELECTION OF TEST SITE(S)
Test site were selected using the following criteria.
• The U.S. Department of Defense (DoD) (as site owner) agreed to allow access to the site forthe demonstration.
• The site is accessible to two-wheel drive vehicles.
• The soils at the site have been contaminated by heavy metals that are detectable by the threeSCAPS metal sensor technologies.
• The soil types at the site consist of unconsolidated sediments of native sands, silts, clays, andgravel. These soil types are suitable for CPT pushing and present good subsurface matricesfor the three SCAPS metal sensor technologies.
• The soil contaminant levels identified during previous investigations ranged from belowanalytical laboratory detection limits to heavily impacted. These data indicate contaminationin the subsurface in concentration ranges comparable with the SCAPS metal sensingtechnologies to be demonstrated.
3.3 TEST SITE HISTORY AND CHARACTERISTICS
Demonstration of the SCAPS Metal Sensors was conducted at four different test sites (Table 1).Each of the four test sites is described in the following sections.
Table 1. Metal Sensor Test Sites and Target Contaminant.
Site Name Location Site Designation Target ContaminationLake City Army Ammunition Plant Independence, MO LCAAP LeadNaval Air Station North Island North Island, CA NASNI ChromiumHunters Point Shipyard San Francisco, CA HPS ChromiumCamp Keller Biloxi, MS Camp Keller Lead
17
3.3.1 Lake City Army Ammunition Plant, Independence, Missouri
Lake City Army Ammunition Plant (LCAAP) is located in Jackson County, Missouri, mostly withinthe eastern corporate boundary of Independence, Missouri, and 23 miles east of Kansas City,Missouri. The SCAPS metal sensors were evaluated LCAAP Site 30, a Demolition Dump.
LCAAP was the first new government-owned facility in the early 1940's to expand small armsammunition production. Operations at LCAAP (i.e., the manufacture, storage, and testing ofammunition) have resulted in the use of various process waste treatment systems and onsite disposal.Chemicals used onsite in the production process includes soaps, detergents, bleaches, hydrochloricacid, sulfuric acid, nitric acid, explosive compounds (e.g., lead azide and lead styphnate), phosphatecleaners, petroleum and lubricating oils, trichloroethane, trichloroethene, and other cleaningsolvents. The waste for the production areas includes mixtures and reaction products of thesechemicals. Previous investigations have indicated that heavy metals, including arsenic (As), barium(Ba), beryllium (Be), cadmium (Cd), chromium (Cr), copper (Cu), lead (Pb), mercury (Hg), nickel(Ni), silver (Ag) and zinc (Zn), are present on the surface and/or at depths up to 10 feet.
The Area 30 Demolition Dump is located in the northwest portion of LCAAP. This site is near theLCAAP boundary and adjacent to the community of Lake City. It was used by the LCAAP firedepartment from 1951 to 1967 to burn wooden boxes. Antimony, barium, cadmium, copper, lead,mercury, silver and zinc have been detected above background. Antimony, lead, and copper havebeen found in high levels, both on the surface and 5 to 7.5 feet bgs. Detection of lead ranged from200,000 ppm at depth to 25,000 ppm on the surface. Lead contamination was evaluated at this siteby the three SCAPS heavy metal sensors.
Lake City Army Ammunition Plant Area 30 is above alluvial sediments of the main paleochannel,underlain by 10 feet of silty clay which grades sharply into medium grained sand. Subsurface mediaat Area 30 fluctuates between medium and coarse-grained sand until bedrock is encountered at 88feet. The surficial soil underlying the area is Napier silt loam. Ground water is from 4 to 8 feet bgs.Ground water flow direction is in general to the south at a gradient of 0.0066 ft/ft. The terrain isgently sloping to the east with a total relief of less than 5 feet. Vegetation is mowed grass.
3.3.2 IWTP at Naval Air Station, North Island, California
The Industrial Waste Treatment Plant (IWTP) is located in the northern end of Naval Air Station,North Island (NASNI), which is in southern San Diego County, California, across the San DiegoBay from the city of San Diego. Until the middle 1940s, North Island and Coronado Island wereseparated by a narrow tidally influenced inlet, or bight, at which time the Navy filled this area withdredge material. The city of Coronado adjoins NASNI to the southeast and is the nearest civilianpopulation center. The SCAPS metal sensors evaluated the Paint Waste Sludge Basin of the IWTPat NASNI.
NASNI was commissioned in 1917 and used to train pilots and aircraft mechanics. Operations atNASNI, including the repair and service of fleet squadrons, have resulted in the use of various wasteprocessing systems and onsite disposal. The IWTP was built in 1972 and used to process nine wastestreams containing hazardous materials.

18
Initially, most of the wastes were disposed of in unlined impoundments. In 1976, the unlinedsurface impoundments were lined with either concrete or PVC. Prior to liner installation,approximately 12 inches of contaminated soils were removed from the surface of eachimpoundment. The Paint Basin is one of four waste sludge basins built in 1973 on the east side ofthe IWTP. It was used for evaporation of paint chip sludge from water curtain spray booths andconsisted of one concrete-lined basin that measured 25 feet by 25 feet by 3 feet deep. The concreteliners were reinforced with steel rods, with each liner being approximately 4 inches thick. However,several cracks were found along the joints where the basin floors intersected the sidewalls. Thesecracks provided the most probable conduits for contaminant leakage and migration into theunderlying sediments. Previous investigations have indicated that heavy metals, including primarilychromium (Cr) with much smaller amounts of barium (Ba), cadmium (Cd), copper (Cu), lead (Pb),nickel (Ni), and zinc (Zn), are present beneath the Paint basin. The three SCAPS heavy metalsensors were deployed to evaluate chromium contamination at this site.
The NASNI Industrial Waste Treatment Paint Basin is above sand and silt sediments of the LatePleistocene Bay Point Formation which is composed primarily of marine, fossiliferous, looselyconsolidated fine to medium grained brown sand, underlain by undifferentiated granitic rocks of theSouthern California Batholith and prebatholithic metavolcanic rocks. Ground water is present atapproximately 20 feet bgs, but is subject to minor fluctuations as a result of tidal forces. The terrainis topographically flat. The concrete liner of the paint basin is in place and contains holes drilledfrom previous investigations.
3.3.3 The Former Ship Repair Area (Parcel D), Hunters Point Shipyard, San Francisco,California
The main portion of Hunters Point Shipyard (HPS) is situated on a long promontory located in thesoutheastern part of San Francisco extending eastward into San Francisco Bay. The HPS propertyconsists of about 936 acres; 493 of which are on land, and 443 of which are below bay waters.Parcel D is a 128-acre tract of land located in the southeast central portion of HPS.
The land at HPS can be divided into three functional areas: (1) the industrial production area, whichconsists of the waterfront and shop facilities for the structural machinery, electrical, and HPS servicegroups; (2) the industrial support area, which consists of supply and public works facility; and(3) the non-industrial area, which consists of former Navy personnel residential facilities andrecreation areas. The former ship repair area in the south and southwest portions of HPS (Parcel D)was investigated.
The promontory on which HPS is located has been recorded in maritime history since 1776, first asSpanish mission lands used for cattle grazing and later, in the 1840s, for its dry dock facilities. TheTreasure Island Naval Station-Hunters Point Annex also known as the Hunters Point Naval Shipyardwas established in 1869 as the first dry dock on the Pacific Coast. In 1940, the Navy obtainedownership of the shipyard for shipbuilding, repair, and maintenance activities. After World War II,activities shifted from ship repair to submarine servicing and testing. The Navy operated HuntersPoint Annex as a shipbuilding and repair facility from 1941 until 1976. Between 1976 and 1986,the Navy leased most of the shipyard to Triple A, a private ship-repair company. The shipyard wasan annex of Naval Station Treasure Island until 1974 when the Navy’s Engineering Field ActivityWest assumed the management of it. In 1987, PCBs, trichloroethylene and other solvents,

19
pesticides, petroleum hydrocarbons, and metals including lead were confirmed at a number ofshipyard locations. These findings and the shipyard’s proximity to an off-site drinking water source(the aquifer used by a water bottling company) resulted in the EPA placing HPS on the NationalPriority List in 1989. However, subsequent Navy investigations indicate that the aquifers beneathHPS and that used by the bottling company do not appear to be connected. In 1991, the Departmentof Defense listed the shipyard for closure.
During the 1960s, zinc chromate had been used extensively as a primer for aluminum.Consequently, there are elevated concentrations of chromium present. For example, in IR-09 ofParcel D where zinc chromate spraying operations took place, chromium concentrations as high as2700 ppm have been reported. The three SCAPS heavy metal sensors were deployed to evaluatechromium concentration at this site.
Parcel D at HPS consists of about 128 acres of southeast central shoreline and lowland coast. Theland surface at Parcel D is mostly covered by asphalt, buildings, or other structures. Between 70 and80 percent of HPS land consists of relatively level lowlands constructed by excavating portions ofsurrounding hills and placing non-engineered fill materials along the margin of San Francisco Bay.Parcel D is located in the lowlands with surface elevations ranging from 10 to 40 feet above meansea level (msl).
The peninsula forming HPS is within a northwest-trending belt of Franciscan Complex bedrockknown as the Hunters Point Shear Zone. The depth to Franciscan Complex Bedrock from theground surface in Parcel D varies from less than 1 foot in the northern area to greater than 200 feetin the southeastern area. Directly south of the Parcel D boundary is an outcrop of bedrock calledShag Rock. Undifferentiated Sedimentary Deposits cover the bedrock over much of Parcel D,occurring beneath Bay Mud Deposits or, rarely, directly beneath Artificial Fill. These depositsrange up to 110 feet in thickness. Bay Mud Deposits underlie most (about 80 percent) of Parcel Dexcept for a strip along the northern margin of the site and over the bedrock high point directly southof Parcel D. Where present, Bay Mud Deposits range up to 100 feet thick. Undifferentiated UpperSand Deposits are rather scattered in occurrence beneath Parcel D. Where existent, these sandsgenerally overlie Bay Mud Deposits but may be interfingered with Bay Mud Deposits, and, in a fewlocalities, directly overlie Undifferentiated Sedimentary Deposits. These sands range in thicknessup to 20 feet. Artificial Fill overlies all of the naturally occurring units and ranges in thickness upto 80 feet. The thickness of the Artificial Fill and all naturally occurring surficial deposits generallyincreases toward the bay, with the exception of the bedrock high point in the southern part of ParcelD.
3.3.4 Camp Keller Small Arms Range, Keesler Air Force Base, Biloxi, Mississippi
Keesler Air Force Base is located in Biloxi, MS. Camp Keller, which is part of Keesler Air ForceBase, is located 15 miles north of Keesler on state route 67. Several small arms firing ranges arelocated within Camp Keller. These firing ranges are currently in use by the Air Force, Navy, andreserve units. Each firing range consists of a firing area, a clear standoff area providing distance tothe target, and an impact berm. Due to firing range activities, the primary contaminant of concernis lead. In October of 1996, the ERDC SCAPS truck was used in field investigations utilizing theDL-LIBS metal sensor at Camp Keller in front of the Air Force impact berm. Measurementsshowed that the highest lead concentrations (up to 6000 ppm) were found near the surface.However, leached lead contamination was detected from the surface to depths of four feet. No

20
difficulties were encountered during pushing. The water table was encountered at 10 feet belowground surface.
The landmass of Camp Keller consists of the Gulf Coastal Plain, a continuation of the Atlantic Plain,and borders the Gulf of Mexico from Florida to Mexico, stretching northward to include thelowlands of the Mississippi Valley as far as St. Louis, Missouri. Geologically, the coastal plain isan extension of the submerged continental shelf. The Atlantic and Gulf coastal plains have subsidedand emerged several times since the end of the Mesozoic era, as shown by the types of sedimentarydeposits (Cretaceous age and younger), that underlie and comprise them. During the last Ice Age,when sea level was hundreds of feet lower, coastal plains were much broader and shorelines werefar offshore of their present positions. The coastal lowlands consist of a gulf-ward-thickening,heterogeneous, unconsolidated to poorly consolidated wedge of discontinuous beds of sand, silt, andclay.
3.4 PHYSICAL SET-UP AND OPERATION
The SCAPS truck mounted CPT platform is a stand-alone unit that requires no outside sources ofelectrical power during operation. No special structures, either temporary or permanent are requiredfor operation. All power is supplied from a generator operated by the “power take off” (PTO) of thetruck diesel motor and is regulated through an uninterruptible power supply with a bank of batteries.An external electrical power connection is also available. A hydraulic system, integrated into thetruck, provides the force to push the probe into the ground and also powers a grout pump. Water,from onboard tanks, is consumed in the steam cleaning system and during grouting. Retractiongrouting is currently not configured in the three metals sensor probes but may be included inoperational configurations. A local source of water is required for refilling the onboard tanks.Another consumable is grout. These items may be acquired locally or carried along in the SCAPSsupport vehicles. Steam cleaning rinsate water is collected in DOT-rated 208 liters (55 gallon)drums and handled as potentially hazardous waste. Operations yield approximately half a drum ofrinsate waste a day. Wastewater disposal is coordinated with site personnel and handled locally afterresults of rinsate sampling are completed.
3.5 SAMPLING/MONITORING PROCEDURES
To assess the comparability of data acquired by the three SCAPS metal-sensing technologies to datagenerated by established, conventional analytical methods, the SCAPS metal sensors data werecompared to analysis results of sampled soil. A series of pushes and comparison borings wereconducted. Sets of co-located pushes (i.e., one SCAPS XRF metal sensor push, one SCAPSFO-LIBS metal sensor push, one SCAPS DL-LIBS metal sensor push, and one CPT soil samplerpush) were performed both inside and outside of the heavy metal contaminated plume area. Six setsof pushes along a transect from impacted to non-impacted were made to delineate the plume at eachdemonstration site. Soil samples were obtained either by hand-augering or by using the CPT soilsampling probe, and are included as a push in each set of pushes. The three SCAPS sensor pusheswere triangulated around each CPT soil sample location in a manner to co-locate withinapproximately 8 inches of the verification sample.
During demonstration sampling, the SCAPS CPT pushed the three SCAPS metal probes as theyacquired data (the DL-LIBS probe acquired data as the probe was retracted from the hole). Each

21
probe push was above ground water. After each push, the SCAPS metal probe was retracted, andthe CPT push hole was backfilled with a dilute Portland cement, bentonite, and Sikament mixtureusing the “trimmy grout” method.
After the real-time metal sensor data was collected from each set of sensor interrogation holes,verification samples for that push hole were obtained either by pushing a CPT soil sampling probeor by hand-augering. Typically, three 6.6-inch long, 1.5-inch diameter stainless steel tubes ofsample soils were collected from every 1 to 1.5 feet of boring using a Mostap 35PS sampler witha fishtool. The soil samples were collected at depths determined from review of the metal sensors’profile data. Only tubes containing sample soils which appeared relatively undisturbed were used.The sampler was pushed using the SCAPS truck, in accordance with the ASTM D3441, the standardfor CPT soil sampling. The Mostap 35PS sampler itself is an approximately 34-inch long, 2-inchdiameter steel penetrometer tip, which includes a 21-inch long sample barrel containing three6.6-inch long stainless steel soil sampling tube. Samples for confirmatory analysis were collectedfrom the lower and middle (deeper) 6.6-inch soil tubes in the 21-inch sampler. Each soil-samplinghole was backfilled with a dilute Portland cement, bentonite, and Sikament mixture. Each soilsample was handled as described in the following paragraphs. The hand-auger was used in thoseinstances where groundwater was shallow (less than or equal to about 6 feet).
3.6 ANALYTICAL PROCEDURES
The inductively coupled plasma (ICP), EPA Method 6010 (U.S. Environmental Protection Agency),method for determining metal contaminants was used as the standard analytical laboratory method.It was selected as the confirmatory analytical method for the three SCAPS metal technologies dueto its widespread and generally accepted use in delineating heavy metal contamination. This methodrequires that the solid soil sample be solubilized or digested prior to evaluation. Although thisanalytical method does measure the same metal constituents that are targeted by the three SCAPSmetal sensors, some variability will occur due to the fact that the analytical technique is carried outon an “average” digested sample, while the SCAPS metal sensors are evaluating only a spot locationof the sample. However, this analytical method was chosen because it represents technology thatis currently used on a day-to-day basis to make decisions about the distribution of subsurface heavymetal contamination.
The ICP method measures element-emitted light by optical spectroscopy. Samples are nebulizedand the resulting aerosol is transported to the plasma torch. Element-specific atomic-line emissionspectra are produced by a radio frequency inductively coupled plasma. The spectra are dispersedby a grating spectrometer, and the intensities of the lines are monitored by photomultiplier tubes.ICP can determine the presence of several metals simultaneously. Standard solutions of each metalof interest are prepared and evaluated. Then, mixed calibration standard solutions are prepared fromthose individual metal standard solutions and evaluated. For quality control, a calibration blank andat least three standards must be run to generate a calibration curve. At least one matrix spike andone matrix spike duplicate are run to determine digestion recoveries.
One of the main difficulties in comparing the methods is due to differences in small-scale spatialheterogeneity. Each metal sensing probe was pushed in close proximity to each other and to the soilverification sample location. However, there is some uncertainty in establishing the depth fromwhich the soil sample is obtained. Due to the sharp vertical boundaries of the contamination plume,

22
an error of 6 inches or less in the sample depth can change from strongly impacted (greater than10,000 ppm) to clean (less than 100 ppm for most metals). Additionally, it is important to reiteratethat the analytical method tests a digested sample that represents an “average” result for that sample,whereas, the SCAPS metal sensors interrogate a small and discrete sample spot. For this reason,prior to shipping the soil samples to the analytical laboratory, each soil sample was homogenizedon site and split into 4 aliquots. Then, one of the homogenized aliquots was reevaluated by each ofthe three SCAPS metal sensors as quickly as possible after completion of the field demonstration.At the same time, the samples were properly packaged and sent to the laboratory for analysis.

23
Figure 5. Contingency Plot Analysis where DLT is the Detection Limit Threshold.
4.0 PERFORMANCE ASSESSMENT
4.1 PERFORMANCE DATA
The validation process for the two LIBS and XRF sensors consisted of deploying each probe at fourpredetermined sites. For each site, two sets of measurements were conducted. In the first set, in situmeasurements were conducted at a number of locations (usually a transect of six separate pushlocations). These measurements provided a general qualitative picture of the contaminantdistribution at the site. In the second set of measurements, discrete samples, gathered at each site,were homogenized. Splits of each homogenized sample were sent to the respective sensorlaboratory and to an analytical laboratory for analysis.
At each site, a sample of uncontaminated soil was collected. The sample was homogenized, andsplits were sent to each sensor laboratory. The sample of uncontaminated soil was assumed to berepresentative of the grain size distribution of the site and was used by each of the respective sensorlaboratories to prepare calibration standards. The soil was allowed to air dry and standards wereprepared by spiking aliquots of soil with known quantities of a solution containing 10000 ppm ofthe metal contaminant of interest undergoing investigation. Using these standards, a site-specificcalibration curve was generated to minimize soil matrix effects.
These SCAPS metal sensors areintended as semi-quantitative fieldscreening tools , not asquantitative analytical methods.Therefore, the performances ofthe sensor systems were evaluatedusing a standard contingencyanalysis. In a contingencyanalysis, the results from ex-situsensor measurements performedon splits of homogenized discretesample collected for thelaboratory validations are plottedversus the concentration reportedby the analytical laboratory. Theresultant scatter plot has a formatsimilar to that shown in Figure 5.The final results for eachtechnology at each site werestated in the site report in terms ofpercent (%) agreement with thelaboratory results by summing the number of true positive and true negative points from the scatterplot and dividing by the total number of samples. The final report includes the overall percentagreement for each technology summed over all site verification data.
Data reports have been completed for LCAAP, NASNI, HPS, and Camp Keller. The reportssummarize the in situ sensor data, laboratory ex situ sensor data obtained for the three-sensorsystems, off-site laboratory results, and notes and observations from field operations. Copies of
24
these reports may be obtained from Dr. S. Lieberman (address provided in Appendix A, Contacts).The raw and processed data for the pushes and laboratory data for each sensor at each site has beenarchived electronically on CD-ROM and is available in the ESTCP Final Report (LIEBERMAN etal., 2001).
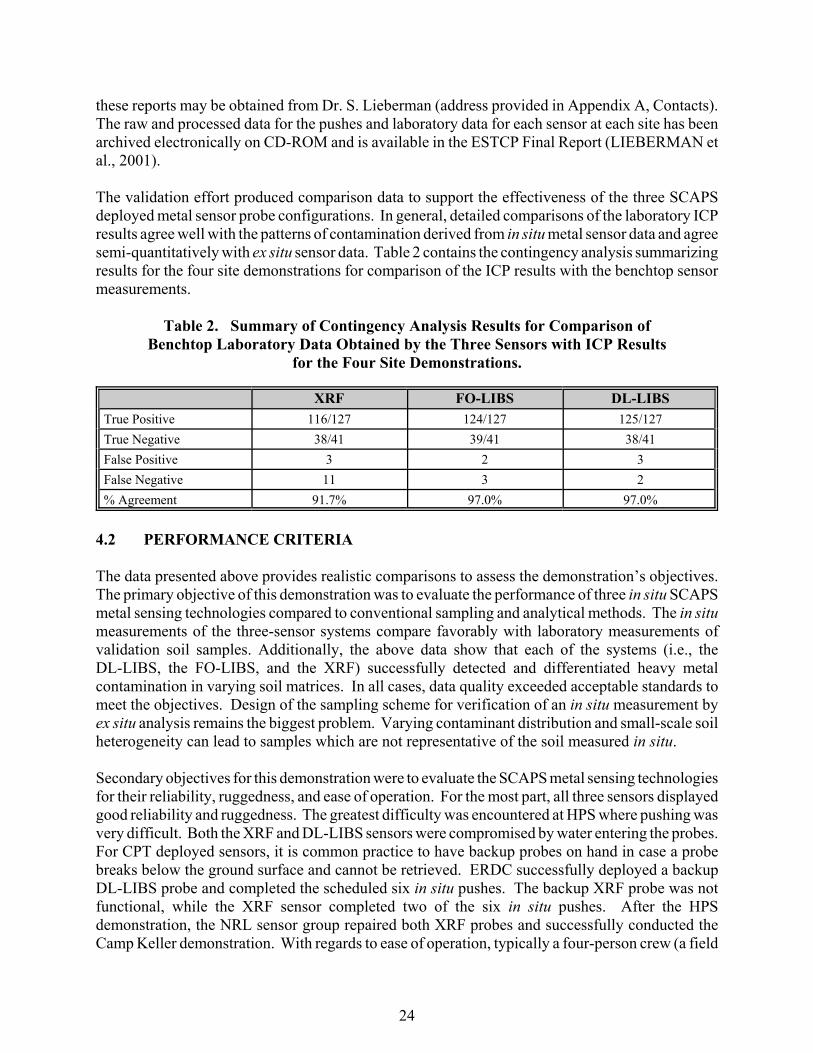
The validation effort produced comparison data to support the effectiveness of the three SCAPSdeployed metal sensor probe configurations. In general, detailed comparisons of the laboratory ICPresults agree well with the patterns of contamination derived from in situ metal sensor data and agreesemi-quantitatively with ex situ sensor data. Table 2 contains the contingency analysis summarizingresults for the four site demonstrations for comparison of the ICP results with the benchtop sensormeasurements.
Table 2. Summary of Contingency Analysis Results for Comparison ofBenchtop Laboratory Data Obtained by the Three Sensors with ICP Results
for the Four Site Demonstrations.
XRF FO-LIBS DL-LIBSTrue Positive 116/127 124/127 125/127True Negative 38/41 39/41 38/41False Positive 3 2 3False Negative 11 3 2% Agreement 91.7% 97.0% 97.0%
4.2 PERFORMANCE CRITERIA
The data presented above provides realistic comparisons to assess the demonstration’s objectives.The primary objective of this demonstration was to evaluate the performance of three in situ SCAPSmetal sensing technologies compared to conventional sampling and analytical methods. The in situmeasurements of the three-sensor systems compare favorably with laboratory measurements ofvalidation soil samples. Additionally, the above data show that each of the systems (i.e., theDL-LIBS, the FO-LIBS, and the XRF) successfully detected and differentiated heavy metalcontamination in varying soil matrices. In all cases, data quality exceeded acceptable standards tomeet the objectives. Design of the sampling scheme for verification of an in situ measurement byex situ analysis remains the biggest problem. Varying contaminant distribution and small-scale soilheterogeneity can lead to samples which are not representative of the soil measured in situ.
Secondary objectives for this demonstration were to evaluate the SCAPS metal sensing technologiesfor their reliability, ruggedness, and ease of operation. For the most part, all three sensors displayedgood reliability and ruggedness. The greatest difficulty was encountered at HPS where pushing wasvery difficult. Both the XRF and DL-LIBS sensors were compromised by water entering the probes.For CPT deployed sensors, it is common practice to have backup probes on hand in case a probebreaks below the ground surface and cannot be retrieved. ERDC successfully deployed a backupDL-LIBS probe and completed the scheduled six in situ pushes. The backup XRF probe was notfunctional, while the XRF sensor completed two of the six in situ pushes. After the HPSdemonstration, the NRL sensor group repaired both XRF probes and successfully conducted theCamp Keller demonstration. With regards to ease of operation, typically a four-person crew (a field

25
site manager, two push-room personnel, and a metal sensor system operator) is employed tocomplete all aspects of field operations. A trained technician should operate all three SCAPS metalsensors. It should be noted that key personnel in both the DL-LIBS and FO-LIBS sensor groups leftprior to completion of the demonstrations. Qualified personnel took over the projects and completedthe remaining field demonstrations, ex situ laboratory analyses, and data processing.
4.3 DATA ASSESSMENT
In general, the overall accuracy (ranging from 92 to 97%) of the three sensor technologies asdetermined from comparison with laboratory results was adequate for use as a filed screeningmethod. Precision was predominantly controlled by spatial heterogeneity rather than instrumentalfactors. Heterogeneity varied from site to site and appeared to be correlated with the manner inwhich the metal contaminant was introduced to the soil (i.e., particulate versus dissolved). This wasdocumented with ICP laboratory analyses of five 1-g aliquots of six soil samples from each site(Table 3).
Table 3. Precision Results for Replicate ICP Analyses of Soil Samples from Each TestSite.
Site PrecisionLCAAP 24-147%NASNI 2-24%
HPS 10-30%Camp Keller 8-113%
High standard deviations (>100%) were observed for replicate analyses of samples where thecontaminant was introduced in particulate form (LCAAP and Camp Keller) with much lowerstandard deviations observed at NASNI and HPS where the contaminant was introduced in dissolvedform. These results illustrate the difficulty of delineating contaminant zones using the results froma limited number of discrete samples. This difference in sample heterogeneity related to the natureof the contaminant would tend to mask variations in sensor performance related to variations in localgeological conditions.
4.4 TECHNOLOGY COMPARISON
The SCAPS metal sensors provide real-time data as the probe is either pushed or retracted from thesoil enables field modifications to the sampling plan. This capability provides a more timely andthorough investigation while avoiding the drawn-out iterative process, typical of conventional sitecharacterization methods (e.g., traditional sampling and off-site laboratory analysis).

This page left blank intentionally.

27
5.0 COST ASSESSMENT
5.1 COST REPORTING
Cost comparisons are reported on a fee-for service basis. The estimate of the fee-for-service rateis based on an average obtained from several sources including both government (U.S. Navy PublicWorks Centers and U.S. Army Corps of Engineers District SCAPS operational systems) andcommercial service providers for similar operations with laser-induced fluorescence sensor system.Although quoted rates can vary by approximately a factor of two, the average rate used for costcomparisons in this report of $6380/10-hr day appears to represent a fairly conservative estimate thatwould cover not only operations, but also account for basic data analysis and reporting. This rateis based on an equipment rate of $3,700/day, which includes the SCAPS LIF-equipped, 20-tonpenetrometer system plus two support vehicles. The labor portion of this daily rate covers a four-person crew, including a push- room operator, a push-room helper, a data acquisition specialist, anda project geologist or project manager charged at $67.50/hr for a 10-hr day. Previously, the averagecost of operating a SCAPS truck with a four-person crew in the field, during production work, wasreported at $4,500 per day (ESTCP, 2001).
5.2 COST ANALYSIS
Major cost drivers for the metal sensor/CPT operations include equipment charges (including capitalequipment costs, equipment repair and maintenance), labor, material (including grout material, misc.expendables), permitting, utility location, location surveying, IDW disposal, work plan/reportpreparation, and equipment mobilization/demobilization. As described in Section 5.1, costs arereported here on a fee-per-service basis in order to facilitate comparisons with conventional siteassessment methodology. The primary source of uncertainties in cost estimates provided here isrelated to variations in the number of feet pushed per day that result from pushing in differentgeological materials. At sites where pushing is difficult due to tough geological material or a largenumber of cobbles, the push rate may be reduced or the probe may be refused, and it may benecessary to move the push vehicle to a new push location to achieve penetration. In thesesituations, the push rate could be reduced by a factor of 25 to 50% or more. A decrease inproduction rate of 50% would increase the cost per sample reported in Table 5 by a factor of two.It should be noted however, that if pushing is difficult or limited for the SCAPS push Metal In SituSensor, it will also be equally difficult for the direct-push sampling system, and may slow theconventional hollow-stem auger and split-spoon sampler system. Although all the metal sensorprobes used in this study were equipped with strain gauges to monitor the tip and sleeve frictionduring pushes (also useful for avoiding breaking the probe), pushing in difficult geology also putsthe probes at greater risk while increasing the chance of damaging or breaking the sensor probe. Inextreme cases, it may become necessary to charge a surcharge for repair of damaged probes (theequipment charges cover normal “wear and tear” which includes periodic replacement of windowsand other wear items). Other variations in production rate (number of feet pushed per day) arisefrom differences in the depth pushed at each push location. In general, production rate increases asthe depth of the push increases because the setup time required to move the truck to a new locationis reduced.
The fee for service costs reported include the capital equipment costs and costs for normal wear andtear and maintenance. Table 4 provides estimates of the capital costs of each SCAPS metal sensor

28
technology. Estimates provided in Table 4 indicate that the capital equipment costs for all three-sensor systems are similar (ranging from approximately $70K for the XRF sensor to approximately$90K for the LIBS sensors). These numbers are comparable to the commercial LIF system currentlyavailable from Dakota Technologies, Inc. (GERMAIN, 2002). Because the XRF and DL-LIBSsensor systems have more equipment downhole than the FO-IBS system, probe costs representapproximately 50%, and 29% of the total system costs for the XRF and DL-LIBS systems, comparedto approximately 20% for the FO-LIBS system. Based on experience with LIF systems operatedby government and commercial service providers, it is estimated that the life cycle for theinstrumentation system is expected to be approximately five to seven years. Environmental/Safetytraining is also expected to be similar to that for LIF systems currently in operation in governmentand commercial systems.
Table 4. Capital Equipment Costs for the Three SCAPS Metal Sensor Systems and aCommercial LIF System.
XRF FO-LIBS DL-LIBS LIFUp Hole Instrumentation System $30K $72.5K $62K $97.5KProbe/Umbilical $35K $19K $27K $15KTOTAL $65K $91.5K $89K $112K
5.3 COST COMPARISON
This demonstration has focused on comparing the effectiveness of three CPT based metal sensortechnologies to perform field screening at a heavy metal impacted hazardous waste site. Table 5presents a direct comparison between the costs using a CPT/metal sensor technology versusconventional drilling, sampling, and laboratory analysis for field screening. Because the productionrate for the three SCAPS metal sensor technologies is very similar, costs for the three metal sensortechnologies are comparable.
This demonstration program has focused on the effectiveness of the CPT/Metal Sensor technologyto perform field screening at hazardous waste sites with metal contamination. Table 5 presents adirect cost comparison using CPT/Metal Sensor versus conventional sampling and direct-pushsampling. For a site investigation with 10 holes to a depth of 30 feet, the table shows the cost forSCAPS CPT/Metal Sensor at approximately 47% of the cost of conventional sampling with asampling ratio of 30 to 1 in favor of CPT/Metal Sensor. On a per sample basis, Table 5 shows thatSCAPS metals sensor technologies offer approximately a 98% cost savings compared withconventional soil borings and laboratory analyses. The cost savings realized from direct-pushmethods compared to conventional drill rigs are due to: (1) the speed with which direct-pushtechniques access depth versus drilling methods; (2) the low amount of investigation-derived wasteproduced by the direct-push methods; and (3) the ability of the direct-push technique to acquire nearcontinuous data. Further savings not documented in Table 4 may be realized using the SCAPSsensors because onsite real-time data acquisition allows the sampling strategy to be modified in thefield to more accurately delineate the extent of contamination. In contrast, traditional samplingstrategies depend on results from laboratory analyses that are usually not available for days or weeksafter samples are collected, and often require return trips to the field when initial results indicate that

29
further sampling is required to complete delineation of the contaminated zone. Also, the greatervertical sampling rates provided by the SCAPS sensors compared to conventional sampling methods(every 2 inches compared to every 5 feet) minimizes the chances that significant zones ofcontamination are missed because 5-foot sampling intervals performed with soil boring do notprovide the resolution necessary to resolve some contaminant layers. For the CPT/ Metal Sensortechnique, regulators may require a minimum number of confirmatory samples, which can beobtained using CPT sampling devices. This will increase the SCAPS CPT/Metal Sensor cost aspresented in the table, but only three or four samples would be required at less than $1,000additional cost.
Table 5. Cost Comparison of SCAPS Metal Sensors with Conventional Sampling andDirect-Push Sampling.
SCAPS Metal Sensor In SituMeasurement
Conventional Drilling (Hollow StemAuger, Split Spoon, and Off-Site
Analyses)Direct-Push and Off-Site
Analyses
10 pushes to 30 ft.Metals andgeotechnical data
COST 10 borings to 30 ft (60 soilsamples for ICP analysis) COST
10 borings to 30ft (60 soilsamples for ICPanalysis)
COST
Two 10-hr field days@ $6,380/day
$12,760 Drilling & sampling @ $50/ftfor 300 ft (approx. three 10-hrdays)
$15,000 Drilling &sampling for 300ft (approx. two10-hr days)
$3,000
1 sample/2 inches formetals = 1,800 totalsamples
Included inbasic cost
ICP laboratory @ $50 persample x 60 samples
$3,000 ICP laboratory @$50 per sample x60 samples
$3,000
1 sample/inch forgeotechnical data
Included inbasic cost
Geotechnical laboratoryanalysis @ $100/sample x 5samples
$500 Geotechnicallaboratoryanalysis @$100/sample x 5samples
$500
4 waste drums @$40/drum
$160 28 waste drums @ $40/drum $1,120 1 waste drum @$40/drum
$40
Decon water testing $1,000 Decon water testing $1,000 Decon watertesting
$1,000
Waste soil testing $0 Waste soil testing $3,000 Waste soil testing $0Waste soil notproduced
$0 Waste soil disposal, 20 drums@ $100/drum
$2,000 Waste soil notproduced
$0
Decon water disposalfor 4 drums @ $100/drum
$400 Decon water disposal $800 Decon waterdisposal for 1drum @ $100/drum
$100
4 man crew Included inbasic cost
Geologist @ $75/hr x 36 hrs $2,700 Geologist @$75/hr x 36 hrs
$2,700Technician @ $40/hr x 40 hrs $1,600
TOTAL $14,320 TOTAL $30,720 TOTAL $10,340Per Sample Cost for1,800 samples
$7.95/sample Per Sample Cost for 60samples
$512/sample Per Sample Costfor 60 samples
$172/sample

This page left blank intentionally.

31
6.0 IMPLEMENTATION ISSUES
6.1 COST OBSERVATIONS
Factors affecting the cost of the metal sensor/CPT operations include labor, material, travel,permitting, utility location, location surveying, work plan and report preparation, and equipmentmobilization. Additional cost may be incurred for coring if the media surface is too hard forpenetration (cement) or when the sensor probe is frequently refused due to lithologies which aredifficult to push. SCAPS CPT/METAL SENSOR or SCAPS Membrane Interface Probe (MIP) costshave been quoted as approximately $6,380 per 10-hour day, plus per diem. It is expected that theoperating costs for the SCAPS metal sensor systems will be comparable.
6.2 PERFORMANCE OBSERVATIONS
The primary performance objective for each of the metal sensors tested in this evaluation is that theyprovide semi-quantitative data on the presence or absence of heavy metal contamination. Assummarized in Table 2, results from comparisons of the three sensor technologies show goodagreement (>90%) for semi-quantitative comparisons (presence/absence) with the standardlaboratory ICP results. These results indicate that all three-sensor technologies met the primaryperformance criteria as field screening methods. Results also showed that spatial heterogeneity cancontribute to high variability in results even for standard laboratory methods. Higher sampling ratesassociated with in situ sensor systems may provide improved delineation of contaminant zonescompared to estimates derived from a small number of discrete samples.
6.3 SCALE-UP
Unlike remediation technologies, very few scale-up issues are anticipated in moving fromdemonstration to full-scale implementation. Direct push platforms capable of deploying the sensorsystems used in these demonstrations are readily available from several commercial vendors. Thecapability for deploying the three sensor technologies from platforms of opportunity wasdemonstrated during this project by deploying the sensors from two different penetrometer platforms(the SSC San Diego SCAPS system and the U.S. Army ERDC SCAPS system). Also, the capabilityto transition the sensor technologies to new technical personnel was demonstrated during the courseof this program because all three-sensor programs experienced departures of key personnel thatnecessitated hand-off operation of the sensor systems from the original developer to new operators.Although direct push LIBS and XRF sensor systems are not currently available, several companieshave expressed interest in the technologies, and negotiations are currently in progress for thetechnology transfer of at least one LIBS sensor system and the XRF sensor.
6.4 OTHER SIGNIFICANT OBSERVATIONS
Quantification of sensor response for all three-sensor systems suffered to some degree from samplemoisture and matrix effects (LIBS to greater extent that XRF). Decrease in the response of the LIBSsensor, due the moisture effects, particularly limits the utility of the LIBS sensors for measurementin the saturated zone. In addition, the DL-LIBS sensor is subject to clogging from flowing sandsin the saturated zone. It is possible that quantification of LIBS sensor response could be improvedby correcting for variations soil moisture using an independent soil moisture content sensor. It is

32
important to note, however, that results demonstrated that this correction was not required for fieldscreening level data for measurements made in the vadose zone.
6.5 LESSONS LEARNED
Because many metal contaminants are released into the environment in particulate form rather thanin liquid form, as is the case for most other chemical contaminants (especially petroleum or solventbased contaminants), the subsurface distribution of many metals may be very heterogeneous andmay be limited to shallow depths bgs. This suggests that in many cases it might be more appropriateto use a smaller push system than the 20-ton push vehicle used in this study. Pick-up truck size pushsystems are available and could be used to push the probes used in this study to depths ofapproximately 6 feet or more. Even though metals that are released in particulate form (e.g.,bullets, batteries, etc.), rather than liquid form (e.g., plating solutions), may be limited to relativelyshallow depths, the ability of the sensors to make many high density measurements is an importantadvantage because of the difficulty of delineating regions of contamination from a limited numberof discrete samples provided by traditional methods.
6.6 END-USER ISSUES
As part of this ESTCP funded Dem/Val effort, efforts were taken to facilitate the transition of theSCAPS metal sensor technologies to the operational SCAPS systems. Currently, three SCAPSsystems are operated by the Army Corps of Engineers — two by the Naval Public Works Centers;one by the Department of Energy (DOE) at the Savannah River Site in South Carolina; and one bythe U.S. EPA. Because there is no formal mechanism or institutional support for technologytransition, each transition is negotiated with and funded by individual DoD or other governmentusers. Although there has been interest from commercial vendors in commercializing both directpush LIBS and XRF sensors, at present none of the sensors have been commercialized. Currently,each of these technologies is only available from the original technology developer.
6.7 APPROACHES TO REGULATORY COMPLIANCE AND ACCEPTANCE
As described earlier, the metal sensors evaluated as part of this effort represent one of a suite ofsensor systems that have been developed or that are still under development for deployment withdirect push systems. The LIF sensor for petroleum hydrocarbons was the first major chemical sensorsystem developed for this system. During the early stages of technology transfer of the LIF sensor,a common question raised by a potential user was, “Is the technology approved by the regulators?”From this question grew the concept that if the LIF technology were “approved” by the regulatorycommunity, users would then embrace it. The quest for regulatory approval led to a successfulmulti-year effort (partially funded by ESTCP) to gain regulatory acceptance for the SCAPS LIFsensor technology based on assembling a comprehensive set of field measurements that directlycompare the performance of the sensor system with traditional EPA methods for a variety ofcontaminants under different hydrogeological conditions. The cornerstone of obtaining as broad anacceptance as possible is linking these technical efforts with multi-state and national certification/verification programs such as the U.S. EPA Consortium for Site Characterization Technology“verification” program and “certification” by the California EPA Department of Toxic SubstanceControl’s Technology Certification Program (Cal Cert). For the case of the SCAPS nitrogen laserLIF sensor system, these opportunities were subsequently linked to the Western Governors

33
Association, Demonstrating Onsite Innovative Technologies (WGA/DOIT) project. Interest by theWGA/DOIT project subsequently led to the establishment of a SCAPS-LIF Interstate Technologyand Regulatory Cooperation (ITRC) workgroup, Technology Specific Task Group (TSTG) with thegoal to achieve acceptance by each of the seven TSTG member-states (Utah, Nebraska, NewMexico, Louisiana, New Jersey, Idaho, California) and using California Certification (Cal Cert) asthe protocol. For the SCAPS nitrogen laser LIF system, these efforts resulted in the successfulcertification by the Cal Cert Program (California Environmental Protection Agency Department ofToxic Substances Control, 1996), verification by the U.S. EPA (Bujewski and Rutherford, 1997) andendorsement of the Cal Cert certification by the WGA (Cone Penetrometer Task Group Report,1996).
Significant lessons were learned from the Tri-Service SCAPS Program in the process of obtainingregulatory acceptance of the SCAPS LIF sensor. Specifically, there appears to be no single path togain universal acceptance of new technology by the regulatory community. However, and probablymore importantly, it was learned that obtaining regulatory acceptance does not guarantee useracceptance. While regulatory acceptance is a desirable goal, if the users cannot be convinced thatthe new technology will enable them to do their jobs faster, better, and cheaper, it will be slow toestablish itself in the marketplace. Experience from the SCAPS LIF program suggests that useracceptance is achieved one user at a time. Discussions with both government and commercial LIFservice providers indicate that the key to growing a business is to provide a product that meets thecustomers’ needs at a competitive price (personal communications, Tim Shields, PWC San Diego,San Diego California; Racyp Yilmaz, Fugro Geoscience, Inc., Houston, Texas). Satisfied usersgenerate repeat business and tell other perspective customers. Regulatory approval by itself maynot generate user acceptance. In retrospect, experience seems to suggest that many perspective usersthat initially expressed reluctance to use SCAPS LIF because of “lack of regulatory acceptance” mayhave found other reasons not to use a new technology even if the regulatory community approvedthe technology.
Based on lessons learned from the SCAPS LIF sensor technology, it appears the most effectivemeans to promote acceptance of a new field screening technology is to aggressively market thetechnology and grow a user base for that technology. Experience suggests the need to convinceindividual users and regulators of the merits of the technology coupled with the fact that there isoften high turnover in both communities requires a long-term and persistent marketing effort. Ingeneral, a motivated commercial vendor has the capability to rally more marketing savvy(knowledge and experience) for a product or service than does a government technology developer.While the SCAPS LIF ESTCP project focused almost exclusively on gaining acceptance of thetechnology by regulators, the efforts of the SCAPS metal sensors ESTCP project were directed moretowards generating a link with commercial partners that ultimately would take the lead for marketingthe technologies to both users and regulators. It is believed that this strategy has the advantage ofoffering a longer term solution to the difficult problem of nurturing a new technology through its’infancy than the previous approach that focused almost exclusively on the single issue of regulatoryacceptance at the expense of other factors required for successfully establishing a new technologyin the marketplace.
During the SCAPS LIF ESTCP project, it also became apparent that, in general, regulators and usersare often slow to accept new methods and technologies due to limited exposure, inadequate technicalunderstanding, and lack of high quality validation data that support developers and/or vendor claims.

34
Ultimately, acceptance requires exposure leading to understanding, as well as comprehensive datavalidation. With the goal to document the performance of these sensor systems under variousconditions with “hard data,” a comprehensive effort was conducted to make available the results ofthis demonstration/validation program as well as related work. To inform regulators, governmentagencies, and commercial users, the SCAPS metal sensing technologies have been presented innational and international environmental conferences and peer-reviewed, scientific journals. Thepublications/presentations for each metals sensor are summarized in the ESTCP final report(Lieberman et al., 2001). The SCAPS metals sensor technologies were also demonstrated at theannual SCAPS User’s meetings.

35
7.0 REFERENCES
1. American Society for Testing and Materials. (2001) D3441-98 Standard Test Method forMechanical Cone Penetration Tests of Soil, http://www.astm.org/cgi-bin/SoftCart.exe/DATABASE.CART/PAGES/D3441.html+mystore+cpzn8491.
2. Bujewski G., and Rutherford B. (1997) Innovative Technology Verification Report: TheSite Characterization and Analysis Penetrometer System (SCAPS) Laser-InducedFluorescence (LIF) Sensor and Support System, 83 pages. U.S. Environmental ProtectionAgency, National Exposure Research Laboratory http://www.epa.gov/etv/pdfs/vrvs/01_vr_usn_ penetrometer.pdf.
3. California Environmental Protection Agency Department of Toxic Substances Control.(1996) Final Hazardous Waste Technology Certification Program Report: SiteCharacterization and Analysis Penetrometer System with Laser-Induced Fluorometry(SCAPS-LIF) as an in-situ field screening technology for the detection of PNA-containingPetroleum Hydrocarbons, 47 pages. http://www.dtsc.ca.gov/sppt/pptd/td/navy-scaps-lif-techcert.html.
4. Cone Penetrometer Task Group Report. (1996) Multi-State Evaluation of an Expedited SiteCharacterization Technology: Site Characterization and Analysis Penetrometer SystemLaser-Induced Fluorescence (SCAPS-LIF), 12 pages. Western Governors’ AssociationDOIT Initiative, Interstate Technology and Regulatory Cooperation Workgroup.
5. Cortes J., Cespedes E. R., and Miles B. H. (1996) Development of Laser-InducedBreakdown Spectroscopy for Detection of Metal Contaminants in Soils, U.S. Army EngineerWaterways Experiment Station.
6. Criss J. W. (1976) Particle Size and Composition Effects in X-Ray Fluorescence Analysisof Pollution Samples. Analytical Chemistry 48, 179-186.
7. Elam W. T., Adams J. W., Hudson K. R., and Gilfrich J. V. (1998) Subsurface Measurementof Soil Heavy Metal Concentrations with the SCAPS X-Ray Fluorescence (XRF) MetalsSensor. Field Analytical Chemistry and Technology 1(1), 75-87.
8. ESTCP. (2001) ESTCP Cost and Performance Report: Tri-Service Site Characterization andAnalysis System (SCAPS) Thermal Desorption Sampler for Volatile Organic Compounds,32. Environmental Security Technology Certification Program http://www.estcp.org/documents/techdocs/199603-TDS.pdf.
9. Fichet P., Mauchien P., Wagner J.-F., and Moulin C. (2001) Quantitative elementaldetermination in water and oil by laser-induced breakdown spectroscopy. Analytica ChimicaActa 429(2), 269-278.
10. Fordham O. (1997) Draft EPA SW-848 Method 6200, ‘Field Portable X-ray FluorescenceSpectrometry for the Determination of Elemental Concentration in Soil and Sediment’, EPAOffice of Solid Waste.

36
11. Germain R. S. (2002) Direct Push Chemical Sensors For DNAPLs, 3 pages. DakotaTechnologies, Inc.
12. Lieberman S. H., Anderson G. W., and Taer A. (1998) Use of a Cone PenetrometerDeployed Video-Imaging System for In Situ Detection of NAPLs in Subsurface SoilEnvironments. Proceedings-1998 Petroleum Hydrocarbons and Organic Chemicals inGround Water: Prevention, Detection, and Remediation, November 11-13, 1998, Houston,TX, 384-390.
13. Lieberman S. H., Boss P. A., Cortes J., and Elam W. T. (2001) Site Characterization andAnalysis Penetrometer System (SCAPS) Heavy Metals Sensors Demonstration ValidationTechnology Demonstration Report, 106 pages. Space and Naval Warfare Systems Center,San Diego http://www.spawar.navy.mil/sti/publications/pubs/tr/1868/tr1868.pdf.
14. Lieberman S. H., Theriault G. A., Cooper S. S., Malone P. G., Olsen R. S., and Lurk P. W.(1991) Rapid, Subsurface, In Situ Field Screening of Petroleum Hydrocarbon ContaminationUsing Laser-induced Fluorescence over Optical Fibers. Second International Symposiumon Field Screening Methods for Hazardous Wastes and Toxic Chemicals, p57-63.
15. McDonald B. J., Trautner J. J., Seelos A. G., and Glanzman R. K. (1996) Calibration of XRFand Laboratory Analyses of Soil. In Uncertainty in the Geological Environment, Vol. 1 (ed.C. D. Shackleford, P. P. Nelson, and M. J. S. Roth), pp. 287-296. American Society of CivilEngineers.
16. Miles B. H., Cortes J., and Cespedes E. R. (1992) Laser-Induced Breakdown SpectroscopyFinal Report, Waterways Experiment Station.
17. Miles B. H., Cortes J., and Cespedes E. R. (1997) Laser-induced Breakdown Spectroscopy(LIBS) Detection of Heavy Metals Using a Cone Penetrometer: System Design and FieldInvestigation Results. Field Analytical Methods for Hazardous Wastes and ToxicChemicals, 671-680.
18. Theriault G. A., Bodensteiner S., and Lieberman S. H. (1998) A real-time fiber-optic LIBSprobe for the in situ delineation of metals in soils. Field Analytical Chemistry andTechnology 2(2), 117-125.
19. Theriault G. A., Mosier-Boss P. A., and Lieberman S. H. (1999) Application of LIBS toIn-Situ Assessment of Metal Contaminated Soils. Proceedings-Advanced Sensors andMonitors for Process Industries and the Environment, November 4-5, 1998, Boston, MA,141-145.
20. Unsell C. W. (1998) Ph.D. Thesis, University of Toledo.
21. U.S. Environmental Protection Agency. Method 6010B: Inductively Coupled Plasma-atomicEmission Spectrometry, http://www.epa.gov/epaoswer/hazwaste/test/6010b.pdf.
22. Winefordner J. D. (2000) Laser-induced Breakdown Spectroscopy for Elemental Monitoringof Slurry Streams, 62 pages. University of Florida.

A-1
APPENDIX A
POINTS OF CONTACT
Point of Contact(Name)
Organization(Name & Address) Phone/Fax/E-mail
Role inProject
Dr. StephenLieberman
SSC San DiegoCode D36149575 Beluga Rd.San Diego, CA 92152-6325
(619) 553-2778(603) 909-8049 (Fax)[email protected]
ProjectCoordinatorFO-LIBS POC
Dr. Pamela A. Boss SSC San DiegoCode D36345650 Lassing Rd.San Diego, CA 92152-6171
(619) 553-1603(619) 553-1269 (Fax)[email protected]
F0-LIBSTechnical Lead
Dr. W. Tim Elam 10551 158th Ave. NERedmond, WA 98052-2659
(425) [email protected]
XRF TechnicalLead
Mr. John H. Ballard U.S. Army Engineer Researchand Development Center(ERDC)3909 Halls Ferry Rd.Vicksburg, MS 39180-6199
(601) 634-2446 (601) 634 2854 (Fax)[email protected]
DL-LIBS POC
Mr. Javier Cortes U.S. Army Engineer Researchand Development Center(ERDC)3909 Halls Ferry Rd.Vicksburg, MS 39180-6199
(601) 634-2447(601) 634-3518 (Fax)[email protected]
DL-LIBSTechnical Lead

ESTCP Program Office
901 North Stuart StreetSuite 303Arlington, Virginia 22203
(703) 696-2117 (Phone)(703) 696-2114 (Fax)
e-mail: [email protected]