Establishing Agroforestry Silvopasture Systems in the ...
47
BearWorks BearWorks MSU Graduate Theses Spring 2021 Establishing Agroforestry Silvopasture Systems in the Missouri Establishing Agroforestry Silvopasture Systems in the Missouri Ozark Region Ozark Region Kara Lynn Powelson Missouri State University, [email protected] As with any intellectual project, the content and views expressed in this thesis may be considered objectionable by some readers. However, this student-scholar’s work has been judged to have academic value by the student’s thesis committee members trained in the discipline. The content and views expressed in this thesis are those of the student-scholar and are not endorsed by Missouri State University, its Graduate College, or its employees. Follow this and additional works at: https://bearworks.missouristate.edu/theses Part of the Agriculture Commons Recommended Citation Recommended Citation Powelson, Kara Lynn, "Establishing Agroforestry Silvopasture Systems in the Missouri Ozark Region" (2021). MSU Graduate Theses. 3626. https://bearworks.missouristate.edu/theses/3626 This article or document was made available through BearWorks, the institutional repository of Missouri State University. The work contained in it may be protected by copyright and require permission of the copyright holder for reuse or redistribution. For more information, please contact [email protected].
Transcript of Establishing Agroforestry Silvopasture Systems in the ...
BearWorks BearWorks
MSU Graduate Theses
Spring 2021
Establishing Agroforestry Silvopasture Systems in the Missouri Establishing Agroforestry Silvopasture Systems in the Missouri
Ozark Region Ozark Region
Kara Lynn Powelson Missouri State University, [email protected]
As with any intellectual project, the content and views expressed in this thesis may be
considered objectionable by some readers. However, this student-scholar’s work has been
judged to have academic value by the student’s thesis committee members trained in the
discipline. The content and views expressed in this thesis are those of the student-scholar and
are not endorsed by Missouri State University, its Graduate College, or its employees.
Follow this and additional works at: https://bearworks.missouristate.edu/theses
Part of the Agriculture Commons
Recommended Citation Recommended Citation Powelson, Kara Lynn, "Establishing Agroforestry Silvopasture Systems in the Missouri Ozark Region" (2021). MSU Graduate Theses. 3626. https://bearworks.missouristate.edu/theses/3626
This article or document was made available through BearWorks, the institutional repository of Missouri State University. The work contained in it may be protected by copyright and require permission of the copyright holder for reuse or redistribution. For more information, please contact [email protected].
ESTABLISHING AGROFORESTRY SILVOPASTURE SYSTEMS IN THE MISSOURI
OZARK REGION
A Master’s Thesis
Presented to
The Graduate College of
Missouri State University
TEMPLATE
In Partial Fulfillment
Of the Requirements for the Degree
Master of Science, Plant Science
By
Kara Lynn Powelson
May 2021

ii
Copyright 2021 by Kara Lynn Powelson
iii
ESTABLISHING AGROFORESTRY SILVOPASTURE SYSTEMS IN THE MISSOURI
OZARK REGION
Agriculture
Missouri State University, May 2021
Master of Science
Kara Lynn Powelson
ABSTRACT
The Missouri Ozarks is located in the south-central part of Missouri, ranging from the very
southwest corner of the state and east to St. Louis. This region is enriched with large dense
populations of oak and hickory tree species, while also being occupied with prime forage
pastures for livestock grazing. Missouri is ranked second in the nation for farming operations and
hay production, while also third in the nation for beef cow number of head (MDA 2021). The
objective of this study is to observe the establishment of two separate silvopasture systems: a
planted walnut plantation and a converted silvopasture. In the summer of 2020, soil samples
were collected, along with soil moisture and soil temperature from the two silvopasture sites
located at the Missouri State University Journagan Ranch in Douglas County, Missouri. Plant
species transects and tree canopy density were observed within the converted silvopasture stand
located on the ranch. Bray I phosphorus (P) and soil pH were measured within the Missouri State
University Agriculture lab. The plantation and converted silvopasture sites showed very low
available Bray I P within their stands, but overall a suitable pH for forage production. The
converted silvopasture was seeded with a tall fescue (Festuca arundinacea), and orchardgrass
(Dactyliz glomerata) seed mix in April of 2020. The converted stand’s forage plant species
transects were taken September 22, 2020. The transects showed one-third bare soil, one-third
grassy weeds and one-third desirable forage species throughout the converted silvopasture stand.
These findings suggest that possible fertilizer application may be needed to allow for more
available Bray I P lbs/ac and for the converted stand, another forage seeding should be applied
along with a weed management plant. This observational study established the baseline data for
soil properties and species densities for future studies that will be conducted within these
silvopasture sites. The long-term goals are to observe multiple years of soil fertility and health
under management intensive grazing (MiG), observe plant species diversity, provide best
management practices to livestock producers regarding silvopasture establishment and provide
data to USDA-NRCS on these site specific silvopasture establishment located in the Missouri
Ozarks.
KEYWORDS: agroforestry; silvopasture; forage; grazing; soil health; beef cattle; management
intensive grazing
iv
ESTABLISHMENT AGROFORESTRY SILVOPASTURE SYSTEMS IN THE
MISSOURI OZARK REGION
By
Kara Lynn Powelson
A Master’s Thesis
Submitted to the Graduate College
Of Missouri State University
In Partial Fulfillment of the Requirements
For the Degree of Master of Science, Plant Science
May 2021
Approved:
Will McClain, Ph.D., Thesis Committee Chair
Melissa Bledsoe, Ph.D., Committee Member
Michael Goerndt, Ph.D., Committee Member
Julie Masterson, Ph.D., Dean of the Graduate College
In the interest of academic freedom and the principle of free speech, approval of this thesis
indicates the format is acceptable and meets the academic criteria for the discipline as
determined by the faculty that constitute the thesis committee. The content and views expressed
in this thesis are those of the student-scholar and are not endorsed by Missouri State University,
its Graduate College, or its employees.
v
TABLE OF CONTENTS
Introduction Page 1
Ozarks Page 1
Silvopasture Page 2
Black Walnut Page 3
Forage Page 3
Plant Diversity Page 4
Livestock Page 5
Management Intensive Grazing Page 5
Soil Health Page 6
Methods Page 8
Experimental Design Page 8
Environmental Data Page 9
Soil Sample Collection Page 10
Field Measurements Page 11
Canopy Density Page 12
Species Transects Page 12
Results Page 13
Environmental Data Page 13
Soil Chemistry Page 13
Canopy Density Page 14
Species Transects Page 14
Discussion Page 16
Environmental Data Page 16
Soil Chemistry Page 16
Canopy Density Page 17
Species Transects Page 18
Conclusion Page 20
References Page 21

vi
LIST OF FIGURES
Figure 1. Aerial view of the walnut plantation located at MSU Journagan
Ranch Douglas County. The system was divided into three replicate blocks.
Each block containing four rows randomly assigned to each walnut cultivar
football or kwikrop.
Page 24
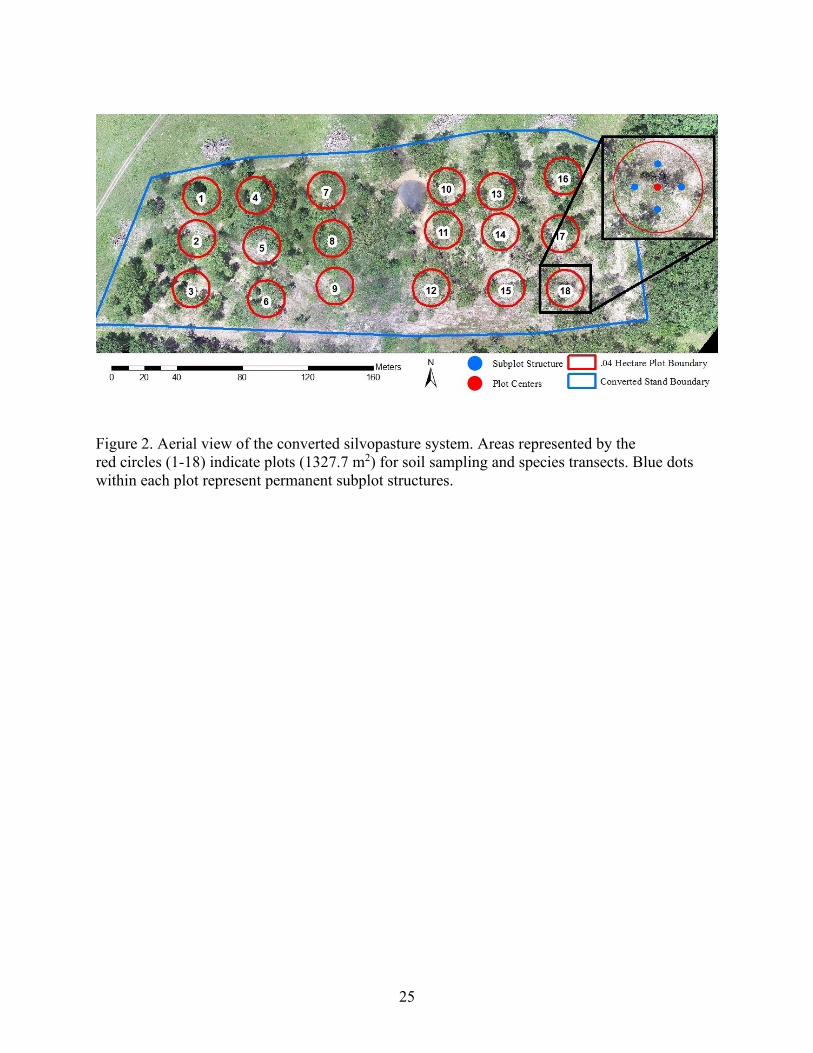
Figure 2. Aerial view of the converted silvopasture system. Areas
represented by the red circles (1-18) indicate plots (1327.7 m2) for soil
sampling and species transects. Blue dots within each plot
represent permanent subplot structures.
Page 25
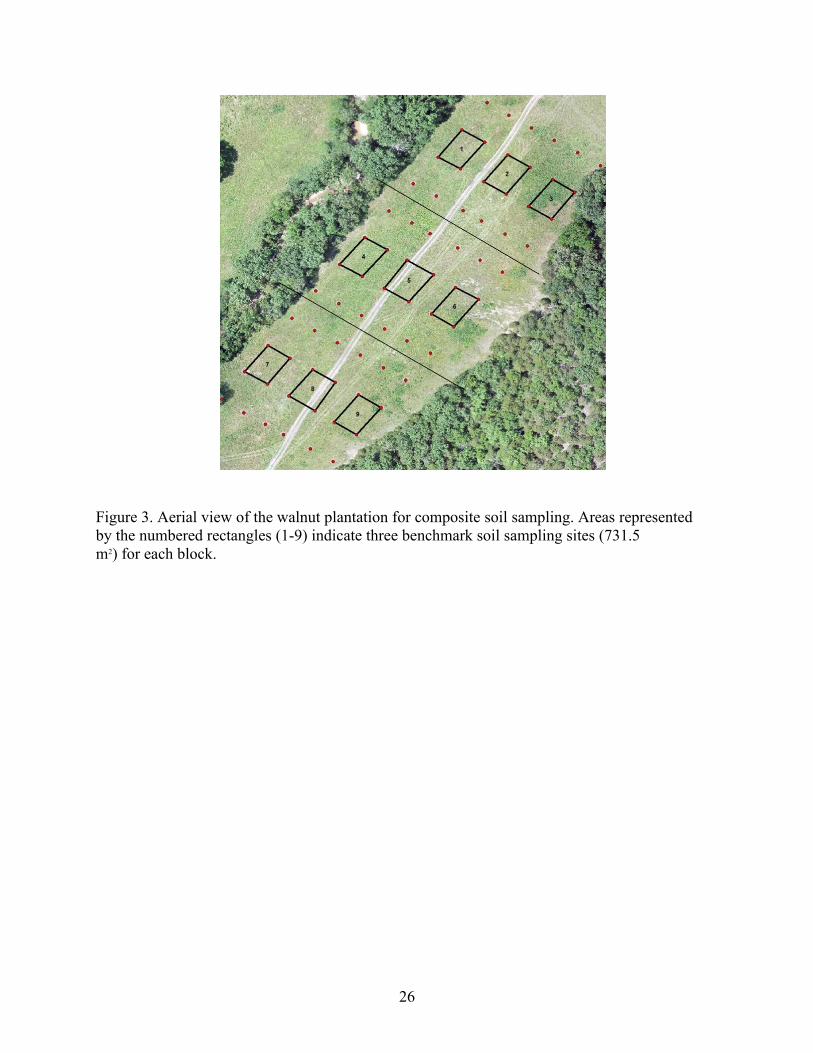
Figure 3. Aerial view of the walnut plantation for composite soil sampling.
Areas represented by the numbered rectangles (1-
9) indicate three benchmark soil sampling sites (731.5 m2) for each block.
Page 26
Figure 4. Individual soil cores were divided into depths of 0-2.5cm (A), 2.5-
5cm (B) and 5-7.5cm (C).
Page 27
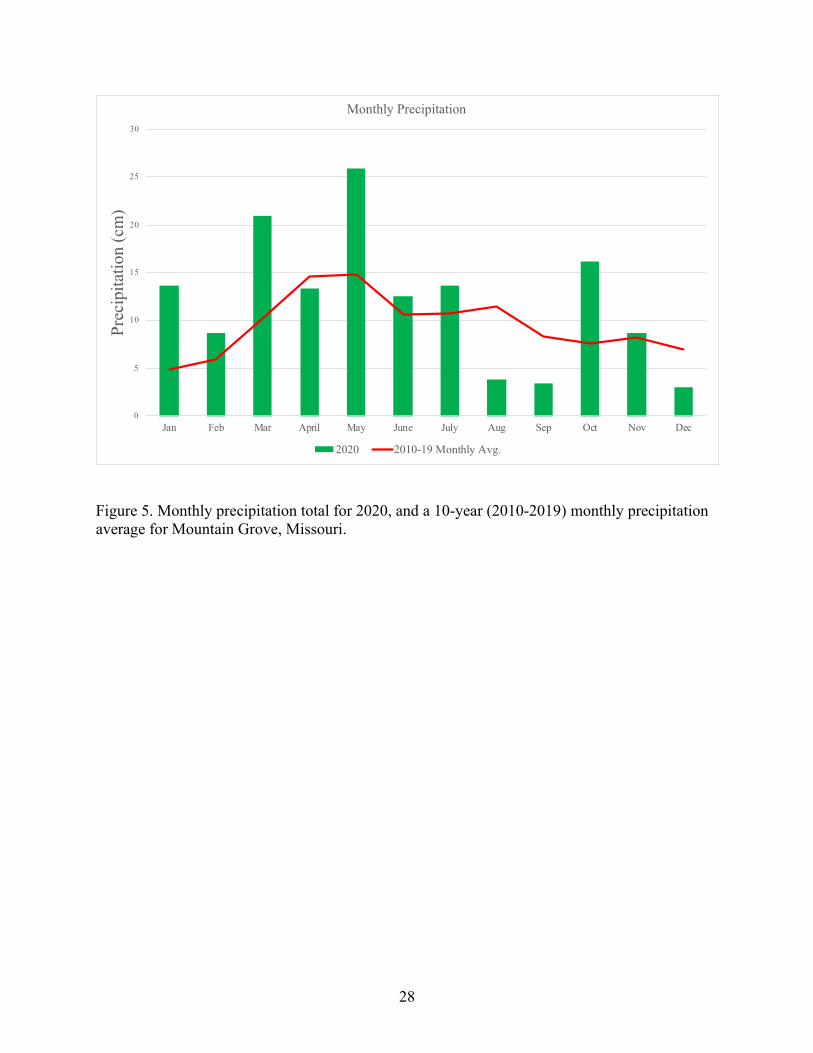
Figure 5. Monthly precipitation total for 2020, and a 10-year (2010-
2019) monthly precipitation average for Mountain Grove, Missouri.
Page 28
Figure 6. Monthly maximum (2020 T-max) and minimum (2020 T-min)
temperatures for the 2020 growing season and the 10-year (2010-
2019) average maximum (2010-19 Avg T-max) and minimum (2010-19
Avg T-min) for Mountain Grove, Missouri.
Page 29
Figure 7. Soil pHs values from composite soil samples for each of the 9
benchmark soil sampling sites in the walnut plantation.
Page 30
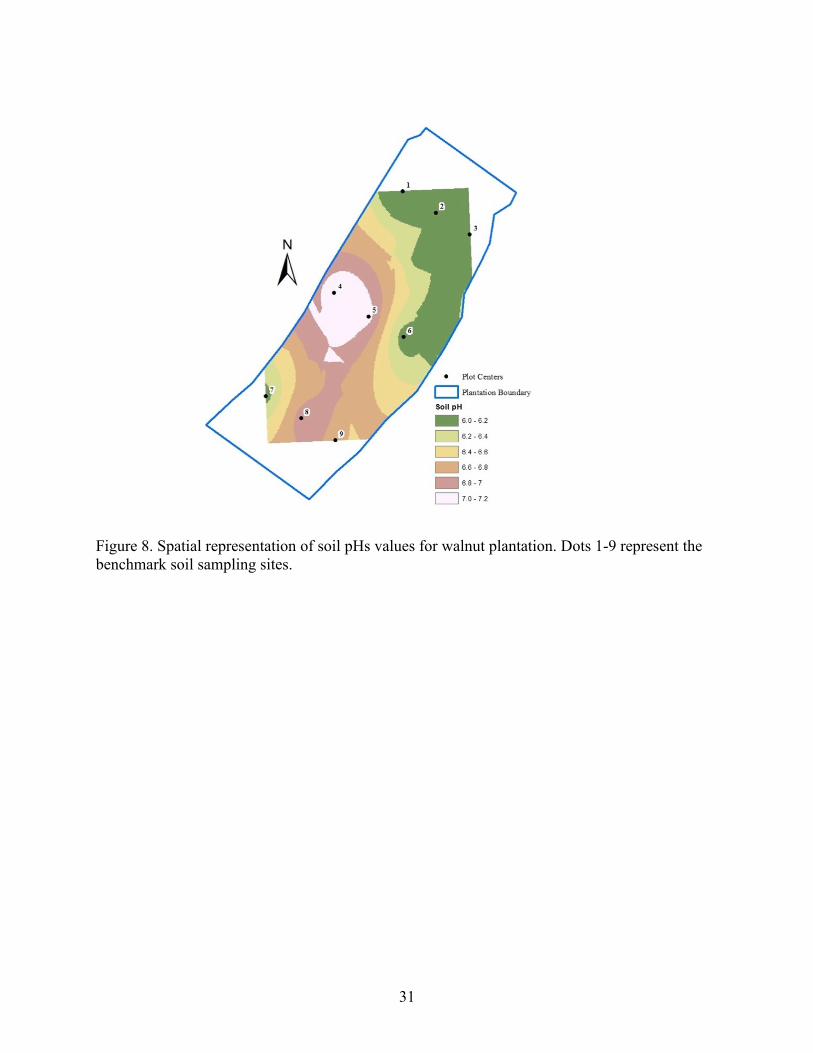
Figure 8. Spatial representation of soil pHs values for walnut
plantation. Dots 1-9 represent the benchmark soil sampling sites.
Page 31
Figure 9. Soil pHs values from composite soil samples for each of the
18 plots in the converted silvopasture site.
Page 32
Figure 10. Spatial representation of soil pHs values
for converted silvopasture. Dots 1-18 represent the plots for soil sampling
Page 33
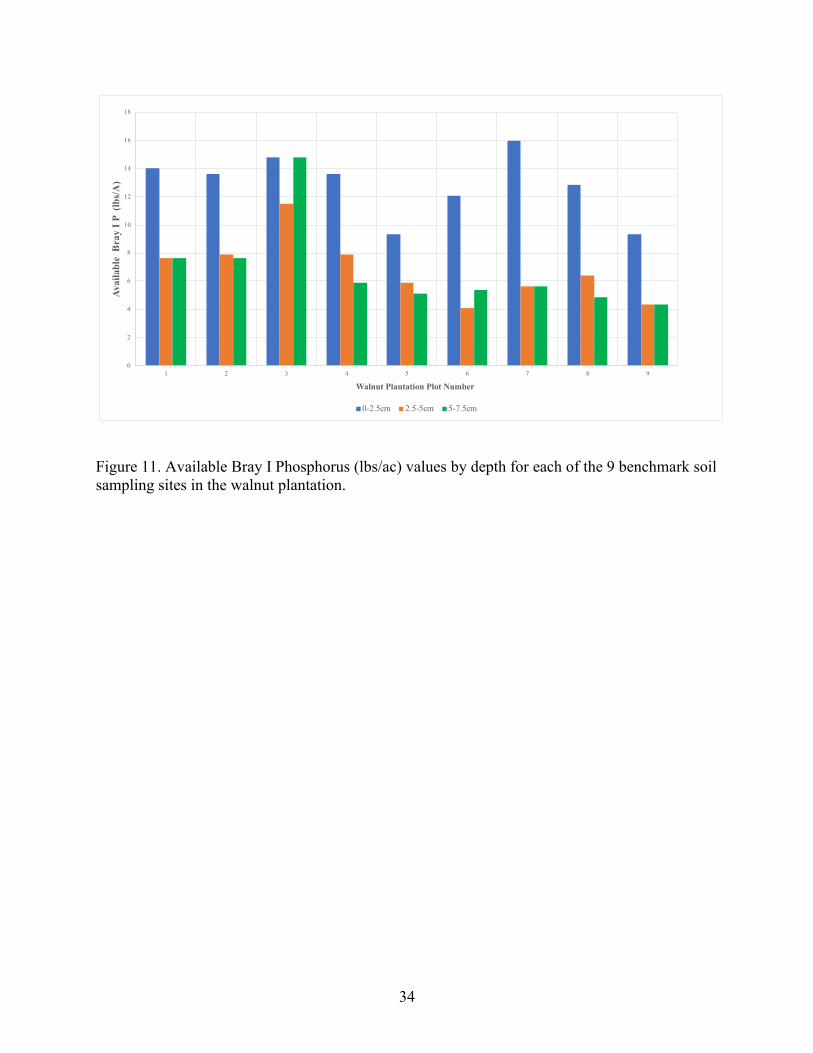
Figure 11. Available Bray I Phosphorus (lbs/ac) values by depth for each of
the 9 benchmark soil sampling sites in the walnut plantation.
Page 34
Figure 12. Spatial representation of available Bray I Phosphorus (lbs/ac) for
the walnut plantation at the soil depth of 0-2.5 centimeters.
Page 35
vii
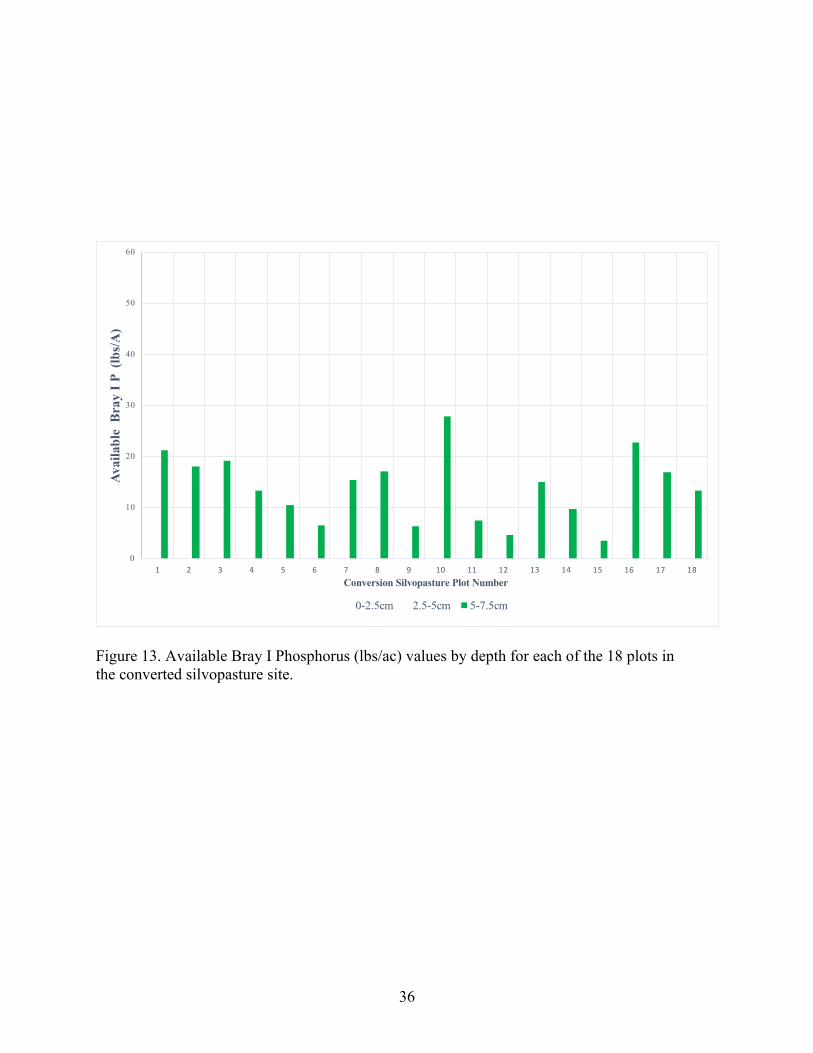
Figure 13. Available Bray I Phosphorus (lbs/ac) values by depth for each of
the 18 plots in the converted silvopasture site.
Page 36
Figure 14. Spatial representation of available Bray I Phosphorus (lbs/ac) for
the converted silvopasture site at the soil depth of 0-2.5 centimeters.
Page 37
Figure 15. Converted silvopasture tree canopy density
observations taken for each plot July 8, 2020.
Page 38
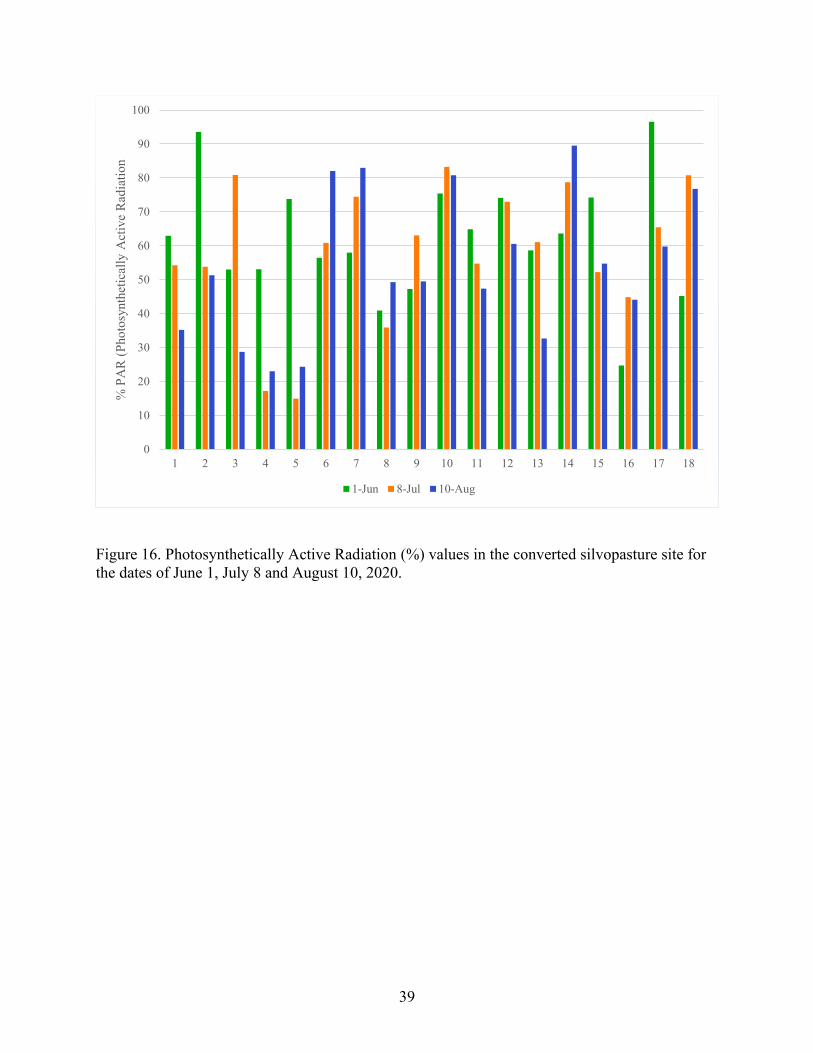
Figure 16. Photosynthetically Active Radiation (%) values in
the converted silvopasture site for the dates of June 1, July 8 and August
10, 2020.
Page 39

1
INTRODUCTION
Ozarks
The Missouri Ozarks is located in the south-central part of Missouri, ranging from the
very southwest corner of the state and east to St. Louis. This region is enriched with large dense
populations of oak and hickory tree species, while also being occupied with prime forage
pastures for grazing livestock. Missouri is ranked second in the nation for farming operations and
hay production, while also third in the nation for beef cow number of head (MDA 2021).
The Ozarks were once heavily populated in short-leaf pine forest, but in the later 1800’s
Missouri’s Ozarks were exploited by eastern United States milling operations (Benac and Flader
2004 and Rafferty 1992). The Missouri Ozark region is predominantly filled with an acidic silt
loam texture on the surface soil and containing more of a clay base on the lower subsoil. These
soils are known to be highly erodible and have become very diverse on the upper portion of the
soil profile due to erosion causing tree throw mass movement and or soil creep (USDA 1997).
Nutrients within the soil impact diversity, competitiveness, and growth for plant species within
the ecosystem. The Ozarks soils are known to be low in available Phosphorus. Phosphorus is an
important macronutrient that assists with plant proteins, amino acids and is necessary for plant
metabolism (Hammer 1997). The inventory of 1999 revealed that in Missouri, there is a total of
5.7 hectares of forestland; 1.85 hectares are located on farms, .92 hectares are pastured, and .94
hectares are not in pasture on the farm (MDA 2021).
A positive outlook on the adoption of implementing a silvopasture system into a
producer’s farming operation is not always easily accepted by producers. Research conveys this
stems from cultural barriers from the older generation of farm families and their original
2
practices (Raedeke et al. 2003). Much research has been conducted on the short-term effects of
agroforestry practices within production agriculture and have seen benefits of increased
macroclimates, positives of soil fertility and cycling of nutrients, while also seeing results of
reduced soil erosion and improved water quality (Lorenz and Lal 2014). There is a lack of
knowledge in the Midwest on how hardwood forests can be best managed for optimal returns to
the land and to the landowner. Agroforestry has gained interested because of the large amount of
underground biomass that has the potential to store much carbon (Lorenz and Lal 2014). Long-
term silvopasture research within the Midwest will help learn the effects of such a system on the
land, while also spreading knowledge to Midwest landowners and farm operators on how they
can best optimize their farming practices with livestock, forages and trees combined (Garrett et
al. 2004).
Silvopasture
Silvopasture is a n intensively managed agroforestry system that integrates trees, forages,
and grazing livestock for a production benefit. Silvopasture is also a management practice that is
known to improve local water quality and positive climate stabilizing effects for livestock all
through the use of implementing trees into an agricultural system (Garrett et al. 2004). There are
two practices that can be used when establishing silvopasture; the practice of taking an already
established pasture and planting trees into it or taking a tree stand and thinning it out to allow for
adequate light to produce forage growth (Angima 2009). Silvopasture brings economic flexibility
for the producer by providing multiple crops to harvest and different ways to market their crops.
Silvopasture also adds additional protection for livestock and wildlife, while in return,
lengthening the production season of forage through the benefits of trees. Silvopasture is a

3
practice that requires the knowledge of livestock maintenance, tree species, tree density and
forage species. It requires a good grasp on the environment of the silvopasture system and all the
components alone and in combination (Angima 2009).
Black Walnut
Black walnut (Juglans nigra) is Missouri’s most valuable tree. It is suitable for well
drained northern Missouri soils and southern Missouri’s alluvial river-deposited soils. Black
walnut is known for its valuable wood and its profitable nutmeats (Reid et al. 2009). Black
walnuts are one of the last species to bud out in the spring and one of the first to lose their leaves
in the fall (Garrett et al. 1996). This aids in cool season forage growth because it allows time for
more sunlight during the spring and fall but produces shade for protection during the heat of the
summer.
Forage
Forage is the ultimate component of a grazing system. It is essential to choose a forage
that is suitable for the growing site and able to provide the nutritional needs to the livestock that
are chosen to graze the site. Research has shown that cool season grasses such as tall fescue,
perennial ryegrass (Lolium perenne) and orchardgrass can perform well under 50% tree canopy
shade (Angima 2009). Pang et al. (2019a) tested the effect of shade from trees on growth and
nutritional quality for 43 forage species. The study’s results showed that annual forage yield
under moderate to dense shade have higher yields than an open pasture. Cool season forage was
also proved to be more tolerable to shade than warm season forage. A sister study was conducted
by Pang et al. (2019b) and concluded that the relative feed value of the forages benefited from
4
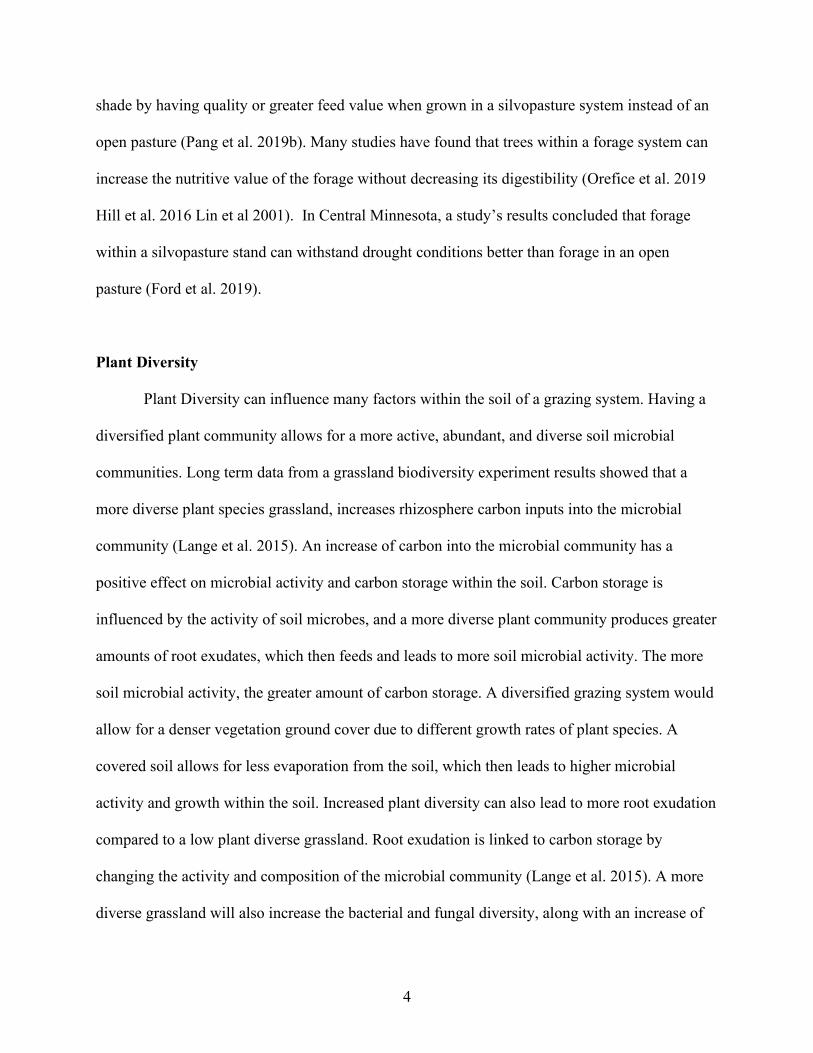
shade by having quality or greater feed value when grown in a silvopasture system instead of an
open pasture (Pang et al. 2019b). Many studies have found that trees within a forage system can
increase the nutritive value of the forage without decreasing its digestibility (Orefice et al. 2019
Hill et al. 2016 Lin et al 2001). In Central Minnesota, a study’s results concluded that forage
within a silvopasture stand can withstand drought conditions better than forage in an open
pasture (Ford et al. 2019).
Plant Diversity
Plant Diversity can influence many factors within the soil of a grazing system. Having a
diversified plant community allows for a more active, abundant, and diverse soil microbial
communities. Long term data from a grassland biodiversity experiment results showed that a
more diverse plant species grassland, increases rhizosphere carbon inputs into the microbial
community (Lange et al. 2015). An increase of carbon into the microbial community has a
positive effect on microbial activity and carbon storage within the soil. Carbon storage is
influenced by the activity of soil microbes, and a more diverse plant community produces greater
amounts of root exudates, which then feeds and leads to more soil microbial activity. The more
soil microbial activity, the greater amount of carbon storage. A diversified grazing system would
allow for a denser vegetation ground cover due to different growth rates of plant species. A
covered soil allows for less evaporation from the soil, which then leads to higher microbial
activity and growth within the soil. Increased plant diversity can also lead to more root exudation
compared to a low plant diverse grassland. Root exudation is linked to carbon storage by
changing the activity and composition of the microbial community (Lange et al. 2015). A more
diverse grassland will also increase the bacterial and fungal diversity, along with an increase of

5
different soil microbial communities causes an increase in soil microbial respiration (Lange et al.
2015). Lange’s data on long term grasslands conveys the positive impacts on soil
microorganisms for carbon storage when a diverse grassland is present on the land. “Plant
diversity and associated soil microbial communities can significantly contribute to sequestration
of atmospheric carbon dioxide” (Lange et al. 2015).
Livestock
Cattle and sheep are predominantly the livestock species that are managed within a
silvopasture system. Silvopasture aids in animal performance by reducing heat stress, provides
greater forage availability and improves nutritional quality (Angima 2009). Silvopasture systems
with uniformity in tree canopy shade help increase the grazing time of livestock and manure
distribution. An increase in grazing results in an increase in improved weight gains in livestock.
Shade is a huge benefit, but properly positioned trees will also allow for weather protection from
wind and winter weather. These are important factors for livestock producers who calve in the
winter and early spring months (Angima 2009).
Management Intensive Grazing
Management Intensive grazing (MiG) is a way that producers can control the grazing
pressure that their livestock will put on a forage pasture. MiG is a way to conserve forage,
promote diversity within a grass stand and better the environment. A MiG producer would
observe their forage often and judge by the forage when they should rotate their livestock into a
new area. A well-managed grazing system allows for more ground cover, less soil nutrient and
water run-off, more organic matter, and a net in greenhouse gas emissions (Franzluebbers et al.
6
2012). Rotating through a paddock or grid system, allows for less grazing pressure and gives
forage and trees a longer recovery time and increases root development (Angima 2009). MiG is a
concept that is for the next generation of livestock producers. It can be considered a risk to
producers to start a MiG system, but it is with local extensions and USDA-NRCS providers
educating local producers at a community, state and federal level where producers will be able to
see the benefits to their land, families, communities, and pocketbooks (Franzluebbers et al.
2012).
Soil Health
Healthy soil is such an important factor for agriculture ecosystems. Defined by Doran et
al. (1996) “the continued capacity of soil to function as a vital living system, within ecosystem
and land-use boundaries, to sustain biological productivity, maintain the quality of air and water
environments, and promote plant animal, and human health.” USDA defines soil health as “the
continued capacity of the soil to function as a vital living ecosystem that sustains plants, animals
and humans” (USDA-NRCS 2018). Silvopasture systems can enhance soil organic carbon, soil
nutrient availability and the soil biota. Soil organic carbon is enhanced by adding trees into a
silvopasture system. An addition of trees will incorporate litter above and below ground that then
turns into organic matter. Organic matter will then feed the soil organisms and influence the soil
biodiversity and function (Jose and Dollinger 2018). Adding trees into a forage environment
provides a new nutrient supply pathway through litter decomposition and nutrient leaching from
leaves. “The process of litter decomposition and mineralization supplies abundant nutrient stock
in agroforestry systems and consequently improves crop yields” (Jose and Dollinger 2018).The
overall study goals and objectives are to 1) observe the establishment of a plantation silvopasture

7
and a converted silvopasture stand and 2) provide a baseline of data for the plantation
silvopasture and the converted silvopasture for future studies to come. Based on the goals and
objectives, struggles and success of the two silvopasture establishments will be monitored and
specific environmental, soil and plant species data will be obtained.
8
MATERIALS AND METHODS
Experimental Design
Missouri State’s Journagan Ranch is where the silvopasture establishment study site
resides. Leo Journagan gifted the Missouri State University with the Journagan Ranch. This
ranch resides on 3,300 acres in Douglas County, Missouri. Journagan Ranch runs one of the
largest Herford herds by a University, while also owning the fifth largest herd of registered
Polled Herford cattle in the United States (Rose 2010). Observations and measurements of forage
and soil were collected through the spring and fall of 2020 on two separate types of silvopasture
establishments.
The first type of silvopasture is a black walnut plantation, referred to as the walnut
plantation. The walnut plantation was planted on a predominantly tall fescue cool season forage
pasture (Roberts and Gerrish 2001) located on a Razort silt loam, 0 to 2 percent slopes, a fine-
loamy, mixed, active, mesic Mollic Hapludalfs (USDA-NRCS 2002). The site measures 219.45
meters by 73.15 meters. Two types of black walnut cultivars, football and kwikrop, were planted
on December 19, 2019. Bare root walnut seedlings were grown in raised beds at the Missouri
State University Shealy Farm in Fair Grove, Missouri. Seedling were collected the day before
planting and planted into 12 rows, each row 18 meters apart, with six trees planted within each
row 12 meters apart. Spacing accounted for ease of passing equipment through the pasture in
future forage and nut harvests (Figure 1).
The second type of silvopasture is a thinned timber stand, referred to as the converted
silvopasture. The converted silvopasture is about two hectares and is composed of mixed oak and
hickory tree species. It resides on an Ocie-Gatewood complex, 3 to 15 percent slopes, a loamy-
skeletal over clayey, mixed, semiactive, mesic Oxyaquic Hapludalfs and a Gatewood-Moko
9
complex, 3 to 15 percent slopes, a very fine, mixed, active, mesic Oxyaquic Hapludalfs (USDA-
NRCS 2012). A forest inventory was taken to mark the dominate and codominant tree species to
keep for health and vigor of the converted silvopasture tree stand. The converted silvopasture
tree stand was thinned to about a 50% canopy cover in November 2019 to allow for adequate
light through the canopy to assist with cool season forage growth (Gardner 1985). A fescue and
orchardgrass seed mix was broadcasted over the converted silvopasture in April 2020. Eighteen
0.04-hectare fixed plots were delineated for future referencing and data collection (Figure 2).
Within each fixed plot, a center point was established with a t-post and four stakes were driven
into the ground 7.62 meters away from the center in each cardinal direction.
Environmental Data
Weather data for years 2010 through 2020 were obtained from the University of Missouri
Extension weather station located in Mountain Grove, Missouri. Weather data included average
maximum temperature, minimum temperature, monthly rainfall, and yearly rainfall. The
Mountain Grove weather station is located about 15 kilometers north of the silvopasture study
sites. In the late summer of 2020, two weather stations were installed at each silvopasture study
site location at Journagan Ranch. These weather stations will provide accurate precipitation rates
at each specific site along with other valuable environmental data. Environmental data will be
obtained from these silvopasture study site weather stations to aid in precise environmental data
collection.

10
Soil Sample Collection
Twenty-seven composite soil samples were collected on July 22, 2020. Within the
walnut plantation, three composite soil samples were taken from each of the three blocks (Figure
3). Within the converted silvopasture stand, nine composite soil samples were collected within
both blocks of the converted silvopasture within the subplot structure (Figure 2).
At each composite sample location, an average of 15-20 soil probe cores were randomly
taken by using an AMS 33” Soil Probe Sampler (Forestry Supplier, Jackson, MS, USA). Cores
were taken to a maximum of 7.5 cm depth, sometimes limited by the shallower depth of the
collectable soil across the site. Each soil core was subdivided into the depths of 0-2.5 (A), 2.5-5
(B), and 5-7.5 (C) centimeters (Figure 4). Soil from each depth was combined from the different
cores at one location into one composite sample for each depth and stored in plastic bags. Soil
samples were transported to the lab in Karls Hall (Missouri State University, Springfield,
Missouri) opened and allowed to air dry at room temperature. Dry samples were then sieved
through a 2mm screen, ground with a mortar and pestle, and stored in plastic bags at room
temperature.
Each soil sample was analyzed for salt pH (pHs) and Bray I phosphorus. Soil pHs was
measured as outlined by Nathan et al. (2012) by weighing 10 grams ( 0.1grams) of air-dried soil
and placing into a labeled 50 milliliter beaker along with 10 milliliters of 0.01 M CaCl2 solution.
Each sample was then stirred with a glass stir rod and then placed on a (FisherBrand Multi-
Platform Shaker.) The shaker table was set at a speed of 450rpm and shook the samples for 30
minutes. Samples were then measured with an OHAUS (W.W. Grainger, Inc., Lake Forest, IL,
USA) Starter300, model ST300 calibrated pH meter and recorded to the hundredth decimal.
11
Bray I soil phosphorus (P) (Bray and Kurtz 1945) was determined colorimetrically by
weighing out 0.5 grams ( 0.1 grams) dried soil sample and adding it into a plastic beaker with 5
milliliters Bray I extractant (Nathan et al. 2012). Samples were vortexed periodically over 5
minutes and centrifuged for five minutes at 4500rpm. Supernatants were then pipetted into the
duplicated labeled tubes, with 4 milliliters of working solution as followed by Nathan et al.
(2012), vortexed and then allowed to sit for 20 minutes for color development. Samples were
placed in plastic cuvettes and read for absorbance of 660nm light using a Thermo Scientific
Genesis 30 visible spectrophotometer (Thermo Scientific, Waltham, Massachusetts, USA)
Solution P concentration (ppm) were then converted to pounds per acre Bray I P (Nathan et al.
2012).
Field Measurements
Soil temperature and soil moisture were measured on June 1, July 8, July 22, and August
10 of 2020 and light levels were measured on June 1, July 8 and August 10 of 2020. Four
measurements, one at each sub plot structure (Figure 3), were taken in every fixed plot in the
converted silvopasture and at each seedling in the walnut plantation. Soil temperature was
recorded using a SpotOn temperature probe (Forestry Suppliers, Jackson, MS, USA) by
inserting the probe rods into the soil to a 7.5-centimeter depth. Sunlight was measured waist high
with an Apogee MQ-306: Line quantum six sensor handheld meter (Forever Green Indoors,
Spokane, WA, USA) that measures a spatial average of PAR (Photosynthetically Active
Radiation). Soil moisture was measured by a Campbell Scientific Hydrosense II meter
(Campbell Scientific, INC. Logan, UT, USA). The Hydrosense II meter was inputted into the
12
soil to about 7.5 centimeters and measured the average soil moisture to the depth of the probe in
percent moisture by volume.
Canopy Density
Overstory tree canopy density was measured on July 8, 2020, with a modified spherical
densiometer (Forestry Suppliers, Jackson, MS USA). The spherical densiometer consists of a
small wooden box with a convex or concave mirror, engraved with 24 squares, placed in it.
The densiometer is used by holding it at breast height so that the observer's head is reflected
from the edge of the mirror just outside the graticule (Lemon 1956). Four readings from a
reference tree are taken in each cardinal direction and follow Lemmon, Paul E., (1956) to create
percent canopy density.
Species Transects
A total of 100 plant species observations were taken within all 18 fixed converted
silvopasture plots on September 18, 2020. Each plot was sub-divided by subplot structures
(Figure 3). Plant species observations started within the center of the plot and went 7.62 meters
in each cardinal direction to the subplot structures. An observation was collected at each 30.48
centimeter by writing down what plant species was growing from the soil in that location. Bare
soil was observed along with grassy weed species: southern crabgrass (Digitaria ciliaris),
shortawn foxtail (Alopecurus aequalis) and yellow nutsedge (Cyperus esculentus). Bermudagrass
(Cynodon dactylon), Kentucky bluegrass (Poa pratensis), tall fescue, orchardgrass, little
bluestem (Schizachyrium scoparium), legumes (white clover Trifolium repens) and woody
broadleaves (Hickory Carya spp.) were all observed.
13
RESULTS
Environmental Data
Monthly precipitation for the observation year of 2020 was similar in all growing months
compared to the past 10-year average besides August and September. The past ten-year average
precipitation for August was 11.4 centimeters and for September was 8.31 centimeters. For the
observation year 2020 August and September both had less than half the ten-year average of
precipitation with August having 3.78 centimeters and September having 3.38 centimeters
(Figure 5). Minimum and Maximum temperature for 2020 was on average lower than the past
ten years (Figure 6).
Soil Chemistry
Soil pHs within the walnut plantation ranges from 6 to 7.18 in pHs value within the 9
composite soil sample sites. Plot 4 has the highest pHs value of 7.18 and plot 3 has the lowest
pHs value at 6 (Figure 7 & 8). Soil pH within the converted silvopasture ranges from pH value of
5.56 in plot 10 to 7.12 pH value in plot 15 (Figure 9). Soil pHs follows a trend of being more
acidic on the north side of the converted silvopasture site and gradually becomes more alkaline
and neutral as elevation increased to the south side of the study site (Figure 10).
Phosphorus values for the Walnut Plantation at depth A, ranged from 15.98 lb/ac P in
plot 7 to 9.36 lb/ac P in plots 5 and 9. Plots 5 and 9 have the lowest values and have the same
value of 9.36 lb/ac P. Plot 3 had the highest available P at depth B, with 11.5lb/ac P and Plot 6
had the lowest available Phosphorus value at 4.08 lb/ac P of available P. Plot 9 had the lowest
available P at depth C, with 4.43 lb/ac P and plot 3 had the highest available P value of 14.82

14
lb/ac P. At depths B and C, the same values were observed within Plots 1, 7 and 9. Plot 3 had the
same available P value for depth A and depth B (Figure 11). The average drop in available P
from depth A to depth B is 6.05 lb/acc P. The average drop in available P from B to depth C is 0.
All information is referenced in figures 11 and 12.
Available Phosphorus (P) values for the converted silvopasture at depth A range from the
lowest available P recorded in plot 15 at 16.39 lb/ac P and the highest recorded in plot 51.08
lb/ac P. Available P within the converted silvopasture for depth B was recorded the lowest in
plot 12 at 8.94 lb/ac P and the highest at 26.32 lb/ac P. For depth C, the lowest available P was in
plot 15 at 3.58 lb/ac P and the highest was in plot 10 with a value of 27.84. Plot 8 shares the
same values of available P in depth B and C. Plots 1, 3, 10, 16, and 17 all have available P values
greater in-depth C, than in depth B. The average drop in available P from depth A to depth B is
13.96 lb/ac P. The average drop in available P from depth B to depth C was 2.54 lb/ac P. For
detailed results, reference figures 13 and 14.
Canopy Density
In the converted silvopasture stand, 13 of the 18 plots have a mean canopy density higher
than 50%. Plots 2, 13, 14, 15 and 18 have a canopy density lower than 50%. Plot 8 has the
highest canopy density at 78% canopy coverage and plot 15 has the least dense canopy coverage
at 30% density (Figure 15).
Species Transects
Within the converted silvopasture, plots 9, 12 & 15 had over 50% bare soil counted
within their species transects. Plot 15 had the highest amount of bare soil counted within its
15
species count with 80% counted bare soil. All plots had a count of grassy weeds, but plots 1, 3, 4,
10, 13, and 14 had over a 40% weed species count. Legumes were observed in plots 1, 3, 4, 7, 8
and 9 but most significant in plot 1 with 19% and plot 7 with 7% legumes. Plot 17 is the only
plot with bermudagrass present that was counted at 3%. Plots 2, 7 and 8 were observed with
around 30% tall fescue species within the plots species transects. Plot 16 had a significant
amount of Bluegrass with 22% counted in species transects. Orchardgrass was observed in all
plots, but in plots 2, 6 and 16 there was a significant amount of biomass of 15%. Little Bluestem
was observed in plots 12, 13, 14, 15 and 17 with plots having the most significant amount at
13%. Woody broad leaf species were observed in plots 1 and 6, with plot 6 having the most
observations at 3% (Figure 8).
16
DISCUSSION
Environmental Data
Weather data does not convey the severity of the short drought like conditions in the late
summer of 2020 at the silvopasture study sites. Weather data indicated that we had above
average precipitation for the month of July, but this precipitation came in between two weeks of
no precipitation. For 2020, the months of August and September were excessively dry at the
silvopasture sites (Figure 5). Precipitation was recorded 15 kilometers north of the silvopasture
study sites. There were dates where precipitation fell in Mountain Grove, Missouri at the weather
station and not at the Journagan Ranch silvopasture study sites.
Soil Chemistry
Available Bray I Phosphorus results for the plantation study site are very low (Buchholz,
1983). Phosphorus application of fertilizer should be suggested to help with forage growth on
both silvopasture sites. Results display that available Bray I P for plots three and six have more
available P at depth C than at depth B (Figure 11). No conclusions determined besides sampler
error. There were many students assisting with soil sampling and possibly could affect results.
Available Bray I P amount was higher overall for the converted silvopasture. The higher
amounts of Bray I P were located in plots 1,2,4,5, and 10 (Figure 13 & 14). All these plots reside
at the bottom of a natural drainage way. These plots may have higher P values compared to the
other parts of the converted silvopasture due to having a concentrated area of soil and nutrient
runoff. Typically, the most concentrated amounts of plant available Bray I P is within the top of
the soil surface. Plots 1,10,16 and 17 have higher values of Bray I P at depth C than the depth B.
Much ground disturbance happened to the converted silvopasture through the thinning process.
17
Trees were thinned by heavy machinery and much soil was turned over. Soil disturbance has not
had enough time to settle down, thus leading to a higher content of available Bray I P deeper in
the soil profile. Between the top depth A to depth B, is on average the largest decline in available
Bray I P (lbs/A) value. The average Bray I available P from depth A to depth B is 13.96lbs/A P.
Thus, showing that the most plant available Bray I P resides within the top depth A of the soil.
Reference figure 15 for P results.
Within the walnut plantation, plots 4, 5, 8 and 9 have a close to neutral pHs or alkaline
pHs (Figure 9). For figure 10 to be improved, more soil samples need to be taken across the
study site to add more data points to be used within creating the map. Overall, soil pHs is
desirable within this site. Soil pHs for the converted silvopasture has an alkaline to neutral soil
pH on the southern side of the stand, especially within plots 15 and 12. This is the location of the
site’s soil change from an Ocie-Gatewood complex to a Gatewood-Moko complex. Located in
plot 15 is rock outcrop and the start of a glade. Limestone and dolomite glades are common
within the Ozarks area. They cause calcium, magnesium, and lime to leach out into the soil, thus
raising the pHs value of plots 12 and 15 (Figure 9). Soil pHs is lower within plots 1, 4 and 10,
but overall, soil pH is desirable within all other converted stand plots (Figure 9 & 10).
Canopy Density
Canopy density for the converted silvopasture was an average of 55.57% canopy density
(Figure 15). The goal of the thin was to obtain a 50% canopy coverage to allow for adequate
sunlight through to optimize cool season forage growth (Gardner et al. 1985). Fifty five percent
canopy density conveys that the tree thinning was successful is staying close to the 50% canopy
density goal. Management is still needed to maintain the canopy and observe the density over

18
time so that the converted silvopasture canopy does not become too dense and have a negative
impact on cool season forage growth. Light intensity (PAR) and canopy density did correlate
when looking at plot 15. Plot 15 had a low tree canopy density of 29.8% and had 74.2% PAR
light intensity reading (Figure 16). Though plot 15 displays how the canopy density correlates
with light intensity, not all plots present this correlation. This may be concluded from light
intensity readings taken at different times of the day at different times of the year. The sun is
located at different points and shifts through the sky all through the day and year, this effects the
light intensity rates. Canopy density is measuring from a the bottom of a base tree by looking
through a densiometer to observe what is directly above that specific tree, thus light was
measured right above the tree. PAR light intensity will have different rates when compared to
canopy density. They can be correlated too, but there are also many errors within comparing the
two with each other.
Species Transects of Converted Silvopasture
Species transects from the converted silvopasture were lumped into three groups of
observations (bare soil, grassy weeds, and desirable forage). Plot two is the only plot with over
50% desirable forage species present within the plot. The average cover of desirable plant
species for all 18 plots is 34% (Figure 8.) Plot 15 is predominantly bare due to much of the stand
being consumed with exposed limestone. The biggest concern for the converted stand is that over
50% of the soil is bare or resides in weedy plant species. Forage management practices such as
flash grazing or chemical herbicide spraying will help reduce the weed population and provide
more room for desirable forage species to grow. Another forage seeding should take place in the

19
fall of 2021 and spring of 2022. Observations convey that it may take the converted silvopasture
two to three years to develop adequate forage to graze livestock on.

20
CONCLUSION
This study was strictly an observation study to establish a baseline of data for years to
come at the Missouri State’s Journagan Ranch silvopasture study sites. Struggles and successes
were monitored within the walnut plantation and converted silvopasture study sites. The
silvopasture study sites were built to help provide info to local livestock producers and the
USDA for best management practices that livestock producers can utilize for their Ozark lands.
The walnut plantation had an overall very-low plant available phosphorus lbs/ac and a
relatively good soil pH. The First year of the converted silvopasture tree thinning, canopy density
was close to the 50% tree canopy density goal. Much soil disturbance was noticed through soil
chemical readings along with much bare soil and weed species present in the ground species.
The walnut plantation silvopasture needs time to establish walnut trees and the converted
silvopasture needs a brush and weed management plan, along with at least one more forage
seeding. The converted stand also needs a few more years for the disturbed soil to settle down to
allow for accurate soil chemical readings from the study site. Many years of observation and
study are needed to conclude results from establishment and management of a plantation
silvopasture and converted silvopasture. This observation study will allow for future years to
assess plant species development and management within the converted silvopasture site.
Expanded soil nutrient analysis is needed to assess soil parameters such as soil organic matter,
nitrogen, microbial activity, soil water infiltration, soil compaction and many more soil
parameters to help assess soil health
21
REFERENCES
Angima SD (2009) Silvopasture: An agroforestry practice. University Extension Oregon State
University EM 8989-E
Benac D, Flader S (2004) History of Missouri forests in the era of exploitation and conservation.
United States Forest Service.
Buchholz D (1983) Soil Test Interpretations and Recommendations Handbook. University of
Missouri, College of Agriculture – Division of Plant Science
Doran JW, Sarrantonio M, Liebig MA (1996) Soil health and sustainability. Adv Agron 56:2-54
Ford MM, Zamora DS, Current D, Magner J, Wyatt G, Walter WD, Vaughan S (2019) Impact of
managed woodland grazing on forage quantity, quality and livestock performance: the
potential for silvopasture in Central Minnesota, USA. Agrofor Syst 93:67-79
Franzluebbers A, Paine L, Winsten J, Krome M, Sanderson M, Ogles K, Thompson D (2012)
Well-managed grazing systems: A forgotten hero of conservation. J Soil Water Conserv
7 (4) 100A-104A
Gardner FP, Pearce BB, Mitchell RL (1985) Physiology of crop plants. Iowa State University
Press, Ames IA.
Garrett HE, Kerley MS, Ladyman KP, Walder WD, Godsey LD, Van Sambeek JW, Brauer DK
(2004) Hardwood silvopasture managment in North America. Agrofor Syst. 61:21-33
Garrett H, Kurtz W, Slusher J (1996) Walnut Agroforestry. MU Guide. University Extension,
University of Missouri-Columbia.
Hammer, David (1997) Missouri Ozark Forest Soils: Perspectives and Realities. An article from
The Missouri Ozark Forest Ecosystem Project (MOFEP).
Hill J, Farrish B, Oswald L (2016) Quality and yield of seven forages grown under partial
shading of a simulated silvopastoral system in east Texas. Arthur Temple College of
Forestry and Agriculture, Stephen F. Austin State University; USDA NRCS East Texas
Plant Materials Center, Nacogdoches, Texas
Jose S, Dollinger J (2019) Silvopasture: a sustainable livestock production system. Agrofor Syst.
93:1-9
Lange M, Eisenhauer N, Carlos S (2015) Plant Diversity increases soil microbial activity and soil
carbon storage. Nat Commun 6:6707
22
Lemon, P (1956) A Sepherical Densiometer For Estimating Forest Overstory Density. Forest Sci.
2:314-320
Lin CH, McGraw RL, George MF, Garrett HE (2001) Nutritive quality and morphological
development under partial shade of some forage species with agroforestry potential.
Department of Forestry, School of Natural Resources, Department of Agronomy,
University of Missouri, Columbia Missouri. 53: 269-281
Lorenz K, Lal R (2014) Soil organic carbon sequestration in agroforestry systems. A review.
Agron. Sus. Dev. 34:443-454.
Missouri Department of Agriculture MDA (2021) Missouri Agriculture Highlights USDA-DNR
Nathan M, Stecker J, Sun U (2012) Soil Testing In Missouri: A guide for conducting soil tests in
Missouri. University of Extension.
Orefice J, Smith RG, Carroll J, Asbjornsen H, Howard T (2019) Forage productivity and
profitability in newly established open pasture, silvopasture, and thinned forest
production systems. Agrofor Syst. 93:1-15
Pang K, Van Sambeek JW, Lin C-H, Jose S, Garrett HE (2019a) Responses of legumes and
grasses to non-, moderate, and dense shade in Missouri, USA. I. Forage yield and its
species-level plasticity. Agrofor Syst. 93:11-24
Pang K, Van Sambeek JW, Navarrete-Tindall NE, Lin C-H, Jose S, Garrett HE (2019b)
Responses of legumes and grasses to non-, moderate, and dense shade in Missouri, USA.
II. Forage quality and its species-level plasticity. Agrofor Syst. 93:1-9
Raedeke A, Green J, Hodge S, Valdivia C (2003) Farmers, the practice of farming, and the future
of agroforestry: An application of Bourdieu’s concepts of field and habitus. Rural Sociol
68:64-86.
Rafferty M (1992) The Ozark forest its exploitation and restoration. Ozarks Watch, Springfield
Greene County Library. Vol. VI, No. 1, Summer 1992 / No. 2, Fall 1992.
Roberts C, Gerrish J (2001) G4652 Seeding Rates, Dates, and Depths of Common Missouri
Forages. University of Missouri Extension. http://extension.missouri.edu/p.G4652
Accessed 21 March 2021
Rose MS (2010) The Journagan Ranch: A land dedicated to learning. Missouri State University.
https://blogs.missouristate.edu/bearbulletin/2010/06/18/the-journagan-ranch-a-land-
dedicated-to-learning/ Accessed 13 May 2020

23
Reid W, Coggeshall M, Garrett HE, Van Sambeek J (2009) Growing Black Walnut for Nut
Production. Agroforestry in Action. Center for Agroforestry, University of Missouri,
Columbia. AF-1011.
USDA NRCS (2018) Healthy soil for life.
https://www.nrcs.usda.gov/wps/portal/nrcs/main/soils/health/ Accessed 22 December
2020
USDA-NRCS (2002) Soil Survey of Douglas County, Missouri. The United States Department
of Agriculture.
United States Department of Agriculture (1997) Missouri Ozark Forest Ecosystem Project
Symposium: an experimental approach to landscape research. Forest service, North
Central Forest Experiment Station, St. Paul, MN.

24
Figure 1. Aerial view of the walnut plantation located at MSU Journagan
Ranch Douglas County. The system was divided into three replicate blocks.
Each block containing four rows randomly assigned to each walnut cultivar football or kwikrop.
25
Figure 2. Aerial view of the converted silvopasture system. Areas represented by the
red circles (1-18) indicate plots (1327.7 m2) for soil sampling and species transects. Blue dots
within each plot represent permanent subplot structures.
26
Figure 3. Aerial view of the walnut plantation for composite soil sampling. Areas represented
by the numbered rectangles (1-9) indicate three benchmark soil sampling sites (731.5
m2) for each block.

27
Figure 4. Individual soil cores were divided into depths of 0-2.5cm (A), 2.5-5cm (B) and 5-
7.5cm (C).
28
Figure 5. Monthly precipitation total for 2020, and a 10-year (2010-2019) monthly precipitation
average for Mountain Grove, Missouri.
0
5
10
15
20
25
30
Jan Feb Mar April May June July Aug Sep Oct Nov Dec
Pre
cipit
atio
n (
cm)
Monthly Precipitation
2020 2010-19 Monthly Avg.

29
Figure 6. Monthly maximum (2020 T-max) and minimum (2020 T-min) temperatures for the
2020 growing season and the 10-year (2010-2019) average maximum (2010-19 Avg T-max) and
minimum (2010-19 Avg T-min) for Mountain Grove, Missouri.
0
10
20
30
40
50
60
70
80
90
100
Jan Feb March April May Jun July Aug Sep Oct Nov Dec
Tem
per
atu
re (°F
)
Monthly Temperature
2020 T-max 2020 T-min 2010-19 Avg T-max 2010-19 Avg T-min

30
Figure 7. Soil pHs values from composite soil samples for each of the 9 benchmark soil sampling
sites in the walnut plantation.
5
5.5
6
6.5
7
7.5
1 2 3 4 5 6 7 8 9
So
il p
H
Walnut Plantation Plot Number
31
Figure 8. Spatial representation of soil pHs values for walnut plantation. Dots 1-9 represent the
benchmark soil sampling sites.

32
Figure 9. Soil pHs values from composite soil samples for each of the 18 plots in
the converted silvopasture site.
5
5.5
6
6.5
7
7.5
1 2 3 4 5 6 7 8 9 10 11 12 13 14 15 16 17 18
So
il p
H
Conversion Silvopasture Plot Number

33
Figure 10. Spatial representation of soil pHs values for converted silvopasture. Dots 1-18
represent the plots for soil sampling
34
Figure 11. Available Bray I Phosphorus (lbs/ac) values by depth for each of the 9 benchmark soil
sampling sites in the walnut plantation.
0
2
4
6
8
10
12
14
16
18
1 2 3 4 5 6 7 8 9
Ava
ila
ble
B
ray
I P
(l
bs/
A)
Walnut Plantation Plot Number
0-2.5cm 2.5-5cm 5-7.5cm

35
Figure 12. Spatial representation of available Bray I Phosphorus (lbs/ac) for the walnut
plantation at the soil depth of 0-2.5 centimeters.
36
0
10
20
30
40
50
60
1 2 3 4 5 6 7 8 9 10 11 12 13 14 15 16 17 18
Ava
ilab
le B
ray
I P
(l
bs/
A)
Conversion Silvopasture Plot Number
0-2.5cm 2.5-5cm 5-7.5cm
Figure 13. Available Bray I Phosphorus (lbs/ac) values by depth for each of the 18 plots in
the converted silvopasture site.

37
Figure 14. Spatial representation of available Bray I Phosphorus (lbs/ac) for
the converted silvopasture site at the soil depth of 0-2.5 centimeters.

38
Figure 15. Converted silvopasture tree canopy density observations taken for each plot July 8,
2020.
0
10
20
30
40
50
60
70
80
90
100
1 2 3 4 5 6 7 8 9 10 11 12 13 14 15 16 17 18
% C
ano
py D
ensi
ty
Plot Number
39
Figure 16. Photosynthetically Active Radiation (%) values in the converted silvopasture site for
the dates of June 1, July 8 and August 10, 2020.
0
10
20
30
40
50
60
70
80
90
100
1 2 3 4 5 6 7 8 9 10 11 12 13 14 15 16 17 18
% P
AR
(P
ho
tosy
nth
etic
ally
Act
ive
Rad
iati
on
1-Jun 8-Jul 10-Aug