
Established 1947, Member FINRA/SIPC Medley Capital ... · Allorto was previously CFO of GSC...
26
Please see pages 23-26 for Important Disclosures 1 National Securities Research Established 1947, Member FINRA/SIPC Business Development Companies Medley Capital Corporation January 21, 2015 Christopher R. Testa 212.417.7447 [email protected] BUY (MCC, $8.90) Despite Some Challenges Valuation is Far Too Low - Initating With A Buy Rating And $11 Price Target. Investment Conclusion . We are initiating coverage of Medley Capital Corporation (MCC) with a Buy rating and $11 price target. Medley Capital Corporation is a middle market focused BDC investing mostly in senior secured first and second lien loans although the company has exposure to secured notes, unsecured debt, equity, and warrants. The company has not reduced its dividend since inception in the quarter ended 3/31/2011; however, cash NII (net investment income minus PIK income) coverage is north of 100% and has been for each quarter. The company earns significant fees and the vast majority of its originations are direct, enabling points earned on originations to bolster all-in effective yields. MCC generally issues equity each quarter to assist in funding investment purchases and originations while keeping leverage in check. Trading at a 30% discount to NAV (net asset value) and stating that they do not intend to issue equity below NAV, MCC is going to face an uphill battle to grow the portfolio over the next year. The company has a SBIC (Small Business Investment Company) license and has $130 million in commitments and $110 million in debentures outstanding. While SBA (Small Business Administration) commitment will most likely increase to $150 million and the revolver is only at 42.3% of capacity, even with these increasing and assuming no outsized prepayment activity our estimates for portfolio growth are lower than the growth MCC has experienced over the past several years. Asset quality has been in sharp decline the past year, with unrealized losses as a percentage of NAV increasing to 4.1% currently from1.7% a year earlier. Over this same time period investments ranked 4 and 5 jumped to 3.2% from 1.6% a year earlier. Despite the decline in asset quality, it remains much better than peers trading at substantially higher multiples. Our $11 price target implies an estimated 2016 Price/Net Investment Income (P/NII) of 7.1x, dividend yield of 14.4%, and Price/Net Asset Value (P/NAV) of 0.81x compared to the BDC sector averages of 8.7x, 10.9%, and 0.90x, respectively. Source: S&P Capital IQ, National Securities Corporation Estimates
Transcript of Established 1947, Member FINRA/SIPC Medley Capital ... · Allorto was previously CFO of GSC...

Please see pages 23-26 for Important Disclosures 1
Na
tio
na
l S
ec
urit
ies
Re
se
arc
h Established 1947, Member FINRA/SIPC
Business Development Companies
Medley Capital Corporation January 21, 2015
Christopher R. Testa
212.417.7447
BUY (MCC, $8.90)
Despite Some Challenges Valuation is Far Too Low - Initating With A Buy Rating And $11 Price Target.
Investment Conclusion . We are initiating coverage of Medley Capital Corporation (MCC) with a Buy rating and $11 price target. Medley Capital Corporation is a middle
market focused BDC investing mostly in senior secured first and second lien loans although the company has exposure to secured notes, unsecured debt, equity, and
warrants. The company has not reduced its dividend since inception in the quarter ended 3/31/2011; however, cash NII (net investment income minus PIK income) coverage is north of 100% and has been for each quarter. The company earns
significant fees and the vast majority of its originations are direct, enabling points earned on originations to bolster all-in effective yields. MCC generally issues equity each quarter
to assist in funding investment purchases and originations while keeping leverage in check. Trading at a 30% discount to NAV (net asset value) and stating that they do not intend to issue equity below NAV, MCC is going to face an uphill battle to grow the
portfolio over the next year. The company has a SBIC (Small Business Investment Company) license and has $130 million in commitments and $110 million in debentures
outstanding. While SBA (Small Business Administration) commitment will most likely increase to $150 million and the revolver is only at 42.3% of capacity, even with these increasing and assuming no outsized prepayment activity our estimates for portfolio
growth are lower than the growth MCC has experienced over the past several years. Asset quality has been in sharp decline the past year, with unrealized losses as a
percentage of NAV increasing to 4.1% currently from1.7% a year earlier. Over this same time period investments ranked 4 and 5 jumped to 3.2% from 1.6% a year earlier. Despite the decline in asset quality, it remains much better than peers trading at
substantially higher multiples. Our $11 price target implies an estimated 2016 Price/Net Investment Income (P/NII) of 7.1x, dividend yield of 14.4%, and Price/Net Asset Value
(P/NAV) of 0.81x compared to the BDC sector averages of 8.7x, 10.9%, and 0.90x, respectively.
Source: S&P Capital IQ, National Securities Corporation Estimates

National Securities Corporation Business Development Companies
January 21, 2015 2
We anticipate MCC will continue to grow the portfolio with debt and cash generated but lack of equity issuance keeps our growth expectations tempered.
Medley has historically issued equity on a “flow” basis and sold stock regularly to assist in funding new investments and keeping leverage in check. While NII/share and dividends had been in a steady uptrend through 2013 the past several quarters have seen
NII/share under pressure. At a 33% discount to NAV, MCC has publicly stated that they do not intend to issue equity below NAV. A proxy vote resulted in shareholders voting
down Medley’s proposal to sell common stock at a discount to NAV to fund portfolio growth. The company issued $32.4 million, $224.6 million, and $241.4 million of equity in 2012, 2013, and 2014, respectively. MCC has a target regulatory leverage (SBA
debentures excluded) of between 0.60x – 0.70x. Taking all this into consideration keeps our portfolio growth expectations muted. From 2012 to 2013 the fair value of the
portfolio grew at a rapid 86.4% and in fiscal 2014 ended 9/30/14 by 67.7%. We anticipate portfolio growth will be a mere 6.9% in 2015 and 9.8% in 2016 due to the inability (and unwillingness) to complete dilutive equity raises. For the second half of
2016, however, we expect modest equity issuance of $55 million per quarter (gross) as we expect by then MCC should have worked out and/or restructured nonaccrual loans,
enabling the stock to trade near NAV and thus probably permitting reasonable equity issuance to assist in funding investment growth.
MCC has impressively maintained NIM (net interest margin) through a
combination of keeping debt costs relatively stable and earning high effective yields through fees and direct origination. Up until fiscal 4Q14 MCC managed to
maintain NIM in an environment when many of their peers were struggling to do so. The company has a low cost of debt relative to their strategy of growth investing and
willingness to step down the capital structure. Also, MCC’s direct origination platform (89% of investments direct as of fiscal 4Q14) enables the company to earn impressive points and fees on originations they complete. This should not be overlooked as MCC is
a true, direct originator. Fees accounted for $0.34/share in 2012, $0.52/share in 2013, and $0.61/share in 2014 and as a percentage of NII/share were 26%, 34%, and 39%,
respectively. NIM fell precipitously in fiscal 4Q14 to 8.48% from 9.75% in the quarter prior as asset quality moved in sync with investments ranked 4 and 5 jumping to 3.2% of fair value from 1.5% in the quarter prior. We anticipate this could compress further as
the company’s increased leverage will most likely increase interest expense and yields on loans should also fall as we anticipate Medley to focus on more senior secured and less
leveraged (at their attachment point in the investment) as asset quality concerns become more pronounced. For 2015 we estimate NIM will be 8.42% and for 2016 we estimate it will be 8.23%.
Medley has 60.9% of its portfolio in senior secured first lien but has unrealized
losses equivalent to 4.1% of NAV. Since fiscal 1Q12 MCC has not finished a quarter with overall net unrealized gains. However, up until fiscal 3Q13 the losses as a percentage of NAV were mostly negligible (well under 0.5% except for fiscal 3Q12).
Beginning in fiscal 2Q13, however, unrealized losses jumped from 0.1% of NAV to 2.2% in fiscal 1Q14. Unrealized losses now stood at $0.28/share from $0.05/share the year
prior. As of 9/30/14 these unrealized losses are 4.1% of NAV and $0.51/share. The senior secured notes have fared the worst, with cost/FV (amortized cost as a percentage of fair value) at 107.8%, up sharply from the year prior level of 98.7%. Even the senior
secured first lien debt has seen a significant deterioration in credit quality. In fiscal 4Q13, cost/FV was 102.3% for first lien debt but has since increased to 103.9%. While
National Securities Corporation Business Development Companies
January 21, 2015 3
on the surface this does not seem as severe it is worth noting that first lien secured comprised 60.0% of the portfolio at fair value in fiscal 4Q14 while unsecured notes were
a mere 4.5%. The unrealized losses per share in first lien over this time period more than doubled, from $0.23 to $0.50. Given the seniority of these loans, direct origination, and industry diversification the losses should not be on the current trajectory they are
on.
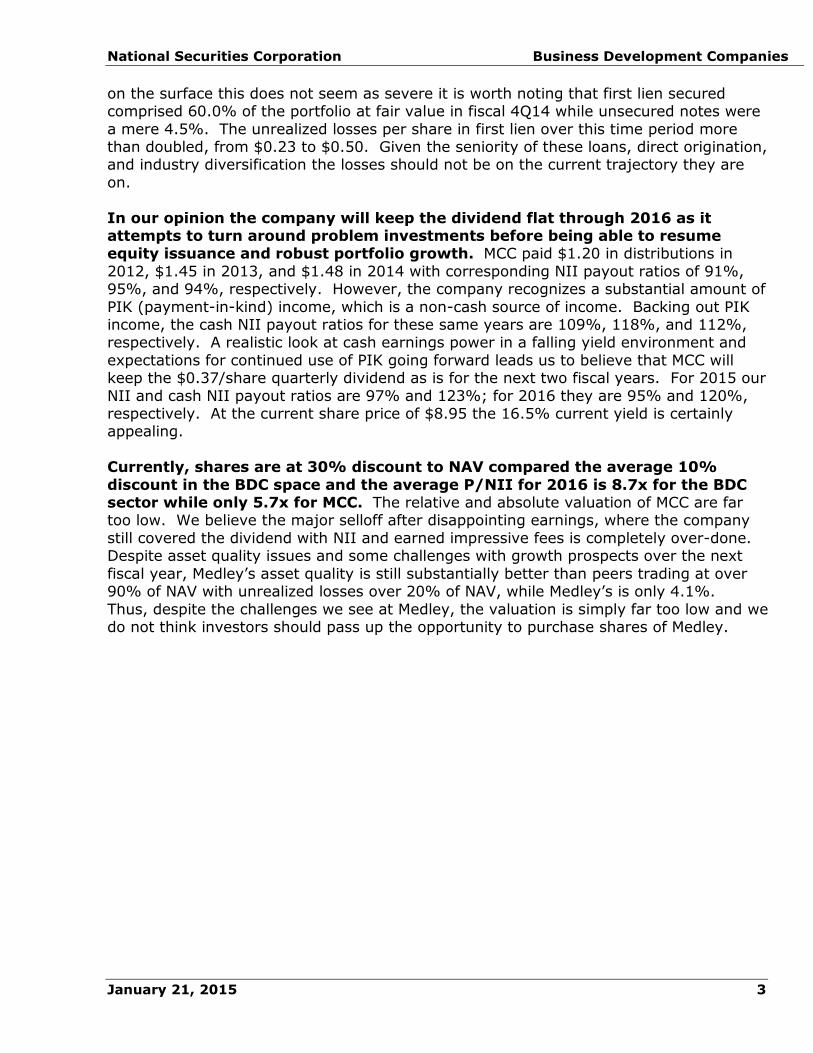
In our opinion the company will keep the dividend flat through 2016 as it attempts to turn around problem investments before being able to resume equity issuance and robust portfolio growth. MCC paid $1.20 in distributions in
2012, $1.45 in 2013, and $1.48 in 2014 with corresponding NII payout ratios of 91%, 95%, and 94%, respectively. However, the company recognizes a substantial amount of
PIK (payment-in-kind) income, which is a non-cash source of income. Backing out PIK income, the cash NII payout ratios for these same years are 109%, 118%, and 112%, respectively. A realistic look at cash earnings power in a falling yield environment and
expectations for continued use of PIK going forward leads us to believe that MCC will keep the $0.37/share quarterly dividend as is for the next two fiscal years. For 2015 our
NII and cash NII payout ratios are 97% and 123%; for 2016 they are 95% and 120%, respectively. At the current share price of $8.95 the 16.5% current yield is certainly appealing.
Currently, shares are at 30% discount to NAV compared the average 10%
discount in the BDC space and the average P/NII for 2016 is 8.7x for the BDC sector while only 5.7x for MCC. The relative and absolute valuation of MCC are far too low. We believe the major selloff after disappointing earnings, where the company
still covered the dividend with NII and earned impressive fees is completely over-done. Despite asset quality issues and some challenges with growth prospects over the next
fiscal year, Medley’s asset quality is still substantially better than peers trading at over 90% of NAV with unrealized losses over 20% of NAV, while Medley’s is only 4.1%.
Thus, despite the challenges we see at Medley, the valuation is simply far too low and we do not think investors should pass up the opportunity to purchase shares of Medley.

National Securities Corporation Business Development Companies
January 21, 2015 4
Company Description Medley Capital Corporation (MCC) is a Business Development Company (BDC) with
headquarters in New York. The company primarily focuses on first and second lien senior secured debt although it does have some exposure to secured notes unsecured debt,
equities, and warrants. The company went public in January 2011. MCC directly originates mostly first and second lien senior debt investments for current income to middle market borrowers.
The company is managed by Brook Taube, CEO and Richard Allorto Jr., CFO. Mr. Taube
has headed Sierra Income Corporation (a subsidiary of MCC’s parent company, Medley Management (NYSE: MDLY-$11.20) since 2012. Mr. Taube is also co-CEO and chairman of the board of MDLY. Before creating Medley he was a portfolio manager at CN
Opportunity fund and before that was a co-founder of T3 Group which was focused on distressed credit investments. Mr. Allorto was previously CFO of GSC Investment
Corporation before joining Medley in July 2010. Exhibit 1. Investment Portfolio at Fair Value as of 9/30/14
Source: Company Reports
MCC’s portfolio had a fair value of $1.2 billion as of September 30, 2014 with 11.4% in business services and 10.3% in buildings and real estate. The company includes fees,
prepayment penalties, PIK income etc. in its interest income. The effective yield earned by MCC has steadily fallen since fiscal 1Q12 and experienced a substantial drop in the
most recent quarter. As of 9/30/14 Medley had overall net unrealized losses of $29.7 million despite being over 60% in first lien secured debt. The unrealized losses are 4.1%
of NAV as of fiscal 4Q14. The trend has certainly been worrisome as unrealized losses were a mere 1.7% a year earlier and only 0.4% the year before that. Medley needs to cure or restructure the four nonaccrual loans expeditiously in order to improve effective
yield, enable equity issuance from a bolstered NAV multiple, and reduce professional fees related to loan workouts. While PIK certainly creates a disparity as shown with the spread
between interest and cash yields, the disparity is even greater with fees bumping up

National Securities Corporation Business Development Companies
January 21, 2015 5
effective yield. This is certainly a positive, as a cash addition to yield more than offsets the non-cash addition.
Exhibit 2: Impact of Fees and PIK on Yields Earned
Source: Company Reports, National Securities Corporation
MCC is externally managed by Medley Management, Inc. and pays both a base fee and incentive fee. The base fee is 1.75% of gross assets in arrears. The incentive fee is paid only if MCC passes a designated hurdle rate of 8%. Essentially, MCC’s NII less the
incentive fee must post a return on prior period NAV greater than 8% before any fee is paid. If this return exceeds 10%, the investment advisor earns an even greater fee and
will get 20% of the difference between the pre-incentive fee NII and the 10% return plus 20% of the difference between the pre-incentive NII and the 10% upper hurdle. The hurdle rates and fee structure are generally in-line with the rest of the BDC industry.
WE ARE INITIATING COVERAGE WITH A BUY RATING AND $11 PRICE TARGET
In order to arrive at our target price we utilize a variant thesis, expected value analysis of
our base case plus a bull case and a bear case. While the valuation is heavily weighted towards the base case (70%) we assign 15% weights to the upside and downside scenario in order to capture the full spectrum of possibilities that the company may encounter over
the next couple of years. We prefer to value MCC and BDCs in general on a NII basis as opposed to NAV basis because fair value marks that flow into equity under GAAP are
difficult to forecast, especially with private investments, and do not necessarily reflect the true fundamentals of the company.

National Securities Corporation Business Development Companies
January 21, 2015 6
Exhibit 3: Expected Value Analysis
Source: National Securities Corporation Estimates
The above table represents our assumptions which drive our valuation. For example, in
our base case for 2016, we get a result of NII/share of $1.56 if investments end the year at $1.33 billion and yield is 12.72%, the cost of funds is 4.71%, the economic return is 16.5%, cost/FV is 102.6%, and total distributions are $1.48/share. We do this for the
next two fiscal years and for three scenarios. Based upon each scenarios performance it will receive a multiple and is discounted back at our calculation for the weighted average
cost of capital (WACC) and them multiplied by the probability to arrive at our expected value. The sum of the expected values equals our price target.
Our $11 price target implies an estimated 2016 P/NII of 7.0x, dividend yield of 14.4%, and P/NAV of 0.81x compared to the BDC sector averages of 9.0x, 10.5%, and 0.92x, respectively. The economic return is calculated by taking year-end NAV minus the
beginning of the year NAV and adding distributions divided by the beginning of the year NAV.
MCC’S PORTFOLIO IS 77% FLOATING RATE WITH A SENIOR SECURED FIRST LIEN FOCUS
Medley’s debt was 77% floating rate as of fiscal 4Q14. Most of the LIBOR floors are
between 0.50% - 1.50% and thus like many of its peers MCC will see NII pressure if LIBOR increases less than 200 bps but will see NII increase if LIBOR increases beyond that. The portfolio was 60.0% first lien and 28.8% second lien with 4.5% in senior
secured notes, 3.1% in unsecured debt, and 3.6% in equity and warrants.
Medley’s asset quality has deteriorated significantly. Investments ranked 4 and 5 are now 3.2% of the portfolio, up from 1.5% in fiscal 3Q14. In fiscal 4Q14 there were no investments ranked 4 but $40.3 million of investments ranked 5. In fiscal 3Q14 $12.1
million of investments were ranked 4 and $4.0 million of investments were ranked 5. Unrealized losses are now 4.1% of NAV, up from 3.0% in the quarter prior and 1.7% in

National Securities Corporation Business Development Companies
January 21, 2015 7
the year prior. The two investment classes with the most issues are clearly senior secured first lien and senior secured notes. Second lien debt has actually held up nicely and experiencing minimal unrealized losses with cost/FV at 100.2%.
Senior secured first lien had a cost/FV of 103.9% in fiscal 4Q14 and senior secured notes
were 107.8%. Bear in mind that senior secured notes are a very small 4.5% of the portfolio at fair value but these are experiencing the biggest negative marks against them. For senior secured the percentage losses may be less severe, but these unrealized losses
are $0.50/share while the senior secured notes are $0.07.
Exhibit 4: FV Measurements
Source: Company Reports, National Securities Corporation
As of fiscal 4Q14 Medley had four loans on non-accrual status for a total fair value of $40.3 million; the exact amount of investments ranked 5 in the portfolio. Considering the
ranked 4 bucket is empty it would appear that the grade 4 investments experienced further issues and were placed on non-accrual status. MCC places investments on non-accrual status when they are not current on due payments for a period of 90 days or
when the company believes that they will not be able to collect principal and/or interest as contractually stated.
One of the non-accrual portfolio companies, Water Capital USA, has a $26.9 million par
value and a 7% cash interest rate and 7% PIK. On the fiscal 4Q14 earnings call Medley stated that Water was still accruing PIK despite the investment being ranked 5 and put on non-accrual. Fair value was marked at $18.2 million for an unrealized loss of $8.8 million.
At 7% PIK, the company is effectively recognizing $1.9 million in PIK accrual over the course of a year on this investment despite the company being slated as non-accrual. We
believe this is aggressive and subject to potential reversal in the future which would cause effective yields to take a hit further.

National Securities Corporation Business Development Companies
January 21, 2015 8
Water Capital is 29.7% of the unrealized loss in senior secured first lien which has an aggregate unrealized loss of $29.2 million. There are two ways of looking at the concentration of the unrealized losses. On the one hand, we can look at the portfolio as
having too much risk concentration which pushes up the LGD (loss given default) rate of the portfolio, which essentially means that for each investment that goes sour the overall
portfolio will have a greater aggregate loss. On the other hand, we can just as easily look at this as Medley having to turn around one portfolio company in order to reverse a substantial amount of the problems in its portfolio.
Exhibit 5: Illustrating the Potential Turnaround in Water Capital
Source: Company Reports, National Securities Corporation Estimates While we value BDCs on a NII basis, it is significant to note that fair value marks 1)
impact GAAP NAV, which influences regulatory capital levels and 2) if truly reflective of portfolio performance, give an indication to potential losses the BDC may experience. MCC is focused on generating current income that will be distributed to shareholders
although it still realizes gains and losses on investments and the unrealized gains and losses will still either increase or decrease equity. Thus, even if the investments that are
marked down continue to pay contractual interest and principal as scheduled, negative fair value marks will inhibit the company’s ability to issue equity above NAV and cause D/E to increase.

National Securities Corporation Business Development Companies
January 21, 2015 9
Exhibit 6: Impact of FV Marks on NAV, Leverage, and Returns
Source: Company Reports, National Securities Corporation Estimates
With a 5% decline in the fair value of investments, D/E jumps from 0.71x to 0.78x which severely hampers the company’s ability to raise additional capital as the company is already unable to issue equity above NAV given the heavily discounted multiple the stock
is currently trading at. The uncertainty surrounding the future performance of the investments and impact of fair value marks against NAV is likely weighing on the stock’s
valuation on both a NAV and NII basis. Exhibit 7: Cost/FV, Unrealized Losses, and NAV at Risk
Source: Company Reports, National Securities Corporation

National Securities Corporation Business Development Companies
January 21, 2015 10
Source: Company Reports, National Securities Corporation CURING OR RESTRUCTURING PROBLEM INVESTMENTS COULD PERMIT MEDLEY
TO TRADE AT NAV, COMPLETE ACCRETIVE EQUITY RAISES, AND RESUME STRONG PORTFOLIO GROWTH
The ability to issue equity has been a core pillar of MCC’s capital strategy. While many BDCs tend to issue equity opportunistically to fund investments and reduce leverage
Medley differentiated itself from this traditional method and instead chose to issue equity on a “flow” basis and do it regularly.
Exhibit 8: Share Issuance and NII/share and NAV/share
Source: Company Reports, National Securities Corporation

National Securities Corporation Business Development Companies
January 21, 2015 11
NII was steadily trending up even with decently sizable share issuance but started to falter this past fiscal year as some credit issues arose. MCC’s equity issuance has certainly not been dilutive on a NII basis or necessarily a NAV basis as NAV has declined really from
asset quality issues, not from dilution.
A major criticism of the company has been that management fees are growing, the portfolio is growing, but NII/share and NAV/share are not.
Exhibit 9: Growth in NII, NAV, Investments, and Fees
Source: Company Reports
The above table is, in our opinion, the source of major frustration for many shareholders. We think that investors would award Medley a higher multiple if they take at least some
initiative in addressing what has become a substantial disparity in management fees and performance at the company. A management fee waiver based upon NII/share and/or incentive fees based upon NAV in arrears as opposed to gross assets would indicate to
shareholders that the company is properly structuring its fees and ensuring they are aligned with performance more than portfolio growth.
However, we would like to point out that Medley’s fee structure is really in-line with all of their peers. They really are not doing anything different in terms of base and incentive
fees paid to the advisor. On the fiscal 4Q14 earnings call they received some criticism for the above table (Exhibit 9) and we do believe that fee waivers could go a long way to help
the stock trade at higher multiples given the concerns voiced. Singling out Medley for a fee structure used by the BDC sector in its near entirety is unfair, in our opinion.
Medley earns a significant amount of fee income due to the fact nearly 90% of its originations are direct as opposed to syndicated. Thus MCC is able to retain the economics
of points earned on its debt originations.

National Securities Corporation Business Development Companies
January 21, 2015 12
Exhibit 10: Fee Income
Source: Company Reports, National Securities Corporation
Total fee income as a percentage of total investments is extremely impressive. Medley is
earning a minimum of 228 bps on the portfolio in fees and on average over the past two fiscal years has earned 283 bps. While competition certainly plays a role in determining
Medley’s pricing power as it relates to fees earned upfront and contractual coupons we look at points earned on originations as substantially bolstering NIM through increasing effective yields. It’s clear that as effective yields have come down due to more
competition fees as a percentage of investment income have increased significantly from 16.2% in fiscal 1Q13 to 22.1% in fiscal 4Q14.
Asset quality aside, the shift in fair value mix of the portfolio has not affected effective yield that much. Impressively enough the effective yield has remained relatively stable
but has certainly come down this past quarter. At the end of fiscal 2012 Medley had 46.5% of the portfolio in first lien which increased to 54.6% in fiscal 2013 and then to
60.0% in fiscal 2014. For these same years effective all-in yield was 13.68%, 14.22%, and 13.84%, respectively.

National Securities Corporation Business Development Companies
January 21, 2015 13
Exhibit 11: Investment Mix and All-In Effective Yield
Source: Company Reports, National Securities Corporation
On the on hand, this chart should impress a lot of readers. The all-in effective yield
reflects the true earnings power of the company and is found by annualizing total investment income divided over the average total investments at fair value. Thus even
while the industry faced yield and thus spread compression MCC’s effective yield continued to generally trend upwards. This trended up really until fiscal 3Q14 when it took
the biggest nosedive since the IPO of MCC and fell 199 bps linked quarter-over-quarter (Q/Q). This is most likely due to the significant jump in unrealized losses and non-accruals. We cannot stress enough that if Medley could get a handle on asset quality they
can keep earning impressive yields despite the challenging environment given their direct origination platform.
THE STEEP DISCOUNT TO NAV AND SHAREHOLDER VOTE AGAINST ISSUANCE BELOW NAV LEAD US TO BELIEVE MEDLEY’S PORTFOLIO GROWTH FOR FISCAL
2015 WILL COME FROM A MIX OF DEBT AND CASH ON HAND
As of fiscal 4Q14, MCC’s portfolio had a fair value of approximately $1.26 billion, up significantly from the year prior value of $749.2 million. We anticipate that MCC can increase the portfolio to $1.33 billion by year-end fiscal 2015 and $1.46 billion by year-
end fiscal 2016. Our estimates assume that MCC resumes issuing $55 million of equity (before fees) in fiscal 3Q16 and fiscal 4Q16. We assume that these issuances increase
the share count by approximately 3.7 million shares in each respective quarter.
National Securities Corporation Business Development Companies
January 21, 2015 14
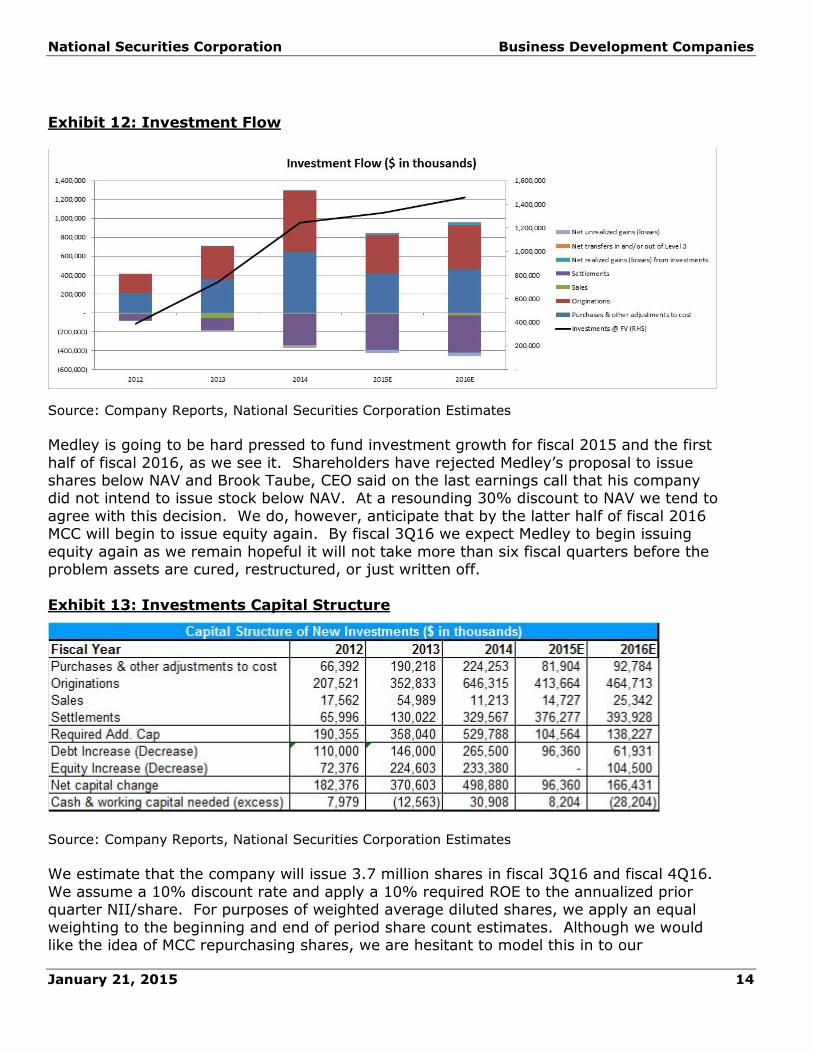
Exhibit 12: Investment Flow
Source: Company Reports, National Securities Corporation Estimates
Medley is going to be hard pressed to fund investment growth for fiscal 2015 and the first
half of fiscal 2016, as we see it. Shareholders have rejected Medley’s proposal to issue shares below NAV and Brook Taube, CEO said on the last earnings call that his company did not intend to issue stock below NAV. At a resounding 30% discount to NAV we tend to
agree with this decision. We do, however, anticipate that by the latter half of fiscal 2016 MCC will begin to issue equity again. By fiscal 3Q16 we expect Medley to begin issuing
equity again as we remain hopeful it will not take more than six fiscal quarters before the problem assets are cured, restructured, or just written off.
Exhibit 13: Investments Capital Structure
Source: Company Reports, National Securities Corporation Estimates
We estimate that the company will issue 3.7 million shares in fiscal 3Q16 and fiscal 4Q16.
We assume a 10% discount rate and apply a 10% required ROE to the annualized prior quarter NII/share. For purposes of weighted average diluted shares, we apply an equal
weighting to the beginning and end of period share count estimates. Although we would like the idea of MCC repurchasing shares, we are hesitant to model this in to our

National Securities Corporation Business Development Companies
January 21, 2015 15
estimates because the Board has not approved a repurchase program and the company will be so capital constrained that we think they would prioritize funding new investments as opposed to returning even more capital as the dividend payout alone remains high
enough.
Exhibit 14: Capital Management
Source: National Securities Corporation Estimates
MCC IS WELL POSITIONED FOR A RISING RATE ENVIRONMENT
MCC’s LIBOR floors are generally between 50 – 150 bps. The company estimates that NII will fall if LIBOR (London Interbank Offer Rate) were to increase less than 200 bps to
reflect this. However, past 200 bps of LIBOR increase the company expects NII to increase overall. As of fiscal 4Q14 the debt portfolio was 77% floating rate, up
substantially from 53% a year prior. As of fiscal 4Q14 MCC’s debt was 61.0% floating rate in the revolver and term loan facility. The remaining 39.0% was comprised 2019 notes, 2023 notes, and SBA debentures. The company paid an effective rate of 6.94% on
its unsecured notes and 3.53% on the SBA debentures. This attractive mix of fixed rate, unsecured debt sets MCC up for a good performance if rates were to rise.
Exhibit 15: Interest Rate Shock
Source: Company Reports

National Securities Corporation Business Development Companies
January 21, 2015 16
Exhibit 16: Select Data and Ratios
Source: Company Reports, National Securities Corporation Estimates
INVESTMENT POSITIVES:
Significant fee income and direct origination
In fiscal 4Q14 89% of MCC’s investments were directly originated and that number is indicative of the normal composition of originations for Medley. Not relying on
broadly syndicated deals enables MCC to retain the economics of direct origination which includes fees attached to the originations as well prepayments, amendments,
administration, etc. Fees as a percentage of average investments have ranged from 228 bps to 350 bps over the past two fiscal years (averaging 283 bps) which we expect to continue as MCC does not rely upon sponsored and club deals to
source investments. MCC has chosen instead to invest in its business and employees, hiring investment/loan officers to source and underwrite potential deals
for the company. While this certainly creates high fixed costs we believe that retaining the fee income is well worth it as it has supported effective all-in yields during a challenging environment dominated by spread compression.
Excellent dividend yield we anticipate MCC will maintain
At the current share price of $8.97 Medley yields over 16.5%. While the NII payout ratio is certainly high at 100% as of the most recent quarter we anticipate the
company can maintain the $0.37/share quarterly dividend while paying out 97% and 95% of NII in 2015 and 2016, respectively. While the cash NII payout is north
of 100%, this has been the case for the past two years and we anticipate the difference will be funded with a mix of capital gains, cash on hand, and debt. While
investors wait for the company to turn itself around they will receive significant dividends as they wait for the full value of MCC to be recognized by the market, in our opinion.

National Securities Corporation Business Development Companies
January 21, 2015 17
MCC is Attractively Valued on a Peer Basis
Our $11 price target implies an estimated 2016 P/NII of 7.1x, dividend yield of
14.4%, and P/NAV of 0.81x compared to the BDC sector averages of 8.8x, 10.9%, and 0.90x, respectively. The economic return is calculated by taking year-end NAV minus the beginning of the year NAV and adding distributions divided by the
beginning of the year NAV. On literally almost every metric Medley is at a steep discount to the peer average. However, the NAV discount is a function of the
substantial and continually growing unrealized losses building up. Unrealized losses are 4.1%, not 20% of NAV and we think the NAV discount is extreme. We are of the belief that MCC will improve nonaccruals and think that the NAV discount is
extreme regardless. The P/NII discount is warranted, however, as we expect a decline in NII/share this year and very anemic growth in fiscal 2016 despite our
expectations that MCC should be able to right the ship and begin a return to their normal business model.
INVESTMENT RISKS:
Inability to issue equity above NAV and high leverage
The primary reason we recommend investors buy Medley is because of the
significant capital constraints the discounted valuation is imposing on the company. MCC has become accustomed to issuing equity on a flow basis to keep leverage in check and adequately fund investment originations. The vote against the proposal
to issue equity below NAV and Mr. Taube’s comments on not intending to issue equity below NAV will essentially force MCC to fund new originations utilizing debt,
cash on hand, and repayment of investments. The company finished fiscal 2014 with D/E of 0.71x and 0.57x excluding SBA debentures for regulatory purposes.
We anticipate that for fiscal 2015 these numbers will be 0.84x and 0.64x, respectively. For 2016 we anticipate D/E of 0.81x and D/E excluding SBA debentures of 0.63x. MCC has stated that their comfort level with leverage is to
have regulatory D/E of between 0.60x – 0.70x. In our view, the company will only breach the upper band of this in fiscal 2Q16 with a regulatory D/E of 0.73x before
our expectations of a $55 million equity raise both fiscal 3Q16 and fiscal 4Q16.
Asset quality
Asset quality is a problem that has just continued to worsen at Medley. The asset quality problems are surprising given the first lien focus and direct origination
platform. Given the portfolio mix and lack of broadly syndicated deals there is no reason for unrealized losses to be 4.1% of NAV. As a result of non-accrual loans building up and the perceived market expectation that this is just a sign of more to
come MCC’s stock trades at a substantial 30% discount to NAV at the current share price. This feeds directly into the investment risk highlighted above and completely
disables MCC’s preferred capital management strategy. Thus, before we can even begin to think about a return to NII and portfolio growth levels MCC has
experienced over the past couple years MCC needs to address the problem investments.

National Securities Corporation Business Development Companies
January 21, 2015 18
External advisor conflict of interest While the vast majority of BDCs are externally managed by an advisor with fee
structures we do not always find palatable we think MCC shareholders are upset with the increase in fees paid to Medley Management, increase in gross assets,
increase in investments, but the decline in NAV and very minimal NII/share growth. We think that regardless of the actual case versus what investors are saying MCC should address this proactively. Medley should implement a base fee waiver based
on NII/share and/or NAV/share and change its incentive fee to be payable based upon NAV in arrears as opposed to gross assets. If MCC were to implement these
two measures we think that any mention of a conflict of interest would go away and in fact MCC would then have less of a conflict than many of their peers. These two measures alone would inspire investor confidence in management and their
priorities, as we see it. We reiterate that Medley doesn’t really have a fee structure different than their peers but we nonetheless feel that given the criticism they are
facing they can deal with this easily simply by implementing some fee waivers.
Other public companies mentioned:
Medley Management Inc. (NYSE:MDLY, Not Rated, $11.20)

National Securities Corporation Business Development Companies
January 21, 2015 19
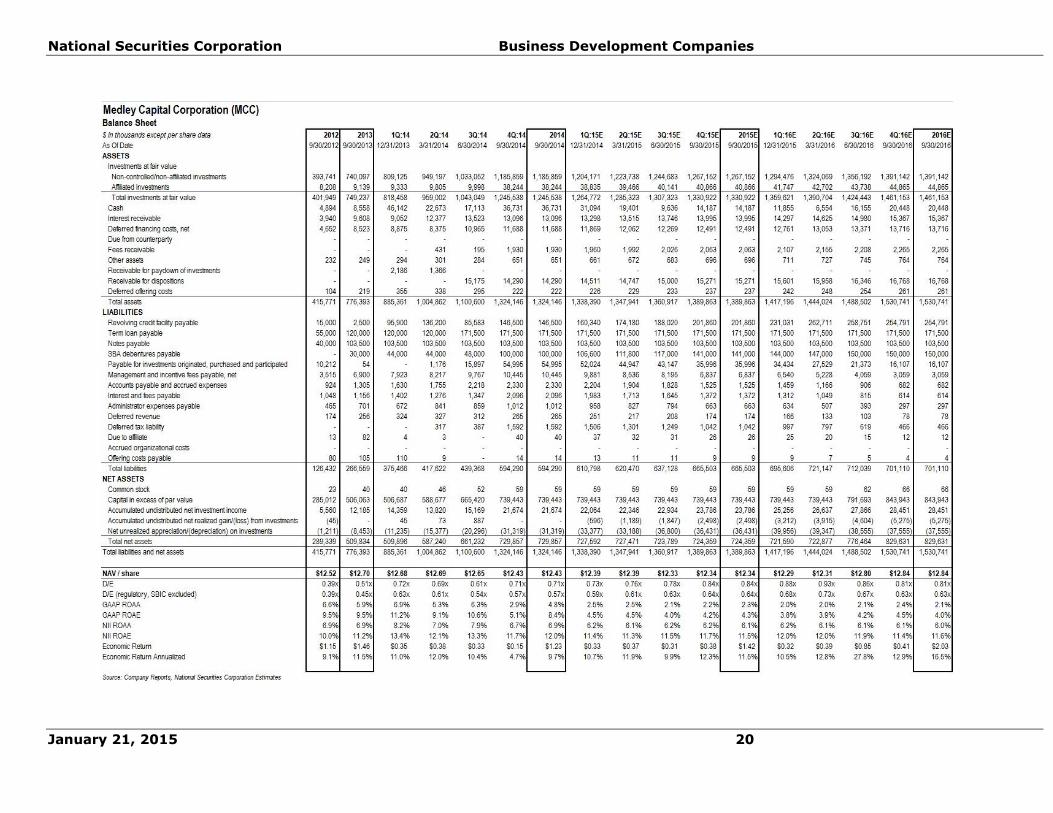
National Securities Corporation Business Development Companies
January 21, 2015 20

National Securities Corporation Business Development Companies
January 21, 2015 21

National Securities Corporation Business Development Companies
January 21, 2015 22
Note: Price/NII reflects consensus NII estimate provided by S&P CapitalIQ
* Price = closing price on 1/20/15
Source: S&P CapitalIQ

National Securities Corporation Business Development Companies
January 21, 2015 23
IMPORTANT DISCLOSURES: National Securities Corporation
410 Park Avenue, 14th Floor, New York, NY 10022
REG AC ANALYST CERTIFICATION
The Estimates analyst named on this report, Christopher Testa, certifies the following: (1) that all of the views expressed in this Estimates report accurately reflect his personal views about any and all of the subject securities or issuers; and (2) that no part of his
compensation was, is, or will be directly or indirectly related to the specific recommendations or views expressed by him in this Estimates report.
IMPORTANT DISCLOSURES
This publication does not constitute and should not be construed as an offer or the solicitation of any transaction to buy or sell any securities or any instruments or any
derivatives of the securities mentioned herein, or to participate in any particular trading strategies. Although the information contained herein has been obtained from recognized
services, and sources believed to be reliable, its accuracy or completeness cannot be guaranteed. Opinions, estimates or projections expressed in this report may make
assumptions regarding economic, industry, company and political considerations, and constitute current opinions, at the time of issuance, which are subject to change without notice.
This report is being furnished for informational purposes only, and on the condition that it will not form a primary basis for any investment decision. Any recommendation(s)
contained in this report is/are not intended to be, nor should it / they construed or inferred to be, investment advice, as such investments may not be suitable for all investors. When preparing this report, no consideration to one’s investment objectives,
risk tolerance and other individual factors was given; as such, as with all investments, purchase or sale of any securities mentioned herein may not be suitable for all investors.
By virtue of this publication, neither the Firm nor any of its employees shall be responsible for any investment decisions. Before committing funds to ANY investment, an investor should seek professional advice. Any information relating to the tax status of financial
instruments discussed herein is not intended to provide tax advice, or to be used by anyone to provide tax advice. Investors are urged to consult an independent tax
professional for advice concerning their particular circumstances. Past performance should not be taken as an indication or guarantee of future performance, and no representation or warranty, either expressed or implied, is made regarding future performance.
National Securities Corporation (NSC) and its affiliated companies, shareholders, officers, directors and / or employees (including persons involved with the preparation or issuance
of this report) may, from time to time, have long or short positions in, and buy or sell the securities or derivatives (including options) thereof, of the companies mentioned herein.
One or more directors, officers, and / or employees of NSC and its affiliated companies, or independent contractors affiliated with NSC may be a director of the issuer of the securities mentioned herein. NSC and / or its affiliated companies may have managed or

National Securities Corporation Business Development Companies
January 21, 2015 24
co-managed a public offering of, or acted as initial purchaser or placement agent for a private placement of any of the securities of any issuer mentioned in this report within the last three (3) years, or may, from time to time, perform investment banking or other
services for, or solicit investment banking business from any company mentioned in this report.
This Estimates may be distributed by affiliated entities of National Securities Corporation (NSC). Affiliated entities of NSC may include, but are not limited to, vFinance Investments, Inc., Equity Station, National Asset Management and other subsidiaries of
our parent company, National Holdings Corporation.
The securities mentioned in this document may not be eligible for sale in some states or
countries, nor be suitable for all types of investors; their value and the income they produce if any, may fluctuate and/or be adversely affected by exchange rates, interest
rates or other factors. Furthermore, NSC may follow emerging growth companies whose securities typically involve a higher degree of risk and more volatility than the securities of more established companies. This report does not take into account the particular
investment objectives, financial situation or needs of individual investors. Before acting on any advice or recommendation in this material, the investor should exercise independent
judgment as to whether it is suitable in light of his/her particular circumstances and, if necessary, seek professional advice. Past performance should not be taken as an indication or guarantee of future performance, and no representation or warranty, express
or implied, is made regarding future performance.
Additional information relative to securities, other financial products, or issuers discussed
in this report is available upon request. Neither this entire report, nor any part thereof, may be reproduced, copied or duplicated in any form or by any means without the prior written consent of National Securities Corporation. All rights reserved. NSC is a member of
both the Financial Industry Regulatory Authority (FINRA) and the Securities Investors Protection Corporation (SIPC).
For disclosures inquiries, please call us at 1-800-417-8000 and ask for your NSC representative, or write us at National Securities Corporation, Attn. Al Scerbo -
Supervision Department, 410 Park Avenue, 14th Floor, New York, NY 10022, or visit our website at www.nationalsecurities.com
Estimates Disclosures Legend
Relevant Disclosures: 2, 4 1 National Securities (NSC) is a market-maker in the securities of the subject
company 2 In the past twelve (12) month period, NSC and / or its affiliates have received
compensation for investment banking for services from the subject company
3 In the past twelve (12) month period, NSC and / or its affiliates have received compensation from the subject company for services other than those related to
investment banking 4 In the past twelve (12) month period, NSC was a manager or a co-manager of a
public offering of one or more of the securities of the issuer
5 In the past twelve (12) month period, NSC was a member of the selling group of a public offering of the security (ies) of the issuer

National Securities Corporation Business Development Companies
January 21, 2015 25
6 One or more directors, officers, and / or employees of NSC and / or its affiliated companies is / are a director (s) of the issuer of the security which is the subject of this report
7 NSC and / or its affiliates expects to receive or intends to seek compensation for investment banking services from the subject company at some point during the
next three (3) months 8 A Estimates analyst or a member of his / her household has a financial interest in
the securities of the subject company as follows: a) long common stock; b) short
common stock; c) long calls; d) short calls; e) long puts; f) short puts; g) long rights; h) short rights; i) long warrants; j) short warrants; k) long futures; l)
short futures; m) long preferred stock; n) short preferred stock 9 As of the end of the month immediately preceding the date of publication of this
report or the end of the prior month if the publication is within ten (10) days
following the end of the month, NSC and / or its affiliates beneficially owned one percent (1%) or more of any class of common equity securities of the subject
company. 10 Please see below for other relevant disclosures
Shares of this security may be sold to residents of all 50 states, Puerto Rico, Guam, the US Virgin Islands and the District of Columbia.
*Investment banking services provided in the previous 12 months
MEANING OF RATINGS:
BUY: the stock is likely to generate a total return of at least 10% over the next 12 months
and should outperform relative to the industry.
BUY: the stock is likely to perform in-line with the industry over the next 12 months.
SELL: the stock is likely to underperform (from a total return perspective) relative to the industry over the next 12 months.
NR: Not Rated
SP: Suspended

National Securities Corporation Business Development Companies
January 21, 2015 26
Charts - MCC
Source: S&P Capital IQ.
MCC Date Rating Price Target
Initiation 1.21.15 BUY $11