
Essays on-geography-gis-vol5
82
Essays on Geography and GIS Volume 5 December 2012
-
Upload
eugenio1958 -
Category
Education
-
view
58 -
download
1
Transcript of Essays on-geography-gis-vol5
Essays on Geography and GISVolume 5
December 2012

2Essays on Geography and GIS, Volume 5 December 2012
Table of Contents
3 The Power of the Map
6 Geography: A Platform for Understanding
9 A Business Plan for the Planet
13 Geoliteracy: So What?
15 Quo Vadimus?
18 GIS and The City 2.0
22 Strengthening the GIS Profession
31 URISA at 50
35 Sustainability in Africa
44 The Geoscape: A New Canvas for Understanding
47 Unlocking the Educational Potential of Citizen Science
50 Thinking Outside the Map
53 Place-Based Knowledge in the Digital Age
62 Can Geodesign Help Us Adapt to Climate Change?
65 Break-the-Mold Approaches to Geography Learning
68 Monitoring Our Planetary Pulse
72 Geo-Education: Preparation for 21st-Century Decisions
74 The 50th Anniversary of GIS
77 Origins of the Canada Geographic Information System
3The Power of the MapEssays on Geography and GIS, Volume 5 December 2012
The Power of the MapBy John Calkins, Esri
Maps mean different things to different people. So what is a
map?
My definition is simple: a map is an answer to a question.
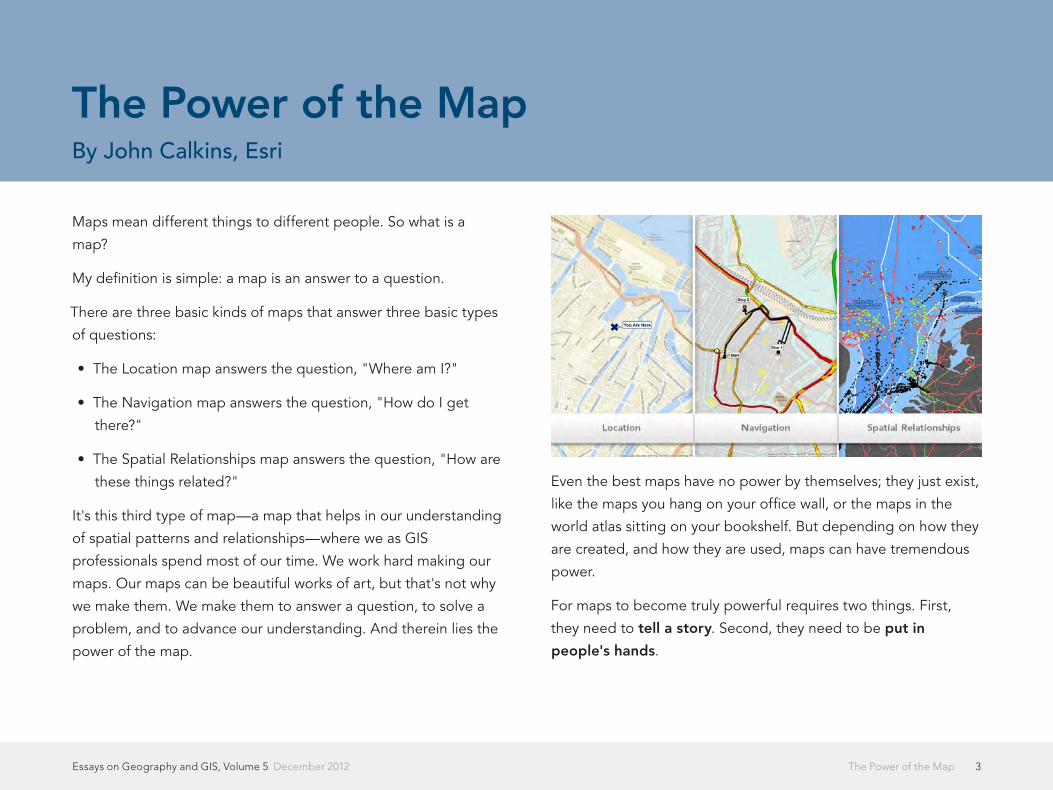
There are three basic kinds of maps that answer three basic types
of questions:
• The Location map answers the question, "Where am I?"
• The Navigation map answers the question, "How do I get
there?"
• The Spatial Relationships map answers the question, "How are
these things related?"
It's this third type of map—a map that helps in our understanding
of spatial patterns and relationships—where we as GIS
professionals spend most of our time. We work hard making our
maps. Our maps can be beautiful works of art, but that's not why
we make them. We make them to answer a question, to solve a
problem, and to advance our understanding. And therein lies the
power of the map.
Even the best maps have no power by themselves; they just exist,
like the maps you hang on your office wall, or the maps in the
world atlas sitting on your bookshelf. But depending on how they
are created, and how they are used, maps can have tremendous
power.
For maps to become truly powerful requires two things. First,
they need to tell a story. Second, they need to be put in
people's hands.

4The Power of the MapEssays on Geography and GIS, Volume 5 December 2012
Telling Stories
Almost anyone can publish a map or spatial data, or put dots
on a map, or create a cool web mapping app. But today we
are seeing a shift to the desire and the need to communicate
more effective stories, not just the data. We need the rest of the
message beyond the data on the map. We need to craft these
maps into more useful information products. Because maps only
have power when they tell a story.
A map represents geographic data and includes other features,
such as annotation, legends, and pop-ups, to help us understand
the map. The next step is adding a new feature to this list:
narratives. We need to turn our maps into storytelling devices. A
map that tells a story doesn't simply answer a question or solve
a problem; it's a map with a definite purpose, a direction, and a
message: it's a map that can drive action.
Create a map that tells a story, and you've created a much more
powerful map. But once you've done that, how do you put your
map—your story—in the hands of the people that will use it to
create a better world?
Power in Your Hand
We often make maps, but are they reaching the right people?
Our colleagues, the decision makers, the public? Others who can
collaborate with us?
Maps only have power when we put them in the hands of people.
GIS has traditionally been a back-office technology, and many of
the maps created by GIS professionals only reach the hands of a
few people. But all that is changing, and it's changing very rapidly.
What is changing is how we put maps in the hands of the people.
Do you remember how maps used to be shared? You would print
out your map on a giant color plotter, roll up the paper map, and
hand it to someone. It wasn't the most effective way of leveraging
the full power of all your hard work.
Today, thanks to advances in computing and geospatial
technologies, you have a much wider variety of options available
for extending the reach of your map. For example, you can now
put your map in a web app. Or you can put it on a mobile device.

5The Power of the MapEssays on Geography and GIS, Volume 5 December 2012
This evolution is changing the discussion; it's changing how we
interact among ourselves, our organization, and the much larger
world.
Power to the People
Gone are the days when information was inaccessible; when our
maps were difficult to create, and even more difficult to share.
Be it your coworkers, your constituents, or your fellow world
citizens, today almost anyone can use your map from practically
anywhere. They can use it to be more productive, make better
decisions, and help others. They can use it to make the world a
better place.
Now that's what I call power.
(This blog post originally appeared October 9, 2012, in Esri Insider.)
Thanks to the rise of mobile computing, today almost anyone can use your map from practically anywhere.

6Geography: A Platform for UnderstandingEssays on Geography and GIS, Volume 5 December 2012
At the Esri International User Conference this summer, I shared
the context that GIS professionals are working in today: living on
a small planet; breathing the same air and becoming increasingly
concerned about our future—our personal future, the future
of our families and communities, even the future of life on the
planet. The evidence suggests that our world is changing rapidly,
with many trends that will be challenging for us personally and
our organizations for the rest of our lives.
At the same time, we are living in an amazing time when scientific
discovery and technological advancement are accelerating
dramatically. We are making huge scientific discoveries and
creating unfathomable volumes of data in the process. But these
advances and the simple volume of data aren't enough. Clearly
we need more integrated knowledge and ways to be able to
make better decisions and create better outcomes. We need to
harness our technology and our brainpower to create a more
sustainable future.
Geography
The role of geography is a platform for understanding the
world. GIS is making geography come alive. It condenses our
data, information, and science into a language that we can easily
understand: maps.
These maps help us integrate and apply our knowledge. The
same maps tell stories—stories about almost everything in our
world. We need to better harness the power of GIS maps to
engage everyone, telling the stories of what's happening to the
Geography: A Platform for UnderstandingBy Jack Dangermond, Esri
Jack Dangermond speaking at the 2012 Esri International User
Conference. Watch his opening talk.

7Geography: A Platform for UnderstandingEssays on Geography and GIS, Volume 5 December 2012
world and creating maps that create a better future, a future with
better outcomes.
I'm increasingly confident that our GIS community will do
this. One reason is that GIS itself is advancing; it's getting
more powerful and easier to use. It's evolving with lots of new
capabilities. It's also moving to a new web/cloud based platform;
one that will make GIS pervasive. GIS will evolve to a new level,
creating "geography as a platform."
Reimagining Our World
This new platform allows geographic knowledge to be widely
shared, enabling widespread access and use of GIS.
At the same time, other trends, such as widespread measurement,
big data, and ubiquitous computing, are advancing rapidly,
including Software as a Service computing, device computing
with lightweight and locationally aware applications, as well as
supporting scientific exploration and innovation.
The convergence of GIS with these trends will enable us to
integrate geographic knowledge into everything we do.
This new pattern integrates all types of geographic information—
maps, data, imagery, social media, crowdsourced information,
sensor networks, and much more.
Cloud GIS enables ubiquitous access and integrates the
traditional work of geospatial professionals with a whole new
world of GIS applications. It takes what have been relatively
scarce commodities—stories and actionable geoinformation—
and makes them abundant. Web maps provide the medium for
integration and understanding and make this information widely
accessible in simple forms. This widespread, easy access to
geographic knowledge is what we mean by providing geography
as a platform for understanding.Cloud GIS enables pervasive access, integrating traditional GIS with a whole new world of applications.

8Geography: A Platform for UnderstandingEssays on Geography and GIS, Volume 5 December 2012
A New Pattern
This new pattern breaks down the barriers between different
workflows and disciplines and brings them together. This will
enable us to better collaborate and share, as well as approach
problem solving and decision making more holistically.
We are already starting to see organizations rapidly adopt this
new pattern. The European Environment Agency, the United
Nations Environment Programme, the World Bank, and many
United States government agencies are adopting it. They are
using cloud computing to support their own mission and, at the
same time, sharing their knowledge with others. By sharing their
geospatial knowledge in common cloud environments, they are
creating a new kind of spatial data infrastructure.
Enabling the Platform
The sharing of geospatial knowledge will open our world and
create a new level of understanding. As more organizations
embrace this idea and adopt a culture of collaboration and
sharing, the GIS community will benefit greatly. GIS practitioners
will be able to do their work better and elevate the role of GIS in
our organizations.
Our work at Esri is about enabling our users to do their important
work. We take that responsibility very seriously. I thank you for
entrusting us to do that.
(This article originally appeared in the Fall 2012 issue of ArcNews.)
Cloud GIS changes the discussion, breaking down barriers between workflows, disciplines, and cultures.
9A Business Plan for the PlanetEssays on Geography and GIS, Volume 5 December 2012
The World Bank, a cooperative of
187 member countries, provides
financial and technical assistance
to developing countries around the
world to help reduce poverty.
Conventional governance methods
can't cope with the speed and
scale of the technological, social,
and environmental changes
sweeping the world. Governments
and international development
organizations have to adopt a more
holistic approach to the challenge—
in essence, to draw up a "business plan for the planet."
Such a plan would require a comprehensive redesign of economic
policies, broadening the way we calculate national products
and services. It would include a more comprehensive form of
wealth accounting that puts quantifiable values on natural capital
and ecosystem services. The least developed countries need
investment flows to speed up green and inclusive growth, while
middle-income countries need to shift the pattern of their growth
with resource efficiency and inclusivity at the fore. The developed
world needs to play its part by shrinking the footprint caused by
inequity and resource inefficiency. It's a global business plan for a
multispeed world.
This can only be achieved with better data and, more important,
the better application and use of that data. Data without purpose
is clutter. We have learned over 65 years of serving our clients
that, to be effective, development programs must be based on
firm evidence and driven by reliable data.
Since the first Earth Summit in Rio de Janeiro 20 years ago,
the debate on sustainable development has shifted focus to
the sustainability of growth. Growth is essential for poverty
eradication, but for growth to be sustainable, it needs to be
greener and more inclusive.
Climate change threatens to undo much of what we've
accomplished for the poorest and most vulnerable in developing
countries and sharpens the need for integrated solutions across
the economy. We calculate that climate change is already costing
Africa 5 percent of its gross domestic product (GDP) growth
per year. The need to find solutions that improve food security,
provide energy access, balance water supply and demand, can
A Business Plan for the PlanetBy Rachel Kyte, World Bank

10A Business Plan for the PlanetEssays on Geography and GIS, Volume 5 December 2012
cope with rapid urbanization, and bring climate adaptation to the
fore demand lateral thinking and planning.
With these challenges, no country can afford the luxury of not
empowering its most significant market and productive sector:
women. In some countries in Africa, women compose the
majority of small farmers and business owners, but access only
about 5 percent of the bank credit. Underinvesting makes no
sense.
The good news is that technology exists to enable more
evidence-based, data-driven development. Technology is
evolving rapidly, and data is becoming more accessible.
Technology can become a source of empowerment that improves
and strengthens growth programs through popular engagement.
We at the World Bank value open, accessible data and believe in
its effectiveness. We have seen that it can help reduce poverty,
restore ecosystems, and generate growth. Of key importance,
though, is how data is collected; who keeps, analyzes, and shares
it; and how this is done. At the bank, one of the most important
tools for collecting, applying, and sharing data is GIS.
We have used GIS operationally since the early 1980s. Many
teams are using and developing GIS tools and maps for a wide
range of applications including assessing the viability of current
development projects or the location of planned ones. A map
might show human settlement densities in a country relative to its
clinics, hospitals, and schools to indicate areas of greatest need.
A map could also be used to ascertain that there are sufficient
service roads in the right places. Or a map could help determine
how many people are at risk from flooding or earthquakes.
Projects benefiting from such spatial analyses include the bank's
Climate Change Knowledge portal. In addition, the bank's spatial
development infrastructure team has set up a high-priority rapid-
mapping service for its natural disaster risk management situation
room. A series of 49 interactive, country profile maps shows
World Bank makes its extensive data holdings readily available through maps on ArcGIS Online.

11A Business Plan for the PlanetEssays on Geography and GIS, Volume 5 December 2012
climate change priorities. The bank also performs urban growth
analysis for more than 100 cities worldwide using remote sensing.
The World Bank Institute's Innovation Team has geocoded and
mapped more than 30,000 geographic locations for more than
2,500 bank-financed projects worldwide under its Mapping
for Results initiative. All new World Bank projects are now
georeferenced to ensure that development planners can track
and deliver resources more efficiently and effectively and avoid
work duplication. Since the data is publicly accessible, it also
empowers citizens to follow the progress of projects and service
delivery in their countries.
The bank's Development Research Group uses GIS methods
extensively to carry out policy research and provide support to
bank operations. As part of its environmental policy research,
the bank uses overlay mapping techniques to track the spatial
distribution of potential environmental impacts and calculate the
probable effects of climate change.
In our Global Facility for Disaster Reduction and Recovery
(GFDRR), geospatial risk assessments are central to the World
Bank's disaster reduction strategy. The bank does not engage
directly in disaster response but focuses on risk reduction. In
the event of a disaster, we do assist humanitarian agencies and
postdisaster reconstruction (as in Haiti after the January 2010
earthquake). GFDRR has identified 31 priority countries deemed
most at risk of disasters. The GFDRR lab has magnified its impact
by inviting specialists in GIS and related fields to help map risk
profiles in these countries under the Open Data for Resilience
program.
Meanwhile, many countries are turning to GIS for planning
and service delivery. Ghana is using GIS to map its extractive
industries and assess their economic value. Jamaica has
embraced the technology for similar reasons. Mali is using GIS
to help adapt to the challenges of climate change. GIS has also
The World Bank launched the interactive Mapping for Results (M4R) platform in October 2010 which visualizes the location of World Bank projects to better monitor projects and their impact on people, enhance transparency and social accountability, and enable citizens and other stakeholders to provide direct feedback. View this map on ArcGIS Online.
12A Business Plan for the PlanetEssays on Geography and GIS, Volume 5 December 2012
helped revitalize Rwanda's coffee-growing industry. The value
of GIS in poverty reduction was thoroughly explored in the
World Development Report 2009 entitled Reshaping Economic
Geography.
Cost was a major inhibitor in the early use of GIS. But, as the
technology has become more affordable and commercially
available, its use has expanded exponentially. Many proprietary
technologies that used to be prohibitively expensive are now
open source. The World Bank itself has opened many of its data
banks to public access. It is crucial for the sustainability of GIS
that its data is not lost but becomes permanently incorporated
into national and international operations as spatial data
infrastructure.
To an increasing degree, governments, aid agencies, and
commercial enterprises are joining forces around GIS technology,
particularly on issues, such as climate change, that are too
big and complex for any one institution to handle. The World
Bank recently entered into a partnership with the European
Space Agency to incorporate satellite data—under the rubric
Earth Observation for Development—into the bank's lending
operations in sustainable development.
Collaborations such as these are bound to grow as more
organizations tap into the power of GIS. This will bring the data
necessary for a business plan for the planet one step closer to
reality.
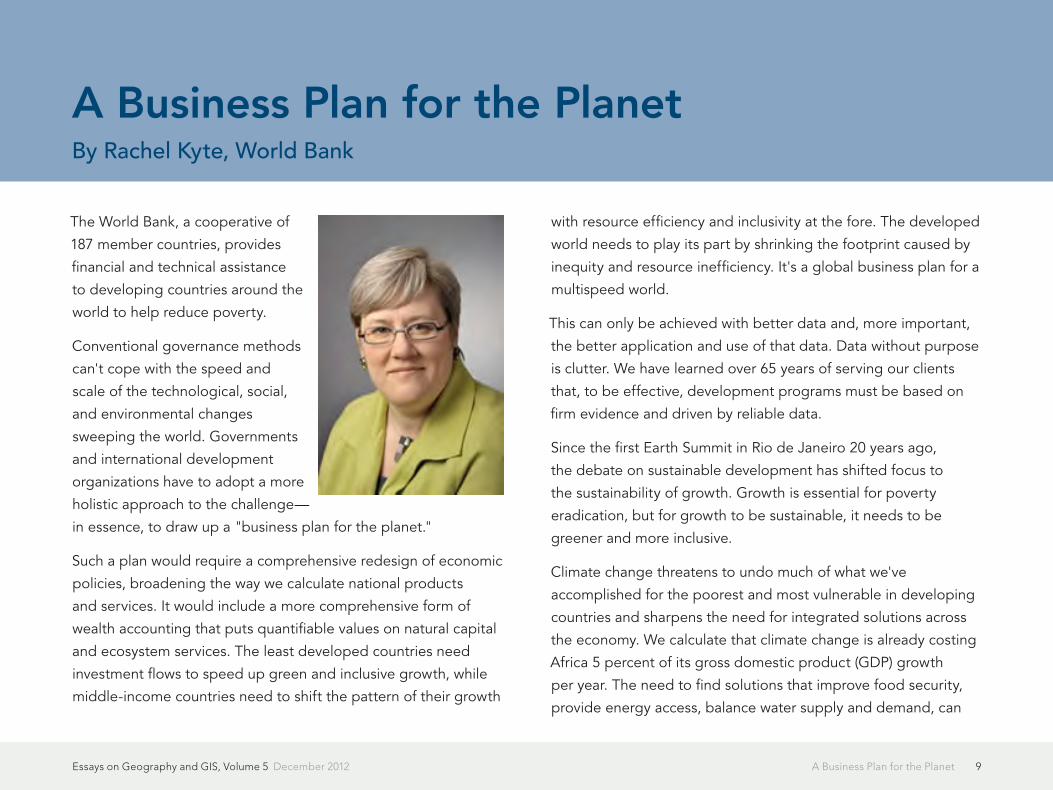
About the Author
Rachel Kyte is the vice president for sustainable development at
the World Bank.
(This article originally appeared in the Spring 2012 issue of ArcUser.)
13Geoliteracy: So What?Essays on Geography and GIS, Volume 5 December 2012
Trooping into my room on the first day of school, my 8th grade
geography classes would look above the board and see a sign:
Geography is:
1. What's where?
2. Why is it there?
3. So what?
I would tell them that they didn't need to know a lot of facts
for my class; primarily they needed thinking skills. They would
build up their background knowledge by exercising those skills
endlessly. We quickly began exploring.
Their growing background knowledge and thinking skills would
allow them to answer the first and second questions. But to
answer the third question they needed to always be alert, not
just "go through the day." They needed to be attentive wherever
they were, look for patterns and relationships at various scales,
and pay attention to what they heard adults talking about, as
well as what they saw/heard/read in the news. I told them it was
okay to ask "So what?" in class, any time they wanted, and such
diversions happened often.
True literacy—about words, numbers, graphics, personal finance,
social relationships, etc.—means more than simply reciting
facts and rules committed to memory. It means being able to
understand situations and relationships, and handle questions
not previously encountered—and to do so with increasing
sophistication.
For geographic literacy, or "geoliteracy," this means far more
than knowing the states and capitals in the US or the directions
around a compass. Such facts are handy, for sure, but insufficient
by themselves.
So what does geoliteracy mean?
• It means being able to detect patterns that vary across space,
and to understand how phenomena in one place and time
relate to other phenomena.
• It means looking at a map, a classroom, or an athletic field
and seeing patterns with similar clarity.
• It means looking at a label on a piece of clothing and
understanding how an item made in a distant land might
have gotten to this location, and being able to describe some
possible related conditions and effects of such a journey.
Geoliteracy: So What?By Charlie Fitzpatrick, Esri

14Geoliteracy: So What?Essays on Geography and GIS, Volume 5 December 2012
• It means understanding how different groups might see and
describe the value of a specific tree, a species, or an ocean
differently.
• It means looking at a billboard next to a vacant lot on the
way home from school and being able to describe some of
what "Future home of BigBox SuperStore" might mean to the
community beyond just one less place to play catch.
• It means hearing a discussion about labor, economy, local
resources, and global patterns, and being able to talk about
what different sides might value.
• It means carefully choosing which ideas to support and
discard, and knowing how to learn about new things,
including deciding why certain bits of information might be
more appropriate than others.
Geoliteracy helps people to navigate through life and to cope
with overlapping and often competing information and values,
at scales from micro to cosmic. It means being able to describe
for new situations "what's where," postulate "why it's there,"
and being interested enough to wonder and skilled enough
to resolve "so what." Geoliteracy fosters skills in managing
disparate information about complex problems. And this is
exactly what employers are seeking today—workers accustomed
to thinking critically, learning insatiably, collaborating naturally,
and using technology to analyze and integrate more efficiently
and powerfully. Geoliteracy opens doors to a better future for
individuals, communities, and the planet.
(This blog post originally appeared October 29, 2012, in Esri Insider.)
Things are different between "here" and "there." Geoliteracy helps people understand the world and helps students see relationships.
15Quo Vadimus?Essays on Geography and GIS, Volume 5 December 2012
Quo Vadimus?By Brian J. L. Berry, University of Texas, Dallas
Where are we going?
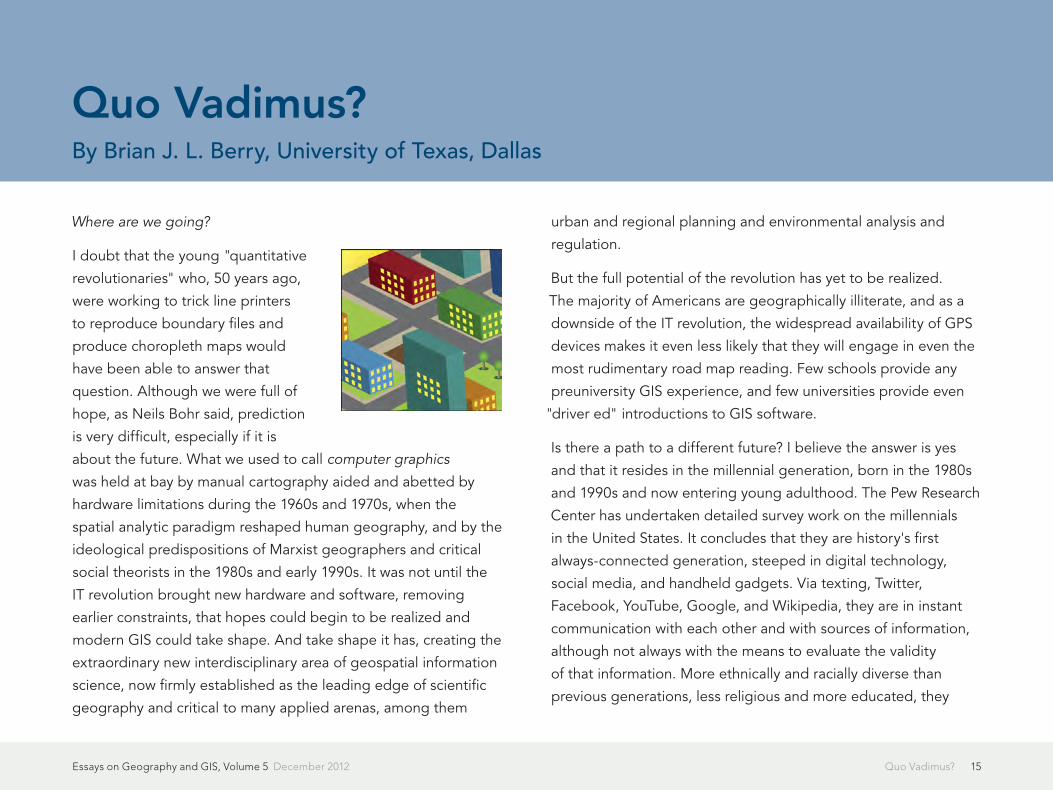
I doubt that the young "quantitative
revolutionaries" who, 50 years ago,
were working to trick line printers
to reproduce boundary files and
produce choropleth maps would
have been able to answer that
question. Although we were full of
hope, as Neils Bohr said, prediction
is very difficult, especially if it is
about the future. What we used to call computer graphics
was held at bay by manual cartography aided and abetted by
hardware limitations during the 1960s and 1970s, when the
spatial analytic paradigm reshaped human geography, and by the
ideological predispositions of Marxist geographers and critical
social theorists in the 1980s and early 1990s. It was not until the
IT revolution brought new hardware and software, removing
earlier constraints, that hopes could begin to be realized and
modern GIS could take shape. And take shape it has, creating the
extraordinary new interdisciplinary area of geospatial information
science, now firmly established as the leading edge of scientific
geography and critical to many applied arenas, among them
urban and regional planning and environmental analysis and
regulation.
But the full potential of the revolution has yet to be realized.
The majority of Americans are geographically illiterate, and as a
downside of the IT revolution, the widespread availability of GPS
devices makes it even less likely that they will engage in even the
most rudimentary road map reading. Few schools provide any
preuniversity GIS experience, and few universities provide even
"driver ed" introductions to GIS software.
Is there a path to a different future? I believe the answer is yes
and that it resides in the millennial generation, born in the 1980s
and 1990s and now entering young adulthood. The Pew Research
Center has undertaken detailed survey work on the millennials
in the United States. It concludes that they are history's first
always-connected generation, steeped in digital technology,
social media, and handheld gadgets. Via texting, Twitter,
Facebook, YouTube, Google, and Wikipedia, they are in instant
communication with each other and with sources of information,
although not always with the means to evaluate the validity
of that information. More ethnically and racially diverse than
previous generations, less religious and more educated, they
16Quo Vadimus?
are more culturally liberal than their generation X parents and
embrace multiple modes of self-expression using the new media,
valuing a wide range of lifestyle choices.
Importantly, they are among the one-fourth of US Internet users
who play games on social networks (a segment that is growing).
The potential of online social gaming has, I believe, yet to be
realized by geospatial analysts. Observers of the "serious gaming"
industry argue that new generations of games, particularly
what they call "life-and-style" games, "games-for-change,"
and "behavior change" games, have the potential to attract
participants to work on real-world problems and craft potential
solutions. Tens of millions of players have been attracted to
Zynga's Cityville and Farmville games, managing small cities or
virtual farms, proceeding from level to level via collaborative
development activities. The fun is in the gaming; the opportunity
comes in focusing on real problems in real places rather than on
virtual worlds. It is the real place component that carries with it
the means to counter geographic illiteracy.
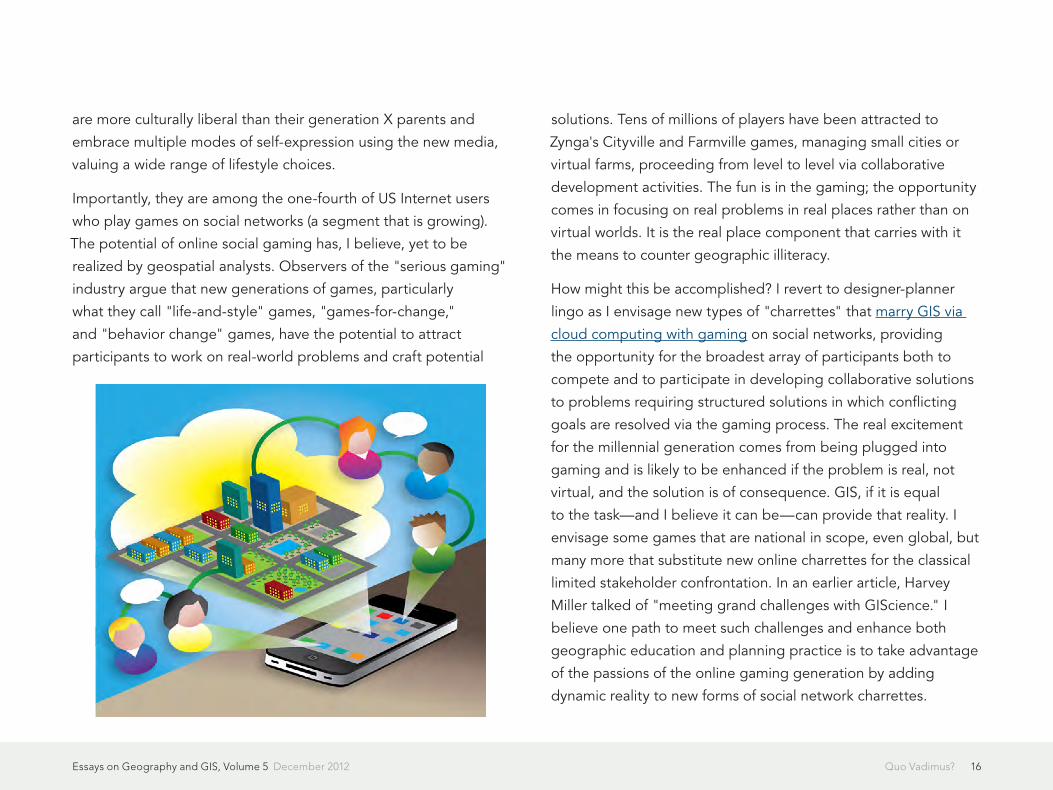
How might this be accomplished? I revert to designer-planner
lingo as I envisage new types of "charrettes" that marry GIS via
cloud computing with gaming on social networks, providing
the opportunity for the broadest array of participants both to
compete and to participate in developing collaborative solutions
to problems requiring structured solutions in which conflicting
goals are resolved via the gaming process. The real excitement
for the millennial generation comes from being plugged into
gaming and is likely to be enhanced if the problem is real, not
virtual, and the solution is of consequence. GIS, if it is equal
to the task—and I believe it can be—can provide that reality. I
envisage some games that are national in scope, even global, but
many more that substitute new online charrettes for the classical
limited stakeholder confrontation. In an earlier article, Harvey
Miller talked of "meeting grand challenges with GIScience." I
believe one path to meet such challenges and enhance both
geographic education and planning practice is to take advantage
of the passions of the online gaming generation by adding
dynamic reality to new forms of social network charrettes.
Essays on Geography and GIS, Volume 5 December 2012
17Quo Vadimus?Essays on Geography and GIS, Volume 5 December 2012
About the Author
Brian J. L. Berry is the Lloyd Viel Berker Regental Professor in the
School of Economic, Political and Policy Sciences at the University
of Texas, Dallas (UTD). One of geography's earliest mid-1950s
quantitative revolutionaries, he has been an active participant in
the development of spatial analysis and GIScience ever since. A
member of the National Academy of Sciences and a fellow of the
American Institute of Certified Planners, he headed Harvard's
Laboratory for Computer Graphics and Spatial Analysis from 1976
to 1981. Recently, he helped craft UTD's pioneering PhD program
in geospatial information science.
(This article originally appeared in the Spring 2012 issue of ArcNews.)

18GIS and The City 2.0Essays on Geography and GIS, Volume 5 December 2012
Seven billion. That number has received a lot of attention recently
as the global population has grown past this mark. But lost in
the media coverage of this milestone was another, perhaps
even more fascinating, global statistic: more than 50 percent of
those 7 billion people now live in cities, a number projected to
grow to more than 75 percent during this century. In fact, there
will be at least 19 cities in the world with a population greater
than 20 million people by the end of the 21st century. Cities are
human destiny.
This growing recognition of cities as the center of the human
world was further highlighted when The City 2.0 was awarded
the 2012 TED Prize. "For the first time in the history of the prize,
it is being awarded not to an individual but to an idea," the
Technology/Entertainment/Design (TED) committee stated. "It is
an idea upon which our planet's future depends."
Clearly, cities will play an increasingly important role in our
survival. Cities offer easier access to services, and urban dwellers
are more efficient consumers of limited resources. But as our
cities become more populated and more numerous, how do we
best manage this complexity?
We need to start thinking about cities in a different way.
Reimagining the Canvas
Fundamental to changing the way we think about cities is a
reimagining of the way we abstract them. Maps are abstractions
of geography and have proved to be particularly useful
throughout our history. But traditional maps have limited our
ability to manage and design in a holistic, comprehensive manner.
GIS technology has given us a powerful new context for
extending our traditional methods of abstracting geography—a
new canvas that includes everything that lies below, on, above,
and around the city, including what exists inside and outside
buildings, as well as how things connect to the city and how all
these things change through time.
Cities as Ecosystems
Cities are the places where most of us now spend the vast
majority of our lives. They have in fact become man-made
ecosystems—vast assemblages of interdependent living and
nonliving components—the primary habitat for the human
species.
GIS and The City 2.0By Jack Dangermond, Esri

19GIS and The City 2.0Essays on Geography and GIS, Volume 5 December 2012
The recognition of cities as a habitat for modern man is leading
to new approaches to their management and design. GIS
technology has long been used to map, study, analyze, and
manage natural ecosystems. It only seems logical to manage,
model, and design our new man-made ecosystem with the same
tried-and-true tools used for traditional ecosystems.
Buildings as Microcities
As our cities are growing in size and complexity, so too are
the buildings that compose much of the fabric of the city. In
effect, many buildings and facilities are becoming small cities
themselves, and they need to be designed and managed as such.
GIS tools, used successfully for many years in fields such as
environmental analysis and landscape planning, also support a
broad range of applications inside and outside buildings and
facilities. In fact, GIS can be used throughout the life cycle of a
facility—from siting, design, and construction through ongoing
use, maintenance, and adaptation, ultimately through closing,
repurposing, and reclamation.
An Engaged Citizenry
Smart cities of the future will be those where the citizenry is
engaged in city design and evolution, where we fully leverage
the collective intelligence of the masses and allow everyone
to actively participate in shaping our communities. Today,
social media and mobile citizen engagement applications are
enhancing a variety of government-citizen interactions involving
public information, requests for service, public reporting, citizens
as sensors, unsolicited public comment, and even volunteerism.
Geospatial technologies have already proved to be effective
tools in supporting citizen engagement. Intelligent web maps are
acknowledged as a catalyst for solving key challenges in creating
a dialog through informed citizens. As web- and cloud-based GIS
continues to evolve and social media and mobile devices become
more pervasive, governments will continue to deliver innovative
Tall structures can have a huge shadow impact on a city, as modeled here in CityEngine.
20GIS and The City 2.0Essays on Geography and GIS, Volume 5 December 2012
forums through interactive information and participatory citizen
applications.
Designing The City 2.0
Geography is constantly changing—from wind and water erosion,
natural climate shifts, tectonic and volcanic activity, and the
dominance and extinction of species and ecosystems. But recent
changes to geography as a direct result of human activities are
threatening the survival of many species, including our own.
And while the actions causing these monumental changes are
often deliberate, much of the change to geography has been
an unintentional by-product of poor planning and unsustainable
actions—change that I call accidental geography.
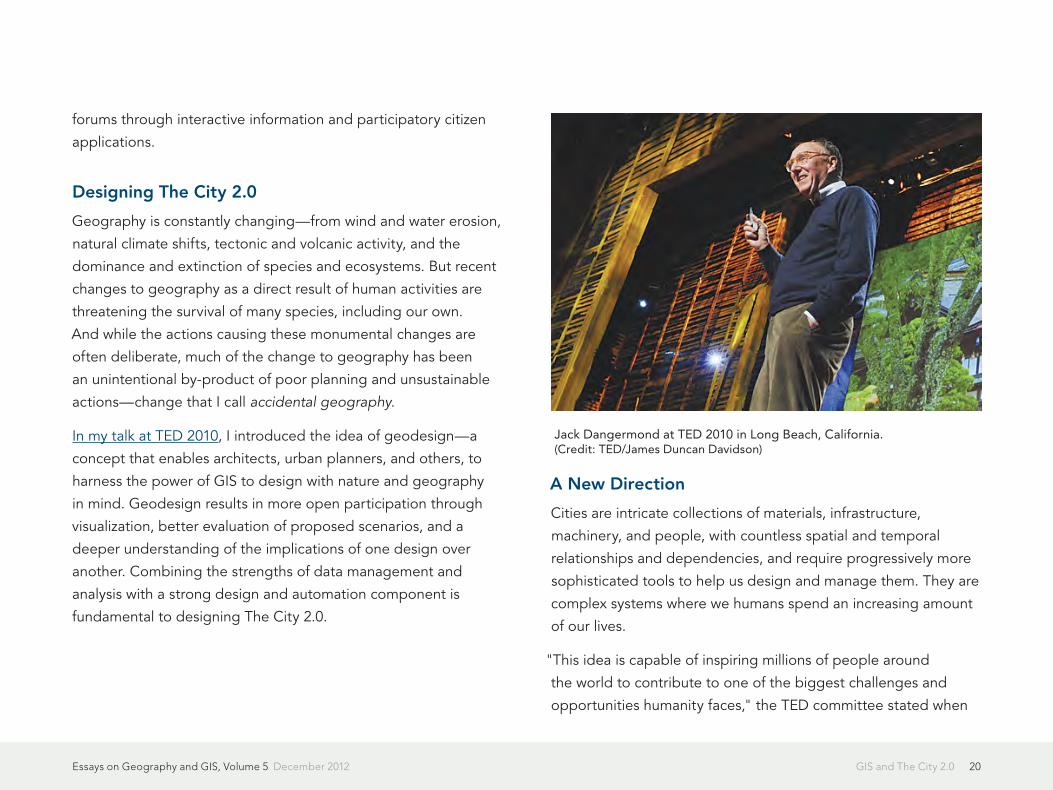
In my talk at TED 2010, I introduced the idea of geodesign—a
concept that enables architects, urban planners, and others, to
harness the power of GIS to design with nature and geography
in mind. Geodesign results in more open participation through
visualization, better evaluation of proposed scenarios, and a
deeper understanding of the implications of one design over
another. Combining the strengths of data management and
analysis with a strong design and automation component is
fundamental to designing The City 2.0.
A New Direction
Cities are intricate collections of materials, infrastructure,
machinery, and people, with countless spatial and temporal
relationships and dependencies, and require progressively more
sophisticated tools to help us design and manage them. They are
complex systems where we humans spend an increasing amount
of our lives.
"This idea is capable of inspiring millions of people around
the world to contribute to one of the biggest challenges and
opportunities humanity faces," the TED committee stated when
Jack Dangermond at TED 2010 in Long Beach, California. (Credit: TED/James Duncan Davidson)

21GIS and The City 2.0Essays on Geography and GIS, Volume 5 December 2012
announcing the award of the 2012 TED Prize. "The City 2.0 is not
a sterile utopian dream but a real-world upgrade tapping into
humanity's collective wisdom."
Our challenge is to design our man-made ecosystems to achieve
the maximum benefit to society while minimizing short- and
long-term impacts on the natural environment. As an integrative
platform for management and analysis of all things spatial, I
believe that GIS technology can help meet this challenge.
Cities are our new man-made ecosystems, and it's time we start
to think about them, manage them, and design them as such.
(This article originally appeared in the Spring 2012 issue of ArcNews.)
22Strengthening the GIS ProfessionEssays on Geography and GIS, Volume 5 December 2012
Is GIS a profession? If so, what's its
relationship to other professions in
the geospatial field? How can you tell
if someone who calls herself a GIS
professional—or a GIS educator for that
matter—knows what she's doing? You
might be surprised to learn that these
are contentious questions in the United
States and other parts of the world. They're contentious because
the demand for GIS work has surpassed the demand for other
kinds of geospatial work, despite the fact that GIS is a relatively
new branch of the field. The rightful roles and qualifications of
GIS pros are in dispute, and there's competition for who gets to
decide.
Do you consider yourself a GIS professional? Or are you thinking
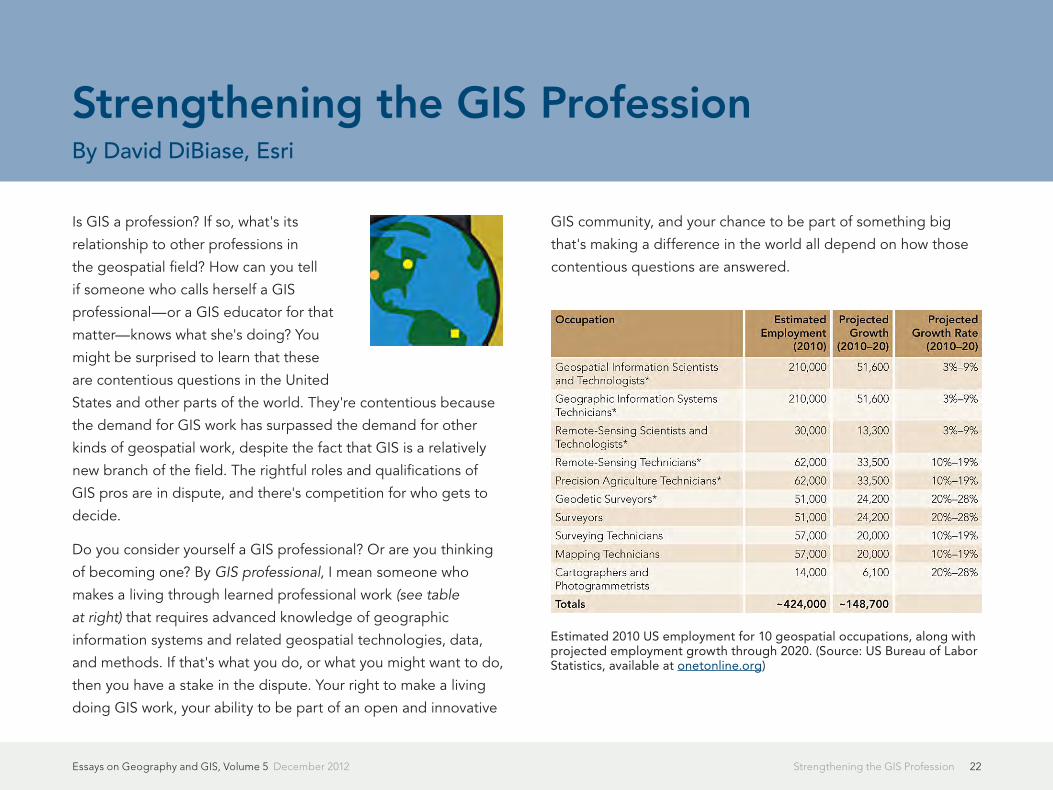
of becoming one? By GIS professional, I mean someone who
makes a living through learned professional work (see table
at right) that requires advanced knowledge of geographic
information systems and related geospatial technologies, data,
and methods. If that's what you do, or what you might want to do,
then you have a stake in the dispute. Your right to make a living
doing GIS work, your ability to be part of an open and innovative
GIS community, and your chance to be part of something big
that's making a difference in the world all depend on how those
contentious questions are answered.
Strengthening the GIS ProfessionBy David DiBiase, Esri
Estimated 2010 US employment for 10 geospatial occupations, along with projected employment growth through 2020. (Source: US Bureau of Labor Statistics, available at onetonline.org)
23Strengthening the GIS ProfessionEssays on Geography and GIS, Volume 5 December 2012
I've been interested in the professionalization of GIS work since
Bill "Hux" Huxhold and others raised these questions in the
1990s. Hux was, and is, a respected member of the GIS old guard.
With his piercing blue eyes and close-cropped white hair, Hux
looks a bit like Mr. Clean with eyeglasses. But unlike that cheerful
ally of housekeepers everywhere, Hux was mad in the late 1990s,
and he wasn't going to take it anymore.
Hux was angry that there were no standards to ensure the
qualifications of GIS professionals. "Can it be," he asked, "that
anyone can pass himself off as a ‘GIS professional'?" Hux also
railed at the absence of a formal quality control mechanism
for GIS education. "Can it be that anyone can pass herself off
as knowing what to teach GIS students?" To fill these gaps,
Hux, Nancy Obermeyer, and a few others crusaded for a
formal professional certification program for GIS professionals.
Hux convinced the Urban and Regional Information Systems
Association (URISA) to establish a certification committee to
study the problem and recommend a solution. He also argued for
a formal accreditation program for GIS in higher education.
Creating the GIS Profession
I was an educator at Penn State University at the time, and these
arguments made a strong impression on me. Like many other
educators, I was skeptical about the potential of certification and
accreditation to ensure competence and quality. But the more
I read and thought, I became convinced something more than
competence is at stake. What's at stake in the professionalization
of GIS is the right of GIS practitioners—some of whom are my
students—to work side by side as respected peers with other
geospatial professionals.
From the time that the US Department of Labor Employment
and Training Administration (DOLETA) showcased geospatial
technology as a high-growth industry, it warned that the absence
of a coherent definition and public awareness of the field posed
an obstacle to its growth. As the philosopher Michael Davis said,
"Just as nobody likes a wise guy, nobody likes a definition" (2002).
But to define something is, in a sense, to create it. I believe that
the early crusaders and their successors have helped create a
flourishing GIS profession that is just now coming of age.
The Geospatial Work Force
Until recently, we had to be content with anecdotal evidence
about the GIS profession's size and scope. Reliable estimates
of GIS employment didn't exist in the United States or most
anywhere else. However, the anecdotal evidence was enough to
worry DOLETA and others that work-force needs were growing
faster than the capacity of the geospatial education infrastructure.
Good students tended to get good jobs. Then confidence waned
somewhat during the recession, when good jobs of every kind
became much harder to find and keep.

24Strengthening the GIS ProfessionEssays on Geography and GIS, Volume 5 December 2012
The size and scope of the GIS work force came into sharper
focus when DOLETA established two new GIS occupations—
geographic information scientists and technologists and GIS
technicians—in late 2009 and when it identified the core
competencies of geospatial professionals in 2010. Along with the
new occupation definitions came the first rough estimates of the
size and growth of the US GIS work force.
The employment estimates and growth projections in the
accompanying table don't add up because some estimates
overlap. However, even when the overlaps are accounted for,
the estimates are still impressive: nearly 425,000 geospatial
professionals were employed in 2010 in the United States,
DOLETA work force analysts say, and almost 150,000 additional
positions will be created by 2020. Significantly, the two GIS
occupations account for the largest share of those employment
estimates—about half of all US geospatial workers in 2010, and
nearly more than one-third of new positions to be created by
2020. Estimates of the size of the geospatial work force beyond
the United States are harder to find, but some reckon that there
were about two million professional GIS users worldwide in 2005
(Longley et al. 2005).
Meanwhile, GIS employment prospects are good in many
locations. According to Richard Serby, president of GeoSearch
Inc., a leading personnel recruitment firm specializing in the
geospatial industry, employment opportunities in most sectors
have already rebounded to prerecession levels in the United
States, recovering faster than most other industries. Serby points
out that Indeed.com, which aggregates job postings worldwide,
listed more than 11,000 geospatial jobs just for the period
February 15 to March 15, 2012. Half of the geospatial jobs had
GIS in their titles, and all but a few jobs included GIS in their
requirements.
Scoping the GIS Profession
In 2010, DOLETA issued a Geospatial Technology Competency
Model (GTCM) that identifies the specialized knowledge and
abilities that successful geospatial professionals possess. The
GTCM is useful for geospatial workers, who can use it to guide
their continuing professional development plans. Employers can
use it for job descriptions and interviews. Students can use the
GTCM to assess what they know, what they need to learn, and
which educational programs fit their needs. Educators can use
it to assess how well their curricula align with work force needs.
And certification and accreditation bodies can use it as a basis
for their requirements. The GTCM is freely available for use and
reuse, without restriction, at www.careeronestop.org
/competencymodel.
In addition to 43 essential competencies common to most of
the geospatial occupations, the GTCM identifies 19–24 essential
competencies for each of three industry sectors: positioning
and data acquisition, analysis and modeling, and software and
application development. The sectors represent "clusters of

25Strengthening the GIS ProfessionEssays on Geography and GIS, Volume 5 December 2012
worker competencies associated with the three major categories
of geospatial industry products and services." The diagram
above shows the scope of responsibilities for three geospatial
professions in relation to the industry sectors and to one another.
Debates about the rightful roles of GIS professionals arise
because their activities tend to overlap those of other
geospatial professions. Overlaps cause tensions but also afford
opportunities for cooperation. J. Alison Butler, an experienced
and outspoken champion of the GIS profession, points out that
overlaps tend to be complementary. For example, professional
surveyors and GIS professionals do many similar things but
usually at different geographic scales ("Surveyors work at a
1:1 scale," Butler says, in contrast with GIS professionals, who
"work at smaller scales and do not need to be so precise."). And
although professional roles overlap, each geospatial profession
exhibits a distinctive "center of mass," or concentration within
one sector (see diagram at left).
The GIS profession's center of mass is analysis and modeling.
GIS professionals tend to be end users of geospatial data and
software. They're employed in a wide range of allied industries,
such as natural resources, government, and defense and
intelligence. The character and geographic distribution of GIS
employment differs from one industry to the next. However,
the core responsibility of most GIS professionals is to use
specialized software technology to render actionable information
from geospatial data. In addition, many GIS professionals also
acquire and process geospatial data (within the constraints
of government regulation over data collection activities that
pose risks to public safety and welfare). Others design and
implement geospatial databases or develop customized software
applications.
In this article, I define GIS professional narrowly, as one who
makes a living doing GIS work. Some object to scoping the
field so narrowly. Directions Media editor in chief Joe Francica
points out that "non-GIS people are becoming more 'location
aware' and thinking spatially." Gone are the days, Francica and
others observe, when knowledge workers had to rely on "the
map guy" to provide location-based information. Now "everyone
is becoming a 'map guy.'" Even so, neither widespread access
to mapping capabilities nor crowdsourced or "volunteered"
The work roles of three geospatial professions cross boundaries of the geospatial industry sectors and overlap one another. Each profession has a "center of mass" within one sector. Not all geospatial professions are depicted.
26Strengthening the GIS ProfessionEssays on Geography and GIS, Volume 5 December 2012
geographic information have displaced GIS professionals. On
the contrary, as the employment estimates above suggest, the
demand for GIS professionals seems to be increasing even as
location awareness proliferates.
GIS as a Learned Profession
Not everyone agrees that a GIS profession exists. Debates
about whether GIS qualifies as a true profession date back
more than 20 years. Today, however, by almost any definition,
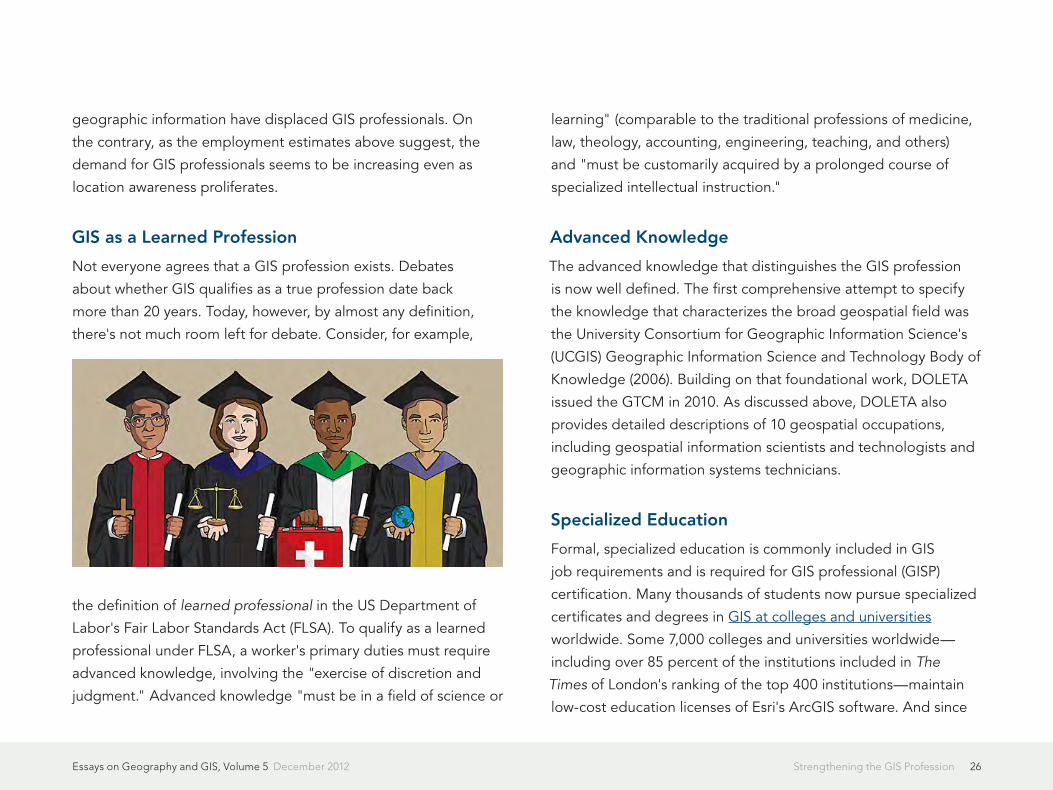
there's not much room left for debate. Consider, for example,
the definition of learned professional in the US Department of
Labor's Fair Labor Standards Act (FLSA). To qualify as a learned
professional under FLSA, a worker's primary duties must require
advanced knowledge, involving the "exercise of discretion and
judgment." Advanced knowledge "must be in a field of science or
learning" (comparable to the traditional professions of medicine,
law, theology, accounting, engineering, teaching, and others)
and "must be customarily acquired by a prolonged course of
specialized intellectual instruction."
Advanced Knowledge
The advanced knowledge that distinguishes the GIS profession
is now well defined. The first comprehensive attempt to specify
the knowledge that characterizes the broad geospatial field was
the University Consortium for Geographic Information Science's
(UCGIS) Geographic Information Science and Technology Body of
Knowledge (2006). Building on that foundational work, DOLETA
issued the GTCM in 2010. As discussed above, DOLETA also
provides detailed descriptions of 10 geospatial occupations,
including geospatial information scientists and technologists and
geographic information systems technicians.
Specialized Education
Formal, specialized education is commonly included in GIS
job requirements and is required for GIS professional (GISP)
certification. Many thousands of students now pursue specialized
certificates and degrees in GIS at colleges and universities
worldwide. Some 7,000 colleges and universities worldwide—
including over 85 percent of the institutions included in The
Times of London's ranking of the top 400 institutions—maintain
low-cost education licenses of Esri's ArcGIS software. And since

27Strengthening the GIS ProfessionEssays on Geography and GIS, Volume 5 December 2012
Esri made free, one-year educational software licenses available
for individual student use in fall 2005, over 450,000 students
worldwide have requested DVDs or downloaded the software.
The availability of no-cost ArcGIS software that students can use
on their personal computers has helped educational institutions
offer advanced GIS education online for adult learners who can't
put their lives on hold to participate in traditional campus-based
education.
GIS seems clearly to qualify as a learned profession under the
FLSA definition. The advanced knowledge that distinguishes
the profession is well defined. Prolonged courses of specialized
intellectual instruction are widely available, attracting large and
increasing numbers of enrollments.
Professional Ethics in GIS
Professions are more than just occupations, and the distinction
involves more than just specialized knowledge and education.
One of the distinguishing characteristics of a profession is its
specialized code of professional ethics.
In the early 1990s, Will Craig—another pioneer of urban and
regional information systems and GIS—pointed out the need
for a code for the GIS profession and set out to write one. Craig
began by examining the existing codes in use in other fields.
He found "surprising similarity" among them. Most reflected a
"duty-" or "obligations-based" approach to ethics. "Obligations
to society," he observed, "usually override other considerations"
in the codes he studied. At its founding in 2004, the GIS
Certification Institute (GISCI) endorsed the GIS Code of Ethics he
completed (with help from many members of the GIS community)
and later developed its own complementary Rules of Conduct.
To qualify for certification as a GISP, applicants must pledge
to uphold the code and rules. Coming to terms with its ethical
challenges is another sign of a profession that is coming of age.
Certification and Licensure
Another distinguishing characteristic of professions is
specialized certification or licensure. We typically think of
these as mechanisms to ensure that individual practitioners
are competent and trustworthy. However, another way to
think about certification is as a road map for continuing
professional development. GISCI has conferred its GISP
certification on more than 5,000 professionals who document
sufficient formal education, experience, and contributions to
the profession. To qualify for renewal of certification, GISPs
must document continuing formal education and contributions.
These requirements strengthen the profession by ensuring that
professionals "keep current in the field through . . . professional
development" (GIS Code of Ethics Item II. 1.).
Unlike the state licensure required for professional surveyors in
the United States, GISP certification remains voluntary (though
one state, South Carolina, requires that surveyors who use GIS

28Strengthening the GIS ProfessionEssays on Geography and GIS, Volume 5 December 2012
be licensed as "GIS surveyors"). In part, this difference is due to
the fact that GIS is a much younger profession than surveying.
However, recent developments suggest that GIS certification may
not remain voluntary for long. According to Max Baber of the
US Geospatial Intelligence Foundation, the US undersecretary
for defense intelligence has mandated a formal policy for
certification of geospatial analysts. The policy is to be in place
at the National Geospatial-Intelligence Agency by September
2012. Baber believes that GIS professionals in the civilian side of
government may be affected in the longer term. It appears that
GIS certification is finally taking root.
GIS Professional Organizations
Another characteristic of GIS and other professions is specialized
membership organizations dedicated to advancement of the
profession. Such organizations typically aim to serve members
through continuing professional development opportunities
and through advocacy on their behalf in the policy arena. (A
list of organizations for geospatial professionals is available
at edcommunity.esri.com.) Voluntary, active participation in
such organizations is one example of what GISCI means by
"contributions to the profession."
Toward a Moral Ideal for GIS
The GIS field has all the trappings of a profession, including
a distinctive body of advanced knowledge, specialized
educational offerings, a code of professional ethics, mechanisms
for professional certification, and specialized membership
organizations. What's lacking is a certain ethos—a characteristic
spirit evident in the shared beliefs and aspirations of mature
professions like medicine, the law, and even accounting.
Darrell Pugh, the author so often cited for his checklist of the
defining traits of professions, includes one he calls a "social ideal."
For Michael Davis, serving a shared "moral ideal" is a defining
characteristic of all professions. Physician and ethicist John
W. Lewis argues that a profession's "core product and service
is [its] pledge to put the interests of others ahead of [its] own
while providing [its] specific services." At the 2012 Esri Partner
Conference, Jack Dangermond reminded attendees "we have a
driving purpose to make a difference in the world."
How can the GIS profession advance society's interests? What
is the GIS profession's moral ideal? For starters, here's my
suggestion:
The GIS profession's moral ideal is to apply geospatial
technologies and spatial thinking to design sustainable futures for
people and places everywhere.
Challenges
The GIS profession is relatively young. It has weaknesses
and faces some very real threats. Some critics question the
profession's legitimacy, citing the facts that GIS professional
29Strengthening the GIS ProfessionEssays on Geography and GIS, Volume 5 December 2012
certification remains voluntary and that no formal GIS
accreditation process is in place to hold colleges and universities
accountable. Others seek to monopolize the use of GIS and
related technologies through government regulation. Given these
challenges, GIS professionals need to do everything we can—
individually and collectively—to strengthen our profession.
Seven Things Every GIS Professional Can Do to Strengthen Our Field
1. Become certified as a GISP or its equivalent (depending on
where you are and what you do). Professional certification
is a public commitment to competence, ethical practice,
and continuing professional development. (Technical
certifications like Esri's are valuable, too, but are no substitute
for professional certification.) Formalizing that commitment,
and fulfilling it throughout your career, is one of the most
significant things you can do to strengthen your profession.
And the larger your GIS professional community grows, the
better your chances to control your own destiny.
2. Map out a professional development plan that includes
continuing formal education and contributions to the
profession. Whether you opt in to certification or not, use
the requirements for renewal of GISP certification—and the
GTCM—as guides.
3. Join and be actively involved in one or more organizations
that advance the interests of the GIS profession. Wise
employers will help support your participation. If you don't
enjoy such support in your job, participate anyway and look
for a better job.
4. Be able to explain the nature of your profession, its history,
and its code of ethics.
5. Cultivate respectful working relationships with colleagues
in kindred professions. Participate in efforts to increase
cooperation among the geospatial professions but stand up
for your profession when its legitimacy is challenged. Keep in
mind that your adversaries are usually not your professional
colleagues but rather the lobbyists and lawyers who stand to
gain the most by monopolistic regulations.
6. Volunteer for GIS activities that benefit society. Help increase
public awareness on GIS Day. Become a mentor for a
schoolteacher who wants to teach with GIS. Volunteer to
serve on an industry advisory board for a GIS certificate and/
or degree program at a nearby higher education institution.
Encourage such programs to use the GTCM to assess their
curricula and students and to embrace accreditation.
7. Articulate a "moral ideal" for GIS that expresses your
professional commitment to society.
So, what's your moral ideal?
30Strengthening the GIS ProfessionEssays on Geography and GIS, Volume 5 December 2012
About the Author
David DiBiase is Esri's director of education industry solutions.
Before joining Esri in 2011, he founded the Penn State Online
master's degree and certificate programs in GIS. As a member
of URISA's Certification Committee, he helped design the criteria
by which more than 5,000 GISPs have been certified. He is a past
president of GISCI.
(This article originally appeared in the Summer 2012 issue of ArcNews.)
References
Butler, J. A. (2008). "Redefining Who We Are." Professional
Surveyor Magazine, April. www.profsurv.com/magazine/article
.aspx?i=2117.
Davis, Michael (2002). Profession, Code, and Ethics. Burlington,
VT: Ashgate.
GIS Certification Institute. Code of Ethics and Rules of Conduct.
www.gisci.org.
Lewis, John W. (2001). Ethics and the Learned Professions (white
paper). The Institute for Global Ethics. www.globalethics.org/files
/wp_professions.pdf/20.
Longley, P. A., M. F. Goodchild, D. J. Maguire, and D. W. Rhind
(2005). Geographic Information Systems and Science. 2nd ed.
Chichester, UK: Wiley.
Obermeyer, Nancy J. (2007). "GIS: The Maturation of a
Profession." Cartography and Geographic Information
Science 34, no. 2: 129–32.
US Department of Labor (revised 2008). "Fact Sheet #17D:
Exemption for Professional Employees Under the Fair Labor
Standards Act (FLSA)." www.dol.gov/whd/regs/compliance
/fairpay/fs17d_professional.pdf [PDF].

31URISA at 50Essays on Geography and GIS, Volume 5 December 2012
URISA—the Urban and
Regional Information Systems
Association—will celebrate
its 50th anniversary at the
2012 GIS-Pro Conference
in Portland, Oregon,
September 30–October 4.
Here, Jack Dangermond shares
memories of URISA's early years,
as well as thoughts about its future. Dangermond earned URISA's
Horwood Distinguished Service Award in 1988.
URISA—How and why did you get involved with URISA?
Dangermond—I was a young graduate of the Harvard Lab when
Alan Schmidt advised me to attend the 1969 URISA meeting in
Los Angeles. I wasn't really sure what URISA was, but I traveled
to the meetings for three days and met many interesting
people. It was there I first met Ed Horwood, Tom Palmerlee,
Bob Aangenbrug, Bob Dial, and other people who introduced
me to early concepts of urban information systems.
At that time, there were a lot of innovative people and
organizations thinking about urban information systems in the
Los Angeles area, and many of them showed up at the URISA
meeting, for example, the Community Analysis Bureau (CAB)
in the city and the Southern California Regional Information
Study (SCRIS), an outgrowth of the Census Use Study activities
sponsored by the Census Bureau in New Haven, Connecticut.
People I remember meeting were Caby Smith, Matt Jaro,
Ross Hall, Lee Johnson, Al Evans, Ken Duecker, and Mike Kevany.
They were playing around with everything from the first
generation of ADMATCH address geocoding and census DIME
files to transportation modeling. I realized this was a special
meeting where public-sector people, private consultants, and
entrepreneurs were mixing and sharing ideas about applications
of computers and information systems within local government.
I discovered that URISA wasn't just another academic conference.
It was a place where professional relationships were established
and new concepts were discussed. In those days, the atmosphere
of the meetings was highly charged and competitive. People
were actively trying to forward their vision, create business, and
get business. At least a third of the participants were consultants
URISA at 50An Interview with Jack Dangermond
Jack Dangermond

32URISA at 50Essays on Geography and GIS, Volume 5 December 2012
like me, who talked about their offerings and wares in various
sessions.
I got one small computer mapping job for the 1970 election
campaign for George Leyland, with whom I'd worked at
Harvard and who later became head of the Federal Emergency
Management Agency.
URISA—How did URISA evolve as the GIS industry matured?
Dangermond—I liked URISA because it provided a forum of
colleagues where a young professional and entrepreneur like
me could share my work. People were genuinely interested
and would give me feedback. We talked about technology and
approaches to the kinds of problem solving that eventually
became known as urban GIS. This kind of open culture of sharing
and learning flourished, especially during the 1970s and early
1980s. Around 1982 or 1983, URISA decided to invite vendors to
exhibit at the annual meeting. At that point, the complexion of
URISA began to change.
By the late 1980s, URISA had become identified with local
government GIS. The membership grew dramatically into the
thousands. But at the same time, the association took on a more
commercial aura with a strong trade show emphasis. And as the
GIS industry began to shake out, the trade show business fell off,
and attendance also declined. Discussions shifted to planning,
organization, implementation, and policy issues. Likewise, the
original core people who had founded or nurtured URISA as a
venue for sharing ideas and best practices continued to come
and dialog. I liked this. URISA gradually became one of the
homes where GIS professionals could get together and discuss
issues.
URISA—Which URISA people come to mind who really made
a difference in the GIS field?
Dangermond—URISA's founder, Horwood, was a big influence
on me. He was also a really fun guy. Horwood liked the idea of
using computational methods for doing transportation planning.
He especially liked getting people together to share their
experiences in urban information systems.
Dial was another key visionary and influencer. He pushed some
of the early thinking about urban information systems. His
thinking, writing, and presentations led to a Housing and Urban
Development program that funded experiments in implementing
Jack Dangermond produced these drawings by hand for the 1979 URISA conference. Here he looked into the future with 1980 as a near-future milestone.

33URISA at 50Essays on Geography and GIS, Volume 5 December 2012
automated methods within cities around the country. This got
the private sector interested in selling hardware, software, and
services to build these experimental systems.
Dial was one of the first to envision how the multiple fiefdoms
in cities could share common databases. I grabbed that notion
personally to drive some of the concepts of urban GIS in the early
days of ArcInfo, and it really worked. I credit Scott Morehouse for
listening to my rants and systematically implementing a toolbox
of tools that could be customized (using ARC Macro Language) to
build application views to a common, shared database. We saw
eager adoption—by planning departments, public works, land
records organizations, and environmental agencies—of this vision
of sharing a common GIS database.
Duane Marble was another early leader. Marble brought in
systematic user needs assessment methodology and later the
whole concept of doing geographic and GIS research in the
academy. All this activity eventually led to the National Center
for Geographic Information Analysis at Santa Barbara, California;
Buffalo, New York; and Maine. Marble's research thinking,
together with that of Aangenbrug and Roger Tomlinson, and
others, helped balance out the somewhat aggressive commercial
forces that were pushing URISA along.
URISA—Why did URISA gravitate to GIS?
Dangermond—URISA was, in a sense, one of the birthplaces
of information system technology for local governments. This
was a hot topic at the time—kind of like social networking is
today. Remember that the best computers we had were huge,
very expensive mainframes, and there really wasn't much of a
database management technology at all. IMS [IBM's mainframe
system] was a hierarchical data structure and considered the best
of breed. This technology was designed primarily for accounting
systems and financial back-office work. In those days, if you put
simple things like property records into a database and could
get lists of them, it was rocket science. So there was a need for
a forum where people could come together and share, because
computers and information systems were so new. Only a few
people in transportation and urban planning were interested
in computational approaches and database approaches. URISA
brought these people together.
When GIS began to emerge as a commercial product in the
late 1970s and early 1980s, it attracted more people from more
organizations. They were excited to discover that GIS was a real
information system just like an accounting system or a financial
system or a permitting system, all of which had already been
commercialized. So the introduction of a commercial off-the-shelf
platform for sale from multiple vendors caused a stir and a lot of
common interest. People and organizations wanted to buy these
products because they saw their value, and there was lots of
competition during the 1980s and 1990s for brands from different
vendors.

34URISA at 50Essays on Geography and GIS, Volume 5 December 2012
URISA—Do you think Esri's User Conference has affected
URISA?
Dangermond—Perhaps. As more organizations purchased and
implemented this software, some of those who attended URISA
to help select a platform now attend our conference because
of its strong emphasis on supporting users with technology
refreshers and training. What the User Conference does not
replace is a forum for discussion of data policies, professional
standards, new methods, new approaches—the kinds of
conversations that URISA was known for.
URISA—Looking ahead, URISA has proposed a new emphasis
on GIS management. What's your perspective on this
potential new role?
Dangermond—Today, GIS is maturing as a technology and
as a profession, and GIS operations within organizations are
maturing as well. There's a need for a forum to bring together the
professionals who are responsible for managing large, complex
GIS operations. URISA is the logical place where managers come
together to talk about how to use new technology and new
methods to make cities better places.
I have, year after year, supported URISA because I believe it's
one of the best places where local government professionals can
get together and discuss their common interests with respect
to information system technology. It was certainly one of the
birthplaces of urban GIS and continues to have much to offer its
members.
During URISA's first two or three decades, there was perhaps
a greater spirit of excitement when the meetings were held.
URISA's number-one asset was its ability to get people together
to share ideas, renew old friendships, have a chance to share
their work, get acknowledgment from friends, network, and
also have a great party. These were the magical ingredients that
kept URISA alive through thick and thin. Reengaging that spirit is
what's needed. And the 50th anniversary conference in Portland
this October is a good time and place to start.
See also "URISA's 50th Anniversary."
(This article originally appeared in the Summer 2012 issue of ArcNews.)
35Sustainability in AfricaEssays on Geography and GIS, Volume 5 December 2012
We need to take stock and attach value to our
natural resources and ecosystems, such that we may
include their value in planning and decision-making
processes, as well as in our national accounts and
balance sheets.
Although His Excellency President Ian Khama of Botswana was
speaking about Africa in his opening remarks to the first Summit
for Sustainability in Africa, his words apply equally to the rest of
the globe.
The goal of the summit, hosted in Gaborone last May by the
government of Botswana and Conservation International, was
to demonstrate how African nations and their investment
partners understand, manage, and value natural capital to
support and improve human well-being. The aim was to take a
practical, results-focused approach, with African nations leading
and encouraging investment partners to provide support in a
coordinated and coherent fashion.
The term natural capital refers to earth's natural assets (soil, air,
water, plants, and animals) and the ecosystem services resulting
from them (e.g., food production, climate regulation, pollination,
flood protection) that sustain human life.
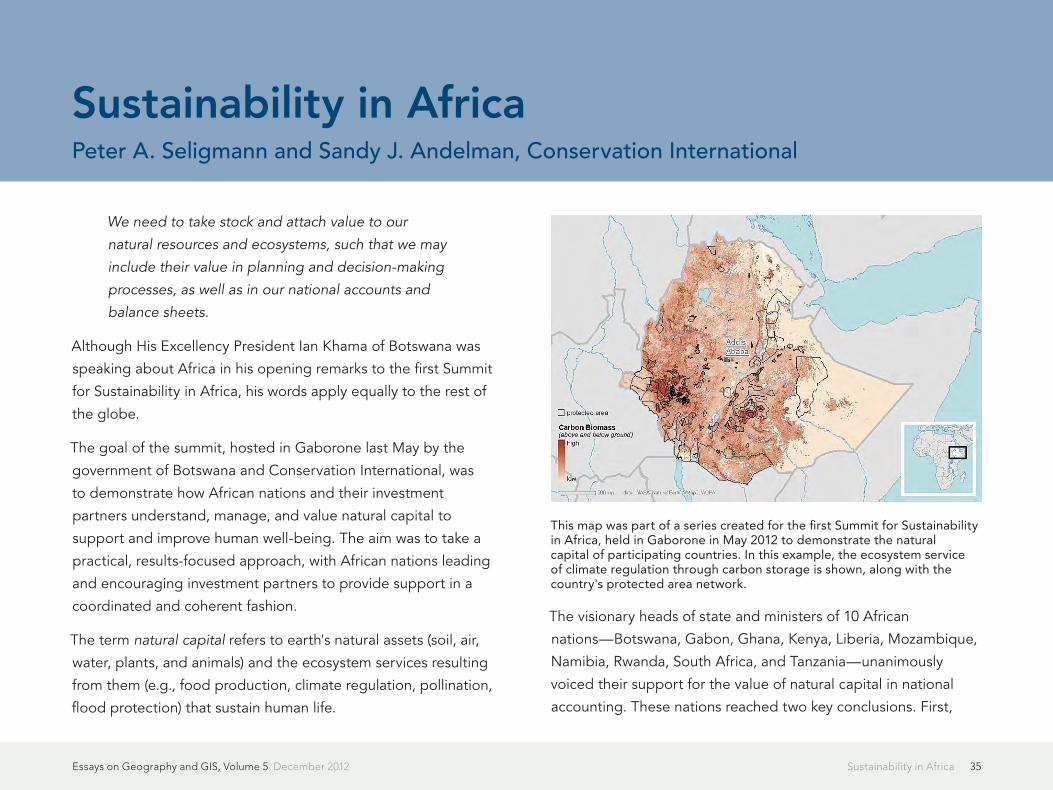
The visionary heads of state and ministers of 10 African
nations—Botswana, Gabon, Ghana, Kenya, Liberia, Mozambique,
Namibia, Rwanda, South Africa, and Tanzania—unanimously
voiced their support for the value of natural capital in national
accounting. These nations reached two key conclusions. First,
Sustainability in AfricaPeter A. Seligmann and Sandy J. Andelman, Conservation International
This map was part of a series created for the first Summit for Sustainability in Africa, held in Gaborone in May 2012 to demonstrate the natural capital of participating countries. In this example, the ecosystem service of climate regulation through carbon storage is shown, along with the country's protected area network.

36Sustainability in AfricaEssays on Geography and GIS, Volume 5 December 2012
there was unanimous consensus that the historical pattern of
resource exploitation has failed to promote sustained growth,
environmental integrity, and improved social capital and has,
even worse, been counterproductive. Second, they agreed that
the value of natural capital—the wealth of benefits provided to
people by biodiversity and ecosystems, like watersheds, forests,
coral reefs, and grasslands—must be fully accounted for and
integrated into national and corporate planning, as well as
reporting practices, policies, and programs.
The message resulting from the summit—the Gaborone
Declaration—reaffirmed a commitment to sustainability already
shared by these visionary leaders. The declaration signaled a new
era of leadership, rooted in Africa, that understands, values, and
manages the natural capital that sustains all of us: a platform on
which we can begin to build a sustainable future.
Summit participants included Sam Dryden, director of agricultural
development at the Bill & Melinda Gates Foundation; Laurene
Powell Jobs, chair and founder of Emerson Collective; Rachel
Kyte, vice president of sustainable development at the World
Bank; Rob Walton, the chairman of Walmart; and numerous other
private- and public-sector partners from within and outside Africa.
These participants also issued a communiqué to draw attention to
what they described as "the limitations of GDP [gross domestic
product] as a measure of well-being and sustainable growth that
values environmental and social aspects of progress."
In closing the summit, President Khama emphasized the
importance of following through on these commitments. "This
meeting will not be of any value to our peoples if we fail to
achieve the objectives that formed the core of this summit, that is,
integrating the value of natural capital into national and corporate
accounting and planning," he said. "We must continue building
social capital and reducing poverty by transitioning agriculture
and extractive industries to practices that promote sustainable
employment and the protection of natural capital while building
the knowledge, capacity, and policy networks needed to
promote leadership and increase momentum for change."
This is true leadership and an example we should celebrate and
follow.
The Gaborone Declaration marked an important step in paving
the way toward mutually beneficial partnerships between
governments and businesses. A month later, at Rio+20—the
United Nations Conference on Sustainable Development—these
10 African nations united under the Gaborone Declaration and
emerged as global leaders. They urged others to join them in
taking the first steps to correct what has been, up until now, a
misguided development trajectory. They were followed by
49 other nations, developed and developing alike, along with
nearly 100 public, private, and civil society partners, including
ArcelorMittal, the Coca-Cola Company, the Bill & Melinda Gates
Foundation, the German Development Institute, the MacArthur
Foundation, the United Nations Environment Programme, the
37Sustainability in AfricaEssays on Geography and GIS, Volume 5 December 2012
United Nations Permanent Forum on Indigenous Issues, Walmart,
Woolworths, the World Bank, and World Vision.
Measuring Sustainability: Getting the Metrics and Measurements Right
The recent Stiglitz-Sen-Fitoussi Commission on the Measurement
of Economic Performance and Social Progress (2009) put it very
clearly:
What we measure affects what we do; and if our
measurements are flawed, decisions may be
distorted. . . . Those attempting to guide the
economy and our societies are like pilots trying
to steer a course without a reliable compass. The
decisions they make depend on what we measure,
how good our measurements are and how well our
measures are understood. We are almost blind when
the metrics on which action is based are ill-designed
or when they are not well understood. . . . We need
better metrics.
Ecosystem goods and services from natural capital provide
an enormous contribution to the global economy, but natural
capital has not been factored into conventional indicators of
economic progress and human well-being like GDP or the human
development index (HDI). Neither GDP per capita nor the HDI
reflect the state of the natural environment. Both indicators focus
only on the short term, giving no indication of whether current
well-being can be sustained for future generations.
Many economists and politicians have become convinced that
the failure of societies to account for the value of natural capital—
as well as the use of indicators of well-being that don't reflect
the state of natural capital—have contributed to degradation of
the natural environment. We are using a flawed measurement
approach to guide policy and decision making, and one key step
toward achieving healthy, sustainable economies is to begin
accounting for our use of natural capital. We must recognize and
report the true cost of economic growth and our ability to sustain
human well-being, both today and in the future. By incorporating
the value of natural capital and ecosystem services, such as water
provision, climate regulation, soil fertilization, or plant pollination,
into our balance sheets, governments and businesses will be able
to see a more holistic and accurate picture of natural and national
wealth.
Sustainability and Food Security: Grow Africa and the G8 New Alliance for Food Security and Nutrition
Ann's story that follows is representative of hundreds of millions
of farmers across sub-Saharan Africa. The continent's smallholder
agricultural systems have inadvertently degraded vital ecosystem
services like flood protection, water supply, and soil nutrient
cycling:
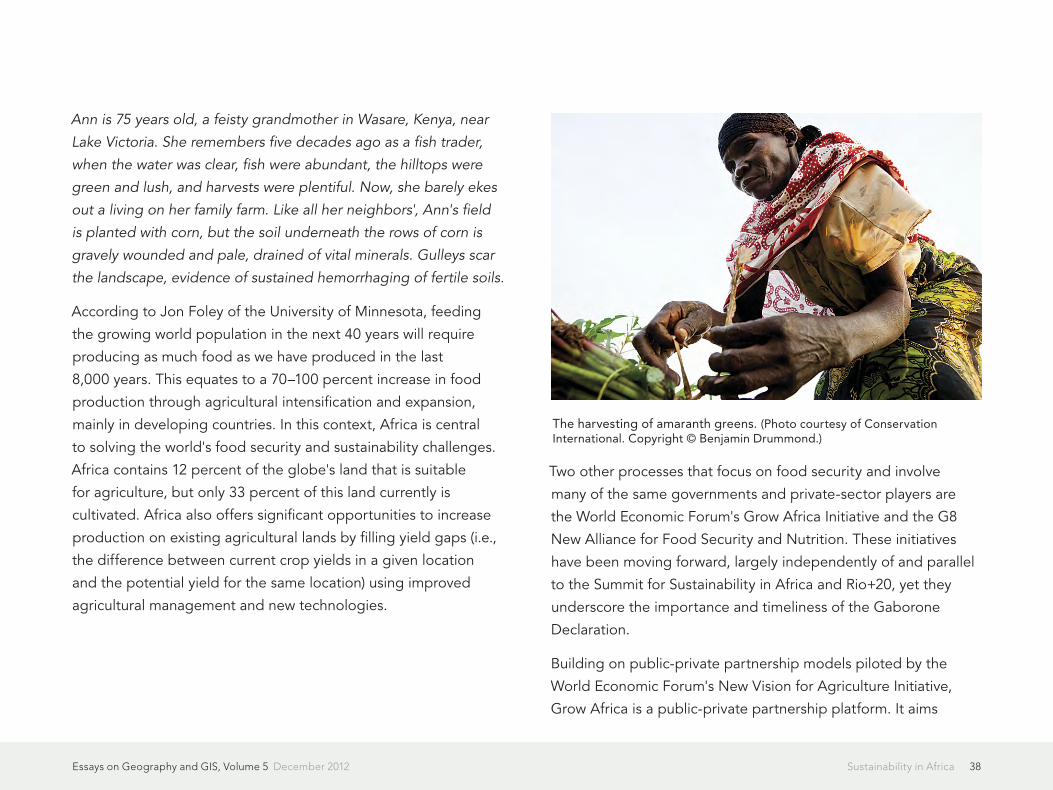
38Sustainability in AfricaEssays on Geography and GIS, Volume 5 December 2012
Ann is 75 years old, a feisty grandmother in Wasare, Kenya, near
Lake Victoria. She remembers five decades ago as a fish trader,
when the water was clear, fish were abundant, the hilltops were
green and lush, and harvests were plentiful. Now, she barely ekes
out a living on her family farm. Like all her neighbors', Ann's field
is planted with corn, but the soil underneath the rows of corn is
gravely wounded and pale, drained of vital minerals. Gulleys scar
the landscape, evidence of sustained hemorrhaging of fertile soils.
According to Jon Foley of the University of Minnesota, feeding
the growing world population in the next 40 years will require
producing as much food as we have produced in the last
8,000 years. This equates to a 70–100 percent increase in food
production through agricultural intensification and expansion,
mainly in developing countries. In this context, Africa is central
to solving the world's food security and sustainability challenges.
Africa contains 12 percent of the globe's land that is suitable
for agriculture, but only 33 percent of this land currently is
cultivated. Africa also offers significant opportunities to increase
production on existing agricultural lands by filling yield gaps (i.e.,
the difference between current crop yields in a given location
and the potential yield for the same location) using improved
agricultural management and new technologies.
Two other processes that focus on food security and involve
many of the same governments and private-sector players are
the World Economic Forum's Grow Africa Initiative and the G8
New Alliance for Food Security and Nutrition. These initiatives
have been moving forward, largely independently of and parallel
to the Summit for Sustainability in Africa and Rio+20, yet they
underscore the importance and timeliness of the Gaborone
Declaration.
Building on public-private partnership models piloted by the
World Economic Forum's New Vision for Agriculture Initiative,
Grow Africa is a public-private partnership platform. It aims
The harvesting of amaranth greens. (Photo courtesy of Conservation International. Copyright © Benjamin Drummond.)
39Sustainability in AfricaEssays on Geography and GIS, Volume 5 December 2012
to accelerate investments and transform African agriculture in
accordance with national agricultural priorities and in support of
the Comprehensive Africa Agriculture Development Programme,
a program of the New Partnership for Africa's Development
established by the African Union in 2003. At the Grow Africa
Investment Forum last May, held at the glamorous African Union
Conference Centre in Addis Ababa, seven African governments
presented opportunities for multinational, private-sector
investment.
Also in May, at Camp David (the US president's retreat in
Frederick County, Maryland), the G8 countries announced
the New Alliance for Food Security and Nutrition. The New
Alliance, also a public-private partnership, is being promoted as
a mechanism to raise 50 million people in Africa out of poverty
over the next 10 years. The G8 committed $1 billion, together
with $3 billion in pledges from 45 agribusiness companies,
and is initially targeting Ethiopia, Ghana, and Tanzania. While
applauding the focus on lifting 50 million people out of poverty,
several African civil society groups and international organizations,
such as the agency Oxfam, have criticized the alliance's top-
down approach and its failure to bring smallholder farmers—
particularly women—to the table. They have also voiced concern
about its lack of attention to environmental sustainability.
We are clearly gaining traction and attention on these critical
challenges, but we need to integrate our efforts to strengthen
our collective impact.
Looking Ahead to Increased Sustainability
As stated by Kenyan Alex Awiti, director of the East African
Institute at Aga Khan University in Nairobi, "A fundamental
question underlies Africa's socioeconomic and environmental
sustainability: How can smallholder farmers increase land
productivity, profitability, and human well-being outcomes
without causing irreparable damage to the natural world on
which they depend?"
Africa's smallholder production systems, like global agricultural
production systems, depend on essential natural capital—the
ecosystem services produced by ecosystems at many spatial
scales, such as rainfall and water captured by forests or from
underground aquifers or vegetation from grasslands and
savannas to feed cattle, goats, and sheep. As a result, solutions
to the challenges faced by smallholder farmers require a
landscape-level approach.
However, much of the existing knowledge of ecosystems
and agricultural systems in Africa is local, fragmented, often
inaccessible, and seldom mapped at the scales relevant for
decision making. As a result, policy makers, farmers, and
investors often make important land-use and land management
decisions based on partial and incomplete understanding of
landscape-level interactions and feedback.
Without concerted investments in a framework with the right
metrics, indicators, and data to track changes in ecosystem

40Sustainability in AfricaEssays on Geography and GIS, Volume 5 December 2012
services and human well-being, gains in food production are
unlikely to be sustainable in the long run. At worst, they may
unintentionally degrade the environment.
Conservation International and partners have argued, therefore,
for a new, holistic, evidence-based approach to supporting
African agriculture, one that improves decisions on sustainable
land use and land management and provides a holistic
understanding of ecosystem health and human well-being.
Africa needs an integrated diagnostic and monitoring framework
to generate data and information at appropriate scales to
support decision making at household, national policy, and
international and global investment levels: an instruction manual,
if you will, to ensure that communities, investors, growers, and
decision makers are operating in sync. Such a framework requires
a strategically selected set of indicators that integrate information
about land productivity, soil and plant health, biodiversity, water
availability, and human well-being in a scientifically credible way.
At the same time, the set of indicators must be small enough that
decision makers aren't overwhelmed with too much information.
Farmers like Ann, African governments, and investors like the
G8 and multinational corporations need a system of metrics
and indicators that provide information at the right scales.
These indicators are the missing piece that will help minimize
environmental impacts of food production, as well as ensure that
the well-being of Ann and millions of farmers like her across sub-
Saharan Africa can be improved in a sustainable manner.
Over the last two years, with funding from the Bill &
Melinda Gates Foundation, Conservation International has
worked together with a broad set of science and policy partners
to identify the right set of metrics for measuring natural capital.
These metrics are intended to map the flow of ecosystem goods
and services to people and to quantify the contributions of
Map showing the Southern Agricultural Growth Corridor of Tanzania (SAGCOT), where the government is attempting to transform agricultural development, increase food production, and reduce poverty through a targeted program of public-private partnerships. The corridor is critically important for maintaining natural capital and contains important protected areas that also provide revenue from ecotourism.

41Sustainability in AfricaEssays on Geography and GIS, Volume 5 December 2012
these services to human well-being. We tested this framework in
southern Tanzania, including the Southern Agricultural Growth
Corridor of Tanzania (SAGCOT), where the country's government
is attempting to transform agricultural development, increase
food production, and reduce poverty through a targeted
program of public-private partnerships. The corridor [see ArcGIS
map on previous page] is critically important for maintaining
natural capital and contains important protected areas that
also provide revenue from ecotourism. As with Grow Africa,
some questions and concerns are being raised with respect
to SAGCOT: whether it is commercially viable, whether large
commercial farms will dominate the landscape at the expense
of the region's poorest farmers, whether investments will be
transparent, whether fears of land grabbing will be addressed,
and whether there will be transparent processes for investments
and auditing. Without access to integrated information on the
socio-agroecosystems within the corridor—information that
can gauge the success of the agricultural investments and the
environmental and socioeconomic outcomes—there is significant
risk that SAGCOT will fall short of its transformational goals.
Vital Signs Africa
Having identified the metrics and demonstrated the feasibility
of making the necessary measurements at the right scales,
we're ready to think bigger, act bigger, and dramatically scale
up. Recently, Conservation International, in collaboration with
Columbia University, the Council for Scientific and Industrial
Research in South Africa, and the Earth Institute, launched Vital
Signs Africa, an integrated monitoring system for agriculture,
ecosystem services, and human well-being. The first phase
of Vital Signs, funded by the Bill & Melinda Gates Foundation,
focuses on regions in five countries in sub-Saharan Africa,
including Ethiopia, Ghana, and Tanzania. These regions were
selected because they are where agricultural transformation
is targeted to meet the needs of Africa's growing population.
Measurements will be collected through a combination of
ground-based data collection, household surveys, and high-
resolution and moderate-resolution remote sensing.
Currently, no African countries have environmental monitoring
systems, and Vital Signs aims to fill that gap. The system
emphasizes capacity building, working through subgrants to
local scientists who will collect information and partnerships with
existing data collection efforts, such as the Tanzania National
Bureau of Statistics. It focuses on building local capacity for
analysis and synthesis of spatial information, as well as on the
capacity of African policy makers and institutions to understand
and use this kind of information.
Data collection will happen at multiple scales to create the most
accurate possible picture: a household scale, using surveys on
health, nutritional status, and household income and assets;
a plot scale to assess agricultural production and determine
what seeds go into the land, where they come from, what kind

42Sustainability in AfricaEssays on Geography and GIS, Volume 5 December 2012
of fertilizer is used, what yield of crops they deliver, and what
happens after the harvest; a landscape scale (100 km2) measuring
water availability for household and agricultural use, ecosystem
biodiversity, soil health, carbon stocks, etc.; and a regional scale
(~200,000 km2) that will tie everything together into a big picture
to enable decision makers to interact with the information at the
scales on which agricultural development decisions are made.
High-resolution (e.g., QuickBird, WorldView-2) and moderate-
resolution (e.g., Landsat, SPOT) remote sensing will provide wall-
to-wall coverage.
Vital Signs aims to fill the crucial information gap, providing a set
of metrics to quantify the value of natural capital for agriculture
and for human well-being; using the right measurements at
the right scales; and offering a set of indicators and tools to
provide policy makers, farmers, and investors with the holistic
understanding they need for better decision making.
These are long-term endeavors that will take time to realize
but offer a smarter way forward as we work to build healthy,
sustainable economies that support people and our planet.
The Geospatial World of Conservation International
Armed with an Esri nonprofit organization site license, for many years
Conservation International (CI) has partnered with Esri and Esri Partners
and users to provide data and geospatial analysis that has made a world
of difference. To name merely a few, CI uses ArcGIS for the following:
• As the core analytical engine for its automated near real-time
monitoring systems, serving more than 1,200 subscribers in
Madagascar, Indonesia, Bolivia, and Peru
• To analyze trade-offs between multiple ecosystem services and
stakeholders linked to land use and water quality management in
the Great Barrier Reef, Australia
• To define site- and landscape-level conservation priorities in
collaboration with regional partners to guide conservation action
and funding in the Mediterranean Basin, Caribbean, Eastern
Afromontane, Indo-Burma, and East Melanesian Islands biodiversity
hot spots
• To analyze land use and natural resources to inform various
development scenarios in the Cardamom Mountains of Cambodia
to guide government policy makers

43Sustainability in AfricaEssays on Geography and GIS, Volume 5 December 2012
About the Authors
Peter A. Seligmann is chairman and chief executive officer of
Conservation International and has been a leader in creating
conservation solutions for the past 36 years. Since he founded
the organization in 1987, Conservation International has
earned a reputation as an organization on the cutting edge,
creating innovative and lasting solutions to the threats facing
humanity, biodiversity, and the natural systems that sustain us
all. Dr. Sandy J. Andelman is the executive director of the Vital
Signs Monitoring System and is a vice president at Conservation
International. Vital Signs fills a critical unmet need for integrative,
diagnostic data on agriculture, natural capital, and human well-
being. Andelman has pioneered the creation of global monitoring
and forecasting systems for climate change and ecological
change.
For more information, visit conservation.org or vitalsigns.org.
(This article originally appeared in the Fall 2012 issue of ArcNews.)

44The Geoscape: A New Canvas for UnderstandingEssays on Geography and GIS, Volume 5 December 2012
For many years, Bill Miller directed the development of Esri's
training and support infrastructure. Later as an engineer/architect,
he was intimately involved in the design of Esri's state-of-the-
art corporate headquarters and conference center. Perhaps his
best-known contribution to the GIS community was development
of the ModelBuilder environment released as part of the
ArcGIS Spatial Analyst extension. More recently, he came out of
retirement to rejoin Esri and head up a new Geodesign Services
effort.
Miller's vision for the integration of geospatial technologies with
the design process was long shared by a group of people that
included UC Santa Barbara's Michael Goodchild, Esri President
Jack Dangermond, Harvard University's Carl Steinitz, and a
handful of others. Miller took the first step toward making this
vision a reality when he assembled a small team to develop
ArcSketch, a free sample extension that allowed users to quickly
sketch features in ArcGIS. ArcSketch was Esri's first small step
toward what is now commonly referred to as "geodesign."
Beyond Landscape
While identifying the technology hurdles the geospatial
industry needed to overcome in order to advance the concept
of geodesign, Miller noted a fundamental contextual obstacle
as well: our traditional approach to abstracting the landscape
severely limited our ability to move forward with geodesign. We
couldn't fully realize the vision of geodesign without a framework
for a more holistic, comprehensive understanding of the world
around us.
Different levels of understanding often require different levels
of abstraction, and it's clear that's what was happening with
geodesign. As TED founder Richard Saul Wurman has so
succinctly stated, "Understanding precedes action." Design is
action. Before we can design, we must understand. Geodesign—
the act of thoughtfully creating the future for the mutual benefit
of humans and the natural environment—requires a heightened
level of understanding.
Understanding the world for the purpose of geodesign
necessitated extending our view of geographic space. "This
meant moving from 2D to 3D and to 4D, coupled with the idea
that most data, at some level, is spatial and that all types of
The Geoscape: A New Canvas for UnderstandingBy Matt Artz, Esri
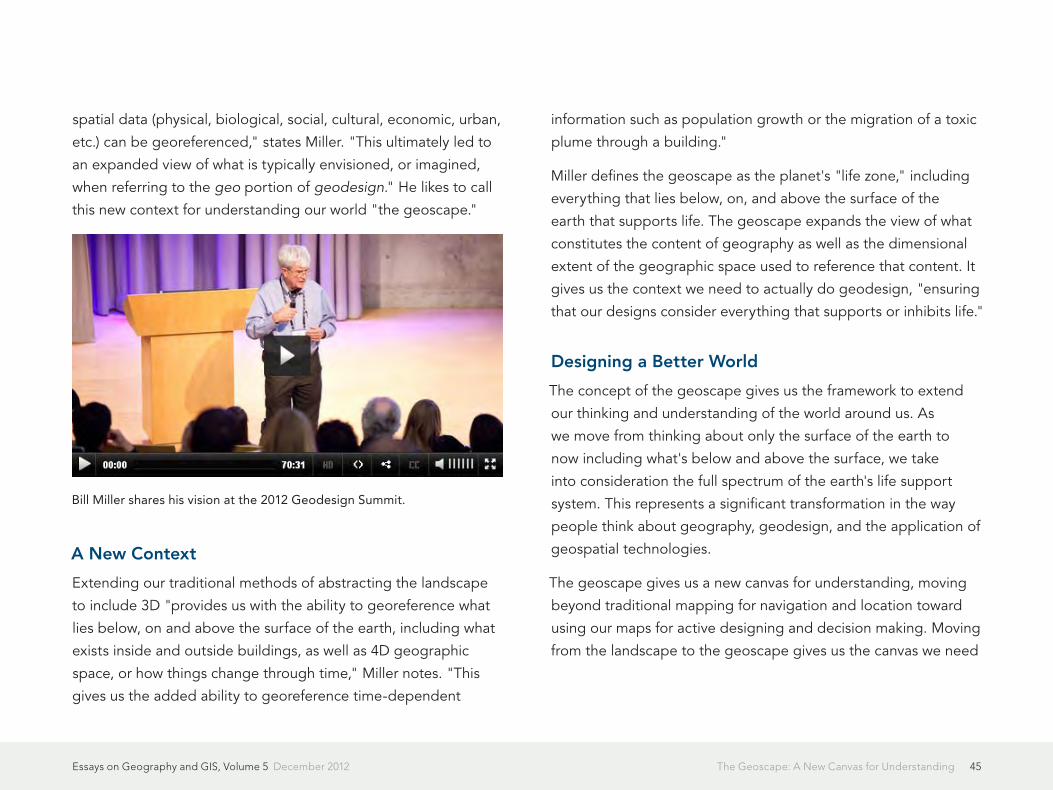
45The Geoscape: A New Canvas for UnderstandingEssays on Geography and GIS, Volume 5 December 2012
spatial data (physical, biological, social, cultural, economic, urban,
etc.) can be georeferenced," states Miller. "This ultimately led to
an expanded view of what is typically envisioned, or imagined,
when referring to the geo portion of geodesign." He likes to call
this new context for understanding our world "the geoscape."
A New Context
Extending our traditional methods of abstracting the landscape
to include 3D "provides us with the ability to georeference what
lies below, on and above the surface of the earth, including what
exists inside and outside buildings, as well as 4D geographic
space, or how things change through time," Miller notes. "This
gives us the added ability to georeference time-dependent
information such as population growth or the migration of a toxic
plume through a building."
Miller defines the geoscape as the planet's "life zone," including
everything that lies below, on, and above the surface of the
earth that supports life. The geoscape expands the view of what
constitutes the content of geography as well as the dimensional
extent of the geographic space used to reference that content. It
gives us the context we need to actually do geodesign, "ensuring
that our designs consider everything that supports or inhibits life."
Designing a Better World
The concept of the geoscape gives us the framework to extend
our thinking and understanding of the world around us. As
we move from thinking about only the surface of the earth to
now including what's below and above the surface, we take
into consideration the full spectrum of the earth's life support
system. This represents a significant transformation in the way
people think about geography, geodesign, and the application of
geospatial technologies.
The geoscape gives us a new canvas for understanding, moving
beyond traditional mapping for navigation and location toward
using our maps for active designing and decision making. Moving
from the landscape to the geoscape gives us the canvas we need
Bill Miller shares his vision at the 2012 Geodesign Summit.

46The Geoscape: A New Canvas for UnderstandingEssays on Geography and GIS, Volume 5 December 2012
for designing a better world. After all, as Miller is fond of saying,
"The purpose of design is to facilitate life."
Read Miller's new paper, "Introducing Geodesign: The Concept."
(This blog post originally appeared July 30, 2012, in Esri Insider.)
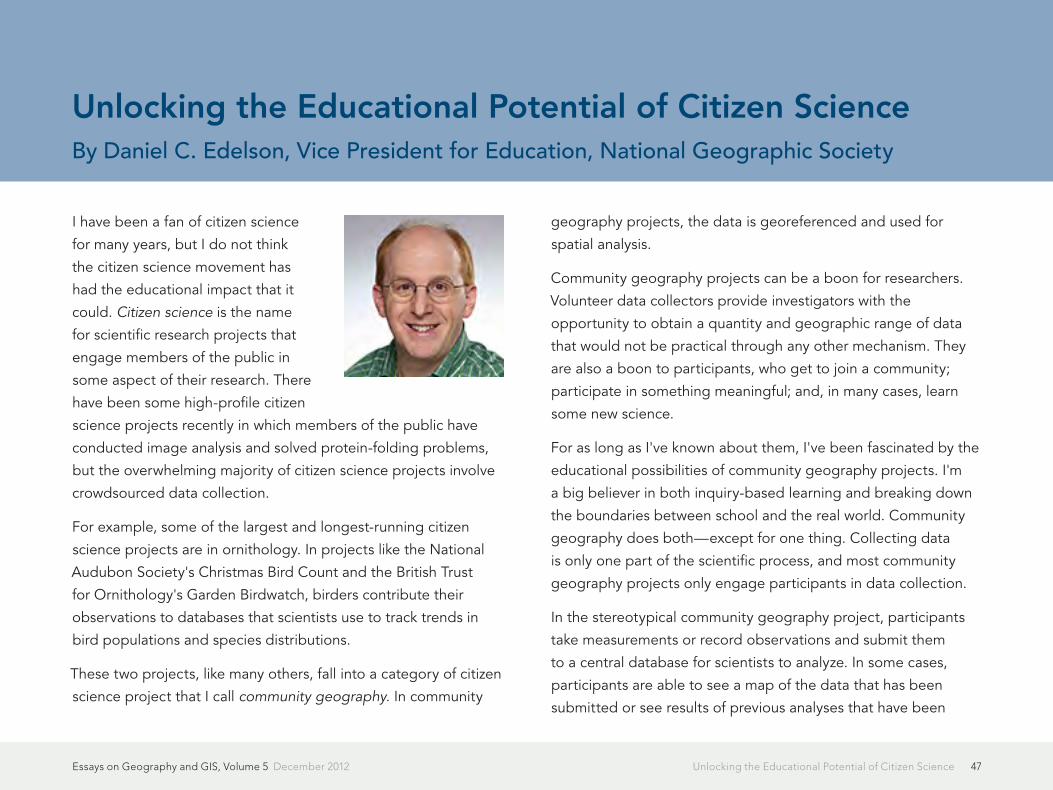
47Unlocking the Educational Potential of Citizen ScienceEssays on Geography and GIS, Volume 5 December 2012
I have been a fan of citizen science
for many years, but I do not think
the citizen science movement has
had the educational impact that it
could. Citizen science is the name
for scientific research projects that
engage members of the public in
some aspect of their research. There
have been some high-profile citizen
science projects recently in which members of the public have
conducted image analysis and solved protein-folding problems,
but the overwhelming majority of citizen science projects involve
crowdsourced data collection.
For example, some of the largest and longest-running citizen
science projects are in ornithology. In projects like the National
Audubon Society's Christmas Bird Count and the British Trust
for Ornithology's Garden Birdwatch, birders contribute their
observations to databases that scientists use to track trends in
bird populations and species distributions.
These two projects, like many others, fall into a category of citizen
science project that I call community geography. In community
geography projects, the data is georeferenced and used for
spatial analysis.
Community geography projects can be a boon for researchers.
Volunteer data collectors provide investigators with the
opportunity to obtain a quantity and geographic range of data
that would not be practical through any other mechanism. They
are also a boon to participants, who get to join a community;
participate in something meaningful; and, in many cases, learn
some new science.
For as long as I've known about them, I've been fascinated by the
educational possibilities of community geography projects. I'm
a big believer in both inquiry-based learning and breaking down
the boundaries between school and the real world. Community
geography does both—except for one thing. Collecting data
is only one part of the scientific process, and most community
geography projects only engage participants in data collection.
In the stereotypical community geography project, participants
take measurements or record observations and submit them
to a central database for scientists to analyze. In some cases,
participants are able to see a map of the data that has been
submitted or see results of previous analyses that have been
Unlocking the Educational Potential of Citizen ScienceBy Daniel C. Edelson, Vice President for Education, National Geographic Society
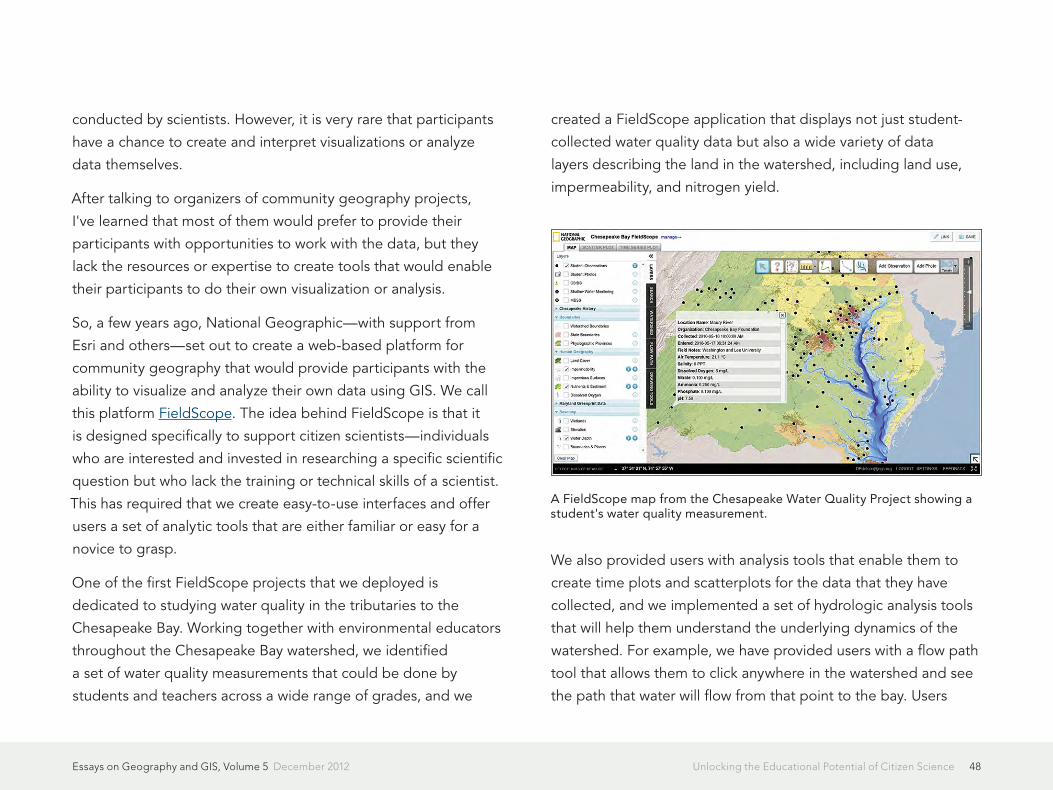
48Unlocking the Educational Potential of Citizen ScienceEssays on Geography and GIS, Volume 5 December 2012
conducted by scientists. However, it is very rare that participants
have a chance to create and interpret visualizations or analyze
data themselves.
After talking to organizers of community geography projects,
I've learned that most of them would prefer to provide their
participants with opportunities to work with the data, but they
lack the resources or expertise to create tools that would enable
their participants to do their own visualization or analysis.
So, a few years ago, National Geographic—with support from
Esri and others—set out to create a web-based platform for
community geography that would provide participants with the
ability to visualize and analyze their own data using GIS. We call
this platform FieldScope. The idea behind FieldScope is that it
is designed specifically to support citizen scientists—individuals
who are interested and invested in researching a specific scientific
question but who lack the training or technical skills of a scientist.
This has required that we create easy-to-use interfaces and offer
users a set of analytic tools that are either familiar or easy for a
novice to grasp.
One of the first FieldScope projects that we deployed is
dedicated to studying water quality in the tributaries to the
Chesapeake Bay. Working together with environmental educators
throughout the Chesapeake Bay watershed, we identified
a set of water quality measurements that could be done by
students and teachers across a wide range of grades, and we
created a FieldScope application that displays not just student-
collected water quality data but also a wide variety of data
layers describing the land in the watershed, including land use,
impermeability, and nitrogen yield.
We also provided users with analysis tools that enable them to
create time plots and scatterplots for the data that they have
collected, and we implemented a set of hydrologic analysis tools
that will help them understand the underlying dynamics of the
watershed. For example, we have provided users with a flow path
tool that allows them to click anywhere in the watershed and see
the path that water will flow from that point to the bay. Users
A FieldScope map from the Chesapeake Water Quality Project showing a student's water quality measurement.

49Unlocking the Educational Potential of Citizen ScienceEssays on Geography and GIS, Volume 5 December 2012
might employ this tool to see the portion of the river system that
would be affected by a point source of pollution.
This Chesapeake water quality project has proved very popular in
public schools; in the two years that it has been active, more than
600 teachers have received training on the software, and we have
recorded more than 40,000 visits to the site. It is also succeeding
in engaging users in analysis. In the first three quarters of 2011,
we recorded more than 75,000 geoprocessing events and more
than 45,000 uses of the query tools.
In the 2011–12 school year, both Fairfax County, Virginia, and
Anne Arundel County, Maryland, have incorporated the project
into their science curricula for all middle school students.
With support from the National Science Foundation, we are
currently in the process of expanding FieldScope's functionality
and creating authoring tools that will enable the broadest
possible community of citizen science projects to build
FieldScope applications for their own users. This spring, we will
be launching FieldScope applications for two national community
geography projects: Project BudBurst, which is studying
plant phenology, and Frogwatch, USA, which is studying the
distribution of amphibian species.
FieldScope, with its carefully designed user interface and
specially selected GIS tools, is beginning to unlock the potential
of citizen science as a learning experience. Teachers and students
have responded enthusiastically to the opportunity to participate
in geospatial analysis of data. In part, their enthusiasm stems
from the fact that it's data about their own community that they
helped collect. Administrators, in turn, are seeing that the entire
experience of community geography is enabling them to achieve
important learning outcomes for both science understanding and
science skills.
Our goal over the next few years is to bring this powerful
educational experience to as broad an audience as possible,
young and old, in school and out.
For more information about National Geographic FieldScope and
the Community Geography Initiative, visit natgeoed.org
/fieldscope.
(This article originally appeared in the Spring 2012 issue of ArcNews.)
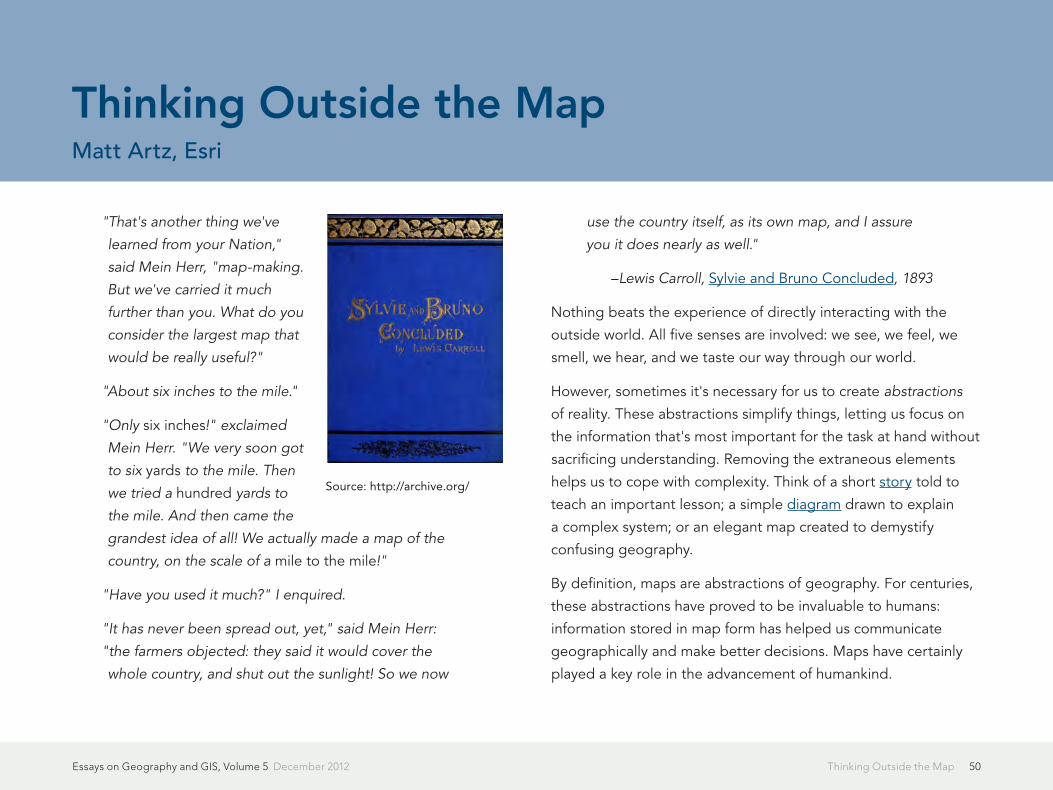
50Thinking Outside the MapEssays on Geography and GIS, Volume 5 December 2012
"That's another thing we've
learned from your Nation,"
said Mein Herr, "map-making.
But we've carried it much
further than you. What do you
consider the largest map that
would be really useful?"
"About six inches to the mile."
"Only six inches!" exclaimed
Mein Herr. "We very soon got
to six yards to the mile. Then
we tried a hundred yards to
the mile. And then came the
grandest idea of all! We actually made a map of the
country, on the scale of a mile to the mile!"
"Have you used it much?" I enquired.
"It has never been spread out, yet," said Mein Herr:
"the farmers objected: they said it would cover the
whole country, and shut out the sunlight! So we now
use the country itself, as its own map, and I assure
you it does nearly as well."
–Lewis Carroll, Sylvie and Bruno Concluded, 1893
Nothing beats the experience of directly interacting with the
outside world. All five senses are involved: we see, we feel, we
smell, we hear, and we taste our way through our world.
However, sometimes it's necessary for us to create abstractions
of reality. These abstractions simplify things, letting us focus on
the information that's most important for the task at hand without
sacrificing understanding. Removing the extraneous elements
helps us to cope with complexity. Think of a short story told to
teach an important lesson; a simple diagram drawn to explain
a complex system; or an elegant map created to demystify
confusing geography.
By definition, maps are abstractions of geography. For centuries,
these abstractions have proved to be invaluable to humans:
information stored in map form has helped us communicate
geographically and make better decisions. Maps have certainly
played a key role in the advancement of humankind.
Thinking Outside the MapMatt Artz, Esri
Source: http://archive.org/
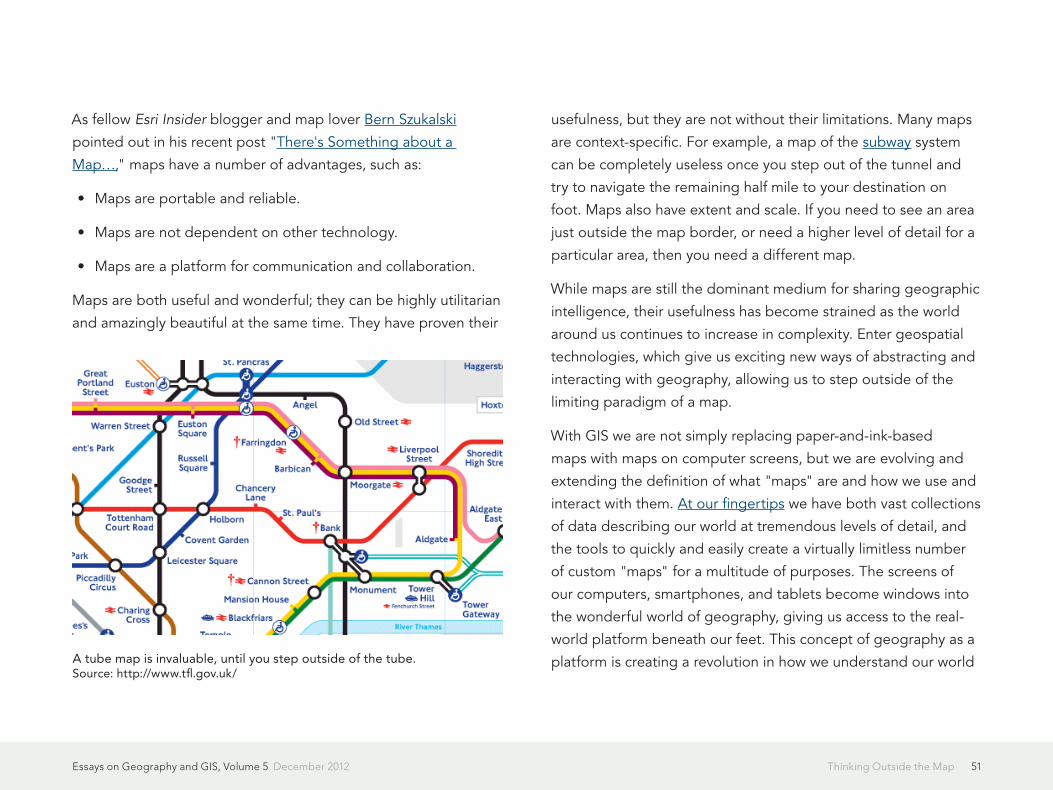
51Thinking Outside the MapEssays on Geography and GIS, Volume 5 December 2012
As fellow Esri Insider blogger and map lover Bern Szukalski
pointed out in his recent post "There's Something about a
Map…," maps have a number of advantages, such as:
• Maps are portable and reliable.
• Maps are not dependent on other technology.
• Maps are a platform for communication and collaboration.
Maps are both useful and wonderful; they can be highly utilitarian
and amazingly beautiful at the same time. They have proven their
usefulness, but they are not without their limitations. Many maps
are context-specific. For example, a map of the subway system
can be completely useless once you step out of the tunnel and
try to navigate the remaining half mile to your destination on
foot. Maps also have extent and scale. If you need to see an area
just outside the map border, or need a higher level of detail for a
particular area, then you need a different map.
While maps are still the dominant medium for sharing geographic
intelligence, their usefulness has become strained as the world
around us continues to increase in complexity. Enter geospatial
technologies, which give us exciting new ways of abstracting and
interacting with geography, allowing us to step outside of the
limiting paradigm of a map.
With GIS we are not simply replacing paper-and-ink-based
maps with maps on computer screens, but we are evolving and
extending the definition of what "maps" are and how we use and
interact with them. At our fingertips we have both vast collections
of data describing our world at tremendous levels of detail, and
the tools to quickly and easily create a virtually limitless number
of custom "maps" for a multitude of purposes. The screens of
our computers, smartphones, and tablets become windows into
the wonderful world of geography, giving us access to the real-
world platform beneath our feet. This concept of geography as a
platform is creating a revolution in how we understand our worldA tube map is invaluable, until you step outside of the tube. Source: http://www.tfl.gov.uk/

52Thinking Outside the MapEssays on Geography and GIS, Volume 5 December 2012
and plan for the future, all while avoiding the "paradox of the
complete map" that Lewis Carroll so eloquently described back
in 1893.
(This blog post originally appeared July 9, 2012, in Esri Insider.)

53Place-Based Knowledge in the Digital AgeEssays on Geography and GIS, Volume 5 December 2012
In Victor Hugo's The Hunchback of Notre
Dame, the archdeacon holds up a book
before the cathedral and says, "This will
kill that. The book will kill the edifice."1 Of
course, we know that the printing press
did not "kill" buildings. We still have
cathedrals and books, and indeed, most
books wouldn't survive very long unless stored in buildings.
But we also know that the book changed cathedrals, which had
been thought of as "books in stone," with the stories of the Bible
depicted in the statuary and stained glass of those buildings.
We still have cathedrals today, but they no longer have to serve
also as books, and so they have changed in fundamental ways,
becoming more abstract in form, more diverse in function, and
largely shorn of their didactic ornament.
I mention this because we find ourselves at another moment in
time where we could hold up a digital device—a laptop, tablet,
smartphone, or e-reader—and declare, in front of either a book
or a building, that "this will kill that." While we know that such
devices will not "kill" books, or buildings for that matter, we have
also gone far enough into the digital revolution to sense that
digital media—and spatial media like geographic information
systems—seem destined to have the same kind of effect as the
printed book did beginning some 500 years ago.
This brings to mind the observation of Marshall McLuhan that
each new technology "turns its predecessor into an art form."2
Books will indeed survive the onslaught of downloadable
e-books, but as we depend less and less upon books for
information or even as the most convenient way to access
information, we will increasingly value them as an art form,
as McLuhan put it—as beautiful objects and works of great
craftsmanship, exemplified in the rise of popular institutions such
as the Minnesota Center for the Book Arts.
And what about Victor Hugo's claim that books ultimately
trump buildings? Downloadable e-books have not "killed" the
library as a building type, but as happened with the cathedral
after the widespread adoption of the printing press, libraries
have increasingly become places where people go to have
experiences that they cannot find anywhere else. Like the modern
cathedral, the modern library will likely have a greater array of
functions; play a more social and less didactic role in people's
lives; and, at least partly, lose the primary purpose they once
Place-Based Knowledge in the Digital AgeBy Thomas Fisher, University of Minnesota

54Place-Based Knowledge in the Digital AgeEssays on Geography and GIS, Volume 5 December 2012
served of storing large quantities of books. It may be that, in
the future, we will go to libraries to admire the craftsmanship of
books and then interact with others about what we have learned
from the information we have downloaded on our portable
devices.
The biggest effect of the digital revolution, though, may be
less material and more metaphorical. As McLuhan argued, the
"medium is the message," with major changes in media leading to
changes in our metaphors and to the meanings that we ascribe to
the world.3 The mass-produced book led to a view of the world
as a kind of machine, a metaphor that reflected the very thing
that made this new media possible: the printing press. And that
change in metaphor, in turn, led to many of the revolutions that
followed: the Protestant Revolution in the sixteenth century, the
Scientific Revolution of the seventeenth century, the Democratic
Revolutions of the late eighteenth century, and the Industrial
Revolution of the nineteenth century.
The machine metaphor lasted well into the twentieth century and
paradoxically gave rise to the very technology—computers—that
would ultimately overturn that metaphor. In the early twentieth
century, we still heard people talk about the world in mechanistic
ways, with intellectuals like Leo Tolstoy calling the body "a living
machine"4 and Le Corbusier calling the house a "machine for
living in."5 Later in the last century, we still heard such mechanistic
analogies, such as the physicist Stephen Hawking regarding the
"brain as a computer."6
Computing, though, also gave us the Internet. And with that,
along with the miniaturization of computing in mobile devices,
we have gradually realized that computers represent not just a
faster form of computation but an entirely new medium, which
has brought with it a new metaphor that increasingly dominates
our view of the world. It took machines, in other words, to move
us from a mechanistic view of reality to a networked one. We
no longer view the brain as a kind of computer, but instead as
a neural network; no longer speak of society as a well-oiled
mechanism, but instead as a social network; and no longer see
the human body as a machine, but instead as part of the web of
life.
This shift in metaphor matters even more than the media that
has prompted it. We will, of course, continue to use machines
55Place-Based Knowledge in the Digital AgeEssays on Geography and GIS, Volume 5 December 2012
just as we will continue to use books, and so our material world
will remain layered with technologies of the past as well as the
present. But when we start to think of ourselves and see the
world differently, big things begin to happen, as we saw in
the wake of the printing press. Human relationships and social
structures change, as we have already seen in the "Arab Spring"
revolutions taking place in areas like North Africa, fueled by
the crowdsourcing capabilities of cell phone technology; in the
micro-lending revolution in the developing world, enabled by
the financial transfers possible through social networks; or in the
green revolution going on around the world, empowered by our
access to information formerly out of reach of ordinary people.
The metaphor may ultimately be the message that matters.
The Ecology of Being
This metaphor of the world as a network or web will alter our
intellectual lives as well. The old machine metaphor privileged
physics, mechanics, and engineering—three of the fields most
closely associated with mechanisms. The new web metaphor,
instead, draws from fields like biology and ecology, seeing in their
understanding of how natural ecosystems work a parallel to the
networked world we now occupy and informing us about human
ecosystems and how they relate to each other in particular places.
The increasingly weblike way of seeing the world, in turn, has
profound implications for how and in what form we will seek
information. The printed book offers us a linear way of doing
so. We begin at the beginning—or maybe at the end, with
the index—and work forward or backward through a book, or
at least parts of it, to find the information we need. Digital
media, in contrast, operate in networked ways, with hyperlinked
texts taking us in multiple directions, social media placing us
in multiple communities, and geographic information systems
arranging data in multiple layers. No one starting place,
relationship, or layer has privilege over any other in such a world.
The linearity of the book, compared to the multiplicity of the web,
leads to an even more fundamental shift in how we assess reality:
from a temporal to a spatial one. Like reading a book, we see
time as an arrow, a linear path with starting and ending points.
While we learned from Albert Einstein that we could slow time
down depending upon how fast we accelerate, we cannot reverse
time or occupy different speeds of time at the same time. But
that is not the case with space. Like the web, we can manipulate
space, move in multiple directions within it, and reverse it—tear a
space down, for example—if we choose.
The worldwide web, of course, often seems aspatial. It connects
us to people and places not in, and often far from, the actual
spaces we occupy. Indeed, this new weblike way of engaging
in the world appears to have collapsed both time and space,
making everything that ever existed anywhere in the world
immediately available to us, as if temporal or spatial distance no
longer mattered. Such effects, however, disguise the essentially
spatial nature of digital media. The laterally linked and complexly
56Place-Based Knowledge in the Digital AgeEssays on Geography and GIS, Volume 5 December 2012
networked nature of the web gives it a spatial form, conceptually
if not always physically. And the layering of data and simultaneity
of information through the web makes it place-based, even if that
"place" exists in virtual space.
This line of thinking, in turn, suggests that the current way we
store information—through digital documents and files—and
distribute it—through e-mail, e-books, e-zines, and the like—may
represent a transition stage in this technology. Such formats
mimic the forms that emerged from the printing press and paper
technology and, because of their familiarity, have enabled us
to adapt to the access of digital information more easily. But
they also reinforce a linear way of thinking about information
inherently at odds with the weblike way in which we increasingly
see the world.
GIS will eventually become a major way—perhaps the dominant
way—in which we will access information in the future because
of the essentially spatial nature of that software. Rather than see
information as discrete bits, accessed linearly and temporally, like
moving along a necklace of data, GIS layers information spatially,
linking it according to its relevance to other data on a given layer
and according to its relevance to all the other layers in a given
place. It allows us to "map" information, which may become the
primary way we organize, access, and distribute knowledge in the
future.
This use of spatial tools to match the spatial nature of a web will
have a profound effect on how we think about information itself.
The book led us to see information in highly discrete ways. By
packaging related content between two covers, books encourage
us to see knowledge as a set of distinct disciplines, each with
its own discourse and eventually its own set of assumptions and
use of language that made it increasingly hard for anyone else
not in that discipline to understand. And by sorting information
according to disciplines, books enabled us to think of knowledge
divorced from any particular physical or conceptual space. As
a result, we can take almost any subject—say, water—and find
that topic addressed in myriad ways by many disciplines—the
sciences and social sciences, literature and history, art and
poetry—all located in different places in a library and all
addressed in different ways through different disciplinary lenses.
That way of organizing knowledge has served us well in the last
several centuries as we have sought to understand and control
the world around us. But it's gotten in our way in recent decades,
as we have come to realize the damage we have done to the
world and the threat that that poses to our civilization and to us.
It has led, for example, to what Adam Smith called the paradox of
value, when he asked, at the beginning of The Wealth of Nations,
why we so value diamonds that have so little real use, and why
we don't value water, without which we cannot live.7 By dividing
information into discrete, disciplinary units, we have created what
we might call the paradox of knowledge: in which we have so

57Place-Based Knowledge in the Digital AgeEssays on Geography and GIS, Volume 5 December 2012
much information about the world and yet remain so ill informed
about our effect on the world.
This suggests that we may need to arrange knowledge differently
in the future, not according to disciplinary categories, but instead
according to spatial phenomena and, as Smith would say, to the
things without which we cannot live. GIS offers one way of doing
so. While the data-rich digital mapping of GIS arose, initially, to
ease geographic analysis and enhance spatial decision making,
it has the potential to organize knowledge in ways that align
more closely with the ways in which the world itself is organized:
spatially.
That may make sense in spatially oriented fields, like geography,
forestry, or planning, but how, you might ask, does that make
sense for fields that appear to have no spatial equivalent:
philosophy or pharmacy, history or histology, literature or
linguistics? It's a good question, but maybe the wrong one to
ask. It may be that we need to stop asking how to preserve our
disciplines, which, for all their value, remain abstractions of or at
best partial views of the world, and instead start asking how to
preserve what remains of the natural world, which our disciplines,
if they have any value, need to serve.
Spatializing Knowledge
How might GIS help us spatialize knowledge? Rather than
organize knowledge by type or discipline, we could use GIS to
embed all the knowledge relevant to a place in the myriad layers
of information about it. And as we scroll over a place, we can
select the pertinent layers and begin to see the relationships
among disciplines and the connections among data. So many
talk about the need for interdisciplinarity, but as long as we
organize knowledge in disciplinary silos, the connections among
disciplines will continue to elude us. When we instead begin to
organize knowledge spatially, the connections come to the fore,
as we focus less on the layers and more on the overlay of them
and on their relevance to particular situations.
This, of course, may seem too much to ask: the reorganization of
knowledge and the spatializing of education. We have, however,
58Place-Based Knowledge in the Digital AgeEssays on Geography and GIS, Volume 5 December 2012
managed over the last couple of centuries to temporalize
education. Every field has a history, and almost every one
requires that students study the history of the discipline as part
of knowing it. Indeed, historical understanding has become such
a part of what we define as an educated person that we take
it almost for granted, but it wasn't always so. It wasn't until the
nineteenth century that we assumed, as Georg Hegel argued,
that we couldn't fully comprehend anything without knowing its
history.
In the first decades of the twenty-first century, we need to see
that the same holds true for space as much as it does for time.
We cannot fully understand any field without also spatializing it,
without also seeing how it relates to every other discipline as they
come together in particular places, with a given group of people,
in specific social and environmental contexts. We need to know
how disciplines evolved over time, but we also need to know how
they, so to speak, hit the ground and how they play out as part of
the web that constitutes the whole of a place and of the people
there.
This does not mean that we should see such spatial analysis
as an end in itself. Except for historians, we rarely study
temporal phenomena—history—as an end in itself. In most
fields, history serves as a means to an end, as a way of better
understanding how the present came to be and what the future
might hold. The same is true for a spatial understanding of our
fields. Except for a few fields, like my own field of architecture,
which does study space as an end in itself, most disciplines will
likely see this weblike, spatial turn in our thinking as a means
of understanding their subject in new ways. Space represents,
like time, an a priori condition, as Immanuel Kant argued—a
precondition to everything else, and so having a sense of the
relationship of space and time—how a field evolved spatially as
well as temporally, what happened where as well as when—will
increasingly become necessary to fathom how we have done so
much damage to so many places and to the cultures of so many
people on the planet even as we purportedly know more about
them.
The spatializing of knowledge via its mapping onto places has
another advantage as well: it becomes a visual way of conveying
information across the barriers of language and to the growing
percentage of the human population that remains illiterate.
The book divides the literate and illiterate and, as such, has
helped reinforce the power of the former over the latter. Hugo
understood that when he had the archdeacon hold up the book
as killing the building. The medieval cathedrals spoke to both the
literate and illiterate and, in some respects, the book made large
stores of knowledge inaccessible to the latter.
The digital divide threatens that as well, with the wealthier parts
of the world having much more access to information than the
poorer parts. The web and cloud computing may help end that
division by making most of what we need to know available
at low cost, with "dumb" devices able to access information
59Place-Based Knowledge in the Digital AgeEssays on Geography and GIS, Volume 5 December 2012
anywhere in the world. But there remains the problem of literacy,
as well as translation, and so closing the digital divide through
such devices will only partly close the gap that exists between
those who have access to knowledge and those who don't.
We may never close the latter until we spatialize knowledge
through the use of visual tools like GIS. Enabling people to see
the information relevant to their lives, whether or not they can
read, and to map it to the places they know to understand the
conditions that affect their lives, could have a transformative
effect in empowering those who have been left behind by the
book and even by the early incarnations of the computer.
GIS may represent the leading edge of computer mapping
and visualization technology, but it also signifies, in some
respects, a return to the world that Hugo's archdeacon saw as
threatened. This brings to mind the observation of the novelist
and semiotician Umberto Eco—that modernism represented a
premedieval condition, which suggests that our post-postmodern
world may have more characteristics in common with the
medieval world than we have recognized.8
If the medieval cathedral tells its stories in stone and glass, GIS
tells them through layers and overlays. Both do so visually and
spatially, both speak to viewers whose language or even whose
literacy may not matter, and both reveal relationships and
meanings that no book could ever capture. At the same time, the
medieval cathedral and digital cartography both have the power
to move us to action, to help us see things with our own eyes and
without the interpretation of an author who might want to edit
what we know or affect what we think.
Just as the book helped give rise to the Protestant Revolution, in
which people wanted to read the Bible for themselves and make
up their own minds, so too might the visual and spatial power of
GIS someday give rise to a secular version of the same, in which
people, protesting the power of a few to control so much of the
knowledge about the world, will want to see that information for
themselves and make up their own minds.
Geodesigning the Future
This leads to my final point about the spatializing of knowledge.
The temporalizing of knowledge has, through the agency of
history, helped us understand the past and possibly comprehend
how the present came to be, but rarely do we venture very far
into the future. We call that science fiction or fantasy to set such
future-oriented thinking apart from what we can reliably know
about the world as it is or as it once was. And we tend to see
such work as somehow of lesser quality or validity than what the
sciences, social sciences, and humanities offer.
But spatial understanding has a different relationship to the
future, as well as the past and present. Spatial knowledge
recognizes place, rather than time, as the ultimate continuity in
our lives. And while none of us can see the future as a temporal

60Place-Based Knowledge in the Digital AgeEssays on Geography and GIS, Volume 5 December 2012
idea, we continually imagine the future of places, projecting
possible spatial arrangements based on what we see around us.
The design disciplines do this all the time, using spatial means to
imagine what could be, envisioning the future of a place, product,
or environment, and depicting that visually for others to see. We
commend or criticize a design and accept or alter it to fit our idea
of what should happen in a particular place or with a particular
product. We don't consider design a lesser discipline, simply a
different one, operating according to its criteria and assumptions.
I mention this because the leading edge of GIS rests with the
idea of "geodesign," the use of geographic analyses of what is as
the basis of making design decisions about what could be. Rather
than see future-oriented thinking as somehow fiction or fantasy,
geodesign allows us to connect what we know about the world
with what we might want the world to be. Just as GIS can serve
as a means of organizing knowledge spatially, geodesign might
serve as a means of projecting that knowledge into the future
and assessing its merits based on what we know about a place.
Why does this matter? Because we stand on a similar precipice
as Hugo's archdeacon, with even more drastic implications. We
might well say that "this will kill that," but in our case, "this"
represents modern civilization and "that," the natural world. Since
the rise of the book, although not necessarily because of it, we
have devised a Ponzi scheme with the planet over the last couple
of centuries, exploiting natural resources, other species, foreign
cultures, and even future generations to keep those at the top of
this pyramid scheme enriched.
As we know from the collapse of other, smaller Ponzi schemes,
such frauds cannot last. They tend to collapse suddenly and
without warning, and those most enriched by the scheme—us—
have the farthest to fall. The only way we can avoid such a fate is
to realign our relationship with the natural world, to reorganize
our considerable knowledge about it to reveal the forces that
lead to our unsustainable practices, and to relearn how to
steward what remains of the planet we have so altered. And if we
don't, we have only to alter the terms of Hugo's observation only
slightly. This—the collapse of our Ponzi scheme—will kill that—
the civilization we have built up over the last 200 years.
The spatialization of our knowledge, in other words, isn't just an
academic exercise or the result of some arcane interest of a few
spatial thinkers or GIS specialists. With it, we can begin to set the
foundation for a more sustainable future for ourselves as we see
the impact of our actions and the relevance of our knowledge to
the particular places in which we live. This will not kill anything
except the ridiculous illusion that we can continue to live beyond
the carrying capacity of our planet. And doing so is not just about
space; it's about time!

61Place-Based Knowledge in the Digital AgeEssays on Geography and GIS, Volume 5 December 2012
About the Author
Thomas Fisher is a professor in the School of Architecture and
dean of the College of Design at the University of Minnesota in
the Twin Cities. This paper is based on Fisher's keynote address
to the GeoDesign and Spatializing the University meeting of the
Big 10 university librarians, May 2012.
(This article originally appeared in the Fall 2012 issue of ArcNews.)
References
1. Hugo, Victor. The Hunchback of Notre Dame. New York, New
York: Modern Library, 2002. Book V, Chapter 2.
2. McLuhan, Marshall. Understanding Media, The Extensions of
Man. Cambridge, Massachusetts: MIT Press, 1994. Preface, ix.
3. Ibid. p. 8–13.
4. Tolstoy, Leo. War and Peace. New York, New York: Modern
Library, 2002. p. 241.
5. Le Corbusier. Towards an Architecture. Los Angeles, California:
Getty Publications, 2007.
6. Sample, Ian. "Stephen Hawking: ‘There is no heaven; it's a
fairy story,'" The Guardian. Sunday, May 17, 2011.
7. Smith, Adam. The Wealth of Nations. New York, New York:
Modern Library, 1994. Book 1, Chapter 4.
8. Eco, Umberto. The Aesthetics of Chaosmos: The Middle
Ages of James Joyce. Cambridge, Massachusetts: Harvard
University Press, 1989.
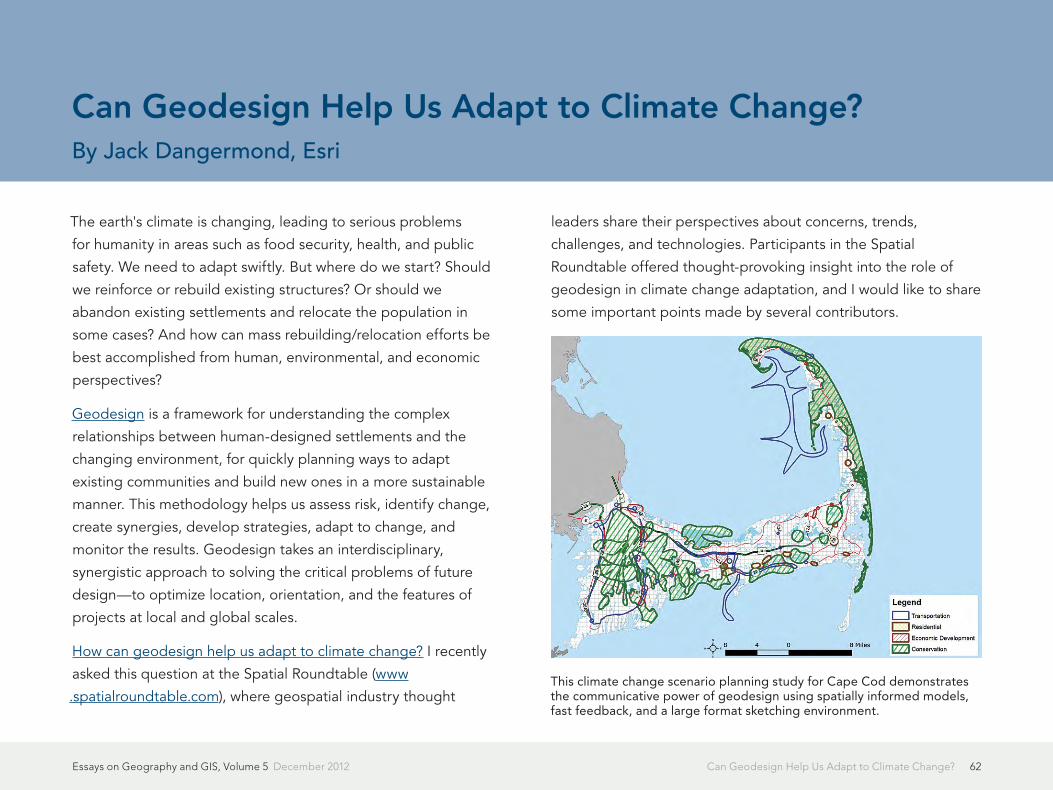
62Can Geodesign Help Us Adapt to Climate Change?Essays on Geography and GIS, Volume 5 December 2012
The earth's climate is changing, leading to serious problems
for humanity in areas such as food security, health, and public
safety. We need to adapt swiftly. But where do we start? Should
we reinforce or rebuild existing structures? Or should we
abandon existing settlements and relocate the population in
some cases? And how can mass rebuilding/relocation efforts be
best accomplished from human, environmental, and economic
perspectives?
Geodesign is a framework for understanding the complex
relationships between human-designed settlements and the
changing environment, for quickly planning ways to adapt
existing communities and build new ones in a more sustainable
manner. This methodology helps us assess risk, identify change,
create synergies, develop strategies, adapt to change, and
monitor the results. Geodesign takes an interdisciplinary,
synergistic approach to solving the critical problems of future
design—to optimize location, orientation, and the features of
projects at local and global scales.
How can geodesign help us adapt to climate change? I recently
asked this question at the Spatial Roundtable (www
.spatialroundtable.com), where geospatial industry thought
leaders share their perspectives about concerns, trends,
challenges, and technologies. Participants in the Spatial
Roundtable offered thought-provoking insight into the role of
geodesign in climate change adaptation, and I would like to share
some important points made by several contributors.
Can Geodesign Help Us Adapt to Climate Change?By Jack Dangermond, Esri
This climate change scenario planning study for Cape Cod demonstrates the communicative power of geodesign using spatially informed models, fast feedback, and a large format sketching environment.

63Can Geodesign Help Us Adapt to Climate Change?Essays on Geography and GIS, Volume 5 December 2012
Designing Our Future
"Geodesign proposes to support decisions about the surface
of the Earth through a combination of two sets of tools: one
to allow designers to sketch proposals as they appear in map
form, and the other to provide scientifically sound assessments
of proposals through the execution of computer-based models,"
said Dr. Michael Goodchild, professor of geography, University
of California, Santa Barbara. "For example, a designer should
be able to sketch a design for a development near a coastline,
and to evaluate it based on scientific models of sea-level rise, as
well as pollution of air and water, impacts on traffic congestion,
and other environmental and social dimensions. By including
projections of the effects of climate change, this approach
offers a coherent and scientifically based way of addressing key
decisions about development and land-use change."
A Global Dashboard
"If we really want to feed 9 billion people by the middle of this
century, we need spatial data systems with real-time monitoring
capacity and a data dissemination capability that can reach all
stakeholders directly," said Dr. Wim Bastiaanssen, cofounder,
eLEAF. "Without daily updates of intelligent, pixel-based data
components, the great capacity of geodesign will not reach
its full potential to support daily decisions in natural resources
management—and become more climate resilient across the
world. A data-enriched geodesign system supports authorities,
policy makers, water managers and individual farmers to make
firm decisions. Geodesign principles fed with quantified crop,
water, and climate data components must become one click away
for everybody."
Scenario Development
"I am especially interested in the role geodesign might play in
environmental scenario development," said Dr. Elena Bennett,
assistant professor, McGill University. "Scenarios, sets of stories
about the future, can be a useful technique for thinking about a
range of potential futures. In the environment, scenarios are often
used to understand situations of uncontrollable or unpredictable
futures, of which climate change is a classic example.
Environmental scenarios can be qualitative or quantitative, and
are often associated with images, but rarely with maps. I am
interested in the potential for mapping scenarios, and for using
geodesign as a way to bring together multiple disciplines to
improve development and understanding of environmental
scenarios in situations of climate change."
Integrating Knowledge
"Geodesign, by bringing multiple disciplines into a common
geographic perspective, is the ideal integrator—helping societies
identify those regions and policies where the interactions
between climate stress and differing socioeconomic conditions
are likely to make the most difference," said Dr. James Baker,

64Can Geodesign Help Us Adapt to Climate Change?Essays on Geography and GIS, Volume 5 December 2012
director, Global Carbon Measurement Program, William J. Clinton
Foundation. "The resultant visualization and modeling will give
guidance on the most efficient and effective ways to adapt both
in the short and the long term. The long-term impact of climate
change looms large—the sooner we can begin to adapt with
tools like geodesign, the more resilient our societies will be in the
future."
The Issue of Scale
"GIS, as a spatially based technology, offers a powerful approach
to both the sketch and assessment aspects of geodesign,
allowing decisions and their impacts to be investigated at a full
range of scales from the very local to the global," said Goodchild.
Dave Williamson, founding partner, Cascade Environmental
Resource Group, agreed that scalability is a key issue: "Climate
change is a global issue, and the models tend to operate at a
global scale. However, planning decisions must consider meso-
scale influences, while implementation generally takes place at a
regional or local scale."
A Responsive Framework
"Geodesign should strive to provide a systematic and consistently
applied methodology for assessing risk and potential outcomes,"
added Williamson. "The current state of the science of climate
change is such that new information is coming to light on a
regular basis and yesterday's accepted fact is tomorrow's fallacy.
Geodesign should provide a dynamically responsive framework
that can accommodate the ongoing shifts in the climate change
model. When it comes to planning in response to climate change,
the future will belong to the speedy and the integrated."
Moving Forward
"The geodesign framework is to be welcomed as another
powerful arrow in the quiver of approaches and tools that will
help us to plan and implement climate-smart development
measures," said Gernot Brodnig, geographer, World Bank.
"The time for implementation of strategic and tactical projects
based upon this understanding is now," added Dr. Nguyen
Huu Ninh, Nobel Prize winner and chairman of CERED. "Making
wise decisions to accommodate emerging changes will have
major positive impacts on the health, security, and prosperity of
populations in high risk areas around the globe."
I'd like to thank all of the Spatial Roundtable participants for
their valuable insights on this important topic. You can read the
complete responses here.
(This blog post originally appeared April 23, 2012, in Esri Insider.)
65Break-the-Mold Approaches to Geography LearningEssays on Geography and GIS, Volume 5 December 2012
Before you read this column, I want you to pause for a moment to
consider the following question: How could we make geography
learning more enjoyable for young people?
My nonscientific research indicates that about 1 percent of the
general public enjoy learning geography so much that they
cannot imagine a way to make it more enjoyable (you know
who you are). The rest of us tend to generate ideas like making
geography learning into a game, making it more relevant, or
adding rewards.
I don't think people's answers to the question are nearly as
interesting as what flashes into their minds when asked to
think about geography learning. My nonscientific research on
this reveals that most of us picture very traditional classroom
activities: memorizing place-names and locations, learning
to interpret maps, reading about foreign cultures, analyzing
population pyramids, and tracing migration paths. Two things
tend to characterize that image: it doesn't feel relevant or useful
to the learner, and it doesn't feel inherently enjoyable. So when
we think about improving geography learning, we think about
how we can change those experiences.
There are a small number of people out there, however, who
summon up very different images when they think about
geography learning. Maybe they never experienced traditional
geography education, or maybe they experienced it and have
completely rejected it as a model for learning. They envision
activities that feel both relevant and enjoyable. These are
the people we need to find and listen to, because they don't
think about improving geography education by incrementally
improving traditional approaches. They think about completely
new approaches to geography teaching and learning.
One place where you can find people like that is in the
Geography Collective, a group of innovative thinkers in the
United Kingdom. They describe themselves in the following way:
"We are a collective of geography activists, teachers, therapists,
academics, artists, and guerrillas. We've come together to
encourage [young] people to see our world in new ways."
Break-the-Mold Approaches to Geography LearningBy Daniel C. Edelson, Vice President for Education, National Geographic Society

66Break-the-Mold Approaches to Geography LearningEssays on Geography and GIS, Volume 5 December 2012
The members of the Geography Collective characterize
themselves as "guerrilla geographers," and their goal is to
engage others in guerrilla geography. By their definition,
guerrilla geography consists of "operations carried out by small,
independent geographers to cause thought [and] connected
thinking, stimulate the public, and to wear down public
resistance to geography, usually carried on by a number of small
groups behind public lines or in occupied spaces. . . . Guerrilla
geography is irregular [direct action] educating."
Its approach to engaging people in guerrilla geography is
through a set of miniadventures that are designed for young
people to do by themselves or with adults. These adventures—or
"missions," as the Geography Collective calls them—encourage
exploration. They challenge participants to explore either new or
familiar places with new perspectives.
These missions are always quirky and often have a sense of
playful mischief about them. One mission asks explorers to
locate places where one neighborhood ends and another begins
and then explain how they know. Another asks them to "go
outdoors in search of the most beautiful poo you can find [it's
a kid thing]. When you discover it, take a picture of it." A third
asks them to explore the world from a bug's-eye view by taking
macrophotographs. And a fourth, called Avoid Seeing Red,
instructs explorers, "If you see red, shield your eyes, look irritated,
and walk in another direction."
The Geography Collective shares its missions with children,
parents, and educators through a series of books and a website,
Mission:Explore. The website offers points for completing
missions and allows explorers to collect points toward "badges"
as rewards.
Behind the playfulness and quirkiness of the Geography
Collective's missions are carefully considered philosophical
and educational stances. One is that young people should be
encouraged to explore their surroundings and express their own
opinions about the positive and negative aspects of different
spaces. Another is that they should recognize their own role
in shaping the world. Underlying all of what the Geography
The Geography Collective's Mission:Explore website.
67Break-the-Mold Approaches to Geography LearningEssays on Geography and GIS, Volume 5 December 2012
Collective does is the goal of teaching geography as a method
for observing the world and deciding how to act in it.
The Geography Collective does not position its approach to
geography learning in opposition to traditional geography or
even as an alternative. It presents its approach as providing an
additional set of experiences that are disappearing from the
modern world, where children are taught that all the interesting
things in the world have already been discovered and adults
believe it's more important to protect young people from the
hazards of the world around them than to give them the chance
to explore it.
The Geography Collective is one of the most creative groups in
geography education today, and every time I learn more about
its work, I get more excited about it. However, I do find myself
wishing that creative approaches to geography teaching and
learning were not so unusual. This is just one transformative
approach to geography learning, and it is not going to resonate
with everyone. Where the Geography Collective's approach is
quirky and playful, others might be practical and serious—but
equally effective and motivating to learners.
I can't help feeling that truly creative approaches to geography
learning are discouragingly few and far between right now. Too
few people are even thinking about geography education, and
those who are still focus too much on incremental improvements
rather than entirely new approaches. We should take the
Geography Collective members and others like them as
inspiration. We must challenge ourselves to think more creatively
and seek out and promote the creative ideas of others.
(This article originally appeared in the Fall 2012 issue of ArcNews.)
68Monitoring Our Planetary Pulse Essays on Geography and GIS, Volume 5 December 2012
Geography has for many years been concerned with exploring
and describing our world. Historically, explorers commanded
grand expeditions to the farthest reaches of the globe.
This golden age of exploration contributed greatly to our
understanding of how our world works.
This was followed by the space age—an era where we left the
planet and turned our cameras and sensors to look back on
our home, giving us an entirely new perspective. Bound to the
surface of earth for millennia, humankind was getting its first
opportunity to look at our planetary system as a whole—from a
few hundred miles up in space.
While data remotely sensed from satellites continues to play
an important role in monitoring and understanding our planet,
"earth observation" has more recently taken on a whole new
dimension thanks to deployment of an increasingly complex
and pervasive network of earthbound sensors. These sensors
are practically everywhere you look—as well as in places you
could never imagine. From stream gauges to seismographs,
from weather stations to air quality monitors, from ocean buoys
to even our cell phones, countless sensors are measuring and
collecting important data about our planet at a rate that seemed
impossible just a short time ago.
We're collecting more information about the geography of planet
earth today than ever before. New data sources, along with
the sheer volume of data being collected, are spawning a new
age of exploration. But the new explorers are navigating a vast,
uncharted sea of data. What do we do with all of this sensed
data? How can we make sense of the sensor web?
A Global Dashboard
Modern science and advanced technology have resulted in
unprecedented access to global environmental information
through the placement of countless sensors across the planet—
and the linking together of this information through the Internet.
The sensor web has inundated us with data that needs to be
stored, managed, analyzed, and used to inform better decisions
about our many social and environmental challenges. Integrating
and synthesizing all this disparate sensor data into a single,
comprehensive view—a global dashboard—is our next great
opportunity for exploring our world.
Monitoring Our Planetary Pulse Global Dashboards Help Us Make Sense of the Sensor Web—and Our Planet
By Matt Artz, Esri
69Monitoring Our Planetary Pulse Essays on Geography and GIS, Volume 5 December 2012
The dashboard of your car presents you with high-level feedback
on the current status or "health" of various subsystems that make
up your vehicle. It's designed such that a simple glance gives
you a quick summary of the status of the entire car. This leads
to an understanding that informs your driving decisions and
determines your actions.
As our planet speeds toward the future, all passengers on
'spaceship earth' can benefit from a simple, easy-to-understand,
dynamic overview of the health of our planet. A "global
dashboard" is a decision support tool to help us monitor current
conditions, identify change, and drive informed action. This tool
would operate as a framework for taking many different pieces of
past, present, and future data from a variety of sources, merging
them, and displaying them in an easy-to-read-and-interpret
format that indicates where action needs to be taken. It enables
exploration at scales from global to local, allowing us to visualize
large, complex global spatial information in the context of our
neighborhoods, our streets, and our houses.
Technology Is the New "Natural"
In the twenty-first century, information technology is becoming
our most valuable tool for managing complexity and designing
a better world. We tend to think of "environment" and
"technology" as two opposing, almost mutually exclusive ends of
the spectrum. But as technology becomes more pervasive in our
world and more tightly integrated with our very existence, in fact
the opposite is true. If we do it correctly, this integration will allow
humans to enter a more mutually beneficial relationship with the
environment.
"Technology offers a continually, if unevenly, expanding domain
of increasing human control and power in the world, and in the
process, technology continually transforms the natural and social
worlds," say Braden Allenby and Daniel Sarewitz. "Technology
embodies the modern ideal of applying rationality to the
betterment of humankind."1
At its core, technology extends human abilities. As Marina Gorbis
has said, technology amplifies our capabilities, "enabling us to
do things we never dreamed of doing before."2 To meet the
monumental challenges of the future, David Kirkpatrick states
that "we will only be successful if we unreservedly embrace
technology and innovation as essential tools."3
We now live in a new era where technology is redefining man's
relationship with the environment. Perhaps nowhere was this
more eloquently predicted than in Richard Brautigan's 1967 poem
"All Watched Over by Machines of Loving Grace," where he
painted a vivid picture of a future where nature and technology
are inextricably linked in a mutually beneficial relationship.
I like to think (and
the sooner the better!)
of a cybernetic meadow
where mammals and computers

70Monitoring Our Planetary Pulse Essays on Geography and GIS, Volume 5 December 2012
live together in mutually
programming harmony
like pure water
touching clear sky.
I like to think (right now please!) of a cybernetic
forest filled with pines and electronics where deer
stroll peacefully past computers as if they were
flowers with spinning blossoms.
I like to think (it has to be!) of a cybernetic ecology
where we are free of our labors and joined back to
nature, returned to our mammal brothers and sisters,
and all watched over by machines of loving grace.4
This prophetic vision of our utopian environmental future may
seem quite frightening to some people, but I would suggest
that it is already here. The computers are here, the sensors
are here, and the data is here. Our next challenge is to turn
the data into actionable information and use it to create a
better future for ourselves and the environment. But those
worried about the "Big Brother"-ness of such a vision may look
toward Adam Greenfield's essay for help in establishing ethical
guidelines for user experience in ubiquitous-computing settings.
Taking part of its title from Brautigan's poem, the essay provides
a useful example of five principles that meet the dual requirement
of being both useful and humane:
• Default to harmlessness.
• Be self-disclosing.
• Be conservative of face.
• Be conservative of time.
• Be deniable.5
Greenfield's focus is weighted toward doing no harm to humans,
but still presents us with valuable concepts such as transparency
and reversibility, which can be applied to the use of global
dashboards.
Moving Forward
We live in a world full of sensors. Thanks to the rich information
flow they provide and the availability of new mapping tools to
display and analyze this information in context, now everyone can
be an active participant in the journey of spaceship earth. This
has far-reaching benefits to both society and the environment,
ushering in a new era of understanding and leading us toward
more informed, equitable, and sustainable action.
The global dashboard is already here; it's just not in the form
we expected. It's not a single, massive, integrated system, but a
distributed system of published services that can be consumed
by anyone on the Internet. These services can then be combined,
visualized, and analyzed using a variety of applications across

71Monitoring Our Planetary Pulse Essays on Geography and GIS, Volume 5 December 2012
different mediums. The result is not a single global dashboard,
but a multitude of dashboards designed to help us monitor and
address a plethora of specific problems and issues.
As technology becomes more tightly integrated into virtually
everything we do, we need to understand that it's not a blessing,
nor is it a curse—it's simply a tool of our own creation, a tool to
help us move down the path toward our destiny. Or, as Allenby
and Sarewitz note, "technology is neither the answer nor the
question, it's just the condition."6
References
1. Allenby, Braden, and Daniel Sarewitz (2011). The Techno-
Human Condition.
2. Gorbis, Marina (2011). "Human plus Machine."
3. Kirkpatrick, David (2011). "How To Be An Optimist In A
Pessimistic Time." TechCrunch.
4. Brautigan, Richard (1967). "All Watched Over by Machines of
Loving Grace."
5. Greenfield, Adam (2004). "'All Watched Over by Machines of
Loving Grace': Some Ethical Guidelines for User Experience in
Ubiquitous-Computing Settings."
6. Allenby and Sarewitz, The Techno-Human Condition.

72Geo-Education: Preparation for 21st-Century DecisionsEssays on Geography and GIS, Volume 5 December 2012
Geo-education is about preparing people to make the important
decisions we will all face in the 21st century. At National
Geographic, we call people who are prepared to make these
decisions geo-literate.
Geo-literacy requires three kinds of understanding:
Interactions—A geo-literate individual understands that the
world is composed of interacting systems that move and
transform resources. These may be social systems, like political,
economic, and cultural systems. They may be technological
systems, like transportation, energy transmission, and
communications systems. Or they may be environmental systems,
like hydrological, atmospheric, and ecological systems.
Interconnections—A geo-literate individual understands that
these systems connect people and places to each other. This
means that events that happen in one location affect other
people and places. It also means that our actions affect other
people and places.
Implications—A geo-literate individual is able to use his or her
understanding of interactions and interconnections to make
well-reasoned decisions. This means being able to anticipate
the cascading consequences of actions that result from systems
interactions and interconnections among people and places. It
also means being able to weigh costs and benefits for oneself, for
one's community, and for other people and places when making
decisions.
More important than what it requires is what geo-literacy enables
you to do. Here are six categories of critical decisions that
geo-literacy prepares people to make:
Community life—A geo-literate individual understands the
factors that improve or degrade the quality of life in a community.
These factors include everything from walkability to cultural
resources to housing stock. A geo-literate individual is able to
use that understanding to (1) make good personal choices about
where to live and spend time, and (2) make good civic choices
about how to improve the quality of life in his or her community.
Location and transportation—A geo-literate individual is
able to reason through problems involving site selection and
transportation planning. These problems come up in personal,
professional, and civic life, but they are particularly important in
professional life in the modern world. Individuals with geospatial
reasoning skills are in high demand in fields as diverse as military
Geo-Education: Preparation for 21st-Century DecisionsBy Daniel C. Edelson, Vice President for Education, National Geographic Society

73Geo-Education: Preparation for 21st-Century DecisionsEssays on Geography and GIS, Volume 5 December 2012
logistics, intelligence, natural resources management, and
supply-chain management.
Interactions across cultures—Our local communities are
increasingly diverse, and our daily lives increasingly involve
interactions with people in faraway places. Both of these trends
make it important that members of our society be culturally
literate, meaning able to communicate and collaborate effectively
with individuals from different cultures.
Environmental and social impacts—Both the connections that
knit together our world ever more tightly and the growth in our
global population mean that the impacts of our actions on the
environment and on other people are amplified. This makes it all
the more important that we all be able to anticipate the potential
environmental and social impacts of our actions and make
decisions accordingly.
Global affairs—While most individuals' direct influence on global
affairs is limited, people throughout the world have growing
opportunities to shape global affairs through participation
in political processes and public opinion. So geo-literacy is
important to be able to participate in the public debate about
trade, diplomacy, military action, and foreign aid.
Acts of caring—By "acts of caring," I mean actions to improve
the lives of other people or care for the world that we share. This
includes efforts to alleviate poverty, reduce hunger, or improve
health care and education. It also includes wildlife conservation
and environmental restoration. Whether one is taking action
oneself or providing financial support, it is important to be able
to make informed decisions about what actions are most likely to
have a meaningful and lasting impact. This requires geo-literacy.
The challenge of geo-education is weaving the knowledge and
reasoning skills required to make these six categories of critical
decisions into the written curriculum of schools and the unwritten
curriculum of home and community life. This is a challenge that
we have not yet taken on explicitly in our modern society, but we
must all take it on if we are to prepare today's youth for the world
they will inherit.
(This article originally appeared in the Summer 2012 issue of ArcNews.)

74The 50th Anniversary of GISEssays on Geography and GIS, Volume 5 December 2012
Some events, like birthdays,
weddings, and graduations, are
easy to mark on the calendar.
Others, like the beginning
of a social movement or a
language—or the invention of
GIS—are harder to pinpoint.
However, the confluence of
three pivotal events in 1962
and 1963 makes this as good a
time as any to celebrate a half-
century of GIS.
The first event was the
establishment of the Canada
Land Inventory (CLI) in 1962. CLI set out to produce about
1,500 maps of land use and land capabilities at 1:50,000 and
1:250,000 scales. Though the maps were made by traditional
manual methods, Roger Tomlinson (then employed by Spartan
Air Services of Ottawa) convinced the head of CLI that computers
could be used to automate map analysis. CLI invited Tomlinson
to define the functional requirements of what would later be
called the Canada Geographic Information System. His carefully
considered use of the qualifier "geographic" caught on and
has created opportunities and challenges for the discipline of
geography ever since.
In August 1963, just as Tomlinson delivered his feasibility report
to CLI, Edward Horwood of the University of Washington
organized the First Annual Conference on Urban Planning
Information Systems and Programs. Within a few years, that event
became the annual conference of a new organization called the
The 50th Anniversary of GISBy David DiBiase, Esri
Roger Tomlinson
The title page of Roger Tomlinson's 1962 paper that started the work on GIS in the Government of Canada.
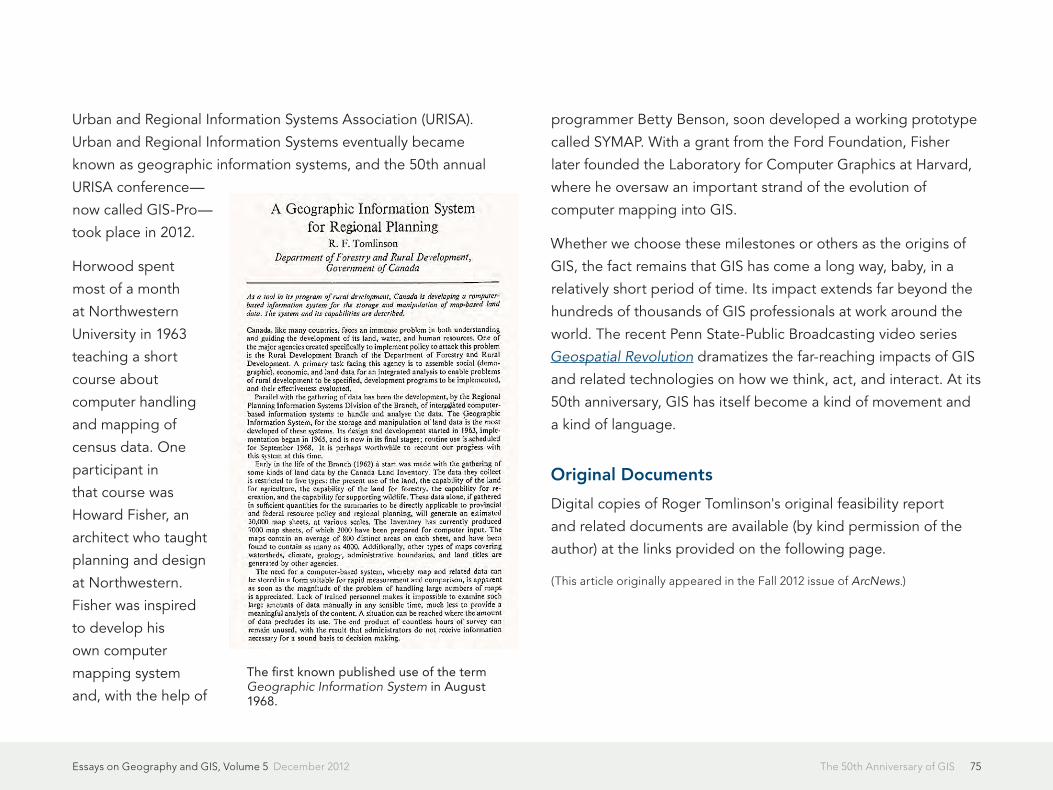
75The 50th Anniversary of GISEssays on Geography and GIS, Volume 5 December 2012
Urban and Regional Information Systems Association (URISA).
Urban and Regional Information Systems eventually became
known as geographic information systems, and the 50th annual
URISA conference—
now called GIS-Pro—
took place in 2012.
Horwood spent
most of a month
at Northwestern
University in 1963
teaching a short
course about
computer handling
and mapping of
census data. One
participant in
that course was
Howard Fisher, an
architect who taught
planning and design
at Northwestern.
Fisher was inspired
to develop his
own computer
mapping system
and, with the help of
programmer Betty Benson, soon developed a working prototype
called SYMAP. With a grant from the Ford Foundation, Fisher
later founded the Laboratory for Computer Graphics at Harvard,
where he oversaw an important strand of the evolution of
computer mapping into GIS.
Whether we choose these milestones or others as the origins of
GIS, the fact remains that GIS has come a long way, baby, in a
relatively short period of time. Its impact extends far beyond the
hundreds of thousands of GIS professionals at work around the
world. The recent Penn State-Public Broadcasting video series
Geospatial Revolution dramatizes the far-reaching impacts of GIS
and related technologies on how we think, act, and interact. At its
50th anniversary, GIS has itself become a kind of movement and
a kind of language.
Original Documents
Digital copies of Roger Tomlinson's original feasibility report
and related documents are available (by kind permission of the
author) at the links provided on the following page.
(This article originally appeared in the Fall 2012 issue of ArcNews.)
The first known published use of the term Geographic Information System in August 1968.

76The 50th Anniversary of GIS
Sources
Chrisman, Nick. 2006. Charting the Unknown: How Computer
Mapping at Harvard Became GIS. Esri Press.
Tomlinson, Roger. 1998. "The Canada Geographic Information
System." In Timothy Foresman, ed. The History of Geographic
Information Systems: Perspectives from the Pioneers. Prentice Hall.
Further Reading
The following are some of Roger Tomlinson's original documents
from which grew the important and exciting field we know today
as GIS, as well as a new article written by him about the origins of
the Canada Geographic Information System:
An Introduction to the Use of Electronic Computers in the
Storage, Compilation and Assessment of Natural and Economic
Data for the Evaluation of Marginal Lands [PDF], by Roger
Tomlinson. 1962. "This is the paper that started the work on GIS
in the Government of Canada."—Roger Tomlinson
Feasibility Report of Computer Mapping System [PDF], by
Roger Tomlinson. Agricultural Rehabilitation and Development
Administration, Department of Agriculture, Government of
Canada, August 1963.
An Introduction to the Geo-Information System of the Canada
Land Inventory [PDF], by Roger Tomlinson. 1967.
A Geographic Information System for Regional Planning [PDF], by
Roger Tomlinson. August 1968.
Essays on Geography and GIS, Volume 5 December 2012

77Origins of the Canada Geographic Information SystemEssays on Geography and GIS, Volume 5 December 2012
This article has been paraphrased from Roger Tomlinson and
M. A. G. Toomey, "GIS and LIS in Canada," chapter 15 in
Mapping a Northern Land: The Survey of Canada 1947–1994,
Gerald McGrath and Louis Sebert, eds. (McGill-Queen's
University Press, 1999).
At the heart of the innovations that led to the Canada Geographic
Information System was the fundamental idea of using computers
to ask questions of maps and to render useful information from
them. To do this, maps had to be in digital form. This led to
the idea that many digital maps could be stitched together to
represent the whole of Canada and that the maps could be linked
intelligently to digital databases of statistics, such as the Census.
Fifty years later, this brief article recalls the people, organizations,
and circumstances that gave rise to these original ideas, and how
the ideas played out.
In 1960, Spartan Air Services of Ottawa, Canada, was a large
surveying and mapping company whose business included
topographic mapping, geophysical surveys, land resources
surveys, and other projects worldwide. Some projects required
manual analysis of mapped data. However, since manual analysis
was almost as costly as the surveys themselves, not infrequently
the proposals for map analysis were rejected by both clients and
Spartan's management because they were too costly.
George Brown, chief of Spartan's land resources division,
permitted me to try digital methods as a potentially cost-
effective alternative. I created two small test maps in numerical
coordinate form—each 5 x 5 inches and containing five polygons.
I found that these could be digitally overlaid and that I could
measure the resulting areas from the digital record.
Efforts to interest Ottawa computer companies (Computing
Devices of Canada, IBM, Sperry, and Univac) to partner with
Spartan for future development were not successful. However,
in 1962, at an ASPRS conference in Washington, DC, John Sharp,
a consultant to IBM, introduced Spartan to the digital
photogrammetric research being done at IBM in Poughkeepsie,
New York, in the United States. That, along with subsequent
contacts with the previously reluctant staff in the IBM office in
Ottawa, was the beginning of a pivotal relationship that was to
grow significantly over the years. IBM brought early experience
with computers and programming to the table. I brought an
understanding of the needs, as well as the geographical training
Origins of the Canada Geographic Information SystemBy Roger Tomlinson
78Origins of the Canada Geographic Information SystemEssays on Geography and GIS, Volume 5 December 2012
needed to formulate the new concepts and to spell out the
requirements for the system.
Another pivotal encounter was a chance meeting with Lee Pratt
in 1962. Canada had recently passed into law the Agricultural
Rehabilitation and Development Act. That legislation created
a need for an inventory of land use and land capability across
Canada. Thus was the Canada Land Inventory (CLI) established
in 1962. Pratt was the new head of the CLI. The CLI planned to
create about 1,500 maps of the commercially productive parts
of Canada at scales of 1:50,000 and 1:250,000. These were to
show the capability of land for agriculture, forestry, wildlife, and
recreation, as well as present land use and the boundaries of
census subdivisions. Like Spartan and me, Pratt and the CLI faced
the problem of how to efficiently analyze a large number of maps.
The idea of using computers to do this was very attractive.
Pratt urged me to write a paper entitled Computer Mapping: An
Introduction to the Use of Electronic Computers in the Storage,
Compilation and Assessment of Natural and Economic Data
for the Evaluation of Marginal Lands. I presented the paper
to the National Land Capability Inventory Seminar in Ottawa
in November 1962. It was well received. The Department of
Agriculture subsequently awarded a contract to Spartan to carry
out a technical feasibility study for the CLI. The outcome of that
study was the Feasibility Report of Computer Mapping System
that I prepared and delivered to the Agricultural Rehabilitation
and Development Administration (ARDA) in August 1963.
In retrospect, the feasibility report seems remarkably prescient
about the functional requirements of a comprehensive GIS. The
system's purpose was to enable analysis of geographic data
over any part of a continent-wide area. Results were to be
provided in tabular or map form, or both. Many different kinds
of maps needed to be put into the system. The report specified
a seamless, nationwide data structure. The recommended
structure separated the descriptor data (attributes) from image
data (points and polygon boundaries). The report addressed
the task of converting many maps to digital form. The need
for various data inputs optimized for different data types
was anticipated, including automated scanning for polygon
boundaries, digitizing for selected points as identifiers inside
the polygons, and keypunching for descriptor and statistical
data. These data types were to be input separately and
linked logically later. The coordinate system requirements
were examined, and the concepts of error in subsequent area
calculation considered. Image data compaction requirements
were identified to reduce data volumes to be stored on magnetic
tape. The need to combine socioeconomic data with mapped
data was also prescribed. Data analysis capabilities included area
measurements and multiple topological overlays. The vision of a
comprehensive GIS is clearly evident in this report.
The Department of Agriculture (Pratt and Al Davidson) accepted
the proposal and awarded contracts to Spartan and IBM to
develop the system. I was asked to join the ARDA team and

79Origins of the Canada Geographic Information SystemEssays on Geography and GIS, Volume 5 December 2012
direct system development. More than 40 people worked on
the development teams throughout the rest of the decade.
One key contributor was Guy Morton, who devised a brilliant
tessellation schema that was fundamental to the system data
structure. The schema is now known as the Morton Matrix. Don
Lever was responsible for most of the logic and for converting the
scanner data to topologically coded map format. Bruce Sparks
and Peter Bedárd developed the system's edgematching
capability. Art Benjamin designed the links between image
data and descriptor data. Bob Kemeny developed the
map data compaction methods using the eight-directional
coding originated by Galton and later called Freeman codes.
Frank Jankaluk devised the reference coordinate system and
error calculation algorithms. Bob Whittaker designed the system
for error correction and updating. Peter Kingston designed the
data retrieval system and the polygon overlay process. Also
incorporated in the system were map projection change, rubber
sheeting, scale change, line smoothing and generalization,
automatic gap closing, area measurement, dissolve and merge,
buffer generation, and new polygon generation, all operating
in the topological domain. A very important part of the system
was a computer command language that recognized geographic
analysis terms that could be understood by a wide range of
potential users. The command language was designed by
Peter Kingston, Ken Ward, Bruce Ferrier, Mike Doyle, John Sacker,
Frank Jankaluk, Harry Knight, and Peter Hatfield.
The Canada Geographic Information System (CGIS) gave rise
to several developments in cartographic instrumentation.
D. R. Thompson at IBM in Poughkeepsie engineered the first
cartographic-size digital scanner specifically for the project. It was
delivered in 1967 at a cost of approximately $180,000 and worked
well for 15 years until replaced by a newer model. The original
is now in the National Museum of Science and Technology in
Ottawa.
Another technical innovation was the first high-precision
48 x 48 inch free-cursor digitizing table ever produced. Ray Boyle,
then working for Dobbie-McInnes (Electronics) Ltd in Scotland,
designed and built these especially for the CGIS.
Names matter, so it seems worthwhile to reflect briefly on the
origins of the term geographic information system. Though the
original proposal to the CLI was entitled "computer mapping,"
that term seemed inappropriate by the end of 1963. At that
time, we referred to the system as the ARDA Data Coordination
System. As time went on, we considered various alternatives. The
term spatial data system seemed too general, and the term land
information system too restrictive considering the data types
that were to be involved. The term geo-information system or
Geo-IS eventually came into use in the office and appears in
a 1967 paper entitled "An Introduction to the Geo-Information
System of the Canada Land Inventory." Finally, we settled on
the term Canadian Geographical Information System, which a
wise politician in the cabinet shortened to Canada Geographic

80Origins of the Canada Geographic Information SystemEssays on Geography and GIS, Volume 5 December 2012
Information System to reflect the then-popular use of Canada as
a synonym for the federal government.
The first published uses of the term GIS may be a 1968 paper
prepared for the Commonwealth Scientific and Industrial
Research Organization (CSIRO)—Australia's national science
agency—entitled "A Geographic Information System for Regional
Planning" and in a film produced that same year by the Canadian
Film Board called Data for Decisions. On reflection, the name
perfectly defines the system's capabilities. It has since been
widely adopted for many other systems worldwide.
See also "The 50th Anniversary of GIS."
(This article originally appeared in the Fall 2012 issue of ArcNews.)
The term geo-information system or Geo-IS first appears in the 1967 paper shown here.
Copyright © 2012 EsriAll rights reserved.Printed in the United States of America.
The information contained in this document is the exclusive property of Esri. This work is protected under United States copyright law and other international copyright treaties and conventions. No part of this work may be reproduced or transmitted in any form or by any means, electronic or mechanical, including photocopying and recording, or by any information storage or retrieval system, except as expressly permitted in writing by Esri. All requests should be sent to Attention: Contracts and Legal Services Manager, Esri, 380 New York Street, Redlands, CA 92373-8100, USA.
The information contained in this document is subject to change without notice.
US Government Restricted/Limited RightsAny software, documentation, and/or data delivered hereunder is subject to the terms of the License Agreement. The commercial license rights in the License Agreement strictly govern Licensee’s use, reproduction, or disclosure of the software, data, and documentation. In no event shall the US Government acquire greater than RESTRICTED/LIMITED RIGHTS. At a minimum, use, duplication, or disclosure by the US Government is subject to restrictions as set forth in FAR §52.227-14 Alternates I, II, and III (DEC 2007); FAR §52.227-19(b) (DEC 2007) and/or FAR §12.211/12.212 (Commercial Technical Data/Computer Software); and DFARS §252.227-7015 (DEC 2011) (Technical Data – Commercial Items) and/or DFARS §227.7202 (Commercial Computer Software and Commercial Computer Software Documentation), as applicable. Contractor/Manufacturer is Esri, 380 New York Street, Redlands, CA 92373-8100, USA.
Esri Trademarks and Service Marks: @esri.com, 3D Analyst, ACORN, Address Coder, ADF, AML, ArcAtlas, ArcCAD, ArcCatalog, ArcCOGO, ArcData, ArcDoc, ArcEdit, ArcEditor, ArcEurope, ArcExplorer, ArcExpress, ArcGIS, ArcGlobe, ArcGrid, ArcIMS, ARC/INFO, ArcInfo, ArcInfo Librarian, ArcLessons, ArcLocation, ArcLogistics, ArcMap, ArcNetwork, ArcNews, ArcObjects, ArcOpen, ArcPad, ArcPlot, ArcPress, ArcPy, ArcReader, ArcScan, ArcScene, ArcSchool, ArcScripts, ArcSDE, ArcSdl, ArcSketch, ArcStorm, ArcSurvey, ArcTIN, ArcToolbox, ArcTools, ArcUSA, ArcUser, ArcView, ArcVoyager, ArcWatch, ArcWeb, ArcWorld, ArcXML, Atlas GIS, AtlasWare, Avenue, BAO, Business Analyst, Business Analyst Online, BusinessMAP, CommunityInfo, Database Integrator, DBI Kit, EDN, Esri, Esri—Team GIS, Esri—The GIS Company, Esri—The GIS People, Esri—The GIS Software Leader, FormEdit, GeoCollector, Geographic Design System, Geography Matters, Geography Network, GIS by Esri, GIS Day, GIS for Everyone, GISData Server, JTX, MapIt, Maplex, MapObjects, MapStudio, ModelBuilder, MOLE, MPS—Atlas, PLTS, Rent-a-Tech, SDE, SML, Sourcebook·America, SpatiaLABS, Spatial Database Engine, StreetMap, Tapestry, the ARC/INFO logo, the ArcGIS logo, the ArcGIS Explorer logo, the ArcPad logo, the Esri globe logo, the Esri Press logo, the GIS Day logo, the MapIt logo, The Geographic Advantage, The Geographic Approach, The World’s Leading Desktop GIS, Water Writes, arcgis.com, esri.com, geographynetwork.com, gis.com, gisday.com, and Your Personal Geographic Information System are trademarks, service marks, or registered trademarks or service marks of Esri in the United States, the European Community, or certain other jurisdictions.
Other companies and products mentioned herein may be trademarks or registered trademarks of their respective trademark owners.
Contact Esri
380 New York Street Redlands, California 92373-8100 usa
1 800 447 9778 t 909 793 2853 f 909 793 5953 [email protected] esri.com
Offices worldwide esri.com/locations
Esri inspires and enables people to positively impact their future through a deeper, geographic understanding of the changing world around them.
Governments, industry leaders, academics, and nongovernmental organizations trust us to connect
them with the analytic knowledge they need to make the critical decisions that shape the planet.
For more than 40 years, Esri has cultivated collaborative relationships with partners who share our
commitment to solving earth’s most pressing challenges with geographic expertise and rational resolve.
Today, we believe that geography is at the heart of a more resilient and sustainable future. Creating
responsible products and solutions drives our passion for improving quality of life everywhere.
G56295 Esri12/12tk


