ESS.:.6 .GRAIN DUST:, PROBLEMS' AND …ageconsearch.umn.edu/bitstream/143812/2/ess6.pdf · material...
25
ESS.:.6 . GRAIN DUST:, PROBLEMS' AND .. MICS AND STAnSTICS SERVICE,. WASHINGTON, DC. NATIONAL· ECONOMr:CS Dr" APR 81 22P' :,;
Transcript of ESS.:.6 .GRAIN DUST:, PROBLEMS' AND …ageconsearch.umn.edu/bitstream/143812/2/ess6.pdf · material...

ESS.:.6 .GRAIN DUST:, PROBLEMS' AND OTILIZA;I~~~-L :c~.. SCHNAKE'E~O~I MICS AND STAnSTICS SERVICE,. WASHINGTON, DC. NATIONAL· ECONOMr:CS Dr"
APR 81 22P' :,;

18 11111 .
125 11111 . 111111.4 111111.6

PB81-190274
Grain Dust: Problems and Utilization
(U.s.) Economics and Statistics Service Washington, DC
Apr 81
I :.. ]
u.s. .....rtment of Commerce National Tethnical Information Service
NIB;

1. ItEPORT NO. I. ESS-6
4. TItle end Subtitle
GRAIN DUST: PROBLEMS AND UTILIZATION
7. Aut!IM(.) I. '-forml. ar.enlz8tlon Itept. No. L. D. Schnake ESS-6
t. PM!onnlnc Orpnlzetlon Name and Add .... II. ProIectITHklWork Unit No.
National Economics Division IL Contra:t(C) or Grent(G) No.Economics and Statistics Service
U.S. Department of Agriculture (C)
Washington, D.C. 20250 (Q)
Same as box 9
It. Abarect (Umlt: 200 _rda)
Grain dust is a dif.ficult, dangerous, and exp~nsive material to handle. A country elevator handling 750,000 bushels of grain annually would spend an estimated $500,000 for equipment to meet Clean Air Act standards. The additional cost of controlling dust may be offset by using the substance as fuel, feed, or fertilizer. Grain dust as a feed ingr~dient would likely be the optimum use.
17. Document Anelyal. •• Dncrlptore
Contamination Economic analysis Grains Cost analysis Feeding stuffs Utilization Dust Fertilizers Dust Control Grai~ elevators
... IcIefIUfIen/Open.Ended Term.
Clean A~r Act Problems Fuel
. Grain byproducts Grain duet
Co COIATI FIeld/Group
II. AVIIllebll1ty Itatemcm~ 21. No. of ...." NATIONAL TECHNICAL INFORMATION SERVICE 5285 Port Royal Road,$pringfield Va. 22161 22. fIrIce
OPTIONAL FOItM 272 (4-77) (Formerly NTIs-35) Department of Commerce

G FP81-1t;027 t
United S,.,.s(l.1J' Department ofV! Agriculture Grain Dust Economics and Statistics Service Problems and Utilization ESS-6
L.D. Schnake \ \
PROOOCI Of:
NAT/ONAL TECHNICAL INFORMAnON SERVICE
u.s. DEPARTMENT OF COMMERCE SPRINGFiElD, VA. 22161

CONTENTS
SUMMARY •••• • • • • • • • • • v
INTRODUCTION . . . . . . 1
UNDERSTANDING GRAIN DUST 1 "
PROBLEMS WITH GRAIN DUST • • • • 5 Handling Problems • . • • . • • . . . . . . . 5 Contamination Possibilities • 6
UTILIZATION OF GRAIN DUST • • • 6 Grain Dust as a Fuel 6 Grain Dust as a Fertilizer . . . . 7 Grain Dust as a Feed 8
ECONOMIC CONSIDERATIONS • . . . . . . 8 Costs of Removing Dust at the
Country Elevator .11 Possible Effects on Grain
Production and MarkeUng .a a • • • • 14
AREAS OF RESEARCH EMPHASIS . . . . . . . . . ... . . • . . • 15
REFERENCES . . . . . . . . 16
PREFACE
The collection and use of grain dust is a relatively recent issue. Little information on grain dust exists in economic literature. The technical information needed to provide economic analysis is also limited. This paper provides information and a compilation of selected references about grain dust, serving as a first contact reference for analysts who may become interested in the subject area. It is expected that technical and economic information will be increasing, and that much more detailed analyses will be forthcoming.
iv

SUMMARY
Grain dust, difficult, dangerous, and expensive to handle, is very small particles of grain and other matter in the grain mass and is quite similar in composition to the grain from which it came. Its explosive characteristics, sometimes compared to gunpowder, have been blamed for several elevator explosions. Grain dust is also considered an air pollutant, aff~cted by Federal environmental regulations. Pneumatic conveyance is the most effecti~~ means of handling grain dust since it tends to pack. The most likely economical use of grain dust is as a feed ingredient, although its potential for fuel and fertilizer has also been studied.
Quality checks jhould be made on grain dust if a feed use is planned. The dust from aflatoxin-infected grain may contain toxins due to the collection of small particles of infected grain kernels by dust collection systems.
At least one-third of today's country elevator operators may not be able to afford the estimated $500,000 required to meet Clean Air Act requirements now prescribed for terminal elevators. Costs to facilities handling 750,000 bushels annually could increase an estimated 9.1 cents per bushel.
Costs to producers affected by an elevator closing, not including costs for added delivery distance or disposal of uneconomic quantities of dust, are estimated to be 13.4 cents per bushel, 6 percent of 1979 estimated renter costs for corn production.
Research is needed to: determine the quantity and quality of grain dust at each point in the U.S. grain marketing system, determine the ecollomic impact of proposed Government regulations that result in the collection of additional grain dust, establish poultry and livestock performance on rations using processed and unprocessed grain dust, develop methods for rapid determination of dust quality, and develop improved technologies to unload dust from transport containers.
v

Grain Dust:
Problems and Utilization
L D. &hnake·
INTRODUCTION
Collecting grain dust is a difficult and expensive process and is receiving increased attention from grain handlers, mostly as a result of Federal environmental regulations. Dust that is collected from grain and not returned to the grain is a physical loss and a revenue loss if not s~ld for a price equal to the grain. Grain dust disposition problems center on which method of utilization would be the most economically efficient, for example, fuel, feed, or fertilizer. This paper identifies problems related to grain dust aspirated (removed) for environmental control and safety within grain handling facilities, summarizes knowledge about this grain dust, puts a relative perspective on the economics of handling it, and summarizes research needs. 1/
Dust collection in the grain industry began to increase after passage of the 1963 Clean Air Act. Collection has increased significantly with the increared emphasis on air quality since subsequent amendments to the act through 1978. Any new regulations pertaining to worker environment in grain handling facilities could lead to collection of greater quantities of grain dust by more elevators.
U.S. Government regulatory agencies have requested that grain dust removed not be returned to grain.
UNDERSTANDING GRAIN DUST
Grain handling facilities have a history of explosions because of grain dust. Fuel, oxygen, and an ignition source with appropriate dispersion in containment, are three basic ingredients for an explosion. Grain dust is an excellent fuel, air in an elevator supplies the oxygen, and many ignition sources may exist: overheated equipment bearings, slipping belts, welding sparks, tramp metal, faulty wiring, and careless smoking. The dangers of grain dust have been likened to those of gunpowder.
The quantity of grain dust collected has been relatively inconsequential in the past, because it has never been used for marketing purposes. Circumstances are changing as quantities of dust collected have reached marketable proportions.
*The author is stationed at the U.S. Grain Marketing Research Laboratory, Manhattan, Kans.
1/ Reference to grain dust throughout this paper refers to aspirated grain dust from grain handling operations, unless noted otherwise.
1
, r
1$4

Grain Dust: Problems and Uti1i~ldtion
American Feed Control Officials, Inc., only recently adopted a definition of grain dust collected for environmental control within a grain handling facility: "Aspirated grain fractions are obtained during the normal aspiration of cereal grains and/or oil seeds for the purpose of environmental control and safety within a grain handling facility. It shall consist primarily of seed parts and may not contain more than 15 percent ash. It shall not contain aspirations from medicated feeds" (1). ~
The lack of a definition for aspirated grain dust until recently has contr.ibuted to a general lack of knowledge in the United States as to what grain dust is. It has be~n viewed mistakenly by many to be dirt with no value. Grain dust still lacks a definition specifying end-use values.
Grain dust collected by dust collection systems in grain handling operations consists of small particles of the grain kernel and other small particles of matter in the grain mass. Moreover~ grain dust has a wide spectrum of particle sizes. No general agreement exists as to which particle sizes should be called grain dust. Some have suggested particles of 500 microns and less, others 250 microns and less.
The composition of dust may be quite variable. The variation may be due to anyone or a combination of several factors. Dust from specific grains will have characteristics relative to the grain from which it came, but dust from some elevators may come from more than one grain (tables 1 through 4).
The season may affect the quantity and/or quality of grain dust. Factors that may cause annual variations in grain dust characteristics include rain just before harvest, particularly for wheat and soybeans. Rain just before or at harvest results in more field soil in the grain mass and consequently a higher ash content of the dust. A wet harvesting season for corn often results in relatively higher moisture corn requiring more drying, which results in more broken kernels and consequently more grain dust. A dry, stressful growing season for wheat, which usually results in a higher wheat protein content, would likely produce a higher protein dust from that wheat.
Regional differences in grain dust are likely to exist, partly because of regional specialization in grain production and partly because of differences in growing conditions.
Grain handling practices of elevators may also influence the characteristics of grain dust. The more times grain is handled, the higher the percentage of broken kernels and dust (IS). The variations in the quantity and various quality aspects of grain dust at different stages in the production-marketing complex have not been evaluated. Blending practices of U.S. grain handlers may increase the uniformity of dust from a particular grain as it moves in the grain handling system. As grain moves to final use, however, increas~d handling likely changes the particle size distribution of the dust, as well as the quantity of dust.
£1 Underscored numbers in yarentheses refer to items listed in the References.
2

p,I
\1 (I'I
d '!
L. D. Schnake
Table 1--Proximate analysis of dust and grain on a O-percent ash) 14-percent moisture basis
Sample Protein Fat Fiber Starch
Percent
Wheat dust 10.9 2.5 16.4 54.5Wheat grain 14.0 2.0 3.0 68.0
Corn dust 8.2 2.5 7.4 67.0Corn grain 8.8 4.6 2.5 70.0
Sorghum dust 7.1 5.1 14.3 55.6Sorghum grain 9.0 3.0 2.0 72.0
Soybean dust 9.2 3.0 13.7 52.6Soybean grain 34.2 17.8 4.9 29.0
Source: (14) •
Table 2--Variations in grain dusts for selected elevators, selected characteristics. 1975
Elevator Protein Fat ~ Fiber Ash MOisture~ Bulk density ... - - - - - Percent - Lbs/ft3
One (mid-April) 7.8 23.4 10.4 8.0 19.2Two (mid-July) 10.8 7.4 39.4 5.6 38.5Three (early Oct.) 1.6 14.910.1 17.3 7.2 22.0Three (late Oct.) 9.4 1.5 18.4 14.2 7.1 18.9Four (late Nov.) 9.1 4.5 9.9 9.2 10.6Four (mid-Dec.) 10.8 2.0 10.5 10.9 8.4 24.0
-- = Not reported.
Source: Personal communications.
3

Grain Dust: Problems and Utilization
Table 3--Variations in wheat dust collected at a selected elevator
Total Date Protein Fat Fiber Ash MOisture~ digestible
nutrients
Percent
Janua't'y 1977 10.65 1.40 10.85 4.16 6.30 91.21
January 1978 12.95 1. 75 7.55 3.51 6.80 91.87
January 1979 12.25 1.95 11.45 4.45 10.10 78.38
Source: Personal communications.
Table 4--Ana1ysis of mixed grain dust. selected Midwest terminals, selected years
EtherYear Protein Fiber Ash Moisture extract
Percent
1977: 1/ Mean 10.2 13.7 11.1 8.5 2.9 Range 6.5-22.1 7.9-18.3 7.9-18.3 6.3-1~.9 1.2-5.0
1978: Mean 9.7 11.2 10.0 8.2 3.2 Range 7.6-12.1 6.3-21.1 4.6-23.6 6.6-10.4 1.5-7.9
1979: Mean 8.3 11.6 7.4 9.9 2.4 Range 7.2-·11. 2 6.7-19.7 4.5-10.6 8.2-11.6 1.6-4.8
1/ Includes December 1976.
Source: (~) .
4
L. D. Schnake
PROBLEMS WITH GRAIN DUST
Grain dust is difficult and dangerous to handle, and it may be contaminated with toxins.
Handling Problems
Dust particles tend to pack when they come to rest, and it is difficult to return them to motion (to flow). Bridging is a common problem in dust storage bins. 3/ Expensive pneumatic handling equipment is often required to handle dust properly~
Grain dust is quite abrasive. As a result, maintenance cost on dust handling and processing equipment is high relative to similar equipment in grain and feed facilities.
Grain dust pelletizes well with conventional pelleting equipment incorporating only steam. Steam-conditioned pellets have been stored up to 3 months with no problems. The addition of molasses as a binder is not required with steam conditioning and if storage af dust pellets is contemplated, the addition of molasses during pelleting may not be desirable. Dust pellets with even a small amount of molasses have required jackhammers for removal from storage bins.
Grain dust is transported in rail hopper cars and boxcars and van-type and hopperbottom trailer trucks. Hopper-bottom trailer trucks are the most easily unloaded transport vehicles with current handling technology. Conventional hopper cars are difficult to unload. A lack of dust volume prevents the dedication of expensive pneumatic railcars to grain dust hauls. Boxcars are difficult to unload; however, few boxcars are used in the grain trade.
Vehicles hauling grain dust can be filled to capacity. However, they c~nnot be loaded to weight limits due to the low bulk density of grain dust. Thus, grain dust incurs a shipping cost penalty.
Vibrations during tracsport will cause dust to settle, presenting unloading problems. The shipping container must be tightly enclosed to prevent dust loss and to protect the dust from rain. Grain dust subjected to moisture readily molds, ~nless prompt, corrective action is taken.
Dust in grain can fuel elevator explosions. Dust collected from grain may be considered as a concentration of fuel, a dangerous substance that must be handled with caution. It can be highly charged with static electricity, making the grain dust diffucult to handle.
3/ Bridging is the interlocking of particles to form an arch (bridge) in a bin, impeding or preventing the flow of particles from the bin.
5

Grain Dust: Problems and Utilization
Contamination Possibilities
Aflatoxin incidence, particularly in corn, is related to relative humidity, soil moisture, and wind. if Corn grown in the Southeast, as well as the dust it produces, is more aflatoxin-prone compared with that of other regions due to the aflatoxin conditions in that region. Dust from aflatoxin-infected corn would be expected to contain aflatoxins. Grain sorghum is harvested at high-moisture levels similar to corn, leading to a tendency to mold easily unless properly dried. Consequently, dust from sorghum harvested during a wet season might also be an aflatoxin suspect. Aflatoxin incidence in wheat is not nearly as prevalent as in corn or sorghum, because wheat is harvested at much lower moisture levels than corn and sorghum. Wheat also does not break nearly as much in handling as corn. Thu~, the wheat kernel is not as subject to mold invasion as the corn kernel. The incidence of aflatoxin in wheat dust is likely very low.
Grain dust may contain malathior. residue concentrations, particularly if the chemical was improperly applied. t1alathion is the only approved insecticide used on stored grain. The incidence of malathion residues on U.S. grain arriving at export ports is now quite low (23). Farmers store 60 percent of U.S. grain stocks onfarm (based on January 1, 1981-,-grain stocks). Much o~ this grain is under Government loan or reserve programs. If farmers should incr.ease the use of approved insecticide protectant to maintain grain quality, the incidence and level of malathion residues on grain would likely increase from what is shown in current research findings.
UTILIZATION OF GRAIN DUST
The flour milling industry has long collected dust and disposed of it by integrating it into bran or other millfeed created in milling. However, disposing of large quantities of grain dust by the grain handling industry is a different situation. Collected grain dust cannot legally be dumped at sanitary landfills. Open-air burning is generally prohibited. Spreading dust on cropland poses weed and insect problems.
Suggested uses for grain dust include fuel, feed, or fertilizer (25). In addition to technical reports (3, 4 r 5, and 10) on these suggested uses, at least one private feeding trial focuses on grain dust pellets in feed lot rations. The results were quite favorable. Howeve~, economic feasibility studies have not been made on the total system of grain dust collection and utilization.
Grain Dust as a Fuel
Grain dust can be burned under controlled conditions for heat. At least one public utility near a major U.S. grain center is exploring this possibility.
Grain d~st composition (see table 2) must be considered by anyone contemplating use of grain dust in incineration processes. High ash content grain dust, often typical
if Aflatoxins are poisons (toxins) produced by the fungi Aspergillus flavus and A. parasiticus.
6

L. D. Schnake
of dust collected fTom soybeans, is usually associated with sand of high silica content. Silica subjected to incineTation pTocesses creates glass, causing problems in devices designed ~o produce heat.
Grain dust for an incineration proces~ could be a substitute or complement in plants designed to burn coal, although coal is superior to grain dust on an energy basis. Coal, producing 11,867 Btu per pound, has 1.71 as much energy per pound as corn dust with 6,948 Btu per pound (table 5). Corn dust as an energy source would be worth $22.78 per ton at the user's site in a fOTID that could be handled, compared with coal at $38.92 per ton. T~e dust would require processing, such as pe1leting before it could be shipped for incineration. This could cost $26.50 per ton, excluding transportation (20). The minimal transportation cl.arge that should be considered is $10 per ton. Thus, grain dust would require a subsidy of $13.72 per ton to be competitive as a substitute for coal ($22.78 energy value minus $26.50 proeessing for handling minus $10 minimal transportation charge).
Grain dust, because of its starch content (see table 1), could also be used to PTOduce fuel alcohol. P~ice relationships would be the determining factor. The relative technical values of corn and corn dust, the most abundant of ttle grains and grain dusts, used for alcohol production, have not been documented.
Grain Dust as a Fertilizer
Grain dusl, high in organic matter, makes a good composted product for use in greenhouses nnd by gardeners (5, 7). Composted producta for consumer consumption commonly retail for $4 per hundred;eight in the Midwest (1980). At this rate, the retail
Table 5--Heat of combustion and comparison of combustibles of dust control system effluent
Dust source Heat of combustion Combustibles 1/
Kilocalorie gs/g Btu/lb Percent
Corn 3,860 6,948 81.6
Wheat 3,663 6,593 75.0
Sorghum 3,552 6,394 71.3
Soybean 3,049 5,488 63.2
1/ Combustibles = 100 minus percentage of ash minus percentage of moistuTe.
Source: Derived from (14).
7

Grain Dust: Problems and Utilization
value of a ton of processed grain dust would be $80. However, most of the retailvalue is accounted for by wholesaler and retailer margins, transportation, andprocessing, leaving a small proportion, if any, of the value allocated to the basicproduct.
Grain Dust as a Feed
Two recently published reports evaluate grain dust as an ingredient in broiler, IIswine, and sheep rations (4, 10) (tables 6 through 9). Other reports have suggestedpossible use of grain dust-asfeed (.§.,11, 13, 16, and 18).
A feeding trial using grain dust in feeder cattle rations has been reported by Kai.1sasState University (£). Grain dust has been used in cattle, swine, and poultry rations, but manufacturers and feeders are hesitant to discuss their use of grain dllRtin rations.
It has been suggested that grain dust has about 80 percent of the nutritional valueof the source grain (19) (see tables 1 through 4). Using corn price and a proportional nutritional value of 80 percent for the dust relative to the grain, an esti rr~te can be made of the monetary value of grain dust as a feed ingredient. At $2.52per bushel ($90 per ton, Kansas City, Mar. 1980) for corn delivered to a feed mill,grain dust has an estimated value of $72 per ton as a feed ingredient delivered tothe mill. This compare r with an estimated $12.78 per ton for unprocessed grain dustdelivered for fuel. Compared with composted grain dust at $80 per ton retail, graindust processed as a feed ingredient retailed from $155 per ton for l4-percent protein dairy feed to $194 per ton for hog feed in March 1980 (26). Processing (pellet ing) cost of dust as a feed ingredient is estimated at $26.501per ton (20). Thissimple analysis suggests that grain dust be used for animal feed. Allowances werenot made for the costs of handling grain dust. However, since the handling problemwould exist for any of the end uses evaluated, these costs would not change the relationships. Thus, the relative end-use values remain the same.
ECONOMIC CONSIDERATIONS
Little information currently exists to help answet the many questions about the economic effects of grain dust removal. No information is available on how many facili ties now collect grain dust i~ the United States, and there is no public informationon the quantity of dust collect..:.d. All export elevators collect dust to meet Government regulations; however, nol all export elevators retain the dust they collect (27,p. 130). -
Grain dust may be sold as a byproduct of a grain handling operation but it may generate only limited revenue. The grain handling firm incurs disposal costs includingthe outbound freight where there is no market. Grain dust sells at grain price whenit is returned to the grain, so many operators collecting grain dust return as muchdust to the grain as possible. An offsetting factor is the possibility that thispractice may cost more in wear and tear on equipment than the loss incurred from dust.disposal. Data are not available either to support or to refute this possibility.
8

L. D. Schnake
Table 6--Cumulative average daily gain a~d feed efficiency of broilers fed diets con
Parameter
Average daily gain: Up to 2 weeks Up to 4 weeks Up to 6 weeks Up to 8 weeks
Feed efficiency: Up to 8 weeks (feed/gs
gain)
1/ Corn replaced by grain dust 2/, 3/, 4/ Mean values in the
(P<O.OS). -
Source: (~) .
taining grain dust
Grain dust replacement of cor.n (percent) !/
o 25 50 75
Grams
17.57 15.87 15.92 17.10 2/28.66 3/25.91 3/25.00 3/25.59 "'%./36.07 1/32 •97 1/31.93 1/32 •40
39.73 37.67 37.40 37.00
,];/3.27 1/2 • 63 1/2 •63 !±./2.96
on an "as fed" weight-for-weight basis. same row with unlike footnotes differ significantly
Table 7--Results of swine growing-finishing trial with diets containing grain dust
Parameter
Average daily gain per head
Daily feed intake per head
Feed efficiency: (feed/gs gain)
!/ Corn replaced by grain dust 2/, 3/ Mean values in the same
(P<O.OS) .
Source: (~) •
Grain dust replacement of corn (percent) !I
o 25 50
Kilograms
0.74 0.79 0.77
2:./ 2 •06 1/2 • 35
Grams
2.81 2.86 3.05
on an "as fed" weight-for-weight basis. row with unlike footnotes differ significantly
9

....
Grain Dust: Problems and Utilization
Table 8--Performance of 12 lambs fed rations containing grain dust
Percentage of grain dust in rations l! Item
50o 25
Kilograms
Final weight 44.0 40.1 39.1
Feedlot performance: Average daily gain 2/.27 3/.19 3/.17 Daily feed intake 4/ 2/ ,3/1.15 3/1.07 2/1.24 Feed/kg of gain !!!- - 2/4.24 3/5.76 2/ 7•36
1/ Percentage on a dry-matter basis. 2/, 3/, 5/ Mean values in the same row with unlike footnotes differ significantly
(P<O.OS). - • ,. i/ 100-percent dry-matter basis (moisture free).
Source: (10) •
Table 9--Performance of eight lambs fed rations containing grain dust--two protein sources
Percentage of grain dust in ration and protein source 1/
Item o percent 12 percent 24 I.',ercent
Soybean Soybean SoybeanUrea Urea Ureameal meal meal
Kilograms
Final weight 46.9 46.1 46.4 44.6 45.1 46.9
Feedlot performance: Average daily ga:f.n .21 .20 .20 .16 .18 .20 Daily feed intake ~/ 1.05 1.04 1.03 1.07 1.12 1.16 Feed/kg of gain ~/ 5.17 5.28 5.17 6.73 6.23 5.73
1/ Grain dust percentage on a dry-matter basis. 2/ 100-percent dry-matter basis (moisture free). Source: (10) •
10

L. D. Schnake
Grain farmers do not know how much cost will be passed back to them through lower prices for grain.
Dust retention rates, reported in personal communications, range from 0.04 to 0.13 percent by weight of grain handled on an in-and-out basis. A commonly reported figure is 0.07 percent. One industry engineer has estimated that up to 2.6 percent of the weight of grain is dust, but that only 5 percent of this dust in grain is airborne.
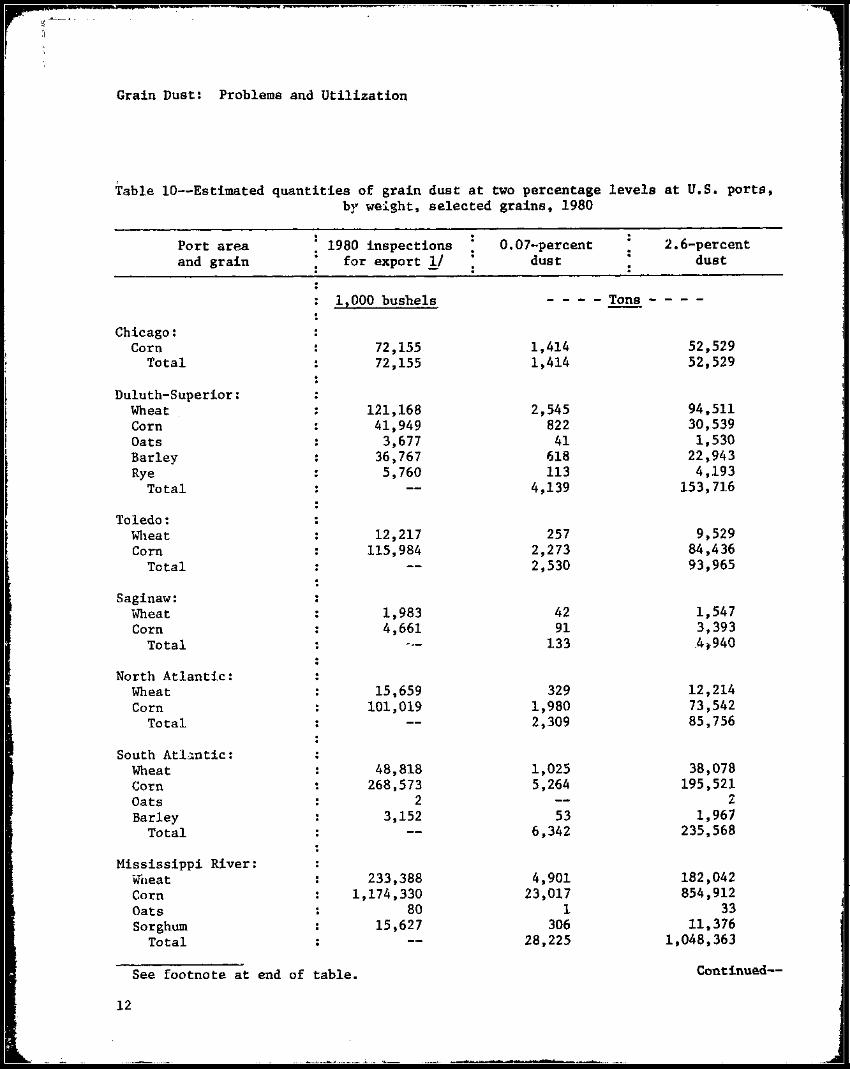
Some engineers believe that at least 50 percent of dust in grain at export elevators is generated at the port by high-speed handling facilities. The estimated quantity of dust and the quantities that may have been collected for the major grains at U.S. export elevators in 1980 appear in table 10.
About 1.5 million tons of grain dust may have been transported to U.S. port elevators in 1980, the likely equivalent of more than 53 million bushels of corn, if, in fact, 2.6 percent of the weight of grain is dust and port facilities should generate at least 50 percent of the dust. It is difficult to estimate how much transportation equipment l~as required to transport the estimated q~~ntity of dust, since dust fills spaces beu,reen kernels and adheres to the kernel surface.
The number of elevators, other than export elevators, that collect and r~tain grain dust is unknown. The number of elevators installing dust systems continues to increase as more and more elevators are brought into compliance with the Clean Air Act, according to industry contacts. Many of these elevators are country elevators.
Costs of Removing Dust at the Country Elevator 21
One estimate of the number of U.S. country elevators is 8,600 (9). These facilities range in storage capacity from less than 100,000 bushels with throughput ratios ranging from 4.5 to 13, to 2.5 million bushels with throughput ratios ranging from about 1 up to 5 (21).
The estimated cost in 1976 to equip a country elevator to meet Clean Air Act standards was over $225,000 (17). Equipment to provide a worker environment with less than 5 mg dust per cubiclmeter of air would be substantially more extensive than that to meet Clean Air Act requirements, according to air control systems engineers. Two engineers queried about current costs to equip a "typical" country elevator to meet Clean Air Act requirements estimated 1980 costs to be $500,000.
For an elevator handling 750,000 bushels annually, a $500,000 investment that would still not likely meet OSHA worker environment standards for nuisance dusts, amounts to approximately 8.5 cent.s per bushel over the life of the equipment. &.1 If a dust
51 Country elevator here means an elevator that received grain from producers only and none from other elevators.
&./ Grain dust is considered a nuisance dust by OSHA (~). OSHA does not now have regulations on grain dust related to worker health in grain handling facilities. However, a proposal for regulations has been made and initial hearings have been held (§).
11
lj'~-··
:i
Grain Dust: Problems and Utilization
Table 10--Estimated quantities of grain dust at two percentage levels at U.S. ports,
Port area and grain
Chicago: Corn
Total
Duluth-Superior: Wheat Corn Oats Barley Rye
Total
Toledo: Wheat Corn
Total
Saginaw: Wheat Corn
Total
North Atlantic: Wheat Corn
Total
South AtLmtic: Wheat Corn Oats Barley
Total
Mississippi River: Wheat Corn Oats Sorghum
Total
by weight, selected grains, 1980
1980 inspections 0.07-percent 2.6-percent for export Y dust dust
1,000 bushels - Tons
72,155 1,414 52,529 72 ,155 1,414 52,529
121,168 2,545 94,511 41,949 822 30,539
3,677 41 1,530 36,767 618 22,943 5,760 113 4,193
4,139 153,716
12,217 257 9,529 115,984 2,273 84,436
2,530 93,965
1,983 42 1,547 4,661 91 3,393
133 .4l 940
15,659 329 12,214 101,019 1,980 73,542
2,309 85,756
48,818 1,025 38,078 268,573 5,264 195,521
2 2 3,152 53 1,967
6,342 235,568
233,388 4,901 182,042 1,174,330 23,017 854,912
80 1 33 15,627 306 11,376
28,225 1,048,363
Continued--See footnote at end of table.
12

L. D. Schnake
Table 10--Estimated quantities of grain dust at two percentage levels at U.S. ports,by weight, selected grains, 1980--continued
Port area 1980 inspections 0.07-percent 2.6-percentand grain for export !/ dust dust
1,000 bushels - - - Tons - - - -East Gulf:
Wheat Corn
Total
9,216 123,875
194 2,428 2,622
7,188 90,181 97,369
North Texas Gulf: Wheat Corn Barley Sorghum
Total
370,071 153,729
45 88,315
7,771 3,013
1 1,731
12,516
288,655 111,915
28 64,293
461.,891
South Texas Gulf: Wheat Corn Sorghulll
Total
25,475 937
77,725
535 18
1,523 2,076
19,870 682
56,584 77 ,136
Columbia River: Wheat Barley Sorghum
Total
395,995 19,684
9,040
8,316 331 177
8,824
308,876 12,283
6,581 327,740
Puget Sound: Wheat Corn Barley Sorghum
Total
4,824 269,546
3 37,995
101 5,283
745 6,129
3,763 196,229
2 27,660
227,654
California: Wheat Corn Sorghum
Total
60,241 96,818 23,518
1,265 1,898
461 3,624
46,988 70,484 17,121
134,593
Total U.S. ports 80,883 3,004,220
-- - Not applicable. !/ SOL ce: Grain Transportation Situation, U.S. Dept. Agr., Office of
Transportation, Feb. 9, 1981.
13

Grain Dust: Problems and Utilization
removal rate of 0.0015 is considered~ dust removal amounts to an additional 0.6 cent per bushel shrink on ~4 per buohel grain. Relative to "typical" 1,:!'78/79 eleva-tor in-and-out charges of 10 cents per bushel paid by producers (22), the additional 9.1 cents pe~ bushel cost for dust removed would increase the in-sud-out charge a minimum of 91 percent.
Possible Effects on Grain Prpduction and Marketing
Some country elevators may close in the face of regulations requiring them to remove dust from grain because of the financial burden. The closing of an elevator immediately affects producers in the trade area and elevators and producers in adjoining trade areas.
Farmers
Farmers in communities with only one elevator would face extended delivery distance if that elevator should close. Current estimates indicate th~t farmers spend more than 12 cents per bushel to transport grain to the first point L~ sale (11). This cost would immediately increase. However, transportation cost~ ~ay not reflect the total increase in delivery costs. For those who must deliver part of their grain at harvest, investment must be made in additional equipment to transport or hold grain to keep high-speed harvesting equipment busy. Any extra elevation to temporary holding space creates additional l~sses and damage to grain which translates into additional costs. Estimates put the producer cost of additional field holding bin space at approximately 4.23 cents per bushel.
The farmer may face additional marketing charges for dust removal if the elevator does not have a sufficient volume of dust to market and if the farmer is not willing to haul the dust away. In areas of North Dakota where efforts have been made to market clean wheat, farmers have been assessed a charge if they did not haul the cleanings away. Onsite pelle~ing costs for small quantities of dust that would be available at any given time at a country elevator could be as high as $56 per ton, approximately 0.22 to 0.24 cent per bushel of grain handled (20).
These estimated cost increases, examples of how the grain dust issue could affect the grain delivery and handling costs of certaitt farmers, can be stated relative to crop production costs. Excluding additional transportation costs and dust processing costs, estimated increases are: field holding bins (4.23 cents per bushel); shrink from dust removal (0.6 cent per bushel); and increased in-and-out handling charges (8.5 cents per bushel), amounting to 13.4 cents per bushel. This represents a 6percent increase over estimated 1979 U.S. average renter costs of $2.25 per bushel for corn (24).
Elevators
An issue that needs to be considered is how many existing country elevators could financially support a $500,000 investment which would not add to productivity. A change in ownership would not necessarily keep such facilities in service since the ~ost of dust removal would be independent of ownership. Closing these elevators
14

1. D. Schnake
would increase the concentration of ownership of marketing facilities. The other issue besides the ability to make the investment is how the marketing uystem will allocate the additional costs of dust removal.
Whether the costs to terminal and port operators can be passed forward or backward in the marketing chain depends on the market. No incentive exists for the foreign buyer to bid more for U.S. grain unless it is the only source, since th~ export market determines price. The complaint of forej~n buyers, " ••• that U.S. grain is dirtier or dustier than grain from other origins," is documented (28, p. 71). However, some sources disagree with the statement. Australia's elevators already have massive dust removal systems, and dust is essentially removed from their grain (predominantly wheat); thus, the United States cannot offer dust-free grain as a selling point to traditional Australian customers. Likewise, an offer of cleaned grain to ~raditional Canadian customers would not be an incentive, since Canadian laws require cleaning of exported grain. Therefore, additional costs will probably be passed back to the farmer in most instances.
AREAS OF RESEARCH EMPHASIS
Research efforts are needed to minimize the economic consequences of dealing with increasing quantities of collected grain dust.
The economic impact of proposed Government regulations that result in the collection of additional grain dust to meet worker environmental standards needs evaluation. Particular emphasis should be placed on the effects of such regulations on the structure of the grain handling industry, particularly the first point of sale and the implications on grain pricing.
Research is needed to determine the quantity of grain dust at each level in the marketing system so decisionmakers can determine best dust disposition.
Feeding trials, using unprocessed and processed dust (for example, grain dust pellets and slurries) are needed to demonstrate grain dust efficiency in the rations of the various classes of livestock and poultry. These trials should be followed by economic analyses.
Export market development efforts should also be considered. For many years, the Canadians have exported pelleted grain screenings and dust, with levy-free shipments to the European Economic Community.
Development of rapid analytical methods is needed to determine various quality characteristics of grain dust for proper grain dust utilization.
Research would help show the most economical unloading technology for transport containers used for unprocessed grain dust.
15

REFERENCES
(1) American Feed Control Officials, Inc., Official Publication, 1981. pp. 139-140.
(2) Axe, Dirk, Harvey Ilg, Keith BoIsen, and Keith Behnke. "Grain Dust for Finishing Cattle," Cattleman's Day 1980. Kansas Agr. Exp. Sta., Rpt. of Progrel'ls 377, Manhattan, Kans. Mar. 1980.
(3) Behnke, Keith. "Elevator Dust as a Feed Ingredient," Feed Management. July 1978.
(4) and H.M. Clark. "Nutritional Utilization of Grain Dust by Monogastrics," proceedings of the International Symposium on Grain Dust, Manhattan, Kans. Oct. 2-4, 1979.
(5) Chang, C.S., Fang S. Lai, R. Rousser, and B.S. Miller. "Burning and Composting Grain Dust," proceedings of the International Symposium on Grain Dust, Manhattan, Kans. Oct. 2-4, 1979.
(6) Clark, Ed. "Elevator Grain Dust Pel1eted for Feed May Offer Disposal Method," Feedstuffs. Mar. 13, 1978.
(7) Conununications Marketing, Inc. "Grain Dust Has Value as Soil Conditioner," Grain A~. Jan. 1980.
(8) Federal Register. Vol. 45, no. 33, pp. 10,732-10,737, Feb. 15, 1980.
(9) Heifner, Richard G., James L. Driscoll, John W. Helmuth, Mack N •. Leath, Floyd F. Niernberger, and Bruce Wright. The U.S. Cash Grain Trade in 1974: Participants, Transactions. and Information Sources. AER-386. U.S. Dept. Agr., Econ. Res. Serv., Sept. 1977.
(10) Ilg, H., D. Axe, and K.K. BoIsen. "Nutritional Utilization of Grain Dust by Ruminants," proceedings of the International Symposium on Grain Dust, Manhattan, Kans. Oct. 2-4, 1979.
(11) Kansas Crop and Livestock Reporting Service. Kansas Custom Rates, 1979.
(12) Kiewet, Fred. "Grain Dust Diets Prove Successful," Kansas City Star. Mar. 8, 1979.
(13) McNabney, Jim. "Grain Dust Might Pay Its Own Way as Feed," Farm Journal. Oct. 1978.
(14) Martin, C.R. "Characterization of Grain Dust Properties," paper presented at 1978 summer meeting of American Society of Agricultural Engineers (ASAE), Logan, Utah, June 27-30, 1978.
(15) and L.E. Stephens. "Broken Corn and Dust Generated During Repeated Handling," vol. 20, no. 1, (1977), pp. 168-171. Transactions of the ASAE, St. Joseph, Mich.
16

(16) Miller Publishing Company. "Grain Dust Utilization in Animal Feeds," Feedstuffs. ~1ar. 12, 1979.
(17) National Grain and Feed Association. "Government and Grain." Feb. 22, 1977.
(i8) Perry, T.W. "Adaptability is the Key to a Liquid Feed System," Feedlot Management. Nov. 1972.
(19) Progressive Farmer Company. "Making Grain Dust Into Livestock Feed," Progressive Farmer. Aug. 1978.
(20) Schnake, L.D. Grain Dust Pe11eting Costs and Capital Requirements For Stationary and Portable Plants. ESCS-7l. U.S. Dept. Agr., Econ. Stat. Coop. Serv., Sept. 1979.
(21) __~__~______ and James L. Driscoll. Number and Physical Characteristics of Grain Elevators. ESCS-22. U.S. Dept. Agr., Econ. Stat. Coop. Serv., May 1978.
(22) Siebert, John W. India~ Elevator Service Charges, 1978-79. Dept. of Agr • .-Econ., Purdue University, West Lafayette, Ind., CES Paper 55, July 1979.
(23) Storey, Charles L. Preliminary Information for Insect Incidence Survey of 1977 and 1978, U.S. Grain Exports, U.S. Dept. Agr., SEA-AR, forthcoming.
(24) U.S. Congress, U.S. Senate. Costs of Producing Selected Crops in the United States--1978, 1979, and Projections for 1980. Prepared by U.S. Dept. Agr., Econ. Stat. Coop. Serv., July 1980.
(25) U.S. Department of Agriculture. "A Progress Report--Grain Dust Explosion Research," Agricultural Research. Apr. 1979.
(26) Agricultural Prices. Apr. 1980.
(27) "Prevention of Dust Explosion in Grain Elevators--An Achievable Goal," task force report. Office of the Special Coordinator for Grain Elevator Safety and Security, 1980.
(28) U.S. General Accounting Office. "Federal Export Grain Inspection and Weighing Programs: Improvements Can Make Them More Effective and Less Costly." Report to the U.S. Congress, CED-80-lS, Nov. 30, 1979.
'U.S. GOVERHIIENT PRlllTING OFF1C~: 1981-0-340-93dES5-79
17

UNITED STATES DEPARTMENT OF AGRICULTURE POSTAGE A,..:', I"EES PAIDWASHINGTON, D.C. 20250
U.S. DEPARTMENT OF ~AGRICULTURE AGR 101 ~THIRD CLASS
Economics and Statistics Service
The Economics and Statistics Service (ESS) collects data and carrips out research on food and numtion, international agricultural trade, natural resources, and rural development. The Economics unit researches and analyzes production anii marketing of major commodities; foreign agriculture and trade; economic use, conservation, and development of natural resources; trends in rural population, employment, and housing and rural economic a:ljustment problems; and performance of agricultural industry. The Statistics unit collects data on crops, livestock, prices, and labor, and publiahes official USDA State and national estimates through the Crop Reporting Board. Through its infomtation program, ESS provides objective and timely economic and statistical information for farmers, government policymakers, consumem, agribusiness fmns, cooperatives, rural residents, and othe!, interested citizens.