ESO/PAOS progress meeting Leiden, 29 September, 2004 Fringe Sensor Unit S. Menardi, ESO.
49
ESO/PAOS progress meeting Leiden, 29 September, 2004 Fringe Sensor Unit S. Menardi, ESO
-
date post
21-Dec-2015 -
Category
Documents
-
view
216 -
download
2
Transcript of ESO/PAOS progress meeting Leiden, 29 September, 2004 Fringe Sensor Unit S. Menardi, ESO.

ESO/PAOS progress meetingLeiden, 29 September, 2004
Fringe Sensor Unit
S. Menardi, ESO
Leiden, 29 September 2004 Page 2
ESO/PAOS progress meeting
Overview (1)
Star Separator 1(STS1)
PS SES PS SES
Baseline, B
s1s2
s1s2
Telescope T 1
(UT or AT)
Metrology end point E2Metrology end point E1
Star Separator 2(STS2)
Delay Line 1(DL1)
Beam A1
(SES)Beam B1
(PS)Beam B2
(PS)Beam A2
(SES)
Delay Line 2(DL2)
Differential Delay Line 1B (DDL1B)
Differential Delay Line 2B (DDL2B)
Fringe Sensor Unit B (FSUB)
MetrologySystem
Fringe Sensor Unit A (FSUA)
(or MIDI,or AMBER)
Differential Delay Line 1A (DDL1A)
Differential Delay Line 2A (DDL2A)
OPD Controller
Δ OPDController
ΔL
OPDPS mod λ0, GDPS
OPDSES mod λ0, GDSES
ΔGD
Telescope T2( )UT or AT
OPDPS mod λ0, GDPS, APS
OPDSES mod λ0, GDSES, ASES
data storage
data storage
data storage
Scope of the contract with Alenia: development of FSU A and B operating in K band with provisions for H band.
The FSU combines the light of each object (Primary Star and Secondary Star), collected by two VLTI telescopes and delivers and records measurements of:
• Optical Path Difference [modulo λ0]
• Group Delay
• Fringe Amplitude

Leiden, 29 September 2004 Page 3
ESO/PAOS progress meeting
Overview (2)
achromaticλ/4
compensator light
from T1
light from T2
BC
p1 & s1
p2 & s2τp1 + ρp2 τs1 + ρs 2
|ϕp2 - ϕs2| = 90°
PBS
τp1 + ρp2
PBS
τs1 + ρs 2
ρp1 + τp2
ρs1 + τs 2
ρp1 + τp2 ρs1 + τs 2
Φ0
Φ2 = Φ
0 + π
A
C
Φ1 = Φ
0 + π/2
Φ
CkΦ
Φ3 = Φ
0 + 3π/2
D
B
FSU operating principle

Leiden, 29 September 2004 Page 4
ESO/PAOS progress meeting
Overview (3)
Alignment System
IRACE
BeamCombiner
PolarisingBeamsplitters
Single-modefibers
(Spatial filters)
Re-imagingOptics
Dispersiveelement
B
C
D IR ArrayDetector
Cryostat
PRIMAMetrology
(1319 nm laser)
PRIMAMetrology
(1319 nm laser)
A
ShutterSystem
FSU LCU 2
PRIMA WS
FSU LCU 1
OPD Controller
FSU main components
Leiden, 29 September 2004 Page 5
ESO/PAOS progress meeting
Project organisation
Alenia Spazio, prime contractor
opto-mechanics design and procurement
system engineering
system assembly, integration and verification
Osservatorio Astronomico Torino (OATo), main sub-contractor
Cryostat design and procurement
Measurement algorithms and performance analysis
Software development (LCU level)
ESO furnished equipment
2 x PICNIC detectors & IRACE systems
Control Electronics Hardware

Leiden, 29 September 2004 Page 6
ESO/PAOS progress meeting
Overall Configuration (1)
FSU-A and FSU-B Overview (K band only)
Leiden, 29 September 2004 Page 7
ESO/PAOS progress meeting
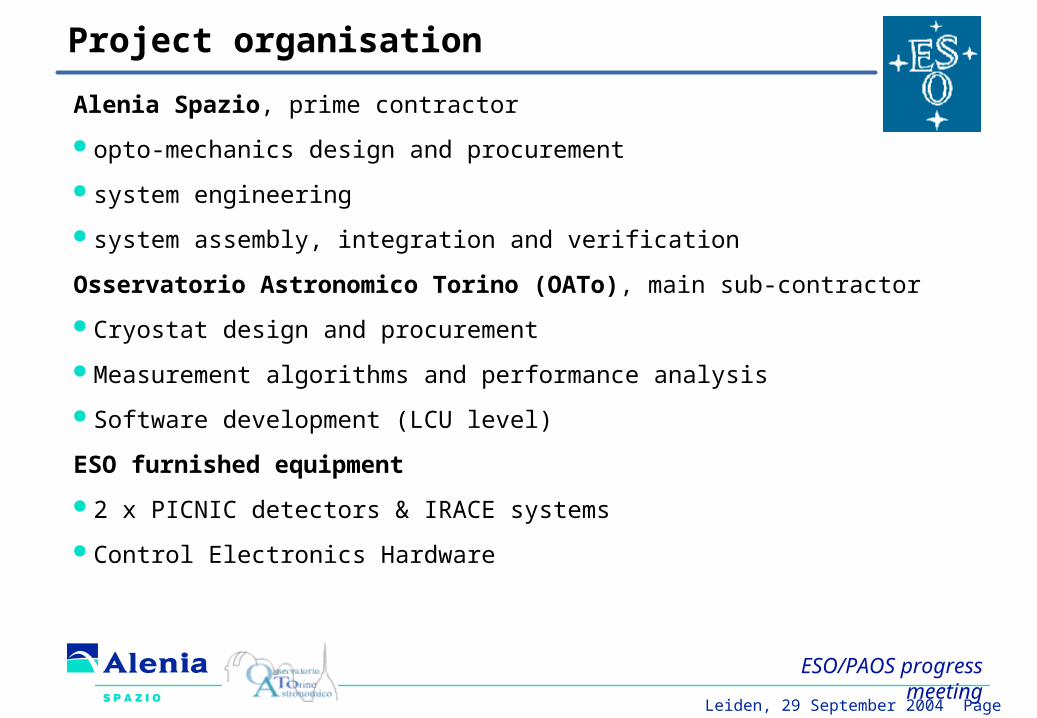
Overall Configuration (2)
Shutter System and Alignment System
Leiden, 29 September 2004 Page 8
ESO/PAOS progress meeting
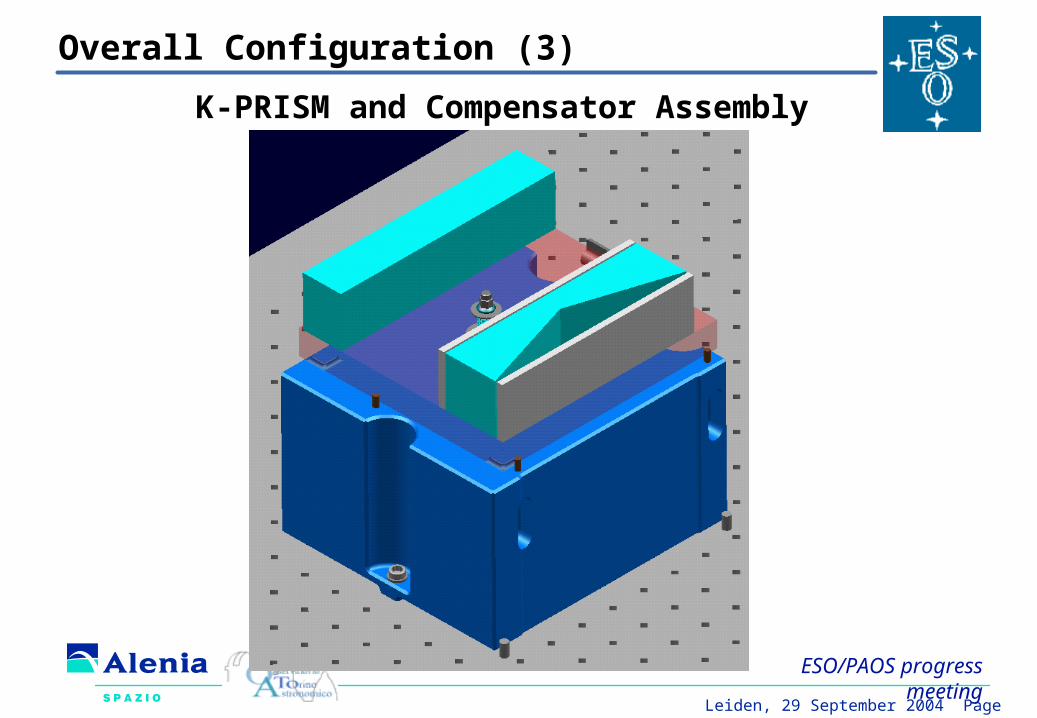
K-PRISM and Compensator Assembly
Overall Configuration (3)
Leiden, 29 September 2004 Page 9
ESO/PAOS progress meeting
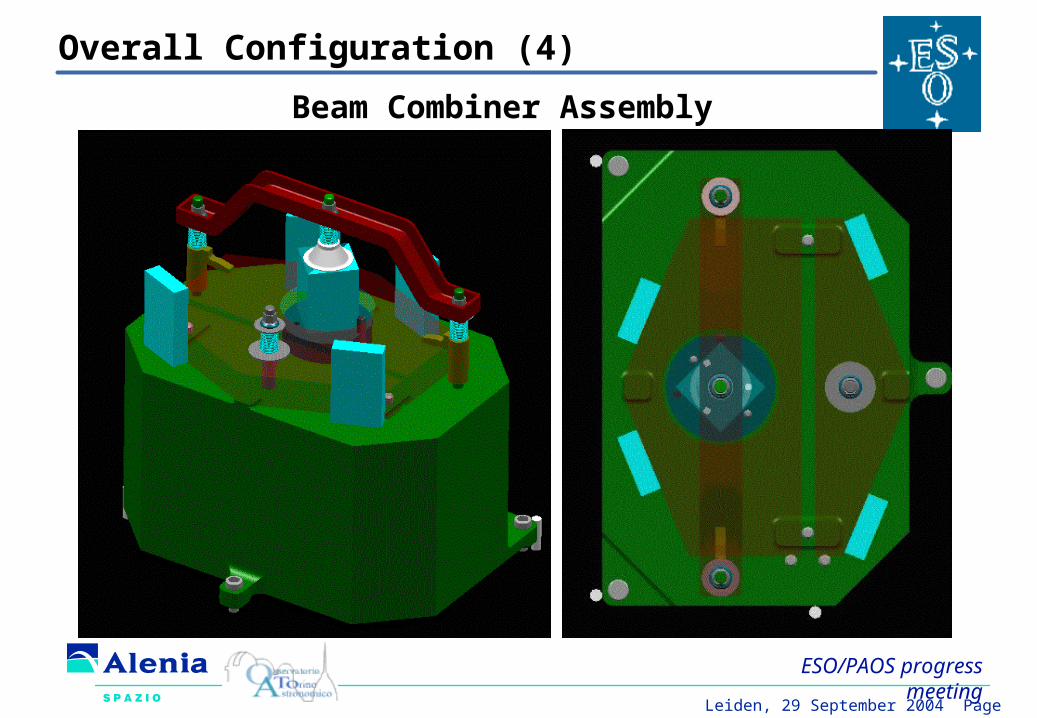
Beam Combiner Assembly
Overall Configuration (4)

Leiden, 29 September 2004 Page 10
ESO/PAOS progress meeting
Overall Configuration (5)
Polarising Beamsplitters, Doublets and Fibers
Leiden, 29 September 2004 Page 11
ESO/PAOS progress meeting
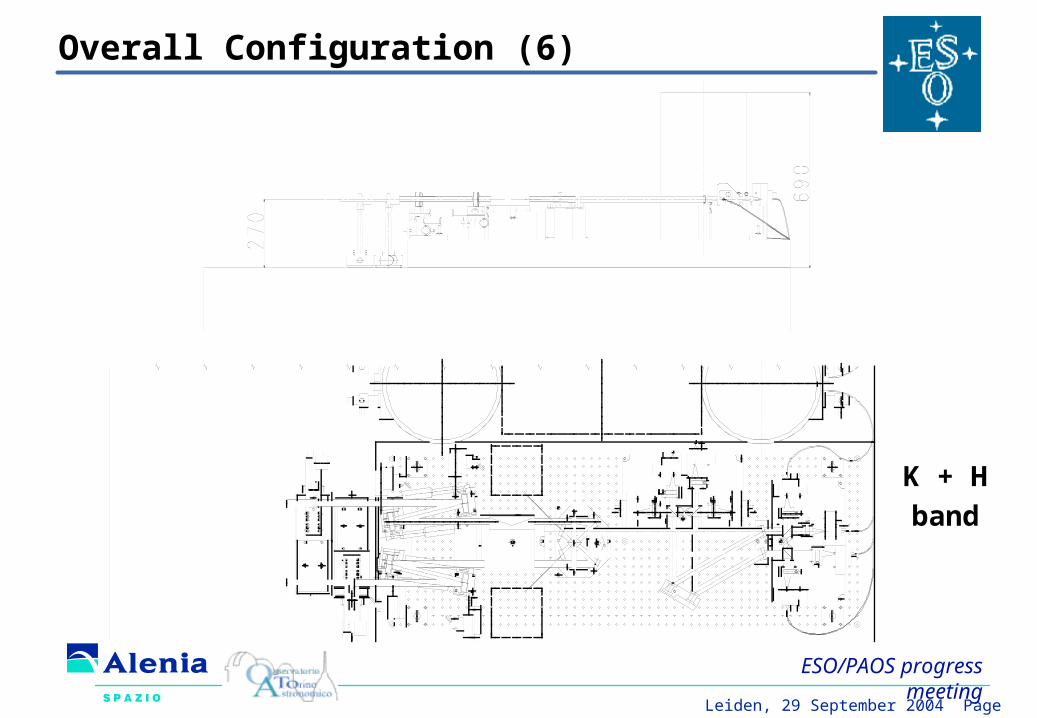
Overall Configuration (6)
K + H
band

Leiden, 29 September 2004 Page 12
ESO/PAOS progress meeting
Dimensions in mm
FSU Optics (1)
Glass compensatorGlass compensator
Description:Description: Infrasil® plano parallel plates with suitable thicknesses
Task:Task: Compensation of LAD introduced by differential air path (+/- 120 meters, 5 x 48 m regions)

Leiden, 29 September 2004 Page 13
ESO/PAOS progress meeting
FSU Optics (2)
Alignment Unit MirrorsAlignment Unit Mirrors
Description:Description: 2 actuated flat mirrors on each beam(2 x 5 degrees of freedom)
Task:Task: Alignment of input beams (pupil, image, OPD)w.r.t. VLTI artificial source Leonardo
Dimensions in mm

Leiden, 29 September 2004 Page 14
ESO/PAOS progress meeting
FSU Optics (3)
Achromatic Retarder and CompensatorAchromatic Retarder and Compensator
Description:Description: Retarder is a K-Prism (3 internal reflections)Compensator is a parallelepiped.Both in Infrasil®
Task:Task: Create a π/2 phase delay between p and s (Retarder) and Compensate for OPL inside the K-prism (Compensator)
Dimensions in mm

Leiden, 29 September 2004 Page 15
ESO/PAOS progress meeting
FSU Optics (4)
Beam CombinerBeam Combiner
Description:Description: Beamsplitter cube 50/50, linear polarisers @ 1319 nm in the 2.5 mm central area, wedges to reflect metrology laser in different direction.
Tasks:Tasks: combines both telescope beams, introduces a π phase delay between transmitted and reflected beams, combines both metrology beams, reject unwanted polarisation component of metrology beams, reject metrology laser stray light (angular deviation).Dimensions in mm

Leiden, 29 September 2004 Page 16
ESO/PAOS progress meeting
Beam combiner
In1
In2
Tr1 Re2
X
Y
a
b
φ
-Beam Splitter
Cube
Wedged
Polarizer
Z
Y
Top view
c
d
-beam splitter
cubeWedged
Polarizer
clear
aperture
Side view
Wedged
Polarizer
h
α
α
φ
2Tr
1Re_ _s MET in
_ _p MET in
_ _p MET out
_ _s MET out
X
Y
β
β
Wedged
Polarizer
Wedged
Polarizer

Leiden, 29 September 2004 Page 17
ESO/PAOS progress meeting
FSU Optics (5)
Metrology interfaceMetrology interface
Description:Description: two holed mirrors, reflect stellar beams and transmit the metrology beams
Task:Task: Inject/extract metrology beams from thestellar beams path (in central obscuration)
Dimensions in mm
Metrology and stellar beams are common-modeMetrology and stellar beams are common-modeup to beam-combinerup to beam-combiner

Leiden, 29 September 2004 Page 18
ESO/PAOS progress meeting
FSU Optics (6)
H/K DichroicsH/K Dichroics
Description:Description: Dichroic coatings on both sides, Substrate with small wedge
Task:Task: splits H band (reflected) and K band (transmitted) and reject metrology laser light
Dimensions in mm
H + K + 1319 nmK1319 nmH
1319 nmH
K

Leiden, 29 September 2004 Page 19
ESO/PAOS progress meeting
FSU Optics (7)
Polarising beam splittersPolarising beam splitters
Description:Description: 2 PBS designed in K band, with 2 corner cuberetroreflectors to minimize thermal background(the fiber “sees” its own core)
Task:Task: splits p and s polarisation components
Dimensions in mm
Leiden, 29 September 2004 Page 20
ESO/PAOS progress meeting
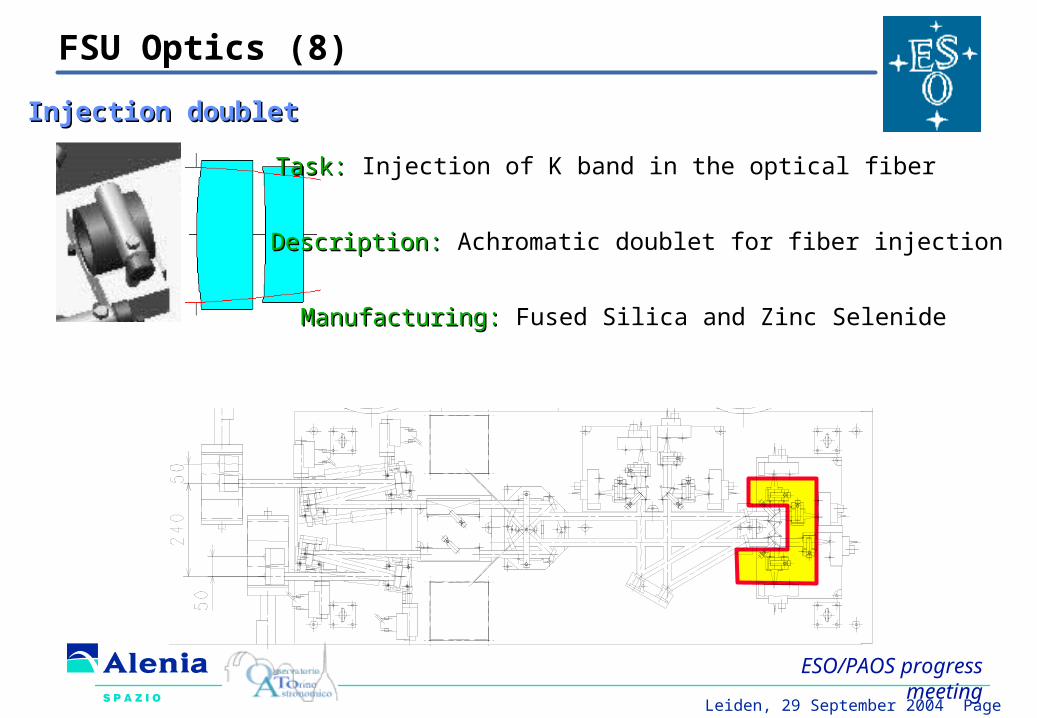
FSU Optics (8)
Injection doubletInjection doublet
Description:Description: Achromatic doublet for fiber injection
Manufacturing:Manufacturing: Fused Silica and Zinc Selenide
Task:Task: Injection of K band in the optical fiber
Dimensions in mm
Leiden, 29 September 2004 Page 21
ESO/PAOS progress meeting
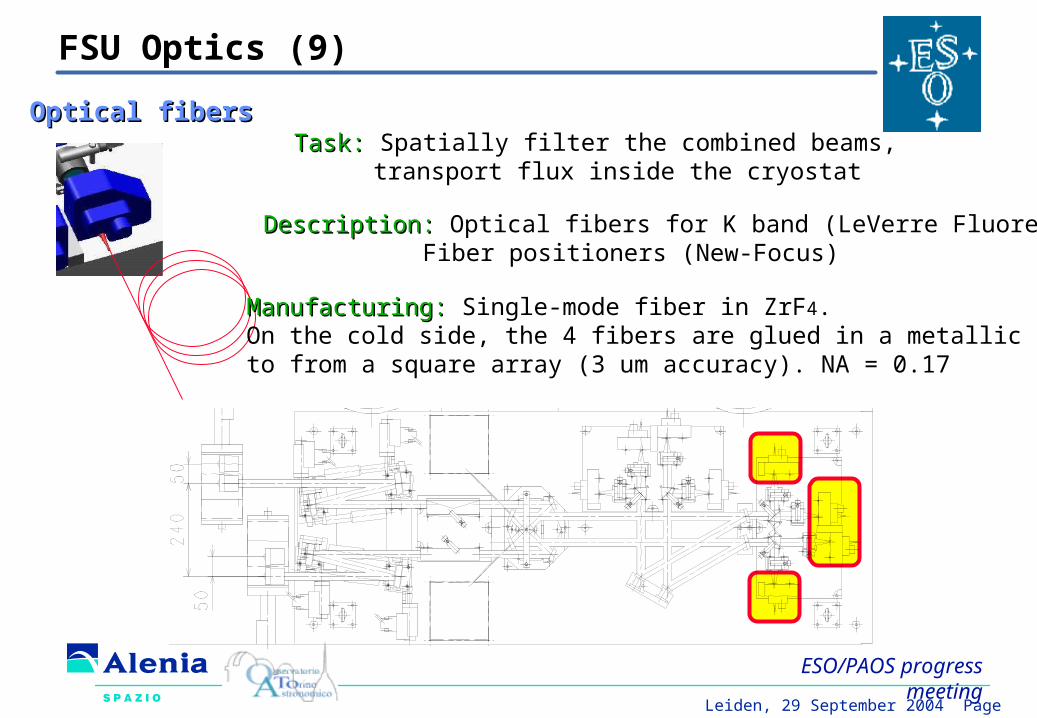
FSU Optics (9)
Optical fibersOptical fibers
Description:Description: Optical fibers for K band (LeVerre Fluore).Fiber positioners (New-Focus)
Manufacturing:Manufacturing: Single-mode fiber in ZrF4. On the cold side, the 4 fibers are glued in a metallic block to from a square array (3 um accuracy). NA = 0.17
Task:Task: Spatially filter the combined beams,transport flux inside the cryostat
Dimensions in mm

Leiden, 29 September 2004 Page 22
ESO/PAOS progress meeting
Cryostat

Leiden, 29 September 2004 Page 23
ESO/PAOS progress meeting
Cryostat (2)

Leiden, 29 September 2004 Page 24
ESO/PAOS progress meeting
FSU Optics (10)
Cold collimatorCold collimator
Description:Description: Achromatic doublet Fused silica and Zinc Selenide
Task:Task: Collimation of fiber output beams

Leiden, 29 September 2004 Page 25
ESO/PAOS progress meeting
FSU Optics (11)
Cold prismCold prism
Description:Description: Fused silica prism, Wedge ~ 12º,dichroic coatings
Task:Task: disperse A, B, C, D beamsreject λ>2.5 um (cold K filter)reject MET laser straylight (1/500)

Leiden, 29 September 2004 Page 26
ESO/PAOS progress meeting
FSU Optics (12)
Cold cameraCold camera
Description:Description: Single aspheric lens
Manufacturing:Manufacturing: Zinc SelenideFront surface is aspherical, rear surface is spherical
Task:Task: Projects dispersed spots on the array detector

Leiden, 29 September 2004 Page 27
ESO/PAOS progress meeting
Cryostat (3) Cold plate

Leiden, 29 September 2004 Page 28
ESO/PAOS progress meeting
Detection Algorithm Software Architecture
TAC Standard blockstacTIMBlock: IRACE Timing and Algorithm Scheduling Probe: Algorithm results storage by callback function , max rate 8 KHzMonitor: Real Time Display of last computed quantities up to 100Hz
Custom blockstacIRVMEBlock: manage the detector raw data in CDS and NDRO readout modetacOPDAmpBlock: produce OPD and squared Amps at up to 8 kHz tacGDBlock: implement the algorithm for GD estimate at user selectable rate up to 200HztacFluxBlock: provide the flux estimates in the 3 spectral channels tacRTNBlock: deliver OPD, GD and squared Amps to the OPD Controller at the rates applicable to each quantity.

Leiden, 29 September 2004 Page 29
ESO/PAOS progress meeting
Detector readout modes
time
time
Pixel Charge
RSTTrigger by TIM
DIT DIT
IRQ IRQ
Sequencenr loop Run-Time
TAC Algorithm Run-Time < Tr
Algorithm ResultsAvailable
RD1 RD2 RD1 RD2 RD1 RD2
RST
Tr= Readout Intervalmin Tr=0.125 ms
IRQ
DWT
time
time
RST RST
RD1
DIT DIT
IRQ IRQ
Sequencenr loop Run-Time
TAC Algorithm Run-Time < Tr
RD2
RDn-1RDn
RD1
RD2
RDn-1RDn
Algorithm resultsavailable
Pixel Charge
Trigger by TIM
Tr= Readout Interval
min Tr=0.125 ms
RDn
IRQ
DWT
Read-Reset-Read Multiple Non Destructive Readouts

Leiden, 29 September 2004 Page 30
ESO/PAOS progress meeting
Measurement algorithms: OPD
OPD estimate:
iterative procedure of least square fit of measured data sk to nominal data fk
First step: linear range identification
∑ −=
k k
kk xfszxe
2
2
1
))((),(
σ
Selection of minimum error position among three initial points (x1, x2, x3) in the fringe period
Subsequent steps: iterations of zero crossing estimate formula using tabulated functions f, g, l, h’ )(
)('1
n
nnn zh
zhzz −≅+
2' /)(2)( nnn xfxg σ⋅−= weight function
∑ ⋅=n
nn xgxsxl )()()( bias function
signature function )()()( xlxgsxhk
kk −⋅=∑Linear iterations required: 3
Template resolution: 1 - 5 nm

Leiden, 29 September 2004 Page 31
ESO/PAOS progress meeting
Simultation results Source = 3500 K
Evaluated vs. signal + background photon noise, read-out noise
OPD performance – Noise
Integration time [ms] 0.25 0.25 0.25 0.25 2 2
Assumed Readout noise [e rms] 11 11 11 11 4 4
Magnitude (UTs) [mag] 7 8 10 11 13 14
Req. on OPD noise [nm] 11.1 19.0 71.1 159 72 140
OPD noise, p = 0 m [nm] 6.2 11.2 44.5 109 46 98
OPD noise, p = 30 m [nm] 6.2 11.3 47.0 114 48 105
OPD noise, p = 60 m [nm] 6.8 12.3 50.8 124 49 110
OPD noise, p = 90 m [nm] 7.4 13.3 54.6 133 55 121
OPD noise, p = 120 m [nm] 8.5 15.3 61.6 163 64 147

Leiden, 29 September 2004 Page 32
ESO/PAOS progress meeting
OPD performance – Linearity
OPD mod λ measurement linearity - direct I/O comparison
%101 ≤−∂∂ddmRequirement:
OPD derivative – 1 Mean [%]
Peak [%]
RMS [%]
p = 0 m 0.000 0.063 0.028
p = 30 m 0.000 0.212 0.052
p = 60 m 0.000 0.158 0.044
p = 90 m 0.000 0.133 0.035
p = 120 m 0.000 0.114 0.026
Fulfilled from zenith to 120 m air path in delay line
Simulation results:

Leiden, 29 September 2004 Page 33
ESO/PAOS progress meeting
Measurement algorithms: Group Delay
GD estimate: by least square fit of measured data sk to nominal data fk
Montecarlo simulation over GD range [-6.1 m, 6.1 m]
4067 cases uniformly distributed - data resolution 3 nm
Source: point-like, T = 3’500 K and T = 25’000 K
Nominal FSU configuration - Spatial template resolution: 5 nm
Fringe jumps included (not removed)
Implementation approach: find local minimum of error in central fringe using OPD algorithm z1
find global minimum by error comparison over 6 fringes:
z1±λ, z1±2λ, z1±3λ z2
adjust local minimum around z2
Leiden, 29 September 2004 Page 34
ESO/PAOS progress meeting
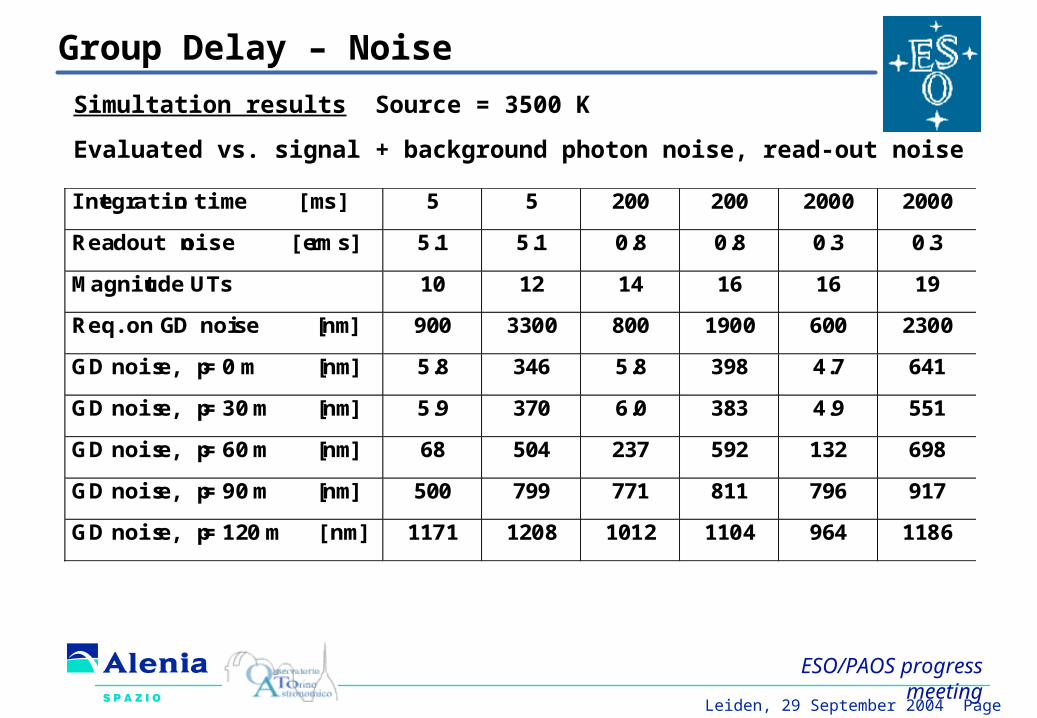
Group Delay – Noise
Integration time [ms] 5 5 200 200 2000 2000
Readout noise [e rms] 5.1 5.1 0.8 0.8 0.3 0.3
Magnitude UTs 10 12 14 16 16 19
Req. on GD noise [nm] 900 3300 800 1900 600 2300
GD noise, p = 0 m [nm] 5.8 346 5.8 398 4.7 641
GD noise, p = 30 m [nm] 5.9 370 6.0 383 4.9 551
GD noise, p = 60 m [nm] 68 504 237 592 132 698
GD noise, p = 90 m [nm] 500 799 771 811 796 917
GD noise, p = 120 m [nm] 1171 1208 1012 1104 964 1186
Simultation results Source = 3500 K
Evaluated vs. signal + background photon noise, read-out noise
Leiden, 29 September 2004 Page 35
ESO/PAOS progress meeting
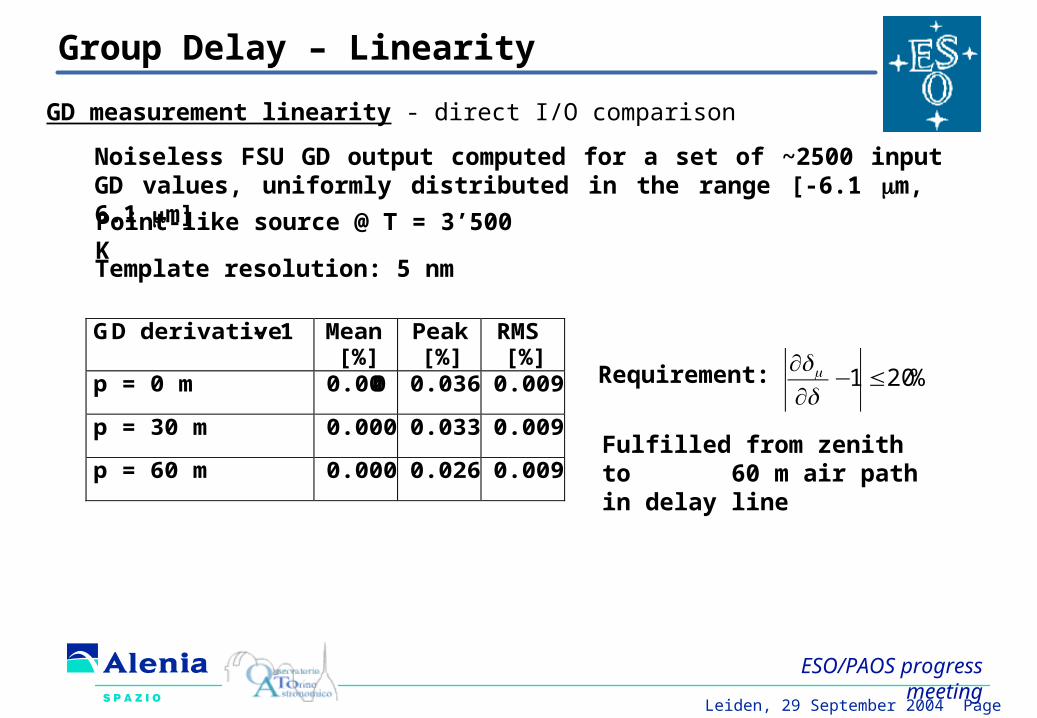
Group Delay – Linearity
GD measurement linearity - direct I/O comparison
Noiseless FSU GD output computed for a set of ~2500 input GD values, uniformly distributed in the range [-6.1 m, 6.1 m]
Point-like source @ T = 3’500 K
%201 ≤−∂∂ddmRequirement:
GD derivative – 1 Mean [%]
Peak [%]
RMS [%]
p = 0 m 0.000 0.036 0.009
p = 30 m 0.000 0.033 0.009
p = 60 m 0.000 0.026 0.009
Fulfilled from zenith to 60 m air path in delay line
Template resolution: 5 nm

Leiden, 29 September 2004 Page 36
ESO/PAOS progress meeting
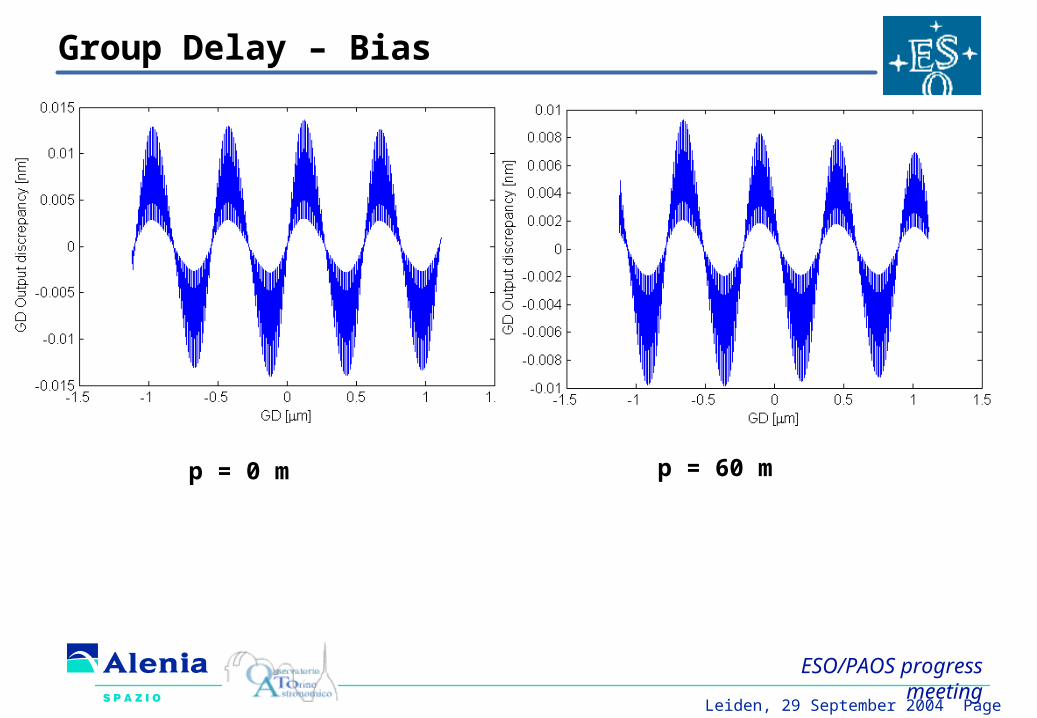
Group Delay – Bias
GD measurement bias - direct I/O comparison
Noiseless FSU GD output computed for a set of ~1000 input GD values, uniformly distributed in the range [-λ0/2, λ0/2]
Point-like source @ T = 3’500 K
Template resolution: 5 nm
2/,5.2 00 λ≤−≤− ddnmddm
Requirement: GD bias Mean [nm]
Peak [nm]
RMS [nm]
p = 0 m 0.000 0.014 0.006
p = 30 m 0.000 0.013 0.005
p = 60 m 0.000 0.010 0.004
Fulfilled from zenith to 60 m air path in delay line
Restricted GD range derived from recent definition of GD bias specification on central fringe
Leiden, 29 September 2004 Page 37
ESO/PAOS progress meeting
Group Delay – Bias
p = 0 m p = 60 m

Leiden, 29 September 2004 Page 38
ESO/PAOS progress meeting
Sensitivity analysis
Method:
modify FSU parameters (A beam only) & evaluate FSU output variation
Required knowledge of the transmission spectral distribution: 0.5% on transmission over full K band2% on single 100 nm spectral region
Required knowledge of the phase spectral distribution: 1º over full K band5º on single 100 nm spectral region
Leiden, 29 September 2004 Page 39
ESO/PAOS progress meeting
Sensitivity analysis – warm fiber end alignment
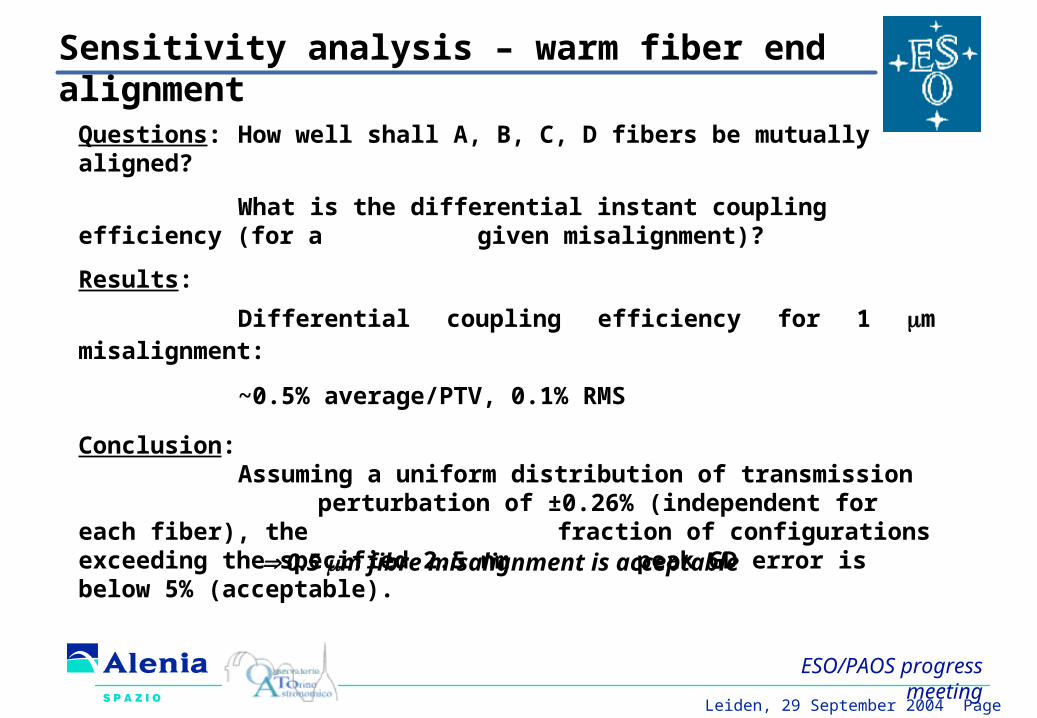
Questions: How well shall A, B, C, D fibers be mutually aligned?
What is the differential instant coupling efficiency (for a given misalignment)?
Results:
Differential coupling efficiency for 1 m misalignment:
~0.5% average/PTV, 0.1% RMS
Conclusion:Assuming a uniform distribution of transmission perturbation of ±0.26% (independent for each fiber), the fraction of configurations exceeding the specified 2.5 nm peak GD error is below 5% (acceptable).
0.5 m fibre misalignment is acceptable
Leiden, 29 September 2004 Page 40
ESO/PAOS progress meeting
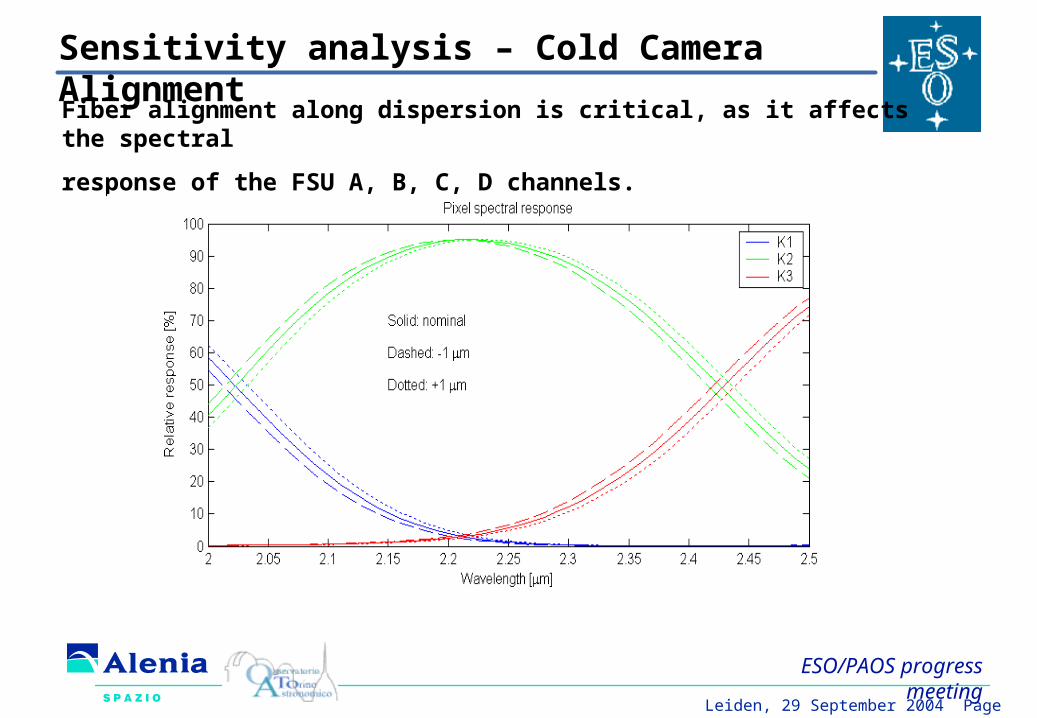
Sensitivity analysis – Cold Camera Alignment
Fiber alignment along dispersion is critical, as it affects the spectral
response of the FSU A, B, C, D channels.
Leiden, 29 September 2004 Page 41
ESO/PAOS progress meeting
Sensitivity analysis – Cold Camera Alignment (2)
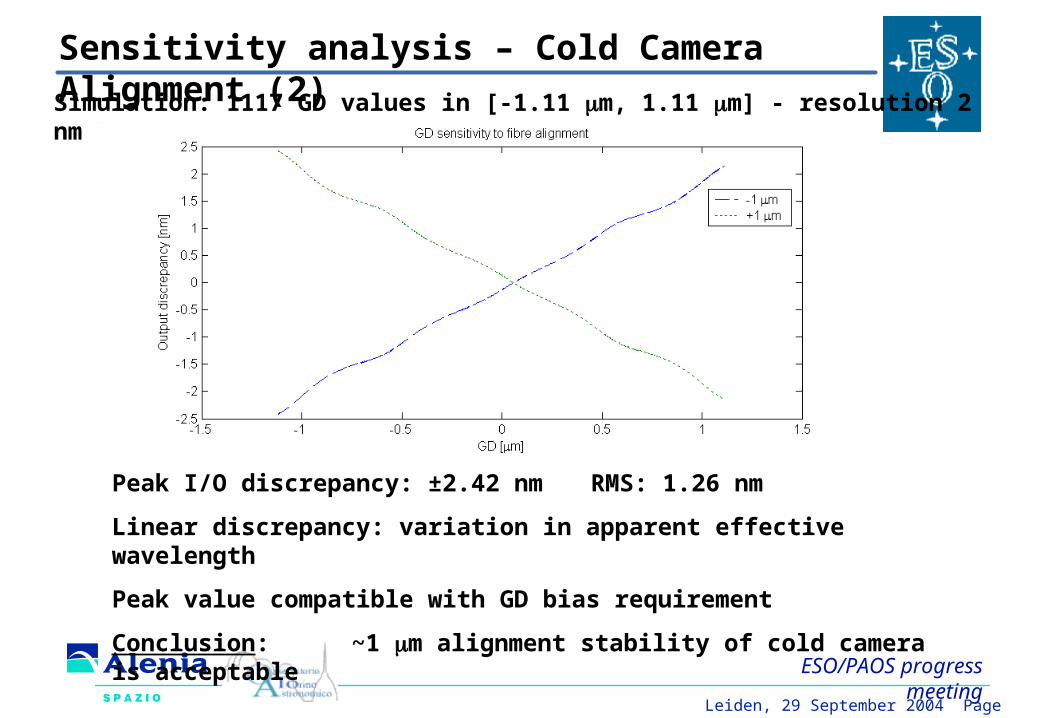
Simulation: 1117 GD values in [-1.11 m, 1.11 m] - resolution 2 nm
Peak I/O discrepancy: ±2.42 nm RMS: 1.26 nm
Linear discrepancy: variation in apparent effective wavelength
Peak value compatible with GD bias requirement
Conclusion: ~1 m alignment stability of cold camera is acceptable

Leiden, 29 September 2004 Page 42
ESO/PAOS progress meeting
FSU calibration (1)FSU Calibration procedure
Rationale: detailed characterisation of instrument parameters
Global approach: includes VLTI optical train and average atmosphere
Method: FSU A + B in calibration mode, OPD scan
(Fourier Transform Spectroscopy)
FSU A on Fringe Tracking loop, FSU B measuring for self-calibration
A B roles (tracking / calibration) exchanged for calibration of FSU A
Requirements:
FSU A + B; AT (UT); DL; STS; MET; known bright star
Purpose:
FSU spectral response
Target effective λ

Leiden, 29 September 2004 Page 43
ESO/PAOS progress meeting
FSU calibration (2)
Source requirements: knowledge / stability temperature or K magnitude
Requirements more relaxed for higher temperature sources
Not unreasonable for coldest stars: few 10 K, 0.02 mag
Requirements on lab source: 1 K @ T = 800 K

Leiden, 29 September 2004 Page 44
ESO/PAOS progress meeting
FSU calibration (3)
On-sky calibration sequence for FSU B (FSU A tracking)
1. Configure both STSs in calibration mode (+ telescope pointing etc.)
2. Acquire and centre stellar fringes on FSU A and FSU B independently
3. Close fringe tracking loop on FSU A: DL A driven by FSU A
4. Reset PRIMA metrology
5. DL B driven by FSU A + MET to cancel internal dOPD + OPD scan offsets
6. FSU B outputs recorded during OPD scan
7. OPD noise on FSU A and on MET supposed to average down to nm level
8. Fourier transform of FSU B output
9. Removal of source spectrum
10. Computation of transmission (modulus) and phase (argument) distributions
Procedure verified vs. photon + readout noise on FSU B

Leiden, 29 September 2004 Page 45
ESO/PAOS progress meeting
FSU calibration (4)Plot of Fsu output A, 100 m OPD scan, T = 6000 K source
Requirements for good spectral sampling (31 points) : 300 m scan
Exposure requirements by Montecarlo evaluation of noise on measured transmission (req. < 0.5%) and effective λ (req. < 0.5e-4)
K = 10 mag, TI = 400 ms 240 s total (100 ms OPD step actuation)
Nearly independent from source spectral type
Leiden, 29 September 2004 Page 46
ESO/PAOS progress meeting
On-line diagnostics
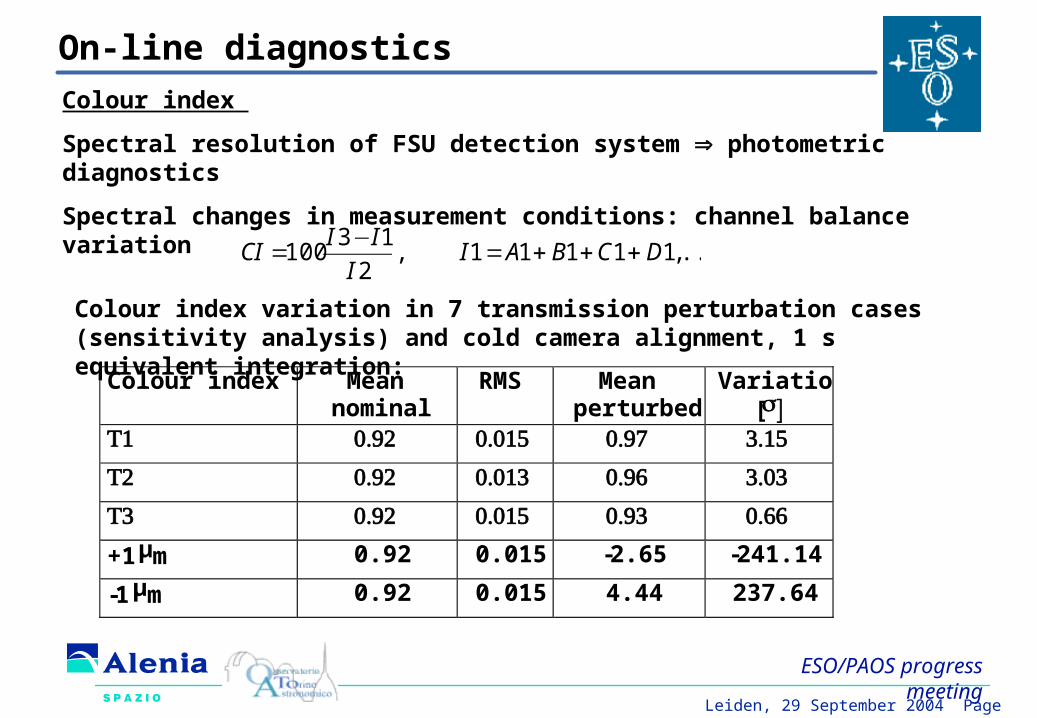
Colour index
Spectral resolution of FSU detection system photometric diagnostics
Spectral changes in measurement conditions: channel balance variation
...,11111,2
13100 DCBAI
I
IICI +++=
−=
Colour index variation in 7 transmission perturbation cases (sensitivity analysis) and cold camera alignment, 1 s equivalent integration:
Colour index Mean nominal
RMS Mean perturbed
Variation [σ]
1 T 0.92 0.015 0.97 3.15
2 T 0.92 0.013 0.96 3.03
3 T 0.92 0.015 0.93 0.66
+1 μm 0.92 0.015 -2.65 -241.14
-1 μm 0.92 0.015 4.44 237.64
Leiden, 29 September 2004 Page 47
ESO/PAOS progress meeting
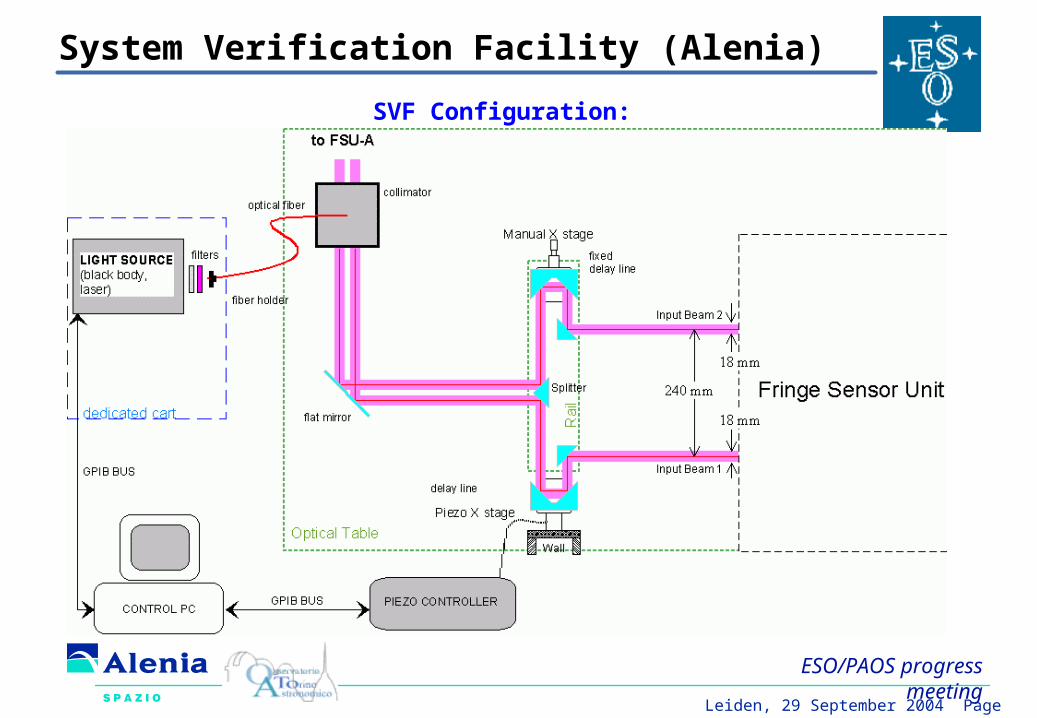
SVF Configuration:
System Verification Facility (Alenia)

Leiden, 29 September 2004 Page 48
ESO/PAOS progress meeting
Collimator
FSU Calibration Facility (Paranal)
Fiber Head

Leiden, 29 September 2004 Page 49
ESO/PAOS progress meeting
Achieved Contract Kick-off: July 2002
Final Design Review: September 2003
Order of fiber bundle (critical long lead item): Feb. 2004
First release of Ali LCU software and FSU WS software: May 2004
Cryostat acceptance tests and PICNIC detector integration: Sept. 2004
Next steps Finalise procurement of Beam Combiners (prototypes are available)
Complete opto-mechanical mechanical integration (by end 2004)
SVF and Calibration Faciliy manufacturing
Acceptance testing, scheduled in March 2005
Delivery of FSU A and B, in June 2005
Achieved milestones and next steps


![Eso Eso [1]](https://static.fdocuments.net/doc/165x107/5594e8891a28ab5d778b4705/eso-eso-1.jpg)