ESG Highlights - Nov 2020
25
December 2020 XYLEM INC. INVESTOR OVERVIEW & ESG HIGHLIGHTS
Transcript of ESG Highlights - Nov 2020

December 2020
XYLEM INC. INVESTOR OVERVIEW & ESG HIGHLIGHTS

Forward-Looking Statements This presentation contains information that may constitute “forward-looking statements" within the meaning of the Private Securities Litigation Reform Act of 1995. Generally, the words “anticipate,” “estimate,” “expect,” “project,” “intend,” “plan,” " contemplate," " predict," “forecast,” “believe,” “target,” “will,” “could,” “would,” “should,” " potential," " may" and similar expressions may, but are not necessary to, identify forward-looking statements. By their nature, forward-looking statements address uncertain matters and include any statements that: are not historical, such as statements about the Company’s capitalization, restructuring and realignment plans, and future strategic plans; describe the Company’s business strategy, outlook, objectives, plans, intentions or goals; or address operating or financial performance, events or developments that we expect or anticipate will occur in the future - including statements relating to orders, revenues, operating margins and earnings per share growth, and expressing general views about future operating results . Forward-looking statements involve known and unknown risks, uncertainties and other important factors that could cause actual results to differ materially from those expressed or implied in, or reasonably inferred from, such statements. The novel coronavirus (“COVID-19”) pandemic is and may continue to amplify many of these risks and uncertainties.
Factors that could cause results to differ materially from those anticipated include: overall economic and business conditions; the COVID-19 pandemic’s uncertain magnitude, duration, geographic reach and impact on the global economy; the current and future impact of the COVID-19 pandemic on our business, growth, projections, financial condition, operations, cash flows, and liquidity, including from adverse economic conditions on our performance or customer markets caused by the COVID-19 pandemic ; actual or potential other epidemics, pandemics or global health crises; geopolitical and other risks associated with our international operations that could affect customer markets and our business , such as military actions, protectionism, economic sanctions or trade barriers, including tariffs and embargoes, and non-compliance with laws or regulations , including those pertaining to foreign corrupt practices, data privacy, export and import and competition; potential for unexpected cancellations or delays of customer orders in our reported backlog; fluctuations in foreign currency exchange rates; disruption, competition and pricing pressures in the markets we serve; industrial, governmental and private sector spending; the strength of housing and related markets; weather conditions; ability to retain and attract talent and key members of management; our relationship with and the performance of our supply chain, including channel partners; our ability to successfully identify, complete and integrate acquisitions; our ability to borrow or refinance our existing indebtedness; availability of liquidity sufficient to meet our needs; uncertainty from the expected discontinuance of LIBOR and transition to another interest rate benchmark; changes in the value of goodwill or intangible assets; uncertainty related to restructuring and realignment actions and related charges and savings , including with respect to the amount and timing of estimated costs and savings, the timing of or delays in implementing actions, and our ability to realize all of the anticipated cost savings, all of which are subject to change as the Company makes decisions and refines plans and estimates over time; management and employee distraction resulting from restructuring actions; timing delays in implementing strategic initiatives; our ability to continue strategic investments for growth; risks relating to products, including defects, security, liability and recalls; governmental or regulatory claims or investigations; cybersecurity attacks, breaches or other disruptions of information technology systems on which we rely, or on our products ; our sustainability initiatives; the use of proceeds from our green bond offering, including failure to appropriately allocate the net proceeds or meet the investment requirements of certain environmentally-focused investors; litigation and contingent liabilities; and other factors set forth under “Item 1A. Risk Factors” in our Annual Report on Form10-K for the year ended December 31, 2019, " Item 1A. Risk Factors" in the Company's Quarterly Report on Form 10-Q for the quarter ended March 31, 2020 and in subsequent filings we have made or may make with the Securities and Exchange Commission.
All forward-looking statements made herein are based on information currently available to the Company as of the date of this press release. The Company undertakes no obligation to publicly update or revise any forward-looking statements, whether as a result of new information, future events or otherwise, except as required by law.
2

Xylem at a Glance
Founded
Global Locations
Employees
Market Cap1
1. As of 12/7/2020
2019 Revenue
$5.25B
Adj. EBITDAMargin*
19.5%
Adj. Operating Margin*
13.9%
* See appendix for non-GAAP reconciliations 3
~$18B
~16,300
~380
2011
U.S.
45%
Rest of World
8%
Emerging Markets
21%
Western Europe
26%
Revenue by Geography:
Revenue by End Market: Utilities
50%Industrial
35%Commercial
10%Residential
5%

4
Our VisionTo create a world in which water issues are no longer a constraint to health, prosperity and sustainable development.
Our StrategyTo help customers solve the world’s greatest water challengeswith innovative products, services and solutions.
R E S P O N S I B I L I T Y | C R E AT I V I T Y | R E S P E C T | I N T E G R I T Y
CustomerSuccess
EmergingMarkets
Leadership& Talent
Sustainability
Cultivate Leadership& Talent Development
Integrate sustainability into everything we do
• Strengthen our Empowering, Mission-Driven & Inclusive Culture• Increase Leadership Succession Depth and Breadth• Align Incentives and Organization With Strategy C
ore
Stra
tegi
c Pi
llars Grow in
Emerging Markets
• Accelerate Localization• Expand Coverage to Underserved Cities, Countries & Sub-
Regions• Establish Robust Base of Pyramid Business Plan
DriveCustomer Success
• Accelerate the Digital Transformation of Water• Enhance the Customer Experience
• Build Leadership Position in Services and Solutions
Build a Cultureof ContinuousImprovement
• Drive Cost Leadership • Build Supply Chain Resilience and Sustainability
• Eliminate Business Complexity
Strengthen Innovation& Technology
• Accelerate Enabling Digital Infrastructure• Deliver Strategic Innovation • Strengthen Core Portfolio
ContinuousImprovement
Innovation &Technology
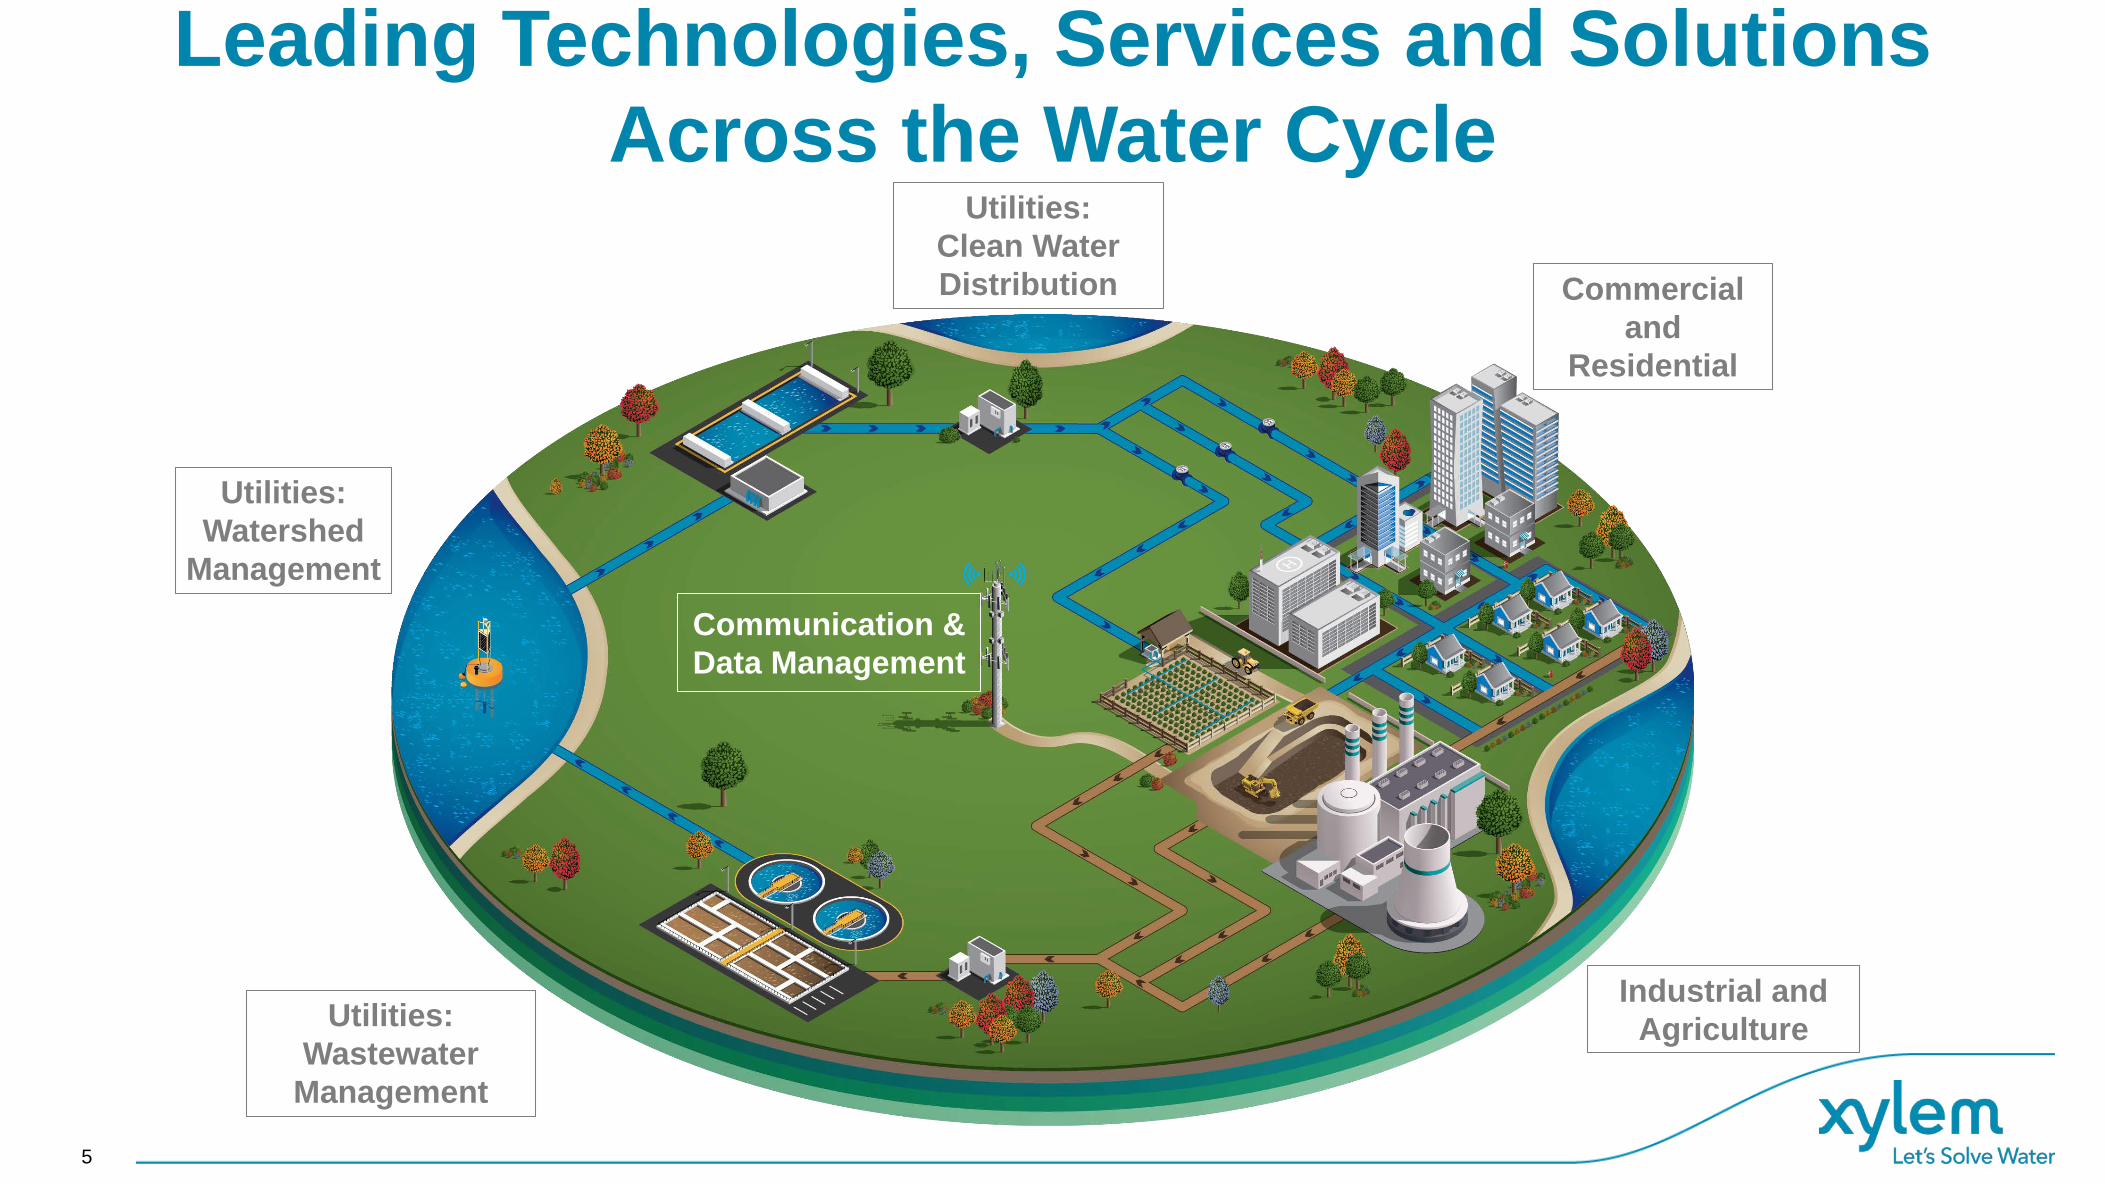
Leading Technologies, Services and Solutions Across the Water Cycle
5
Utilities:Watershed
Management
Utilities:Clean Water Distribution
Utilities:Wastewater
Management
Communication &Data Management
Industrial andAgriculture
Commercial and
Residential

6
Global Water Challenges Are Escalating
Scarcity
3 out of 10 people do not have access to safe drinking water. 6 out of 10 lack access to safely managed sanitation services.
Resilience
By 2050, more than 200 million people could be displaced by desertification, sea level rise and extreme weather events.
Affordability
$40 billion of clean water is lost annually due to broken infrastructure or unauthorized use, driving water prices higher
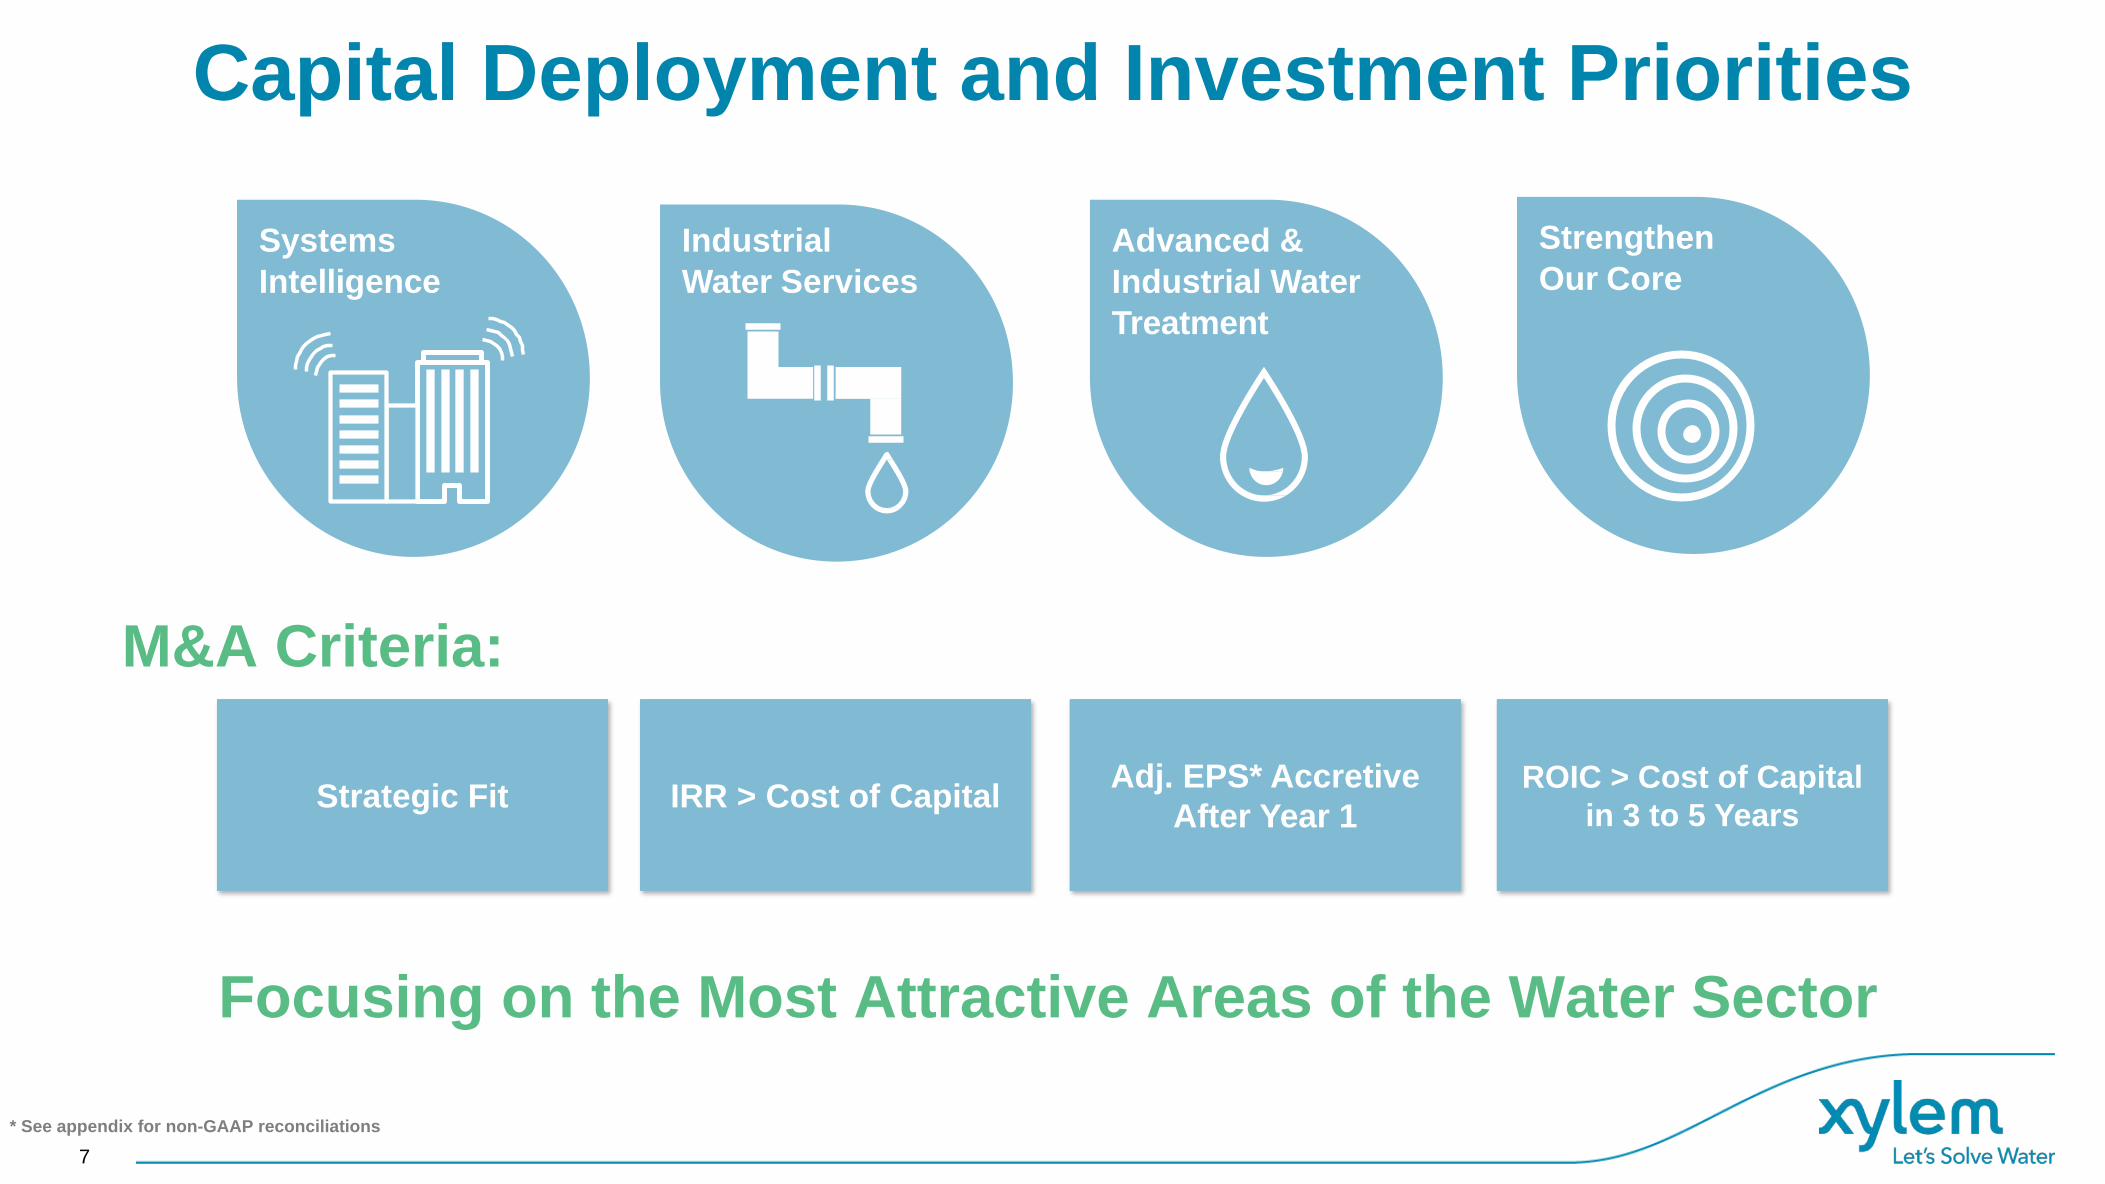
Industrial Water Services
Capital Deployment and Investment Priorities
Strengthen Our Core
Advanced & Industrial Water Treatment
Systems Intelligence
Strategic Fit IRR > Cost of Capital Adj. EPS* Accretive After Year 1
ROIC > Cost of Capital in 3 to 5 Years
Focusing on the Most Attractive Areas of the Water Sector
* See appendix for non-GAAP reconciliations
M&A Criteria:
7

8
Core Products
Smart and Connected Products
Intelligent Solutions and Services
We Have a Unique and Differentiated Portfolio of Products and Solutions
Moving Up the Technology
Curve Leveraging organic investments
through innovation and
technology
Adding digital and other cutting
edge technologies through M&A
Building on deep global installed base and long history of quality, reliable products enables further optimization for customers with digital solutions

Xylem’s Investment Thesis WE WILL BENEFIT FROM FAVORABLE
SECULAR THEMES
MARKET-PLUS GROWTH DRIVEN BY FOCUSED STRATEGIES
RUNWAY FOR FURTHER MARGIN EXPANSION
STRATEGIC CAPITAL DEPLOYMENT TO CREATE VALUE
• Well positioned in key end markets and geographies with sustainable long-term growth profiles
• Increased investment in faster-growth regions and innovation
• Productivity and simplification actions continue to enhance profitability
• Strong cash flow generation and capital structure enables significant value creation
9

Committed to Excellence in Corporate Governance
10
Focus on Long-term
Growth and Value
Creation
Strong Corporate
Governance Profile
Increasing Gender
Balance and Racial/Ethnic
Diversity
Executive Compensation
Tied to Sustainability
Robust Shareholder Engagement
Our Board has a record of corporate governance
enhancements that promote accountability of management and the Board to shareholders
• All Directors are independent except our CEO (92%); Independent Chair
• Shareholder proxy access right• Overall Board and committee meeting attendance 95% (2019)• Declassified board with all directors elected annually• Shareholders have the right to call special meetings• No poison pill• Annual self-assessments of Board, committees and individuals;
periodic evaluations by an independent 3rd party• Robust director nominee selection process with commitment to
diverse candidate pools• Effective oversight of ESG risks and opportunities

Diverse Board of Directors with Deep Expertise and Global Perspective
Lila TretikovCorporate Vice President of Technology, Microsoft
Committees: Innovation & Technology
Jeanne Beliveau-DunnChief Executive Officer & President, Claridad
Committees: Leadership Development & Compensation, Innovation & Technology
Patrick K. DeckerPresident & CEO, Xylem
Former President & CEO, Harsco
Robert F. FrielIndependent Board Chair, XylemFormer Chairman, President & CEO, PerkinElmer
Committees: Nominating & Governance
Victoria D. HarkerEVP & Chief Financial Officer, TEGNA
Committees: Audit & Finance (Chair), Nominating & Governance
Sten E. JakobssonFormer President & CEO, ABB AB
Committees: Audit & Finance, Nominating & Governance
Steven R. LorangerFormer Chairman, President & CEO, ITT
Committees: Innovation & Technology (Chair), Leadership Development & Compensation
Jerome A. PeribereFormer President & CEO, Sealed Air
Committees: Leadership Development & Compensation (Chair), Innovation & Technology
Surya N. Mohapatra Ph.D.Former Chairman, President & CEO, Quest Diagnostics
Committees: Leadership Development & Compensation, Innovation & Technology
Markos I. TambakerasFormer Chairman, President & CEO, Kennametal
Committees: Nominating & Governance (Chair), Audit & Finance
Jorge M. GomezEVP & Chief Financial Officer, Dentsply Sirona
Committees: Audit & Finance, Nominating & Governance
11
Uday YadavPresident & COO, Electrical Sector, Eaton
Committees: Audit & Finance

Board Composition and Evaluation
Conduct robust annual assessment
Focus on Board succession
Enhance the Board’s skills and expertise
Increase gender balance and racial and ethnic diversity
Nominating & Governance Committee responsible for identifying and recommending qualified director candidates
Actively manage Board succession with focus on diversity of thought and background, innovation and technology and global leadership experience
Lila Tretikov and Uday Yadav appointed to our Board in 2020 bringing global perspectives and technology and operational expertise
3 27
≤2 3-6 7-10
Director Tenure*
2
4
1
32
≤55 56-60 61-65 66-70 >70
Director Age*
Average Tenure: 6 years Average Age: 62
Diversity50% of
Directors are Female or Ethnically Diverse
92% of Directors are Independent
12
*As of September 30, 2020

Compensation Governance Highlights Compensation Governance
Clear & comprehensive disclosure Pay-for-performance alignment Balanced short-term & long-term incentive pay mix Stock ownership guidelines Annual risk assessment Clawback policy Double-trigger change of control provision No tax gross-ups Prohibition on pledging, hedging and shorting No perquisites No special retirement plan for NEOs No fixed-term employment contracts for NEOs No repricing of options
13
Strong governance practices to ensure that executive compensation supports the long-term interests of our shareholders
Simple, flexible, and sustainable to support strategic growth priorities
Focused on long-term growth and profitability… strongly aligned with long-term value creation
Target compensation may be adjusted for individual performance, strategic impact, level of responsibility and tenure in the position
Compensation for Chief Executive Officer and Chief Sustainability Officer linked to sustainability performance

Executive Compensation Program Structure Compensation
Element Key Role
Base Salary • Fixed component of compensation.
Annual Incentive Plan
• Cash incentive plan for results in single year• 75% based on Team Performance: Revenue (25%),
Operating Income (25%) and Free Cash Flow (25%)• 25% based on Individual Objectives*
Long-Term Incentive Plan
• 50% of LTIP award is PSUs based on 3-year absolute ROIC metric (25%) & 3-year relative TSR metric (25%)
• Other 50% of LTIP award is time-based RSUs (25%) and stock options (25%)
*Individual Objectives (IO) for Annual Incentive Plan:• Both financial and non-financial for executives; align with the Company’s top
strategic priorities and imperatives• IO scores designed to be differentiated based on assessment of individual’s
performance against his or her IO objectives• IO objectives for our CEO and our Chief Sustainability Officer include
sustainability performance as measured by Sustainalytics• IO objectives for segment presidents include safety performance of their
businesses as measured by injury frequency and risk reduction index
14
2019 CEO Target Compensation Mix
Base Salary 13%
Annual Incentive 16%
Long-Term Incentive 71% Performance-Based
Compensation: 87%
Please see 2020 Proxy Statement for further details
Strong support in say-on-pay votes … at least 91% since 2011
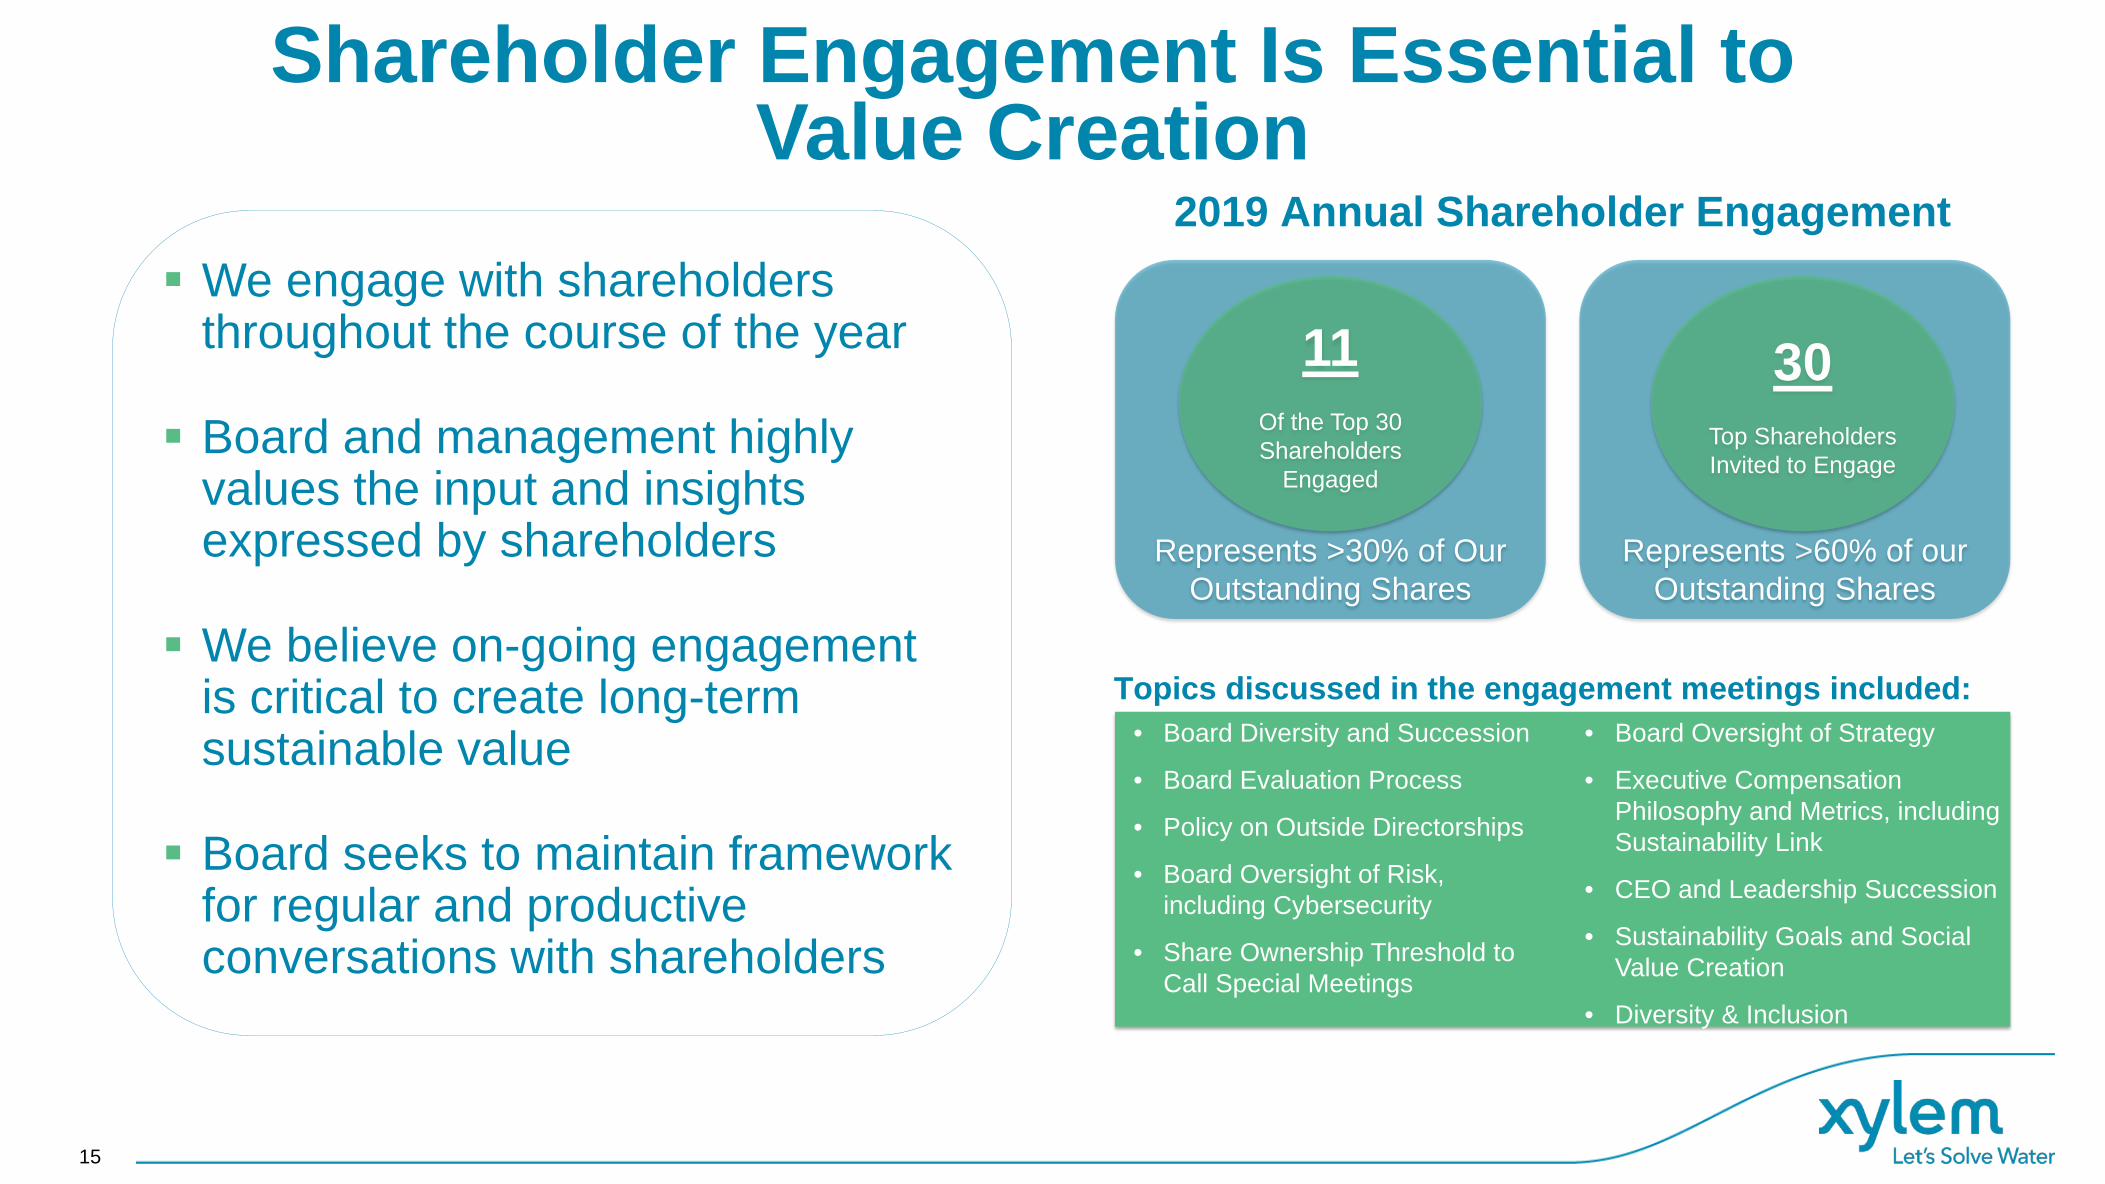
Shareholder Engagement Is Essential to Value Creation
2019 Annual Shareholder Engagement
Represents >60% of our Outstanding Shares
30Top Shareholders Invited to Engage
Represents >30% of Our Outstanding Shares
11Of the Top 30 Shareholders
Engaged
Topics discussed in the engagement meetings included:
15
We engage with shareholders throughout the course of the year
Board and management highly values the input and insights expressed by shareholders
We believe on-going engagement is critical to create long-term sustainable value
Board seeks to maintain framework for regular and productive conversations with shareholders
• Board Diversity and Succession
• Board Evaluation Process
• Policy on Outside Directorships
• Board Oversight of Risk, including Cybersecurity
• Share Ownership Threshold to Call Special Meetings
• Board Oversight of Strategy
• Executive Compensation Philosophy and Metrics, including Sustainability Link
• CEO and Leadership Succession
• Sustainability Goals and Social Value Creation
• Diversity & Inclusion

Key Areas of Board and Committees Risk Oversight
16
AUDIT & FINANCE• Oversight of overall risk assessment and
risk management processes and policies • Accounting, controls and financial
disclosures • Financial statements and financial risk
exposures• Tax strategy and related risks• Business ethics and anti-corruption
program• Capital structure and credit rating review
BOARD• Strategy • Succession planning for senior
management• Competitive developments• Significant mergers and acquisitions• Significant legal or reputational matters • Significant commercial and capital
markets risks • Cyber risk and data privacy
INNOVATION & TECHNOLOGY
• Technology, innovation and disruption• Technical talent management• Product safety
LEADERSHIP DEVELOPMENT & COMPENSATION
• Executive compensation philosophy and program design
• Executive development and leadership • Succession planning for senior
management• Diversity & inclusion • Talent management and employee
engagement survey review
NOMINATING & GOVERNANCE
• Certain compliance programs, including trade, anti-harassment, environmental, health and safety
• Corporate governance • Sustainability, corporate responsibility &
social value creation • Business continuity, including crisis
preparedness

Sustainability is Fundamental to Who We Are and What We Do
17
Barron’s
Most Sustainable Companies
78 Overall ESG Score(Leader; 98th
Percentile)
AAA ESG Rating
Just Capital’s listof America’s most JUSTcompanies
Gold Medal CSR Rating
2020 Highlights• Strong progress towards 2025 Sustainability Goals• Issued a $1 Billion Inaugural Green Bond to fund projects and further link
sustainability with business and financing strategies; builds on sustainability-rating linked credit revolver (executed in 2019)
• Provided robust support to our colleagues, customers and communities as part of COVID-19 response
• Advancing commitment to diversity & inclusion• Leveraged partnerships and issued whitepapers to raise awareness of water issues
to global audiences• Appointed Claudia Toussaint as Chief Sustainability Officer
Human Rights Campaign
Corporate Equality Index 2020
100%A -
Newsweek
Most Responsible Companies
#27

Our Sustainability Framework and Alignment with UN Sustainable Development Goals
18
Empowering CommunitiesWe provide humanitarianrelief and volunteer to help people living in communities facing severe water challenges.
Serving Our CustomersWe provide innovative technologies, solutions and expertise that helpour customers solve major water challenges.
Building a SustainableCompanyWe adhere to and champion responsible business practices, including promoting diversity and inclusion.
Xylem Sustainability 2025 Framework
We have broad impact across all UN SDG’s … but are sharply focused on a unique and specific opportunity to directly impact 3, 5, 6, 9, 11 & 13

19
more than 16.5 billion cubic meters of water* through advanced technologies that avert water loss and enable water reuse
SAVE
over 7 billion cubic meters of polluted water from flooding communities
PREVENT
1% of Xylem employees’ time and 1% of company profits to water-related causes and education
GIVE
that 100% of Xylem employees have access to clean water and safe sanitation at work, at home and during natural disasters
ENSURE
Use 100%
energy and process water recycling at Xylem’s major facilities
RENEWABLE
access to clean water and sanitation solutions for at least 20 million people living at the base of the global economic pyramid
PROVIDE
Deepening Our Commitment to SustainabilityThrough Our 2025 Signature Goals

20
Essential Services and Support Through COVID-19
Supporting Our Colleagues• Health and safety is paramount
(Mask mandates; site testing and contact tracing, etc.)
• $20M pledged for employee support packages
• Activated Xylem’s Pandemic Risk Mitigation Plan
Supporting Our Customers
• Supporting mission-critical essential services (e.g., Treatment equipment installed for emergency expansion of hospital in Sicily)
• Engaging customers through Xylem Assist outreach program
• Enabling remote work and training through online education and certification modules
Supporting Our Communities
• Donating water technology products for pop-up hospitals in Italy, China, and U.S.
• Engaged with partners and colleagues through grant awards and donation matching
• Partnerships with global NGOs to serve communities in need
• Donating PPE
Critical water and wastewater operations have never been more important

2121
Strong Commitment to Diversity & InclusionGoals and highlights include:
• 50% gender parity in leadership positions• 25% U.S. minority representation in leadership
positions
• Company policy for diverse candidate slates in 100% of open people manager roles; committed to diverse candidate pool for Board of Director candidates; D&I metrics part of quarterly business reviews
• 25% of employees engaged in internal employee networks (Women, LGBTQ, People of Color, Working Parents, Veterans, Emerging Leaders)
• Quarterly D&I events at industry and other events with customers, suppliers & partners
• Focus on social value and water equity in underrepresented and underserved communities
• Increase US diverse supplier spend (women-owned, minority-owned, veteran owned businesses, etc.)

Appendix
22

Xylem Inc. Non-GAAP MeasuresManagement reviews key performance indicators including revenue, gross margins, segment operating income and margins, orders growth, working capital and backlog, among others. In addition, we consider certain non-GAAP (or "adjusted") measures to be useful to management and investors evaluating our operating performance for the periods presented, and to provide a tool for evaluating our ongoing operations, liquidity and management of assets. This information can assist investors in assessing our financial performance and measures our ability to generate capital for deployment among competing strategic alternatives and initiatives, including but not limited to, dividends, acquisitions, share repurchases and debt repayment. Excluding revenue, Xylem provides guidance only on a non-GAAP basis due to the inherent difficulty in forecasting certain amounts that would be included in GAAP earnings, such as discrete tax items, without unreasonable effort. These adjusted metrics are consistent with how management views our business and are used to make financial, operating and planning decisions. These metrics, however, are not measures of financial performance under GAAP and should not be considered a substitute for revenue, operating income, net income, earnings per share (basic and diluted) or net cash from operating activities as determined in accordance with GAAP. We consider the following non-GAAP measures, which may not be comparable to similarly titled measures reported by other companies, to be key performance indicators:
“Organic revenue" and "Organic orders” defined as revenue and orders, respectively, excluding the impact of fluctuations in foreign currency translation and contributions from acquisitions and divestitures. Divestitures include sales of insignificant portions of our business that did not meet the criteria for classification as a discontinued operation. The period-over-period change resulting from foreign currency translation impacts is determined by translating current period and prior period activity using the same currency conversion rate.
“Constant currency” defined as financial results adjusted for foreign currency translation impacts by translating current period and prior period activity using the same currency conversion rate. This approach is used for countries whose functional currency is not the U.S. dollar.
“EBITDA” defined as earnings before interest, taxes, depreciation and amortization expense. “Adjusted EBITDA” reflects the adjustment to EBITDA to exclude share-based compensation charges, restructuring and realignment costs, gain or loss from sale of businesses and special charges.
"Adjusted Operating Income", "Adjusted Segment Operating Income", "Adjusted Net Income" and “Adjusted EPS” defined as operating income, segment operating income, net income and earnings per share, adjusted to exclude restructuring and realignment costs, gain or loss from sale of businesses, special charges and tax-related special items, as applicable.
“Free Cash Flow” defined as net cash from operating activities, as reported in the Statement of Cash Flow, less capital expenditures as well as adjustments for other significant items that impact current results which management believes are not related to our ongoing operations and performance. Our definition of "free cash flow" does not consider certain non-discretionary cash payments, such as debt.
“Realignment costs” defined as costs not included in restructuring costs that are incurred as part of actions taken to reposition our business, including items such as professional fees, severance, relocation, travel, facility set-up and other costs.
“Sensus Acquisition Related Costs” defined as costs incurred by the Company associated with the acquisition of Sensus that are being reported within operating income. These costs include integration costs, acquisition costs, costs related to the recognition of the backlog intangible asset amortization recorded in purchase accounting.
“Special charges" defined as costs incurred by the Company, such as acquisition and integration related costs not included in "Sensus Acquisition Related Costs", non-cash impairment charges and other special non-operating items, such as pension adjustments.
“Tax-related special items" defined as tax items, such as tax return versus tax provision adjustments, tax exam impacts, tax law change impacts, significant reserves for cash repatriation, excess tax benefits/losses and other discrete tax adjustments.
23

2019 Xylem Inc. Non-GAAP ReconciliationReported vs. Organic & Constant Currency Revenue
($ Millions)(As Reported - GAAP) (As Adjusted - Organic)
Constant Currency
(A) (B) (C) (D) (E) = B+C+D (F) = E/A (G) = (E - C) / AChange % Change
Acq./Div.
Change % Change
Year Ended December 31 2019 Revenue 2018 Revenue 2019 v. 2018 2019 v. 2018 FX ImpactAdj. 2019 v.
2018Adj. 2019 v.
2018
Xylem Inc. 5,249 5,207 42 1% 22 124 188 4% 3%Water Infrastructure 2,177 2,176 1 0% - 70 71 3% 3%Applied Water 1,541 1,534 7 0% - 29 36 2% 2%Measurement & Control Solutions 1,531 1,497 34 2% 22 25 81 5% 4%
24
Adjusted Operating Income
2019
Total Revenue 5,249
Operating Income 486
Operating Margin 9.3%
Special Charges 159
Restructuring & Realignment Costs 82
Adjusted Operating Income 727
Adjusted Operating Margin 13.9%
EBITDA and Adjusted EBITDA($ Millions)
2019Net Income 401Income Tax Expense 15Interest Expense (Income), net 62Depreciation 117Amortization 140EBITDA 735Share-based Compensation 29Restructuring & Realignment 82Special Charges 178Adjusted EBITDA 1,023Revenue 5,249Adjusted EBITDA Margin 19.5%
Thank You
25
#Xylemsustainability | #letssolvewater
NYSE: XYL
Matt Latino, Vice President, Investor Relations(914) 323-5821
Joanne Peck, Investor Relations Coordinator(914) 323-5931
http://www.xylem.com/en-us/investors/