ESG 6-10 Years Strategy
2
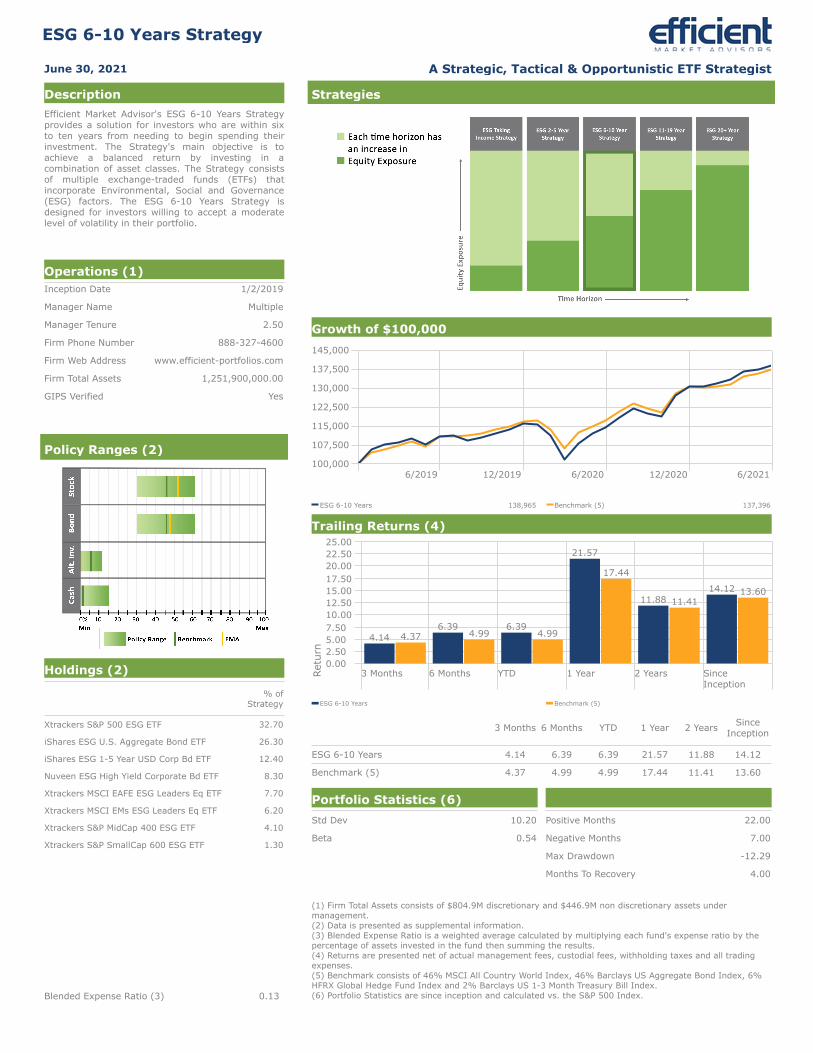
ESG 6-10 Years Strategy Description Efficient Market Advisor's ESG 6-10 Years Strategy provides a solution for investors who are within six to ten years from needing to begin spending their investment. The Strategy's main objective is to achieve a balanced return by investing in a combination of asset classes. The Strategy consists of multiple exchange-traded funds (ETFs) that incorporate Environmental, Social and Governance (ESG) factors. The ESG 6-10 Years Strategy is designed for investors willing to accept a moderate level of volatility in their portfolio. Operations (1) Inception Date Manager Name Manager Tenure Firm Phone Number Firm Web Address Firm Total Assets GIPS Verified 1/2/2019 Multiple 2.50 888-327-4600 www.efficient-portfolios.com 1,251,900,000.00 Yes Holdings (2) % of Strategy Xtrackers S&P 500 ESG ETF iShares ESG U.S. Aggregate Bond ETF iShares ESG 1-5 Year USD Corp Bd ETF Nuveen ESG High Yield Corporate Bd ETF Xtrackers MSCI EAFE ESG Leaders Eq ETF Xtrackers MSCI EMs ESG Leaders Eq ETF Xtrackers S&P MidCap 400 ESG ETF Xtrackers S&P SmallCap 600 ESG ETF 32.70 26.30 12.40 8.30 7.70 6.20 4.10 1.30 Blended Expense Ratio (3) 0.13 Policy Ranges (2) Portfolio Statistics (6) Std Dev Beta 10.20 0.54 Positive Months Negative Months Max Drawdown Months To Recovery 22.00 7.00 -12.29 4.00 (1) Firm Total Assets consists of $804.9M discretionary and $446.9M non discretionary assets under management. (2) Data is presented as supplemental information. (3) Blended Expense Ratio is a weighted average calculated by multiplying each fund's expense ratio by the percentage of assets invested in the fund then summing the results. (4) Returns are presented net of actual management fees, custodial fees, withholding taxes and all trading expenses. (5) Benchmark consists of 46% MSCI All Country World Index, 46% Barclays US Aggregate Bond Index, 6% HFRX Global Hedge Fund Index and 2% Barclays US 1-3 Month Treasury Bill Index. (6) Portfolio Statistics are since inception and calculated vs. the S&P 500 Index. 3 Months 6 Months YTD 1 Year 2 Years Since Inception ESG 6-10 Years Benchmark (5) 4.14 6.39 6.39 21.57 11.88 14.12 4.37 4.99 4.99 17.44 11.41 13.60 Trailing Returns (4) 3 Months 6 Months YTD 1 Year 2 Years Since Inception 0.00 7.50 10.00 12.50 15.00 17.50 20.00 22.50 25.00 4.14 6.39 6.39 21.57 11.88 14.12 4.37 4.99 4.99 17.44 11.41 13.60 ESG 6-10 Years Benchmark (5) Return Growth of $100,000 6/2019 12/2019 6/2020 12/2020 6/2021 100,000 107,500 115,000 122,500 130,000 137,500 145,000 ESG 6-10 Years 138,965 Benchmark (5) 137,396 Strategies June 30, 2021 A Strategic, Tactical & Opportunistic ETF Strategist
Transcript of ESG 6-10 Years Strategy
ESG 6-10 Years Strategy
Description
Efficient Market Advisor's ESG 6-10 Years Strategy provides a solution for investors who are within six to ten years from needing to begin spending their investment. The Strategy's main objective is to achieve a balanced return by investing in a combination of asset classes. The Strategy consists of multiple exchange-traded funds (ETFs) that incorporate Environmental, Social and Governance (ESG) factors. The ESG 6-10 Years Strategy is designed for investors willing to accept a moderate level of volatility in their portfolio.
Operations (1)Inception Date
Manager Name
Manager Tenure
Firm Phone Number
Firm Web Address
Firm Total Assets
GIPS Verified
1/2/2019
Multiple
2.50
888-327-4600
www.efficient-portfolios.com
1,251,900,000.00
Yes
Holdings (2)
% ofStrategy
Xtrackers S&P 500 ESG ETF
iShares ESG U.S. Aggregate Bond ETF
iShares ESG 1-5 Year USD Corp Bd ETF
Nuveen ESG High Yield Corporate Bd ETF
Xtrackers MSCI EAFE ESG Leaders Eq ETF
Xtrackers MSCI EMs ESG Leaders Eq ETF
Xtrackers S&P MidCap 400 ESG ETF
Xtrackers S&P SmallCap 600 ESG ETF
32.70
26.30
12.40
8.30
7.70
6.20
4.10
1.30
Blended Expense Ratio (3) 0.13
Policy Ranges (2)
Portfolio Statistics (6)
Std Dev
Beta
10.20
0.54
Positive Months
Negative Months
Max Drawdown
Months To Recovery
22.00
7.00
-12.29
4.00
(1) Firm Total Assets consists of $804.9M discretionary and $446.9M non discretionary assets undermanagement.(2) Data is presented as supplemental information.(3) Blended Expense Ratio is a weighted average calculated by multiplying each fund's expense ratio by thepercentage of assets invested in the fund then summing the results.(4) Returns are presented net of actual management fees, custodial fees, withholding taxes and all tradingexpenses.(5) Benchmark consists of 46% MSCI All Country World Index, 46% Barclays US Aggregate Bond Index, 6%HFRX Global Hedge Fund Index and 2% Barclays US 1-3 Month Treasury Bill Index.(6) Portfolio Statistics are since inception and calculated vs. the S&P 500 Index.
3 Months 6 Months YTD 1 Year 2 YearsSince
Inception
ESG 6-10 Years
Benchmark (5)
4.14 6.39 6.39 21.57 11.88 14.12
4.37 4.99 4.99 17.44 11.41 13.60
Trailing Returns (4)
3 Months 6 Months YTD 1 Year 2 Years Since Inception
0.002.505.007.5010.0012.5015.0017.5020.0022.5025.00
4.146.39 6.39
21.57
11.8814.12
4.37 4.99 4.99
17.44
11.4113.60
ESG 6-10 Years Benchmark (5)
Ret
urn
Growth of $100,000
6/2019 12/2019 6/2020 12/2020 6/2021100,000
107,500
115,000
122,500
130,000
137,500
145,000
ESG 6-10 Years 138,965 Benchmark (5) 137,396
Strategies
June 30, 2021 A Strategic, Tactical & Opportunistic ETF Strategist
ESG 6-10 Years Strategy
A Strategic, Tactical & Opportunistic ETF StrategistJune 30, 2021
Efficient Market Advisors a business of Cantor Fitzgerald Investment Advisors, L.P. (EMA) claims compliance with the Global Investment Performance Standards (GIPS) and has prepared and presented this report in compliance with the GIPS standards. EMA has been independently verified for the periods November 1, 2004 through September 30, 2020. Verification assesses whether (1) EMA has complied with all the composite construction requirements of the GIPS standards on a firm-wide basis, and (2) EMA’s policies and procedures are designed to calculate and present performance in compliance with the GIPS standards. Verification does not ensure the accuracy of any specific composite presentation.
Cantor Fitzgerald Investment Advisors, L.P. acquired Efficient Market Advisors, LLC on February 28, 2017 to form Efficient Market Advisors a business of Cantor Fitzgerald Investment Advisors, L.P. (EMA). Prior to being acquired, Efficient Market Advisors, LLC was an independent, SEC-registered investment advisor. Cantor Fitzgerald Investment Advisors, L.P. is an SEC-registered investment advisor.
EMA constructs investment portfolios using Exchange-Traded Funds (ETFs). Founded in 2004 for the sole purpose of managing ETF based separate accounts, EMA serves high net-worth investors, trusts, foundations, retirement plans and institutions. EMA has one of the longest pure-ETF investment track records in the investment management industry. EMA utilizes proprietary and third-party research to construct ETF portfolios that offer investors highly-diversified asset class exposure that is transparent, liquid, low-cost and tax-efficient. EMA’s mission is to deliver superior investment returns over full market cycles through the implementation of propriety asset allocation processes.
Asset allocation and diversification strategies do not protect against market risk or loss of principal. Neither do these strategies assure a profit nor do they protect against losses in declining markets. Investments in managed portfolios have additional management fees and expose the investor to the risks inherent within the portfolio and the specific risks of the underlying funds directly proportionate to their fund allocation. Investing involves risk, including the loss of principal. Investment returns, particularly over shorter time periods, are highly dependent on trends in the various investment markets. Investors should consider the investment objectives, risks, charges and expenses of the underlying funds that make up the managed portfolios carefully before investing. Information regarding the underlying funds held in client accounts is outlined in the investment's prospectus which should be read carefully to fully understand the total amount of fees being paid and other risks. EMA does not receive any of thefees charged by the underlying funds. Further information on the fees received by EMA is outlined in our Form ADV Part 2A Disclosure Brochure which can be found at https://www.adviserinfo.sec.gov.
The composite figures illustrated represent the returns only for the time periods indicated. These returns reflect the actual investment results of a composite of clients participating in the strategy. Accounts are first added to the composite in the third complete month of management by EMA. All investments, including investments in the underlying funds in the managed portfolios, involve the risk of potential investment losses as well as investment gains. The performance of the managed portfolios should be viewed in the context of the broad market and general economic conditions prevailing during the periods covered by the performance information. Due to investment timing, allocation and holding periods for cash and other managed portfolio assets, performance may not completely replicate the performance of the strategy’s stated benchmark. There is no assurance that any investment or strategy will achieve its investment objective, and the information provided is not intended to be a complete analysis of every material fact respecting any strategy.
Returns for periods longer than one year are annualized. All returns are expressed in U.S. dollars and are net of re-investment of dividends and interest. The returns shown represent composite results net of fees and expenses. The returns shown on this document represent composite returns of managed portfolios in this strategy. An investor’s actual results may have varied.
The composite benchmark is a blend of 46% MSCI All Country World Index, 46% Barclays US Aggregate Bond Index, 6% HFRX Global Hedge Fund Index and 2% Barclays US 1-3 Month Treasury Bill Index. The blended benchmark is calculated daily and rebalanced monthly.
MSCI All Country World Index (ACWI): A free float-adjusted market capitalization-weighted index that is designed to measure the equity market performance of developed and emerging markets. The MSCI ACWI consists of 46 country indices comprising 23 developed and 23 emerging market country indices.
Barclays US Aggregate Bond Index: A broad-based, market capitalization-weighted benchmark that measures the investment grade, US dollar denominated, fixed rate taxable bond market, which includes Treasuries, government related and Corporate securities.
HFRX Global Hedge Fund Index: The HFRX Global Hedge Fund Index is designed to be representative of the overall composition of the hedge fund universe. It is comprised of all eligible hedge fund strategies; including but not limited to convertible arbitrage, distressed securities, equity hedge, equity market neutral, event driven, macro, mergerarbitrage, and relative value arbitrage. The strategies are asset weighted based on the distribution of assets in the hedge fund industry.
Barclays US 1-3 Month Treasury Bill Index: Includes all publicly issued zero-coupon US Treasury Bills that have a remaining maturity of less than 3 months and more than 1 month, are rated investment grade, and have $250 million or more of outstanding face value. The securities must be denominated in US dollars and must be fixed rate and non-convertible.
Indices: Indices are unmanaged, do not incur management fees, costs and expenses and cannot be invested in directly.
Standard Deviation: A measurement of dispersion about an average, depicting how widely a stock or portfolio’s returns varied over a certain period of time. When an investment or portfolio has a high standard deviation, the predicted range of performance is wide, and implies greater volatility.
Alpha: The return on an asset in excess of the asset’s required rate of return.
Beta: The measure of an asset or portfolio’s sensitivity to the market as a whole. A beta above 1 is more volatile than the market while a beta below 1 is less volatile.
Sharpe Ratio: The average return in excess of the risk free rate divided by the standard deviation of return. It is a measure of the average excess return earned per unit of standard deviation of return.
Max Drawdown: The decline from either the initial investment or the highest appreciated value to the lowest investment value. For example, a portfolio with $100,000 in assets that declines in value to $75,000 would have a 25% drawdown.
Months to Recover: The number of months that it takes an investment to return from its lowest amount to the highest appreciated value of the invested assets.
Past performance is not indicative of future results, and there can be no assurance, and clients should not assume, that future performance of any EMA managed portfolios will be comparable to their past performance. Investment returns and principal value will fluctuate, so that investors' shares, when sold, may be worth more or less than their original cost. Current performance may be lower or higher than the performance data cited.
Actual client results are impacted by start and end dates, withdrawals, additional deposits, and any charges imposed by the investment custodian, which may materially affect client performance returns. Investing may involve risk including loss of principal.
A portion of the data and information contained in this fact sheet have been obtained from various sources believed to be reliable. However, EMA does not guarantee the accuracy of such data and information.
This fact sheet is being provided for informational purposes only. It should not be considered investment advice and investors should not make investment decisions based solely on the information in this fact sheet. The performance numbers reported are not a solicitation to buy or sell securities, and there is no claim to the suitability of the investment strategy for any individual. Securities prices may vary dramatically over time and results will vary due to changing economic or market conditions.
For current month-end performance figures or to request a copy of our Form ADV Part 2A Disclosure Brochure, please contact Efficient Market Advisors at (888) 327-4600.
NOT FDIC INSURED - NO BANK GUARANTEE - MAY LOSE VALUE
Disclosures