ESD risk assessment of South - Department of Primary ... · INCORPORATING THE NATIONAL ECOLOGICALLY...
101
ESD risk assessment of South Australia’s Spencer Gulf Prawn Fishery INCORPORATING THE NATIONAL ECOLOGICALLY SUSTAINABLE DEVELOPMENT (ESD) REPORTING FRAMEWORK AND THE ECOLOGICAL RISK ASSESSMENT FOR EFFECTS OF FISHING (ERAEF) ON SPECIES COMPONENTS. JULY 2014
-
Upload
truonghanh -
Category
Documents
-
view
215 -
download
0
Transcript of ESD risk assessment of South - Department of Primary ... · INCORPORATING THE NATIONAL ECOLOGICALLY...
ESD risk assessment of South
Australia’s Spencer Gulf Prawn Fishery
INCORPORATING THE NATIONAL ECOLOGICALLY SUSTAINABLE
DEVELOPMENT (ESD) REPORTING FRAMEWORK AND THE
ECOLOGICAL RISK ASSESSMENT FOR EFFECTS OF FISHING
(ERAEF) ON SPECIES COMPONENTS.
JULY 2014

DATE TO INSERT 2012 TITLE OF THE DOCUMENT
ESD risk assessment of South Australia’s Spencer Gulf Prawn Fishery Information current as of July 2014.
© Government of South Australia 2014
Disclaimer
PIRSA and its employees do not warrant or make any representation regarding the use, or results of the
use, of the information contained herein as regards to its correctness, accuracy, reliability and currency or
otherwise. PIRSA and its employees expressly disclaim all liability or responsibility to any person using the
information or advice.
All enquiries
To be inserted
Primary Industries and Regions SA (PIRSA)
Level 15, 25 Grenfell Street
GPO Box 1671, Adelaide SA 5001
T 08 8226 2900 F 08 8226 0476
W www.pir.sa.gov.au/fisheries

2
Table of Contents 1 Executive summary ........................................................................................................................ 6 2 Introduction ................................................................................................................................... 8
2.1 Fisheries management plans and ESD reporting ................................................................... 8 2.2 ESD risk assessment and reporting process .......................................................................... 9 2.3 Ecological risk assessment for effects of fishing (ERAEF) ...................................................... 9
3 Background................................................................................................................................... 10 3.1 Fishery description .............................................................................................................. 10
3.1.1 Area of the fishery ........................................................................................................... 11 3.1.2 Fishing method and operation ........................................................................................ 12 3.1.3 Retained species.............................................................................................................. 14 3.1.4 Non-retained species ...................................................................................................... 14 3.1.5 TEPs ................................................................................................................................. 15
3.2 Management ....................................................................................................................... 15 3.2.1 Management history ....................................................................................................... 15 3.2.2 Legislation ....................................................................................................................... 16 3.2.3 Current management ...................................................................................................... 17 3.2.4 Catch and effort reporting .............................................................................................. 17
3.3 Biology ................................................................................................................................. 18 3.3.1 Distribution and stock structure ..................................................................................... 18 3.3.2 Reproductive biology ...................................................................................................... 18 3.3.3 Current status of the fishery ........................................................................................... 19
3.4 Major environments ............................................................................................................ 19 3.4.1 Physical environment ...................................................................................................... 19 3.4.2 Socio-economic environment ......................................................................................... 20
3.5 Research .............................................................................................................................. 20 3.5.1 Recent/current research ................................................................................................. 20 3.5.2 Future research ............................................................................................................... 21
4 Methodology ................................................................................................................................ 22 4.1 ESD reporting framework .................................................................................................... 22
4.1.1 Scope ............................................................................................................................... 22 4.1.2 Process ............................................................................................................................ 23 4.1.3 Issue identification (component trees) ........................................................................... 24 4.1.4 Risk assessment and prioritization of issues ................................................................... 24 4.1.5 Reporting requirements .................................................................................................. 26
4.2 ERAEF ................................................................................................................................... 26 4.2.1 The hierarchical approach ............................................................................................... 26 4.2.2 Conceptual model ........................................................................................................... 27 4.2.3 PSA (Level 2) for species components ............................................................................ 28 4.2.4 Stakeholder engagement process ................................................................................... 32
4.3 Subsequent ESD risk assessments and PSA on species components .................................. 32 5 Results .......................................................................................................................................... 35
5.1 ESD risk assessment outcomes ............................................................................................ 35 5.1.1 Retained species.............................................................................................................. 35 5.1.2 Non-retained species ...................................................................................................... 37 5.1.3 General ecosystem .......................................................................................................... 37 5.1.4 Community wellbeing ..................................................................................................... 40 5.1.5 Aboriginal community ..................................................................................................... 42 5.1.6 Governance ..................................................................................................................... 43 5.1.7 External factors affecting fishery performance .............................................................. 44

3
5.1.8 Summary of ESD Reporting Framework .......................................................................... 48 5.1.9 Performance reports for high risk components .............................................................. 48 5.1.10 Units excluded from analysis (Step 1) ......................................................................... 57 5.1.11 Units scored for productivity and susceptibility (Steps 2 and 3) ................................ 57 5.1.12 Units plotted onto a PSA plot (Step 4) ........................................................................ 68 5.1.13 Ranking of units by overall risk (Step 5) ...................................................................... 69 5.1.14 Evaluation of the PSA(Step 6) ..................................................................................... 70 5.1.15 Decision rules to move beyond Level 2 (Step 7) ......................................................... 72 5.1.16 High-risk categorization (Step 8) ................................................................................. 73 5.1.17 Stakeholder panel assessment of PSA outcomes ....................................................... 73 5.1.18 Discussion of High Risk Species and Species of Interest (Step 8) ............................... 78
6 References .................................................................................................................................... 82 7 Glossary ........................................................................................................................................ 85 8 Appendices ................................................................................................................................... 86
8.1 Participants of ESD stakeholder workshop ......................................................................... 86 8.2 Consequence tables for ESD component trees ................................................................... 86 8.3 Productivity and susceptibility attribute values, scores and overall risk for all species ..... 89
List of Figures Fig. 1. Map showing the area of the SGPF and commercial fishing blocks. .......................................... 12 Fig. 2. Double rig trawl gear and location of hopper sorting and prawn grading systems used in the
Spencer Gulf Prawn Fishery (figure courtesy of SARDI Aquatic Sciences). .................................. 13 Fig. 3. Trawl net configuration showing otter boards, head rope, ground chain and cod end with crab
bag (figure courtesy of SARDI Aquatic Sciences). ........................................................................ 14 Fig. 4. Summary of the ESD reporting framework process (source: Fletcher et al. 2002). ................... 23 Fig. 5. Structure of component trees used in the ESD reporting framework (found in an information
package used in conjunction with Fletcher et al. 2002, which can be found on the website http://www.fisheries-esd.com). .................................................................................................. 24
Fig. 6. Overview of the ERAEF framework showing focus of analysis for each level in the hierarchy (at the left, in italic). At each level a risk management response is an alternative to proceeding to the next level in the hierarchy (reproduced from Hobday et al. 2007 with permission from the authors). ....................................................................................................................................... 27
Fig. 7. Generic conceptual model used in the ERAEF (reproduced from Hobday et al. 2007 with permission from the authors)). .................................................................................................... 28
Fig. 8. The axes on which risk to the ecological units (i.e. species) is plotted. The x-axis includes attributes that influence the productivity of a species, or its ability to recover after impact from fishing. The y-axis includes attributes that influence the susceptibility of the species to impacts from fishing. Combining susceptibility and productivity determines the relative risk to a unit, i.e. units with high susceptibility and low productivity are at highest risk, while units with low susceptibility and high productivity are at lowest risk. The dashed contour lines divide regions of high, medium, and low risk. ......................................................................................................... 31
Fig. 9. Retained species component tree for the Spencer Gulf Prawn Fishery. See Table 8 for explanation of colour-coded risk categories. ............................................................................... 35
Fig. 10. Non-retained species component tree for the Spencer Gulf Prawn Fishery. The numbers in parentheses indicate the number of species recorded from the 2007 by-catch survey undertaken in Spencer Gulf. See Table 8 for explanation of colour-coded risk categories. ........................... 37
Fig. 11. General ecosystem component tree for the Spencer Gulf Prawn Fishery. See Table 8 for explanation of colour-coded risk categories. ............................................................................... 37

4
Fig. 12. Community wellbeing component tree for the Spencer Gulf Prawn Fishery. See Table 8 for explanation of colour-coded risk categories. ............................................................................... 40
Fig. 13. Governance component tree for the Spencer Gulf Prawn Fishery. See Table 8 for explanation of colour-coded risk categories. ................................................................................................... 43
Fig. 14. External impacts component tree for the Spencer Gulf Prawn Fishery. See Table 8 for explanation of colour-coded risk categories. Desalination plant is coloured grey to represent two risk scores: State Government’s position and industry’s position. .............................................. 44
Fig. 15. PSA plots for the a) target, b) by-product, c) discard, and d) TEP species components of the Spencer Gulf Prawn Fishery. The black dots represent the productivity (P) and susceptibility (S) scores of the species (where increase in dot size indicates the number of species at each P-S score combination, i.e. 1, 2-3, 4-6, or ≥7 species), and the red cross indicates the average for the species component. ..................................................................................................................... 68
Fig. 16. Frequency distribution of overall risk values generated for the 195 species examined. ........ 71
List of Tables Table 1. Description summary of the commercial Spencer Gulf Prawn Fishery..................................... 6 Table 2. Chronology of the main fishery development and management milestones for the Spencer
Gulf Prawn Fishery (modified from Dixon & Sloan 2007). ........................................................... 15 Table 3. Summary of management arrangements in the Spencer Gulf Prawn Fishery........................ 17 Table 4. Components of the national ESD reporting framework for Australian fisheries. ................... 23 Table 5. The general consequence table for use in ecological risk assessments related to fishing
(Fletcher et al. 2002). ................................................................................................................... 25 Table 6. Likelihood definitions (source: Fletcher et al. 2002). .............................................................. 25 Table 7. Risk matrix of consequence and likelihood. The numbers in the cells indicate the risk value,
and the colours indicate risk categories (see Table 8 for more details) (source: Fletcher et al. 2002). ........................................................................................................................................... 25
Table 8. Relationship between risk value, risk category, management response and reporting requirements (source: Fletcher et al. 2002). ............................................................................... 26
Table 9. The attributes used to measure productivity and susceptibility for each species. ................ 30 Table 10. Key meetings of the stakeholder engagement process for the PSA of the Spencer Gulf Prawn
Fishery. ......................................................................................................................................... 32 Table 11. Cut-off criteria and scores for productivity and susceptibility attributes for the species
components. Note: Availability 2 is only used when there is no information for Availability 1; The most conservative score between Encounterability 1 and 2 is used. .......................................... 34
Table 12: Summary of National ESD Reporting Framework outcomes ................................................ 48 Table 13: Performance report for identified risks ranked as medium or higher identified in the ESD
reporting framework. Risk ratings are medium = yellow, high = red, extreme = purple ............. 49 Table 14. Species components examined in this report. ...................................................................... 57 Table 15. Summary of productivity and susceptibility scores of all and species of interest recorded in
the 2007 prawn trawl by-catch survey of the Spencer Gulf, listed in order of role of fishery (species components: target (TA), by-product (BP), discard (DI) and TEP species), taxa name (ascending), productivity-susceptibility risk category (high to low), and ERAEF species ID (ascending) See section 5.1.16 for definitions of high-risk categories. ....................................... 59
Table 16. Summary of information available on productivity and susceptibility attributes for all species examined. ..................................................................................................................................... 70
Table 17. Overall uncertainty distribution – frequency of missing information for the combined productivity and susceptibility attributes. ................................................................................... 70
Table 18. Correlation matrix for productivity attributes, where the correlation (r) is based on scores within each attribute pair. ........................................................................................................... 71

5
Table 19. Correlation matrix for susceptibility attributes, where the correlation (r) is based on scores within each attribute pair. ........................................................................................................... 71
Table 20. Summary of risk categories for each taxonomic group and species component. ................ 72 Table 21. Summary of average productivity, susceptibility and overall risk values for each of the species
components.................................................................................................................................. 72 Table 22. Categorisation of species determined as high risk from the PSA and stakeholder panel
discussion. .................................................................................................................................... 73 Table 23: PSA High risk species that require no further assessment as agreed to by the stakeholder
panel ............................................................................................................................................. 75 Table 24: PSA Low or medium species that were considered for further assessment by the stakeholder
panel ............................................................................................................................................. 75 Table 25: Final species list for consideration of management arrangements following stakeholder
panel’s meeting ............................................................................................................................ 78 Table 26. Participants of the ESD stakeholder workshop held in Adelaide 7 November 2011. ........... 86 Table 27. Consequence levels for the major retained/non-retained species (source: Fletcher et al.
2002). ........................................................................................................................................... 86 Table 28. Consequence levels for the by-product species/minor non-retained species (source: Fletcher
et al. 2002). .................................................................................................................................. 86 Table 29. Consequence levels for the impact of a fishery on protected species (source: Fletcher et al.
2002). ........................................................................................................................................... 86 Table 30. Consequence levels for the impacts of a fishery on habitats (source: Fletcher et al. 2002).87 Table 31. Consequence levels for the impact of a fishery on the general ecosystem/trophic levels
(source: Fletcher et al. 2002). ...................................................................................................... 87 Table 32. Consequence levels for impacts of management of a fishery at a political level (source:
Fletcher et al. 2002). .................................................................................................................... 87 Table 33. Participants of the stakeholder panel workshop held in Adelaide 1 February 2013. ........... 88 Table 34. Participants of the stakeholder panel workshop held in Adelaide 19 February 2013. ......... 88
Acknowledgments
The following people are thanked for their involvement in the ESD risk assessment process for the SGPF, which allowed for the development of this report:
Dr Alistair Hobday for kindly donating his time and expertise in explaining the conceptualization and methodology of the ERAEF, and providing species information from the CSIRO database and the Excel worksheets for carrying out the Level 2 PSA
Ms Crystal Beckmann for conducting exhaustive literature searches and documenting attribute values for all species components of the PSA
Research Subcommittee members of the Spencer Gulf and West Coast Prawn Fishermen’s Association and other invited stakeholders for their participation in ESD risk assessment workshops and meetings
Dr Simon Bryars for facilitating the ESD stakeholder workshop
Mr James Bennett for recording minutes of the ESD stakeholder workshop
The ESD risk assessment followed closely the National ESD reporting framework developed by Rick Fletcher et al. (2002) for the non-species components. His assistance in adapting this framework to the Spencer Gulf was appreciated.
The PSA analysis of the species components of the risk assessment followed the methodology of Alistair Hobday et al. (2007). His expertise and support were greatly appreciated in conducting this component of the assessment
Dr Michael Steer for kindly providing expert knowledge on fish biology on the stakeholder panel assessing the PSA.

6
1 Executive summary
Commercial fishing for King Prawns (Penaeus (Melicertus) latisulcatus) in South Australia started in the 1960’s. The Spencer Gulf Prawn Fishery (SGPF) is the largest of the three State prawn fisheries in terms of area of the fishery, production, and number of licence holders. The SGPF had a GVP of around $30.3M in 2010/11 with a total catch of 1,979 tonnes of prawns and is one of the more valuable fisheries in Australia.
The commercial SGPF operates within the waters of Spencer Gulf north of Cape Catastrophe, Eyre Peninsula and Cape Spencer, Yorke Peninsula. The fishery in Spencer Gulf is generally closed in January and February, and from July to October each year. Fishing periods in other months are from the last quarter to first quarter of the moon phase.
Trawling is undertaken at night (between sunset and sunrise) using demersal otter trawl gear. Many vessels in the prawn fleet can also process the catch on-board. Considerable technological advancements have been made in the fishery including the use of “crab bags” to partition mega-fauna by-catch inside the codend, “hoppers” for efficient sorting of the catch and rapid return of by-catch, and “graders” to sort the prawns into marketable size categories.
No species other than King Prawn, bugs and Southern Calamari that are captured in prawn trawl nets are permitted to be retained.
Table 1. Description summary of the commercial Spencer Gulf Prawn Fishery.
Characteristic Description
Target species King Prawn (Penaeus (Melicertus) latisulcatus) By-product species Balmain Bugs (Ibacus spp.), Southern Calamari (Sepioteuthis australis) Fishing method Demersal otter trawl, predominantly double rig (single rig may also be used) Area Waters of Spencer Gulf north of the geodesic from 34°59.12’S, 136°0.18’E (Cape
Catastrophe, Eyre Peninsula) to 35°17.99’S, 136°52.84’E (Cape Spencer, Yorke Peninsula)
Depth range 10-60 m Fishing periods From last quarter to first quarter of moonphase during Nov, Dec, Mar-Jun, at night
time only Primary landing port Port Lincoln Catch and effort data Daily and monthly logbook submitted monthly Observer program Fishery-independent observers for stock assessment purposes, no regular program for
monitoring catch composition Management methods Input controls: limited entry, gear restrictions, spatial and temporal closures,
maximum headline length 29.26 m, minimum mesh size 4.5 cm, maximum vessel length 22 m, maximum vessel power 336 kW (= 450 hp)
Legislation Fisheries Management Act 2007, Fisheries Management (General) Regulations 2007, Fisheries Management (Prawn Fisheries) Regulations 2006
Management plan Management plan for the Spencer Gulf Prawn Fishery (Dixon and Sloan 2007) Harvest strategy Yes, currently under review Consultative forums Spencer Gulf and West Coast Prawn Fishermen’s Associations Inc. (SGWCPFA) Main markets Predominantly domestic, some export to Vietnam, United Arab Emirates and Hong
Kong Assessments under the EPBC Act Protected species accreditation (Part 13) – Exempt status 26 October 2009, expires 3
November 2014; Export declaration (Part 13A) – yes Certification standard for sustainability Marine Stewardship Council, certification 25 July 2011, expires 24 July 2016
Fishery statistics 2009/10 2010/11
Number of licences/vessels 39 (transferable)/39 39 (transferable)/39 Annual catch 2,361 t 1,979 t Annual effort 17,012 h 16,738 h Gross value of production $27.4M $30.3M Total management costs $0.92M $0.93M

7
The Fisheries Management Act 2007 (the ‘Act’) requires management plans to include risk assessments of the impacts or potential impacts of the fishery on relevant ecosystems, and ecological factors that could have an impact on the performance of the fishery. These risk assessments are used to identify and inform development of ecological, economic and social objectives of the fishery management plan that are consistent with ecologically sustainable development (ESD) principles.
To efficiently meet its ESD accountabilities under both State and Commonwealth legislation, PIRSA Fisheries and Aquaculture has adopted the ‘National ESD Reporting Framework for Fisheries’ developed by Fletcher et al. (2002). The initial steps of this analysis included identifying the issues relevant to the fishery and then prioritising these issues (Fletcher et al. 2005). The primary method chosen to complete these two elements was to conduct a qualitative risk assessment for each of the main biological and socio-economic components that make up the fishery. Risk analysis involves consideration of the sources of risk (being a chance of something going wrong, or a hazard), their consequences and the likelihood that those consequences may occur.
For the non-species components of the fishery, there were 31 areas identified as medium risk or higher, the majority related to ‘Community Wellbeing’ and ‘External Factors affecting Fishery Performance’ components of the fishery. Four risks were identified as being ‘extreme’ risk, six ‘high’ risk and 21 ‘medium risk’ activities were identified. A full ESD performance report in the context of specific management objectives including current operational objectives, indicators, and preferred strategies for each of the identified medium risks are provided.
The ESD reporting framework found that, of the species components, the target species, King Prawns were found to be of medium risk, by-product species, Bugs and Southern Calamari were found to be of low risk, and the non-retained species as a group were of high risk. The species component of the fishery, regardless of their ranking in the ESD reporting framework, were assessed further in the ecological risk assessment of the effects of fishing (ERAEF) process.
Semi-quantitative assessments of the species components of the fishery were conducted on species in the fishery identified through by-catch surveys. The methods used in this assessment followed the Productivity Susceptibility Analysis (PSA) methodology described in the ERAEF framework developed by Hobday et al. (2011).
It is important to note that the PSA essentially measures potential for risk when described in the context of the ERAEF methodology. While the relative fishery interactions are measured through the susceptibility attributes, assessment of the actual impact of the fishery on a species is not made. The process identifies species that may require further consideration with regard to mitigation options or additional information requirements to further investigate risk.
Initial outcomes of the level 2 PSA scoring of target, by-catch and by-product, and TEP species identified 21 species as high risk. A stakeholder panel at workshops in February 2013 considered the attribute scores used in the PSA for each of 195 species identified through the by-catch surveys. The stakeholder panel discussed additional information or varying views of the data that was incorporated in the attribute scores for several species. Where there was information considered in addition to that included in the PSA, or there were strong divergent views on information used in the PSA, the stakeholder panel agreed some lower risk species would also be included in the assessment of management arrangements that may mitigate any potential risk. Inclusion of these lower risk species in the assessment was considered appropriate for the purposes of developing a new management plan for the fishery that considers all potential risks.
For 12 species the stakeholder panel agreed that their actual distribution was wide and the potential for risk to these species was low. In these cases the no further assessment with respect to management arrangements was considered necessary.

8
For a further 17 species, differences or uncertainty in information was identified by the stakeholder panel. In these cases, to ensure that any potential risk was identified, a more precautionary approach was adopted for the purposes of considering management arrangements to mitigate risk and these species were included with the high risk species for further assessment.
Following the stakeholder panels consideration, for the retained and non-retained species components of the fishery, 22 species were agreed to be assessed further for the purposes of considering management arrangements to mitigate risks. These 22 specues comprised three invertebrates, three chondrichthys and 16 teleosts. In addition, Blue swimmer crabs were considered a species of interest due to their high abundance in the by-catch and being an important commercial and recreational fishery in their own right.
The management arrangements for these 23 species were assessed by the stakeholder panel to ascertain if current management arrangements were adequate or further arrangements/strategies were required. For twenty species, the stakeholder panel who considered the ERAEF outcomes agreed that the fishery under the current management arrangements do not pose significant risk to their sustainability.
The stakeholder panel identified three species for which further information was required to ensure the fishery did not pose risk to their sustainability. These species were Tiger Pipefish (a Protected Species under the Fisheries Management (General) Regulations 2007), Coastal Stingaree and Giant Cuttlefish (northern Spencer Gulf population). Mitigation strategies suggested for these species included ongoing monitoring of interactions between the fishery and these species, collation of further information to fill information gaps where possible and future assessment of risk through future ERAEF assessments.
An independent expert review of the draft ESD risk assessment report has been conducted. The review described the report as thorough with all steps in the process followed diligently. The reviewer commented that the assessment was an excellent example of adaption of internationally regarded ESD risk assessment frameworks to a prawn trawl fishery. The reviewer’s specific comments have been incorporated in this report where appropriate. The reviewer also suggested further options for addressing the potential risk to high risk species including augmenting by-catch data and further investigating by-catch reduction devices through extending the work previously conducted in the fishery with T-90 nets and grids (see section 3.5.1.3).
2 Introduction
2.1 Fisheries management plans and ESD reporting
The Fisheries Management Act 2007 (the ‘Act’) has been in place since 1 December 2007. Since then, the Fisheries Council of South Australia has been established as the peak advisory body to the Minister for Agriculture, Food and Fisheries. A primary function of the Fisheries Council is to prepare fisheries management plans under the Act and to advise the Minister on key aspects of fisheries and aquatic resource management. Management plans are a significant instrument, guiding decisions on annual catch or effort levels, the allocation of access rights, and establishing the tenure of valuable commercial licences.
The Act also describes the nature and content of fisheries management plans. Among other requirements, management plans must describe the biological, economic and social characteristics of a fishery. Management plans must also include risk assessments of the impacts or potential impacts of the fishery on relevant ecosystems, and ecological factors that could have an impact on the performance of the fishery. Importantly, these risk assessments are used to identify and inform

9
development of ecological, economic and social objectives of the fishery management plan that are consistent with ecologically sustainable development (ESD) principles.
The Minister has requested the Fisheries Council to prepare a management plan for Spencer Gulf Prawn Fishery (SGPF) by 30 June 2013.
2.2 ESD risk assessment and reporting process
To efficiently meet its ESD accountabilities under both State and Commonwealth legislation, PIRSA Fisheries and Aquaculture has adopted the ‘National ESD Reporting Framework for Fisheries’ developed by Fletcher et al. (2002). The purpose of this reporting framework was to provide a consistent way to implement and assess fisheries with respect to the principles of ESD in Australia.
There are a number of elements to the ESD reporting process including the initial steps of identifying the issues relevant to the fishery and then prioritising these issues (Fletcher et al. 2005). The primary method chosen to complete these two elements was to conduct a qualitative risk assessment for each of the main biological and socio-economic components that make up a fishery. This approach, developed in Australia, has been extensively used to analyse and report on the ESD performance of commercial fisheries, and has the potential to drive substantial performance improvements.
When applied appropriately the national framework will:
• Substantially improve knowledge about the environmental, economic, and social issues relevant to the ESD performance of a fishery
• Enable consistent and comprehensive analysis and reporting of the current and strategic operating environment for fisheries (this may also inform industry strategic and business planning initiatives)
• Engage industry, key fishery stakeholders, managers and scientists in a proven, transparent, and clearly defined collaborative process to understand and improve fisheries management performance
• Improve the efficiency and quality of performance reporting against a range of public and private sector accountabilities (such as the EPBC Act strategic assessment process, or industry business planning initiatives).
The ESD reporting process outlined above provides a logical framework for managers and stakeholders to identify, prioritise, and efficiently manage risks to achieve agreed ESD objectives. Where there are substantial knowledge gaps, the process informs cost-effective and efficient research strategies targeted to high risk areas.
2.3 Ecological risk assessment for effects of fishing (ERAEF)
The ecosystem based approach to fisheries management (EBFM) has become the preferred approach to address the issue of fishery impacts on the marine environment, ie. beyond the direct impacts on target species that are monitored through regular fisheries management processes. A key challenge to effective implementation n of this approach has been the development of tools to identify potential impacts and risks. This is further hampered by a lack of data on the broader ecological impacts of fishing on the environment.
The ecological risk assessment of the effects of fishing (ERAEF) framework developed by Hobday et al. (2011), allows for assessment of various fisheries, relevant to the level of information available, in a hierarchical approach that moves from a comprehensive but qualitative analysis of risk, through a semi-quantitative (PSA) approach to a fully quantitative model-based approach. The approach effectively ‘screens’ activities or hazards at each level and removes those considered to be of low risk from further analysis. The ERAEF is also precautionary in that missing information is scored as being of highest risk in the absence of other evidence or logical argument to the contrary.

10
The approach is based on five generic components of fishing impacts on the ecological system:
Target species
By-product and by-catch species
Threatened, endangered and protected species (TEP)
Habitats
Ecological communities.
The ERAEF is recognized by the MSC as the risk-based framework upon which its assessments of fisheries are based. Given the SGPF’s recent certification by the Marine Stewardship Council (MSC), it is therefore appropriate that the ERAEF methodology is adopted for risk assessment of the species components encountered by the fishery.
3 Background
Several key documents were consulted for preparing the following background information on the SGPF (DEH 2004; Dixon & Sloan 2007; Currie et al. 2009; DEWHA 2009; EconSearch 2011a, 2012; Moody Marine 2011; Dixon et al. 2012), along with relevant legislation (Fisheries Management Act 2007, Fisheries Management (General) Regulations 2007, Fisheries Management (Prawn Fisheries) Regulations 2006). These documents should be referred to for additional information.
It should be noted that fish nomenclature used in this report is standardized in accordance with the Australian Fish Names Standard AS SSA 5300-2007 (Seafood Services Australia 2007). Where this was not possible, nomenclature followed the Codes for Australian Aquatic Biota (CAAB), which is maintained by CSIRO and can be accessed at the website http://www.marine.csiro.au/caab/.
3.1 Fishery description
Commercial fishing for King Prawns in South Australia started in the 1960’s. Today, three commercial prawn fisheries occur within South Australia: the Spencer Gulf Prawn Fishery (SGPF), the Gulf St Vincent Prawn Fishery and the West Coast Prawn Fishery, all of which exclusively target a single penaeid species, the King Prawn (Penaeus (Melicertus) latisulcatus).
This ecological risk assessment focuses on the Spencer Gulf Prawn Fishery (SGPF), which is the largest of the three prawn fisheries in terms of area of the fishery, production, and number of licence holders. Licensed prawn fishers are permitted to take several other species as by-product, which are not targeted, but caught incidentally during fishing operations. The Spencer Gulf fishery can retain “bugs” (also known as”slipper lobsters”) (Ibacus spp) and calamari (Sepioteuthis australis). Recreational catch of prawns is negligible as recreational fishers are restricted to depths greater than 10 m, and may only take prawns by hand or a handheld device.
Prawn fishing is undertaken at night (from sunset to sunrise) using demersal otter trawl gear. Many vessels in the prawn fleet can also process the catch on-board. Considerable technological advancements have been made in the fishery including the use of “crab bags” to partition mega-fauna by-catch in the codend, “hoppers” for efficient sorting of the catch and rapid return of by-catch, and “graders” to sort the prawns into marketable size categories. The fishery in Spencer Gulf is generally closed in January and February, and from July to October each year. Fishing periods in other months are around 18 nights from the last quarter to first quarter of the moon phase.
The SGPF had a GVP of around $27.5M in 2009/10 and was one of the more valuable fisheries in South Australia with a total catch of 2,361 tonnes of prawns.
11
The SGPF has been recognized by the Food and Agricultural Organization (FAO) of the United Nations as one of the best-managed fisheries in the world. In its report on ‘Global study of shrimp fisheries’, the FAO praised the SGPF as ‘a global model of fair, flexible and accountable management’ (Gillett 2008).
On 25 July 2011, following a rigorous environmental assessment, the SGPF built upon its reputation as a global leader by becoming the first prawn fishery in Australia to gain certification by the Marine Stewardship Council (MSC) (Moody Marine 2011). In doing so, it has established itself as a fishery that demonstrates best-practice ecological sustainable fisheries management and promotes the best environmental choice in seafood.
A summary of the commercial SGPF is presented in Table 1
3.1.1 Area of the fishery
The commercial SGPF operates within the waters of Spencer Gulf north of the geodesic from the location on mean high water springs closest to 34°59.12’S, 136°0.18’E (Cape Catastrophe, Eyre Peninsula) to the location on mean high water springs closest to 35°17.99’S, 136°52.84’E (Cape Spencer, Yorke Peninsula) (Fig. 1).
All licensed and unlicensed persons are prohibited from taking prawns in any waters of the ocean, bays and gulfs (including Spencer Gulf) of the State that are less than 10 m in depth.
Some aquatic reserves also have prohibitions and restrictions on fishing and which species can be taken. The locations and coordinates of the State’s aquatic reserves are provided in the Fisheries Management (Aquatic Reserves) Regulations 2007 or on the PIRSA website www.pir.sa.gov.au/fisheries/recreational_fishing/closures/aquatic_reserves_and_marine_parks.

12
Fig. 1. Map showing the area of the SGPF and commercial fishing blocks.
3.1.2 Fishing method and operation
Commercial fishing is undertaken using the demersal otter trawl technique. This essentially consists of towing a funnel-shaped net leading into a bag (most commonly referred to as a cod end) over the sea floor (Fig. 2 and Fig. 3). A separate large meshed bag, referred to as a crab bag, is held within the cod end and acts to retain blue crabs and megafauna such as sharks and rays, while prawns flow through to the cod end. The crab bag reduces crab mortality, incidental damage to prawns and allows the other species to be returned promptly to the sea when emptying the codend. Otter boards are used to keep the trawl nets open horizontally (ie “spread” the net) whilst being towed.

13
Fig. 2. Double rig trawl gear and location of hopper sorting and prawn grading systems used in the Spencer Gulf Prawn Fishery (figure courtesy of SARDI Aquatic Sciences).

14
Fig. 3. Trawl net configuration showing otter boards, head rope, ground chain and cod end with crab bag (figure courtesy of SARDI Aquatic Sciences).
Trawling is undertaken during the night between sunset and sunrise, and generally between the last quarter of the moon, through the phase of the new moon to the first quarter. Trawl shots within the SGPF are of ~1 hr duration, which is relatively short compared to other prawn fisheries.
Most vessels in Spencer Gulf are fitted with a ‘hopper’, into which the contents of the cod ends are emptied. The hopper is flooded with water to increase the survival of by-catch that is subsequently discarded. The contents of the hopper trickle onto a conveyer belt system where the retained catch is sorted from the by-catch. Discarded by-catch is returned directly to the water from the conveyer system. The prawn catch is then placed through a commercial grading machine that sorts the prawn catch into weight categories. The graded catch is then usually packed and frozen immediately, either cooked or green, into 5 kg or 10 kg cartons. On occasion, the catch may be placed directly into a brine solution.
At the end of each fishing trip, the catch is off-loaded at ports adjacent to the fishing grounds and transported to fish processing factories. Main landing ports for Spencer Gulf boats are Port Lincoln, Wallaroo, Port Adelaide, and Port Pirie.
3.1.3 Retained species
In addition to the target species, King Prawn, commercial licence holders are permitted to retain and sell two species groups harvested incidentally during prawn trawling: Balmain bugs (Ibacus spp.) and Southern Calamari (Sepioteuthis australis). These species are referred to as by-product. No other species may be retained by commercial licence holders.
3.1.4 Non-retained species
Prawn trawling is generally regarded as a relatively non-selective fishing method, and prawn fisheries are closely scrutinised in terms of achieving ESD objectives, largely due to their impact on benthic ecosystems. In response to recommendations by the Australian Government’s Department
15
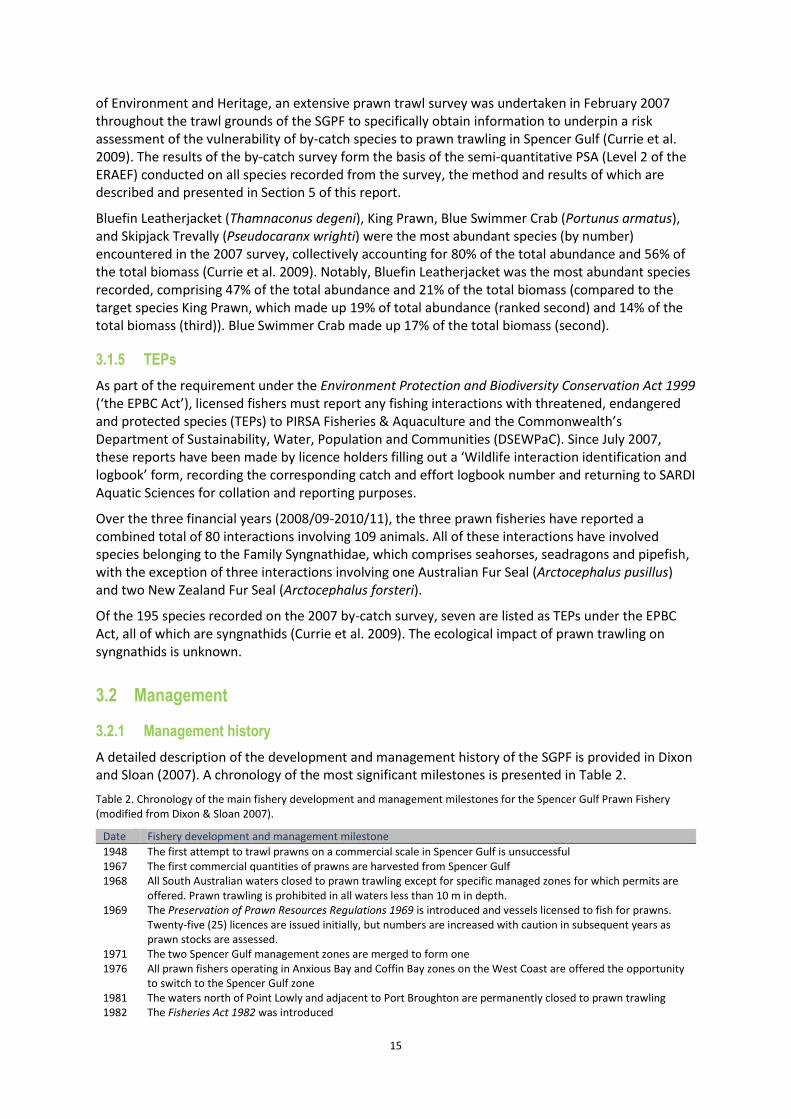
of Environment and Heritage, an extensive prawn trawl survey was undertaken in February 2007 throughout the trawl grounds of the SGPF to specifically obtain information to underpin a risk assessment of the vulnerability of by-catch species to prawn trawling in Spencer Gulf (Currie et al. 2009). The results of the by-catch survey form the basis of the semi-quantitative PSA (Level 2 of the ERAEF) conducted on all species recorded from the survey, the method and results of which are described and presented in Section 5 of this report.
Bluefin Leatherjacket (Thamnaconus degeni), King Prawn, Blue Swimmer Crab (Portunus armatus), and Skipjack Trevally (Pseudocaranx wrighti) were the most abundant species (by number) encountered in the 2007 survey, collectively accounting for 80% of the total abundance and 56% of the total biomass (Currie et al. 2009). Notably, Bluefin Leatherjacket was the most abundant species recorded, comprising 47% of the total abundance and 21% of the total biomass (compared to the target species King Prawn, which made up 19% of total abundance (ranked second) and 14% of the total biomass (third)). Blue Swimmer Crab made up 17% of the total biomass (second).
3.1.5 TEPs
As part of the requirement under the Environment Protection and Biodiversity Conservation Act 1999 (‘the EPBC Act’), licensed fishers must report any fishing interactions with threatened, endangered and protected species (TEPs) to PIRSA Fisheries & Aquaculture and the Commonwealth’s Department of Sustainability, Water, Population and Communities (DSEWPaC). Since July 2007, these reports have been made by licence holders filling out a ‘Wildlife interaction identification and logbook’ form, recording the corresponding catch and effort logbook number and returning to SARDI Aquatic Sciences for collation and reporting purposes.
Over the three financial years (2008/09-2010/11), the three prawn fisheries have reported a combined total of 80 interactions involving 109 animals. All of these interactions have involved species belonging to the Family Syngnathidae, which comprises seahorses, seadragons and pipefish, with the exception of three interactions involving one Australian Fur Seal (Arctocephalus pusillus) and two New Zealand Fur Seal (Arctocephalus forsteri).
Of the 195 species recorded on the 2007 by-catch survey, seven are listed as TEPs under the EPBC Act, all of which are syngnathids (Currie et al. 2009). The ecological impact of prawn trawling on syngnathids is unknown.
3.2 Management
3.2.1 Management history
A detailed description of the development and management history of the SGPF is provided in Dixon and Sloan (2007). A chronology of the most significant milestones is presented in Table 2.
Table 2. Chronology of the main fishery development and management milestones for the Spencer Gulf Prawn Fishery (modified from Dixon & Sloan 2007).
Date Fishery development and management milestone
1948 The first attempt to trawl prawns on a commercial scale in Spencer Gulf is unsuccessful 1967 The first commercial quantities of prawns are harvested from Spencer Gulf 1968 All South Australian waters closed to prawn trawling except for specific managed zones for which permits are
offered. Prawn trawling is prohibited in all waters less than 10 m in depth. 1969 The Preservation of Prawn Resources Regulations 1969 is introduced and vessels licensed to fish for prawns.
Twenty-five (25) licences are issued initially, but numbers are increased with caution in subsequent years as prawn stocks are assessed.
1971 The two Spencer Gulf management zones are merged to form one 1976 All prawn fishers operating in Anxious Bay and Coffin Bay zones on the West Coast are offered the opportunity
to switch to the Spencer Gulf zone 1981 The waters north of Point Lowly and adjacent to Port Broughton are permanently closed to prawn trawling 1982 The Fisheries Act 1982 was introduced

16
1995 The Fisheries (Management Committees) Regulations 1995 are introduced 1998 The first management plan for the SGPF was introduced (MacDonald 1998) 2007 The Fisheries Management Act 2007 and subordinate regulations are introduced. All Fisheries Management
committees (FMCs) are discontinued, and a consultative process is developed between PIRSA Fisheries and the Spencer Gulf and West Coast Prawn Fishermen’s Association (SGWCPFA) to provide the foundations for co-management of the SGPF.
2007 The second management plan for the SGPF was introduced (Dixon & Sloan 2007)
3.2.2 Legislation
The legislation that governs the management of the three South Australian prawn fisheries are the Fisheries Management Act 2007 and subordinate regulations Fisheries Management (General) Regulations 2007 and Fisheries Management (Prawn Fisheries) Regulations 2006.
The Act provides the broad statutory framework to provide for the conservation and management of South Australia’s aquatic resources. In the administration of the Act, the Minister for Agriculture, Food and Fisheries must pursue the following objectives, outlined in Section 7 (‘Objects of Act’) of the Act:
(1) An object of this Act is to protect, manage, use and develop the aquatic resources of the State in a manner that is consistent with ecologically sustainable development and, to that end, the following principles apply:
(a) proper conservation and management measures are to be implemented to protect the aquatic resources of the State from over-exploitation and ensure that those resources are not endangered;
(b) access to the aquatic resources of the State is to be allocated between users of the resources in a manner that achieves optimum utilisation and equitable distribution of those resources to the benefit of the community;
(c) aquatic habitats are to be protected and conserved, and aquatic ecosystems and genetic diversity are to be maintained and enhanced;
(d) recreational fishing and commercial fishing activities are to be fostered for the benefit of the whole community;
(e) the participation of users of the aquatic resources of the State, and of the community more generally, in the management of fisheries is to be encouraged.
(2) The principle set out in subsection (1)(a) has priority over the other principles.
(3) A further object of this Act is that the aquatic resources of the State are to be managed in an efficient and cost effective manner and targets set for the recovery of management costs.
(4) The Minister, the Director, the Council, the ERD Court and other persons or bodies involved in the administration of this Act, and any other person or body required to consider the operation or application of this Act (whether acting under this Act or another Act), must –
(a) act consistently with, and seek to further the objects of, this Act; and (b) insofar as this Act applies to the Adelaide Dolphin Sanctuary, seek to further the
objects and objectives of the Adelaide Dolphin Sanctuary Act 2005; and (c) insofar as this Act applies to the River Murray, seek to further the objects of the River
Murray Act 2003 and the Objectives for a Healthy River Murray under that Act; and (d) insofar as this Act applies to areas within a marine park, seek to further the objects
of the Marine Parks Act 2007.
(5) For the purposes of subsection (1), ecologically sustainable development comprises the use, conservation, development and enhancement of the aquatic resources of the State in a way, and at a rate, that will enable people and communities to provide for their economic, social and physical well-being while –
17
(a) sustaining the potential of aquatic resources of the State to meet the reasonably foreseeable needs of future generations; and
(b) safeguarding the life-supporting capacity of the aquatic resources of the State; and (c) avoiding, remedying or mitigating adverse effects of activities on the aquatic
resources of the State,
(taking into account the principle that if there are threats of serious or irreversible damage to the aquatic resources of the State, lack of full scientific certainty should not be used as a reason for postponing measures to prevent such damage).
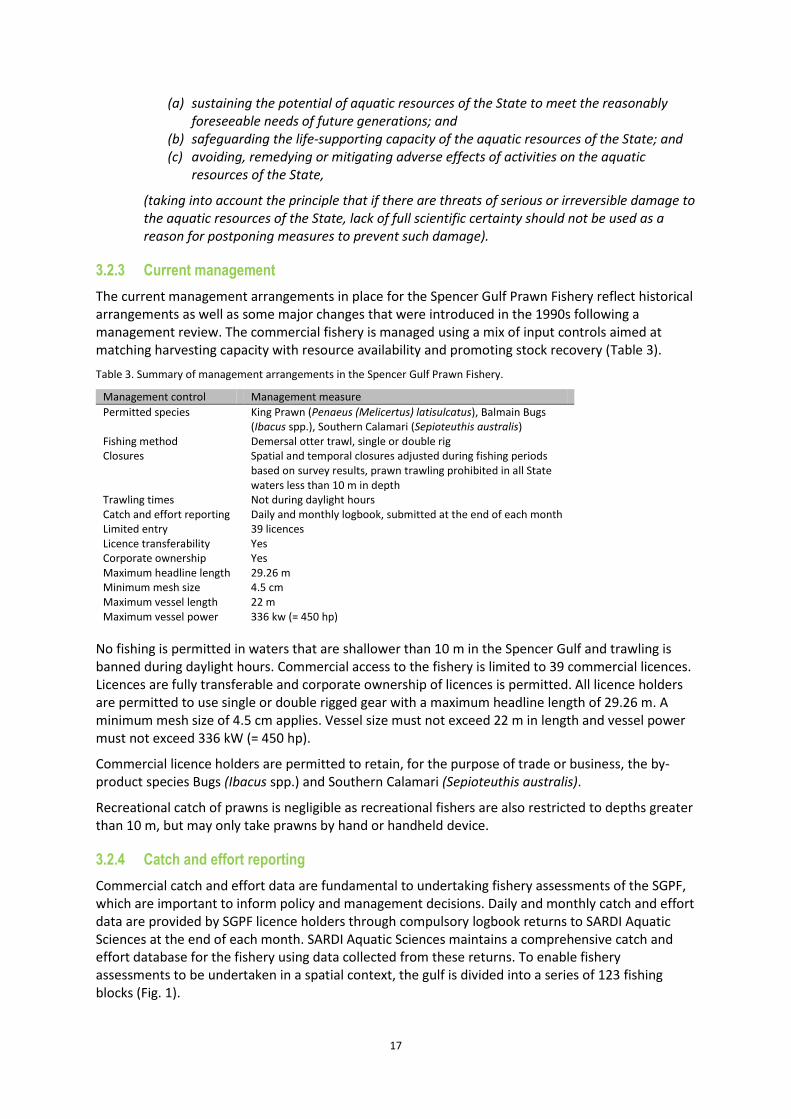
3.2.3 Current management
The current management arrangements in place for the Spencer Gulf Prawn Fishery reflect historical arrangements as well as some major changes that were introduced in the 1990s following a management review. The commercial fishery is managed using a mix of input controls aimed at matching harvesting capacity with resource availability and promoting stock recovery (Table 3).
Table 3. Summary of management arrangements in the Spencer Gulf Prawn Fishery.
Management control Management measure
Permitted species King Prawn (Penaeus (Melicertus) latisulcatus), Balmain Bugs (Ibacus spp.), Southern Calamari (Sepioteuthis australis)
Fishing method Demersal otter trawl, single or double rig Closures Spatial and temporal closures adjusted during fishing periods
based on survey results, prawn trawling prohibited in all State waters less than 10 m in depth
Trawling times Not during daylight hours Catch and effort reporting Daily and monthly logbook, submitted at the end of each month Limited entry 39 licences Licence transferability Yes Corporate ownership Yes Maximum headline length 29.26 m Minimum mesh size 4.5 cm Maximum vessel length 22 m Maximum vessel power 336 kw (= 450 hp)
No fishing is permitted in waters that are shallower than 10 m in the Spencer Gulf and trawling is banned during daylight hours. Commercial access to the fishery is limited to 39 commercial licences. Licences are fully transferable and corporate ownership of licences is permitted. All licence holders are permitted to use single or double rigged gear with a maximum headline length of 29.26 m. A minimum mesh size of 4.5 cm applies. Vessel size must not exceed 22 m in length and vessel power must not exceed 336 kW (= 450 hp).
Commercial licence holders are permitted to retain, for the purpose of trade or business, the by-product species Bugs (Ibacus spp.) and Southern Calamari (Sepioteuthis australis).
Recreational catch of prawns is negligible as recreational fishers are also restricted to depths greater than 10 m, but may only take prawns by hand or handheld device.
3.2.4 Catch and effort reporting
Commercial catch and effort data are fundamental to undertaking fishery assessments of the SGPF, which are important to inform policy and management decisions. Daily and monthly catch and effort data are provided by SGPF licence holders through compulsory logbook returns to SARDI Aquatic Sciences at the end of each month. SARDI Aquatic Sciences maintains a comprehensive catch and effort database for the fishery using data collected from these returns. To enable fishery assessments to be undertaken in a spatial context, the gulf is divided into a series of 123 fishing blocks (Fig. 1).

18
Data provided in the logbook returns include: licence information, date(s), shot no., block no., trawl start/end time (duration), depth, GPS location, trawl speed, bucket count (prawns per 7 kg bucket), frozen catch by size grade, brine catch, retained by-product, water temperature, and a link to any wildlife interaction (where appropriate).
These data were first obtained in 1988/89. Historical data prior to 1988/89 were obtained from two sources: 1) annual data from 1968-1973, and 2) monthly data from 1973-1988 derived from South Australian Fishing Industry Council annual reports (Dixon et al. 2012).
3.3 Biology
3.3.1 Distribution and stock structure
P. latisulcatus is distributed throughout the Indo-west Pacific (Grey et al. 1983). Its distribution in South Australia is unique, as it is at its lowest temperature range, restricted to waters of Spencer Gulf, Gulf St Vincent and along the west coast including the commercially fished areas of Ceduna, Venus Bay and Coffin Bay. King (1977), Sluczanowski (1980) and Carrick (1982, 1996) provide detailed accounts of the distribution of King prawns in Spencer Gulf.
The King prawn is a benthic species that prefers sandy areas to seagrass or vegetated habitats (Tanner & Deakin 2001). Both juvenile and adult prawns show a strong diel behavioural pattern of daytime burial and nocturnal activity (Rasheed & Bull 1992; Primavera & Lebata 2000). Strong lunar and seasonal differences in activity are also exhibited, where prawn activity (and catchability) is greater during the dark phase of the lunar cycle and during warmer months.
The distribution and abundance of P. latisulcatus within gulfs and estuaries is affected by salinity and the presence of sandy substrate (Potter et al. 1991). Higher abundances are associated with salinities above 30 ‰ (Potter et al. 1991). In physiological studies, optimal salinity ranged from 22 to 34 ‰, and 100% mortality occurred at salinities below 10 ‰ (Sang & Fotedar 2004). Juvenile P. latisulcatus are more efficient osmoregulators than adults, tolerating greater variations in salinity. Important nursery areas in Western Australia and South Australia are characterised as being hyper-saline (35–55 ‰) (Carrick 1982; Penn et al. 1988).
An analysis of the genetic structure of P. latisulcatus within South Australia using electrophoresis suggested a homogenous stock (Richardson, 1982 cited in Carrick 2003). Conversely, genetic analysis indicates significant differences between stocks in South Australia and Western Australia.
3.3.2 Reproductive biology
In the Spencer Gulf, adult prawns aggregate, mature, mate and spawn in deep water (>10 metres) between October and April, with the main spawning period between October–January and peaking in November.
Spawning and fecundity are affected by water temperature, with the minimum for spawning being 17°C for P. latisulcatus in WA (Penn 1980). The peak reproductive period in Queensland (QLD) populations of P. latisulcatus was between June and July when water temperature dropped below 25°C (Courtney & Dredge 1988). While the ideal temperature range (17–25°C) for spawning generally occurs from ~1 November to 31 May, the majority of spawning in Spencer Gulf is restricted to earlier in the fishing year, which is likely associated with optimizing reproductive success due to shorter larval durations and higher larval survival at that time of year (Roberts et al. 2012).
During mating the male transfers a sperm capsule (spermatophore) to the female reproductive organ (thelycum). The success of this insemination depends on the female prawn having recently moulted. Ovary development followed by spawning of fertile eggs occurs during a single

19
intermoult period (Penn 1980), where fertilization presumably occurs immediately prior to, or on release of, the eggs by the female.
Prawn larvae undergo metamorphosis through four main stages: nauplii, zoea, mysis and post-larvae. Key parameters that affect larval development and survival are generally considered to be: temperature, salinity and food availability (Preston, 1985; Jackson & Burford 2003; Bryars & Havenhand 2006; Lober & Zeng, 2009). The effect of water temperature is an important factor, with faster development and higher survival in warmer water (Roberts et al. 2012).
Post-larvae settle in inshore nursery areas at 2-3 mm carapace length (CL) and can remain there for up to 10 months, depending on the time of settlement (Carrick 1996). The post-larvae produced from early spawning events settle in nursery areas during December or January where they grow rapidly before emigrating to deeper water in May or June. Alternatively, post-larvae produced from spawning after January settle in nurseries from March and then grow slowly. They “over-winter” in the nursery areas before recruiting to the trawl grounds in February of the following year (Carrick 2003).
Prawns undergo a series of moults to increase their size incrementally. The shedding of hard body parts during moulting means that the age of individuals cannot be reliably determined - as is possible for teleost and cartilaginous fishes through the examination of otoliths and vertebrae. The inability to directly age prawns has increased the reliance on tag-recapture and cohort analysis for the determination of growth rate. Male prawns grow slower and attained a smaller maximum size than females. Maximum growth rates occur during late summer and autumn, and growth is negligible from July to December (Carrick 2003).
3.3.3 Current status of the fishery
The primary measures for stock status in Spencer Gulf are the average catch rates obtained during fishery-independent surveys conducted in February, April and November, which are used as indices of relative biomass. As the fishery has maintained a long and stable history of commercial catches and recruitment (Dixon et al. 2012), the performance indicators for relative biomass aim to maintain survey catch rates within historical ranges that are considered to be at or above MSY (Dixon et al. 2013). For the 2011/12 fishing season, mean catch rates for surveys conducted in November 2011, and February and April 2012 were 160, 171 and 193 kg/h, respectively (Dixon et al. 2013). Each measure was above the limit reference points of 95, 120 and 160 kg/h (Dixon and Sloan 2007b), respectively. The commercial catch in 2011/12 of 1,675 t was the lowest recorded since 2002/03. Despite the reduction in catch, historical reductions in effort, relatively stable catches and increases in prawn size over time indicate that the SGPF has been fished within sustainable limits for much of its history. Stable measures of relative biomass by size (as determined by survey catch rates) indicate that the fishery continues to be harvested within sustainable limits in recent years. Given the performance against these measures, the current level of fishing mortality is unlikely to cause the fishery to become recruitment overfished.
On the basis of the evidence provided above, the management unit is classified as a sustainable stock.
3.4 Major environments
3.4.1 Physical environment
Spencer Gulf is a shallow embayment <40 m deep in northern areas and up to 60 m deep in southern areas. Sediments are predominately sand and mud, and seagrass habitats are common at depths <10 metres. Due to minimal freshwater input and high summer evaporation rates, it is an inverse estuary, with salinity increasing towards the head of the gulf (Nunes & Lennon 1986).

20
Sea Surface Temperatures (SSTs) in South Australia are lower and more variable than in northern fisheries that target P. latisulcatus (eg. Broome and Shark Bay). In Spencer Gulf, SST fluctuates seasonally between ~12°C and ~24°C (Nunes & Lennon 1986) with warmer SSTs in the north, cooler surface waters in the south, and considerably lower temperatures in the surrounding open ocean.
3.4.2 Socio-economic environment
The South Australian Prawn Fisheries are important in terms of total value and benefit to regional economies in South Australia. They generate direct and indirect employment, contribute to regional development, and support many small businesses in direct fishing enterprises as well as various support industries, primarily in regional South Australia (EconSearch, 2012). The SGPF had a GVP of around $30.3M in 2010/11 with a total catch of 1,979 tonnes of prawns (Knight and Tsolos, 2012) and was one of the more valuable fisheries in Australia (EconSearch, 2011b).
3.5 Research
3.5.1 Recent/current research
3.5.1.1 Fishery Independent fishing surveys Fishery Independent stock assessment surveys (FIS) are conducted before, mid and toward the end of each normal fishing season to inform the fishing strategy undertaken by the fishing fleet and to assess the fishery against performance indicators described in the management plan. Additionally, data from November surveys provide information on egg production, and data from February surveys provide information on recruitment (Dixon et al. 2012).
Surveys are conducted using industry vessels with independent observers. The surveys involve trawl shots conducted at semi-fixed sites for a specified length of time. The distance trawled depends on trawl speed and is measured with GPS. Since 1982, a total of 347 different shots have been surveyed, with GPS information available for the start and finish positions of 306 of these. The number of shots surveyed each year has been amended throughout the years (Dixon et al. 2012) for efficiency and cost effectiveness.
3.5.1.2 Fishery dependent surveys Industry conduct surveys in fishing months when there are no FIS are conducted. These industry-driven surveys target particular areas of the gulf that industry consider as potential areas for fishing. Data collated from these surveys include estimates of catch rate and mean prawn size (bucket counts).
Spot survey data aim to augment the harvest strategies developed from stock assessment surveys by targeting areas that are likely to have changed since the previous stock assessment survey such that they may be included in harvest strategy development.
3.5.1.3 Evaluation of T-90 cod ends with by-catch reduction grid There has been a long history of industry developing alternative gear to reduce by-catch in the Spencer Gulf Fishery. This most recent project aims to build on previous trials and evaluate the effectiveness of T-90 cod ends with by-catch reduction grid fishing gear The project will specifically look at improvement in catch quality, reduction in by-catch as well as reduced fuel costs. The project was completed in 2014.
3.5.1.4 Bioeconomic Model for South Australian Prawn Trawl Fisheries This project will develop a modeling tool that allows for testing of alternate management strategies, including fleet reduction, quota management and other management frameworks as suggested by

21
industry. The models will integrate economic dynamics with biological information to allow for explicit implications on the economic efficiency of various management options with biological outcomes. This project is due for completion in May 2014.
3.5.1.5 Optimising business structures and fisheries management systems for key fisheries. This project will assess the performance and identify impediments to wealth creation in selected CRC fisheries including the Spencer Gulf Prawn Fishery and identify practical opportunities for overcoming these impediments. This project is due for completion in April 2014.
3.5.1.6 Prawn Tagging Between 1984 and 1991 >150,000 prawns were individually tagged in Spencer Gulf to determine growth and movement. Approximately 9,000 tagged prawns were recaptured between 1985 and 1992. In 2012 another tagging program began, with a specific objective of understanding the movement patterns of prawns found and tagged in southern Spencer Gulf.
3.5.1.7 By-catch surveys A by-catch survey is conducted every five to seven years to underpin a risk assessment of the Spencer Gulf Prawn Fishery. The aims of a by-catch survey are to assess the potential vulnerability of by-catch species to the trawling activity of the fishery. Specifically the project describes the species composition and spatial distribution patterns of prawn trawl catch. The most recent completed by-catch survey was conducted in 2007 with the report published in 2009 (Currie et al. 2009). This survey provided the basis for the species based assessment completed in this risk assessment (see section 0). A further by-catch survey was completed in February 2013, however, the results were not analysed in time to inform this risk assessment.
3.5.1.8 Giant Cuttlefish This project will determine the movement and finer scale population structure of Giant Cuttlefish in upper Spencer Gulf and resolve the systematic status of Giant Cuttlefish within the gulf. The outcomes from this project will inform future fisheries management and lead to enhanced resource sustainability. The research is due for completion in February 2015.
3.5.1.9 Ecosystem Based Assessment This project aims to develop a reporting framework for environmental assessment of prawn trawl fisheries in Australia using the Spencer Gulf Prawn Trawl Fishery as a case study following the accepted Ecosystem Based Fisheries Management principles. The project will collate and analyse existing data on by-catch/by-product, ETPS, benthic habitats and trophodynamics. The outcomes will aid the management of the fishery by developing appropriate research priorities for ecosystem based research. The project is due for completion in June 2013.
3.5.2 Future research
The Research Subcommittee of the Spencer Gulf and West Coast Prawn Fishermen’s Management Committee drafted a research plan to guide investment and support by the Association into research needs. Proposed research for the fishery will be guided by the priorities provided in this plan.
22
4 Methodology
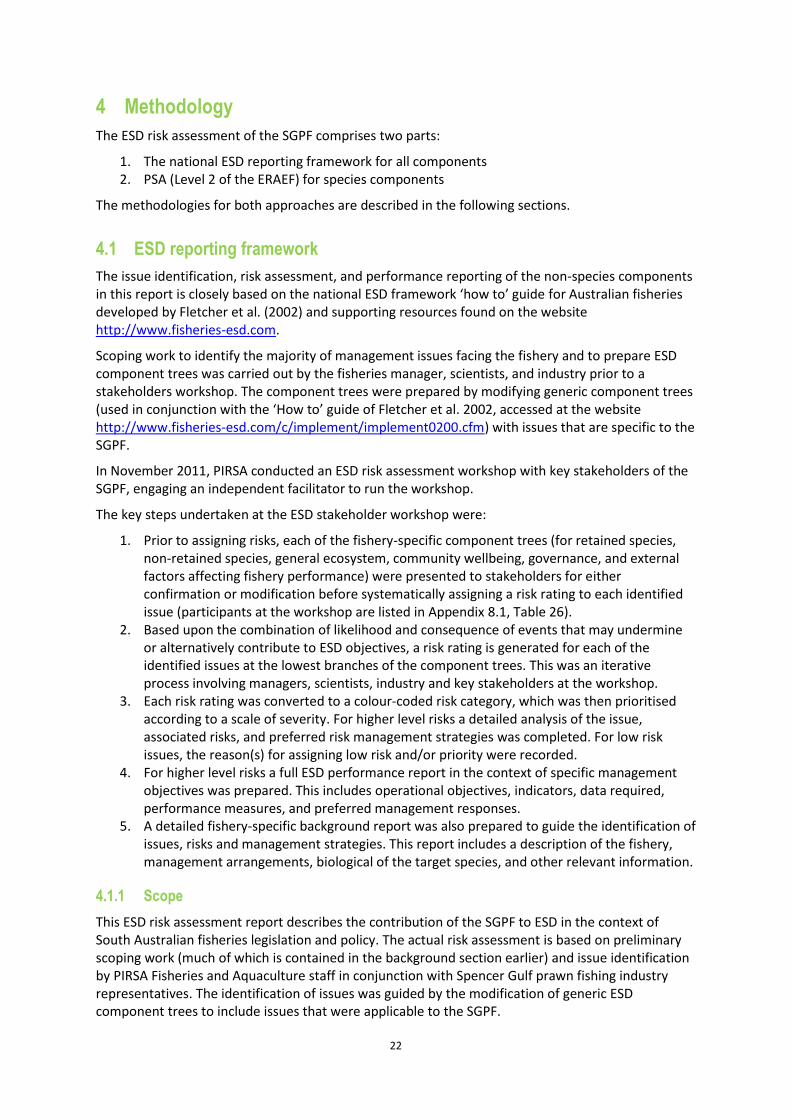
The ESD risk assessment of the SGPF comprises two parts:
1. The national ESD reporting framework for all components 2. PSA (Level 2 of the ERAEF) for species components
The methodologies for both approaches are described in the following sections.
4.1 ESD reporting framework
The issue identification, risk assessment, and performance reporting of the non-species components in this report is closely based on the national ESD framework ‘how to’ guide for Australian fisheries developed by Fletcher et al. (2002) and supporting resources found on the website http://www.fisheries-esd.com.
Scoping work to identify the majority of management issues facing the fishery and to prepare ESD component trees was carried out by the fisheries manager, scientists, and industry prior to a stakeholders workshop. The component trees were prepared by modifying generic component trees (used in conjunction with the ‘How to’ guide of Fletcher et al. 2002, accessed at the website http://www.fisheries-esd.com/c/implement/implement0200.cfm) with issues that are specific to the SGPF.
In November 2011, PIRSA conducted an ESD risk assessment workshop with key stakeholders of the SGPF, engaging an independent facilitator to run the workshop.
The key steps undertaken at the ESD stakeholder workshop were:
1. Prior to assigning risks, each of the fishery-specific component trees (for retained species, non-retained species, general ecosystem, community wellbeing, governance, and external factors affecting fishery performance) were presented to stakeholders for either confirmation or modification before systematically assigning a risk rating to each identified issue (participants at the workshop are listed in Appendix 8.1, Table 26).
2. Based upon the combination of likelihood and consequence of events that may undermine or alternatively contribute to ESD objectives, a risk rating is generated for each of the identified issues at the lowest branches of the component trees. This was an iterative process involving managers, scientists, industry and key stakeholders at the workshop.
3. Each risk rating was converted to a colour-coded risk category, which was then prioritised according to a scale of severity. For higher level risks a detailed analysis of the issue, associated risks, and preferred risk management strategies was completed. For low risk issues, the reason(s) for assigning low risk and/or priority were recorded.
4. For higher level risks a full ESD performance report in the context of specific management objectives was prepared. This includes operational objectives, indicators, data required, performance measures, and preferred management responses.
5. A detailed fishery-specific background report was also prepared to guide the identification of issues, risks and management strategies. This report includes a description of the fishery, management arrangements, biological of the target species, and other relevant information.
4.1.1 Scope
This ESD risk assessment report describes the contribution of the SGPF to ESD in the context of South Australian fisheries legislation and policy. The actual risk assessment is based on preliminary scoping work (much of which is contained in the background section earlier) and issue identification by PIRSA Fisheries and Aquaculture staff in conjunction with Spencer Gulf prawn fishing industry representatives. The identification of issues was guided by the modification of generic ESD component trees to include issues that were applicable to the SGPF.
23
Each fishery-specific component tree is developed to ensure consistency with ESD principles and, as such, the ESD report assesses the performance of the fishery for up to seven components (within three main categories), each of which focus on ecological, economic, social or governance issues facing the fishery (Table 4). The process also identifies where additional (or reduced) management or research attention is needed, and identifies strategies and performance criteria to achieve management objectives to the required standard.
Table 4. Components of the national ESD reporting framework for Australian fisheries.
Category Component
Contributions of the fishery to ecological wellbeing
Retained species
Non-retained species
General ecosystem
Contributions of the fishery to human wellbeing
Aboriginal community
Community wellbeing (including the fishing industry)
Factors affecting the ability of the fishery to contribute to ESD
Governance
External factors affecting fishery performance
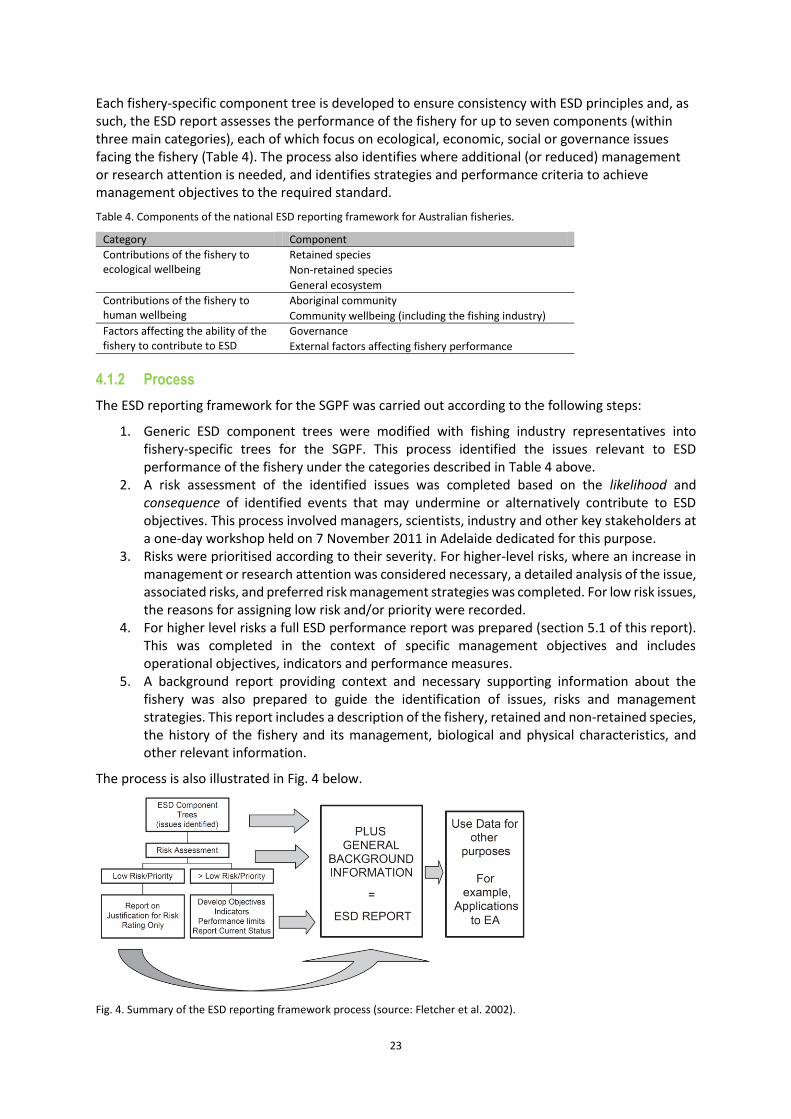
4.1.2 Process
The ESD reporting framework for the SGPF was carried out according to the following steps:
1. Generic ESD component trees were modified with fishing industry representatives into fishery-specific trees for the SGPF. This process identified the issues relevant to ESD performance of the fishery under the categories described in Table 4 above.
2. A risk assessment of the identified issues was completed based on the likelihood and consequence of identified events that may undermine or alternatively contribute to ESD objectives. This process involved managers, scientists, industry and other key stakeholders at a one-day workshop held on 7 November 2011 in Adelaide dedicated for this purpose.
3. Risks were prioritised according to their severity. For higher-level risks, where an increase in management or research attention was considered necessary, a detailed analysis of the issue, associated risks, and preferred risk management strategies was completed. For low risk issues, the reasons for assigning low risk and/or priority were recorded.
4. For higher level risks a full ESD performance report was prepared (section 5.1 of this report). This was completed in the context of specific management objectives and includes operational objectives, indicators and performance measures.
5. A background report providing context and necessary supporting information about the fishery was also prepared to guide the identification of issues, risks and management strategies. This report includes a description of the fishery, retained and non-retained species, the history of the fishery and its management, biological and physical characteristics, and other relevant information.
The process is also illustrated in Fig. 4 below.
Fig. 4. Summary of the ESD reporting framework process (source: Fletcher et al. 2002).

24
4.1.3 Issue identification (component trees)
The ESD reporting component trees for the SGPF are a refined version of the generic trees intended to be used in conjunction with the ‘How to’ guide of Fletcher et al. (2002). The generic trees and the issues that they encompass were the result of extensive consideration and refinement during the initial development of the national ESD approach for wild capture fisheries. The trees were designed to be very comprehensive to ensure that all of the conceivable issues facing a fishery would be considered during the workshop process. The fishery-specific component trees developed after expert and stakeholder consideration provide a more realistic and practical illustration of the issues facing a particular fishery.
The generic component trees have been used as the starting point to ensure thorough, consistent, and rigorous identification and evaluation of ESD issues across all of the South Australian fisheries being assessed. When developing each of the major fishery-specific component trees, each primary component is broken down into more specific sub-components for which operational objectives can then be developed (Fig. 5).
Sub-sub-sub-
component 1
Sub-sub-sub-
component 2
Sub-sub-component
Sub-component 1
Sub-sub-component
Sub-component 2 Sub-component 3
Component
Fig. 5. Structure of component trees used in the ESD reporting framework (found in an information package used in conjunction with Fletcher et al. 2002, which can be found on the website http://www.fisheries-esd.com).
4.1.4 Risk assessment and prioritization of issues
Once the fishery-specific component trees were finalized, the focus moved to the assessment and prioritisation of risks and opportunities facing the fishery. These have been considered in the context of the specific management objectives for each fishery being assessed. The higher level management objectives and desired ESD outcomes are those described in the Act. Risks and opportunities are also evaluated against more detailed fishery-specific objectives - such as those articulated in the management plan for the SGPF.
The risk assessment of issues identified for the SGPF has been done on the basis of existing management for the fishery. Hence the risk assessment conducted during the stakeholder workshop on 7 November 2011 considered the residual risk after the existing risk treatments were taken into account. For example, PIRSA’s current compliance program for the SGPF is itself based on a separate compliance risk assessment process. This process identifies compliance risks in the context of the fishery’s management objectives, and then develops and applies strategies to mitigate those risks. The ESD assessment and reporting process works across the full suite of fishery ESD objectives in a similar way.
What is risk analysis?
‘Risk analysis involves consideration of the sources of risk, their consequences and the likelihood that those consequences may occur’ (AS/NZS 4360:1999).
Risk assessment applied under the national ESD framework has been designed to be consistent with the Australian and New Zealand Standard AS/NZS 4360:1999 for risk management. Subject matter experts and key fishery stakeholders consider the range of potential consequences of an issue, activity, or event (identified during the component tree development process) and how likely those

25
consequences are to occur. The estimated consequence of an event is multiplied by the likelihood of that event occurring to produce an estimated level of risk.
ESD workshop participants worked methodically through each component tree from the top down and conducted a qualitative risk assessment of each issue. An estimate of the consequence level for each issue was made and scored from 0–5 based on scoring criteria, with 0 being negligible and 5 being catastrophic. The consequence score was based on either a general consequence table developed for ecological risk assessments (Table 5) or more detailed consequence tables specific to the ESD component being assessed (Appendix 8.2), and represents the outcome of the combined expertise of workshop participants.
Table 5. The general consequence table for use in ecological risk assessments related to fishing (Fletcher et al. 2002).
Level Ecological
Negligible (0) Very insignificant impacts – unlikely to be even measurable at the scale of the stock/ecosystem/ community against natural background variability
Minor (1) Possibly detectable but minimal impact on structure/function or dynamics Moderate (2) Maximum appropriate/acceptable level of impact (e.g. full exploitation rate for a target species) Severe (3) This level will result in wider and longer term impacts now occurring (e.g. recruitment overfishing) Major (4) Very serious impacts now occurring with relatively long timeframe likely to be needed to restore to
an acceptable level Catastrophic (5) Widespread and permanent/irreversible damage or loss will occur – unlikely to ever be fixed (e.g.
extinctions)
The level of consequence was estimated at the appropriate scale and context for the issue in question. For the target species (King Prawn) the consequence assessment was based at the population not the individual level. That is, killing one prawn is catastrophic for the individual but not for the population. Similarly, when assessing possible ecosystem impacts this was done at the level of the whole ecosystem or at least in terms of the entire extent of the habitat, not at the level of an individual patch, or individuals of a non-target species.
The likelihood of that consequence occurring was scored from 1-6, with 1 being remote and 6 being likely (Table 6). This was based on a judgment about the probability of the events, or chain of events, occurring that could result in a particular adverse consequence. This judgment about conditional probability was again based on the collective experience and knowledge of workshop participants.
Table 6. Likelihood definitions (source: Fletcher et al. 2002).
Level Descriptor
Likely (6) It is expected to occur Occasional (5) May occur Possible (4) Some evidence to suggest this is possible here Unlikely (3) Uncommon, but has been known to occur elsewhere Rare (2) May occur in exceptional circumstances Remote (1) Never heard of, but not impossible
From the consequence and likelihood scores, the overall risk value was calculated (i.e. risk = consequence x likelihood). The calculated risk values were then linked to one of five colour-coded risk categories, the relationship for which is illustrated by a risk matrix (Table 7).
Table 7. Risk matrix of consequence and likelihood. The numbers in the cells indicate the risk value, and the colours indicate risk categories (see Table 8 for more details) (source: Fletcher et al. 2002).
Consequence Likelihood Negligible (0) Minor (1) Moderate (2) Severe (3) Major (4) Catastrophic (5)
Remote (1) 0 1 2 3 4 5 Rare (2) 0 2 4 6 8 10 Unlikely (3) 0 3 6 9 12 15 Possible (4) 0 4 8 12 16 20 Occasional (5) 0 5 10 15 20 25 Likely (6) 0 6 12 18 24 30

26
Where a more detailed and/or quantitative risk assessment and management process was in place for the fishery, such as a robust quantitative stock assessment for the target species, the resultant risk score could be expected to be moderate to low. The risk score in this example reflects the fact that the risk is being managed effectively through existing arrangements.
4.1.5 Reporting requirements
The national ESD reporting framework suggests that only those issues scored at moderate, high and extreme risk, which require additional management attention, need to have full ESD performance reports completed (Table 8). This is the approach that has been adopted by PIRSA in the preparation of fishery ESD reports. The rationale for scoring other issues as low or negligible risk is also documented and form part of these reports. This encourages transparency and should help stakeholders to understand the basis for risk scores and the justification for no further management, or for additional management action if necessary.
Table 8. Relationship between risk value, risk category, management response and reporting requirements (source: Fletcher et al. 2002).
Risk category Risk values Likely management response Likely reporting requirements
Negligible 0 Nil Short justification only Low 1-6 None specific Full justification needed Moderate 7-12 Specific management needed Full performance report High 13-18 Possible increase in management activities needed Full performance report Extreme >18 Likely additional management activities needed Full performance report
As noted above, a comprehensive ESD performance report has only been prepared for higher risk/priority issues that require additional management attention (Section 5.1). The content of these reports is based on standard subject headings recommended in Fletcher et al. (2002).
The full performance report for the SGPF was developed by PIRSA Fisheries and Aquaculture, informed by the initial consultation with industry and then broader stakeholders at the stakeholder workshop on 7 November 2011. This ESD report was sent to industry and other stakeholder participants for comment before it is finalised.
4.2 ERAEF
4.2.1 The hierarchical approach
Before the methodology of the PSA is presented, the broader ERAEF process, including how the PSA fits within the ERAEF, requires a brief explanation.
The Ecological Risk Assessment for the Effects of Fishing (ERAEF) framework involves a hierarchical approach that moves from a comprehensive but largely qualitative analysis of risk at Level 1, through a more focused and semi-quantitative approach at Level 2, to a highly focused and fully quantitative ‘model-based’ approach at Level 3 (Fig. 6). This approach is efficient because many potential risks are screened out at Level 1, so that the more intensive and quantitative analyses at Level 2 (and ultimately at Level 3) are limited to a subset of the higher risk activities associated with fishing. It also leads to rapid identification of high-risk activities, which in turn can lead to immediate remedial action (risk management response). The ERAEF approach is also precautionary, in the sense that risks will be scored high in the absence of information, evidence or logical argument to the contrary.
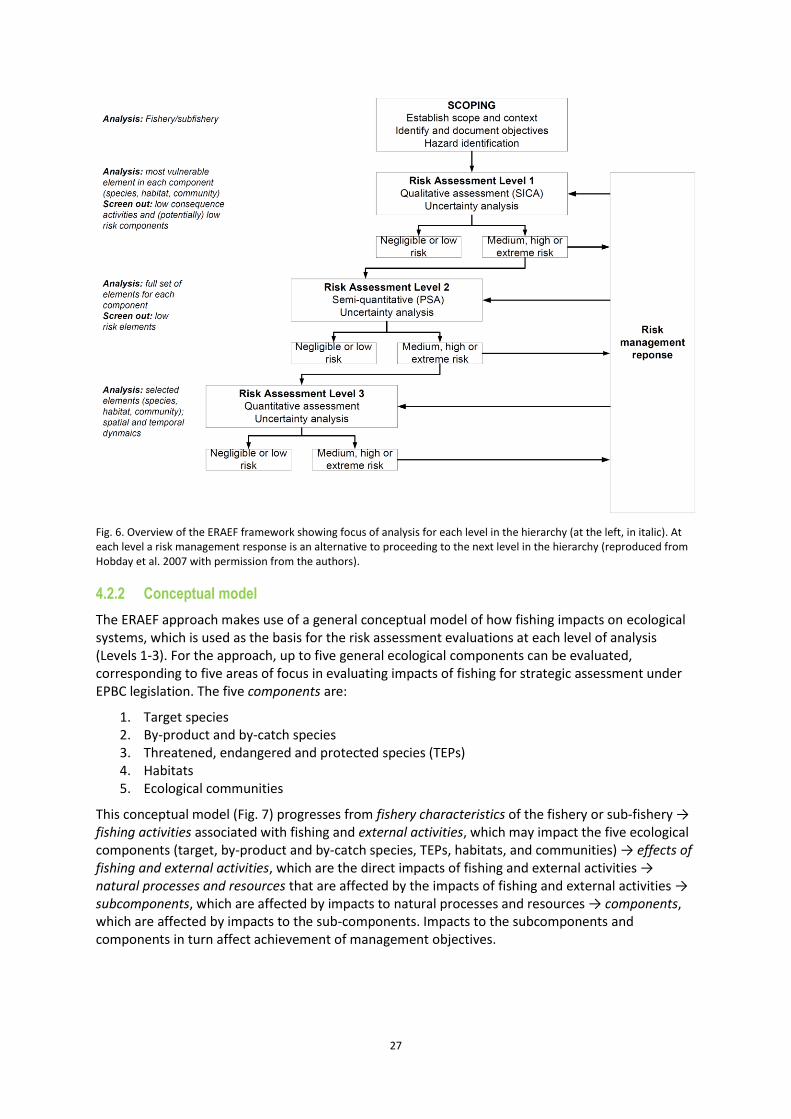
27
Fig. 6. Overview of the ERAEF framework showing focus of analysis for each level in the hierarchy (at the left, in italic). At each level a risk management response is an alternative to proceeding to the next level in the hierarchy (reproduced from Hobday et al. 2007 with permission from the authors).
4.2.2 Conceptual model
The ERAEF approach makes use of a general conceptual model of how fishing impacts on ecological systems, which is used as the basis for the risk assessment evaluations at each level of analysis (Levels 1-3). For the approach, up to five general ecological components can be evaluated, corresponding to five areas of focus in evaluating impacts of fishing for strategic assessment under EPBC legislation. The five components are:
1. Target species 2. By-product and by-catch species 3. Threatened, endangered and protected species (TEPs) 4. Habitats 5. Ecological communities
This conceptual model (Fig. 7) progresses from fishery characteristics of the fishery or sub-fishery → fishing activities associated with fishing and external activities, which may impact the five ecological components (target, by-product and by-catch species, TEPs, habitats, and communities) → effects of fishing and external activities, which are the direct impacts of fishing and external activities → natural processes and resources that are affected by the impacts of fishing and external activities → subcomponents, which are affected by impacts to natural processes and resources → components, which are affected by impacts to the sub-components. Impacts to the subcomponents and components in turn affect achievement of management objectives.

28
Fig. 7. Generic conceptual model used in the ERAEF (reproduced from Hobday et al. 2007 with permission from the authors)).
The external activities that may impact the fishery objectives are also identified in a scoping exercise and evaluated at Level 1. This provides information on the additional impacts on the ecological components being evaluated, even though management of the external activities is outside the scope of management for that fishery.
The assessment of risk at each level takes into account current management strategies and arrangements. A crucial process in the risk assessment framework is to document the rationale behind assessments and decisions at each step in the analysis. The decision to proceed to subsequent levels depends on:
• Estimated risk at the previous level • Availability of data to proceed to the next level • Management response (e.g. if the risk is high but immediate changes to management
regulations or fishing practices will reduce the risk, then analysis at the next level may be unnecessary).
A full description of the ERAEF method is provided in the methodology document (Hobday et al. 2007).
4.2.3 PSA (Level 2) for species components
For this ESD risk assessment of the SGPF, the ESD national framework of Fletcher et al. (2002) was used instead of Level 1 (of the ERAEF) for assessment of non-species components (trees) and issues identified for the fishery as part of the scoping exercise outlined in section 4.1.1, while Level 2 (PSA) of the ERAEF was used to assess the species components identified from the 2007 trawl by-catch survey (Currie et al. 2009).

29
4.2.3.1 By-catch survey The by-catch samples were conducted at 120 sites selected to represent the range of habitats and depths historically targeted by prawn trawlers. Some sites were within areas that have been closed to trawling for some years. Trawls were of approximately 30 minutes using standard double-rig otter trawl used for commercial prawn trawling. A sub-sample of homogenised catch was retained for analysis. Large sharks and rays that could not effectively be sub-sampled were individually measured and weighted prior to being released. Remaining catch was weighed before being processed with commercial product and by-product removed and by-catch discarded.
The by-catch surveys were conducted in conjunction with the February stock assessment survey at predetermined trawl locations during the dark moon phase with the addition of ‘by-catch only’ locations (to ensure coverage of a range of geomorphology and habitat types and trawl intensity (high, medium, low and nil.). Thus, this survey is considered to be a fishery-independent survey. The inclusion with the stock assessment surveys was necessary due to the high cost of conducting by-catch surveys relative to the GVP of the fishery.
The increased area sampled in the by-catch surveys compared to normal fishing operations that are conducted in a fraction of the fishable area of the gulf allowed for a greater geographic area to be sampled, potentially identifying species that may have been missed from surveying the main fishing grounds only. Indeed, a higher number of species were collected in the 2007 compared to previous surveys by Carrick (1997) conducted during normal fishing operations.
There was a also a difference in tow time between the by-catch surveys (30 minute trawls) and normal fishing operations (generally 60 minute trawls). Thus the samples collected may be biased depending on the swimming strength of species, although this was considered minimal based on previous experience of by-catch from trawls of varying times.
As the by-catch survey was conducted over a short time period (four days in 2007) the composition of by-catch species assessed by the PSA approach reflect the by-catch species at that time. It was recognised that other by-catch species caught and discarded by normal fishing operations at other times of the year may have been missed by this survey, and subsequently in the PSA analysis. However, this was not considered to be significant as normal fishing operations are during times of warm water temperatures (Nov. to May) and the sampling was considered representative of this fishing period being conducted in Feb. In addition, species identified by the surveys as by-catch may not be identified as by-catch in subsequent surveys. Ideally, the survey would be repeated at different times within seasons, and in other years, however, the high cost of conducitng these surveys relative to the GVP of the fishery precludes this. The survey has been repeated in 2013, and the outcomes of this second survey may inform the extent to which samples undertaken at different times are representative. The reviewer who reviewed this report recommended that fishery stakeholders consider augmenting the by-catch survey information with by-catch information of normal fishing operations using efficient methodologies.
4.2.3.2 PSA The PSA approach is a method of assessment that allows all units within the ecosystem components to be effectively and comprehensively screened for risk. While the PSA for species components is often used to assess risk of all species whose distribution includes the area in which the fishery operates (regardless of whether there is ever an interaction recorded), the units of analysis for this PSA report only comprised the individual target, by-product, discard and TEP species recorded from the 2007 prawn trawl by-catch survey.
The PSA approach is based on the assumption that the risk to an ecological component will depend on two characteristics of the component species: 1) the productivity of the species, which will determine the rate at which it can recover after potential depletion or damage by fishing activity; and 2) the extent of the impact due to the fishing activity, which will be determined by the susceptibility of the species to the fishing operations of the fishery. It is important to note that the

30
PSA essentially measures potential for risk – hereafter referred to simply as ‘risk’, when described in the context of the ERAEF methodology. A measure of absolute risk requires some direct measure of abundance or mortality rate for the species in question, and this information is generally lacking at Level 2. While the relative fishery interactions are measured through the susceptibility attributes, assessment of the actual impact of the fishery on a species is not made. It does not take into account the level of catch, the size of the population, or the likely exploitation rate. Thus, the risk rating provided from PSA identifies species that may require further consideration with regard to mitigation options or additional information requirements.
The PSA approach examines attributes of each species that contribute to or reflect its productivity or susceptibility to provide a relative measure of risk to the species. The following section describes how this approach is applied to the different components in the analysis. Full details of the methodology are described in Hobday et al. (2007).
The PSA for species components examines the average of seven attributes to measure productivity of each species, and the product of another four attributes to measure their susceptibility.
Table 9. The attributes used to measure productivity and susceptibility for each species.
Attribute
Productivity Average age-at-maturity Average max age Fecundity Average max size Average size-at-maturity Reproductive strategy Trophic level (Fishbase)
Susceptibility Availability considers overlap of fishing effort with a species distribution
Encounterability considers the likelihood that a species will encounter fishing gear that is deployed within the geographic range of that species (based on two attributes: adult habitat and bathymetry)
Selectivity considers the potential of the gear to capture or retain species
Post capture mortality (PCM) considers the condition and subsequent survival of a species that is captured and released (or discarded)
The attribute values for many of the units (species) can be obtained from consultation of the published scientific literature and other resources (e.g. scientific experts).
The productivity attributes for each species are based on data from the literature or from data sources such as FishBase. As productivity attributes relate to the biology of a species, these are only subject to change with updated information in the literature. For many species recorded in the 2007 by-catch survey, attributes for productivity were already known from PSAs conducted on other fisheries in Australia and stored in a database maintained by Dr Alistair Hobday at CSIRO Marine and Atmospheric Research. Dr Hobday kindly provided this information and assistance in using an Excel workbook that he developed for users to carry out a PSA.
The four aspects of susceptibility (for species) are determined in the following way:
Availability considers overlap of fishing effort with species distribution. For species without distribution maps, availability is scored based on broad geographic distribution (global, southern hemisphere, Australian endemic). Where more detailed distribution maps are available (e.g. from BIOREG data or DEH protected species maps), availability is scored as the overlap between fishing effort and the portion of the species range that lies within the broader geographical spread of the fishery. Overrides can occur where direct data from independent observer programs are available.
For this PSA of the SGPF, the latter (and preferred) measure of availability was determined for each species by comparing the fishing blocks in which the species was present (recorded from the 2007 by-catch survey) with the % contribution that those same fishing blocks made to the total effort in the fishery over a recent five-year period (2006/07-2010/11). The sum of the % contributions was considered to be a reasonable measure of overlap of a species distribution within the Spencer Gulf

31
with fishing effort of the SGPF. While the method of scoring availability differed from that of Hobday et al. (2007), itwas considered suitable for assessment of the Spencer Gulf Prawn Fishery given the nature of the fishery and the availability of information from the by-catch survey (A. Hobday pers comm.).
Encounterability is the likelihood that a species will encounter fishing gear deployed within its range. Encounterability is scored using habitat information from FishBase, modified by bathymetric information. Higher risk corresponds to the gear being deployed at the core depth range of the species. Overrides are based on mitigation measures and fishery independent observer data.
For species that do encounter gear, selectivity is a measure of the likelihood that the species will be caught by the gear. Factors affecting selectivity will be gear and species dependent, but body size in relation to gear size is an important attribute for this aspect. Overrides can be based on body shape, swimming speed and independent observer data.
For species that are caught by the gear, post-capture mortality (PCM) measures the survival probability of the species. Obviously, for species that are retained, survival will be zero. Species that are discarded may or may not survive. This aspect is mainly scored using independent filed observations or expert knowledge.
As for productivity, susceptibility attributes for some species were pre-filled by Dr Hobday. Literature searches were attempted to either fill missing information or to update existing information where appropriate for species encountered by the SGPF. The cut-off criteria and scores for productivity and susceptibility attributes for the species components are presented in Table 11.
Overall susceptibility scores for species are a product of the four aspects outlined above. This means that susceptibility scores will be substantially reduced if any one of the four aspects is considered to be low risk. However, the default assumption in the absence of verifiable supporting data for all attributes (i.e. productivity and susceptibility) is that all aspects are high risk, and so are assigned as such.
Once each species is assigned a risk score based on their attributes for productivity and susceptibility, the results are plotted on a PSA plot (Fig. 8). These data for individual species, along with the average productivity and susceptibility, are presented for each species component.
Fig. 8. The axes on which risk to the ecological units (i.e. species) is plotted. The x-axis includes attributes that influence the productivity of a species, or its ability to recover after impact from fishing. The y-axis includes attributes that influence the susceptibility of the species to impacts from fishing. Combining susceptibility and productivity determines the relative risk to a unit, i.e. units with high susceptibility and low productivity are at highest risk, while units with low susceptibility and high productivity are at lowest risk. The dashed contour lines divide regions of high, medium, and low risk.
There are seven steps for the PSA undertaken for each component following Level 1 analysis: Step 1 Identify the units excluded from analysis and document the reason for exclusion Step 2 Score units for productivity

32
Step 3 Score units for susceptibility Step 4 Plot individual units of analysis onto a PSA plot Step 5 Ranking of overall risk to each unit Step 6 Evaluation of the PSA Step 7 Decision rules to move beyond Level 2 (i.e. further analysis/assessment) Step 8 High-risk categorization
4.2.4 Stakeholder engagement process
A recognized part of conventional risk assessment is the involvement of stakeholders involved in the activities being assessed. Stakeholders can make an important contribution by providing expert judgment, fishery-specific and ecological knowledge, and process and outcome ownership. The ERAEF method also relies on stakeholder involvement of varying extent at each stage in the process.
The semi-quantitative nature of the Level 2 PSA largely comprises desktop-based work, which reduces somewhat (although doesn’t completely remove) the need for stakeholder involvement. The final PSA is completed by scientists because access to computing resources, databases, and programming skills is required. Nevertheless, the approach that was adopted for the PSA of the SGPF (Table 10) aimed to provide stakeholders with transparency, involvement, understanding and opportunity for feedback, as these were considered to be the necessary ingredients to ultimately provide them with greater confidence and ownership of the PSA results. A stakeholder panel, consisting of the Research Subcommittee of the Spencer Gulf and West Coast Prawn Fishermen’s Association, fisheries scientist and Conservation Council of South Australia representatives considered the initial outputs from the PSA and provided their opinion regarding attributes to the analysis and agreed to additional consideration for some species. Following agreement to the final risk ratings, the panel then considered management arrangements for high risk species as well as a number of other species where there was differing opinions with regard to the PSA attribute scores assigned to species or information provided by stakeholders was uncertain.
Table 10. Key meetings of the stakeholder engagement process for the PSA of the Spencer Gulf Prawn Fishery.
Date Venue Purpose of meeting
19/7/11 PIRSA Fisheries and Aquaculture, Adelaide
Dr Hobday of CSIRO invited by PIRSA to explain the ERAEF approach, particularly application of the PSA for the SGPF, incl. recommending the Research Subcommittee of the SGWCPFA as the appropriate stakeholder group for engagement and consultation
15/9/11 SARDI Aquatic Sciences, West Beach
Overview of ESD risk assessment process, including ERAEF and PSA approach, presented to Research Subcommittee of the SGWCPFA
8/11/11 PIRSA Fisheries and Aquaculture, Adelaide
Preliminary results of PSA presented to Research Subcommittee of the SGWCPFA and invited executive officers for other relevant fisheries and guests representing conservation interests
13/7/12 SARDI Aquatic Sciences, West Beach
Follow-up meeting to confirm criteria for scoring attributes, review PCM of priority species, confirm next steps for writing up report and management response
1/2/13 SARDI Aquatic Sciences, West Beach
PSA outcomes provided to stakeholder panel including the Research Subcommittee of the SGWCPFA and other experts for discussion. Attendees provided at Table 33.
19/2/13 Adelaide PSA outcomes provided to stakeholder panel including the Research Subcommittee of the SGWCPFA and other experts for discussion. Attendees provided at Table 34.
4.3 Subsequent ESD risk assessments and PSA on species components
The frequency at which each fishery must revise and update the ESD risk assessment is not fully prescribed; however, it is anticipated that the main drivers for determining the need for further assessment(s) (including ERAEF components, e.g. PSA on species components) would include, but not necessarily be limited to:
Preparation of a new management plan for the SGPF before the expiry of the management plan that is currently being developed (i.e. before its tenth anniversary of being introduced)
Any related client actions placed upon the SGPF, its research and/or management by the MSC in order to meet their annual auditing requirements

33
Any related conditions/recommendations placed upon the SGPF, its research and/or management following assessment by DSEWPaC in order to meet ecologically sustainable fisheries management requirements.
As new information arises or management changes occur in the SGPF, reassessment of any components (or component trees), issues or risks may be undertaken whenever the Minister or the Fisheries Council considers it necessary. As with this ESD risk assessment report, PIRSA may take ownership of this process, and scientific consultants may be engaged. In any case, the assessment process should again involve stakeholders to maintain transparency.

34
Table 11. Cut-off criteria and scores for productivity and susceptibility attributes for the species components. Note: Availability 2 is only used when there is no information for Availability 1; The most conservative score between Encounterability 1 and 2 is used.
Low productivity
High susceptibility Medium productivity Medium susceptibility
High productivity Low susceptibility
High risk Medium risk Low risk Attribute Score 3 Score 2 Score 1
Productivity Avg age-at-maturity >15 years 5-15 years <5 years Avg max age >25 years 10-25 years <10 years Fecundity <100 eggs per year 100-20,000 eggs per year >20,000 eggs per year Avg max size >300 cm 100-300 cm <100 cm Avg size-at-maturity >200 cm 40-200 cm <40 cm Reprod strategy Live bearer (LB), mouth brooder (BR) Demersal egg layer (DS), berried (BG) Broadcast spawner (BS) Trophic level (Fishbase) >3.25 2.75-3.25 <2.75
Susceptibility Availability 1. Overlap of adult species range with fishery
>30% overlap 10-30% overlap <10% overlap
Availability 2. Global distribution. Also need to consider stock proxies
Australia (A) Southern hemisphere (S) Global (W)
Encounterability 1. Habitat High overlap with fishing gear (SB, soft
bottom; BP, benthopelagic) Medium overlap with fishing gear (HB, hard bottom)
Low overlap with fishing gear (EP, epipelagic; MP, mesopelagic)
Encounterability 2. Bottom depth High overlap with fishing gear (20-60
m depth) Medium overlap with fishing gear (10-20 m depth)
Low overlap with fishing gear (0-10 m, >60 m depth)
Selectivity Species >2*mesh size to 4 m in length Species 1-2*mesh size, or 4-5 m in
length Species <mesh size (4.5 cm), or >5 m in length
Post-capture mortality (= 1 – PCS, post-capture survival)
Retained species, or majority dead when released
Released alive Evidence of post-capture release and survival (>66% chance live if released)

35
5 Results
5.1 ESD risk assessment outcomes
Note that the following performance reports include a summary of comments from individual stakeholders at the workshop in dot-point form, which are not verbatim et literatim. These comments are individual views and may not be representative of others at the workshop and diverging opinions are recorded.
The risk ratings are reflective of the group consensus.
5.1.1 Retained species
Fig. 9. Retained species component tree for the Spencer Gulf Prawn Fishery. See Table 8 for explanation of colour-coded risk categories.
Although the component trees are presented here for retained and non-retained species, these species underwent a semi-quantitative level 2 productivity susceptibility analysis (PSA) of species components (target, by-catch, by-product and TEP species) using the ecological risk assessment of the effects of fishing (ERAEF) methodology of Hobday et al. (2011). The results of the PSA on the species components are presented in section 8.3 of this report.
King Prawn
Potential for catastrophic consequences if heavily overfished, but currently managed well, therefore risk is not high
Dealing with the context of how the fishery operates today, not the past
Annual stock assessment for the fishery – performance of the fishery measured through performance indicators
If surveys are low, then fishery catches responds by adopting a conservative harvest strategy, which is characterized by a larger target size, which generally means that there is a comparatively smaller area that is opened for trawling
The fishery is demonstrably sustainable as it uses an adaptive (or real-time) approach to management to ensure that population of prawns remains high
The fishery has recently gained Marine Stewardship Council (MSC) accreditation for being an ecologically sustainable fishery
The fishery is believed to be operating within sustainable limits (with respect to maximum sustainable yield, MSY, and possibly maximum economic yield, MEY)
Are we modifying characteristics of the prawn populations? o Size structure – target larger prawns – post sexual maturity o Give higher proportion of population the chance to spawn o No biological concerns here o Based on real-time management
Western King Prawn
(Penaeus (Melicertus) latisulcatus)
Primary species
Bugs (Ibacus spp.)
Southern Calamari
(Sepioteuthis australis)
By-product species
Retained species

36
There are currently no reliable estimates of biomass as there is no model developed yet, but funding has recently been approved to develop a bio-economic model 1 Prawns grow rapidly – they grow to 4 years old, fishers target 2-3 year olds
Commercial fishers o Only fish a small % of the area o A large amount of the population remains untouched
Consequence: 2, Likelihood: 6, Risk rating: 12 (Moderate)
Bugs
By-product assessment undertaken three years ago o Looked at abundance (fished areas vs non-fished areas) o Catch and effort trends were declining for bugs throughout the year (no change
though for Southern Calamari)
A minimum carapace width was introduced by regulation o Large size limit ensure increased protection for spawning and subsequent
recruitment o Size limit had a big impact on what was retained
Berried females must be returned
High survival of returned bugs
Consequence: 1, Likelihood: 6, Risk rating: 6 (Low)
Southern Calamari
By-product assessment undertaken three years ago o Looked at abundance (fished areas vs non-fished areas) o Catch and effort trends were stable for Southern Calamari
Rapidly reproducing species
Catch small ones – these are the pre-recruits to the fishery
Recruit frequently and from all over the gulf
Fishing believed to have minimal impact on population
Abundance on trawl grounds is 3-4 times higher than un-trawled grounds as they tend to prefer the habitat associated with trawled grounds – a theory was raised that prawn trawling may provide favourable habitat and therefore support the populations
There are a 6-8 months every year where no fishing occurs for the SGPF – in total, only around 50 days are fished per year
Up to 90 t is landed over a fishing season, believed to not compromise sustainability – MSF take ~270 t
There was a question on what the catches normally comprised in regard to size and no., e.g. few large or many small individuals – this is variable
T90 net trials underway – may be introduced in the SGPF (already being exclusively used in the Gulf St Vincent Prawn Fishery)
Consequence: 1, Likelihood: 6, Risk rating: 6 (Low)
1 This research is currently planned to be completed by 2015.

37
5.1.2 Non-retained species
Fig. 10. Non-retained species component tree for the Spencer Gulf Prawn Fishery. The numbers in parentheses indicate the number of species recorded from the 2007 by-catch survey undertaken in Spencer Gulf. See Table 8 for explanation of colour-coded risk categories.
A comprehensive and fishery-independent trawl by-catch survey is scheduled for every 6-7 years
As part of the ESD risk assessment process, a separate workshop was scheduled the following day (8 November 2011) to focus on all species components, including by-catch species, according to the desktop-based ERAEF methodology of Hobday et al. (2007)
The species components workshop will specifically adopt the semi-quantitative level 2 of the ERAEF methodology (i.e. productivity susceptibility analysis, PSA) to assigning risk to all species
We do know that trawling does encounter by-catch and have an impact on it, although the impact is variable since it is dependent on a species’ attributes of productivity, susceptibility and availability to trawling operations
Some species recorded from the survey have been identified as habitat-type or habitat-forming species (e.g. marine plants) – these will be considered as habitat and therefore dealt with in that part of the risk assessment
Note that there are some data-deficient species – the PSA approach is precautionary in that missing attributes are automatically assigned a high risk score
Consequence: 3, Likelihood: 5, Risk rating: 15 (High)
5.1.3 General ecosystem
Fig. 11. General ecosystem component tree for the Spencer Gulf Prawn Fishery. See Table 8 for explanation of colour-coded risk categories.
Fishing
Benthic biota
Removal of/damage
to organisms by
Discarding (by-catch)
Translocation
Turbidity
Addition/movement
of biological material
Impacts on trophic structure
Trawling
Anchoring
Lost gear
Habitat disturbance
Air quality
Oil spills
Oil discharge
Rubbish debris
Sewage
Water quality
Broader environment
General ecosystem
Chondrichthyans (24)
Invertebrates (59)
Teleosts (102)
By-catch (discard) species (185)
Teleosts (7)
TEP species (7)
Non-retained species (192)
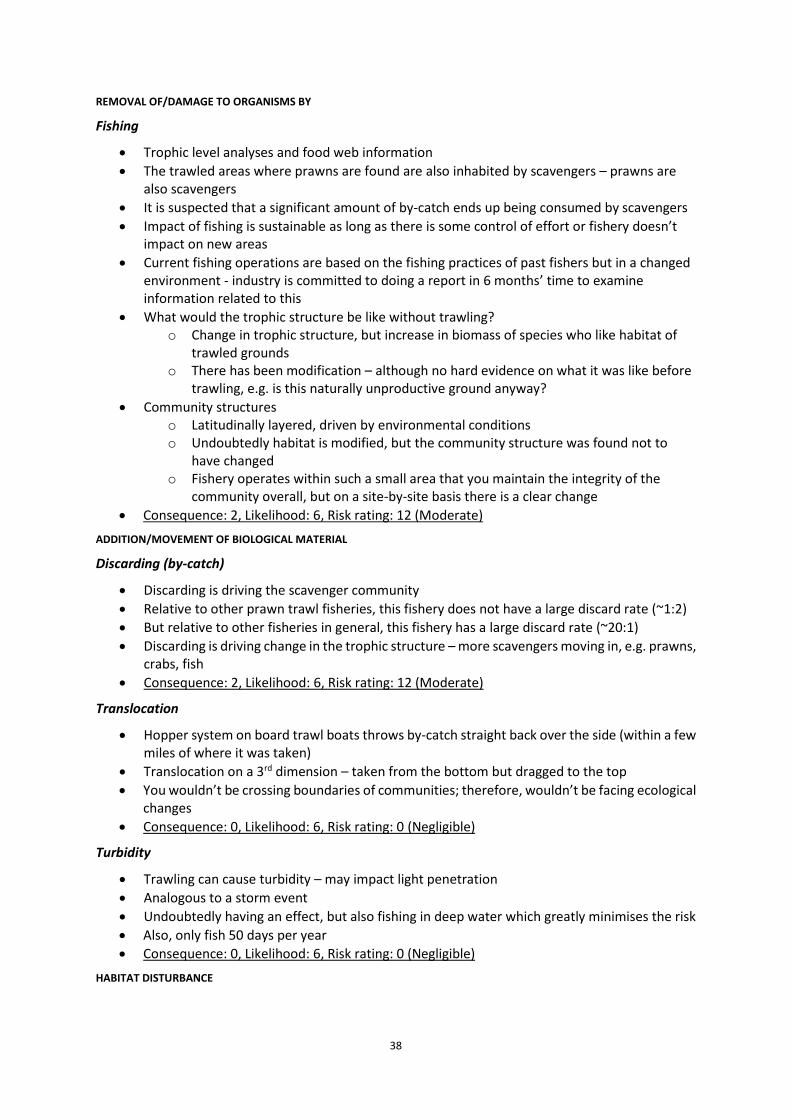
38
REMOVAL OF/DAMAGE TO ORGANISMS BY
Fishing
Trophic level analyses and food web information
The trawled areas where prawns are found are also inhabited by scavengers – prawns are also scavengers
It is suspected that a significant amount of by-catch ends up being consumed by scavengers
Impact of fishing is sustainable as long as there is some control of effort or fishery doesn’t impact on new areas
Current fishing operations are based on the fishing practices of past fishers but in a changed environment - industry is committed to doing a report in 6 months’ time to examine information related to this
What would the trophic structure be like without trawling? o Change in trophic structure, but increase in biomass of species who like habitat of
trawled grounds o There has been modification – although no hard evidence on what it was like before
trawling, e.g. is this naturally unproductive ground anyway?
Community structures o Latitudinally layered, driven by environmental conditions o Undoubtedly habitat is modified, but the community structure was found not to
have changed o Fishery operates within such a small area that you maintain the integrity of the
community overall, but on a site-by-site basis there is a clear change
Consequence: 2, Likelihood: 6, Risk rating: 12 (Moderate)
ADDITION/MOVEMENT OF BIOLOGICAL MATERIAL
Discarding (by-catch)
Discarding is driving the scavenger community
Relative to other prawn trawl fisheries, this fishery does not have a large discard rate (~1:2)
But relative to other fisheries in general, this fishery has a large discard rate (~20:1)
Discarding is driving change in the trophic structure – more scavengers moving in, e.g. prawns, crabs, fish
Consequence: 2, Likelihood: 6, Risk rating: 12 (Moderate)
Translocation
Hopper system on board trawl boats throws by-catch straight back over the side (within a few miles of where it was taken)
Translocation on a 3rd dimension – taken from the bottom but dragged to the top
You wouldn’t be crossing boundaries of communities; therefore, wouldn’t be facing ecological changes
Consequence: 0, Likelihood: 6, Risk rating: 0 (Negligible)
Turbidity
Trawling can cause turbidity – may impact light penetration
Analogous to a storm event
Undoubtedly having an effect, but also fishing in deep water which greatly minimises the risk
Also, only fish 50 days per year
Consequence: 0, Likelihood: 6, Risk rating: 0 (Negligible)
HABITAT DISTURBANCE

39
Trawling
Operating in a changed environment now – some damage has been done
Clearly had an impact
Recovery from trawling could take years depending on substrate and species present and habitat type.
Impact of trawling on benthic habitat is obvious over time but you can minimise the risk by managing the footprint
o Keep fishing the same areas and don’t go outside of that o Don’t fish new areas
Impacts are seen in the fished areas, not the whole gulf – fished areas are small compared to whole gulf
The fishing is most intense in certain areas, i.e. fishers return to traditional fishing grounds
Can habitat recover between trawling visits? – some are visited regularly (monthly), others irregularly (e.g. maybe only every few years)
There is potential to step outside of the traditional areas and have an additional and new impact; however, the current management measures manage the impact/footprint by spatial management of the fishery
Perception in the public – words can be construed in a negative way and not truly represent the good management practices
There was some initial disagreement between industry, SARDI and Conservation Council, but agreement was reached
o Noted that there was a severe impact on certain trawled grounds, but no impact on non-trawled areas
o Acknowledged the effective management measures currently in place
Consequence: 2, Likelihood: 6, Risk rating: 12 (Moderate)
Anchoring
Negligible impact
Consequence: 0, Likelihood: 6, Risk rating: 0 (Negligible)
Lost gear
Negligible impact
Don’t leave gear behind
Remain within defined areas to keep gear intact
Consequence: 0, Likelihood: 6, Risk rating: 0 (Negligible)
BROADER ENVIRONMENT
Air quality
Greenhouse gas, carbon emissions
39 boats x 50 days per year
Negligible impact
Consequence: 0, Likelihood: 6, Risk rating: 0 (Negligible)
Water quality – rubbish/debris
Negligible impact
Very rarely leave gear behind
Cast-offs – off-cuts of rope in marine system – trawlers do most gear repairs on land in the shed
Consequence: 0, Likelihood: 6, Risk rating: 0 (Negligible)
Oil spills (– specifically)

40
Consequence: 4, Likelihood: 2, Risk rating: 8 (Moderate)
Oil discharge
Negligible impact
Consequence: 0, Likelihood: 6, Risk rating: 0 (Negligible)
Sewage
Negligible impact
Consequence: 0, Likelihood: 6, Risk rating: 0 (Negligible)
5.1.4 Community wellbeing
Fig. 12. Community wellbeing component tree for the Spencer Gulf Prawn Fishery. See Table 8 for explanation of colour-coded risk categories.
FISHING INDUSTRY
Profit
Big incentive, need to make a living
EconSearch reports provide details of economic performance
Largely dependent on price of prawns
Risk rating: Extreme
DEPENDENT COMMUNITIES (REGIONAL CENTRES)
Employment
Need jobs!
Risk rating: High
OHS&W
Profit
Employment
OHS&W
Relationship with community
Asset value
Lifestyle
Fishing industry
Employment
GRP and GSP
Re-investment
Economic value
Social capital
Identity
Health/food
Social value
Infrastructure
Attitude of recreational fishers
Dependent communities (regional centres)
Economic value
Health/food
Research/knowledge
Identity
Social value
Infrastructure
Indep. communities (city centres)
Community wellbeing

41
Need safety to continue business and encourage people to work
Risk rating: High
Relationship with community
Very important
Perception is everything
Value of product needs to be protected
Good marketing has an effect
Risk rating: High
Asset value
Fishers form of superannuation
Maintaining healthy fishing stock maintains healthy licence value
Risk rating: High
Lifestyle
Way of life
Risk rating: High
Employment
SGPF provides huge flow-on benefits to regional centres
Highly dependent communities such as Port Lincoln and Wallaroo
Employ approximately 450 people directly (185 fishing jobs)/370 indirectly
800 FTEs generated/300 in regions – check EconSearch reports
Fishing facing challenges from the mining sector
Consequence: 2, Likelihood: 6, Risk rating: 12 (Moderate)
Gross regional product (GRP) and Gross state product (GSP)
2nd highest value fishery in SA
GVP $30M
Regionally, very important
Consequence: 2, Likelihood: 6, Risk rating: 12 (Moderate)
Reinvestment
Fishers live in the regions and spend their money there
Consequence: 1, Likelihood: 6, Risk rating: 6 (Low)
Social capital
Port Lincoln and other regional areas are known for their fishing. i.e. they have a well-established identity as ‘fishing towns’
Prawn and seafood sector identity
Consequence: 2, Likelihood: 4, Risk rating: 8 (Moderate)
Infrastructure
Marinas
Roads
Flow-on benefits from fishing fleets being based in the areas
Consequence: 2, Likelihood: 5, Risk rating: 10 (Moderate)
Attitude of recreational fishers
Some conflict with other target species

42
Rules are prohibitive to recreational fishers taking prawns (i.e. no fishing <10 m, by hand or hand net only)
Allocation issues
In effect, no practical access to prawns for recreational fishers –The recreational sector would like some access
Consequence: 1, Likelihood: 6, Risk rating: 6 (Low)
INDEPENDENT COMMUNITIES (CITY CENTRES)
Economic value
Contributes $30M annually to the State
Consequence: 1, Likelihood: 6, Risk rating: 6 (Low)
Social value
Health benefits of seafood
Source of food
Prawns are important throughout Australia, particularly at Christmas
Consequence: 1, Likelihood: 6, Risk rating: 6 (Low)
Research/knowledge
Market leader – considered a worldwide leader in research/knowledge
MSC accreditation
Stock assessments and associated SARDI reports
Consequence: 2, Likelihood: 6, Risk rating: 12 (Moderate)
Identity
Need more marketing so that people identify ‘Spencer Gulf Prawns’ as the highest quality seafood
Marketing ecological sustainability is vital
Consequence: 1, Likelihood: 6, Risk rating: 6 (Low)
Infrastructure
Less impact state-wide than for regional centres
Consequence: 1, Likelihood: 4, Risk rating: 4 (Low)
5.1.5 Aboriginal community
This component will be completed through a separate Aboriginal traditional ESD workshop and/or as part of the development of Aboriginal traditional fishing management plans.
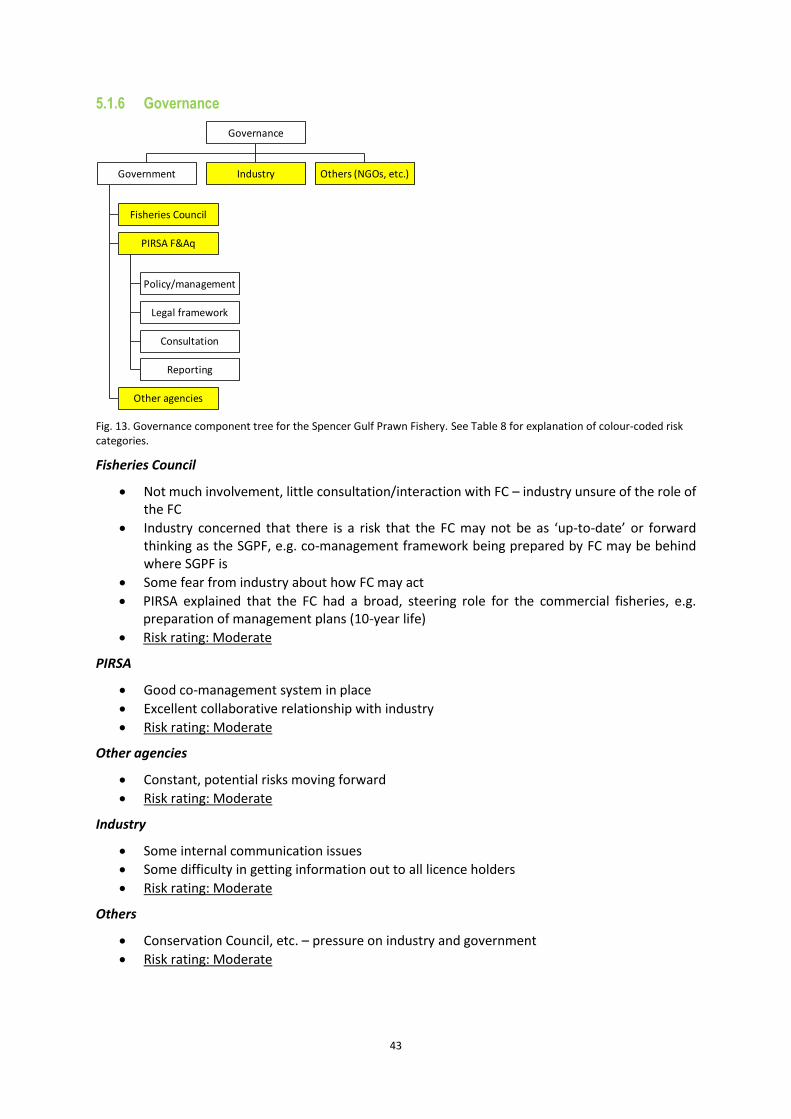
43
5.1.6 Governance
Fig. 13. Governance component tree for the Spencer Gulf Prawn Fishery. See Table 8 for explanation of colour-coded risk categories.
Fisheries Council
Not much involvement, little consultation/interaction with FC – industry unsure of the role of the FC
Industry concerned that there is a risk that the FC may not be as ‘up-to-date’ or forward thinking as the SGPF, e.g. co-management framework being prepared by FC may be behind where SGPF is
Some fear from industry about how FC may act
PIRSA explained that the FC had a broad, steering role for the commercial fisheries, e.g. preparation of management plans (10-year life)
Risk rating: Moderate
PIRSA
Good co-management system in place
Excellent collaborative relationship with industry
Risk rating: Moderate
Other agencies
Constant, potential risks moving forward
Risk rating: Moderate
Industry
Some internal communication issues
Some difficulty in getting information out to all licence holders
Risk rating: Moderate
Others
Conservation Council, etc. – pressure on industry and government
Risk rating: Moderate
Fisheries Council
Policy/management
Legal framework
Consultation
Reporting
PIRSA F&Aq
Other agencies
Government Industry Others (NGOs, etc.)
Governance

44
5.1.7 External factors affecting fishery performance
Fig. 14. External impacts component tree for the Spencer Gulf Prawn Fishery. See Table 8 for explanation of colour-coded risk categories. Desalination plant is coloured grey to represent two risk scores: State Government’s position and industry’s position.
ECOLOGICAL (BIO-PHYSICAL)
Physical
All factors unlikely to change over the next 5 years
Natural variations in physical factors
Fishery is amazingly stable o Stable environment o Definitely have seasonal catches o Environmental factors likely to be variable, but the fishery output remains stable
Temperature/salinity are not really drivers of the system
The amount of catch is matched to the amount of recruitment
Consequence: 1, Likelihood: 3, Risk rating: 3 (Low)
Climate change
Way beyond life of a management plan – difficult to capture/grasp issue in developing strategies
PIRSA and government to potentially come up with long-term strategies
Oceanographic
Climate change
Temperature
Weather
Upwellings
Salinity
Bathymetry
Physical
Diseases/viruses
Biological
Bio-physical
Desalination plant
Sewage
Agricultural runoff
Stormwater
Water quality
Mining/exploration
Illegal marine dumping
Coastal development
Dredging
Habitat modification
Commercial shipping
Exotic species
Anthropogenic
Ecological
Fuel price
Demand
Market forces
Marketing
Quality control
Market access
Labour (availability/cost)
Other fishing costs
Interest rates
Regulatory requirements
Economic
Marine parks
Shipping
Aquaculture zones
Defence areas
Desalination
Access
External impacts on industry
Mining related activities

45
Climate change may actually have positive impacts on the fishery, e.g. increase in temperature, increase in growth rates and, therefore, overall productivity
WKP is a tropical species in a sub-tropical environment
There is uncertainty in regard to its potential effect on other species in the food web
Consequence: 2, Likelihood: 1, Risk rating: 2 (Low)
Diseases/viruses
Disease-free status
Risk of imported prawn for bait – AQIS regulations now
Lack of controls have seen outbreaks in other fisheries, e.g. abalone virus
Always potential risks
Increase in shipping, may mean more potential impacts
Change to marine environments
Consequence: 4, Likelihood: 4, Risk rating: 16 (High)
ECOLOGICAL (ANTHROPOGENIC)
Desalination plants
Likely to occur
Risk of leaching into sea – impact on water quality through chemicals and salinity
Minor consequence
Real-time monitoring systems to be put in place – if triggers are met, plant will be shut down
Modelling outputs includes salinity levels
Set safe tolerable levels – if they are met, things get shutdown
Legal requirement – monitored by EPA
There has been significant debate on impacts
Need to err on precautionary side
Secondary effects – power generation
Government position: Consequence: 1, Likelihood: 5, Risk rating: 5 (Low)
Others (industry, Conservation Council): Consequence: 3, Likelihood: 5, Risk rating: 15 (High)
Note: likely to be built, but not in the next few years
In recognition of the differing views on this component, a risk rating is not recorded for this component.
Sewage
Interaction with juveniles in tidal flats
Agricultural runoff
Increased nutrients
Spray drift
Stormwater
Becomes an issue with big storm events
As individual events, the above three factors have minor impacts, but when combined together, it may have a significant impact
Combine these three together
Consequence: 2, Likelihood: 3, Risk rating: 6 (Low)
Mining
More infrastructure and ports for mining may have an impact
Exploration infrastructure in the gulf

46
Consequence: 1, Likelihood: 2, Risk rating: 2 (Low)
Mining-related activities
Dust from at-sea barrages
Increases productivity – phytoplankton is iron deficient
More algal blooms
Consequence: 1, Likelihood: 3, Risk rating: 3 (Low)
Illegal dumping
Hook-ups with dumped material are dangerous – OHS issue
Also ecological impacts of illegal reefs
Consequence: 1, Likelihood: 6, Risk rating: 6 (Low)
Coastal development
New marinas – physical destruction of habitat
Critical juvenile habitats in northern gulfs and this is where much of the coastal/industrial development is taking place
Not much development has happened yet, but once you build on a site it is lost
Consequence: 4, Likelihood: 3, Risk rating: 12 (Moderate)
Commercial shipping
Traffic – can change the movement of the fleet
Spillage risk
More of an immediate inconvenience than a risk to the fishery
Consequence: 0, Likelihood: 6, Risk rating: 0 (Negligible)
Exotic species
Haven’t heard of there being any exotic species that compete with prawns
Reality is that it is a very remote risk
An exotic species would need to compete for food or take habitat with prawns, but unlikely to wipe prawns out completely
Consequence: 3, Likelihood: 2, Risk rating: 6 (Low)
ECONOMIC
Fuel price
Linked to profit – increase in fuel price means less profit
Likely to keep increasing into the future
Other related impacts, such as carbon tax are unknown
Consequence: 4, Likelihood: 6, Risk rating: 24 (Extreme)
Market forces
Not going to diminish demand
Demand for other prawns may compete with SGPF prawns and may force a reduction in price
Imports
Costs are increasing and the price you get for prawns is decreasing
Consequence: 4, Likelihood: 5, Risk rating: 20 (Extreme)
Marketing
Frozen product to be transported anywhere
No protection of primary producer
Branding issues

47
o Need to start promoting as a premium product o MSC accreditation o Sustainable practices
Distinction between price takers and price makers – fishers want to be price makers with some control over price
Consequence: 3, Likelihood: 4, Risk rating: 12 (Moderate)
Quality control
Losing skilled labour to mining o Affects quality of grading and packing o Need a skilled eye to perform work o Experience
Consequence: 3, Likelihood: 3, Risk rating: 9 (Moderate)
Labour
Availability and cost are two considerations
Competing demand from mining industry o Hard to retain staff o There are more lucrative industries than fishing
Consequence: 3, Likelihood: 4, Risk rating: 12 (Moderate)
Other fishing costs
OHS, training, licence fees
Always going to be there
Consequence: 4, Likelihood: 6, Risk rating: 24 (Extreme)
Interest rates
Some fishers would own outright, some would be impacted by
How many fishers would be impacted? EconSearch reports may give some indication
Margins are low, therefore rising interest rates will eat into this
Consequence: 3, Likelihood: 4, Risk rating: 12 (Moderate)
Regulatory requirements
Boat surveys, e.g. brake horsepower
External regulations being imposed on fishery, e.g. carbon tax, AQIS, DTEI
Consequence: 1, Likelihood: 4, Risk rating: 4 (Low)
ACCESS
Marine parks
SGPF have been fortunate in the process, but some concerns about Habitat Protection Zones
Consequence: 2, Likelihood: 5, Risk rating: 10 (Moderate)
Shipping
Anchorage points – conflicts with shipping
Consequence: 1, Likelihood: 6, Risk rating: 6 (Low)
Aquaculture zones
Loss of access due to aquaculture zoning
May be more zones/licences in future
Consequence: 2, Likelihood: 6, Risk rating: 12 (Moderate)
Defence areas

48
A few in place in the gulfs at the moment
Unlikely to have a significant impact
Consequence: 0, Likelihood: 4, Risk rating: 0 (Negligible)
5.1.8 Summary of ESD Reporting Framework
In summary, the ESD reporting framework for all components of the fishery found that for the species components, the target species, King Prawns was found to be of medium risk, by-product species, Bugs and Southern Calamari were found to be of low risk, and the non-retained species as a group were high risk. It should be noted that for the species component of the fishery, that regardless of their ranking in the ESD reporting framework in sections 5.1.1 and 5.1.2, that these were assessed further in the EREAF process outlined in section 0.
For the non-species components of the fishery, there were 31 areas identified as of medium risk or greater. A summary table of identified risks are provided in Table 12.
Table 12: Summary of National ESD Reporting Framework outcomes
Component Trees Extreme High Medium Low Negligible Total
Retained Species Refer to PSA on Species Component (Section 5.2)
Non-retained species Refer to PSA on Species Component (Section 5.2)
General Ecosystem 4 8 12
Governance 5 5
Community Wellbeing 1 5 5 6 17
External Factors affecting Fishery Performance
3 1 7 9 2 22
Total 4 6 21 15 10
5.1.9 Performance reports for high risk components
A full ESD performance report in the context of specific management objectives including current operational objectives, indicators, and preferred strategies for each of the identified risks of medium or above is provided below (Table 13).

49
Table 13: Performance report for identified risks ranked as medium or higher identified in the ESD reporting framework. Risk ratings are medium = yellow, high = red, extreme = purple
Risk Description Risk Objective Strategies Performance Indicator
General Ecosystem -
Impacts on trophic structure – Removal of/damage to organisms by – Fishing
Risk of damage to – or removal of - material on the ecosystem due to the fishing operations
Minimise fishery impacts on by-catch and by-product species
Minimise fishery impacts on benthic habitat and associated species communities
Maintain a limit on the amount of gear used in the fishery.
Maintain permanent closed areas.
Undertake a risk assessment to determine the vulnerability of by-catch and by-product species to overfishing from prawn trawling.
Develop mitigation strategies for by-catch and by-product species deemed at high risk of overfishing from prawn trawling.
Promote the development of environmentally friendly fishing gear and fishing practices.
Develop strategies for assessment of impacts on habitat and associated species communities.
Undertake a by-catch risk assessment.
Develop mitigation strategies for high risk species
Measure success of each mitigation strategy
Measure effectiveness of mitigation strategies by assessing differences in consecutive risk assessments.
Maintain permanent closed areas
Develop strategies for assessment of impacts on habitat and associated species communities.
General Ecosystem -
Impacts on trophic structure – Additional/movement of biological material – Discarding (by-catch)
Possible impacts associated with addition of biological material from fishing through discarding
Minimise fishery impacts on by-catch and by-product species
Minimise fishery impacts on benthic habitat and associated species communities
Maintain a limit on the amount of gear used in the fishery.
Maintain permanent closed areas.
Undertake a risk assessment to determine the vulnerability of by-catch and by-product species to overfishing from prawn trawling.
Develop mitigation strategies for by-catch and by-product species deemed at high risk of overfishing from prawn trawling.
Promote the development of environmentally friendly fishing gear and fishing practices.
Develop strategies for assessment of impacts on habitat and associated species communities.
Undertake a by-catch risk assessment.
Develop mitigation strategies for high risk species
Measure success of each mitigation strategy
Measure effectiveness of mitigation strategies by assessing differences in consecutive risk assessments.
Maintain permanent closed areas
Develop strategies for assessment of impacts on habitat and associated species communities.
General Ecosystem -
Habitat disturbance – Trawling
Risk of habitat disturbance from trawling
Minimise fishery impacts on by-catch and by-product species
Maintain a limit on the amount of gear used in the fishery.
Maintain permanent closed areas.
Undertake a by-catch risk assessment.
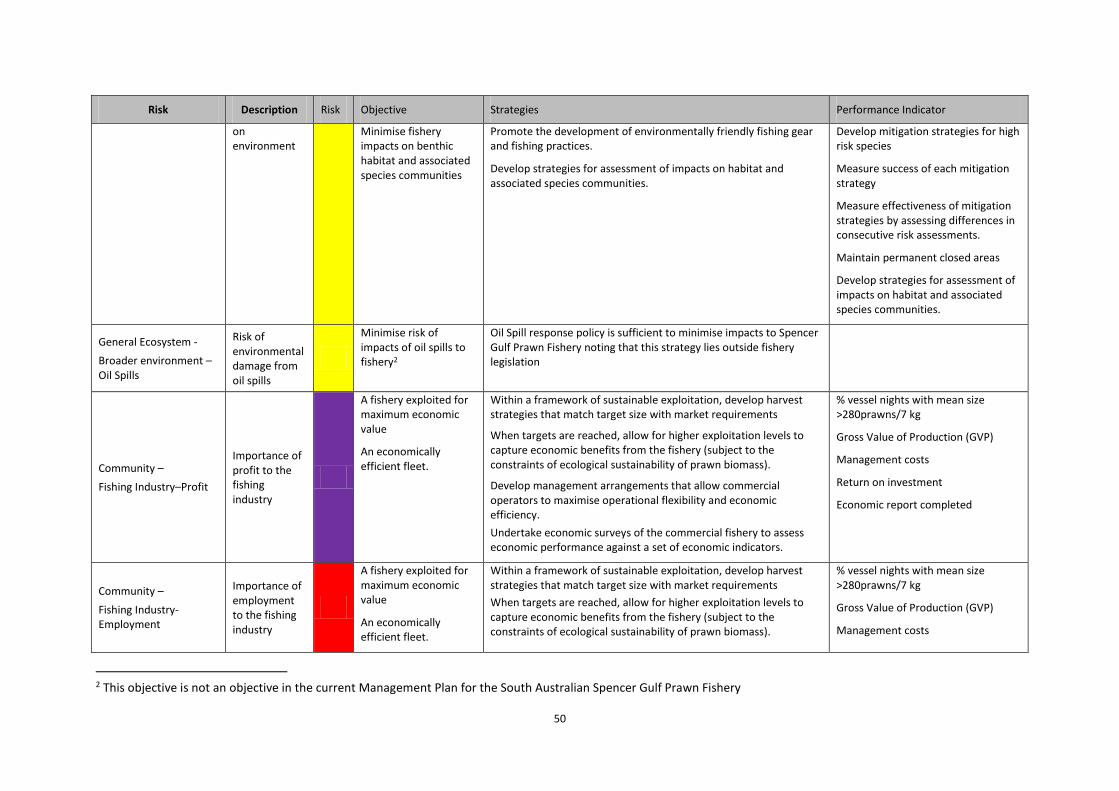
50
Risk Description Risk Objective Strategies Performance Indicator
on environment
Minimise fishery impacts on benthic habitat and associated species communities
Promote the development of environmentally friendly fishing gear and fishing practices.
Develop strategies for assessment of impacts on habitat and associated species communities.
Develop mitigation strategies for high risk species
Measure success of each mitigation strategy
Measure effectiveness of mitigation strategies by assessing differences in consecutive risk assessments.
Maintain permanent closed areas
Develop strategies for assessment of impacts on habitat and associated species communities.
General Ecosystem -
Broader environment – Oil Spills
Risk of environmental damage from oil spills
Minimise risk of impacts of oil spills to fishery2
Oil Spill response policy is sufficient to minimise impacts to Spencer Gulf Prawn Fishery noting that this strategy lies outside fishery legislation
Community –
Fishing Industry–Profit
Importance of profit to the fishing industry
A fishery exploited for maximum economic value
An economically efficient fleet.
Within a framework of sustainable exploitation, develop harvest strategies that match target size with market requirements
When targets are reached, allow for higher exploitation levels to capture economic benefits from the fishery (subject to the constraints of ecological sustainability of prawn biomass).
Develop management arrangements that allow commercial operators to maximise operational flexibility and economic efficiency.
Undertake economic surveys of the commercial fishery to assess economic performance against a set of economic indicators.
% vessel nights with mean size >280prawns/7 kg
Gross Value of Production (GVP)
Management costs
Return on investment
Economic report completed
Community –
Fishing Industry- Employment
Importance of employment to the fishing industry
A fishery exploited for maximum economic value
An economically efficient fleet.
Within a framework of sustainable exploitation, develop harvest strategies that match target size with market requirements
When targets are reached, allow for higher exploitation levels to capture economic benefits from the fishery (subject to the constraints of ecological sustainability of prawn biomass).
% vessel nights with mean size >280prawns/7 kg
Gross Value of Production (GVP)
Management costs
2 This objective is not an objective in the current Management Plan for the South Australian Spencer Gulf Prawn Fishery

51
Risk Description Risk Objective Strategies Performance Indicator
Develop management arrangements that allow commercial operators to maximise operational flexibility and economic efficiency.
Undertake economic surveys of the commercial fishery to assess economic performance against a set of economic indicators.
Return on investment
Economic reports completed
Community –
Fishing Industry- Occupational health, safety and welfare
Importance of good OHS&W practices to the fishing industry
Injuries in the fleet are
minimised2
Ensure skippers are aware of OHSW requirements and documentation is current.
Skippers are aware of OHSW requirements
Community –
Fishing Industry- Relationship with community
Enhance social license to operate
Management arrangements reflect concerns and interests of the wider community
Management arrangements are complied with.
Promote stakeholder input to the management of the fishery, through established co-management processes.
Ensure that social and cultural issues are given appropriate consideration when new management strategies are being developed.
Communicate management arrangements to the wider community.
Promote high levels of stakeholder stewardship through established management processes and Fishwatch activities
Fleet complies with harvest strategies
Community –
Fishing Industry- Asset value
Importance of licence asset value to the fishing industry
A fishery exploited for maximum economic value
An economically efficient fleet.
Within a framework of sustainable exploitation, develop harvest strategies that match target size with market requirements
When targets are reached, allow for higher exploitation levels to capture economic benefits from the fishery (subject to the constraints of ecological sustainability of prawn biomass).
Develop management arrangements that allow commercial operators to maximise operational flexibility and economic efficiency.
Undertake economic surveys of the commercial fishery to assess economic performance against a set of economic indicators.
>280prawns/7 kg
Gross Value of Production (GVP)
Management costs
Return on investment
Economic reports
Community –
Fishing Industry – lifestyle
Importance of lifestyle to fishers and community
Management arrangements reflect concerns and interests of the wider community
Promote stakeholder input to the management of the fishery, through established co-management processes. Ensure that social and cultural issues are given appropriate consideration when new management strategies are being developed.
Committee complies with harvest strategies

52
Risk Description Risk Objective Strategies Performance Indicator
Community –
Dependent Communities-Regional Centres- Economic value – Employment
Importance of fishing industry to economic value of regional centre employment
An economically efficient fleet.
Develop management arrangements that allow commercial operators to maximise operational flexibility and economic efficiency.
Number of people employed directly or indirectly in the fishery
Economic reports
Community –
Dependent Communities-Regional Centres- Economic value – GRP & GSP
Importance of fishery GRP and GSP to regional communities
A fishery exploited for maximum economic value
An economically efficient fleet.
Within a framework of sustainable exploitation, develop harvest strategies that match target size with market requirements
When targets are reached, allow for higher exploitation levels to capture economic benefits from the fishery (subject to the constraints of ecological sustainability of prawn biomass).
Undertake economic surveys of the commercial fishery to assess economic performance against a set of economic indicators
% vessel nights with mean size >280prawns/7 kg
Gross Value of Production (GVP)
Management costs
Return on investment
Economic reports
Community –
Dependent Communities-Regional Centres-Social capital
Importance of fishing industry to social capital of regional centres
Management arrangements reflect concerns and interests of the wider community
Develop management arrangements that allow commercial operators to maximise operational flexibility and community interaction.
Ensure stakeholders are involved in development of management arrangements.
Maintain communication with external stakeholders.
PIRSA website information is updated as required.
Stock Assessment publically available
Co-management arrangements between industry association and government are maintained.
Community –
Dependent Communities-Regional Centre-Infrastructure
Importance of fishing industry to infrastructure of regional centres
Management arrangements reflect concerns and interests of the wider community
Where appropriate, and if possible, influence other processes that impact on infrastructure development
Community –
Dependent Communities-City Centres- Research knowledge
Importance of regional knowledge research information for city centres
Sufficient biological and environmental information exists to inform management decisions.
Collect fishery-dependent information through commercial logbooks. Maintain the fishery-independent prawn survey program. Assess the status of the stock through quantitative stock assessment. Collect appropriate environmental data to aid assessment.
Review and update the strategic research and monitoring plan.
Fishery independent surveys
Stock Assessment completed annually
Economic report
Gross Value of Production (GVP)
Management costs

53
Risk Description Risk Objective Strategies Performance Indicator
Minimise fishery impacts on by-catch and by-product species
Minimise fishery impacts on benthic habitat and associated species communities
Undertake economic surveys of the commercial fishery to assess economic performance against a set of economic indicators
Undertake a risk assessment to determine the vulnerability of by-catch and by-product species to overfishing from prawn trawling.
Develop strategies for assessment of impacts on habitat and associated species communities
Promote the development of environmentally friendly fishing gear and fishing practices.
Return on investment
Undertake by-catch risk assessment regularly
Maintain permanently closed areas Develop strategies for assessment of impacts on habitat and associated species communities.
Governance –
Government-Fisheries Council
Importance of governance arrangements to fisheries management
Industry delegated greater responsibility in management
Management arrangements reflect concerns and interests of the wider community
Costs of management of the fishery funded by relevant stakeholders
Develop an improved industry decision-making structure to satisfy governance requirements. Promote stakeholder input to the management of the fishery, through established co-management processes. Ensure that social and cultural issues are given appropriate consideration when new management strategies are being developed. Ensure stakeholders are involved in development of management arrangements for achieving management objectives
Total cost of management
Industry Management Committee meetings
At-sea management committee
Undertake an ESD risk assessment.
Cost recovery process undertaken
Governance –
Government-PIRSA Fisheries and Aquaculture
Sufficient consultation between stakeholders and PIRSA Fisheries and Aquaculture
Industry delegated greater responsibility in management
Management arrangements reflect concerns and interests of the wider community
Costs of management of the fishery funded by relevant stakeholders
Develop an improved industry decision-making structure to satisfy governance requirements.
Promote stakeholder input to the management of the fishery, through established co-management processes.
Ensure that social and cultural issues are given appropriate consideration when new management strategies are being developed.
Communicate management arrangements to the wider community.
Ensure stakeholders are involved in development of management arrangements for achieving management objectives
Total cost of management
Industry Management Committee meetings
At-sea management committee
Undertake an ESD risk assessment.
Cost recovery process undertaken
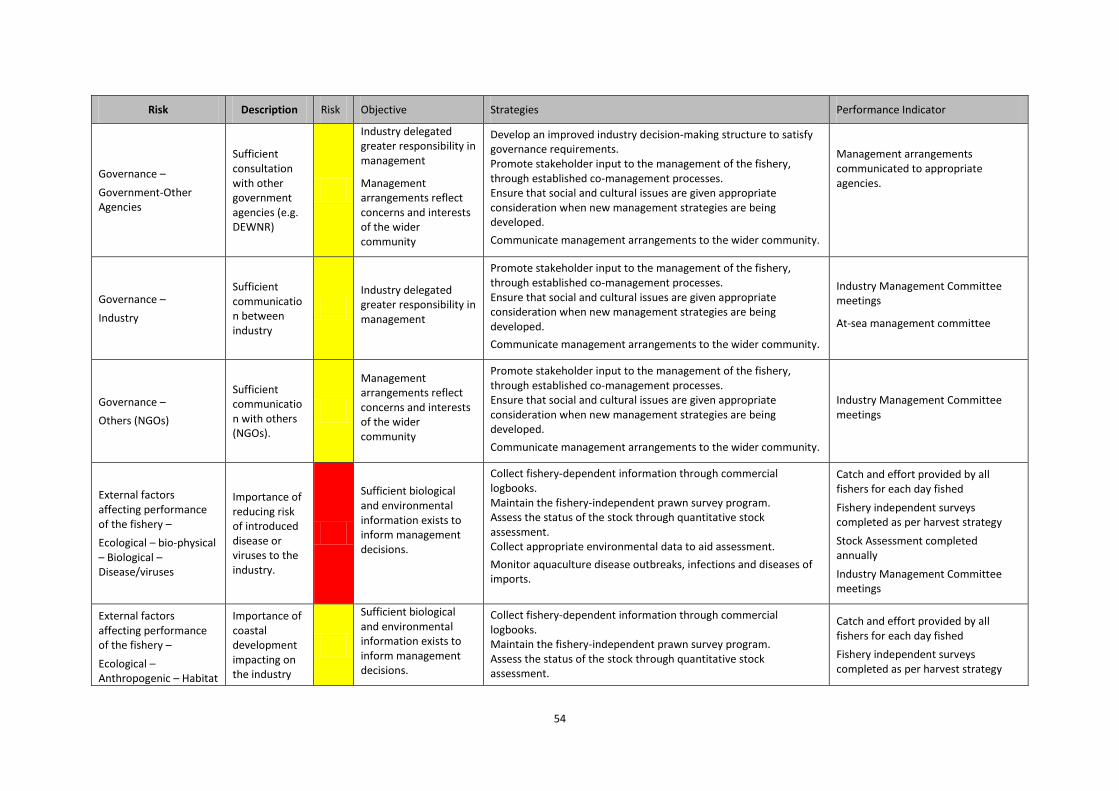
54
Risk Description Risk Objective Strategies Performance Indicator
Governance –
Government-Other Agencies
Sufficient consultation with other government agencies (e.g. DEWNR)
Industry delegated greater responsibility in management
Management arrangements reflect concerns and interests of the wider community
Develop an improved industry decision-making structure to satisfy governance requirements. Promote stakeholder input to the management of the fishery, through established co-management processes. Ensure that social and cultural issues are given appropriate consideration when new management strategies are being developed.
Communicate management arrangements to the wider community.
Management arrangements communicated to appropriate agencies.
Governance –
Industry
Sufficient communication between industry
Industry delegated greater responsibility in management
Promote stakeholder input to the management of the fishery, through established co-management processes. Ensure that social and cultural issues are given appropriate consideration when new management strategies are being developed.
Communicate management arrangements to the wider community.
Industry Management Committee meetings
At-sea management committee
Governance –
Others (NGOs)
Sufficient communication with others (NGOs).
Management arrangements reflect concerns and interests of the wider community
Promote stakeholder input to the management of the fishery, through established co-management processes. Ensure that social and cultural issues are given appropriate consideration when new management strategies are being developed.
Communicate management arrangements to the wider community.
Industry Management Committee meetings
External factors affecting performance of the fishery –
Ecological – bio-physical – Biological – Disease/viruses
Importance of reducing risk of introduced disease or viruses to the industry.
Sufficient biological and environmental information exists to inform management decisions.
Collect fishery-dependent information through commercial logbooks. Maintain the fishery-independent prawn survey program. Assess the status of the stock through quantitative stock assessment. Collect appropriate environmental data to aid assessment.
Monitor aquaculture disease outbreaks, infections and diseases of imports.
Catch and effort provided by all fishers for each day fished
Fishery independent surveys completed as per harvest strategy
Stock Assessment completed annually
Industry Management Committee meetings
External factors affecting performance of the fishery –
Ecological – Anthropogenic – Habitat
Importance of coastal development impacting on the industry
Sufficient biological and environmental information exists to inform management decisions.
Collect fishery-dependent information through commercial logbooks. Maintain the fishery-independent prawn survey program. Assess the status of the stock through quantitative stock assessment.
Catch and effort provided by all fishers for each day fished
Fishery independent surveys completed as per harvest strategy
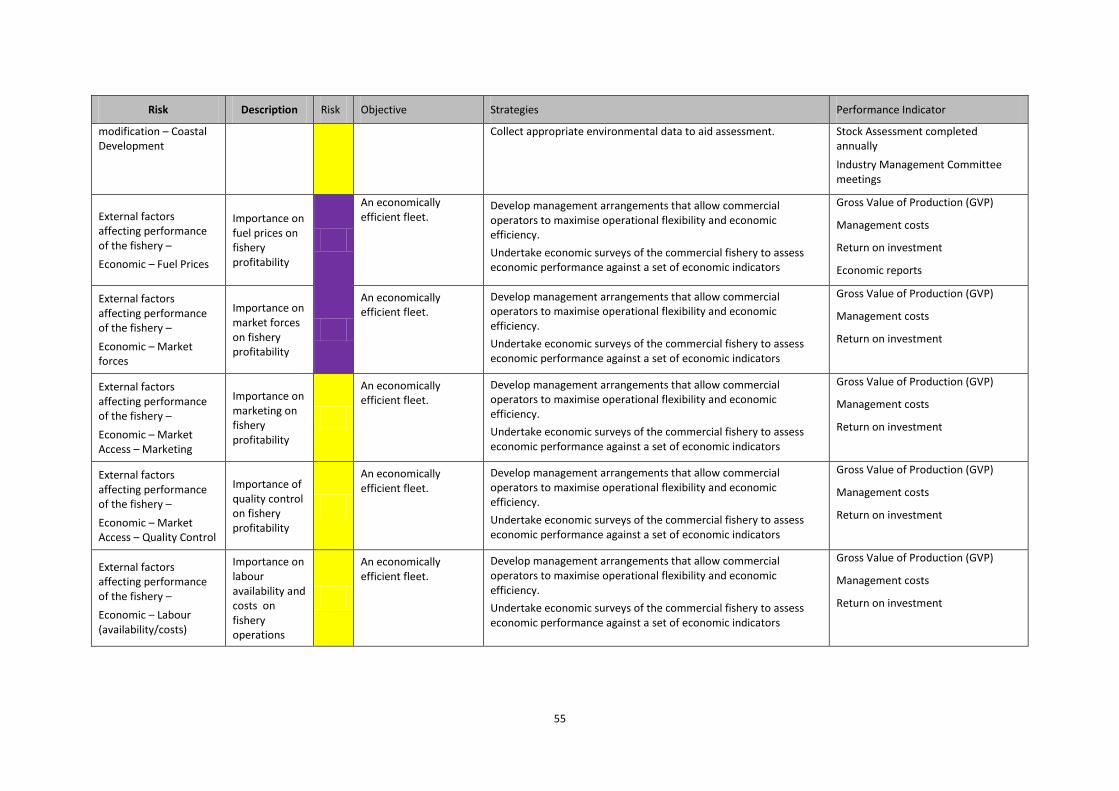
55
Risk Description Risk Objective Strategies Performance Indicator
modification – Coastal Development
Collect appropriate environmental data to aid assessment.
Stock Assessment completed annually
Industry Management Committee meetings
External factors affecting performance of the fishery –
Economic – Fuel Prices
Importance on fuel prices on fishery profitability
An economically efficient fleet.
Develop management arrangements that allow commercial operators to maximise operational flexibility and economic efficiency.
Undertake economic surveys of the commercial fishery to assess economic performance against a set of economic indicators
Gross Value of Production (GVP)
Management costs
Return on investment
Economic reports
External factors affecting performance of the fishery –
Economic – Market forces
Importance on market forces on fishery profitability
An economically efficient fleet.
Develop management arrangements that allow commercial operators to maximise operational flexibility and economic efficiency.
Undertake economic surveys of the commercial fishery to assess economic performance against a set of economic indicators
Gross Value of Production (GVP)
Management costs
Return on investment
External factors affecting performance of the fishery –
Economic – Market Access – Marketing
Importance on marketing on fishery profitability
An economically efficient fleet.
Develop management arrangements that allow commercial operators to maximise operational flexibility and economic efficiency.
Undertake economic surveys of the commercial fishery to assess economic performance against a set of economic indicators
Gross Value of Production (GVP)
Management costs
Return on investment
External factors affecting performance of the fishery –
Economic – Market Access – Quality Control
Importance of quality control on fishery profitability
An economically efficient fleet.
Develop management arrangements that allow commercial operators to maximise operational flexibility and economic efficiency.
Undertake economic surveys of the commercial fishery to assess economic performance against a set of economic indicators
Gross Value of Production (GVP)
Management costs
Return on investment
External factors affecting performance of the fishery –
Economic – Labour (availability/costs)
Importance on labour availability and costs on fishery operations
An economically efficient fleet.
Develop management arrangements that allow commercial operators to maximise operational flexibility and economic efficiency.
Undertake economic surveys of the commercial fishery to assess economic performance against a set of economic indicators
Gross Value of Production (GVP)
Management costs
Return on investment
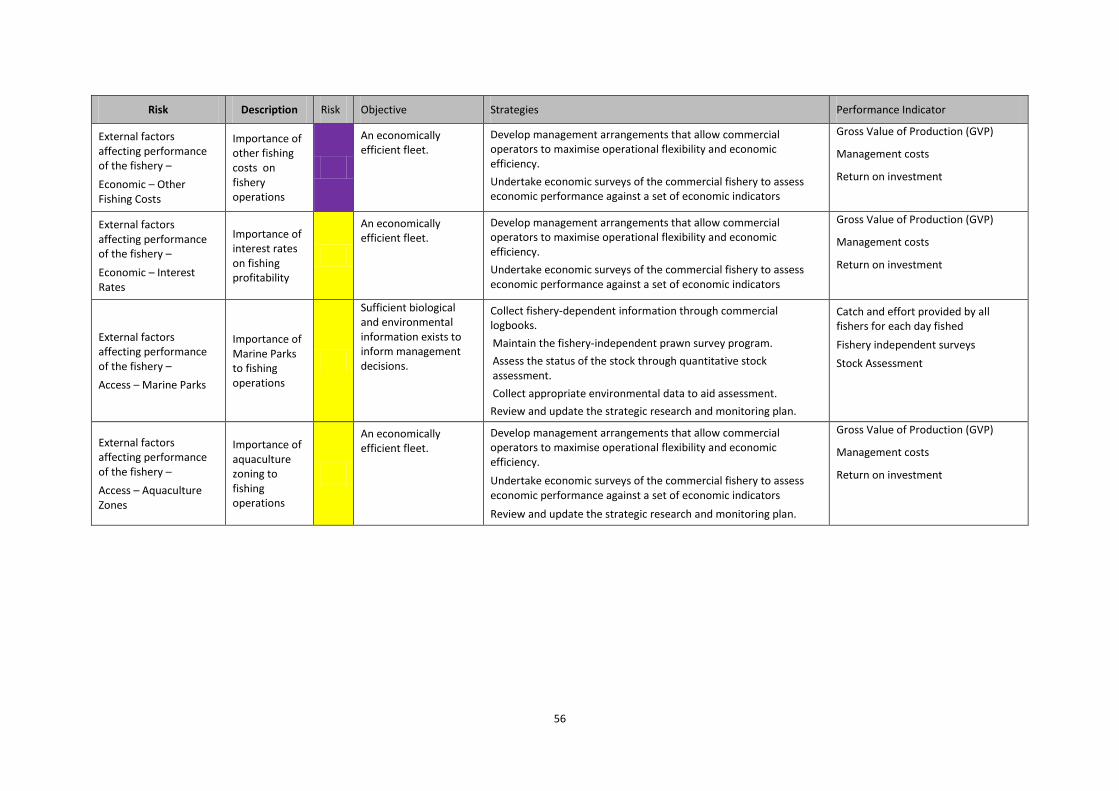
56
Risk Description Risk Objective Strategies Performance Indicator
External factors affecting performance of the fishery –
Economic – Other Fishing Costs
Importance of other fishing costs on fishery operations
An economically efficient fleet.
Develop management arrangements that allow commercial operators to maximise operational flexibility and economic efficiency.
Undertake economic surveys of the commercial fishery to assess economic performance against a set of economic indicators
Gross Value of Production (GVP)
Management costs
Return on investment
External factors affecting performance of the fishery –
Economic – Interest Rates
Importance of interest rates on fishing profitability
An economically efficient fleet.
Develop management arrangements that allow commercial operators to maximise operational flexibility and economic efficiency.
Undertake economic surveys of the commercial fishery to assess economic performance against a set of economic indicators
Gross Value of Production (GVP)
Management costs
Return on investment
External factors affecting performance of the fishery –
Access – Marine Parks
Importance of Marine Parks to fishing operations
Sufficient biological and environmental information exists to inform management decisions.
Collect fishery-dependent information through commercial logbooks.
Maintain the fishery-independent prawn survey program.
Assess the status of the stock through quantitative stock assessment.
Collect appropriate environmental data to aid assessment.
Review and update the strategic research and monitoring plan.
Catch and effort provided by all fishers for each day fished
Fishery independent surveys
Stock Assessment
External factors affecting performance of the fishery –
Access – Aquaculture Zones
Importance of aquaculture zoning to fishing operations
An economically efficient fleet.
Develop management arrangements that allow commercial operators to maximise operational flexibility and economic efficiency.
Undertake economic surveys of the commercial fishery to assess economic performance against a set of economic indicators
Review and update the strategic research and monitoring plan.
Gross Value of Production (GVP)
Management costs
Return on investment

57
5.1.10 Units excluded from analysis (Step 1)
Species lists for PSA are derived from the 2007 fishery-independent trawl by-catch survey undertaken throughout the Spencer Gulf. A total of 395 species were recorded on that survey; however, species that were considered to be part of the habitat were excluded from consideration for the PSA on species components. These excluded species comprised sessile invertebrates belonging to the phyla Porifera (sponges), Urochordata (sea squirts), Cnidaria (soft corals) and Bryozoa (lace corals), and marine plants belonging to the phyla Rhodophyta (red algae), Phaeophyta (brown algae), Magnoliophyta (seagrass) and Chlorophyta (green algae).
Once these habitat or habitat-type species were filtered from the species list, a total of 195 remaining species were considered for the PSA on species components. All 195 species were identified to the species level; therefore, no further species were excluded from analysis due to identification difficulties or any other reason.
5.1.11 Units scored for productivity and susceptibility (Steps 2 and 3)
The 195 species examined comprised 109 teleosts (bony fish), 62 invertebrates and 24 chondrichthyans (sharks, skates and rays). The actual PSA was run separately for species grouped into one of four species components: target (1 species), by-product (2), discard (185) and TEP species (7) (Table 14).
Table 14. Species components examined in this report.
Taxa name Target By-product Discard TEPs Total
Chondrichthyan 24 24
Invertebrate 1 2 59 62
Teleost 102 7 109
Total 1 2 185 7 195
The complete species list for all four species components, including ERAEF species identification, taxonomic group, family, species name, common name, CAAB code and role in fishery (species component), is shown in Appendix 8.3.
The tables presented in this section provide a summary of the PSAs conducted for each species sorted by role in the fishery, taxonomic group and risk category (Table 15).
These assessments are limited to direct impacts from fishing, and the operational objective is to avoid over-exploitation due to fishing, either as over-fishing or becoming over-fished. The risk scores and categories (high, medium or low) reflect potential rather than actual risk using the Level 2 (PSA) method. For species assessed using the PSA, no account is taken of the level of catch, the size of the population, the likely exploitation rate, or the temporal variability of these factors. However, recent fishing effort distribution is considered when calculating the availability attribute value.
Management actions or strategies in place in the SGPF that are likely to have had an influence on the results of the PSA include: 1) spatial management, which limits the range (or ecological footprint) of the fishery (affecting availability); 2) minimum mesh size, which affects the size of animals that are captured (selectivity); and 3) handling practices, which may affect the survival of species after capture (PCM). Management strategies that are less likely to influence the PSA results include limits to fishing effort, use of catch limits (e.g. the pre-Christmas catch cap), and seasonal closures.
It should be noted that the PSA method is likely to generate more false positives (species assessed as higher risk than their actual risk) than false negatives (species assessed as lower risk than their actual risk). This is due to the precautionary approach to uncertainty adopted in the PSA method where, in the absence of information, attributes are assigned a default score of 3 (i.e. high risk). It also arises from the nature of the PSA method assessing potential rather than actual risk, as discussed above.

58
Thus, some species will be assessed at high risk because they have low productivity and are exposed to the fishery, even though they are rarely, if ever, caught and are relatively abundant.
All informaiton and data colleted through the PSA were sourced through scientifically reviewed and published documents. The PSA tables also report on missing information (i.e. the number of attributes with missing data, which therefore receive the default score of 3 for high risk). For some species, attributes may be scored on information from related species or other supplementary information, and even though this information is indirect and less reliable than if species-specific information was available, this is not scored as a missing attribute.
.
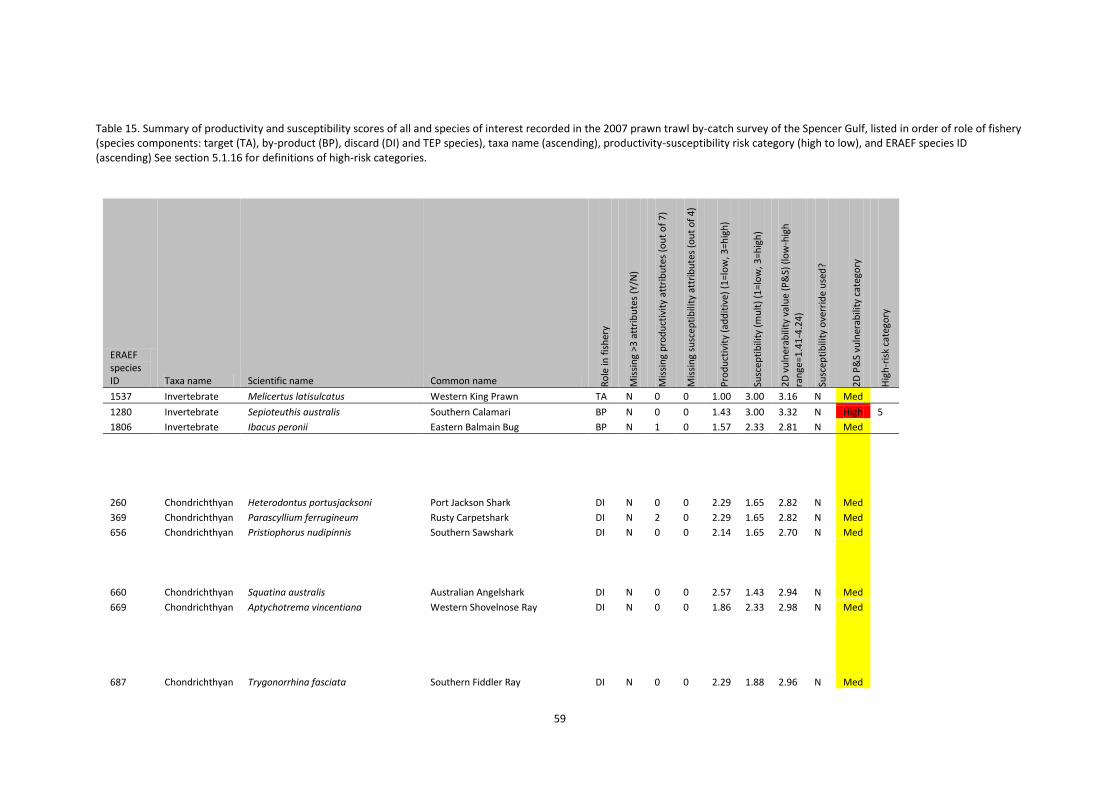
59
Table 15. Summary of productivity and susceptibility scores of all and species of interest recorded in the 2007 prawn trawl by-catch survey of the Spencer Gulf, listed in order of role of fishery (species components: target (TA), by-product (BP), discard (DI) and TEP species), taxa name (ascending), productivity-susceptibility risk category (high to low), and ERAEF species ID (ascending) See section 5.1.16 for definitions of high-risk categories.
ERAEF species ID Taxa name Scientific name Common name R
ole
in f
ish
ery
Mis
sin
g >3
att
rib
ute
s (Y
/N)
Mis
sin
g p
rod
uct
ivit
y at
trib
ute
s (o
ut
of
7)
Mis
sin
g su
scep
tib
ility
att
rib
ute
s (o
ut
of
4)
Pro
du
ctiv
ity
(ad
dit
ive)
(1
=lo
w, 3
=hig
h)
Susc
epti
bili
ty (
mu
lt)
(1=l
ow
, 3=h
igh
)
2D
vu
lner
abili
ty v
alu
e (P
&S)
(lo
w-h
igh
ran
ge=1
.41
-4.2
4)
Susc
epti
bili
ty o
verr
ide
use
d?
2D
P&
S vu
lner
abili
ty c
ateg
ory
Hig
h-r
isk
cate
gory
1537 Invertebrate Melicertus latisulcatus Western King Prawn TA N 0 0 1.00 3.00 3.16 N Med
1280 Invertebrate Sepioteuthis australis Southern Calamari BP N 0 0 1.43 3.00 3.32 N High 5
1806 Invertebrate Ibacus peronii Eastern Balmain Bug BP N 1 0 1.57 2.33 2.81 N Med
260 Chondrichthyan Heterodontus portusjacksoni Port Jackson Shark DI N 0 0 2.29 1.65 2.82 N Med
369 Chondrichthyan Parascyllium ferrugineum Rusty Carpetshark DI N 2 0 2.29 1.65 2.82 N Med
656 Chondrichthyan Pristiophorus nudipinnis Southern Sawshark DI N 0 0 2.14 1.65 2.70 N Med
660 Chondrichthyan Squatina australis Australian Angelshark DI N 0 0 2.57 1.43 2.94 N Med
669 Chondrichthyan Aptychotrema vincentiana Western Shovelnose Ray DI N 0 0 1.86 2.33 2.98 N Med
687 Chondrichthyan Trygonorrhina fasciata Southern Fiddler Ray DI N 0 0 2.29 1.88 2.96 N Med

60
ERAEF species ID Taxa name Scientific name Common name R
ole
in f
ish
ery
Mis
sin
g >3
att
rib
ute
s (Y
/N)
Mis
sin
g p
rod
uct
ivit
y at
trib
ute
s (o
ut
of
7)
Mis
sin
g su
scep
tib
ility
att
rib
ute
s (o
ut
of
4)
Pro
du
ctiv
ity
(ad
dit
ive)
(1
=lo
w, 3
=hig
h)
Susc
epti
bili
ty (
mu
lt)
(1=l
ow
, 3=h
igh
)
2D
vu
lner
abili
ty v
alu
e (P
&S)
(lo
w-h
igh
ran
ge=1
.41
-4.2
4)
Susc
epti
bili
ty o
verr
ide
use
d?
2D
P&
S vu
lner
abili
ty c
ateg
ory
Hig
h-r
isk
cate
gory
714 Chondrichthyan Hypnos monopterygium Coffin Ray DI N 0 0 2.14 1.65 2.70 N Med
764 Chondrichthyan Dasyatis brevicaudata Smooth Stingray DI N 0 0 2.43 1.88 3.07 N Med
767 Chondrichthyan Dasyatis thetidis Black Stingray DI N 0 0 2.29 1.65 2.82 N Med
774 Chondrichthyan Urolophus paucimaculatus Sparsely-spotted Stingaree DI N 0 0 1.86 2.33 2.98 N Med
784 Chondrichthyan Myliobatis australis Southern Eagle Ray DI N 0 0 2.29 1.65 2.82 N Med
999 Chondrichthyan Mustelus antarcticus Gummy Shark DI N 0 0 2.14 1.65 2.70 N Med
1040 Chondrichthyan Pristiophorus cirratus Common Sawshark DI N 0 0 2.29 1.65 2.82 N Med
1065 Chondrichthyan Dipturus whitleyi Melbourne Skate DI N 0 0 2.43 1.65 2.94 N Med
1078 Chondrichthyan Squalus megalops Spikey Dogfish DI N 0 0 2.29 1.65 2.82 N Med
1197 Chondrichthyan Orectolobus maculatus Spotted Wobbegong DI N 1 0 2.71 1.65 3.18 N Med
8003 Chondrichthyan Sutorectus tentaculatus Cobbler Wobbegong DI N 3 0 2.43 1.43 2.82 N Med
22 Chondrichthyan Urolophus gigas Spotted Stingaree DI N 0 0 2.00 1.65 2.59 N Low
286 Chondrichthyan Callorhinchus milii Elephantfish DI N 0 0 1.71 1.65 2.38 N Low
391 Chondrichthyan Asymbolus vincenti Gulf Catshark DI N 0 0 1.86 1.65 2.48 N Low
772 Chondrichthyan Urolophus cruciatus Banded Stingaree DI N 0 0 1.86 1.65 2.48 N Low

61
ERAEF species ID Taxa name Scientific name Common name R
ole
in f
ish
ery
Mis
sin
g >3
att
rib
ute
s (Y
/N)
Mis
sin
g p
rod
uct
ivit
y at
trib
ute
s (o
ut
of
7)
Mis
sin
g su
scep
tib
ility
att
rib
ute
s (o
ut
of
4)
Pro
du
ctiv
ity
(ad
dit
ive)
(1
=lo
w, 3
=hig
h)
Susc
epti
bili
ty (
mu
lt)
(1=l
ow
, 3=h
igh
)
2D
vu
lner
abili
ty v
alu
e (P
&S)
(lo
w-h
igh
ran
ge=1
.41
-4.2
4)
Susc
epti
bili
ty o
verr
ide
use
d?
2D
P&
S vu
lner
abili
ty c
ateg
ory
Hig
h-r
isk
cate
gory
812 Chondrichthyan Dipturus cerva Whitespotted Skate DI N 0 0 1.71 1.65 2.38 N Low
8258 Chondrichthyan Urolophus orarius Coastal Stingaree DI N 1 0 1.86 1.65 2.48 N Low
9286 Chondrichthyan Asymbolus submaculatus Variegated Catshark DI N 0 0 1.86 1.65 2.48 N Low
9247 Invertebrate Sepia novaehollandae a cuttlefish (not designated) DI N 1 1 1.71 3.00 3.46 N High 5
9266 Invertebrate Holothuria (Thymiosycia) hartmeyeri a holothurian (not designated) DI N 3 0 1.86 3.00 3.53 N High 5
11 Invertebrate Nototodarus gouldi Gould's Squid DI N 0 0 1.43 2.33 2.73 N Med
30 Invertebrate Portunus armatus Blue Swimmer Crab DI N 0 0 1.29 2.33 2.66 N Med
1298 Invertebrate Ceratosoma brevicaudatum a nudibranch (not designated) DI N 3 0 2.29 1.65 2.82 N Med
1304 Invertebrate Ophionereis schayeri a brittlestar (not designated) DI N 2 0 2.14 1.65 2.70 N Med
1523 Invertebrate Leptomithrax gaimardii Great Spider Crab DI N 3 0 2.00 2.33 3.07 N Med
1808 Invertebrate Luidia australiae a seastar (not designated) DI N 3 0 2.14 1.65 2.70 N Med
2721 Invertebrate Erugosquilla grahami a mantis shrimp (not designated) DI N 1 0 1.71 2.33 2.89 N Med
9242 Invertebrate Equichlamys bifrons Queen Scallop DI N 3 0 1.86 2.33 2.98 N Med
9246 Invertebrate Sepia apama Giant Cuttlefish DI N 0 0 1.71 2.33 2.89 N Med
9248 Invertebrate Sepioloidea lineolata Pinstripe Bottle-Tailed Squid DI N 3 0 2.29 1.88 2.96 N Med
9249 Invertebrate Sepiadarium austrinum Southern Bottletail Squid DI N 3 0 2.29 1.43 2.69 N Med

62
ERAEF species ID Taxa name Scientific name Common name R
ole
in f
ish
ery
Mis
sin
g >3
att
rib
ute
s (Y
/N)
Mis
sin
g p
rod
uct
ivit
y at
trib
ute
s (o
ut
of
7)
Mis
sin
g su
scep
tib
ility
att
rib
ute
s (o
ut
of
4)
Pro
du
ctiv
ity
(ad
dit
ive)
(1
=lo
w, 3
=hig
h)
Susc
epti
bili
ty (
mu
lt)
(1=l
ow
, 3=h
igh
)
2D
vu
lner
abili
ty v
alu
e (P
&S)
(lo
w-h
igh
ran
ge=1
.41
-4.2
4)
Susc
epti
bili
ty o
verr
ide
use
d?
2D
P&
S vu
lner
abili
ty c
ateg
ory
Hig
h-r
isk
cate
gory
9250 Invertebrate Octopus australis Southern Octopus DI N 3 0 2.29 1.65 2.82 N Med
9255 Invertebrate Zoila friendii thersites Black Cowry DI N 3 0 2.14 1.65 2.70 N Med
9258 Invertebrate Ptilometra macronema a crinoid (not designated) DI Y 4 0 2.14 1.88 2.85 N Med
9259 Invertebrate Astropecten triseriatus a seastar (not designated) DI N 3 0 2.14 1.65 2.70 N Med
9268 Invertebrate Metapenaeopsis sp. Velvet Prawn DI N 3 0 2.14 1.65 2.70 N Med
9277 Invertebrate Gomeza bicornis Masked Burrowing Crab DI Y 4 0 2.14 1.65 2.70 N Med
9278 Invertebrate Nectocarcinus integrifrons Rough Rock Crab DI Y 4 0 2.43 1.88 3.07 N Med
1267 Invertebrate Glycymeris (Glycymeris) striatularis a dog cockle (not designated) DI N 1 0 1.43 1.20 1.87 N Low
1269 Invertebrate Atrina (Atrina) tasmanica a razor clam (not designated) DI N 3 0 1.86 1.65 2.48 N Low
1270 Invertebrate Ostrea angasi Native Oyster DI N 1 0 1.86 1.43 2.34 N Low
1271 Invertebrate Mimachlamys asperrima Doughboy Scallop DI N 2 0 1.57 1.20 1.98 N Low
1272 Invertebrate Pecten fumatus Commercial Scallop DI N 0 0 1.14 1.43 1.83 N Low
1274 Invertebrate Eucrassatella kingicola a cockle (not designated) DI N 3 0 1.86 1.88 2.64 N Low
1285 Invertebrate Octopus berrima an octopus (not designated) DI N 1 0 1.86 1.65 2.48 N Low
1297 Invertebrate Amoria (Amoria) undulata Wavy Volute DI N 3 0 2.00 1.65 2.59 N Low
1306 Invertebrate Ophiothrix (Ophiothrix) caespitosa a brittlestar (not designated) DI N 2 0 2.00 1.65 2.59 N Low
1342 Invertebrate Lamarckdromia globosa Fringed Sponge Crab DI N 3 0 2.00 1.20 2.33 N Low
1348 Invertebrate Ovalipes australiensis Common Sand Crab DI N 3 0 2.00 1.65 2.59 N Low
9240 Invertebrate Ischnochiton (Heterozona) cariosus a chiton (not designated) DI N 3 0 2.00 1.43 2.46 N Low
9241 Invertebrate Pinna bicolor Razor Clam DI N 2 0 1.57 1.65 2.28 N Low
9243 Invertebrate Acrosterigma cygnorum Heart Cockle DI N 3 0 1.86 1.43 2.34 N Low
9244 Invertebrate Dosinia victoriae a venus cockle (not designated) DI N 3 0 1.86 1.88 2.64 N Low
9245 Invertebrate Cleidothaerus albidus a rock shell (not designated) DI N 3 0 1.86 1.58 2.44 N Low
9251 Invertebrate Diodora lincolnensis a keyhole limpet (not designated) DI Y 4 0 2.14 1.43 2.57 N Low
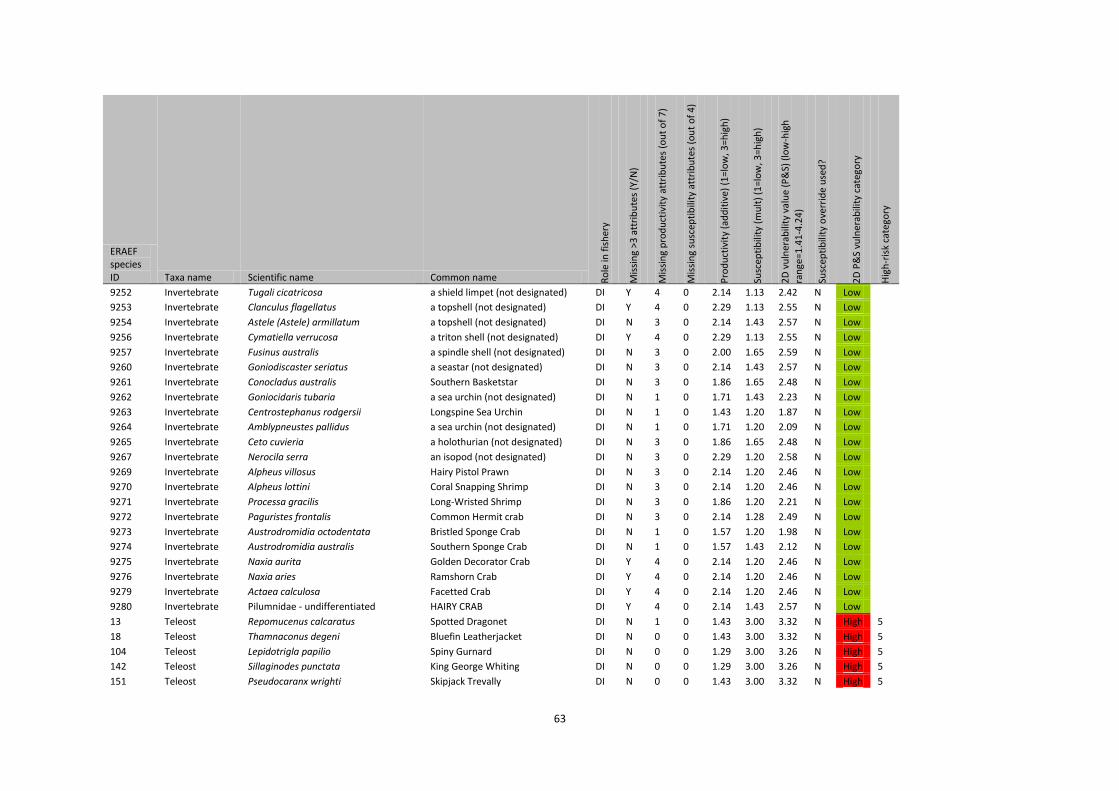
63
ERAEF species ID Taxa name Scientific name Common name R
ole
in f
ish
ery
Mis
sin
g >3
att
rib
ute
s (Y
/N)
Mis
sin
g p
rod
uct
ivit
y at
trib
ute
s (o
ut
of
7)
Mis
sin
g su
scep
tib
ility
att
rib
ute
s (o
ut
of
4)
Pro
du
ctiv
ity
(ad
dit
ive)
(1
=lo
w, 3
=hig
h)
Susc
epti
bili
ty (
mu
lt)
(1=l
ow
, 3=h
igh
)
2D
vu
lner
abili
ty v
alu
e (P
&S)
(lo
w-h
igh
ran
ge=1
.41
-4.2
4)
Susc
epti
bili
ty o
verr
ide
use
d?
2D
P&
S vu
lner
abili
ty c
ateg
ory
Hig
h-r
isk
cate
gory
9252 Invertebrate Tugali cicatricosa a shield limpet (not designated) DI Y 4 0 2.14 1.13 2.42 N Low
9253 Invertebrate Clanculus flagellatus a topshell (not designated) DI Y 4 0 2.29 1.13 2.55 N Low
9254 Invertebrate Astele (Astele) armillatum a topshell (not designated) DI N 3 0 2.14 1.43 2.57 N Low
9256 Invertebrate Cymatiella verrucosa a triton shell (not designated) DI Y 4 0 2.29 1.13 2.55 N Low
9257 Invertebrate Fusinus australis a spindle shell (not designated) DI N 3 0 2.00 1.65 2.59 N Low
9260 Invertebrate Goniodiscaster seriatus a seastar (not designated) DI N 3 0 2.14 1.43 2.57 N Low
9261 Invertebrate Conocladus australis Southern Basketstar DI N 3 0 1.86 1.65 2.48 N Low
9262 Invertebrate Goniocidaris tubaria a sea urchin (not designated) DI N 1 0 1.71 1.43 2.23 N Low
9263 Invertebrate Centrostephanus rodgersii Longspine Sea Urchin DI N 1 0 1.43 1.20 1.87 N Low
9264 Invertebrate Amblypneustes pallidus a sea urchin (not designated) DI N 1 0 1.71 1.20 2.09 N Low
9265 Invertebrate Ceto cuvieria a holothurian (not designated) DI N 3 0 1.86 1.65 2.48 N Low
9267 Invertebrate Nerocila serra an isopod (not designated) DI N 3 0 2.29 1.20 2.58 N Low
9269 Invertebrate Alpheus villosus Hairy Pistol Prawn DI N 3 0 2.14 1.20 2.46 N Low
9270 Invertebrate Alpheus lottini Coral Snapping Shrimp DI N 3 0 2.14 1.20 2.46 N Low
9271 Invertebrate Processa gracilis Long-Wristed Shrimp DI N 3 0 1.86 1.20 2.21 N Low
9272 Invertebrate Paguristes frontalis Common Hermit crab DI N 3 0 2.14 1.28 2.49 N Low
9273 Invertebrate Austrodromidia octodentata Bristled Sponge Crab DI N 1 0 1.57 1.20 1.98 N Low
9274 Invertebrate Austrodromidia australis Southern Sponge Crab DI N 1 0 1.57 1.43 2.12 N Low
9275 Invertebrate Naxia aurita Golden Decorator Crab DI Y 4 0 2.14 1.20 2.46 N Low
9276 Invertebrate Naxia aries Ramshorn Crab DI Y 4 0 2.14 1.20 2.46 N Low
9279 Invertebrate Actaea calculosa Facetted Crab DI Y 4 0 2.14 1.20 2.46 N Low
9280 Invertebrate Pilumnidae - undifferentiated HAIRY CRAB DI Y 4 0 2.14 1.43 2.57 N Low
13 Teleost Repomucenus calcaratus Spotted Dragonet DI N 1 0 1.43 3.00 3.32 N High 5
18 Teleost Thamnaconus degeni Bluefin Leatherjacket DI N 0 0 1.43 3.00 3.32 N High 5
104 Teleost Lepidotrigla papilio Spiny Gurnard DI N 0 0 1.29 3.00 3.26 N High 5
142 Teleost Sillaginodes punctata King George Whiting DI N 0 0 1.29 3.00 3.26 N High 5
151 Teleost Pseudocaranx wrighti Skipjack Trevally DI N 0 0 1.43 3.00 3.32 N High 5

64
ERAEF species ID Taxa name Scientific name Common name R
ole
in f
ish
ery
Mis
sin
g >3
att
rib
ute
s (Y
/N)
Mis
sin
g p
rod
uct
ivit
y at
trib
ute
s (o
ut
of
7)
Mis
sin
g su
scep
tib
ility
att
rib
ute
s (o
ut
of
4)
Pro
du
ctiv
ity
(ad
dit
ive)
(1
=lo
w, 3
=hig
h)
Susc
epti
bili
ty (
mu
lt)
(1=l
ow
, 3=h
igh
)
2D
vu
lner
abili
ty v
alu
e (P
&S)
(lo
w-h
igh
ran
ge=1
.41
-4.2
4)
Susc
epti
bili
ty o
verr
ide
use
d?
2D
P&
S vu
lner
abili
ty c
ateg
ory
Hig
h-r
isk
cate
gory
156 Teleost Parequula melbournensis Silverbelly DI N 1 0 1.43 3.00 3.32 N High 5
158 Teleost Pagrus auratus Snapper DI N 0 0 1.71 3.00 3.46 N High 5
201 Teleost Foetorepus calauropomus Common Stinkfish DI N 1 0 1.43 3.00 3.32 N High 5
221 Teleost Pseudorhombus jenynsii Smalltooth Flounder DI N 0 0 1.14 3.00 3.21 N High 5
234 Teleost Scobinichthys granulatus Rough Leatherjacket DI N 0 0 1.43 3.00 3.32 N High 5
249 Teleost Diodon nicthemerus Globefish DI N 0 0 1.57 3.00 3.39 N High 5
311 Teleost Acanthaluteres vittiger Toothbrush Leatherjacket DI N 0 0 1.14 3.00 3.21 N High 5
874 Teleost Gonorynchus greyi Beaked Salmon DI N 3 0 2.00 3.00 3.61 N High 5
1037 Teleost Neoplatycephalus richardsoni Tiger Flathead DI N 0 0 1.29 3.00 3.26 N High 5
1367 Teleost Neosebastes bougainvillii Gulf Gurnard Perch DI N 3 0 2.00 3.00 3.61 N High 5
8677 Teleost Upeneichthys vlamingii Bluespotted Goatfish DI N 0 0 1.14 3.00 3.21 N High 5
8682 Teleost Parapriacanthus elongatus Elongate Bullseye DI N 1 0 1.43 3.00 3.32 N High 5
9285 Teleost Cynoglossus broadhursti Southern Tongue Sole DI N 2 0 1.71 3.00 3.46 N High 5
6 Teleost Neoplatycephalus aurimaculatus Toothy Flathead DI N 0 0 1.43 2.33 2.73 N Med
26 Teleost Zebrias scalaris Manyband Sole DI N 0 0 1.29 2.33 2.66 N Med
94 Teleost Neosebastes pandus Bighead Gurnard Perch DI N 3 0 2.00 2.33 3.07 N Med
118 Teleost Platycephalus speculator Southern Bluespotted Flathead DI N 0 0 1.29 2.33 2.66 N Med
122 Teleost Pegasus lancifer Sculptured Seamoth DI N 3 0 2.00 1.88 2.74 N Med
194 Teleost Kathetostoma laeve Common Stargazer DI N 1 0 2.00 2.33 3.07 N Med
231 Teleost Eubalichthys mosaicus Mosaic Leatherjacket DI N 0 0 1.29 2.33 2.66 N Med
239 Teleost Aracana ornata Ornate Cowfish DI N 3 0 2.00 2.33 3.07 N Med
241 Teleost Aracana aurita Shaw's Cowfish DI N 3 0 2.00 2.33 3.07 N Med
244 Teleost Tetractenos glaber Smooth Toadfish DI N 0 0 1.43 2.33 2.73 N Med
248 Teleost Contusus brevicaudus Prickly Toadfish DI N 0 0 1.43 2.33 2.73 N Med
307 Teleost Lophonectes gallus Crested Flounder DI N 0 0 1.29 2.33 2.66 N Med
757 Teleost Lepidotrigla spinosa Shortfish Gurnard DI N 0 0 1.29 2.33 2.66 N Med
825 Teleost Sardinops sagax Australian Sardine DI N 0 0 1.00 3.00 3.16 N Med

65
ERAEF species ID Taxa name Scientific name Common name R
ole
in f
ish
ery
Mis
sin
g >3
att
rib
ute
s (Y
/N)
Mis
sin
g p
rod
uct
ivit
y at
trib
ute
s (o
ut
of
7)
Mis
sin
g su
scep
tib
ility
att
rib
ute
s (o
ut
of
4)
Pro
du
ctiv
ity
(ad
dit
ive)
(1
=lo
w, 3
=hig
h)
Susc
epti
bili
ty (
mu
lt)
(1=l
ow
, 3=h
igh
)
2D
vu
lner
abili
ty v
alu
e (P
&S)
(lo
w-h
igh
ran
ge=1
.41
-4.2
4)
Susc
epti
bili
ty o
verr
ide
use
d?
2D
P&
S vu
lner
abili
ty c
ateg
ory
Hig
h-r
isk
cate
gory
921 Teleost Genypterus tigerinus Rock Ling DI N 1 0 2.14 2.33 3.16 N Med
1087 Teleost Thyrsites atun Barracouta DI N 0 0 1.57 2.33 2.81 N Med
1088 Teleost Trachurus declivis Common Jack Mackerel DI N 0 0 1.29 2.33 2.66 N Med
2495 Teleost Kanekonia queenslandica Deep Velvetfish DI Y 4 0 2.29 1.43 2.69 N Med
7761 Teleost Pelates octolineatus Western Striped Grunter DI N 0 0 1.29 2.33 2.66 N Med
7771 Teleost Maxillicosta scabriceps Little Gurnard Perch DI N 3 0 2.00 2.33 3.07 N Med
7849 Teleost Neopataecus waterhousii Whiskered Prowfish DI Y 4 0 2.29 1.43 2.69 N Med
7947 Teleost Rhycherus filamentosus Tasselled Anglerfish DI N 3 0 2.43 1.65 2.94 N Med
7948 Teleost Phyllophryne scortea Whitespotted Anglerfish DI N 3 0 2.43 1.43 2.82 N Med
8333 Teleost Brachaluteres jacksonianus Southern Pygmy Leatherjacket DI N 1 0 1.43 2.33 2.73 N Med
8597 Teleost Polyspina piosae Orangebarred Puffer DI N 1 0 1.57 2.33 2.81 N Med
8863 Teleost Parapercis ramsayi Spotted Grubfish DI N 1 0 1.43 2.33 2.73 N Med
8887 Teleost Parapercis haackei Wavy Grubfish DI N 1 0 1.43 2.33 2.73 N Med
8988 Teleost Vincentia badia Scarlet Cardinalfish DI N 1 0 1.71 2.33 2.89 N Med
9281 Teleost Aulopus purpurissatus Sergeant Baker DI N 1 0 2.14 1.65 2.70 N Med
9282 Teleost Histiophryne cryptacanthus Rodless Anglerfish DI N 3 0 2.29 1.43 2.69 N Med
9284 Teleost Thysanophrys cirronasa Tasselsnout Flathead DI N 0 0 1.29 2.33 2.66 N Med
99 Teleost Gymnapistes marmoratus Soldier DI N 1 0 1.57 1.65 2.28 N Low
100 Teleost Glyptauchen panduratus Goblinfish DI N 1 0 1.57 1.65 2.28 N Low
109 Teleost Pterygotrigla polyommata Latchet DI N 0 0 1.29 1.65 2.09 N Low
124 Teleost Caesioperca lepidoptera Butterfly Perch DI N 0 0 1.14 1.65 2.01 N Low
125 Teleost Caesioperca rasor Barber Perch DI N 0 0 1.14 1.65 2.01 N Low
166 Teleost Pempheris multiradiata Bigscale Bullseye DI N 1 0 1.43 1.65 2.18 N Low
168 Teleost Enoplosus armatus Old Wife DI N 3 0 2.00 1.65 2.59 N Low
170 Teleost Pentaceropsis recurvirostris Longsnout Boarfish DI N 1 0 1.29 1.65 2.09 N Low
174 Teleost Parazanclistius hutchinsi Short Boarfish DI N 1 0 1.43 1.65 2.18 N Low
175 Teleost Oplegnathus woodwardi Knifejaw DI N 1 0 1.43 1.65 2.18 N Low

66
ERAEF species ID Taxa name Scientific name Common name R
ole
in f
ish
ery
Mis
sin
g >3
att
rib
ute
s (Y
/N)
Mis
sin
g p
rod
uct
ivit
y at
trib
ute
s (o
ut
of
7)
Mis
sin
g su
scep
tib
ility
att
rib
ute
s (o
ut
of
4)
Pro
du
ctiv
ity
(ad
dit
ive)
(1
=lo
w, 3
=hig
h)
Susc
epti
bili
ty (
mu
lt)
(1=l
ow
, 3=h
igh
)
2D
vu
lner
abili
ty v
alu
e (P
&S)
(lo
w-h
igh
ran
ge=1
.41
-4.2
4)
Susc
epti
bili
ty o
verr
ide
use
d?
2D
P&
S vu
lner
abili
ty c
ateg
ory
Hig
h-r
isk
cate
gory
177 Teleost Nemadactylus douglasii Grey Morwong DI N 0 0 1.29 1.65 2.09 N Low
183 Teleost Sphyraena obtusata Striped Barracuda DI N 0 0 1.29 1.65 2.09 N Low
184 Teleost Sphyraena novaehollandiae Snook DI N 0 0 1.71 1.65 2.38 N Low
193 Teleost Ichthyscopus barbatus Fringe Stargazer DI N 1 0 1.71 1.65 2.38 N Low
225 Teleost Ammotretis lituratus Spotted Flounder DI N 0 0 1.29 1.65 2.09 N Low
232 Teleost Meuschenia scaber Velvet Leatherjacket DI N 0 0 1.43 1.65 2.18 N Low
233 Teleost Nelusetta ayraudi Ocean Jacket DI N 0 0 1.57 1.65 2.28 N Low
236 Teleost Eubalichthys gunnii Gunn's Leatherjacket DI N 0 0 1.14 1.65 2.01 N Low
237 Teleost Meuschenia freycineti Sixspine Leatherjacket DI N 0 0 1.29 1.65 2.09 N Low
243 Teleost Omegophora armilla Ringed Toadfish DI N 0 0 1.43 1.65 2.18 N Low
310 Teleost Acanthaluteres spilomelanurus Bridled Leatherjacket DI N 0 0 1.00 2.33 2.53 N Low
332 Teleost Centroberyx affinis Redfish DI N 1 0 1.71 1.65 2.38 N Low
511 Teleost Arripis georgianus Australian Herring DI N 0 0 1.57 1.65 2.28 N Low
539 Teleost Chelidonichthys kumu Red Gurnard DI N 0 0 1.29 1.65 2.09 N Low
608 Teleost Cheilodactylus nigripes Magpie Perch DI N 0 0 1.29 1.65 2.09 N Low
831 Teleost Engraulis australis Australian Anchovy DI N 0 0 1.29 1.88 2.27 N Low
887 Teleost Paratrachichthys macleayi Sandpaper Fish DI N 0 0 1.71 1.65 2.38 N Low
900 Teleost Hyporhamphus melanochir Southern Garfish DI N 0 0 1.43 1.88 2.36 N Low
903 Teleost Sorosichthys ananassa Little Pineapplefish DI N 0 0 1.57 1.65 2.28 N Low
916 Teleost Pseudophycis bachus Red Cod DI N 1 0 1.57 1.65 2.28 N Low
1401 Teleost Eubalichthys quadrispinis Fourspine Leatherjacket DI N 0 0 1.43 1.65 2.18 N Low
1822 Teleost Sillago bassensis School Whiting DI N 0 0 1.14 2.33 2.59 N Low
7620 Teleost Trachichthys australis Southern Roughy DI N 1 0 1.57 1.65 2.28 N Low
7644 Teleost Optivus agrammus Western Roughy DI N 1 0 1.71 1.43 2.23 N Low
7915 Teleost Cnidoglanis macrocephalus Estuary Cobbler DI N 0 0 1.71 1.65 2.38 N Low
8164 Teleost Spratelloides robustus Blue Sprat DI N 0 0 1.29 1.65 2.09 N Low
8166 Teleost Hyperlophus vittatus Sandy Sprat DI N 0 0 1.14 1.28 1.71 N Low

67
ERAEF species ID Taxa name Scientific name Common name R
ole
in f
ish
ery
Mis
sin
g >3
att
rib
ute
s (Y
/N)
Mis
sin
g p
rod
uct
ivit
y at
trib
ute
s (o
ut
of
7)
Mis
sin
g su
scep
tib
ility
att
rib
ute
s (o
ut
of
4)
Pro
du
ctiv
ity
(ad
dit
ive)
(1
=lo
w, 3
=hig
h)
Susc
epti
bili
ty (
mu
lt)
(1=l
ow
, 3=h
igh
)
2D
vu
lner
abili
ty v
alu
e (P
&S)
(lo
w-h
igh
ran
ge=1
.41
-4.2
4)
Susc
epti
bili
ty o
verr
ide
use
d?
2D
P&
S vu
lner
abili
ty c
ateg
ory
Hig
h-r
isk
cate
gory
8303 Teleost Austrolabrus maculatus Blackspotted Wrasse DI N 1 0 1.43 1.43 2.02 N Low
8326 Teleost Pictilabrus laticlavius Senator Wrasse DI N 1 0 1.57 1.65 2.28 N Low
8341 Teleost Cantheschenia longipinnis Smoothspine Leatherjacket DI N 1 0 1.43 1.65 2.18 N Low
8362 Teleost Taratretis derwentensis Derwent Flounder DI N 1 0 1.57 1.65 2.28 N Low
8413 Teleost Chelmonops curiosus Western Talma DI N 1 0 1.43 1.65 2.18 N Low
8642 Teleost Cristiceps australis Southern Crested Weedfish DI N 1 0 1.57 1.65 2.28 N Low
8683 Teleost Pempheris klunzingeri Rough Bullseye DI N 1 0 1.43 1.88 2.36 N Low
8719 Teleost Vincentia conspersa Southern Cardinalfish DI N 1 0 1.71 1.65 2.38 N Low
8875 Teleost Siphonognathus attenuatus Slender Weed Whiting DI N 2 0 1.71 1.43 2.23 N Low
8880 Teleost Siphonognathus radiatus Longray Weed Whiting DI N 2 0 1.71 1.43 2.23 N Low
8881 Teleost Siphonognathus argyrophanes Tubemouth DI N 2 0 1.86 1.65 2.48 N Low
8883 Teleost Odax acroptilus Rainbow Cale DI N 2 0 1.57 1.65 2.28 N Low
8884 Teleost Siphonognathus caninis Sharpnose Weed Whiting DI N 2 0 1.71 1.43 2.23 N Low
8971 Teleost Neoodax balteatus Little Weed Whiting DI N 2 0 1.71 1.65 2.38 N Low
8989 Teleost Vincentia macrocauda Smooth Cardinalfish DI N 1 0 1.71 1.43 2.23 N Low
9283 Teleost Leviprora inops Longhead Flathead DI N 0 0 1.14 1.65 2.01 N Low
914 Teleost Filicampus tigris Tiger Pipefish TEP N 0 0 1.43 2.33 2.73 N Med
954 Teleost Histiogamphelus cristatus Rhino Pipefish TEP N 0 0 1.43 1.65 2.18 N Low
978 Teleost Leptoichthys fistularius Brushtail Pipefish TEP N 0 0 1.57 1.65 2.28 N Low
1010 Teleost Phycodurus eques Leafy Seadragon TEP N 0 0 1.57 1.65 2.28 N Low
1011 Teleost Phyllopteryx taeniolatus Common Seadragon TEP N 0 0 1.57 1.65 2.28 N Low
1026 Teleost Stigmatopora argus Spotted Pipefish TEP N 0 0 1.43 1.65 2.18 N Low
1664 Teleost Hippocampus abdominalis Bigbelly Seahorse TEP N 0 0 1.43 1.65 2.18 N Low

68
5.1.12 Units plotted onto a PSA plot (Step 4)
The average productivity and susceptibility scores for each species are plotted on 2D plots (Fig. 15). The position of a species on the plot provides a visual reference of risk and risk relative to other species on the same plot (e.g. of the same species components or all species components). The overall risk value for a species is the Euclidean distance from the origin. In regard to productivity and susceptibility, species that lie within the upper third of the PSA plots are deemed to be at high risk (score >3.18), species within the middle third are medium risk (score 2.64-3.18), and species in the lower third are low risk (score <2.64).
Fig. 15. PSA plots for the a) target, b) by-product, c) discard, and d) TEP species components of the Spencer Gulf Prawn Fishery. The black dots represent the productivity (P) and susceptibility (S) scores of the species (where increase in dot size indicates the number of species at each P-S score combination, i.e. 1, 2-3, 4-6, or ≥7 species), and the red cross indicates the average for the species component.
The PSA output allows identification and prioritization (via ranking the overall risk scores) of the species at greatest risk, i.e. species with the lowest inherent productivity and/or highest susceptibility to fishing activities.
While productivity is unlikely to change for any given species, susceptibility can sometimes be reduced through the development of new management arrangements or strategies. Therefore, from examining the relative positions of species on PSA plots, the vertical distance from the species to the next risk category boundary (moving downwards) gives some measure of the extent of management intervention that may be required or the effect that it will need to have to reduce the susceptibility such that it moves the overall risk from one category to the next (i.e. from high to medium, or medium to low).

69
The Bighead Gurnard Perch (Neosebastes pandus) is used as an example to illustrate this point. This species was determined from the PSA to be one of the species with the highest overall risk, with productivity and susceptibility scores of 2 and 3, respectively, and an overall risk score of 3.61 (in the high risk category). A sensitivity analysis using the PSA Excel worksheet demonstrates that, by reducing any one of the risk scores of the four susceptibility attributes from 3 to 2 (e.g. reducing PCM through improved handling practices, or reducing selectivity risk score with a change in cod-end mesh type) will result in an overall risk score of medium.
5.1.13 Ranking of units by overall risk (Step 5)
The final PSA result for a species is obtained by ranking its overall risk value resulting from scoring the productivity and susceptibility attributes. Uncertainty in the PSA results can arise when there is imprecise, incorrect or missing data, where an average for a higher taxonomic group was used (e.g. for genus), or inappropriate selection of attributes. Species with missing attributes will have a more conservative overall risk value than those species with fewer missing attributes (all other attributes being equal), as the highest score for the attribute is used in the absence of data. Gathering the information to allow the attribute to be scored may reduce the overall risk value. Identification of high-risk species with missing attribute information should therefore translate into prioritisation of the additional research required.
The validity of the ranking can also be examined by comparing the results with those from other data sources or modelling approaches that have already been undertaken in specific fisheries. For example, the PSA results for any species (target, by-product, by-catch or TEP species) can be compared against catch rates or against completed stock assessments available for that species. Such comparisons should show whether the PSA ranking agrees with these other sources of information or more rigorous approaches.
The ability to score each species based on data availability varied between the attributes. In regard to the productivity attributes, fecundity data was not available for more than half of the species (54%) (Table 16). Missing data for average age-at-maturity, average maximum age and reproductive strategy ranged from 21-31% of species, while average maximum size, average size-at-maturity and trophic level data were available for almost all species. The current method of scoring the susceptibility attributes enables a value to be assigned for all species – some of these are based on reliable information, whereas others are sensible default values. The mean number of productivity and susceptibility attributes available for each species were 5.73 (82%) and 5.00 (100%), respectively (where one of the attributes for susceptibility, encounterability, was determined from two measures: benthic habitat type and bathymetric overlap). This meant that, on average, conservative scores were used 18% of the time for attributes for a species. Of the 11 productivity and susceptibility attributes, complete data sets were available for 43% of species (Table 17). For the remaining species (57%), uncertainty ranged from 1-4 missing attributes.
In situations where pairwise comparisons of attributes are strongly correlated, only one of the attributes should be included in the final PSA (Stobutzki et al. 2001). The strongest correlation among the productivity attributes was between average size-at-maturity and average maximum age, while the strongest susceptibility correlation was the negative relationship between availability and PCM (Table 18 and Table 19). Nevertheless, the partial correlations within the productivity and susceptibility attribute sets generally indicate that there was little redundancy among the attributes within each set. The low partial correlations suggest that each attribute contributes unique information to justify their inclusion in the PSA.
The mean productivity and susceptibility score for all species was 1.73 ± 0.13 (mean ± SD of scores calculated using n-1 attributes) and 1.48 ± 0.26, respectively. Attribute values, risk scores, and overall risk score/category are shown for each species in Appendix 8.3. The small variation in the mean of the boot-strapped values (using n-1 attributes) indicates that the productivity and

70
susceptibility scores are robust to elimination of a single attribute. In other words, information for a single attribute does not have a disproportionately large effect on either the productivity or susceptibility scores. Potential overall risk values (Euclidean distance on the PSA plot) range from 1-4.24 (i.e. for productivity and susceptibility score combinations of 1/1 and 3/3, respectively). The mean overall risk score for all species was 2.60, with a range of 1.71-3.61.
5.1.14 Evaluation of the PSA(Step 6)
A total of 195 species were examined using the PSA methodology. These comprised 1 target species (King prawn), 2 by-product species (Eastern Balmain Bug, Ibacus peronii, and Southern Calamari), 185 by-catch species, and 7 TEPs (all Syngnathids).
In terms of risk, 105 (54%) of the 195 species examined were assessed as low risk category, while 69 (35%) and 21 (11%) were assessed as medium and high-risk categories, respectively (Table 20).
This percentage breakdown of species into risk categories is comparable with the PSA results for the Northern Tiger Prawn Fishery, where 9%, 31% and 60% of species were classified as high, medium and low risk, respectively (the main difference, however, between the PSAs for the two fisheries is that the one for the NPF examined all species with a distribution that overlapped the fishery, whereas for the SGPF, only species that were recorded from the 2007 prawn trawl by-catch survey were assessed for risk) (Griffiths et al. 2007).
Table 16. Summary of information available on productivity and susceptibility attributes for all species examined.
Productivity attributes
Avg age-at-maturity
Avg max age Fecundity
Avg max size
Avg size-at-maturity
Reprod strategy
Trophic level (Fishbase)
Total species scores for attribute 195 195 195 195 195 195 195 n species scores with attribute unknown 58 61 106 0 0 42 1
% unknown for attribute 30% 31% 55% 0% 0% 22% 1%
Susceptibility attributes Availability Encounter-ability Selectivity PCM
Total species scores for attribute 195 195 195 195 n species scores with attribute unknown 0 0 0 189
% unknown for attribute 0% 0% 0% 97%
Table 17. Overall uncertainty distribution – frequency of missing information for the combined productivity and susceptibility attributes.
Uncertainty (no. missing attributes) Frequency %
0 83 42.6
1 44 22.6
2 13 6.7
3 42 21.5
4 13 6.7
5+ 0 0.0
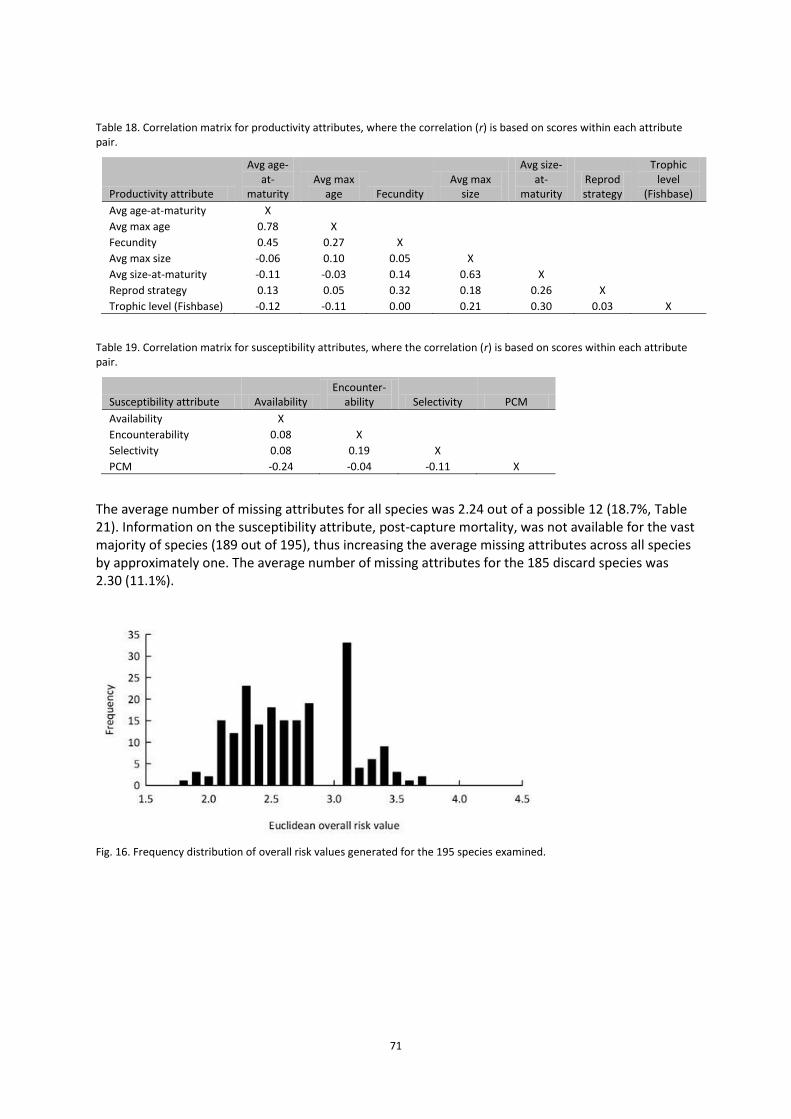
71
Table 18. Correlation matrix for productivity attributes, where the correlation (r) is based on scores within each attribute pair.
Productivity attribute
Avg age-at-
maturity Avg max
age Fecundity Avg max
size
Avg size-at-
maturity Reprod strategy
Trophic level
(Fishbase)
Avg age-at-maturity X
Avg max age 0.78 X
Fecundity 0.45 0.27 X
Avg max size -0.06 0.10 0.05 X
Avg size-at-maturity -0.11 -0.03 0.14 0.63 X
Reprod strategy 0.13 0.05 0.32 0.18 0.26 X
Trophic level (Fishbase) -0.12 -0.11 0.00 0.21 0.30 0.03 X
Table 19. Correlation matrix for susceptibility attributes, where the correlation (r) is based on scores within each attribute pair.
Susceptibility attribute Availability Encounter-
ability Selectivity PCM
Availability X
Encounterability 0.08 X
Selectivity 0.08 0.19 X
PCM -0.24 -0.04 -0.11 X
The average number of missing attributes for all species was 2.24 out of a possible 12 (18.7%, Table 21). Information on the susceptibility attribute, post-capture mortality, was not available for the vast majority of species (189 out of 195), thus increasing the average missing attributes across all species by approximately one. The average number of missing attributes for the 185 discard species was 2.30 (11.1%).
Fig. 16. Frequency distribution of overall risk values generated for the 195 species examined.
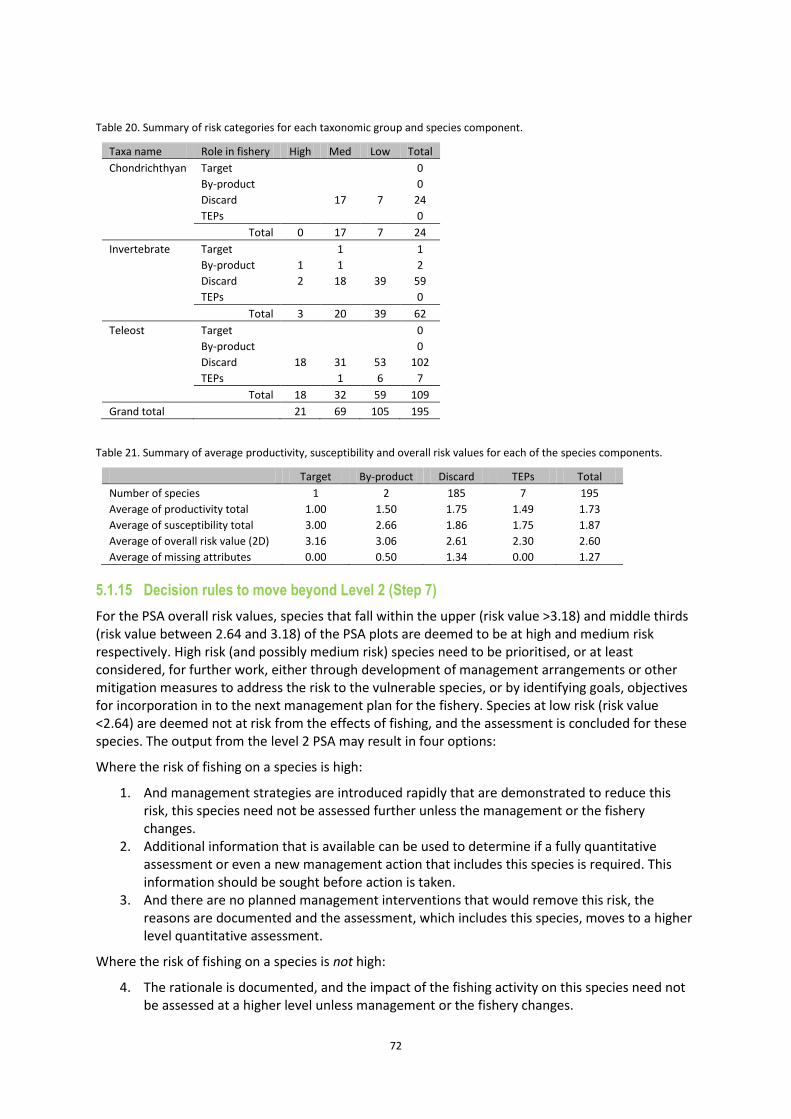
72
Table 20. Summary of risk categories for each taxonomic group and species component.
Taxa name Role in fishery High Med Low Total
Chondrichthyan Target 0
By-product 0
Discard 17 7 24
TEPs 0
Total 0 17 7 24
Invertebrate Target 1 1
By-product 1 1 2
Discard 2 18 39 59
TEPs 0
Total 3 20 39 62
Teleost Target 0
By-product 0
Discard 18 31 53 102
TEPs 1 6 7
Total 18 32 59 109
Grand total 21 69 105 195
Table 21. Summary of average productivity, susceptibility and overall risk values for each of the species components.
Target By-product Discard TEPs Total
Number of species 1 2 185 7 195
Average of productivity total 1.00 1.50 1.75 1.49 1.73
Average of susceptibility total 3.00 2.66 1.86 1.75 1.87
Average of overall risk value (2D) 3.16 3.06 2.61 2.30 2.60
Average of missing attributes 0.00 0.50 1.34 0.00 1.27
5.1.15 Decision rules to move beyond Level 2 (Step 7)
For the PSA overall risk values, species that fall within the upper (risk value >3.18) and middle thirds (risk value between 2.64 and 3.18) of the PSA plots are deemed to be at high and medium risk respectively. High risk (and possibly medium risk) species need to be prioritised, or at least considered, for further work, either through development of management arrangements or other mitigation measures to address the risk to the vulnerable species, or by identifying goals, objectives for incorporation in to the next management plan for the fishery. Species at low risk (risk value <2.64) are deemed not at risk from the effects of fishing, and the assessment is concluded for these species. The output from the level 2 PSA may result in four options:
Where the risk of fishing on a species is high:
1. And management strategies are introduced rapidly that are demonstrated to reduce this risk, this species need not be assessed further unless the management or the fishery changes.
2. Additional information that is available can be used to determine if a fully quantitative assessment or even a new management action that includes this species is required. This information should be sought before action is taken.
3. And there are no planned management interventions that would remove this risk, the reasons are documented and the assessment, which includes this species, moves to a higher level quantitative assessment.
Where the risk of fishing on a species is not high:
4. The rationale is documented, and the impact of the fishing activity on this species need not be assessed at a higher level unless management or the fishery changes.

73
5.1.16 High-risk categorization (Step 8)
Following the Level 2 PSA scoring of target, by-catch and by-product, and TEP species, the high-risk species were divided into one of five categories that highlight potential reasons for their high risk scores. These categories can help to identify areas of uncertainty and assist decisions regarding possible management responses for these species. The categories are independent and species are allocated to each category in the order of the categories presented below. Thus, while in principle a species could qualify for both Category 1 and 2, it will only appear in Category 1 because that was scored first. The five categories were programmed into the PSA Excel spreadsheets provided by Dr Hobday according to the following criteria:
High risk category: (1>3 missing attributes, 2, low overlap, 3 low S (<1.5), low P(>2.5), 4 missing spatial, 5 high still).
Category 1: Missing data (>3 missing attributes in either productivity or susceptibility estimation). Rationale: A total of more than 3 missing attributes (out of 12 possible) could lead to a change in risk score if the information became known. This is because where information is missing for an attribute, that attribute is automatically scored as high risk. The choice of 3 attributes was identified using sensitivity analysis.
Category 2: Low spatial overlap (<20% overlap between effort and the species distribution inside the fishery). Refers to the preferred availability attribute that is used to calculate susceptibility. Rationale: a cut-off of 20% has no strong rationale, other than being a low percentage overlap.
Category 3: Low susceptibility attribute score (one of the susceptibility attribute scores = 1). Rationale: these species may be scored as high risk based on productivity risk alone, even if their susceptibility is very low.
Category 4: Spatial uncertainty (no detailed distributional data available). Availability was calculated using less reliable mapping data or distributional categories (i.e. global/southern hemisphere/Australia), or stock likelihood overrides were necessary. Rationale: the absence of fine scale catch and species distribution data (e.g. TEPs) means that the substitute attribute (precautionary) was used. Spatial data should be sought for these species.
Category 5: Other: (risk score not affected by any of categories 1-4 above)
Of the 21 species assessed as high risk none of these assessments were attributed to missing data, low overlap inside the fishery, low susceptibility attribute score or spatial uncertainty categories. Therefore, other reasons were responsible for these species being at high risk from the effects of fishing by the SGPF (Table 22).
Table 22. Categorisation of species determined as high risk from the PSA and stakeholder panel discussion.
Risk category Description Total
Category 1 Missing data 0
Category 2 Low overlap inside fishery 0
Category 3 Low susceptibility attribute score 0
Category 4 Spatial uncertainty 0
Category 5 Other 21
5.1.17 Stakeholder panel assessment of PSA outcomes
Initial outcomes of the level 2 PSA scoring of target, by-catch and by-product, and TEP species identified 21 species as high risk, 69 at medium risk and 105 at low risk. A summary of the PSA assessment is provided at Table 15. Details of the PSA including all attribute scores and comments included in the PSA is provided at Appendix 8.3.

74
A stakeholder panel at workshops in February 2013 (see Appendix 8.1 for participants) considered the PSA outcomes for each of the 195 species. The stakeholder panel discussed additional information or varying views of the data that was incorporated in the attribute scores for several species.
Where there was information considered in addition to that included in the PSA, or there were strong divergent views on information used in the PSA, the stakeholder panel agreed that some lower risk species would also be included in the assessment of management arrangements to mitigate the potential risk for the purposes of identifying all potential risks. Inclusion of these lower risk species in the additional assessment was considered appropriate for the purposes of developing a new management plan for the fishery that considers all potential risks.
For 12 high risk species the stakeholder panel agreed that their actual distribution was wide and the potential for risk to these species was low. In these cases the no further assessment with respect to management arrangements was considered necessary. These species are listed in Table 23.
For a further 17 species, differences or uncertainty in information was identified by the stakeholder panel. In these cases, to ensure that any potential risk was identified, a more precautionary approach was adopted for the purposes of considering management arrangements to mitigate risk and these species were included with the high risk species for further assessment.
A summary of outcomes for these low or medium risk species agreed to be treated along with the high risk species following the stakeholder panel workshops is provided at Table 24 including the information considered.
Following a the stakeholder panel’s consideration of the PSA assessment and stakeholder opionions a total of 22 species were agreed to be assessed further for the purposes of considering management arrangements to mitigate risks. These species are provided in Table 25. In addition, Blue Swimmer Crabs (Portunus armatus) were considered to be species ‘of interest’ based on their interest to recreational and commercial fisheries and abundance in the catch. Blue Swimmer Crabs were assessed as being of medium risk in the PSA analysis, but were included with the high risk species for further consideration with regard to management strategies.
.
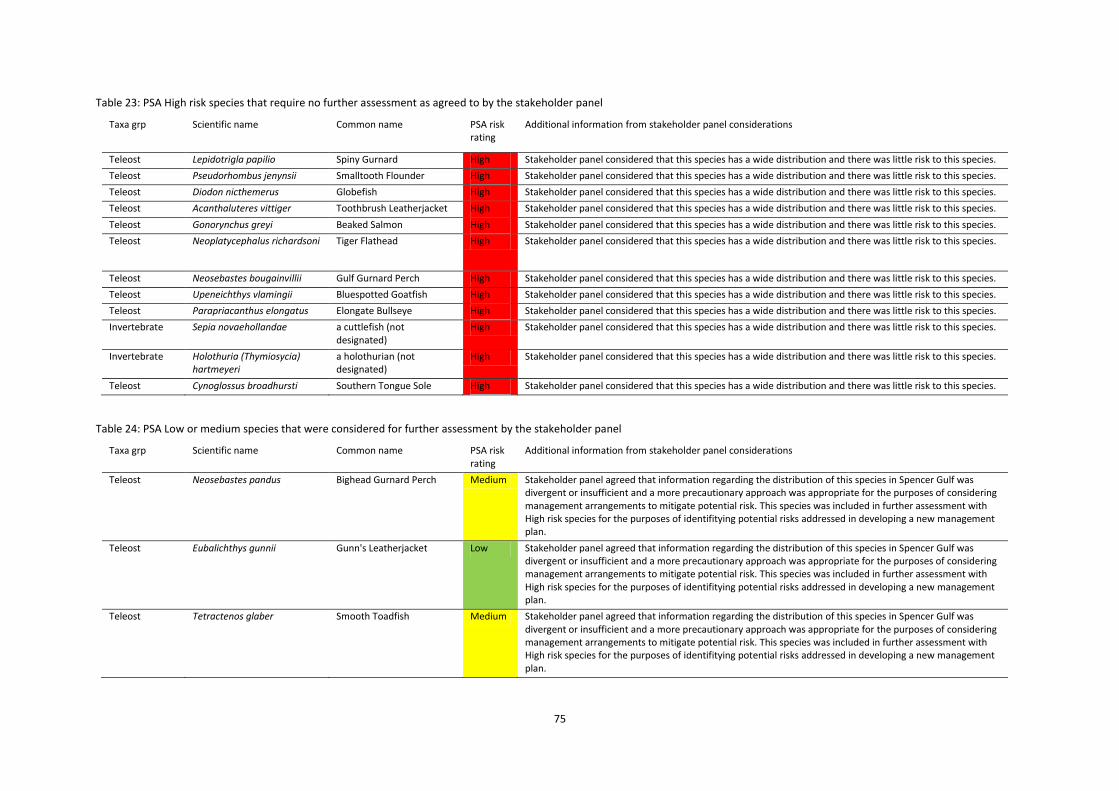
75
Table 23: PSA High risk species that require no further assessment as agreed to by the stakeholder panel
Taxa grp Scientific name Common name PSA risk rating
Additional information from stakeholder panel considerations
Teleost Lepidotrigla papilio Spiny Gurnard High Stakeholder panel considered that this species has a wide distribution and there was little risk to this species.
Teleost Pseudorhombus jenynsii Smalltooth Flounder High Stakeholder panel considered that this species has a wide distribution and there was little risk to this species.
Teleost Diodon nicthemerus Globefish High Stakeholder panel considered that this species has a wide distribution and there was little risk to this species.
Teleost Acanthaluteres vittiger Toothbrush Leatherjacket High Stakeholder panel considered that this species has a wide distribution and there was little risk to this species.
Teleost Gonorynchus greyi Beaked Salmon High Stakeholder panel considered that this species has a wide distribution and there was little risk to this species.
Teleost Neoplatycephalus richardsoni Tiger Flathead High Stakeholder panel considered that this species has a wide distribution and there was little risk to this species.
Teleost Neosebastes bougainvillii Gulf Gurnard Perch High Stakeholder panel considered that this species has a wide distribution and there was little risk to this species.
Teleost Upeneichthys vlamingii Bluespotted Goatfish High Stakeholder panel considered that this species has a wide distribution and there was little risk to this species.
Teleost Parapriacanthus elongatus Elongate Bullseye High Stakeholder panel considered that this species has a wide distribution and there was little risk to this species.
Invertebrate Sepia novaehollandae a cuttlefish (not designated)
High Stakeholder panel considered that this species has a wide distribution and there was little risk to this species.
Invertebrate Holothuria (Thymiosycia) hartmeyeri
a holothurian (not designated)
High Stakeholder panel considered that this species has a wide distribution and there was little risk to this species.
Teleost Cynoglossus broadhursti Southern Tongue Sole High Stakeholder panel considered that this species has a wide distribution and there was little risk to this species.
Table 24: PSA Low or medium species that were considered for further assessment by the stakeholder panel
Taxa grp Scientific name Common name PSA risk rating
Additional information from stakeholder panel considerations
Teleost Neosebastes pandus Bighead Gurnard Perch Medium Stakeholder panel agreed that information regarding the distribution of this species in Spencer Gulf was divergent or insufficient and a more precautionary approach was appropriate for the purposes of considering management arrangements to mitigate potential risk. This species was included in further assessment with High risk species for the purposes of identifitying potential risks addressed in developing a new management plan.
Teleost Eubalichthys gunnii Gunn's Leatherjacket Low Stakeholder panel agreed that information regarding the distribution of this species in Spencer Gulf was divergent or insufficient and a more precautionary approach was appropriate for the purposes of considering management arrangements to mitigate potential risk. This species was included in further assessment with High risk species for the purposes of identifitying potential risks addressed in developing a new management plan.
Teleost Tetractenos glaber Smooth Toadfish Medium Stakeholder panel agreed that information regarding the distribution of this species in Spencer Gulf was divergent or insufficient and a more precautionary approach was appropriate for the purposes of considering management arrangements to mitigate potential risk. This species was included in further assessment with High risk species for the purposes of identifitying potential risks addressed in developing a new management plan.

76
Chondrichthyan Aptychotrema vincentiana Western Shovelnose Ray Medium Stakeholder panel agreed that information regarding the distribution of this species in Spencer Gulf was divergent or insufficient and a more precautionary approach was appropriate for the purposes of considering management arrangements to mitigate potential risk. This species was included in further assessment with High risk species for the purposes of identifitying potential risks addressed in developing a new management plan.
Teleost Sorosichthys ananassa Little Pineapplefish Low Stakeholder panel agreed that information regarding the distribution of this species in Spencer Gulf was divergent or insufficient and a more precautionary approach was appropriate for the purposes of considering management arrangements to mitigate potential risk. This species was included in further assessment with High risk species for the purposes of identifitying potential risks addressed in developing a new management plan.
Teleost Filicampus tigris Tiger Pipefish Medium Spencer Gulf population of this species is a relic of its broader tropical distribution (J Brooks pers comm.). A more precautionary approach was appropriate for the purposes of considering management arrangements to mitigate potential risk. This species was included in further assessment with High risk species for the purposes of identifitying potential risks addressed in developing a new management plan.
Teleost Histiogamphelus cristatus Rhino Pipefish Low Stakeholder panel agreed that information regarding the distribution of this species in Spencer Gulf was divergent or insufficient and a more precautionary approach was appropriate for the purposes of considering management arrangements to mitigate potential risk. This species was included in further assessment with High risk species for the purposes of identifitying potential risks addressed in developing a new management plan.
Chondrichthyan Dipturus whitleyi Melbourne Skate Medium Stakeholder panel agreed that information regarding the distribution of this species in Spencer Gulf was divergent or insufficient and a more precautionary approach was appropriate for the purposes of considering management arrangements to mitigate potential risk. This species was included in further assessment with High risk species for the purposes of identifitying potential risks addressed in developing a new management plan.
Teleost Eubalichthys quadrispinis Fourspine Leatherjacket Low Stakeholder panel agreed that information regarding the distribution of this species in Spencer Gulf was divergent or insufficient and a more precautionary approach was appropriate for the purposes of considering management arrangements to mitigate potential risk. This species was included in further assessment with High risk species for the purposes of identifitying potential risks addressed in developing a new management plan.
Teleost Rhycherus filamentosus Tasselled Anglerfish Medium Stakeholder panel agreed that information regarding the distribution of this species in Spencer Gulf was divergent or insufficient and a more precautionary approach was appropriate for the purposes of considering management arrangements to mitigate potential risk. This species was included in further assessment with High risk species for the purposes of identifitying potential risks addressed in developing a new management plan.
Chondrichthyan Urolophus orarius Coastal Stingaree Low Stakeholder panel agreed to consider the listing of this species on the IUCN red list in addition to limited information on the distribution of the species in Spencer Gulf. A precautionary approach was adopted and this species was included in further assessment with High risk species for the purposes of identifitying potential risks addressed in developing a new management plan.
Invertebrate Sepia apama Giant Cuttlefish Medium Stakeholder panel agreed to consider unpublished information that the population of Giant Cuttlefish in the northern Spencer Gulf may be genetically distinct (de Vries et al. in prep) and has declined in abundance in this area since the 2007 by-catch survey. A precautionary approach was adopted and this species was

77
included in further assessment with High risk species for the purposes of identifitying potential risks addressed in developing a new management plan.
Invertebrate Zoila friendii thersites Black Cowry Medium Stakeholder panel agreed that information regarding the distribution of this species in Spencer Gulf was divergent or insufficient and a more precautionary approach was appropriate for the purposes of considering management arrangements to mitigate potential risk. This species was included in further assessment with High risk species for the purposes of identifitying potential risks addressed in developing a new management plan.
Teleost Optivus agrammus Western Roughy
Low Stakeholder panel discussed information regarding the distribution of this species in Spencer Gulf and if a more precautionary level of risk rating be considered. The panel agreed however that no further assessment was required.
Teleost Vincentia macrocauda
Smooth Cardinalfish
Low Stakeholder panel discussed information regarding the distribution of this species in Spencer Gulf and if a more precautionary level of risk rating be considered. The panel agreed however that no further assessment was required.
Invertebrate Cymatiella verrucosa
a triton shell (not designated)
Low Stakeholder panel discussed information regarding the distribution of this species in Spencer Gulf and if a more precautionary level of risk rating be considered. The panel agreed however that no further assessment was required.
Invertebrate Goniodiscaster seriatus a seastar (not designated Low Stakeholder panel discussed information regarding the distribution of this species in Spencer Gulf and if a more precautionary level of risk rating be considered. The panel agreed however that no further assessment was required.

78
Table 25: Final species list for consideration of management arrangements following stakeholder panel’s meeting
Taxa name Scientific name Common name PSA Risk Rating
Stakeholder panel request for additional assesment
Invertebrate Sepioteuthis australis Southern Calamari High
Chondrichthyan Aptychotrema vincentiana
Western Shovelnose Ray
Medium Yes
Chondrichthyan Dipturus whitleyi Melbourne Skate Medium Yes
Chondrichthyan Urolophus orarius Coastal Stingaree Low Yes
Invertebrate Sepia apama Giant Cuttlefish Medium Yes
Invertebrate Zoila friendii thersites
Black Cowry Medium Yes
Teleost Repomucenus calcaratus
Spotted Dragonet High
Teleost Thamnaconus degeni Bluefin Leatherjacket
High
Teleost Neosebastes pandus Bighead Gurnard Perch
Medium Yes
Teleost Sillaginodes punctata King George Whiting
High
Teleost Pseudocaranx wrighti
Skipjack Trevally High
Teleost Parequula melbournensis
Silverbelly High
Teleost Pagrus auratus Snapper High
Teleost Foetorepus calauropomus
Common Stinkfish High
Teleost Scobinichthys granulatus
Rough Leatherjacket
High
Teleost Eubalichthys gunnii Gunn's Leatherjacket
Low Yes
Teleost Tetractenos glaber Smooth Toadfish Medium Yes
Teleost Sorosichthys ananassa
Little Pineapplefish
Low Yes
Teleost Eubalichthys quadrispinis
Fourspine Leatherjacket
Low Yes
Teleost Rhycherus filamentosus
Tasselled Anglerfish
Medium Yes
Teleost Filicampus tigris Tiger Pipefish Medium Yes
Teleost Histiogamphelus cristatus
Rhino Pipefish Low yes
5.1.18 Discussion of High Risk Species and Species of Interest (Step 8)
The outcome of the stakeholder panel assessment of the PSA resulted in 22 species being considered as high risk or requiring additional assessment for the purposes of developing a new management plan. These 22 species comprised three invertebrates, three chondrichthys and 16 teleosts. In addition, Blue swimmer crabs were considered a species of interest due to their high

79
abundance in the by-catch and being an important commercial and recreational fishery in their own right. The management arrangements for these 23 species were assessed by the stakeholder panel to ascertain if management arrangements were adequate or further arrangements/strategies were required. The findings of the stakeholder panel are provided here.
Southern Calamari
Despite a mix of low and medium risk scores across the attributes for productivity of Southern Calamari, all attributes for susceptibility were scored as high risk, which was enough for this species to be placed in the overall high-risk category. In a recent assessment of by-product in the SGPF, Roberts and Steer (2010) estimated that the trawling fleet catches appreciable quantities of Southern Calamari (up to ~90 t) over the fishing season, yet it does not appear to compromise the sustainable harvest of this species. This also appears to be the case in the multi-species Marine Scalefish Fishery, which share the resource with the commercial prawn fishers but predominantly target mature Southern Calamari on the inshore spawning grounds, as long-term trends in catch have remained relatively stable (>270 t) since the early 1990s (Fowler et al. 2009). Based on the long-term stability of catches, Roberts and Steer (2010) suggested that additional management measures in the SGPF would unlikely result in improving the sustainable harvest of this species.
The stakeholder panel agreed that the SGPF does not impact the sustainability of the species and no further management strategies are required.
By-Catch species
Snapper (Pagrus auratus) – Snapper are reported to be widely distributed throughout temperate waters from Queensland to Western Australia (Gomon et al. 2008). A full stock assessment of snapper in South Australia is conducted regularly and therefore monitoring of the species is considered adequate. The stakeholder panel workshop in February 2013 noted that snapper made up a small component of the trawl by-catch and the majority of these were juveniles. Industry indicated that snapper were mostly caught around nursery grounds in the northern gulf and are, therefore, protected by the Broughton and Wardang fishery closures. The stakeholder panel agreed that the SGPF does not impact the sustainability of the species and no further management strategies were required.
King George Whiting (Sallaginodes punctata) – King George Whiting are reported to be widely distributed throughout temperate waters from central New South Wales to Perth (Gomon et al. 2008). A full stock assessment of King George Whiting in South Australia is conducted regularly and, therefore, monitoring of the species is adequate. Juveniles of the species are mainly found around northern are of the Gulf and are therefore protected by the Broughton and Wardang fishery closures. The stakeholder panel agreed that the SGPF does not impact the sustainability of the species and no further management strategies were required.
Bluefin leatherjacket (Thamnaconus degeni), Skipjack Trevally (Pseudocaranx wrighti), Rough Leatherjacket (Scobinichthys granulatus) Silverbelly (Parequula melbournensis), Spotted Dragonet (Repomucenus calcaratus), Common Stinkfish (Foetorepus calauropomus). These species were collectively considered to be high abundance, scavenger species that thrive on disturbed habitat such as trawl grounds, hence their high abundance in trawl by-catch. The stakeholder panel agreed that the SGPF does not impact the sustainability of these species and no further management strategies were required.
Melbourne Skate (Dipturus whitleyi), Western Shovelnose Ray (Aptychotrema vincentiana), Smooth Toadfish (Tetractenos glaber) Black Cowry (Zoila friendii thersites) were collectively considered by the stakeholder panel to have high rates of survival on release from prawn trawlers. The stakeholder panel agreed that the SGPF does not impact the sustainability of these species and no further management strategies were required. In addition, Black Cowry was identified through the PSA as

80
missing data for over three attributes used to determine its risk rating. If information becomes available for this species, the risk rating may be decreased.
Gunn’s Leatherjacket (Eubalichthys gunnii) and Tasselled Angelfish (Rhycherus filamentosus) are considered to be a reef species (Gomon et al. 2008) and therefore the stakeholder panel considered that there would be limited overlap with the trawl fishery which actively avoids reefs. The stakeholder panel agreed that the SGPF does not impact the sustainability of these species and no further management strategies were required. In addition, Tasselled Angelfish had data missing for over three attributes used to determine its risk rating. If information becomes available for this species, the risk rating may be decreased.
Fourspine leatherjacket (Eubalichthys quadrispinis) are deep water fish (Gomon et al.2008) and were recorded in very low abundance in the trawl by-catch study (Currie et al.2009). The stakeholder panel agreed that the SGPF does not impact the sustainability of the species and no further management strategies were required.
Bighead Gurnard Perch (Neosebastes pandus) are distributed on or near rocky reefs and are more common at depths greater than 50m (Gomon et al. 2008). The stakeholder panel agreed that the SGPF does not impact the sustainability of this species given its distribution and no further management strategies were required. This species had data missing for over three attributes used to determine risk rating. If information becomes available for this species, the risk rating may be decreased.
The Little Pineapple Fish (Sorosichthys ananassa) have not previously been recorded in South Australia, and therefore considered to be in low abundance in Spencer Gulf. These are reported as deep water fish (40 - 150m) and it was considered by the stakeholder panel that there would be limited overlap with the fishery. The stakeholder panel agreed that the SGPF does not impact the sustainability of this species given its overlap with the fishery and no further management strategies were required.
Distribution of Coastal Stingaree (Urolophus orarius) is limited to South Australia, including Spencer Gulf and Gulf St Vincent at depths of 20-50m (Gomon et al. 2008). Urolophus genus is characterised by long gestation periods, relatively late sexual maturity and producing few young with a propensity to abort if stressed. The stakeholder panel agreed that this species was recognised at being at risk from trawling. It was agreed by the stakeholder panel that further monitoring of interactions of the fishery with this species would inform future risk assessments.
Giant Cuttlefish (Sepia apama) were initially assessed in the PSA process as being of medium risk based on its distribution throughout temperate Australian coastline. However, more recent unpublished information indicates that the population in the northern Spencer Gulf may be genetically distinct (de Vries et al. in prep) and has declined in abundance in this area since the 2007 by-catch survey. In taking a precautionary approach in consideration of this information, the stakeholder panel agreed treat this species as a high risk species in recognition of the concerns related to cuttlefish in the Northern part of the Gulf only (north of Wallaroo). It was agreed that the consideration of this species risk classification was driven predominantly by concerns for the northern area and could be addressed by mitigation activities in the northern area.
It was noted that there is some difficulty in correctly identifying smaller individuals of S. apama from S. Novaehollandae resulting in some missreporting of by-catch of S. apama in previous studies. Recent information of declines in numbers of individuals of S. apama in spawning aggregations in northern Spencer Gulf has highlighted the need to protect the stocks of S apama, particularly if these are of a different species. The stakeholder panel acknowledged the risk to this species in the northern Gulf. It was agreed that development of handling/release methods for this species in northern areas that increase post capture survival could reduce the potential risk to this species. The panel also agreed that increased data on the distribution of the population of S. Apama (and/or a

81
separate species) may inform future PSA for this species. The outcomes of current research on Giant Cuttlefish in progress with assistance from the Spencer Gulf Prawn Fishing industry will assist in informating future these assessments.
An independent expert review of the draft ESD risk assessment outcomes suggested that data on fishery by-catch be augmented from observer data of by-catch during regular Fishery Independent Surveys. For the Giant Cuttlefish, it also suggested that the use of by-catch reduction devices such as grids in the fishery be further investigating through extending the work previously conducted in the fishery with T-90 nets and grids. TEP species
Seven of the 195 species collected from the 2007 prawn trawl by-catch survey (and examined in this report) are listed marine species under section 248 of the Commonwealth’s EPBC Act as threatened, endangered or protected. All seven species belong to the family Syngnathidae, which comprises seahorses, seadragons and pipefish and are protected under the South Australian Fisheries Management Act 2007.
All but two of the syngnathid species were classified as low risk, largely owing to the low risk scores for the productivity attributes (i.e. high productivity) and the low risk for % overlap with the fishery (for availability). Two species, the Tiger Pipefish, (Filicampus tigris), and Rhino Pipefish, (Histiogamphelus cristatus) were considered for further assessment along with high risk species due to information regarding the distribution of these species in Spencer Gulf was divergent or insufficient and the stakeholder panel agreed that a more precautionary approach was appropriate. These two lower risk species were included in the assessment of management arrangements that may mitigate any potential risk. Inclusion of these lower risk species in the assessment was considered appropriate for the purposes of developing a new management plan for the fishery that considers all potential risks.
The most abundant species of Syngnathid from the survey was Common Seadragon (Phyllopteryx taeniolatus), followed by Leafy Seadragon (Phycodurus eques) and Bigbelly Seahorse (Hippocampus abdominalis) (Currie et al. 2009). South Australian Museum records indicate that 11 other syngnathid species (not found in the survey) have been recorded in Spencer Gulf.
Currie et al. (2009) suggested that due to lack of precise information it is difficult to determine the ecological consequence for syngnathid interactions with trawling. It is likely that many syngnathids are returned to the water alive but their subsequent fate is uncertain. Nevertheless, the Management Committee of the SGWCPFA has been proactive in voluntarily closing areas known or likely to include preferred habitat of syngnathids, and have advised PIRSA that an increase in the size of the closure at Wardang to further protect syngnathids has taken place voluntarily.
Rhino Pipefish (Histiogamphelus cristatus) is distributed widely from Western Australia through to South Australia’s Spencer Gulf and Gulf St Vincent associated with sea weed(Gomon et al. 2008) There was only one individual recorded in the by-catch survey which occurred in the Wardang closure area (Currie et al. 2009). The stakeholder panel agreed that the SGPF does not impact the sustainability of the species and no further management strategies were required.
Tiger Pipefish (Filicampus tigris) is distributed throughout the subtropics from Queensland to northern Western Australia, and Spencer Gulf and Gulf St Vincent (Gomon et al. 2008). The South Australian gulf populations are a tropic relic of more widespread distribution of this species. The stakeholder panel agreed that this species required further consideration of current management arrangements. The stakeholder panel agreed that further risk mitigation strategies should be investigated in conjunction with those developed for other syngnathids. Information on post capture mortality, or introduction of strategies that increase survival of tiger pipefish (and other syngnathids) is considered likely to reduce the level of risk.

82
Species of Interest
Blue Swimmer Crabs (Medium Risk) – are widely distributed throughout Australia and are in high abundance in Spencer Gulf and other areas of South Australia. The status of the Blue Crab stocks in South Australia is formally assessed regularly as part of the management of the fishery and has been assessed as sustainable. A number of mitigation methods are in place to reduce impacts of prawn trawling on blue crabs including use of crab bags and hopper systems that increase survivorship of released crabs. The industry is also actively investigating the use of gear that reduces crab by-catch (T-90 cod ends with grids). The stakeholder panel agreed that the SGPF does not impact the sustainability of the species and no further management strategies were required.
6 References
Braccini, M., Van Rijn, J. & Frick, L. (2012). High post-capture survival for sharks, rays and chimaeras discarded in the main shark fishery of Australia? PLoS ONE 7(2), e32547.
Bryars, S.R., Havenhand, J.N., (2006). Effects of constant and varying temperatures on the development of blue swimmer crab (Portunus pelagicus) larvae: laboratory observations and field predictions for temperate coastal waters. J. Exp. Mar. Biol. Ecol. 329, 218-229.
Carrick, N. A. (2003) Spencer Gulf Prawn (Melicertus latisulcatus) Fishery. Fishery assessment report to PIRSA. SARDI Aquatic Sciences RD03/0079-2.
Carrick, N.A. (1982) Spencer gulf prawn fishery – surveys increase our knowledge. SAFIC vol 6(1) pp 3-32.
Carrick, N.A. (1996) Key factors which affect prawn recruitment and implications to harvesting prawn stocks. Final report FRDC 91/3.
Courtney A.J. and Dredge M.C.L. (1988) Female reproductive biology and spawning periodicity of two species of king prawns, Penaeus longistylus Kubo and Penaeus latisulcatus Kishinouye, from Queensland’s east coast fishery. Aust. J. Mar. Freshwater Res. 39: 729–741.
Currie, D. R., Dixon, C. D., Roberts, S. D., Hooper, G. E., Sorokin, S. J. & Ward, T. M. (2009). Fishery-independent by-catch survey to inform risk assessment of the Spencer Gulf Prawn Trawl Fishery. Report to PIRSA Fisheries. South Australian Research and Development Institute (Aquatic Sciences), Adelaide. SARDI Publication No. F2009/000369-1. SARDI Research Report Series No. 390.
DEH (2004). Assessment of the South Australian Spencer Gulf Prawn Fishery, Gulf St Vincent Prawn Fishery and West Coast Prawn Fishery. Assessment report prepared for the purposes of Parts 13 and 13(A) of the Environment Protection and Biodiversity Conservation Act 1999.
DEWHA (2009). Assessment of the South Australian Prawn Trawl Fishery. Assessment report prepared for the purposes of Parts 13 and 13(A) of the Environment Protection and Biodiversity Conservation Act 1999.
de Vries M., Gillanders B.M. and Donnellan S. The world’s largest cuttlefish is a population complex, with one population breeding only in the world’s densest cephalopod annual aggregation. Manuscript in preparation.
Dixon, C. D., Hooper, G. E. & Burch, P. (2012). Spencer Gulf Prawn Penaeus (Melicertus) latisulcatus Fishery 2010/11. Fishery assessment report to PIRSA Fisheries and Aquaculture. South Australian Research and Development Institute (Aquatic Sciences), Adelaide. SARDI Publication No. F2007/000770-5. SARDI Research Report Series No. 603.
Dixon C. D. & Sloan, S. (2007). Management plan for the South Australian Spencer Gulf Prawn Fishery. The South Australian Fisheries Management Series. Paper No. 54.

83
EconSearch (2011a). Economic indicators for the Spencer Gulf and West Coast Prawn fisheries, 2009/10. A report prepared for Primary Industries and Resources South Australia.
EconSearch (2011b) Economic indicators for the Commercial Fisheries of South Australia Summary Report, 2009/10. A report prepared for Primary Industries and Resources South Australia.
EconSearch (2012). Preliminary economic indicators for the Spencer Gulf and West Coast Prawn fisheries, 2010/11. A report prepared for Primary Industries and Regions South Australia.
Enever, R., Catchpole, T. L., Ellis, J. R. & Grant, A. (2009). The survival of skates (Rajidae) caught by demersal trawlers in UK waters. Fisheries Research 97, 72-76.
Fletcher, W. J., Chesson, J., Fisher, M., Sainsbury, K. J., Hundloe, T., Smith, A. D. M. & Whitworth, B. (2002). National ESD reporting framework for Australian fisheries: the ‘how to’ guide for wild capture fisheries. FRDC Project 2000/145. Fisheries Research and Development Corporation, Canberra.
Fletcher, W. J., Sainsbury, K. J., Fisher, M. & Hundloe, T. (2005). A flexible and practical framework for reporting on ecologically sustainable development for wild capture fisheries. Fisheries Research 71, 175–183.
Fowler A. J., McGarvey R., Steer M. A. & Feenstra J. E. (2009). The South Australian Marine Scalefish Fishery stock status report. SARDI Publication Number F2007/000565-4.
Gillett, R. (2008). Global study of shrimp fisheries. FAO Fisheries Technical Paper. No. 475. Rome, FAO.
Gomon, M. F., Bray, D. J. & Kuiter, R. H. (2008). Fishes of Australia’s Southern Coast. Reed New Holland, Chatswood NSW.
Grey, D. L., Dall, W. & Baker, A. (1983). A Guide to the Australian Penaeid Prawns. Department of Primary Production of the Northern Territory, Darwin, Australia.
Griffiths, S., Kenyon, R., Bulman, C., Dowdney, J., Williams, A., Sporcic, M. & Fuller, M. (2007). Ecological risk assessment for the effects of fishing: report for the Northern Prawn Fishery. Report for the Australian Fisheries Management Authority, Canberra.
Hill, B. J. & Wassenberg, T. J. (1990). Fate of discards from prawn trawlers in Torres Strait. Australian Journal of Marine and Freshwater Research 41, 53-64.
Hobday, A.J., Smith, A.D.M., Webb, H., Daley, R., Wayte, S., Bulman, C., Dowdney, J., Williams, A., Sporcic, M., Dambacher, J., Fuller, M., Walker, T., (2007). Ecological Risk Assessment for the Effects of Fishing: Methodology. Report R04/1072 for the Australian Fisheries Management Authority, Canberra.
Hobday, A. J., Smith, A. D. M., Stobutzki, I. C., Bulman, C., Daley, R., Dambacher, J. M., Deng, R. A., Dowdney, J., Fuller, M., Furlani, D., Griffiths, S. P., Johnson, D., Kenyon, R., Knuckey, I. A., Ling, S. D., Pitcher, R., Sainsbury, K. J., Sporcic, M., Smith, T., Turnbull, C., Walker, T. I., Wayte, S. E., Webb, H., Williams, A., Wise, B. S. & Zhou, S. (2011). Ecological risk assessment for the effects of fishing. Fisheries Research 108, 372–384.
Jackson, C.J., Burford, M.A., (2003). The effects of temperature and salinity on growth and survival of larval shrimp Penaeus semisulcatus (Decapoda: Penaeoidea). J. Crust. Biol. 23(4), 819-826.
King M.G. (1977) The biology of the western king prawn Penaeus latisulcatus Kishinouye and aspects of the fishery in South Australia. MSc Thesis, University of Adelaide.
Knight, M.A. and Tsolos, A. (2012). South Australian Wild Fisheries Information and Statistics Report 2010/11. South Australian Research and Development Institute (Aquatic Science), Adelaide. SARDI Publication No. F2008/000804-4. SARDI Research Report Series No. 612. 57pp.

84
Lober, M., Zeng, C., (2009). Effect of microalgae concentration on larval survival, development and growth of an Australian strain of giant freshwater prawn Macrobrachium rosenbergii. Aquaculture 289, 95-100.
MacDonald, N. (1998). Management plan for the Spencer Gulf and West Coast prawn fisheries. Primary Industries and Resources, South Australia. Internal document.
Moody Marine (2011). MSC assessment report for Spencer Gulf Prawn (Penaeus (Melicertus) latisulcatus) Fishery. Version: 5 Public Certification Report, Ref: 82110 v5.
Nunes R. and Lennon G. (1986) Physical property distributions and seasonal trends in Spencer Gulf, South Australia: an inverse estuary. Aust. J. Mar. Freshwater Res. 37: 39–53.
Potter, I.C., Manning, R.J.G. and Loneragan, N.R. (1991) Size, movements, distribution and gonadal stage of the western king prawn (Penaeus latisulcatus) in a temperate estuary and local marine waters. J. Zool., Lond. 223: 419-445.
Penn, J.W. (1980) Spawning and fecundity of the western king prawn, Penaeus latisulcatus Kishinouye, in Western Australian waters. Aust. J. Mar. Freshwater Res. 31: 21-35.
Penn, J.W., Hall, N.G. and Caputi, N. (1988) Resource assessment and management perspectives of the Penaeid prawn fisheries of Western Australia. In: J. Caddy (Ed) The scientific basis of Shellfish Management. John Wiley and Sons, New York.
Preston, N., (1985). The combined effects of temperature and salinity on hatching success and the survival, growth and development of the larval stages of Metapenaeus bennettae (Racek and Dall). J. Exp. Mar. Biol. Ecol. 85, 57-74.
Primavera, J.H. and Lebata, M.J.H.L. (2000) Size and diel differences in activity patterns of Metapenaeus ensis, Penaeus latisulcatus and P. merguiensis. Mar. Fresh. Behav. Physiol. 33: 173-185.
Rasheed, M.A. and Bull, C.M. (1992) Behaviour of the Western king prawn, Penaeus latisulcatus Kishinouye: Effect of food dispersion and crowding. Aust. J. Mar. Freshwater Res. 43: 745-752.
Roberts, S. D. & Steer, M. A. (2010). By-product assessment in the Spencer Gulf Prawn Fishery with an emphasis on developing management options for Balmain bugs. South Australian Research and Development Institute (Aquatic Sciences), Adelaide. SARDI Publication No. F2010/000165-1. SARDI Research Report Series No. 439.
Roberts, S.D., Dixon, C.D. & Andreacchio, L. (2012) Temperature dependent larval duration and survival of the western king prawn, Penaeus (Melicertus) latisulcatus Kishinouye, from Spencer Gulf, South Australia. J. Exp. Mar. Biol. Ecol. 411, 14-22.
Sang H.M. and Fotedar R. (2004) Growth, survival, haemolymph osmolality and organosomatic indices of the western king prawn (Penaeus latisulcatus Kishinouye, 1896) reared at different salinities. Aquaculture 234: 601–614. Stobutzki, I. C., Miller, M. J. & Brewer, D. T. (2001). Sustainability of fishery bycatch: a process for assessing highly diverse and numerous bycatch. Environmental Conservation 28, 167–181.
Stobutzki, I. C., Miller, M. J., Heales, D. S. & Brewer, D. T. (2002). Sustainability of elasmobranchs caught as bycatch in a tropical prawn (shrimp) trawl fishery. Fishery Bulletin 100, 800-821.
Sluczanowski, P. (1980) The modelling and optimal control of the Spencer Gulf Prawn Fishery. PhD thesis, Imperial College, London, 1-237. Svane, I., Rodda, K. & Thomas, P. (2007). Prawn fishery by-catch and discards: marine ecosystem analysis – population effects. FRDC Project No. 2003/023. Fisheries Research and Development Corporation, Canberra. SARDI Aquatic Sciences Publication No. RD 03-0132. SARDI Research Report Series No. 199.

85
Tanner, J.E. and Deakin, S. (2001) Active habitat selection for sand by juvenile western king prawns, Melicertus latisulcatus (Kishinouye). J. Exp. Mar. Biol. Ecol. 261: 199-209.
7 Glossary
Component– A major area of relevance to the fishery with respect to ESD (e.g. target species, by-catch, marine environment, employment, income). A sub-component is a sub-division of a component.
Component Tree – are used to assist identification of potential risks to the fishery in each of the components of a fishery in a comprehensive and structured manner. Trees are expanded or contracted by addition or removal of sub-components as required.
Ecological Sustainable Development – comprises the use, conservation, development and enhancement of the aquatic resources of the State in a way, and at a rate, that will enable people and communities to provide for their economic, social and physical well-being while sustaining the potential of aquatic resources of the State to meet the reasonable foreseeable needs of future generations; and safeguarding the life-supporting capacity of the aquatic resources of the State; and avoiding, remedying or mitigating adverse effects of activities on the aquatic resources of the State.
PSA – Productivity Susceptibility Analysis. Semi-quantitative assessment method that relies on life history characteristics of the stock and its susceptibility to the fishery.
Risk - being a chance of something going wrong, or a hazard.
Risk analysis - consideration of the sources of risk (being a chance of something going wrong, or a hazard), their consequences and the likelihood that those consequences may occur (AS/NZS 4360 – 1999).
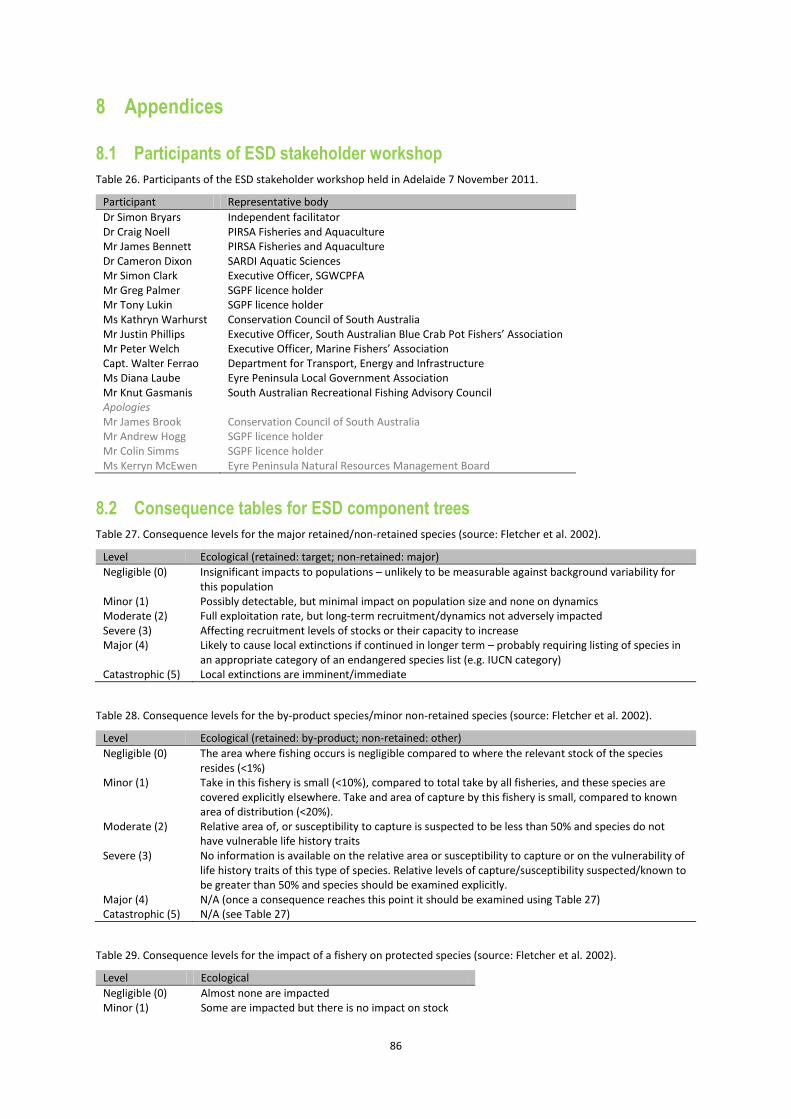
86
8 Appendices
8.1 Participants of ESD stakeholder workshop
Table 26. Participants of the ESD stakeholder workshop held in Adelaide 7 November 2011.
Participant Representative body
Dr Simon Bryars Independent facilitator Dr Craig Noell PIRSA Fisheries and Aquaculture Mr James Bennett PIRSA Fisheries and Aquaculture Dr Cameron Dixon SARDI Aquatic Sciences Mr Simon Clark Executive Officer, SGWCPFA Mr Greg Palmer SGPF licence holder Mr Tony Lukin SGPF licence holder Ms Kathryn Warhurst Conservation Council of South Australia Mr Justin Phillips Executive Officer, South Australian Blue Crab Pot Fishers’ Association Mr Peter Welch Executive Officer, Marine Fishers’ Association Capt. Walter Ferrao Department for Transport, Energy and Infrastructure Ms Diana Laube Eyre Peninsula Local Government Association Mr Knut Gasmanis South Australian Recreational Fishing Advisory Council Apologies Mr James Brook Conservation Council of South Australia Mr Andrew Hogg SGPF licence holder Mr Colin Simms SGPF licence holder Ms Kerryn McEwen Eyre Peninsula Natural Resources Management Board
8.2 Consequence tables for ESD component trees
Table 27. Consequence levels for the major retained/non-retained species (source: Fletcher et al. 2002).
Level Ecological (retained: target; non-retained: major)
Negligible (0) Insignificant impacts to populations – unlikely to be measurable against background variability for this population
Minor (1) Possibly detectable, but minimal impact on population size and none on dynamics Moderate (2) Full exploitation rate, but long-term recruitment/dynamics not adversely impacted Severe (3) Affecting recruitment levels of stocks or their capacity to increase Major (4) Likely to cause local extinctions if continued in longer term – probably requiring listing of species in
an appropriate category of an endangered species list (e.g. IUCN category) Catastrophic (5) Local extinctions are imminent/immediate
Table 28. Consequence levels for the by-product species/minor non-retained species (source: Fletcher et al. 2002).
Level Ecological (retained: by-product; non-retained: other)
Negligible (0) The area where fishing occurs is negligible compared to where the relevant stock of the species resides (<1%)
Minor (1) Take in this fishery is small (<10%), compared to total take by all fisheries, and these species are covered explicitly elsewhere. Take and area of capture by this fishery is small, compared to known area of distribution (<20%).
Moderate (2) Relative area of, or susceptibility to capture is suspected to be less than 50% and species do not have vulnerable life history traits
Severe (3) No information is available on the relative area or susceptibility to capture or on the vulnerability of life history traits of this type of species. Relative levels of capture/susceptibility suspected/known to be greater than 50% and species should be examined explicitly.
Major (4) N/A (once a consequence reaches this point it should be examined using Table 27) Catastrophic (5) N/A (see Table 27)
Table 29. Consequence levels for the impact of a fishery on protected species (source: Fletcher et al. 2002).
Level Ecological
Negligible (0) Almost none are impacted Minor (1) Some are impacted but there is no impact on stock

87
Moderate (2) Levels of impact are at the maximum acceptable level Severe (3) Same as target species Major (4) Same as target species Catastrophic (5) Same as target species
Table 30. Consequence levels for the impacts of a fishery on habitats (source: Fletcher et al. 2002).
Level Ecological (habitat)
Negligible (0) Insignificant impacts to habitat or populations of species making up the habitat – probably not measurable levels of impact. Activity only occurs in very small areas of the habitat, or if larger area is used, the impact on the habitats from the activity is unlikely to be measurable against background variability. (Suggestion – these could be activities that affect <1% of original area of habitat or, if operating on a larger area, have virtually no direct impact)
Minor (1) Measurable impacts on habitat(s) but these are very localised compared to total habitat area. (Suggestion – these impacts could be <5% of the original area of habitat)
Moderate (2) There are likely to be more widespread impacts on the habitat but the levels are still considerable acceptable given the percentage area affected, the types of impact occurring and the recovery capacity of the habitat. (Suggestion – for impact on non-fragile habitats this may be up to 50% [similar to population dynamics theory], but for more fragile habitats, to stay in this category the percentage area affected may need to be smaller, e.g. 20%)
Severe (3) The level of impact on habitats may be larger than is sensible to ensure that the habitat will not be able to recover adequately, or it will cause strong downstream effects from loss of function. (Suggestion – where the activity makes a significant impact in the area affected and the area of habitat being removed is greater than 25% up to 50% [based on recovery rates])
Major (4) Substantially too much of the habitat is being affected, which may endanger its long-term survival and result in severe changes to ecosystem function. (Suggestion – this may equate to 70-90% of the habitat being affected or removed by the activity)
Catastrophic (5) Effectively the entire habitat is in danger of being affected in a major way or completely removed (Suggestion – this is likely to be greater than 90% of the original habitat area being affected)
Table 31. Consequence levels for the impact of a fishery on the general ecosystem/trophic levels (source: Fletcher et al. 2002).
Level Ecological (ecosystem)
Negligible (0) Insignificant impacts to habitat or populations – unlikely to be measurable against background variability. Interactions may be occurring but it is unlikely that there would be any change outside of natural variation.
Minor (1) Captured species do not play a keystone role – only minor changes in relative abundance of other constituents
Moderate (2) Measurable changes to the ecosystem components without there being a major change in function (no loss of components)
Severe (3) Ecosystem function altered measurably and some function or components are locally missing/ declining/increasing outside of historical range and/or allowed/facilitated new species to appear. Recovery measured in years.
Major (4) A major change to ecosystem structure and function (different dynamics now occur with different species/groups now the major targets of capture). Recovery period measured in years to decades.
Catastrophic (5) Total collapse of ecosystem processes. Long-term recovery period may be greater than decades.
Table 32. Consequence levels for impacts of management of a fishery at a political level (source: Fletcher et al. 2002).
Level Social - political
Negligible (0) No impact – would not have any flow-on impacts to the local community. No fisheries department staff would need to make a statement.
Minor (1) May have minor negative impact on the community (e.g. small number of job losses), but these impacts would be easily absorbed.
Moderate (2) Some increase in unemployment and decrease in overall income to which the community will adjust over time. Some community concern, which may translate to some political action or other forms of protest.
Severe (4) Significant reductions in employment and income associated with the fishery. Significant employment and income flow-on effects to other community businesses, as reduced income and

88
increased unemployment in fishing works its way through the local economy. Significant levels of community concern over the future of the community, which may translate to political action or other forms of protest.
Major (6) High level of community impacts which the community could not successfully adapt to without external assistance. Significant level of protest and political lobbying likely. Large-scale employment and income losses in the fishing sector of the local economy. Significant flow-on effects in terms of increasing unemployment and income reductions as a consequence of changes to the fishery. Decline in population and expenditure-based services (e.g. schools, supermarkets, banks). Population declines as families leave the region looking for work.
Catastrophic (8) Large-scale impacts well beyond the capacity of the community to absorb and adjust to. Likely to lead to large-scale rapid decline in community income and increase in unemployment in areas directly and indirectly related to fishing. May lead to large-scale and rapid reduction in population as families leave the region. Likely to lead to high levels of political action, protest and conflict. Significant reduction in access to private and public sector services, as businesses become unviable and target populations needed to attract government and commercial services decline below threshold levels.
Table 33. Participants of the stakeholder panel workshop held in Adelaide 1 February 2013.
Participant Representative body
Mr Andrew Puglisi Chair, SGPF licence holder Mr Simon Clark Executive Officer, SGWCPFA Dr Annabel Jones PIRSA Fisheries and Aquaculture Dr Cameron Dixon SARDI Aquatic Sciences Dr Craig Noell SARDI Aquatic Sciences Mr Greg Palmer SGPF licence holder Mr Tony Lukin SGPF licence holder Ms Kathryn Warhurst Conservation Council of South Australia Mr James Brook Conservation Council of South Australia Mr Ashley Lukin SGPF licence holder Mr Velimir Satalic SGPF licence holder Mr Nick Paul WCPF Licence holder Mr Michael Steer SARDI Aquatic Sciences Mr Mark Ayliff PIRSA Fisheries and Aquaculture
Table 34. Participants of the stakeholder panel workshop held in Adelaide 19 February 2013.
Participant Representative body
Mr Tony Lukin Chair, SGPF licence holder Mr Simon Clark Executive Officer, SGWCPFA Dr Annabel Jones PIRSA Fisheries and Aquaculture Dr Cameron Dixon SARDI Aquatic Sciences Dr Craig Noell SARDI Aquatic Sciences Mr Greg Palmer SGPF licence holder Ms Kathryn Warhurst Conservation Council of South Australia Mr Ashley Lukin SGPF licence holder Mr Velimir Satalic SGPF licence holder Mr Nick Paul WCPF Licence holder Apologies Mr Andrew Puglisi SGPF licence holder

89
8.3 Productivity and susceptibility attribute values, scores and overall risk for all species
ERA species ID Taxa grp Scientific name
CAAB code Family Common name R
ole
in f
ish
ery
P1
Avg
age
-at-
mat
uri
ty
P1 P2
Avg
max
age
P2 P3
Fec
un
dit
y
P3 P4
Avg
max
siz
e
P4 P5
Avg
siz
e-a
t-m
atu
rity
P5 P6
Rep
rod
str
ate
gy
P6 P7
Tro
ph
ic le
vel (
Fish
bas
e)
P7 Pro
du
ctiv
ity
S1a
%O
verl
ap w
/ fi
sher
y
S1a S1b
Glo
bal
dis
trib
n
S1b S1 S2a
Ad
ult
hab
itat
ove
rlap
S2a S2b
Bat
hym
ove
rlap
S2b S2 S3 S
ize
use
d f
or
sele
ctiv
ity
S3 S4 P
CM
(=1
-PC
S)
S4 Susc
epti
bili
ty
2D
-ris
k va
lue
Risk category
Comments*
6 Teleost Neoplatycephalus aurimaculatus 37 296035 Platycephalidae Toothy Flathead DI 2.0 1 17.3 2 1500000 1 55.0 1 30.0 1 BS 1 3.37 3 1.43 10.9 2 A 3 2 SB 3 1,2,3 3 3 30.0 3 3 2.33 2.73 Med
11 Invertebrate Nototodarus gouldi 23 636004 Ommastrephidae Gould's Squid DI 0.5 1 1.1 1 2176 2 38.3 1 24.7 1 DS 2 3.25 2 1.43 12.7 2 A 3 2 MP,EP 1 1,2,3,4 3 3 24.7 3 3 2.33 2.73 Med
13 Teleost Repomucenus calcaratus 37 427015 Callionymidae Spotted Dragonet DI 2.0 1 5.2 1 3 23.5 1 14.1 1 BS 1 2.96 2 1.43 44.6 3 S 2 3 SB,HB 3 1,2,3,4 3 3 14.1 3 3 3.00 3.32 High
18 Teleost Thamnaconus degeni 37 465037 Monacanthidae Bluefin Leatherjacket DI 2.6 1 10.1 2 700000 1 29.0 1 17.4 1 DS 2 2.88 2 1.43 79.9 3 S 2 3 HB,SB 3 1,2,3,4 3 3 17.4 3 3 3.00 3.32 High
22 Chondrichthyan Urolophus gigas 37 038003 Urolophidae Spotted Stingaree DI 4.8 1 11.3 2 1 3 63.6 1 47.3 2 LB 3 3.03 2 2.00 0.1 1 A 3 1 SB,HB 3 1,2,3 3 3 47.3 3 3 1.65 2.59 Low
26 Teleost Zebrias scalaris 37 462010 Soleidae Manyband Sole DI 2.4 1 12.3 2 77500 1 23.9 1 14.6 1 BS 1 3.02 2 1.29 12.5 2 S 2 2 SB 3 1,2,3,4 3 3 14.6 3 3 2.33 2.66 Med
30 Invertebrate Portunus armatus 28 911005 Portunidae Blue Swimmer Crab DI 0.6 1 3.0 1 78000 1 21.8 1 7.0 1 BG 2 3.00 2 1.29 74.6 3 W 1 3 HB,SB 3 1,2,3,4 3 3 7.0 2 3 2.33 2.66 Med
94 Teleost Neosebastes pandus 37 287003 Neosebastidae Bighead Gurnard Perch DI 3 3 3 37.0 1 29.0 1 BS 1 3.18 2 2.00 10.1 2 A 3 2 HB,SB 3 1,2,3,4 3 3 29.0 3 3 2.33 3.07 Med
Stakeholder panel agreed that information regarding the distribution of this species in Spencer Gulf was divergent or insufficient and a more precautionary approach was appropriate for the purposes of considering management arrangements to mitigate potential risk.
99 Teleost Gymnapistes marmoratus 37 287018 Tetrarogidae Soldier DI 4.1 1 24.0 2 3 22.0 1 13.1 1 BS 1 2.88 2 1.57 5.9 1 A 3 1 HB,SB 3 3,4 3 3 13.1 3 3 1.65 2.28 Low
100 Teleost Glyptauchen panduratus 37 287023 Tetrarogidae Goblinfish DI 3.4 1 15.6 2 3 20.0 1 12.9 1 BS 1 3.00 2 1.57 1.0 1 A 3 1 HB,SB 3 3,4 3 3 12.9 3 3 1.65 2.28 Low
104 Teleost Lepidotrigla papilio 37 288002 Triglidae Spiny Gurnard DI 2.6 1 12.8 2 200000 1 20.0 1 14.1 1 BS 1 3.01 2 1.29 79.9 3 A 3 3 SB 3 2,3,4 3 3 14.1 3 3 3.00 3.26 High
Stakeholder panel agreed that information regarding the distribution of this species in Spencer Gulf was divergent or insufficient and a more precautionary approach was appropriate for the purposes of considering management arrangements to mitigate potential risk.
109 Teleost Pterygotrigla polyommata 37 288006 Triglidae Latchet DI 3.1 1 15.5 2 200000 1 62.0 1 25.9 1 BS 1 3.06 2 1.29 1.8 1 S 2 1 SB 3 1,2,3 3 3 25.9 3 3 1.65 2.09 Low
118 Teleost Platycephalus speculator 37 296037 Platycephalidae Southern Bluespotted Flathead DI 3.5 1 9.7 1 1500000 1 90.0 1 36.0 1 BS 1 3.29 3 1.29 29.6 2 A 3 2 SB 3 1,2,3,4 3 3 36.0 3 3 2.33 2.66 Med
122 Teleost Pegasus lancifer 37 309003 Pegasidae Sculptured Seamoth DI 3 3 3 12.0 1 6.4 1 BS 1 2.92 2 2.00 10.3 2 A 3 2 HB,SB 3 1,2,3,4 3 3 6.4 2 3 1.88 2.74 Med
124 Teleost Caesioperca lepidoptera 37 311002 Serranidae Butterfly Perch DI 3.0 1 8.1 1 911482 1 37.6 1 25.5 1 BS 1 2.87 2 1.14 0.1 1 S 2 1 HB,SB 3 4 1 3 25.5 3 3 1.65 2.01 Low
125 Teleost Caesioperca rasor 37 311003 Serranidae Barber Perch DI 2.9 1 6.9 1 911482 1 26.6 1 24.5 1 BS 1 2.99 2 1.14 0.1 1 A 3 1 HB,SB 3 4 1 3 24.5 3 3 1.65 2.01 Low
142 Teleost Sillaginodes punctata 37 330001 Sillaginidae King George Whiting DI 2.4 1 10.0 2 110250 1 72.0 1 29.0 1 BS 1 2.86 2 1.29 45.8 3 A 3 3 HB,SB,BP 3 4 1 3 29.0 3 3 3.00 3.26 High

90
ERA species ID Taxa grp Scientific name
CAAB code Family Common name R
ole
in f
ish
ery
P1
Avg
age
-at-
mat
uri
ty
P1 P2
Avg
max
age
P2 P3
Fec
un
dit
y
P3 P4
Avg
max
siz
e
P4 P5
Avg
siz
e-a
t-m
atu
rity
P5 P6
Rep
rod
str
ate
gy
P6 P7
Tro
ph
ic le
vel (
Fish
bas
e)
P7 Pro
du
ctiv
ity
S1a
%O
verl
ap w
/ fi
sher
y
S1a S1b
Glo
bal
dis
trib
n
S1b S1 S2a
Ad
ult
hab
itat
ove
rlap
S2a S2b
Bat
hym
ove
rlap
S2b S2 S3 S
ize
use
d f
or
sele
ctiv
ity
S3 S4 P
CM
(=1
-PC
S)
S4 Susc
epti
bili
ty
2D
-ris
k va
lue
Risk category
Comments*
151 Teleost Pseudocaranx wrighti 37 337063 Carangidae Skipjack Trevally DI 2.5 1 49.0 3 915610 1 70.0 1 29.5 1 BS 1 2.87 2 1.43 83.3 3 A 3 3 HB,BP 3 1,2,3,4 3 3 29.5 3 3 3.00 3.32 High
156 Teleost Parequula melbournensis 37 349001 Gerreidae Silverbelly DI 1.0 1 6.6 1 3 21.0 1 17.5 1 BS 1 2.89 2 1.43 70.9 3 A 3 3 SB 3 1,2,3,4 3 3 17.5 3 3 3.00 3.32 High
158 Teleost Pagrus auratus 37 353001 Sparidae Snapper DI 2.1 1 25.4 3 8700 2 130.0 2 20.0 1 BS 1 2.85 2 1.71 40.9 3 W 1 3 HB,SB 3 3,4 3 3 20.0 3 3 3.00 3.46 High
166 Teleost Pempheris multiradiata 37 357001 Pempheridae Bigscale Bullseye DI 2.1 1 8.1 1 3 28.0 1 17.4 1 BS 1 3.05 2 1.43 0.5 1 A 3 1 HB,BP 3 1,2,3,4 3 3 17.4 3 3 1.65 2.18 Low
168 Teleost Enoplosus armatus 37 366001 Enoplosidae Old Wife DI 3 3 3 50.0 1 29.0 1 BS 1 2.92 2 2.00 1.6 1 A 3 1 HB,SB,BP 3 3,4 3 3 29.0 3 3 1.65 2.59 Low
170 Teleost Pentaceropsis recurvirostris 37 367003 Pentacerotidae Longsnout Boarfish DI 2.0 1 8.4 1 3 50.0 1 29.0 1 BS 1 2.66 1 1.29 1.2 1 A 3 1 HB,SB,BP 3 1,2,3,4 3 3 29.0 3 3 1.65 2.09 Low
174 Teleost Parazanclistius hutchinsi 37 367010 Pentacerotidae Short Boarfish DI 1.5 1 5.9 1 3 34.0 1 20.7 1 BS 1 3.00 2 1.43 2.6 1 A 3 1 HB,SB,BP 3 3,4 3 3 20.7 3 3 1.65 2.18 Low
Associated with hard bottom areas that are infrequently sampled with trawls (pers. comm. Martin Gomon, email 15/2/13)
175 Teleost Oplegnathus woodwardi 37 369002 Oplegnathidae Knifejaw DI 2.3 1 2.8 1 3 45.0 1 26.5 1 BS 1 3.00 2 1.43 0.1 1 A 3 1 SB 3 1,2,3,4 3 3 26.5 3 3 1.65 2.18 Low
177 Teleost Nemadactylus douglasii 37 377002 Cheilodactylidae Grey Morwong DI 3.0 1 15.3 2 100000 1 56.3 1 23.0 1 BS 1 2.97 2 1.29 0.6 1 S 2 1 HB 2 1,2,3,4 3 3 23.0 3 3 1.65 2.09 Low
183 Teleost Sphyraena obtusata 37 382001 Sphyraenidae Striped Barracuda DI 2.5 1 5.7 1 42000 1 55.0 1 34.7 1 BS 1 3.70 3 1.29 0.1 1 W 1 1 HB,SB,BP 3 3,4 3 3 34.7 3 3 1.65 2.09 Low
184 Teleost Sphyraena novaehollandiae 37 382002 Sphyraenidae Snook DI 3.2 1 16.9 2 42000 1 110.0 2 50.0 2 BS 1 3.70 3 1.71 3.1 1 W 1 1 HB,SB,BP 3 3,4 3 3 50.0 3 3 1.65 2.38 Low
193 Teleost Ichthyscopus barbatus 37 400002 Uranoscopidae Fringe Stargazer DI 2.4 1 11.0 2 3 40.0 1 24.4 1 BS 1 3.43 3 1.71 8.7 1 A 3 1 SB 3 2,3 3 3 24.4 3 3 1.65 2.38 Low
194 Teleost Kathetostoma laeve 37 400003 Uranoscopidae Common Stargazer DI 3.1 1 41.5 3 3 75.0 1 41.5 2 BS 1 3.56 3 2.00 19.5 2 A 3 2 SB 3 1,2,3,4 3 3 41.5 3 3 2.33 3.07 Med
201 Teleost Foetorepus calauropomus 37 427001 Callionymidae Common Stinkfish DI 2.2 1 5.5 1 3 27.0 1 18.5 1 BS 1 2.96 2 1.43 36.2 3 A 3 3 SB,HB 3 1,2,3,4 3 3 18.5 3 3 3.00 3.32 High
221 Teleost Pseudorhombus jenynsii 37 460002 Paralichthyidae Smalltooth Flounder DI 2.5 1 6.4 1 10000000 1 34.0 1 22.3 1 BS 1 3.13 2 1.14 56.5 3 S 2 3 SB 3 1,2,3,4 3 3 22.3 3 3 3.00 3.21 High
Stakeholder panel considered that this species has a wide distribution and there was little risk to this species..
225 Teleost Ammotretis lituratus 37 461004 Pleuronectidae Spotted Flounder DI 3.6 1 14.3 2 340489 1 23.0 1 29.3 1 BS 1 3.20 2 1.29 9.2 1 A 3 1 SB 3 3,4 3 3 29.3 3 3 1.65 2.09 Low
231 Teleost Eubalichthys mosaicus 37 465003 Monacanthidae Mosaic Leatherjacket DI 4.7 1 20.4 2 700000 1 60.0 1 34.1 1 DS 2 2.74 1 1.29 27.1 2 A 3 2 HB,SB 3 1,2,3,4 3 3 34.1 3 3 2.33 2.66 Med
232 Teleost Meuschenia scaber 37 465005 Monacanthidae Velvet Leatherjacket DI 2.7 1 10.9 2 700000 1 31.0 1 19.0 1 DS 2 2.80 2 1.43 0.7 1 S 2 1 HB,SB 3 3,4 3 3 19.0 3 3 1.65 2.18 Low
233 Teleost Nelusetta ayraudi 37 465006 Monacanthidae Ocean Jacket DI 2.5 1 13.8 2 700000 1 100.0 2 53.5 2 BS 1 3.11 2 1.57 0.2 1 A 3 1 HB,SB,BP,MP,EP 3 1,2,3,4 3 3 53.5 3 3 1.65 2.28 Low
234 Teleost Scobinichthys granulatus 37 465007 Monacanthidae Rough Leatherjacket DI 2.8 1 10.9 2 700000 1 30.0 1 18.5 1 DS 2 2.94 2 1.43 81.7 3 A 3 3 HB,SB 3 1,2,3,4 3 3 18.5 3 3 3.00 3.32 High
236 Teleost Eubalichthys gunnii 37 465034 Monacanthidae Gunn's Leatherjacket DI 4.7 1 20.4 2 700000 1 40.0 1 34.1 1 BS 1 2.74 1 1.14 5.7 1 A 3 1 HB,SB 3 1,2,3,4 3 3 34.1 3 3 1.65 2.01 Low
Stakeholder panel agreed that information regarding the distribution of this species in Spencer Gulf was divergent or insufficient and a more precautionary approach was appropriate for the purposes of considering management arrangements to mitigate potential risk.

91
ERA species ID Taxa grp Scientific name
CAAB code Family Common name R
ole
in f
ish
ery
P1
Avg
age
-at-
mat
uri
ty
P1 P2
Avg
max
age
P2 P3
Fec
un
dit
y
P3 P4
Avg
max
siz
e
P4 P5
Avg
siz
e-a
t-m
atu
rity
P5 P6
Rep
rod
str
ate
gy
P6 P7
Tro
ph
ic le
vel (
Fish
bas
e)
P7 Pro
du
ctiv
ity
S1a
%O
verl
ap w
/ fi
sher
y
S1a S1b
Glo
bal
dis
trib
n
S1b S1 S2a
Ad
ult
hab
itat
ove
rlap
S2a S2b
Bat
hym
ove
rlap
S2b S2 S3 S
ize
use
d f
or
sele
ctiv
ity
S3 S4 P
CM
(=1
-PC
S)
S4 Susc
epti
bili
ty
2D
-ris
k va
lue
Risk category
Comments*
237 Teleost Meuschenia freycineti 37 465036 Monacanthidae Sixspine Leatherjacket DI 4.7 1 20.4 2 700000 1 55.0 1 34.1 1 DS 2 2.09 1 1.29 0.5 1 A 3 1 HB,SB 3 1,2,3,4 3 3 34.1 3 3 1.65 2.09 Low
239 Teleost Aracana ornata 37 466001 Ostraciidae Ornate Cowfish DI 3 3 3 15.0 1 14.3 1 BS 1 2.98 2 2.00 20.4 2 A 3 2 HB,SB 3 1,2,3 3 3 14.3 3 3 2.33 3.07 Med
241 Teleost Aracana aurita 37 466003 Ostraciidae Shaw's Cowfish DI 3 3 3 20.0 1 15.3 1 BS 1 2.91 2 2.00 16.0 2 A 3 2 HB,SB 3 1,2,3,4 3 3 15.3 3 3 2.33 3.07 Med
243 Teleost Omegophora armilla 37 467002 Tetraodontidae Ringed Toadfish DI 1.6 1 6.0 1 350 2 25.0 1 16.5 1 DS 2 2.77 2 1.43 7.4 1 A 3 1 HB,SB 3 1,2,3,4 3 3 16.5 3 3 1.65 2.18 Low
244 Teleost Tetractenos glaber 37 467003 Tetraodontidae Smooth Toadfish DI 1.1 1 3.7 1 350 2 15.0 1 14.6 1 DS 2 2.98 2 1.43 10.7 2 A 3 2 HB,SB 3 2,3,4 3 3 14.6 3 3 2.33 2.73 Med
Stakeholder panel agreed that information regarding the distribution of this species in Spencer Gulf was divergent or insufficient and a more precautionary approach was appropriate for the purposes of considering management arrangements to mitigate potential risk.
248 Teleost Contusus brevicaudus 37 467044 Tetraodontidae Prickly Toadfish DI 1.6 1 6.0 1 350 2 25.0 1 16.5 1 DS 2 2.77 2 1.43 11.4 2 A 3 2 HB,SB 3 2,3 3 3 16.5 3 3 2.33 2.73 Med
249 Teleost Diodon nicthemerus 37 469001 Diodontidae Globefish DI 15.0 2 15.0 2 3000 2 28.0 1 23.8 1 BS 1 3.13 2 1.57 36.3 3 A 3 3 HB,SB 3 1,2,3,4 3 3 23.8 3 3 3.00 3.39 High
Stakeholder panel considered that this species has a wide distribution and there was little risk to this species.
260 Chondrichthyan Heterodontus portusjacksoni 37 007001 Heterodontidae Port Jackson Shark DI 9.0 2 38.3 3 10 3 132.6 2 75.0 2 DS 2 2.97 2 2.29 72.5 3 S 2 3 HB,SB 3 1,2,3,4 3 3 75.0 3 0.008 1 1.65 2.82 Med
286 Chondrichthyan Callorhinchus milii 37 043001 Callorhinchidae Elephantfish DI 3.5 1 8.7 1 2 3 99.3 1 54.7 2 DS 2 2.80 2 1.71 8.1 1 S 2 1 HB,SB 3 1,2,3,4 3 3 54.7 3 3 1.65 2.38 Low
307 Teleost Lophonectes gallus 37 460001 Bothidae Crested Flounder DI 2.5 1 6.4 1 20000 2 21.5 1 11.5 1 BS 1 3.13 2 1.29 19.1 2 S 2 2 SB 3 4 1 3 11.5 3 3 2.33 2.66 Med
310 Teleost Acanthaluteres spilomelanurus 37 465043 Monacanthidae Bridled Leatherjacket DI 1.5 1 5.2 1 700000 1 14.0 1 9.4 1 BS 1 2.56 1 1.00 28.1 2 A 3 2 HB,SB 3 1 1 3 9.4 3 3 2.33 2.53 Low
311 Teleost Acanthaluteres vittiger 37 465002 Monacanthidae Toothbrush Leatherjacket DI 3.1 1 12.4 2 700000 1 35.0 1 21.2 1 BS 1 2.00 1 1.14 81.5 3 S 2 3 HB,SB 3 1,2,3 3 3 21.2 3 3 3.00 3.21 High
Stakeholder panel considered that this species has a wide distribution and there was little risk to this species.
332 Teleost Centroberyx affinis 37 258003 Berycidae Redfish DI 4.3 1 40.3 3 3 39.3 1 18.0 1 BS 1 3.22 2 1.71 0.7 1 A 3 1 HB,SB 3 2,3,4 3 3 18.0 3 3 1.65 2.38 Low
369 Chondrichthyan Parascyllium ferrugineum 37 013005 Parascylliidae Rusty Carpetshark DI 3 3 99 3 80.0 1 96.7 2 DS 2 3.10 2 2.29 2.8 1 A 3 1 HB,SB 3 1,2,3,4 3 3 96.7 3 3 1.65 2.82 Med
391 Chondrichthyan Asymbolus vincenti 37 015003 Scyliorhinidae Gulf Catshark DI 1.8 1 8.0 1 99 3 55.0 1 40.7 2 DS 2 3.70 3 1.86 0.0 1 A 3 1 HB,SB 3 3,4 3 3 40.7 3 3 1.65 2.48 Low
511 Teleost Arripis georgianus 37 344001 Arripidae Australian Herring DI 7.8 2 10.3 2 190000 1 33.0 1 18.5 1 BS 1 3.55 3 1.57 0.4 1 A 3 1 EP,MP,BP 3 1, 1 3 18.5 3 3 1.65 2.28 Low
539 Teleost Chelidonichthys kumu 37 288001 Triglidae Red Gurnard DI 2.5 1 12.5 2 200000 1 50.0 1 23.0 1 BS 1 3.00 2 1.29 0.6 1 W 1 1 SB 3 1,2,3,4 3 3 23.0 3 3 1.65 2.09 Low
608 Teleost Cheilodactylus nigripes 37 377001 Cheilodactylidae Magpie Perch DI 3.0 1 27.2 3 100000 1 41.0 1 25.0 1 bs 1 2.67 1 1.29 0.1 1 S 2 1 HB 2 1,2,3,4 3 3 25.0 3 3 1.65 2.09 Low
656 Chondrichthyan Pristiophorus nudipinnis 37 023001 Pristiophoridae Southern Sawshark DI 9.0 2 9.0 1 3 3 118.7 2 96.7 2 LB 3 3.00 2 2.14 1.1 1 A 3 1 HB,SB 3 3,4 3 3 96.7 3 3 1.65 2.70 Med
660 Chondrichthyan Squatina australis 37 024001 Squatinidae Australian Angelshark DI 8.0 2 26.8 3 7 3 124.0 2 92.3 2 LB 3 3.33 3 2.57 12.4 2 A 3 2 HB,SB 3 2,3,4 3 3 92.3 3 0.25 1 1.43 2.94 Med
669 Chondrichthyan Aptychotrema vincentiana 37 027001 Rhinobatidae Western Shovelnose Ray DI 2.0 1 8.0 1 14 3 79.0 1 79.3 2 LB 3 3.25 2 1.86 26.3 2 A 3 2 SB 3 1,2,3 3 3 79.3 3 3 2.33 2.98 Med
Stakeholder panel agreed that
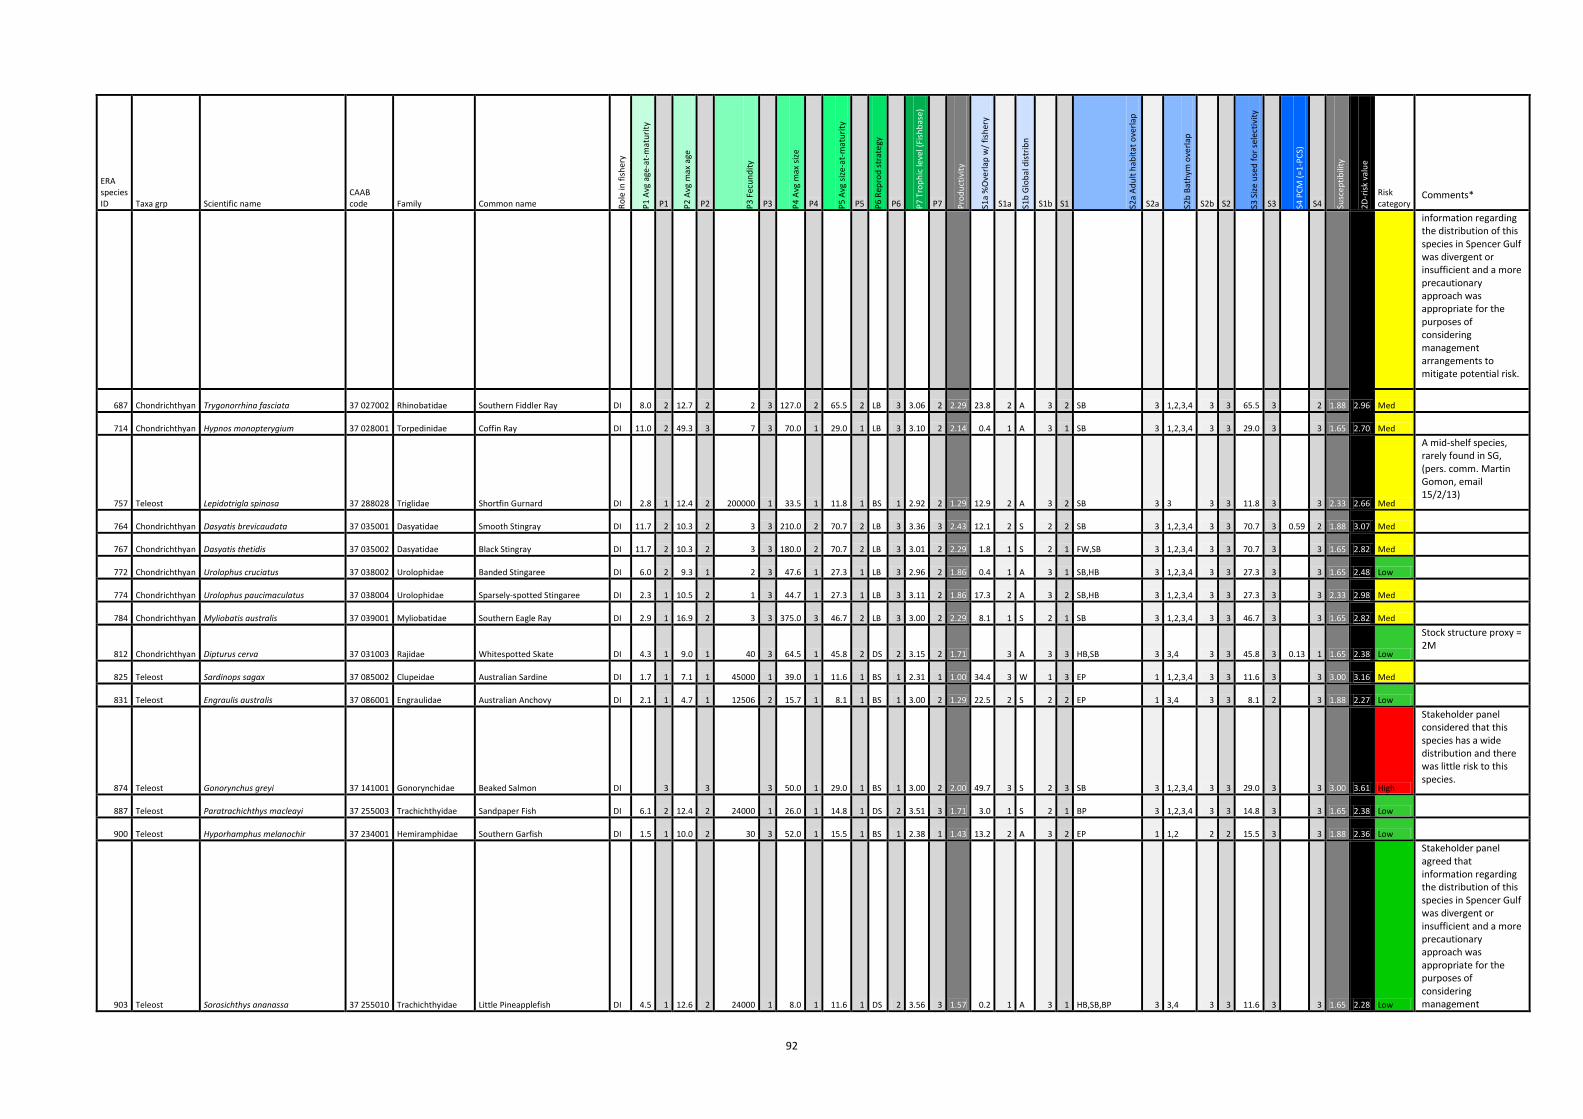
92
ERA species ID Taxa grp Scientific name
CAAB code Family Common name R
ole
in f
ish
ery
P1
Avg
age
-at-
mat
uri
ty
P1 P2
Avg
max
age
P2 P3
Fec
un
dit
y
P3 P4
Avg
max
siz
e
P4 P5
Avg
siz
e-a
t-m
atu
rity
P5 P6
Rep
rod
str
ate
gy
P6 P7
Tro
ph
ic le
vel (
Fish
bas
e)
P7 Pro
du
ctiv
ity
S1a
%O
verl
ap w
/ fi
sher
y
S1a S1b
Glo
bal
dis
trib
n
S1b S1 S2a
Ad
ult
hab
itat
ove
rlap
S2a S2b
Bat
hym
ove
rlap
S2b S2 S3 S
ize
use
d f
or
sele
ctiv
ity
S3 S4 P
CM
(=1
-PC
S)
S4 Susc
epti
bili
ty
2D
-ris
k va
lue
Risk category
Comments*
information regarding the distribution of this species in Spencer Gulf was divergent or insufficient and a more precautionary approach was appropriate for the purposes of considering management arrangements to mitigate potential risk.
687 Chondrichthyan Trygonorrhina fasciata 37 027002 Rhinobatidae Southern Fiddler Ray DI 8.0 2 12.7 2 2 3 127.0 2 65.5 2 LB 3 3.06 2 2.29 23.8 2 A 3 2 SB 3 1,2,3,4 3 3 65.5 3 2 1.88 2.96 Med
714 Chondrichthyan Hypnos monopterygium 37 028001 Torpedinidae Coffin Ray DI 11.0 2 49.3 3 7 3 70.0 1 29.0 1 LB 3 3.10 2 2.14 0.4 1 A 3 1 SB 3 1,2,3,4 3 3 29.0 3 3 1.65 2.70 Med
757 Teleost Lepidotrigla spinosa 37 288028 Triglidae Shortfin Gurnard DI 2.8 1 12.4 2 200000 1 33.5 1 11.8 1 BS 1 2.92 2 1.29 12.9 2 A 3 2 SB 3 3 3 3 11.8 3 3 2.33 2.66 Med
A mid-shelf species, rarely found in SG, (pers. comm. Martin Gomon, email 15/2/13)
764 Chondrichthyan Dasyatis brevicaudata 37 035001 Dasyatidae Smooth Stingray DI 11.7 2 10.3 2 3 3 210.0 2 70.7 2 LB 3 3.36 3 2.43 12.1 2 S 2 2 SB 3 1,2,3,4 3 3 70.7 3 0.59 2 1.88 3.07 Med
767 Chondrichthyan Dasyatis thetidis 37 035002 Dasyatidae Black Stingray DI 11.7 2 10.3 2 3 3 180.0 2 70.7 2 LB 3 3.01 2 2.29 1.8 1 S 2 1 FW,SB 3 1,2,3,4 3 3 70.7 3 3 1.65 2.82 Med
772 Chondrichthyan Urolophus cruciatus 37 038002 Urolophidae Banded Stingaree DI 6.0 2 9.3 1 2 3 47.6 1 27.3 1 LB 3 2.96 2 1.86 0.4 1 A 3 1 SB,HB 3 1,2,3,4 3 3 27.3 3 3 1.65 2.48 Low
774 Chondrichthyan Urolophus paucimaculatus 37 038004 Urolophidae Sparsely-spotted Stingaree DI 2.3 1 10.5 2 1 3 44.7 1 27.3 1 LB 3 3.11 2 1.86 17.3 2 A 3 2 SB,HB 3 1,2,3,4 3 3 27.3 3 3 2.33 2.98 Med
784 Chondrichthyan Myliobatis australis 37 039001 Myliobatidae Southern Eagle Ray DI 2.9 1 16.9 2 3 3 375.0 3 46.7 2 LB 3 3.00 2 2.29 8.1 1 S 2 1 SB 3 1,2,3,4 3 3 46.7 3 3 1.65 2.82 Med
812 Chondrichthyan Dipturus cerva 37 031003 Rajidae Whitespotted Skate DI 4.3 1 9.0 1 40 3 64.5 1 45.8 2 DS 2 3.15 2 1.71 3 A 3 3 HB,SB 3 3,4 3 3 45.8 3 0.13 1 1.65 2.38 Low
Stock structure proxy = 2M
825 Teleost Sardinops sagax 37 085002 Clupeidae Australian Sardine DI 1.7 1 7.1 1 45000 1 39.0 1 11.6 1 BS 1 2.31 1 1.00 34.4 3 W 1 3 EP 1 1,2,3,4 3 3 11.6 3 3 3.00 3.16 Med
831 Teleost Engraulis australis 37 086001 Engraulidae Australian Anchovy DI 2.1 1 4.7 1 12506 2 15.7 1 8.1 1 BS 1 3.00 2 1.29 22.5 2 S 2 2 EP 1 3,4 3 3 8.1 2 3 1.88 2.27 Low
874 Teleost Gonorynchus greyi 37 141001 Gonorynchidae Beaked Salmon DI 3 3 3 50.0 1 29.0 1 BS 1 3.00 2 2.00 49.7 3 S 2 3 SB 3 1,2,3,4 3 3 29.0 3 3 3.00 3.61 High
Stakeholder panel considered that this species has a wide distribution and there was little risk to this species.
887 Teleost Paratrachichthys macleayi 37 255003 Trachichthyidae Sandpaper Fish DI 6.1 2 12.4 2 24000 1 26.0 1 14.8 1 DS 2 3.51 3 1.71 3.0 1 S 2 1 BP 3 1,2,3,4 3 3 14.8 3 3 1.65 2.38 Low
900 Teleost Hyporhamphus melanochir 37 234001 Hemiramphidae Southern Garfish DI 1.5 1 10.0 2 30 3 52.0 1 15.5 1 BS 1 2.38 1 1.43 13.2 2 A 3 2 EP 1 1,2 2 2 15.5 3 3 1.88 2.36 Low
903 Teleost Sorosichthys ananassa 37 255010 Trachichthyidae Little Pineapplefish DI 4.5 1 12.6 2 24000 1 8.0 1 11.6 1 DS 2 3.56 3 1.57 0.2 1 A 3 1 HB,SB,BP 3 3,4 3 3 11.6 3 3 1.65 2.28 Low
Stakeholder panel agreed that information regarding the distribution of this species in Spencer Gulf was divergent or insufficient and a more precautionary approach was appropriate for the purposes of considering management
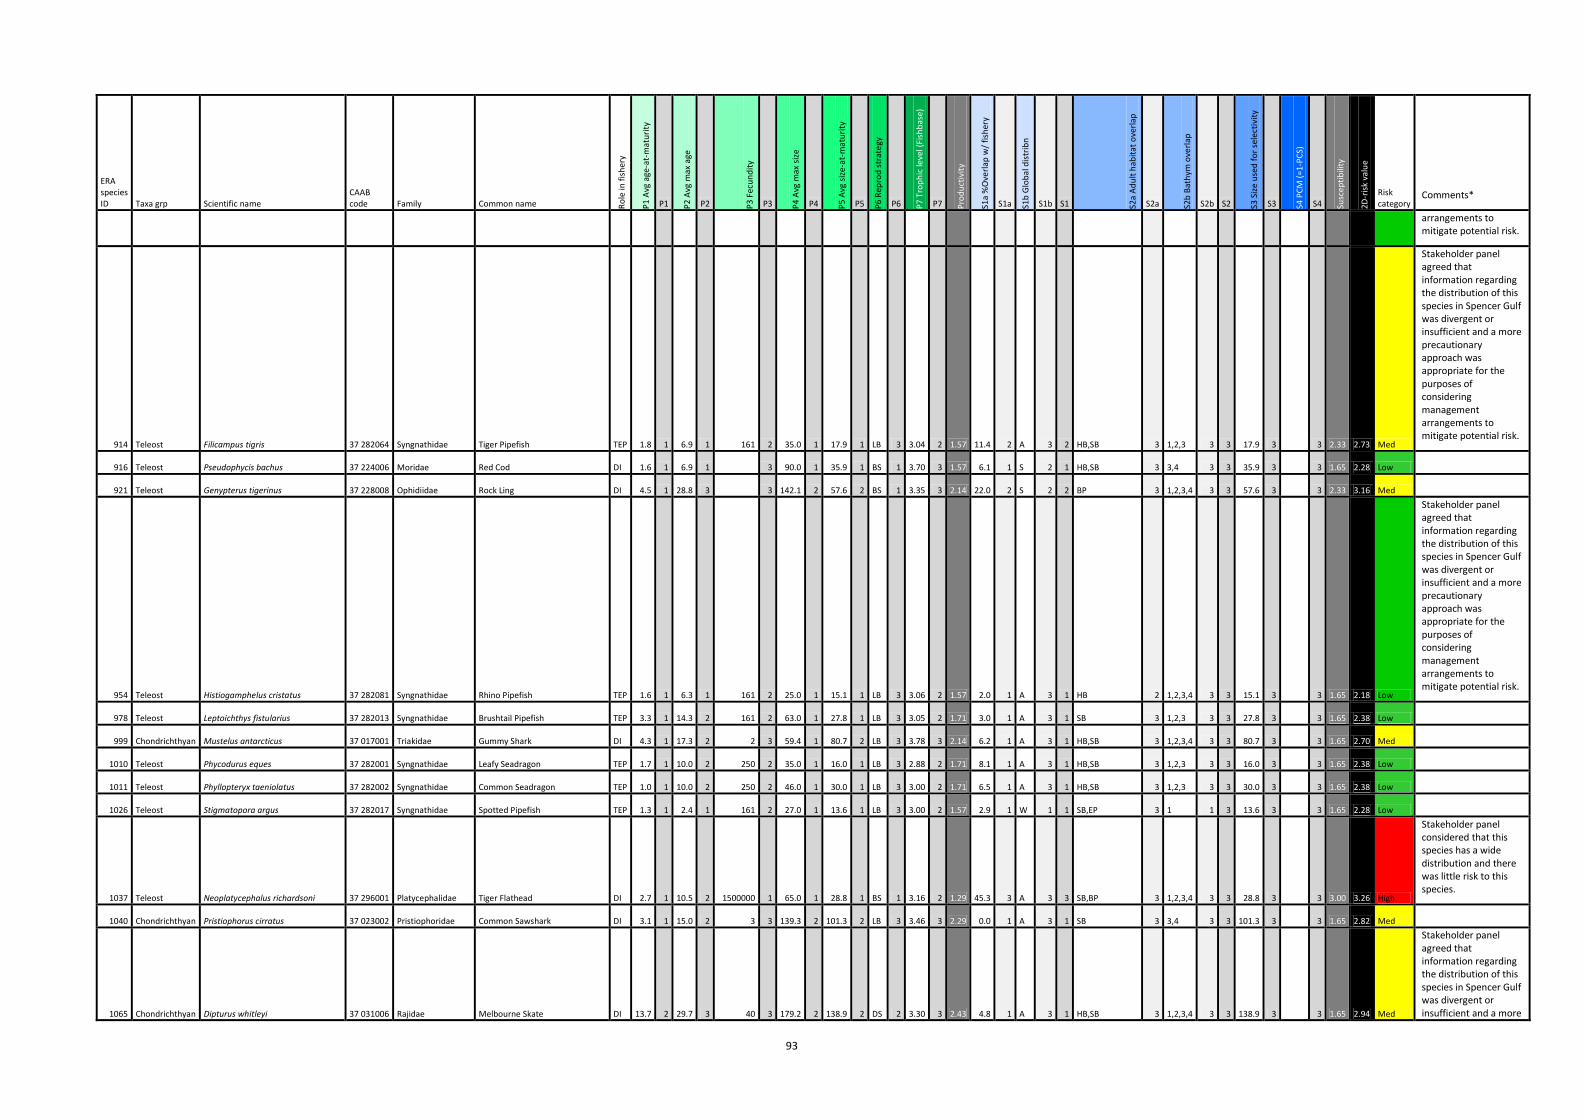
93
ERA species ID Taxa grp Scientific name
CAAB code Family Common name R
ole
in f
ish
ery
P1
Avg
age
-at-
mat
uri
ty
P1 P2
Avg
max
age
P2 P3
Fec
un
dit
y
P3 P4
Avg
max
siz
e
P4 P5
Avg
siz
e-a
t-m
atu
rity
P5 P6
Rep
rod
str
ate
gy
P6 P7
Tro
ph
ic le
vel (
Fish
bas
e)
P7 Pro
du
ctiv
ity
S1a
%O
verl
ap w
/ fi
sher
y
S1a S1b
Glo
bal
dis
trib
n
S1b S1 S2a
Ad
ult
hab
itat
ove
rlap
S2a S2b
Bat
hym
ove
rlap
S2b S2 S3 S
ize
use
d f
or
sele
ctiv
ity
S3 S4 P
CM
(=1
-PC
S)
S4 Susc
epti
bili
ty
2D
-ris
k va
lue
Risk category
Comments*
arrangements to mitigate potential risk.
914 Teleost Filicampus tigris 37 282064 Syngnathidae Tiger Pipefish TEP 1.8 1 6.9 1 161 2 35.0 1 17.9 1 LB 3 3.04 2 1.57 11.4 2 A 3 2 HB,SB 3 1,2,3 3 3 17.9 3 3 2.33 2.73 Med
Stakeholder panel agreed that information regarding the distribution of this species in Spencer Gulf was divergent or insufficient and a more precautionary approach was appropriate for the purposes of considering management arrangements to mitigate potential risk.
916 Teleost Pseudophycis bachus 37 224006 Moridae Red Cod DI 1.6 1 6.9 1 3 90.0 1 35.9 1 BS 1 3.70 3 1.57 6.1 1 S 2 1 HB,SB 3 3,4 3 3 35.9 3 3 1.65 2.28 Low
921 Teleost Genypterus tigerinus 37 228008 Ophidiidae Rock Ling DI 4.5 1 28.8 3 3 142.1 2 57.6 2 BS 1 3.35 3 2.14 22.0 2 S 2 2 BP 3 1,2,3,4 3 3 57.6 3 3 2.33 3.16 Med
954 Teleost Histiogamphelus cristatus 37 282081 Syngnathidae Rhino Pipefish TEP 1.6 1 6.3 1 161 2 25.0 1 15.1 1 LB 3 3.06 2 1.57 2.0 1 A 3 1 HB 2 1,2,3,4 3 3 15.1 3 3 1.65 2.18 Low
Stakeholder panel agreed that information regarding the distribution of this species in Spencer Gulf was divergent or insufficient and a more precautionary approach was appropriate for the purposes of considering management arrangements to mitigate potential risk.
978 Teleost Leptoichthys fistularius 37 282013 Syngnathidae Brushtail Pipefish TEP 3.3 1 14.3 2 161 2 63.0 1 27.8 1 LB 3 3.05 2 1.71 3.0 1 A 3 1 SB 3 1,2,3 3 3 27.8 3 3 1.65 2.38 Low
999 Chondrichthyan Mustelus antarcticus 37 017001 Triakidae Gummy Shark DI 4.3 1 17.3 2 2 3 59.4 1 80.7 2 LB 3 3.78 3 2.14 6.2 1 A 3 1 HB,SB 3 1,2,3,4 3 3 80.7 3 3 1.65 2.70 Med
1010 Teleost Phycodurus eques 37 282001 Syngnathidae Leafy Seadragon TEP 1.7 1 10.0 2 250 2 35.0 1 16.0 1 LB 3 2.88 2 1.71 8.1 1 A 3 1 HB,SB 3 1,2,3 3 3 16.0 3 3 1.65 2.38 Low
1011 Teleost Phyllopteryx taeniolatus 37 282002 Syngnathidae Common Seadragon TEP 1.0 1 10.0 2 250 2 46.0 1 30.0 1 LB 3 3.00 2 1.71 6.5 1 A 3 1 HB,SB 3 1,2,3 3 3 30.0 3 3 1.65 2.38 Low
1026 Teleost Stigmatopora argus 37 282017 Syngnathidae Spotted Pipefish TEP 1.3 1 2.4 1 161 2 27.0 1 13.6 1 LB 3 3.00 2 1.57 2.9 1 W 1 1 SB,EP 3 1 1 3 13.6 3 3 1.65 2.28 Low
1037 Teleost Neoplatycephalus richardsoni 37 296001 Platycephalidae Tiger Flathead DI 2.7 1 10.5 2 1500000 1 65.0 1 28.8 1 BS 1 3.16 2 1.29 45.3 3 A 3 3 SB,BP 3 1,2,3,4 3 3 28.8 3 3 3.00 3.26 High
Stakeholder panel considered that this species has a wide distribution and there was little risk to this species.
1040 Chondrichthyan Pristiophorus cirratus 37 023002 Pristiophoridae Common Sawshark DI 3.1 1 15.0 2 3 3 139.3 2 101.3 2 LB 3 3.46 3 2.29 0.0 1 A 3 1 SB 3 3,4 3 3 101.3 3 3 1.65 2.82 Med
1065 Chondrichthyan Dipturus whitleyi 37 031006 Rajidae Melbourne Skate DI 13.7 2 29.7 3 40 3 179.2 2 138.9 2 DS 2 3.30 3 2.43 4.8 1 A 3 1 HB,SB 3 1,2,3,4 3 3 138.9 3 3 1.65 2.94 Med
Stakeholder panel agreed that information regarding the distribution of this species in Spencer Gulf was divergent or insufficient and a more
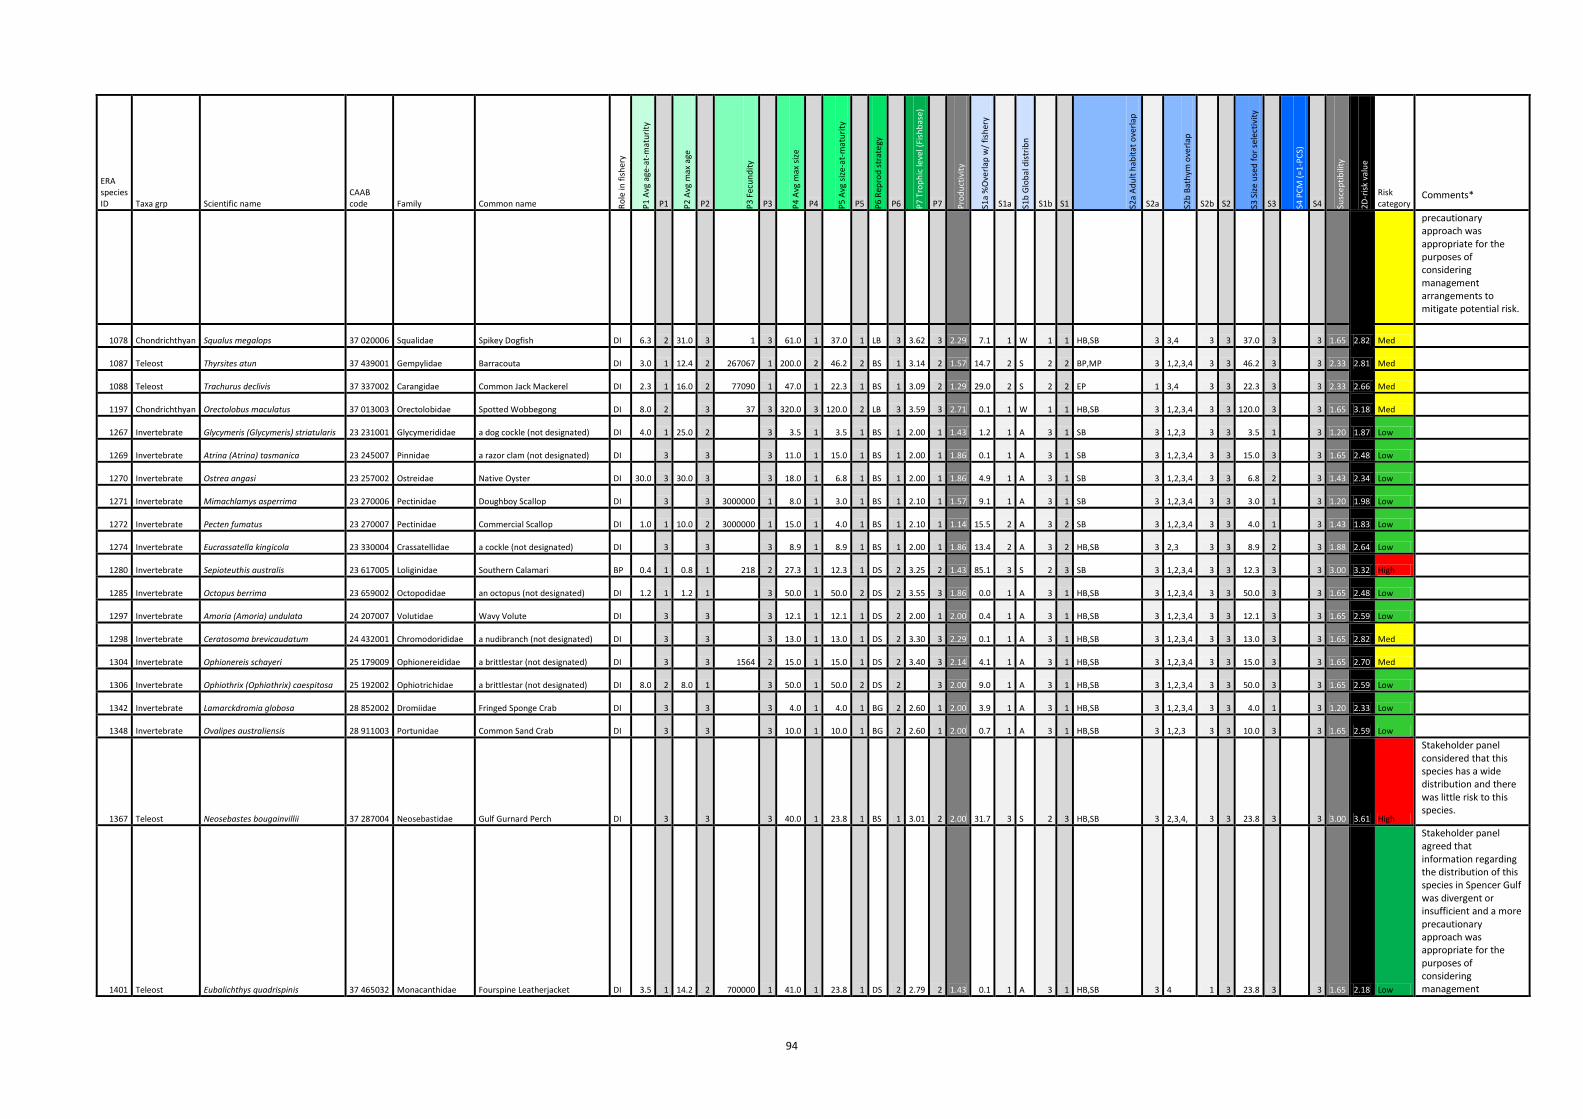
94
ERA species ID Taxa grp Scientific name
CAAB code Family Common name R
ole
in f
ish
ery
P1
Avg
age
-at-
mat
uri
ty
P1 P2
Avg
max
age
P2 P3
Fec
un
dit
y
P3 P4
Avg
max
siz
e
P4 P5
Avg
siz
e-a
t-m
atu
rity
P5 P6
Rep
rod
str
ate
gy
P6 P7
Tro
ph
ic le
vel (
Fish
bas
e)
P7 Pro
du
ctiv
ity
S1a
%O
verl
ap w
/ fi
sher
y
S1a S1b
Glo
bal
dis
trib
n
S1b S1 S2a
Ad
ult
hab
itat
ove
rlap
S2a S2b
Bat
hym
ove
rlap
S2b S2 S3 S
ize
use
d f
or
sele
ctiv
ity
S3 S4 P
CM
(=1
-PC
S)
S4 Susc
epti
bili
ty
2D
-ris
k va
lue
Risk category
Comments*
precautionary approach was appropriate for the purposes of considering management arrangements to mitigate potential risk.
1078 Chondrichthyan Squalus megalops 37 020006 Squalidae Spikey Dogfish DI 6.3 2 31.0 3 1 3 61.0 1 37.0 1 LB 3 3.62 3 2.29 7.1 1 W 1 1 HB,SB 3 3,4 3 3 37.0 3 3 1.65 2.82 Med
1087 Teleost Thyrsites atun 37 439001 Gempylidae Barracouta DI 3.0 1 12.4 2 267067 1 200.0 2 46.2 2 BS 1 3.14 2 1.57 14.7 2 S 2 2 BP,MP 3 1,2,3,4 3 3 46.2 3 3 2.33 2.81 Med
1088 Teleost Trachurus declivis 37 337002 Carangidae Common Jack Mackerel DI 2.3 1 16.0 2 77090 1 47.0 1 22.3 1 BS 1 3.09 2 1.29 29.0 2 S 2 2 EP 1 3,4 3 3 22.3 3 3 2.33 2.66 Med
1197 Chondrichthyan Orectolobus maculatus 37 013003 Orectolobidae Spotted Wobbegong DI 8.0 2 3 37 3 320.0 3 120.0 2 LB 3 3.59 3 2.71 0.1 1 W 1 1 HB,SB 3 1,2,3,4 3 3 120.0 3 3 1.65 3.18 Med
1267 Invertebrate Glycymeris (Glycymeris) striatularis 23 231001 Glycymerididae a dog cockle (not designated) DI 4.0 1 25.0 2 3 3.5 1 3.5 1 BS 1 2.00 1 1.43 1.2 1 A 3 1 SB 3 1,2,3 3 3 3.5 1 3 1.20 1.87 Low
1269 Invertebrate Atrina (Atrina) tasmanica 23 245007 Pinnidae a razor clam (not designated) DI 3 3 3 11.0 1 15.0 1 BS 1 2.00 1 1.86 0.1 1 A 3 1 SB 3 1,2,3,4 3 3 15.0 3 3 1.65 2.48 Low
1270 Invertebrate Ostrea angasi 23 257002 Ostreidae Native Oyster DI 30.0 3 30.0 3 3 18.0 1 6.8 1 BS 1 2.00 1 1.86 4.9 1 A 3 1 SB 3 1,2,3,4 3 3 6.8 2 3 1.43 2.34 Low
1271 Invertebrate Mimachlamys asperrima 23 270006 Pectinidae Doughboy Scallop DI 3 3 3000000 1 8.0 1 3.0 1 BS 1 2.10 1 1.57 9.1 1 A 3 1 SB 3 1,2,3,4 3 3 3.0 1 3 1.20 1.98 Low
1272 Invertebrate Pecten fumatus 23 270007 Pectinidae Commercial Scallop DI 1.0 1 10.0 2 3000000 1 15.0 1 4.0 1 BS 1 2.10 1 1.14 15.5 2 A 3 2 SB 3 1,2,3,4 3 3 4.0 1 3 1.43 1.83 Low
1274 Invertebrate Eucrassatella kingicola 23 330004 Crassatellidae a cockle (not designated) DI 3 3 3 8.9 1 8.9 1 BS 1 2.00 1 1.86 13.4 2 A 3 2 HB,SB 3 2,3 3 3 8.9 2 3 1.88 2.64 Low
1280 Invertebrate Sepioteuthis australis 23 617005 Loliginidae Southern Calamari BP 0.4 1 0.8 1 218 2 27.3 1 12.3 1 DS 2 3.25 2 1.43 85.1 3 S 2 3 SB 3 1,2,3,4 3 3 12.3 3 3 3.00 3.32 High
1285 Invertebrate Octopus berrima 23 659002 Octopodidae an octopus (not designated) DI 1.2 1 1.2 1 3 50.0 1 50.0 2 DS 2 3.55 3 1.86 0.0 1 A 3 1 HB,SB 3 1,2,3,4 3 3 50.0 3 3 1.65 2.48 Low
1297 Invertebrate Amoria (Amoria) undulata 24 207007 Volutidae Wavy Volute DI 3 3 3 12.1 1 12.1 1 DS 2 2.00 1 2.00 0.4 1 A 3 1 HB,SB 3 1,2,3,4 3 3 12.1 3 3 1.65 2.59 Low
1298 Invertebrate Ceratosoma brevicaudatum 24 432001 Chromodorididae a nudibranch (not designated) DI 3 3 3 13.0 1 13.0 1 DS 2 3.30 3 2.29 0.1 1 A 3 1 HB,SB 3 1,2,3,4 3 3 13.0 3 3 1.65 2.82 Med
1304 Invertebrate Ophionereis schayeri 25 179009 Ophionereididae a brittlestar (not designated) DI 3 3 1564 2 15.0 1 15.0 1 DS 2 3.40 3 2.14 4.1 1 A 3 1 HB,SB 3 1,2,3,4 3 3 15.0 3 3 1.65 2.70 Med
1306 Invertebrate Ophiothrix (Ophiothrix) caespitosa 25 192002 Ophiotrichidae a brittlestar (not designated) DI 8.0 2 8.0 1 3 50.0 1 50.0 2 DS 2 3 2.00 9.0 1 A 3 1 HB,SB 3 1,2,3,4 3 3 50.0 3 3 1.65 2.59 Low
1342 Invertebrate Lamarckdromia globosa 28 852002 Dromiidae Fringed Sponge Crab DI 3 3 3 4.0 1 4.0 1 BG 2 2.60 1 2.00 3.9 1 A 3 1 HB,SB 3 1,2,3,4 3 3 4.0 1 3 1.20 2.33 Low
1348 Invertebrate Ovalipes australiensis 28 911003 Portunidae Common Sand Crab DI 3 3 3 10.0 1 10.0 1 BG 2 2.60 1 2.00 0.7 1 A 3 1 HB,SB 3 1,2,3 3 3 10.0 3 3 1.65 2.59 Low
1367 Teleost Neosebastes bougainvillii 37 287004 Neosebastidae Gulf Gurnard Perch DI 3 3 3 40.0 1 23.8 1 BS 1 3.01 2 2.00 31.7 3 S 2 3 HB,SB 3 2,3,4, 3 3 23.8 3 3 3.00 3.61 High
Stakeholder panel considered that this species has a wide distribution and there was little risk to this species.
1401 Teleost Eubalichthys quadrispinis 37 465032 Monacanthidae Fourspine Leatherjacket DI 3.5 1 14.2 2 700000 1 41.0 1 23.8 1 DS 2 2.79 2 1.43 0.1 1 A 3 1 HB,SB 3 4 1 3 23.8 3 3 1.65 2.18 Low
Stakeholder panel agreed that information regarding the distribution of this species in Spencer Gulf was divergent or insufficient and a more precautionary approach was appropriate for the purposes of considering management

95
ERA species ID Taxa grp Scientific name
CAAB code Family Common name R
ole
in f
ish
ery
P1
Avg
age
-at-
mat
uri
ty
P1 P2
Avg
max
age
P2 P3
Fec
un
dit
y
P3 P4
Avg
max
siz
e
P4 P5
Avg
siz
e-a
t-m
atu
rity
P5 P6
Rep
rod
str
ate
gy
P6 P7
Tro
ph
ic le
vel (
Fish
bas
e)
P7 Pro
du
ctiv
ity
S1a
%O
verl
ap w
/ fi
sher
y
S1a S1b
Glo
bal
dis
trib
n
S1b S1 S2a
Ad
ult
hab
itat
ove
rlap
S2a S2b
Bat
hym
ove
rlap
S2b S2 S3 S
ize
use
d f
or
sele
ctiv
ity
S3 S4 P
CM
(=1
-PC
S)
S4 Susc
epti
bili
ty
2D
-ris
k va
lue
Risk category
Comments*
arrangements to mitigate potential risk.
1523 Invertebrate Leptomithrax gaimardii 28 880010 Majidae Great Spider Crab DI 3 3 3 12.5 1 12.5 1 BG 2 2.60 1 2.00 10.7 2 A 3 2 HB,SB 3 1,2,3,4 3 3 12.5 3 3 2.33 3.07 Med
1537 Invertebrate Melicertus latisulcatus 28 711047 Penaeidae King Prawn TA 0.5 1 4.0 1 105000 1 15.3 1 12.0 1 BS 1 2.70 1 1.00 83.9 3 W 1 3 SB,BP 3 1.2.3'4 3 3 12.0 3 3 3.00 3.16 Med
1664 Teleost Hippocampus abdominalis 37 282120 Syngnathidae Bigbelly Seahorse TEP 0.5 1 4.0 1 300 2 27.0 1 9.4 1 BG 2 2.80 2 1.43 3.7 1 S 2 1 SB,HB 3 1,2,3,4 3 3 9.4 3 3 1.65 2.18 Low
1806 Invertebrate Ibacus peronii 28 821004 Scyllaridae Eastern Balmain Bug BP 3.9 1 3 3000 2 11.1 1 6.3 1 BG 2 2.60 1 1.57 66.0 3 A 3 3 SB 3 1,2,3,4 3 3 6.3 2 3 2.33 2.81 Med
1808 Invertebrate Luidia australiae 25 105001 Luidiidae a seastar (not designated) DI 3 3 3 25.0 1 25.0 1 BS 1 3.40 3 2.14 0.5 1 A 3 1 HB,SB 3 1,2,3,4 3 3 25.0 3 3 1.65 2.70 Med
1822 Teleost Sillago bassensis 37 330002 Sillaginidae School Whiting DI 2.7 1 8.7 1 77468 1 32.2 1 17.1 1 BS 1 2.84 2 1.14 24.6 2 A 3 2 HB,SB,BP 3 1,2,3 3 3 17.1 3 3 2.33 2.59 Low
2495 Teleost Kanekonia queenslandica 37 290007 Aploactinidae Deep Velvetfish DI 3 3 3 13.1 1 4.7 1 3 2.98 2 2.29 3.0 1 S 2 1 HB 2 2,3,4 3 3 4.7 2 3 1.43 2.69 Med
2721 Invertebrate Erugosquilla grahami 28 051032 Squillidae a mantis shrimp (not designated) DI 2.5 1 2.5 1 3 13.0 1 13.0 1 DS 2 3.50 3 1.71 49.1 3 W 1 3 SB, HB 3 1,2,3,4 3 3 13.0 3 0.5 2 2.33 2.89 Med
7620 Teleost Trachichthys australis 37 255015 Trachichthyidae Southern Roughy DI 4.9 1 17.5 2 3 15.0 1 10.0 1 BS 1 3.00 2 1.57 0.6 1 S 2 1 HB, BP 3 1,2,3 3 3 10.0 3 3 1.65 2.28 Low
7644 Teleost Optivus agrammus 37 255016 Trachichthyidae Western Roughy DI 3.3 1 10.7 2 3 9.1 1 6.4 1 BS 1 3.44 3 1.71 0.1 1 A 3 1 HB 2 3,4 3 3 6.4 2 3 1.43 2.23 Low
Stakeholder panel discussed information regarding the distribution of this species in Spencer Gulf and if a more precautionary level of risk rating be considered. Risk rating was considered to be no higher than Medium and no further assessment was required following the stakeholder panel’s consideration.
7761 Teleost Pelates octolineatus 37 321020 Terapontidae Western Striped Grunter DI 2.0 1 8.1 1 500000 1 28.0 1 24.9 1 BG 2 3.00 2 1.29 28.5 2 A 3 2 SB 3 2 2 3 24.9 3 3 2.33 2.66 Med
Unlikely to occur at depths >10 m, also patchy in distribution (pers. comm. Martin Gomon, email 15/2/13)
7771 Teleost Maxillicosta scabriceps 37 287007 Neosebastidae Little Gurnard Perch DI 3 3 3 40.0 1 8.2 1 BS 1 2.84 2 2.00 81.1 3 A 3 3 HB, SB 3 1,2,3,4 3 3 8.2 2 3 2.33 3.07 Med
7849 Teleost Neopataecus waterhousii 37 292005 Pataecidae Whiskered Prowfish DI 3 3 3 6.0 1 4.5 1 3 2.92 2 2.29 0.0 1 A 3 1 SB 3 3 3 3 4.5 2 3 1.43 2.69 Med
7915 Teleost Cnidoglanis macrocephalus 37 192001 Plotosidae Estuary Cobbler DI 2.4 1 14.4 2 500 2 91.0 1 42.1 2 BR 3 2.46 1 1.71 0.8 1 A 3 1 SB 3 1,2,3 3 3 42.1 3 3 1.65 2.38 Low
7947 Teleost Rhycherus filamentosus 37 210006 Antennariidae Tasselled Anglerfish DI 3 3 3 23.0 1 14.6 1 BR 3 3.65 3 2.43 0.1 1 A 3 1 HB 2 1,2,3 3 3 14.6 3 3 1.65 2.94 Med
Stakeholder panel agreed that information regarding the distribution of this species in Spencer Gulf was divergent or insufficient and a more precautionary approach was appropriate for the purposes of considering management
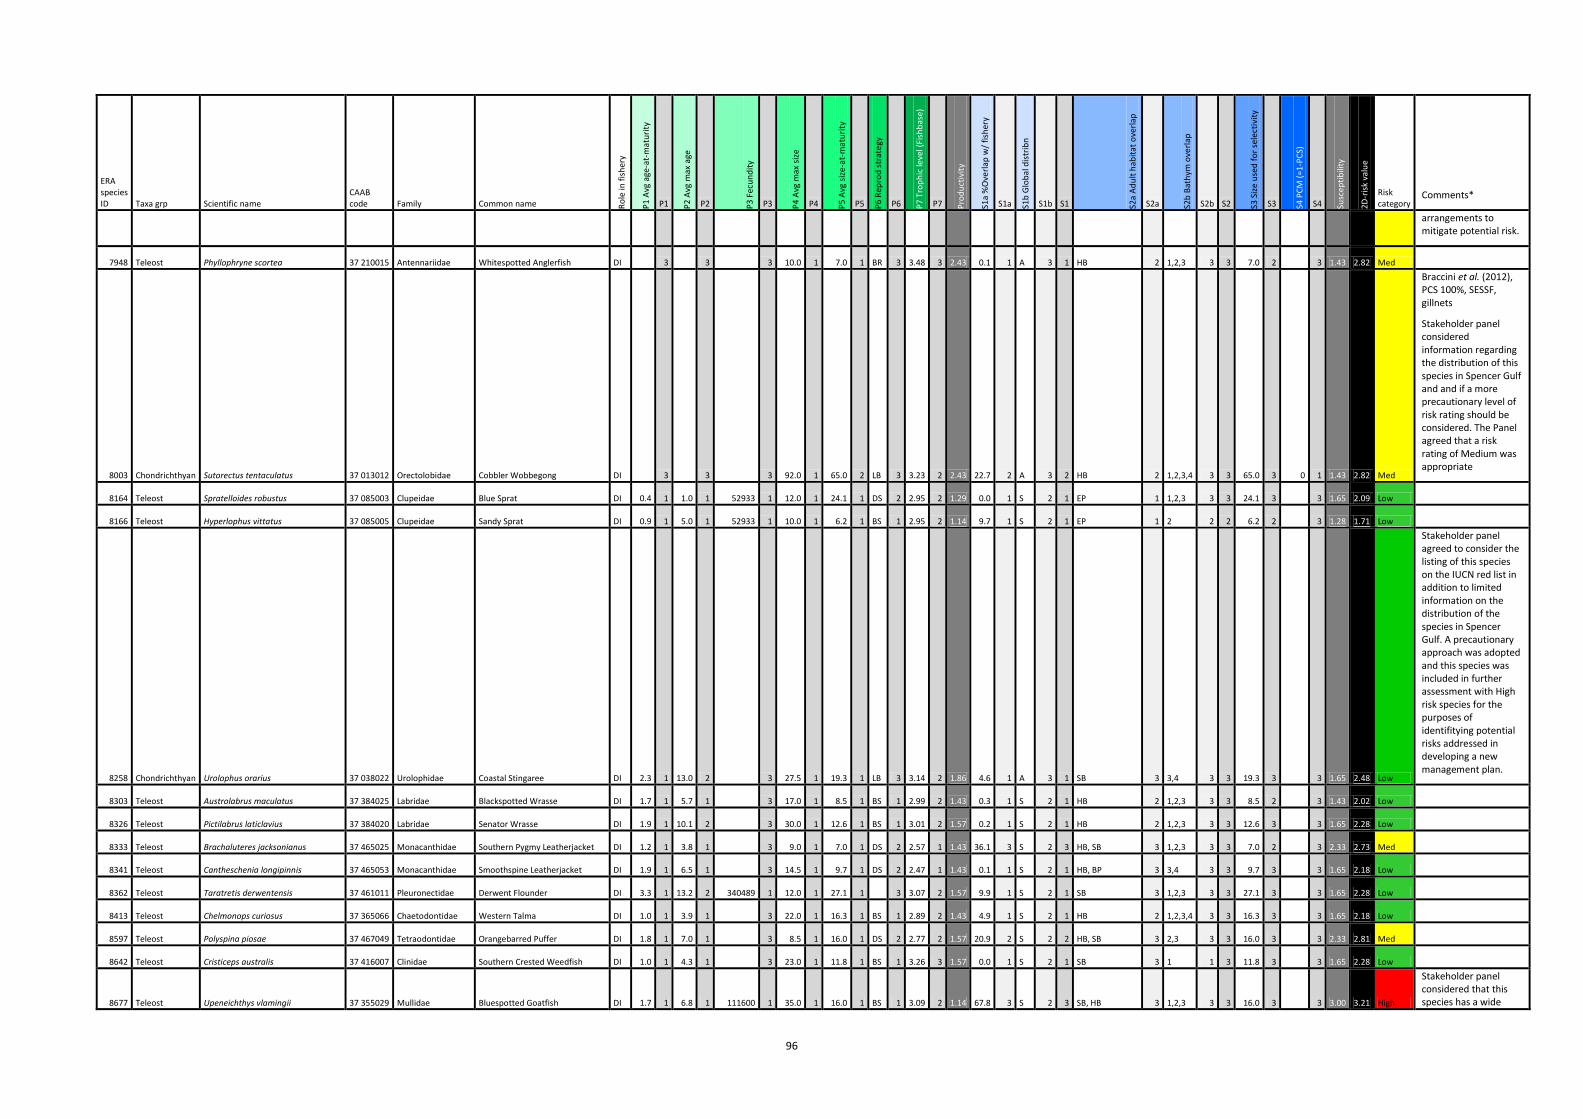
96
ERA species ID Taxa grp Scientific name
CAAB code Family Common name R
ole
in f
ish
ery
P1
Avg
age
-at-
mat
uri
ty
P1 P2
Avg
max
age
P2 P3
Fec
un
dit
y
P3 P4
Avg
max
siz
e
P4 P5
Avg
siz
e-a
t-m
atu
rity
P5 P6
Rep
rod
str
ate
gy
P6 P7
Tro
ph
ic le
vel (
Fish
bas
e)
P7 Pro
du
ctiv
ity
S1a
%O
verl
ap w
/ fi
sher
y
S1a S1b
Glo
bal
dis
trib
n
S1b S1 S2a
Ad
ult
hab
itat
ove
rlap
S2a S2b
Bat
hym
ove
rlap
S2b S2 S3 S
ize
use
d f
or
sele
ctiv
ity
S3 S4 P
CM
(=1
-PC
S)
S4 Susc
epti
bili
ty
2D
-ris
k va
lue
Risk category
Comments*
arrangements to mitigate potential risk.
7948 Teleost Phyllophryne scortea 37 210015 Antennariidae Whitespotted Anglerfish DI 3 3 3 10.0 1 7.0 1 BR 3 3.48 3 2.43 0.1 1 A 3 1 HB 2 1,2,3 3 3 7.0 2 3 1.43 2.82 Med
8003 Chondrichthyan Sutorectus tentaculatus 37 013012 Orectolobidae Cobbler Wobbegong DI 3 3 3 92.0 1 65.0 2 LB 3 3.23 2 2.43 22.7 2 A 3 2 HB 2 1,2,3,4 3 3 65.0 3 0 1 1.43 2.82 Med
Braccini et al. (2012), PCS 100%, SESSF, gillnets
Stakeholder panel considered information regarding the distribution of this species in Spencer Gulf and and if a more precautionary level of risk rating should be considered. The Panel agreed that a risk rating of Medium was appropriate
8164 Teleost Spratelloides robustus 37 085003 Clupeidae Blue Sprat DI 0.4 1 1.0 1 52933 1 12.0 1 24.1 1 DS 2 2.95 2 1.29 0.0 1 S 2 1 EP 1 1,2,3 3 3 24.1 3 3 1.65 2.09 Low
8166 Teleost Hyperlophus vittatus 37 085005 Clupeidae Sandy Sprat DI 0.9 1 5.0 1 52933 1 10.0 1 6.2 1 BS 1 2.95 2 1.14 9.7 1 S 2 1 EP 1 2 2 2 6.2 2 3 1.28 1.71 Low
8258 Chondrichthyan Urolophus orarius 37 038022 Urolophidae Coastal Stingaree DI 2.3 1 13.0 2 3 27.5 1 19.3 1 LB 3 3.14 2 1.86 4.6 1 A 3 1 SB 3 3,4 3 3 19.3 3 3 1.65 2.48 Low
Stakeholder panel agreed to consider the listing of this species on the IUCN red list in addition to limited information on the distribution of the species in Spencer Gulf. A precautionary approach was adopted and this species was included in further assessment with High risk species for the purposes of identifitying potential risks addressed in developing a new management plan.
8303 Teleost Austrolabrus maculatus 37 384025 Labridae Blackspotted Wrasse DI 1.7 1 5.7 1 3 17.0 1 8.5 1 BS 1 2.99 2 1.43 0.3 1 S 2 1 HB 2 1,2,3 3 3 8.5 2 3 1.43 2.02 Low
8326 Teleost Pictilabrus laticlavius 37 384020 Labridae Senator Wrasse DI 1.9 1 10.1 2 3 30.0 1 12.6 1 BS 1 3.01 2 1.57 0.2 1 S 2 1 HB 2 1,2,3 3 3 12.6 3 3 1.65 2.28 Low
8333 Teleost Brachaluteres jacksonianus 37 465025 Monacanthidae Southern Pygmy Leatherjacket DI 1.2 1 3.8 1 3 9.0 1 7.0 1 DS 2 2.57 1 1.43 36.1 3 S 2 3 HB, SB 3 1,2,3 3 3 7.0 2 3 2.33 2.73 Med
8341 Teleost Cantheschenia longipinnis 37 465053 Monacanthidae Smoothspine Leatherjacket DI 1.9 1 6.5 1 3 14.5 1 9.7 1 DS 2 2.47 1 1.43 0.1 1 S 2 1 HB, BP 3 3,4 3 3 9.7 3 3 1.65 2.18 Low
8362 Teleost Taratretis derwentensis 37 461011 Pleuronectidae Derwent Flounder DI 3.3 1 13.2 2 340489 1 12.0 1 27.1 1 3 3.07 2 1.57 9.9 1 S 2 1 SB 3 1,2,3 3 3 27.1 3 3 1.65 2.28 Low
8413 Teleost Chelmonops curiosus 37 365066 Chaetodontidae Western Talma DI 1.0 1 3.9 1 3 22.0 1 16.3 1 BS 1 2.89 2 1.43 4.9 1 S 2 1 HB 2 1,2,3,4 3 3 16.3 3 3 1.65 2.18 Low
8597 Teleost Polyspina piosae 37 467049 Tetraodontidae Orangebarred Puffer DI 1.8 1 7.0 1 3 8.5 1 16.0 1 DS 2 2.77 2 1.57 20.9 2 S 2 2 HB, SB 3 2,3 3 3 16.0 3 3 2.33 2.81 Med
8642 Teleost Cristiceps australis 37 416007 Clinidae Southern Crested Weedfish DI 1.0 1 4.3 1 3 23.0 1 11.8 1 BS 1 3.26 3 1.57 0.0 1 S 2 1 SB 3 1 1 3 11.8 3 3 1.65 2.28 Low
8677 Teleost Upeneichthys vlamingii 37 355029 Mullidae Bluespotted Goatfish DI 1.7 1 6.8 1 111600 1 35.0 1 16.0 1 BS 1 3.09 2 1.14 67.8 3 S 2 3 SB, HB 3 1,2,3 3 3 16.0 3 3 3.00 3.21 High
Stakeholder panel considered that this species has a wide

97
ERA species ID Taxa grp Scientific name
CAAB code Family Common name R
ole
in f
ish
ery
P1
Avg
age
-at-
mat
uri
ty
P1 P2
Avg
max
age
P2 P3
Fec
un
dit
y
P3 P4
Avg
max
siz
e
P4 P5
Avg
siz
e-a
t-m
atu
rity
P5 P6
Rep
rod
str
ate
gy
P6 P7
Tro
ph
ic le
vel (
Fish
bas
e)
P7 Pro
du
ctiv
ity
S1a
%O
verl
ap w
/ fi
sher
y
S1a S1b
Glo
bal
dis
trib
n
S1b S1 S2a
Ad
ult
hab
itat
ove
rlap
S2a S2b
Bat
hym
ove
rlap
S2b S2 S3 S
ize
use
d f
or
sele
ctiv
ity
S3 S4 P
CM
(=1
-PC
S)
S4 Susc
epti
bili
ty
2D
-ris
k va
lue
Risk category
Comments*
distribution and there was little risk to this species.
8682 Teleost Parapriacanthus elongatus 37 357002 Pempheridae Elongate Bullseye DI 1.2 1 4.2 1 3 13.0 1 9.4 1 BS 1 2.93 2 1.43 71.5 3 A 3 3 HB, BP 3 1,2,3 3 3 9.4 3 3 3.00 3.32 High
Stakeholder panel considered that this species has a wide distribution and there was little risk to this species.
8683 Teleost Pempheris klunzingeri 37 357003 Pempherididae Rough Bullseye DI 1.5 1 5.4 1 3 21.0 1 11.8 1 BS 1 2.96 2 1.43 17.4 2 S 2 2 HB 2 1,2 2 2 11.8 3 3 1.88 2.36 Low
8719 Teleost Vincentia conspersa 37 327033 Apogonidae Southern Cardinalfish DI 0.8 1 2.6 1 3 14.0 1 9.4 1 BR 3 3.00 2 1.71 3.3 1 A 3 1 HB 2 1,2,3,4 3 3 9.4 3 3 1.65 2.38 Low
8863 Teleost Parapercis ramsayi 37 390002 Pinguipedidae Spotted Grubfish DI 1.3 1 4.6 1 3 20.0 1 12.9 1 BS 1 2.98 2 1.43 16.1 2 S 2 2 HB, SB 3 1,2,3 3 3 12.9 3 3 2.33 2.73 Med
8875 Teleost Siphonognathus attenuatus 37 385004 Odacidae Slender Weed Whiting DI 1.1 1 2.2 1 3 14.0 1 8.2 1 3 2.76 2 1.71 0.2 1 S 2 1 HB 2 1,2,3 3 3 8.2 2 3 1.43 2.23 Low
8880 Teleost Siphonognathus radiatus 37 385007 Odacidae Longray Weed Whiting DI 1.5 1 5.5 1 3 18.0 1 11.8 1 3 3.02 2 1.71 0.2 1 S 2 1 HB 2 1,2 2 2 11.8 3 3 1.43 2.23 Low
8881 Teleost Siphonognathus argyrophanes 37 385008 Odacidae Tubemouth DI 2.9 1 11.9 2 3 40.0 1 23.8 1 3 3.01 2 1.86 2.1 1 S 2 1 SB 3 1,2,3 3 3 23.8 3 3 1.65 2.48 Low
8883 Teleost Odax acroptilus 37 385010 Odacidae Rainbow Cale DI 1.8 1 6.8 1 3 24.0 1 14.8 1 3 2.62 1 1.57 2.2 1 S 2 1 HB, SB 3 1,2,3 3 3 14.8 3 3 1.65 2.28 Low
8884 Teleost Siphonognathus caninis 37 385011 Odacidae Sharpnose Weed Whiting DI 1.0 1 3.2 1 3 10.0 1 7.0 1 3 2.81 2 1.71 1.5 1 S 2 1 HB, SB 3 1,2,3 3 3 7.0 2 3 1.43 2.23 Low
8887 Teleost Parapercis haackei 37 390004 Pinguipedidae Wavy Grubfish DI 0.7 1 2.4 1 3 11.0 1 7.0 1 BS 1 2.79 2 1.43 32.3 3 S 2 3 HB, SB 3 1,2,3,4 3 3 7.0 2 3 2.33 2.73 Med
8971 Teleost Neoodax balteatus 37 385005 Odacidae Little Weed Whiting DI 1.2 1 4.4 1 3 14.0 1 9.4 1 3 2.95 2 1.71 0.0 1 S 2 1 HB, SB 3 1,2,3 3 3 9.4 3 3 1.65 2.38 Low
8988 Teleost Vincentia badia 37 327120 Apogonidae Scarlet Cardinalfish DI 0.6 1 1.9 1 3 14.0 1 7.0 1 BR 3 3.01 2 1.71 32.8 3 A 3 3 HB, BP 3 1,2,3,4 3 3 7.0 2 3 2.33 2.89 Med
8989 Teleost Vincentia macrocauda 37 327122 Apogonidae Smooth Cardinalfish DI 0.6 1 1.9 1 3 10.0 1 7.0 1 BR 3 3.01 2 1.71 0.5 1 A 3 1 HB 2 1,2,3,4 3 3 7.0 2 3 1.43 2.33 Low
Stakeholder panel discussed information regarding the distribution of this species in Spencer Gulf and if a more precautionary level of risk rating be considered. The panel agreed howere that no further assessment was required.
9240 Invertebrate Ischnochiton (Heterozona) cariosus 23 115023 Ischnochitonidae a chiton (not designated) DI 3 3 3 5.0 1 5.0 1 BS 1 3.00 2 2.00 0.8 1 A 3 1 HB 2 1,2,3 3 3 5.0 2 3 1.43 2.46 Low
9241 Invertebrate Pinna bicolor 23 245001 Pinnidae Razor Clam DI 1.0 1 3 3 50.0 1 15.0 1 BS 1 2.23 1 1.57 0.9 1 W 1 1 SB 3 1 1 3 15.0 3 3 1.65 2.28 Low
9242 Invertebrate Equichlamys bifrons 23 270005 Pectinidae Queen Scallop DI 3 3 3 11.0 1 11.0 1 BS 1 2.00 1 1.86 28.2 2 A 3 2 HB,SB 3 1,2,3 3 3 11.0 3 3 2.33 2.98 Med
9243 Invertebrate Acrosterigma cygnorum 23 335019 Cardiidae Heart Cockle DI 3 3 3 5.5 1 5.5 1 BS 1 2.00 1 1.86 3.0 1 S 2 1 SB 3 1,2,3,4 3 3 5.5 2 3 1.43 2.34 Low
9244 Invertebrate Dosinia victoriae 23 380013 Veneridae a venus cockle (not designated) DI 3 3 3 5.0 1 5.0 1 BS 1 2.00 1 1.86 10.0 2 A 3 2 SB 3 1,2 2 3 5.0 2 3 1.88 2.64 Low
9245 Invertebrate Cleidothaerus albidus 23 423001 Cleidothaeridae a rock shell (not designated) DI 3 3 3 5.0 1 5.0 1 BS 1 2.23 1 1.86 16.0 2 A 3 2 HB 2 1 1 2 5.0 2 3 1.58 2.44 Low
9246 Invertebrate Sepia apama 23 607001 Sepiidae Giant Cuttlefish DI 0.6 1 2.0 1 3 80.0 1 80.0 2 DS 2 3.60 3 1.86 25.1 2 A 3 2 HB, BP 3 1,2,3 3 3 80.0 3 3 2.33 2.89 Med
Stakeholder panel agreed to consider unpublished information that the population in the northern Spencer Gulf may be genetically distinct (de Vries et al.

98
ERA species ID Taxa grp Scientific name
CAAB code Family Common name R
ole
in f
ish
ery
P1
Avg
age
-at-
mat
uri
ty
P1 P2
Avg
max
age
P2 P3
Fec
un
dit
y
P3 P4
Avg
max
siz
e
P4 P5
Avg
siz
e-a
t-m
atu
rity
P5 P6
Rep
rod
str
ate
gy
P6 P7
Tro
ph
ic le
vel (
Fish
bas
e)
P7 Pro
du
ctiv
ity
S1a
%O
verl
ap w
/ fi
sher
y
S1a S1b
Glo
bal
dis
trib
n
S1b S1 S2a
Ad
ult
hab
itat
ove
rlap
S2a S2b
Bat
hym
ove
rlap
S2b S2 S3 S
ize
use
d f
or
sele
ctiv
ity
S3 S4 P
CM
(=1
-PC
S)
S4 Susc
epti
bili
ty
2D
-ris
k va
lue
Risk category
Comments*
in prep) and has declined in abundance in this area since the 2007 by-catch survey. A precautionary approach was adopted and this species was included in further assessment with High risk species for the purposes of identifitying potential risks addressed in developing a new management plan.
9247 Invertebrate Sepia novaehollandae 23 607005 Sepiidae a cuttlefish (not designated) DI 1.0 1 1.0 1 3 17.0 1 17.0 1 DS 2 3.60 3 1.71 66.8 3 A 3 3 3 2,3,4 3 3 17.0 3 3 3.00 3.46 High
Stakeholder panel considered that this species has a wide distribution and there was little risk to this species.
9248 Invertebrate Sepioloidea lineolata 23 608001 Sepiadariidae Pinstripe Bottle-Tailed Squid DI 3 3 3 5.0 1 5.0 1 DS 2 3.60 3 2.29 11.1 2 A 3 2 SB, BP 3 1,2 2 3 5.0 2 3 1.88 2.96 Med
9249 Invertebrate Sepiadarium austrinum 23 608003 Sepiadariidae Southern Bottletail Squid DI 3 3 3 4.0 1 4.0 1 DS 2 3.60 3 2.29 15.8 2 A 3 2 SB 3 2,3 3 3 4.0 1 3 1.43 2.69 Med
9250 Invertebrate Octopus australis 23 659001 Octopodidae Southern Octopus DI 3 3 3 9.0 1 9.0 1 DS 2 3.58 3 2.29 58.6 3 A 3 3 SB 3 1,2,3,4 3 3 9.0 2 1 1.43 2.69 Med
Most octopus are lively and active after sorting from trawl by-catch, high post-discard survival
9251 Invertebrate Diodora lincolnensis 24 040002 Fissurellidae a keyhole limpet (not designated) DI 3 3 3 6.3 1 6.3 1 3 2.00 1 2.14 0.5 1 A 3 1 HB 2 1,2,3 3 3 6.3 2 3 1.43 2.57 Low
9252 Invertebrate Tugali cicatricosa 24 040007 Fissurellidae a shield limpet (not designated) DI 3 3 3 3.0 1 3.0 1 3 2.00 1 2.14 1.2 1 A 3 1 HB 2 2 2 2 3.0 1 3 1.13 2.42 Low
9253 Invertebrate Clanculus flagellatus 24 046124 Trochidae a topshell (not designated) DI 3 3 3 1.2 1 1.2 1 3 3.06 2 2.29 8.1 1 A 3 1 HB 2 1 1 2 1.2 1 3 1.13 2.55 Low
9254 Invertebrate Astele (Astele) armillatum 24 047011 Calliostomatidae a topshell (not designated) DI 3 3 3 3.5 1 3.5 1 DS 2 3.06 2 2.14 18.0 2 A 3 2 HB 2 1,2,3 3 3 3.5 1 3 1.43 2.57 Low
9255 Invertebrate Zoila friendii thersites 24 155035 Cypraeidae Black Cowry DI 3 3 3 13.0 1 13.0 1 DS 2 3.06 2 2.14 0.1 1 A 3 1 HB, SB 3 1,2,3,4 3 3 13.0 3 3 1.65 2.70 Med
Stakeholder panel agreed that information regarding the distribution of this species in Spencer Gulf was divergent or insufficient and a more precautionary approach was appropriate for the purposes of considering management arrangements to mitigate potential risk.
9256 Invertebrate Cymatiella verrucosa 24 176057 Ranellidae a triton shell (not designated) DI 3 3 3 2.5 1 2.5 1 3 3.06 2 2.29 0.5 1 A 3 1 HB 2 1,2 2 2 2.5 1 3 1.13 2.55 Low
Stakeholder panel agreed that information regarding the distribution of this species in Spencer Gulf was divergent or insufficient and a more

99
ERA species ID Taxa grp Scientific name
CAAB code Family Common name R
ole
in f
ish
ery
P1
Avg
age
-at-
mat
uri
ty
P1 P2
Avg
max
age
P2 P3
Fec
un
dit
y
P3 P4
Avg
max
siz
e
P4 P5
Avg
siz
e-a
t-m
atu
rity
P5 P6
Rep
rod
str
ate
gy
P6 P7
Tro
ph
ic le
vel (
Fish
bas
e)
P7 Pro
du
ctiv
ity
S1a
%O
verl
ap w
/ fi
sher
y
S1a S1b
Glo
bal
dis
trib
n
S1b S1 S2a
Ad
ult
hab
itat
ove
rlap
S2a S2b
Bat
hym
ove
rlap
S2b S2 S3 S
ize
use
d f
or
sele
ctiv
ity
S3 S4 P
CM
(=1
-PC
S)
S4 Susc
epti
bili
ty
2D
-ris
k va
lue
Risk category
Comments*
precautionary approach was appropriate for the purposes of considering management arrangements to mitigate potential risk
9257 Invertebrate Fusinus australis 24 202004 Buccinidae a spindle shell (not designated) DI 3 3 3 11.0 1 11.0 1 BS 1 3.06 2 2.00 7.9 1 A 3 1 HB, SB 3 1,2,3 3 3 11.0 3 3 1.65 2.59 Low
9258 Invertebrate Ptilometra macronema 25 047001 Ptilometridae a crinoid (not designated) DI 3 3 3 8.0 1 8.0 1 3 2.38 1 2.14 14.8 2 A 3 2 HB 2 2,3,4 3 3 8.0 2 3 1.88 2.85 Med
9259 Invertebrate Astropecten triseriatus 25 111013 Astropectinidae a seastar (not designated) DI 3 3 3 11.0 1 11.0 1 BS 1 3.40 3 2.14 0.2 1 W 1 1 SB 3 1,2,3 3 3 11.0 3 3 1.65 2.70 Med
9260 Invertebrate Goniodiscaster seriatus 25 127033 Oreasteridae a seastar (not designated) DI 3 3 3 8.0 1 8.0 1 BS 1 3.40 3 2.14 5.0 1 A 3 1 SB 3 1,2,3 3 3 8.0 2 3 1.43 2.57 Low
Stakeholder panel agreed that information regarding the distribution of this species in Spencer Gulf was divergent or insufficient and a more precautionary approach was appropriate for the purposes of considering management arrangements to mitigate potential risk
9261 Invertebrate Conocladus australis 25 171001 Gorgonocephalidae Southern Basketstar DI 3 3 3 15.0 1 15.0 1 BS 1 2.38 1 1.86 3.9 1 A 3 1 HB 2 1,2,3,4 3 3 15.0 3 3 1.65 2.48 Low
9262 Invertebrate Goniocidaris tubaria 25 202007 Cidaridae a sea urchin (not designated) DI 20.0 3 20.0 2 3 8.0 1 8.0 1 BS 1 2.30 1 1.71 5.8 1 A 3 1 HB 2 1,2,3,4 3 3 8.0 2 3 1.43 2.23 Low
9263 Invertebrate Centrostephanus tenuispinus 25 211002 Diadematidae Longspine Sea Urchin DI 1.0 1 16.0 2 3 10.0 1 4.0 1 BS 1 2.30 1 1.43 2.4 1 A 3 1 HB 2 1,2,3 3 3 4.0 1 3 1.20 1.87 Low
Previously misidentified as C. rodgersii (Sorokin/Shepherd, pers. comm. by email). Stakeholder panel discussed information regarding the distribution of this species in Spencer Gulf and if a more precautionary level of risk rating be considered. The panel agreed howere that no further assessment was required..
9264 Invertebrate Amblypneustes pallidus 25 241007 Temnopleuridae a sea urchin (not designated) DI 20.0 3 20.0 2 3 2.5 1 2.5 1 BS 1 2.30 1 1.71 3.6 1 A 3 1 HB, SB 3 1,2,3,4 3 3 2.5 1 3 1.20 2.09 Low
9265 Invertebrate Ceto cuvieria 25 404001 Psolidae a holothurian (not designated) DI 3 3 3 9.8 1 9.8 1 BS 1 2.00 1 1.86 0.6 1 A 3 1 HB 2 2,3,4 3 3 9.8 3 3 1.65 2.48 Low
9266 Invertebrate Holothuria (Thymiosycia) hartmeyeri 25 416053 Holothuriidae a holothurian (not designated) DI 3 3 3 25.0 1 25.0 1 BS 1 2.00 1 1.86 46.6 3 A 3 3 HB, SB 3 1,2,3 3 3 25.0 3 3 3.00 3.53 High
Stakeholder panel considered that this species has a wide distribution and there was little risk to this species.

100
ERA species ID Taxa grp Scientific name
CAAB code Family Common name R
ole
in f
ish
ery
P1
Avg
age
-at-
mat
uri
ty
P1 P2
Avg
max
age
P2 P3
Fec
un
dit
y
P3 P4
Avg
max
siz
e
P4 P5
Avg
siz
e-a
t-m
atu
rity
P5 P6
Rep
rod
str
ate
gy
P6 P7
Tro
ph
ic le
vel (
Fish
bas
e)
P7 Pro
du
ctiv
ity
S1a
%O
verl
ap w
/ fi
sher
y
S1a S1b
Glo
bal
dis
trib
n
S1b S1 S2a
Ad
ult
hab
itat
ove
rlap
S2a S2b
Bat
hym
ove
rlap
S2b S2 S3 S
ize
use
d f
or
sele
ctiv
ity
S3 S4 P
CM
(=1
-PC
S)
S4 Susc
epti
bili
ty
2D
-ris
k va
lue
Risk category
Comments*
9267 Invertebrate Nerocila serra 28 223007 Cymothoidae an isopod (not designated) DI 3 3 3 3.2 1 3.2 1 BR 3 3.00 2 2.29 5.7 1 A 3 1 BP 3 3 3 3 3.2 1 3 1.20 2.58 Low
9268 Invertebrate Metapenaeopsis sp. 28 711913 Penaeidae Velvet Prawn DI 3 3 3 2.5 1 2.5 1 BS 1 3.31 3 2.14 78.8 3 W 1 3 SB,HB 3 2,3 3 3 2.5 1 3 1.65 2.70 Med
9269 Invertebrate Alpheus villosus 28 765001 Alpheidae Hairy Pistol Prawn DI 3 3 3 2.6 1 0.2 1 BG 2 3.24 2 2.14 7.0 1 W 1 1 HB 2 1,2,3 3 3 0.2 1 3 1.20 2.46 Low
9270 Invertebrate Alpheus lottini 28 765006 Alpheidae Coral Snapping Shrimp DI 3 3 3 3.0 1 3.0 1 BG 2 3.24 2 2.14 0.5 1 W 1 1 HB, SB 3 1,2,3 3 3 3.0 1 3 1.20 2.46 Low
9271 Invertebrate Processa gracilis 28 768010 Processidae Long-Wristed Shrimp DI 3 3 3 1.2 1 1.2 1 BS 1 2.30 1 1.86 0.1 1 A 3 1 EP,BP,MP 3 2,3,4 3 3 1.2 1 3 1.20 2.21 Low
9272 Invertebrate Paguristes frontalis 28 827003 Diogenidae Common Hermit crab DI 3 3 3 8.0 1 8.0 1 BR 3 2.70 1 2.14 2.1 1 A 3 1 HB 2 1 1 2 8.0 2 3 1.28 2.49 Low
9273 Invertebrate Austrodromidia octodentata 28 852001 Dromiidae Bristled Sponge Crab DI 0.4 1 5.0 1 3 7.5 1 0.6 1 BR 3 2.70 1 1.57 1.9 1 A 3 1 HB 2 1,2,3,4 3 3 0.6 1 3 1.20 1.98 Low
9274 Invertebrate Austrodromidia australis 28 852015 Dromiidae Southern Sponge Crab DI 0.4 1 5.0 1 3 3.5 1 0.6 1 BR 3 2.70 1 1.57 10.4 2 A 3 2 HB, SB 3 1,2,3,4 3 3 0.6 1 3 1.43 2.12 Low
9275 Invertebrate Naxia aurita 28 880007 Majidae Golden Decorator Crab DI 3 3 3 4.0 1 4.0 1 3 2.70 1 2.14 2.2 1 A 3 1 SB 3 1 1 3 4.0 1 3 1.20 2.46 Low
9276 Invertebrate Naxia aries 28 880089 Majidae Ramshorn Crab DI 3 3 3 3.7 1 3.7 1 3 2.70 1 2.14 8.9 1 A 3 1 HB,SB 3 1,2,3,4 3 3 3.7 1 3 1.20 2.46 Low
9277 Invertebrate Gomeza bicornis 28 900001 Corystidae Masked Burrowing Crab DI 3 3 3 2.1 1 2.1 1 3 2.70 1 2.14 3 S 2 2 HB, SB 3 4 1 3 2.1 1 3 1.43 2.57 Low
Stock structure proxy = 3H
9278 Invertebrate Nectocarcinus integrifrons 28 911010 Portunidae Rough Rock Crab DI 3 3 3 8.0 1 8.0 1 3 3.56 3 2.43 18.6 2 A 3 2 SB 3 1 1 3 8.0 2 3 1.88 3.07 Med
9279 Invertebrate Actaea calculosa 28 920002 Xanthidae Facetted Crab DI 3 3 3 2.0 1 2.0 1 3 2.70 1 2.14 2.3 1 S 2 1 HB 2 1,2,3 3 3 2.0 1 3 1.20 2.46 Low
9280 Invertebrate Pilumnidae - undifferentiated 28 926000 Pilumnidae HAIRY CRAB DI 3 3 3 4.0 1 4.0 1 3 2.70 1 2.14 24.8 2 A 3 2 HB 2 1,2,3,4 3 3 4.0 1 3 1.43 2.57 Low
9281 Teleost Aulopus purpurissatus 37 117001 Aulopidae Sergeant Baker DI 30.0 3 30.0 3 3 69.0 1 34.1 1 BS 1 4.01 3 2.14 0.1 1 A 3 1 HB 2 1,2,3,4 3 3 34.1 3 3 1.65 2.70 Med
9282 Teleost Histiophryne cryptacanthus 37 210013 Antennariidae Rodless Anglerfish DI 3 3 3 9.0 1 6.4 1 BR 3 3.22 2 2.29 0.2 1 S 2 1 HB 2 1,2,3,4 3 3 6.4 2 3 1.43 2.69 Med
9283 Teleost Leviprora inops 37 296005 Platycephalidae Longhead Flathead DI 3.3 1 8.9 1 1500000 1 29.2 1 31.2 1 BS 1 3.24 2 1.14 2.1 1 S 2 1 SB 3 1,2,3 3 3 31.2 3 3 1.65 2.01 Low
9284 Teleost Thysanophrys cirronasa 37 296045 Platycephalidae Tasselsnout Flathead DI 3.4 1 9.1 1 1500000 1 38.0 1 32.8 1 BS 1 3.26 3 1.29 29.1 2 S 2 2 HB 2 1,2,3 3 3 32.8 3 3 2.33 2.66 Med
9285 Teleost Cynoglossus broadhursti 37 463015 Cynoglossidae Southern Tongue Sole DI 2.3 1 8.8 1 3 30.0 1 15.5 1 3 3.09 2 1.71 37.3 3 S 2 3 SB 3 1,2,3 3 3 15.5 3 3 3.00 3.46 High
Stakeholder panel considered that this species has a wide distribution and there was little risk to this species.
9286 Chondrichthyan Asymbolus submaculatus 37 015010 Scyliorhinidae Variegated Catshark DI 1.4 1 5.8 1 2 3 43.8 1 45.4 2 DS 2 3.32 3 1.86 0.1 1 A 3 1 HB 2 3,4 3 3 45.4 3 3 1.65 2.48 Low