dJrl qGi'7 I= GW 32236 pop · dJrl qGi'7 I= EXTERIOR STRU- GW Fw

2009/2010 ANNUAL REPORT
ESACD E P A R T m E N T O f N A T i O N A L D E f E N c E
EnvironmEntal SciEncE adviSory committEEc A N A D i A N f O R c E s B A s E E s q U i m A L T

Published By
department of national defencemARPAc, cfB Esquimaltformation safety and EnvironmentBldg. 199 DockyardP.O. Box 17000 station forcesVictoria, B.c. V9A 7N2
cover Photos Photo credits
Darcy mathewsAnnette Potvincanadian forest servicematt fairbarnsBelen Paredes m. Jollychristine BishopBruce cousensR. Hocken
James miskellyKelsey LowAnn NightingaleDerek ParkerAndrea schillerKirsten PriorBrent sinclaircaroline WilliamsPaige Erickson-mcGee
Eco-aUdit EnvironmEntal BEnEFitS
This annual report is printed on mohawk 100% Post-consumer Recycled material.savings derived from using this post-consumer recycled fiber in lieu of virgin fiber are:
Trees Preserved
for the future
2
solid Waste not
generated
108 lbs
Wastewater flow
saved
979 gallons
Energy not
consumed
1,632,000 BTUs
Greenhouse
gases prevented
213 lbs
Waterbourne
waste not
created
7 lbs
The above calculations are based on 240 pounds of paper for 100 annual reports.
Any views expressed in this publication are the views of the authors and do not necessarily reflect those of cfB Esquimalt.
Top Left: Wilson’s Warbler at RPBO Kelsey Low
Top Right: Bull frog at Aldergrove christine Bishop
Bottom: View from church Hill at Rocky Point Paige Erickson-mcGee
natural resources canadacanadian forest servicePacific forestry centre506 West Burnside RoadVictoria, B.c. V8Z 1m5

Environmental Science Advisory Committee 2009/2010 Annual Report
i
The Department of National Defence (DND) Environmental science Advisory committee (EsAc) for cfB Esquimalt was established in 1994 as a multi agency technical advisory committee that reviews and recommends proposals from researchers and other parties interested in carrying out natural resources research on cfB Esquimalt properties. Every year, EsAc collects, reports, and archives the findings of the research activities in a printed and web-based annual report. EsAc also acts as an advisory body to cfB Esquimalt on various environmental issues occurring on cfB Esquimalt properties, and serves as a gateway to a network of scientists accessible to maritime forces Pacific (mARPAc) staff.
in 2009, the committee reviewed 22 proposals to conduct research and collection activities on cfB Esquimalt properties. Each proposal was reviewed by EsAc for scientific content and forwarded to DND to ensure that the proposed activities would not result in any adverse environmental effects or interfere with military operations and activities. Twenty-one EsAc research and collection permits were issued to individuals and organizations authorizing environmental research on cfB Esquimalt lands. A compilation of the scientific reports obtained from each of these authorized research projects as well as a summary of the committee’s activities conducted throughout the year are presented in this annual report.
To facilitate the sharing of research findings collected on cfB Esquimalt land in 2009, the committee hosted its EsAc Annual Workshop on 4 february 2010 at the Pacific forestry centre, Victoria, B.c. Nine presentations, focusing on
wildlife and sensitive ecosystem inventories, monitoring, and restoration were given to personnel from government and non government organizations. The 2009 EsAc Annual Workshop was well attended with over 75 individuals in attendance.
ExEcUtivE SUmmary
P003-09. Northern saw-whet Owl at Rocky Point.
Environmental Science Advisory Committee 2009/2010 Annual Report
ii
taBlE oF contEntS
ExEcUtivE SUmmary i
introdUction 1
cFB ESQUimalt ProPErtiES 2
BacKGroUnd 2members 3
ESac activitiES in 2009 4Table of all EsAc Activities 6
rESEarcH and collEction activitiES condUctEd in 2009
Rocky Point Bird Observatory Avian monitoringPasserine migration monitoring 8Northern saw-whet Owl Project 19Bander Training Workshops 23monitoring Avian Productivity and survivorship (mAPs) 26
monitoring Winter moth and the Parasites introduced for its control 28Purple martin Origins and Relationships 32Wildlife Tree stewardship Program (WiTs) 37Garry Oak Acorn survey 41Atmospheric monitoring and microclimate station Decommissioning 45studies on the Dynamics of Butterflies and their Host Plants in Garry Oak Ecosystems 49christmas Bird count 54
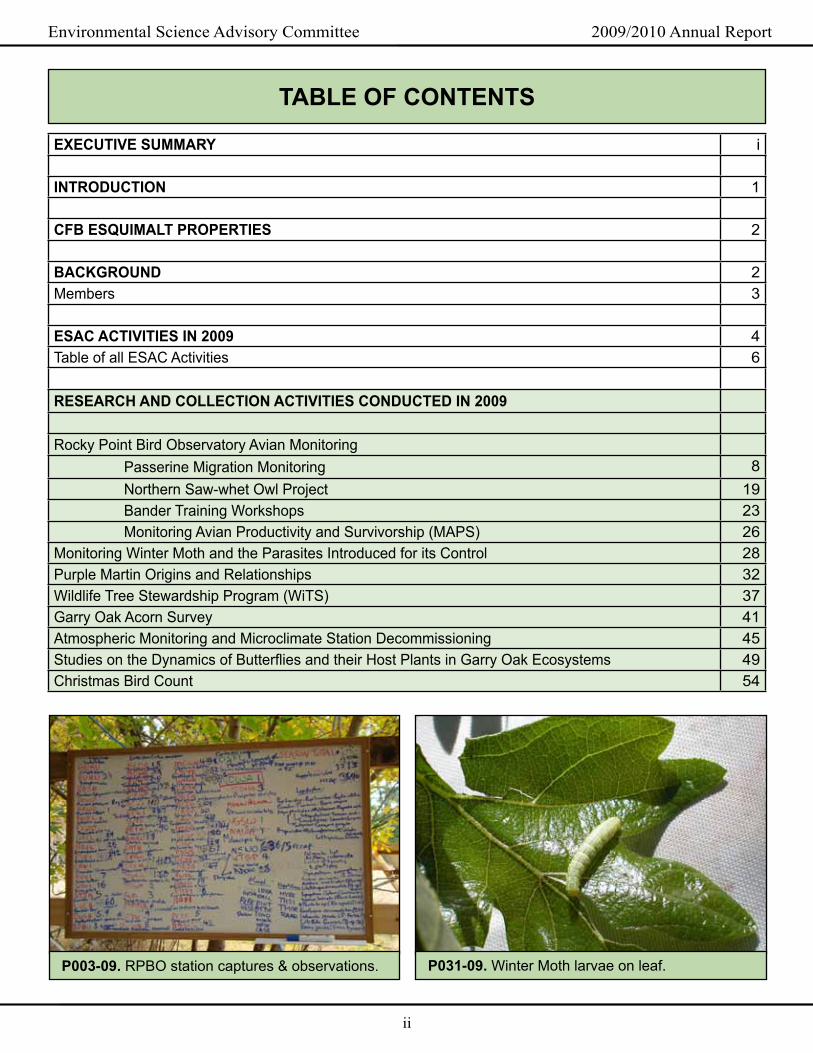
P003-09. RPBO station captures & observations. P031-09. Winter moth larvae on leaf.

Environmental Science Advisory Committee 2009/2010 Annual Report
iii
taBlE oF contEntS continUEd
The strait of Georgia mortuary Landscape Project 59Western Bluebird Nestbox Program 64monitoring of the Oregon spotted frog (Rana pretiosa) 67Year-round microclimates Experienced by Butterfly Larvae in Garry Oak Ecosystems 72Efficacy Testing of Pheromones and Kairomones for Woodboring coleoptera 75monitoring seed Establishment by Purple sanicle and seaside Bird’s-foot Lotus and fluctuations of a coast microseris Population
80
investigations into Environmental contaminants in the Diets of coastal River Otters 83surveys for seaside Birds-foot Trefoil - Lotus formosissimus 91foothill sedge and Lindley's false silverpuffs critical Habitat mapping 93Old-Growth stand structure 96seed collection of Lotus formosissimus for an Experimental Translocation Project. 103Assessing Potential for Population Augmentation of Endangered Oregon spotted frogs: Radio-Telemetry to Determine immediate fate of captive Reared frogs Released on site
107
contaminant Exposure in River Otters (Lontra canadensis): An Assessment of spatial and Geographic Trends in Home Range and Population Demographics
112
acKnoWlEdGEmEntS 115
rEFErEncES 115List of Environmental science Reports for 2009 115List of Environmental science Reports for 2008 116
contact inFormation 117
P044-09. Purple martin adult pair. P044-09. Purple martin nestling banded.

Environmental Science Advisory Committee 2009/2010 Annual Report
1
maritime forces Pacific (mARPAc) constitutes canada’s Navy on the West coast. Her majesty’s canadian Dockyard at canadian forces Base (cfB) Esquimalt is home to the Navy’s canadian Pacific fleet. The role of cfB Esquimalt is to support the ships of the canadian Pacific fleet and other key military units.
With approximately 4,200 hectares of land and multiple properties under its administration (Table 1, figure 1), mARPAc has long acknowledged its responsibility to consider environmental impacts in the management of its training areas and in the planning and conduct of its activities. Efforts to minimize the adverse effects of training and operations in conjunction with innovative
management practices, will ensure continued protection and enhancement of the many significant natural areas and unique features located on cfB Esquimalt lands in British columbia.
mARPAc properties, while utilized for a variety of military purposes, including industrial activities, training exercises, and communications infrastructure, are often relatively undisturbed by human impact. A number of cfB Esquimalt properties support remnants of sensitive ecosystems such as coastal Douglas-fir forests and Garry oak meadows which provide unique opportunities for scientists to conduct an array of environmental studies.
introdUction
P044-09. Purple martin with Dragonfly.
table 1. cfB Esquimalt Properties: Area in hectares (ha).
Albert Head 93Aldergrove (maintenance Detachment) 514colwood 90cfmETER 288Dockyard / signal Hill / Yarrows 63Heals Rifle Range 212mary Hill 178masset 824matsqui TX 95Naden 45Nanaimo Rifle Range 351Nanoose TX 105Rocky Point 1078Royal Roads 229Work Point 66
Total Area 4231

Environmental Science Advisory Committee 2009/2010 Annual Report
2
Advisory committee (EsAc) for cfB Esquimalt. since the creation of the committee, in 1994, EsAc has facilitated and coordinated environmental studies on cfB Esquimalt properties in conjunction with other environmental projects funded by DND. in 2006 the EsAc Letter of Understanding between DND cfB Esquimalt and member agencies, was renewed for another five years (2006-2011).
BacKGroUnd
cFB ESQUimalt ProPErtiES
Prior to 1994, research projects were undertaken by various individuals and organizations on cfB Esquimalt properties. Research was ad hoc and the findings were not readily available to mARPAc personnel for use in environmental management and decision-making. The recognized need for a process to track the research activities and associated findings resulted in the formation of the DND Environmental science
1
Environmental Science Advisory Committee 2009/2010 Annual Report
3
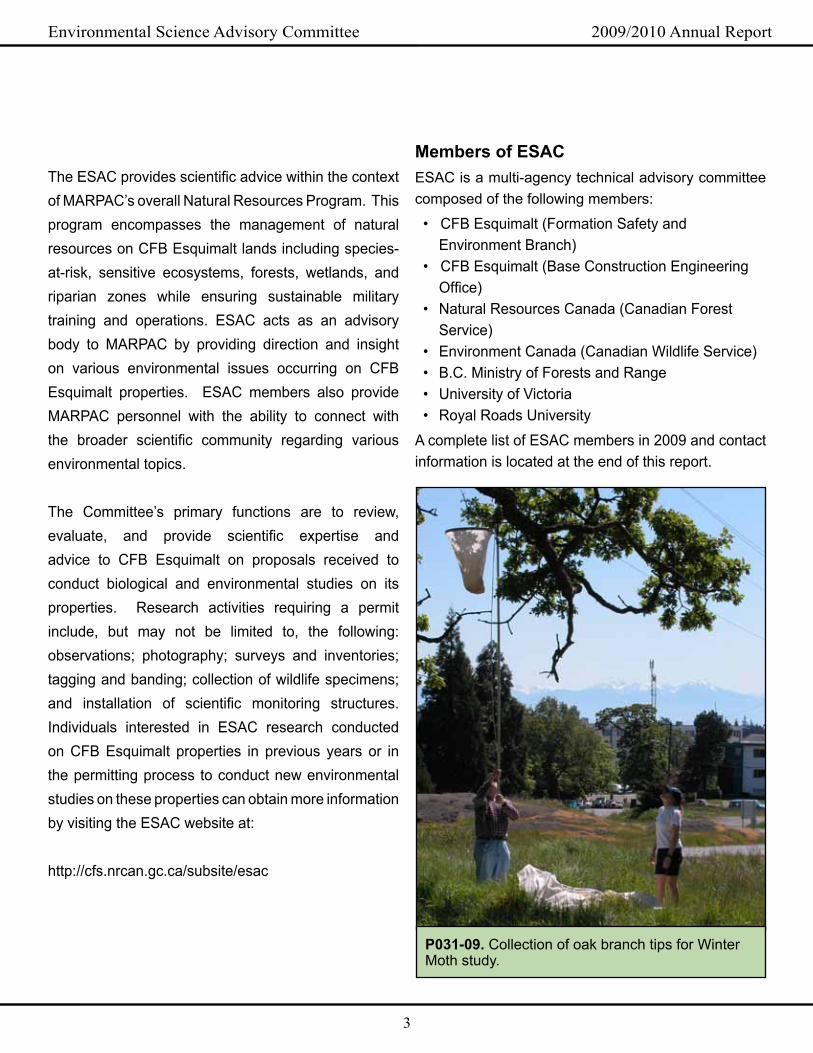
The EsAc provides scientific advice within the context of mARPAc’s overall Natural Resources Program. This program encompasses the management of natural resources on cfB Esquimalt lands including species-at-risk, sensitive ecosystems, forests, wetlands, and riparian zones while ensuring sustainable military training and operations. EsAc acts as an advisory body to mARPAc by providing direction and insight on various environmental issues occurring on cfB Esquimalt properties. EsAc members also provide mARPAc personnel with the ability to connect with the broader scientific community regarding various environmental topics.
The committee’s primary functions are to review, evaluate, and provide scientific expertise and advice to cfB Esquimalt on proposals received to conduct biological and environmental studies on its properties. Research activities requiring a permit include, but may not be limited to, the following: observations; photography; surveys and inventories; tagging and banding; collection of wildlife specimens; and installation of scientific monitoring structures. individuals interested in EsAc research conducted on cfB Esquimalt properties in previous years or in the permitting process to conduct new environmental studies on these properties can obtain more information by visiting the EsAc website at:
http://cfs.nrcan.gc.ca/subsite/esac
members of ESacEsAc is a multi-agency technical advisory committee composed of the following members:
• cfB Esquimalt (formation safety and Environment Branch)
• cfB Esquimalt (Base construction Engineering Office)
• Natural Resources canada (canadian forest service)
• Environment canada (canadian Wildlife service) • B.c. ministry of forests and Range • University of Victoria • Royal Roads UniversityA complete list of EsAc members in 2009 and contact information is located at the end of this report.
P031-09. collection of oak branch tips for Winter moth study.

Environmental Science Advisory Committee 2009/2010 Annual Report
4
ESac activitiES in 2009
research and collection activitiesA total of 22 proposals were received and reviewed by EsAc in 2009. Of the 22 proposals received, 21 permits were issued – with 13 being renewals of previous year’s permits. Table 2 shows the number of proposals received and permits issued annually since 1995.
The diversity of projects conducted in 2009 enhanced the knowledge and understanding of the wildlife and sensitive ecosystems occurring on cfB Esquimalt properties. in addition, research findings collected under EsAc permits contributed to sound decision-making and environmental management by cfB Esquimalt personnel.
The knowledge gained from these studies could also be applied to neighbouring, similar ecosystems under different jurisdictions, thus adding to the value of the research carried out on cfB Esquimalt properties. Table 3 lists all research and collection activities conducted in 2009 under the auspices of EsAc.
advisory and reporting activitiesThe year of 2009-10 was the 15th full year of activ-ity for EsAc. The committee met three times during 2009 to review project proposals and status, plan re-porting activities, and advise cfB Esquimalt on other environmental issues occurring on cfB Esquimalt properties.
A request from a NAsA researcher for use of forest cover data for Rocky Point in testing the applicability of existing multi-spectral remote sensing data was received and forwarded to DND. The committee also discussed and advised on Natural Resource program activity plans for 2009-10.
table 2. Number of research proposals received and permits issued since 1995
Year Proposal Permits
2009 22 21
2008 18 18
2007 18 15
2006 22 21
2005 25 21
2004 16 16
2003 26 24
2002 21 20
2001 14 14
1999 25 25
1998 26 26
1997 24 24
1996 25 24
1995 22 20

Environmental Science Advisory Committee 2009/2010 Annual Report
5
The locations of EsAc project sites as well as all wildlife and sensitive ecosystem inventory data collected by projects in 2009 were integrated into the cfB Esquimalt Natural Resources Geographic information systems (Gis) database. such information helps minimize overlap and interference with military training and other activities and increases the available information for natural resources management of the properties.
As part of the reporting process, EsAc permit holders are required to submit a report on their activities and results, for the permit year. EsAc compiles these documents and makes them available to all member agencies and other interested organizations by way of the annual report.
in 2009, the 2008/09 EsAc Annual Report was produced and 100 hard copy reports were distributed. The EsAc website was updated to provide information on active projects. Archived EsAc projects can be queried by year or location and all EsAc Annual Reports from 1995 to 2008 are available to download from the website. http://cfs.nrcan.gc.ca/subsite/esac
To further promote the sharing of information obtained through EsAc research projects, the committee hosts an annual workshop. The 2009 EsAc Annual Workshop, held 4 february 2010 at the Pacific forestry centre, included opening remarks from Base commander marcell Hallé and was well attended with over 75 individualsin attendance with representation from several federal, provincial and municipal agencies, universities as well as non-governmental organizations and general pubic. Two virtual online presentations were made and all presentations were made available as a
live webcast. Nine presentations, focusing on wildlife and sensitive ecosystem inventories, monitoring, and restoration were given for the projects noted in Table 3.
rocky Point canopy Station:
Decommissioning of the Rocky Point canopy station began in 2009 with the removal of microclimate monitoring equipment on the canopy trees and adjacent tower as detailed under project P087-09 and the committee further recommended that the collected microclimate data be made available for downloading from the EsAc website. Removal of canopy infrastructure is planned for 2010. The committee suggested that Royal Roads University continue weather monitoring at the christopher Point station located some 1.8 km from the canopy station.
P087-09. microclimate monitoring canopy station.

Environmental Science Advisory Committee 2009/2010 Annual Report
6
ESac Permit title Project leader Permit number location
Rocky Point Bird Observatory Avian monitoring** A. Nightingale P003-09* RP, RRmonitoring Winter moth and the Parasites introduced for its control** i. Otvos P031-09* NA
Purple martin Origins and Relationships c. finlay P044-09* cO, DY, RRWildlife Tree stewardship Program (WiTs) i. moul P074-09* AH, cO, RPGarry Oak Acorn survey** R. Negrave P079-09* cfmETR, RPAtmospheric monitoring and microclimate station Decommissioning** m. Dodd P087-09* RP
studies on the Dynamics of Butterflies and their Host Plants in Garry Oak Ecosystems J. Hellmann P090-09* cfmETR, RP
christmas Bird count A. Nightingale P095-09* AH, HR, RPThe strait of Georgia mortuary Landscape Project D. mathews P104-09* AH, cO, RPWestern Bluebird Nestbox Program T. chatwin P108-09* cfmETR, RPmonitoring of the Oregon spotted frog (Rana pretiosa) c. Bishop P109-09* ALDYear-round microclimates Experienced by Butterfly Larvae in Garry Oak Ecosystems** B. sinclair P124-09* RP
Efficacy Testing of Pheromones and Kairomones for Woodboring coleoptera** L. Humble P126-09* AH, RP
monitoring seed Establishment by Purple sanicle and seaside Bird’s-foot Lotus and fluctuations of a coast microseris Population m. fairbarns P130-09 AH, RP
investigations into Environmental contaminants in the Diets of coastal River Otters m. Davis P131-09 AH, cO, DY,
NA, RR, WPsurveys for seaside Birds-foot Trefoil - Lotus formosissimus J. miskelly P132-09 RPfoothill sedge and Lindley's false silverpuffs critical Habitat mapping m. fairbarns P133-09 AH, cfmETR,
RP
Old-Growth stand structure** m. Kranabetter P134-09 HR, NR, RP, RR
seed collection of Lotus formosissimus for an Experimental Translocation Project N. Kroeker P135-09 RP
Assessing Potential for Population Augmentation of Endangered Oregon spotted frogs: Radio-Telemetry to Determine immediate fate of captive Reared frogs Released on site**
P. Govindarajulu P136-09 ALD
contaminant Exposure in River Otters (Lontra canadensis): An Assessment of spatial and Geographic Trends in Home Range and Population Demographics**
c. Nelson P137-09AH, cO, DY, NA, RP, RR,
WP
*Renewed from previous years. **Presentation was made at the EsAc Annual Workshop, 4 february 2010.
Properties: AH: Albert Head; ALD: Aldergrove; cfmETR: canadian forces maritime Experimental and Test Ranges; cO: colwood; DY: Dockyard; HR: Heals Rifle Range; NA: Naden; NR: Nanaimo Rifle Range; RP: Rocky Point; RR: Royal Roads.
table 3. EsAc activities in 2009

Environmental Science Advisory Committee 2009/2010 Annual Report
7
ESACD E P A R T M E N T O F N AT I O N A L D E F E N C E
C A N A D I A N F O R C E S B A S E E S Q U I M A L T
ENVIRONMENTAL SCIENCE ADVISORY COMMITTEE
SCIENTIFIC REPORTS
Research and CollectionActivities Conducted in 2009

Environmental Science Advisory Committee P003-09
8
Project leader(s): Ann Nightingaleorganization(s): Rocky Point Bird Observatoryaddress(es): 1721 cultra Ave, saanichton, Bc, V8m 1T1telephone no.(s): (250) 514-6450 Email(s): [email protected]
PErmit #: P003-09location(S): ROcKY POiNT, ROYAL ROADs
Start datE: 21 JULY 2009comPlEtion datE: 18 OcTOBER 2009 ProjEct StatUS: 1994-ONGOiNG
rocky Point Bird observatory avian monitoring – Passerine migration monitoring
introduction:
2009 marked the 15th season of passerine migration monitoring at Rocky Point. monitoring typically takes place within the 90-day period from 21 July until 18 October, to maximize coverage during the peak migration season for the majority of neotropical passerine species migrating through the southern part of Vancouver island.
The migration monitoring projects at Rocky Point collect data on population trends, and over time provide benchmark data for determining population changes at the landscape level. Data collected at Rocky Point cover coastal British columbia and Alaska, but when the data are combined with data collected from the other banding stations across canada, the status of migrating songbirds can be assessed at a national scale.
Study area and methods:
Rocky Point Bird Observatory (RPBO) is located at the southernmost tip of Vancouver island, B.c. on the canadian forces Ammunition Depot (cfAD) at Rocky Point. The location of the study area is the riparian zone immediately north of the Building 100 site. When access to the Rocky Point site was restricted due to military operations, a pilot migration monitoring study
was conducted at the Royal Roads University campus in colwood, B.c.
The fall migration monitoring effort at Rocky Point employed 13 mist nets in established positions around the site. Nets were opened 30 minutes before sunrise and run for six hours each day between 21 July and 18 October. The protocol calls for daily monitoring during this period except for days with inclement weather or when access to Rocky Point cannot be obtained due to military use on the site. mist netting effort lost in 2009 due to inclement weather was limited to 2 days (156 net hours). military operations on DND land prevented station operation on 22 days (1716 net hours) throughout the sampling period. in total, lost effort amounted to 24 days (1872 net hours) or 26.5% of the annual standard banding effort.
Birds captured in the mist nets were identified, banded, measured for a number of morphometric features, sexed and aged using the criteria in Pyle (1997), and released. Each day, a standardized census route was walked and general observations on all birds present in the area were recorded (RPBO 2008). in addition to the banding effort and daily census, RPBO personnel also recorded personal observations of birds, including those species that were not banded at Rocky Point, at the site.

Environmental Science Advisory Committee P003-09
9
Additional background information regarding the ecological context at Rocky Point and the methods used to monitor birds is covered in both the final report for 2008 (David 2008) and the RPBO protocol (RPBO 2008).
results:
A total of 3,165 birds of 59 species were captured during 4692.7 net hours of operation at the Rocky Point study site. An additional 69 birds of 19 species were captured during 132.0 net hours of pilot operation at the Royal Roads University study site (Table 1).
The most frequently captured migrant species at the RPBO site were (in descending order): Wilson’s Warbler (Wilsonia pusilla), fox sparrow (Passerella iliaca), Pacific-slope flycatcher (Empidonax difficilis), Orange-crowned Warbler (Vermivora celata) and song sparrow (Melospiza melodia). Total captures by species and ages are presented in Table 2.
The most frequently captured migrant species at the Royal Roads University site were (in descending order): song sparrow, spotted Towhee (Pipilo maculatus), and Orange-crowned Warbler. Total captures by species and ages are presented in Table 3.
census surveys and general observations were conducted on 67 days between 21 July and 18 October 2009. A total of 100.5 census hours and a total of 2078.5 general observer hours were tallied. Through these methods, the presence of 142 and 156 species respectively were documented. maximum daily counts and season totals for each species observed are summarized in Table 4.
discussion:
Banding totals were the sixth highest since the initiation of monitoring in 1994. When mist net effort is taken into account, the 2009 capture rate (0.68 birds per net hour) was slightly lower than the previous year’s rate of 0.70 birds per net hour. Access restrictions due to military activity during the sampling period led to the loss of 1716 net-hours, of which 390 corresponded with the peak migratory time period (Leckie, 2008). sampling effort lost during the study period likely contributed to the reduced season total and capture rates.
A new highest banding record was set by Purple finch (Carpodacus purpureus) in 2009, with 38 individuals banded. Two species had their second highest banding records during the 2009 season: American Goldfinch (Carduelis tristis) and fox sparrow (Passerella iliaca), with 156 and 237 new birds banded respectively. Lincoln sparrow (Melospiza lincolnii) had its lowest year on record, with only 80 individuals banded. This marksthe first year this species’ numbers fell below 100 birds.
On 19 August and 28 August, two Alder flycatchers (Empidonax alnorum) were identified by morphological measurements and banded. The species breeds in northern B.c., Yukon and Alaska, however typically migrates east of the Rocky mountains (Ehrlich et al. 1988). These were the first confirmed Alder flycatchers to be banded at RPBO.
Discussion continued on page 17...
table 1. summary of constant effort mist netting during fall migration monitoring (21 July - 18 October 2009) at Rocky Point (RPBO) and Royal Roads University (RRUN).
station Total birds captured Net hours Birds/100 net
hoursNumber new birds banded
Number birds recaptured
species richness
RPBO 3165 4692.7 67.5 2801 364 59RRUN 69 132.0 52.3 65 4 19All sites 3234 4824.7 67.1 2866 368 60

Environmental Science Advisory Committee P003-09
10
Environmental Science Advisory Committee
table 2. summary of constant effort mist net captures at RPBO field site by species, band status and age. After Hatch-year - AHY (birds in at least their 2nd calendar year) and Hatch-year - HY (birds in their 1st cal-endar year) are based on initial annual captures only.
species Total number of birds captured
Number of new birds banded
Number of individuals recaptured
AHY HY
Alder flycatcher 3 2 1 2American Goldfinch 163 156 7 34 123American Robin 24 23 1 7 16Barn swallow 2 2 2Barred Owl 1 1 1Bewick's Wren 55 30 25 3 30Brown-headed cowbird 9 9 9Black-headed Grosbeak 1 1 1Brown-creeper 14 12 2 1 12Black-throated Grey Warbler 2 2 1 1Bushtit 16 15 1 15chestnut-backed chickadee 74 41 33 8 38cedar Waxwing 4 4 2 2chipping sparrow 11 10 1 1 9common Yellowthroat 96 63 34 3 61Dark-eyed Junco 73 72 1 7 65Downy Woodpecker 2 2 2Dusky flycatcher 1 1 1fox sparrow 256 237 19 45 197Golden-crowned Kinglet 92 80 12 9 68Golden-crowned sparrow 68 63 5 13 50Hammond's flycatcher 17 17 17Hermit Thrush 134 127 7 18 109House Wren 6 6 6Hutton's Vireo 1 1 1Lincoln's sparrow 82 80 2 7 73marsh Wren 4 3 1 3merlin 1 1 1macGillivray's Warbler 53 47 6 1 46Northern flicker 1 1 1Northern Pygmy Owl 1 1 1Northern Waterthrush 2 2 2Northern Rough-winged swallow 1 1 1Orange-crowned Warbler 193 183 10 52 129Pine siskin 7 7 2 5Pacific Wren 84 75 9 15 63Pacific-slope flycatcher 223 220 3 19 202Purple finch 38 38 13 25

Environmental Science Advisory Committee P003-09
11
Environmental Science Advisory Committee
table 2 continued. summary of constant effort mist net captures at RPBO field site by species, band status and age. After Hatch-year - AHY (birds in at least their 2nd calendar year) and Hatch-year - HY (birds in their 1st calendar year) are based on initial annual captures only.
species Total number of birds captured
Number of new birds banded
Number of individuals recaptured
AHY HY
Red-breasted Nuthatch 4 4 4Ruby-crowned Kinglet 147 145 2 34 102Rufous Hummingbird 6 6 6Red-winged Blackbird 7 5 2 2 4savannah sparrow 54 53 1 11 42sora 1 1 1song sparrow 185 109 76 23 99spotted Towhee 156 142 14 14 130sharp-shinned Hawk 7 7 7swamp sparrow 2 2 2swainson's Thrush 94 84 10 5 80Townsend's Warbler 6 6 6Trail's flycatcher 1 1 1Varied Thrush 2 2 2Violet-green swallow 4 4 4Warbling Vireo 8 8 2 6White-crowned sparrow 163 110 53 11 107Willow flycatcher 58 56 2 7 49Wilson's Warbler 263 245 18 14 235White-throated sparrow 6 4 2 1 3Yellow-rumped Warbler 26 26 3 23Yellow Warbler 151 147 4 41 107Total 3165 2801 364 432 2407
‘P003-09. Golden-crowned Kinglet. P003-09. Rufous Hummingbird.

Environmental Science Advisory Committee P003-09
12
Environmental Science Advisory Committee
table 3. summary of constant effort mist net captures at RRUN field site by species, band status and age. After Hatch-year - AHY (birds in at least their 2nd calendar year) and Hatch-year - HY (birds in their 1st cal-endar year) are based on initial annual captures only.
species Total number of birds captured
Number of new birds banded
Number of individuals recaptured
AHY HY
American Robin 1 1 1Anna's Hummingbird 1 1 1Bewick's Wren 5 4 1 4Bushtit 4 4 3common Yellowthroat 2 2 2fox sparrow 3 3 3Golden-crowned sparrow 5 5 5Hutton's Vireo 1 1 1Lincoln's sparrow 5 5 5Orange-crowned Warbler 6 6 6Pacific Wren 2 2 2Ruby-crowned Kinglet 1 1 1Rufous Hummingbird 1 1 1song sparrow 10 8 2 1 8total 69 65 4 4 62
P003-09. Brown creeper. P003-09. Willow flycatcher malformed tail.

Environmental Science Advisory Committee P003-09
13
Environmental Science Advisory Committee
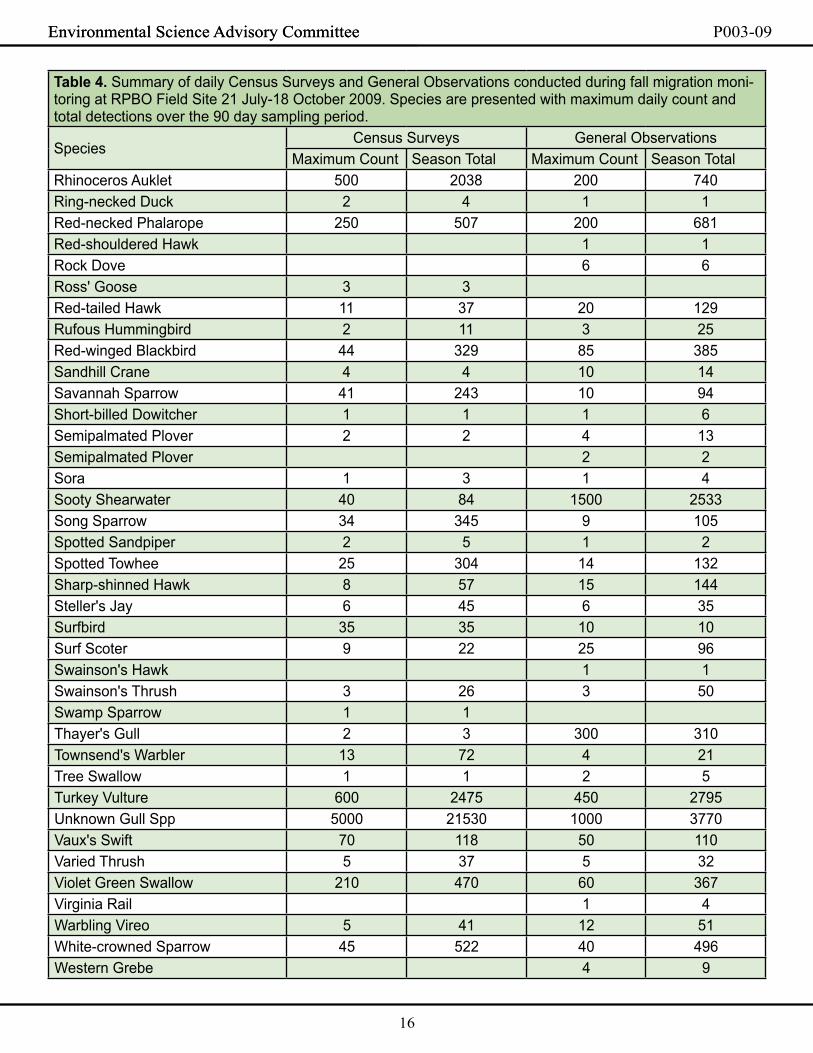
table 4. summary of daily census surveys and General Observations conducted during fall migration moni-toring at RPBO field site 21 July-18 October 2009. species are presented with maximum daily count and total detections over the 90 day sampling period.
speciescensus surveys General Observations
maximum count season Total maximum count season TotalAmerican Green-winged Teal 12 70 16 109American Goldfinch 97 751 80 754American Kestrel 2 4 1 5American Pipit 14 40 40 102American Redstart 1 1American Robin 176 1489 60 498American Wigeon 8 19 3 5Anna's Hummingbird 1 1 1 6Bald Eagle 5 51 6 81Barn swallow 30 195 20 149Black and White Warbler 1 1Barred Owl 2 7 2 12Belted Kingfisher 3 69 4 98Bewick's Wren 9 217 5 89Brown-headed cowbird 8 25 6 44Black-headed Grosbeak 1 5 2 21Black Oystercatcher 8 59 12 127Black swift 1 1Black Turnstone 4 9Bonaparte's Gull 110 846 90 157Brandt's cormorant 22 75 35 236Brewer's Blackbird 2 3 13 25Brown creeper 23 501 10 173Band-tailed Pigeon 180 781 249 2358Black-throated Grey Warbler 3 25 2 5Bushtit 36 236 24 177Bufflehead 1 1Broad-winged Hawk 2 5 1 1canada Goose 23 216 36 660california Gull 2200 19255 900 6476california quail 21 238 70 485caspian Tern 1 3cassin's Vireo 5 37 2 12chestnut-backed chickadee 109 1948 23 462cedar Waxwing 61 424 45 452chipping sparrow 22 51 15 95cliff swallow 1 1cooper's Hawk 2 13 5 78

Environmental Science Advisory Committee P003-09
14
Environmental Science Advisory Committee
table 4. summary of daily census surveys and General Observations conducted during fall migration moni-toring at RPBO field site 21 July-18 October 2009. species are presented with maximum daily count and total detections over the 90 day sampling period.
speciescensus surveys General Observations
maximum count season Total maximum count season Totalcommon Loon 3 10 3 8common merganser 1 1 1 2common murre 838 1807 745 2336common Nighthawk 3 13common Raven 13 125 20 143Wilson's snipe 2 4 1 5common Yellowthroat 8 168 5 79Double-crested cormorant 40 179 46 216Dark-eyed Junco 82 444 10 61Downy Woodpecker 8 143 4 90European starling 40 314 70 507Evening Grosbeak 4 15 6 19fox sparrow 10 93 18 135Great-blue Heron 3 79 4 84Golden-crowned Kinglet 175 1094 50 261Golden-crowned sparrow 13 93 12 95Great Horned Owl 2 17 3 49Golden Eagle 1 1Greater Yellowlegs 3 22 5 33Greater White-fronted Goose 4 26 9 28Glaucous-winged Gull 700 4993 500 3093Hammond's flycatcher 10 34 2 13Harlequin Duck 8 17 8 22Hairy Woodpecker 5 84 4 55Heerman's Gull 400 1623 250 1937Hermit Thrush 16 57 10 72House finch 20 165 10 36Hooded merganser 4 5 1 1House Wren 9 96 6 57Hutton's Vireo 2 6 1 5Killdeer 2 18 9 84Long-billed Dowitcher 1 2 9 13Least sandpiper 23 57 16 115Lesser Yellowlegs 1 2Lincoln's sparrow 21 137 15 83Lesser snow Goose 10 10 85 110mallard 22 264 17 331marbled murrelet 1 1 7 17

Environmental Science Advisory Committee P003-09
15
Environmental Science Advisory Committee
table 4. summary of daily census surveys and General Observations conducted during fall migration moni-toring at RPBO field site 21 July-18 October 2009. species are presented with maximum daily count and total detections over the 90 day sampling period.
speciescensus surveys General Observations
maximum count season Total maximum count season Totalmarsh Wren 2 33 3 32mew Gull 65 624 80 565merlin 1 3 2 19macGillivray's Warbler 9 31 9 22mourning Dove 1 1mute swan 3 3Northwestern crow 9 19 25 81Northern flicker 15 263 9 140Northern Goshawk 1 4Northern Harrier 1 5 1 15Northern Pintail 4 8 3 12Northern Pygmy Owl 1 2 1 2N. Rough-winged swallow 31 70 10 57Northern shoveler 2 4Northern shrike 1 1 1 1Northern saw-whet Owl 1 1Orange-crowned Warbler 32 247 30 261Olive-sided flycatcher 6 60 6 48Osprey 1 2Parasitic Jaeger 1 1Pacific Loon 18 18Pelagic cormorant 6 11 10 43Peregrine falcon 1 7 2 13Pectoral sandpiper 1 1Pink-footed shearwater 2 2 5 5Pigeon Guillemot 10 29 7 28Pine siskin 223 462 12 130Pileated Woodpecker 1 9 3 32Pacific-slope flycatcher 28 208 10 108Purple finch 53 361 15 177Purple martin 2 5 25 58Ring-billed Gull 1 1 1 1Red-breasted merganser 3 3Red-breasted Nuthatch 60 1084 20 192Red-breasted sapsucker 1 1 1 1Ruby-crowned Kinglet 77 334 25 127Red crossbill 77 1523 30 439Red-eyed Vireo 1 2
Environmental Science Advisory Committee P003-09
16
Environmental Science Advisory Committee
table 4. summary of daily census surveys and General Observations conducted during fall migration moni-toring at RPBO field site 21 July-18 October 2009. species are presented with maximum daily count and total detections over the 90 day sampling period.
speciescensus surveys General Observations
maximum count season Total maximum count season TotalRhinoceros Auklet 500 2038 200 740Ring-necked Duck 2 4 1 1Red-necked Phalarope 250 507 200 681Red-shouldered Hawk 1 1Rock Dove 6 6Ross' Goose 3 3Red-tailed Hawk 11 37 20 129Rufous Hummingbird 2 11 3 25Red-winged Blackbird 44 329 85 385sandhill crane 4 4 10 14savannah sparrow 41 243 10 94short-billed Dowitcher 1 1 1 6semipalmated Plover 2 2 4 13semipalmated Plover 2 2sora 1 3 1 4sooty shearwater 40 84 1500 2533song sparrow 34 345 9 105spotted sandpiper 2 5 1 2spotted Towhee 25 304 14 132sharp-shinned Hawk 8 57 15 144steller's Jay 6 45 6 35surfbird 35 35 10 10surf scoter 9 22 25 96swainson's Hawk 1 1swainson's Thrush 3 26 3 50swamp sparrow 1 1Thayer's Gull 2 3 300 310Townsend's Warbler 13 72 4 21Tree swallow 1 1 2 5Turkey Vulture 600 2475 450 2795Unknown Gull spp 5000 21530 1000 3770Vaux's swift 70 118 50 110Varied Thrush 5 37 5 32Violet Green swallow 210 470 60 367Virginia Rail 1 4Warbling Vireo 5 41 12 51White-crowned sparrow 45 522 40 496Western Grebe 4 9

Environmental Science Advisory Committee P003-09
17
Environmental Science Advisory Committee
table 4. summary of daily census surveys and General Observations conducted during fall migration moni-toring at RPBO field site 21 July-18 October 2009. species are presented with maximum daily count and total detections over the 90 day sampling period.
speciescensus surveys General Observations
maximum count season Total maximum count season TotalWestern Gull 20 20 5 5Western Kingbird 1 1Western meadowlark 2 2Western sandpiper 193 227 20 131Western Tanager 1 5 6 33Western Wood-Pewee 6 7 2 5Willow flycatcher 4 26 12 32Wilson's Warbler 43 237 18 188Winter Wren 26 297 10 120White-throated sparrow 1 1 1 1White-winged scoter 4 5Yellow-rumped Warbler 66 505 40 291Yellow Warbler 32 169 50 253
On 15 August 2009 an adult Yellow Warbler (Dendroica petechia) banded on 29 August 2007 in Big sur, california was captured at the RPBO mist net station. The species employs a long distance migration strategy, breeding north to Alaska, Yukon and Northwest Territories and wintering south to central America, Peru and Bolivia (Ehrlich et al. 1988). Western populations of the species are showing declines on breeding sites (shuford and Gardali 2008). The multiple captures of this bird indicate that it uses coastal habitats on its south bound migration.
conclusions:
Bird studies canada has identified the northern Pacific coastal rainforest (Bird conservation Region 5) as a region of high research interest due to the large number of range-limited species and sub-species that occur there (crewe et al. 2008). RPBO maintains historic datasets and currently collects information on 38 of 54 priority landbird species within a vegetation community of critical conservation concern (Pif Bc/Yukon 2006). These data are invaluable in assessing
the historic and current population status of coastal migrant landbird species as RPBO operates the only Pacific coastal migration monitoring effort in canada (crewe et al. 2008)
With the high regional conservation responsibility in mind, RPBO recommends the funding, design and implementation of a study investigating the origin and destination of migratory landbirds using southern Vancouver island (RBPO, RRUN) as a stopover site. Not only would a study of this nature fill gaps in a growing body of information on migratory connectivity for western landbird species (carlisle 2009), but also it would add necessary context to the interpretation of abundance and productivity trends derived from mist netting and census efforts conducted to date. in order to assess management actions and climatic effects within Bird conservation Regions, an understanding of the breeding locations of migrant birds moving through southern Vancouver island is needed (Dunn et al. 2006).

Environmental Science Advisory Committee P003-09
18
acknowledgements:
The monitoring of passerine migration was due to the efforts of bander-in-charge Ron melcer and banding intern Rheanna fraser, aided by a dedicated group of volunteers who contributed 1,236 hours to this project in 2009. The canadian Wildlife service and Wendy Easton continue to be valuable supporters of avian monitoring at Rocky Point.
P003-09. White-
crowned sparrow
nest.
references:
carlisle, J.D., s.K. skagen, B.E. Kus, c. van Riper iii, K.L. Paxton and J.f. Kelly. 2009. Landbird migration in the American West: Recent progress and future research directions. condor 111:211-225.
crewe, T.L., J.D. mccracken, P.D. Taylor, D. Lepage, and A.E. Heagy. 2008. The canadian migration monitoring Network – Réseau canadien de surveillance des migrations: Ten-year Report on monitoring Landbird Population change. cmmN-Rcsm scientific Technical Report #1. Produced by Bird studies canada, Port Rowan, Ontario. 69 pp.
David, G. 2008. migration monitoring at the Rocky Point Bird Observatory: fall 2008. Technical Report. Produced by Rocky Point Bird Observatory, Victoria, British columbia. 29 pp.
Dunn, E.H., K.A. Hobson, L.i. Wassenaar, D.J.T. Hussell, and m.L. Allen. 2006. identification of
summer origins of songbirds migrating through southern canada in autumn. Avian conservation and Ecology – Ecologie et conservation des oiseaux. 1(2): 4. [online] URL: http://www.ace-eco.org/vol1/iss2/art4/
Ehrlich, P., D.s. Dobkin, and D. Wheye. 1988. species accounts in: The birder’s handbook, simon and schuster inc., New York (1988).
fisher, R.A. 1926. The arrangement of field experiments. Journal of the ministry Agriculture. Great Britain 33:503–513.
Leckie, s. 2008. Peak migration Period at Rocky Point, metchosin, Bc. Technical Report. Produced by Rocky Point Bird Observatory, Victoria, British columbia
Partners in flight, British columbia and Yukon, 2006. Northern Pacific rainforest, URL: http://www.pifbcyukon.org/3e.html (accessed 4 August 2010)
Pyle, P. 1997. identification Guide to North American Birds, Part i. Bolinas, cA, slate creek Press.
Rocky Point Bird Observatory (RPBO). 2008. field Protocol for migration monitoring at Rocky Point Bird Observatory (Version 2.0). Technical Document. Produced by Rocky Point Bird Observatory, Victoria, British columbia. 51 pp.
shuford, W.D., and T. Gardali, editors. 2008. california Bird species of special concern: A ranked assessment of species, subspecies, and distinct populations of birds of immediate conservation concern in california. studies of Western Birds 1. Western field Ornithologists, camarillo, california, and california Department of fish and Game, sacramento.

Environmental Science Advisory Committee P003-09
19
Project leader(s): Ann Nightingaleorganization(s): Rocky Point Bird Observatoryaddress(es): 1721 cultra Ave, saanichton, Bc, V8m 1T1telephone no.(s): (250) 514-6450 Email(s): [email protected]
PErmit #: P003-09location(S): ROcKY POiNT
Start datE: 15 sEPTEmBER 2009comPlEtion datE: 31 OcTOBER 2009 ProjEct StatUS: 2003-ONGOiNG
rocky Point Bird observatory avian monitoring – northern Saw-whet owl Project
introduction:
The Northern saw-whet Owl (Aegolius acadicus) is a small, migratory raptor which has been monitored extensively in eastern North America with well over 150,000 individuals banded since 1955.
since the fall of 2002, Northern saw-whet Owls have been actively monitored at Rocky Point during their southward migration. A total of 2278 Northern saw-whet Owls have been banded at Rocky Point since this project’s inception. Study area and methods:
Northern saw-whet Owl migration was monitored following protocols established by Project Owlnet (www.projectowlnet.org), a continent-wide consortium of banding stations. Owl monitoring at Rocky Point was conducted nightly from one half hour after sunset for six consecutive hours during the period from 15 september to 31 October, except when constrained by military activities or inclement weather. Banding occurred on a total of 43 nights during this period.
The mist-netting site established in 2008, southeast of the banding station was used again in 2009. As in 2008, trees damaged by winter winds forced the relocation of
nets; two existing lanes were blocked by fallen trees, so a new net was added between the former net lanes. in 2009, a triangle of three proximate 12-meter-long x 2.6 meter-high mist nets was erected among the willow and alder, and an audio lure (playing a Northern saw-whet Owl territorial call) was placed in the centre of the triangle. four passive nets were also employed: one to the southwest, one to the northwest, and two to the east of the owl-triangle.
P003-09. Northern saw-whet Owl.

Environmental Science Advisory Committee P003-09
20
to be females using the combination wing chord/mass criteria established by Project Owlnet. Only 11.9% were identified as male. The remaining birds fell within the overlap range of the two sexes and thus their gender could not be determined through measurements.
five Northern saw-whet Owls banded at Rocky Point in 2009 were subsequently recaptured on-site; four were recaptured on the same night as they were banded, as is the usual case. One bird, however, was banded on 28 september, then recaptured twice on the night of 4 October, indicating a stopover at the site of at least six days. There were no between-year recaptures in 2009. five Barred Owls were banded during the fall 2009 season, three of which were aged as hatch-year and two as second-year. Based on the criteria in Pyle (1997), one bird was determined to be a male. The measurements of the other four birds fell within the range of overlap between males and females, so the gender could not be determined. RPBO had its first recapture of a Barred Owl in the mist-nets in 2009. A hatch-year bird banded on 6 October was recaptured on 10 October.
Once captured, the owls were removed from the nets and numbered aluminum leg bands were affixed. in addition, various morphometric measurements were taken and the age of the birds was determined. When possible, using the criteria from Project Owlnet, the sex of the owl was also determined, and then the bird was released.
results: in 2009, 344 Northern saw-whet Owls and 5 Barred Owls (Strix varia) were banded during 1455.3 net hours of operation. The capture rate of Northern saw-whet Owls was 0.33 birds/net hour. The capture rate was below the best rate of 0.40 birds per net hour achieved in 2003. Of the 344 Northern saw-whet Owls banded, 51.0% were hatch-year birds, 31.1% were second-year, 16.1% were after second-year and 1.2% were unspecified after hatch-year birds. Three of the Barred Owls captured in 2009 were hatch-year birds and two were second-year individuals.
The captures were well distributed throughout the banding period, with the peak week occurring between 2 October and 8 October. One hundred and thirty-two (38.4%) of the owls were banded within this week, with the nights of 2 October and 7 October both having the maximum nightly capture of 23 Northern saw-whet Owls.
During the banding period, a Northern saw-whet Owl banded on 5 October at Rocky Point was captured on Bainbridge island (seattle), Washington on 18 October. This was the fourth recapture of a Rocky Point bird at the Bainbridge island site. A banded Northern saw-whet Owl captured at Rocky Point on 1 October 2009 was originally banded on Bainbridge island on 19 October 2008. This was only the second foreign recapture at Rocky Point of a Northern saw-whet Owl banded at another site.
As in previous years, the majority (60.2%) of the Northern saw-whet Owls captured were determined
P003-09. first Barred Owl recaptured in the mist-nets in 2009 at RPBO.

Environmental Science Advisory Committee P003-09
21
discussion:
Northern saw-whet Owls are believed to have a four-year population cycle synchronized with that of their most common prey species, deer mice (swengel and swengel 1995). 2009 was the fourth year of the cycle that is developing at Rocky Point, so a much slower year than last year was anticipated. Although the capture of 344 owls was well below the record of 636 set in 2008, the season recorded the third highest number of captures since the project began (figure 1).
figure 1: Northern saw-whet Owl captures at Rocky Point, 2002-2009.
The ratio of hatch-year to after hatch-year birds was considerably lower than the norm, and was similar to the data collected in 2005, possibly reflecting the suggested four-year cycle. During migration, hatch-year birds of the majority of species studied at Rocky Point, including Northern saw-whet Owls, tend to comprise about 70 to 90% of birds captured. in 2009, only 50.9% of the Northern saw-whet Owls captured at Rocky Point were hatch-year birds, suggesting relatively poor breeding success. since the start of the project, only 2005 had a lower ratio of hatch-year birds (40%). The proportion of second-year birds (31.9%) was markedly higher than usual, but was comparable to the year following the first peak in captures observed at Rocky Point. in 2005, 33.3% of the captures were second-year birds. This could be expected because in peak years, an unusually high percentage of the captures are hatch-year birds. if normal winter survival rates occur, a greater proportion of birds in the next year will be second-year individuals.
The statistical tool that is used to determine the sex of the owls was developed using measurements from eastern saw-whet Owls, primarily during the breeding season. A number of the owls captured at Rocky Point were considerably larger than the maximum values listed on the sexing chart, suggesting that there may be
differences between eastern and western populations or between the weights of birds during breeding and migration. Personnel at the Beaverhill Bird Observatory (Alberta) have found similar discrepancies (Lisa Priestley, personal communication, October 2009); as a consequence, they are developing a tool to better identify the sex of western birds, particularly during migration when primary sexual characteristics cannot be observed.
P003-09. Northern saw-whet Owl under UV light.
P003-09. Banded Northern saw-whet Owl.

Environmental Science Advisory Committee P003-09
22
There is considerable debate as to whether Northern saw-whet Owls are truly migratory or if they are instead nomadic (marks and Doremus, 2000). Little is known, particularly in western North America, about the relationships between the birds’ breeding grounds and their fall movements. The two foreign encounters since this project began were both recaptured north of their banding sites in forks, Washington and Bainbridge island, Washington. Given the significant numbers of captures of this species at Rocky Point, there is potential for the use of stable isotopes to provide answers to the growing number of questions about Northern saw-whet Owl movement. conclusions:
The number of captures in 2009, with the low ratio of hatch-year birds suggests a poor breeding season. Longitudinal information on this species will help determine the nature, although not the cause, of population cycles. stable isotope research could identify the breeding areas of birds which pass through Rocky Point allowing for deeper analyses of conditions leading to productivity changes.
Rocky Point is a significant location on the southward route of the Northern saw-whet Owl. As one of only five Project Owlnet sites west of the Rocky mountains actively monitoring this species, continued banding operations at Rocky Point contributes greatly to the knowledge base for western populations. RPBO will be able to provide a coastal perspective to the development of sexing measurement criteria, which appear to have geographic variances.
All data from this project have been submitted to the canadian Wildlife service for inclusion in their database and submission to the Bird Banding Laboratory of the U.s. Geological survey.
acknowledgements:
The Northern saw-whet Owl project was initiated by
Paul Levesque in 2002. in 2009, project manager Ann Nightingale and banding intern Rheanna fraser were assisted by RPBO’s migration bander-in-charge, Ron melcer, and volunteers who contributed more than 500 hours to this project in 2009.
P003-09. Northern saw-whet Owl in release box.
references:
marks, J.s. and J.H. Doremus. 2000. Are northern saw-whet owls nomadic? Journal of Raptor Research 34(4):299-304.
Project Owlnet web site: http://projectowlnet.org. accessed 10 January 2010
Pyle, P. 1997. identification Guide to North American Birds, Part i. Bolinas, cA: slate creek Press.
swengel, A. B. and s. R. swengel.1995. Possible four-year cycle in amount of calling by Northern saw-whet Owls. The Passenger Pigeon, 57(3):149-155.

Environmental Science Advisory Committee P003-09
23
Project leader(s): Ann Nightingaleorganization(s): Rocky Point Bird Observatoryaddress(es): 1721 cultra Ave, saanichton, Bc, V8m 1T1telephone no.(s): (250) 514-6450 Email(s): [email protected]
PErmit #: P003-09location(S): ROYAL ROADs
Start datE: 27 mARcH 2009comPlEtion datE: 29 mARcH 2009 ProjEct StatUS: 2003-ONGOiNG
rocky Point Bird observatory avian monitoring – Bander training Workshop
introduction:
The process of capturing wildlife and the marking and collecting of data and samples from individual birds require specialized training to ensure animal safety and successful research results. since 2003, the Rocky Point Bird Observatory (RPBO) has been offering short training programs to teach the correct techniques in bird capture, banding, ageing, and in morphometric measurements. Study area and methods:
The Avian monitoring and Bird Banding workshop consisted of lectures, lab sessions, and field work at Royal Roads University. for the field component, six mist nets were used to capture songbirds that were used for live teaching demonstrations. The workshop instructor was Ann Nightingale, president of Rocky Point Bird Observatory and a licensed passerine, hummingbird and raptor bander. several banders and volunteers assisted with the training, providing about a three-to-one student-to-trainer ratio.
The 2009 workshop focused on providing training for novices to bird banding. Lectures covered bird identification, safe handling of birds and the basics of ageing and sexing passerines. The lab component of
the workshop focused on bird identification techniques, and for those with considerable identification experience, on ageing and sexing the birds according to the criteria in Pyle (1997). Local specimens held by RPBO under the appropriate federal and provincial permits were used in the lab component. A collection of study skins borrowed from the canadian Wildlife service’s Bird Banding Office was used to provide access to specimens from eastern North America.
P003-09. Banding a Wilson’s Warbler.

Environmental Science Advisory Committee P003-09
24
service. Detailed banding data are either available by request from RPBO, or via the cWs Bird Banding Office in Ottawa. discussion:
The bird banding workshop has been very successful in providing specialized training to people working on bird research projects throughout western North America. The Royal Roads site is an ideal location for the workshops due to classroom, accommodation and field study amenities. The use of several banders and volunteers to assist the instructor has proven very effective in ensuring that all participants are exposed to a variety of bird handling techniques and strategies for bird identification, and to reduce potential stress on the birds. several past participants have gone on to volunteer or work in ornithology and at least one has now achieved a master’s Permit for banding. conclusions:
The Avian monitoring and Bird Banding workshops continue to be well received by the participants. By providing an introduction to safe handling of birds as well as techniques for ageing, sexing and monitoring populations, the workshop prepares participants for field study or volunteer positions.
RPBO plans to offer another workshop in march 2010.
field sessions included site selection and net set up as well as capture and extraction of birds. As the majority of participants were novices, and to reduce stress on the birds, less emphasis was placed on the actual banding of birds during the field component than in previous workshops. more time was spent at the nets, instructing participants on safe handling and extraction of birds from the mist nets. All participants had several opportunities during the field component to handle live birds and to band at least one individual.
Banders Andy stewart (raptors) and Jonathan and Alison moran (hummingbirds) provided field and lab sessions outlining the specific practices related to banding these families of birds.
This year, an optional lab session on specimen preparation was given for those who were interested in acquiring this skill.
results: fourteen participants attended the workshop. Thirty birds of three species (Dark-eyed Junco, spotted Towhee, and American Robin) were fully processed and banded. Birds were banded by holders of valid canadian Wildlife service banding permits, or by the students under the supervision of permitted banders. The data collected were sent to the canadian Wildlife
P003-09. Banding station at Rocky Point.
P003-09. Banded spotted Towhee.

Environmental Science Advisory Committee P003-09
25
Project leader(s): Ann Nightingaleorganization(s): Rocky Point Bird Observatoryaddress(es): 1721 cultra Ave, saanichton, Bc, V8m 1T1telephone no.(s): (250) 514-6450 Email(s): [email protected]
PErmit #: P003-09location(S): ROcKY POiNT
Start datE: 30 mAY 2009comPlEtion datE: 10 AUGUsT 2009 ProjEct StatUS: 2003-ONGOiNG
rocky Point Bird observatory avian monitoring – monitoring avian Productivity and Survivorship (maPS):
introduction:
The monitoring Avian Productivity and survivorship (mAPs) project was created by the institute for Bird Populations in 1989 to assess and monitor the vital rates and population dynamics of over 120 species of North American breeding landbirds at more than 500 sites across North America. The site at Rocky Point has been used for mAPs since 2003, except for a hiatus in 2007. The mAPs site at Royal Roads University was not used in 2009 due to a lack of human resources.
The purpose of the mAPs project at Rocky Point is to create an inventory of the breeding songbird populations using a standardized methodology, and to record sightings of other species to allow comparisons of populations and avian diversity over time and across mAPs sites. The data are submitted to both the canada Wildlife service (banding data) and to the institute of Bird Populations (banding, observation, breeding status, and habitat structure data). Study area and methods:
mAPs monitoring was conducted at Rocky Point, following the mAPs protocol (Desante et al., 2009).
songbirds were captured in mist nets and banded during standardized sampling sessions. The mist nets were located in a variety of habitat types, at prescribed distances from each other. The area covered by the mAPs station was approximately 3.25 hectares. The sessions were conducted for a six-hour period starting at sunrise once per 10-day period between 31 may and 10 August. Nets were not operated in rainy or windy conditions. The mAPs protocol requires a minimum of five years of data (to account for annual variation in populations) before trend analysis or site comparisons can be made.
results: A total of 231 birds (excluding birds that were recaptured) of 37 species were banded at Rocky Point during the mAPs project in 2009, making this a below average year. The capture rate was 0.58 birds per net hour.
fifteen birds captured at Rocky Point had been banded at Rocky Point in previous years. These were chipping sparrow (Spizella passerine banded in 2008), Red-winged Blackbird (Agelaius phoeniceus, 2008), chestnut-backed chickadee (Poecile rufescens,

Environmental Science Advisory Committee P003-09
26
capture rate in 2009. On several banding days, one or more nets, including the most productive on the site, needed to be closed due to high winds. This undoubtedly affected both the number of individuals and the diversity of species captured.
The recapture rate of birds banded in previous years is an important component of the mAPs program. Although there is no expectation that the same adult bird will be captured every year, consistency in placement of the nets, dates of monitoring and habitat structure should lead to a high recapture rate of breeding adults over time. This information is a key component of the survivorship aspect of the mAPs research. conclusions:
The mAPs program is providing data on the productivity and survivorship of a wide variety of species in varied habitats across North America. The mAPs database serves as an important resource for population monitoring and conservation efforts, and may also provide valuable information on range changes. The monitoring at Rocky Point should continue.
As with any longitudinal survey, sites should be chosen which have the least probability of major habitat changes during the study period.
references:
Desante, D.f., K.m. Burton, P. Velez, D. froehlich and D. Kaschube. 2009. mAPs manual: 2009 Protocol. The institute for Bird Populations, Point Reyes station, cA. 75 pp. http://www.birdpop.org/DownloadDocuments/manual/mAPsmanual09.pdf
2008), swainson’s Thrush (Catharus ustulatus, 2006), Orange-crowned Warblers (Vermivora celata, 2006, 2008), cliff swallow (Petrochelidon pyrrhonota, 2005), American Robins (Turdus migratorius, 2006, 2008), American Goldfinch (Spinus tristis, 2008), song sparrow (Melospiza melodia, 2008), Pacific-slope flycatcher (Empidonax difficilis, 2008) and spotted Towhee (Pipilo maculates, 2008). An additional 29 within-season recaptures were recorded. An Orange-crowned Warbler banded at Rocky Point in July 2008 was recaptured at Witty’s Lagoon Regional Park in July 2009. Although Witty’s Lagoon is only 8 km away from the original banding site, Orange-crowned Warblers are migrants, and this bird had likely just returned to the area from its wintering grounds thousands of kilometers away.
Although the focus of mAPs is locally breeding birds, birds not normally seen in the area have been captured during monitoring. in 2009, a chestnut-sided Warbler, only the second observed record of this species for the Victoria area, was captured in the same net that caught a Rose-breasted Grosbeak in 2008.
An Olive-sided flycatcher (Contopus contopus), a species listed as threatened under the federal species at Risk Act (sARA), was captured and banded in 2009. As this was an incidental capture (i.e. was not a targeted study species), banding was allowed without a sARA permit. This species has been identified as a breeding bird at the Rocky Point mAPs site.
Table 1 lists by species the number of birds captured and recaptured at Rocky Point in 2009.
discussion:
Rocky Point continues to be productive in terms of the number of individuals observed and in species richness. Weather played a major factor in the reduced

Environmental Science Advisory Committee P003-09
27
table 1: mAPs captures at Rocky Point in 2009Species new Band recapture Unbanded totalAmerican Goldfinch 1 1American Robin 1 1Barn swallow 5 3 8Bewick's Wren 6 1 7Black-headed Grosbeak 25 1 26Brown creeper 2 2Brown-headed cowbird 18 4 22cassin’s Vireo 2 2cedar Waxwing 1 1chestnut-backed chickadee 1 1chestnut-sided Warbler 6 2 8chipping sparrow 1 1cliff swallow 1 1common Yellowthroat 3 2 5Downy Woodpecker 24 3 2 29House finch 2 2House Wren 1 1Hutton's Vireo 2 1 3macGillivray's Warbler 16 3 19Northern flicker 4 4Northern-Rough-winged swallow 26 3 1 30Olive-sided flycatcher 6 3 9Orange-crowned Warbler 11 5 2 18Pacific Wren 2 1 3Pacific-slope flycatcher 6 1 7Purple finch 3 1 4Red-winged Blackbird 1 1 2Rufous Hummingbird 1 1 2song sparrow 2 2spotted Towhee 2 4 6swainson's Thrush 2 2Tree swallow 33 3 1 37Violet-green swallow 1 1Warbling Vireo 1 1White-crowned sparrow 1 1Willow flycatcher 1 1Wilson's Warbler 5 4 9Yellow Warbler 6 1 7Yellow-rumped Warbler 1 1Total individuals 231 44 12 287Total species 37 19 8 41

Environmental Science Advisory Committee P031-08
28
Project leader(s): imre. s. Otvos and Nicholas conderorganization(s): Resources canada, canadian forest service - Victoriaaddress(es): 506 W. Burnside Road, Victoria, B.c. V8Z 1m5telephone no.(s): (250) 363-0620, (250) 363-0634 Facsimile: (250) 363-0775 Email(s): [email protected] and [email protected]
PErmit #: P031-08location(S): NADEN
Start datE: 6 APRiL 2009comPlEtion datE: 3 JULY 2009 ProjEct StatUS: 1982-2010
monitoring Winter moth and the Parasites introduced for its control
introduction:
The objectives of this study were to monitor winter moth, Operophtera brumata L., population densities and determine percent parasitism by two parasitoid species, a parasitic wasp, Agrypon flaveolatum, and a parasitic fly, Cyzenis albicans, introduced in the Greater Victoria area in British columbia. This was the 25th year that winter moth and its parasitoids were monitored at this location.
Winter moth is a pest that originated in Europe, where it mainly attacks fruit and deciduous trees, although it also attacks sitka spruce (Picea sitchensis) plantations in scotland (Hunter et al. 1991). in canada, it was first reported in Nova scotia in 1949 (Hawboldt and cumming 1950), and was first positively identified in the Victoria area in 1976 (Gillespie et al 1978). By the following year (1977), the winter moth defoliated over 120 km2 on southern Vancouver island (Embree and Otvos 1984).
Winter moth’s principle host on Vancouver island is the Garry oak, quercus garryana Dougl., the only oak native to British columbia. Garry oak is the dominant species in the Garry oak ecosystem, the richest terrestrial ecosystem in coastal British columbia, which
provides habitat to many endangered species of plants and animals (fuchs 2001). in addition to threatening Garry oak, the introduction of winter moth also posed a threat to the fruit growing regions of B.c.
in the late 1950s and early 1960s, a highly successful biological control program was conducted in Nova scotia, during which six parasitoid species were introduced from Europe. Only one parasitic fly and one parasitic wasp species became established, but these two species are credited with controlling the winter moth in Nova scotia (Embree 1971). following this example, in 1979, the canadian forest service commenced introduction in B.c., both from Europe and from Nova scotia, of these two parasitoids. These two species, a parasitic wasp, Agrypon flaveolatum, and a parasitic fly, Cyzenis albicans, were released over a four-year period at a total of 33 different locations in the Victoria area (Embree and Otvos 1984). One of these locations was in a Garry oak meadow on Hotham street on the Naden property. following the completion of the release program in 1982, a monitoring program was initiated at several Garry oak stands in the Greater Victoria area to track the success of the introductions in controlling winter moth.

Environmental Science Advisory Committee P031-08
29
Study area and methods:
Two proven sampling methods were employed to monitor winter moth population and to measure the interaction between the host and the introduced parasitoid species in the Greater Victoria area (including the DND Naden property).
P031-08. Agrypon adult (above) and pupa.
Winter moth population density:Winter moth population densities were determined using the method outlined in Otvos (2009).
Percent parasitism:mass collection and rearing of the larvae was done following the method outlined in Otvos (2009). Because both parasitoids hatch and feed inside the host pupae, they cannot be identified until they complete development during the fall and winter months. Thus, percent parasitism by Cyzenis albicans and Agrypon flaveolatum during 2009 can only be determined in the spring of 2010 after the overwintered parasitoid adults have emerged. Therefore, only parasitism of winter moth larvae collected during the spring of 2008 can be reported at this time.
results: At the Naden sample plot, winter moth population densities averaged 0.21 and 0.16 larvae per leaf in 2008
and 2009, respectively. This was lower than the overall average for the Greater Victoria area of 0.27 and 0.28 larvae per leaf in 2008 and 2009, respectively. The winter moth population densities in the Greater Victoria area caused light defoliation of the leaves that in some locations was visible from a distance. At Naden, the damage caused by the winter moth on most trees was negligible and could only be seen close up, with few leaves having “shot-gun” type holes chewed by the feeding larvae and no discoloration of the damaged leaves was observed.
Parasitism by Cyzenis albicans, the more prevalent of the two introduced parasitoids, at Naden increased from 13.6% parasitism in 2007 to 38.8% in 2008. This change was also reflected in the Greater Victoria area, where percent parasitism by c. albicans increased from an average of 10.8% in 2007 to 32.5% in 2008. We are unable to explain this sudden trebling of percent parasitism by c. albicans at Naden or in the Greater Victoria area at this time.
Parasitism by Agrypon flaveolatum, which has for the last 10 years remained extremely low (averaging of 0.4% at the Naden location), suddenly increased to levels that have never been observed previously. No A. flaveolatum were recovered at Naden in 2007, but Agrypon flaveolatum parasitized 3.8% of winter moth larvae in 2008. A similar increase in parasitism of winter moth by A. flaveolatum between 2007 and 2008 was observed at the five other oak sites that are sampled on a routine basis.
discussion:
Winter moth populations at Naden were lower in 2008 and 2009 than the regional average, but this is not unusual because both winter moth and parasitoid population densities have been consistently lower at Naden than the average levels for the Greater Victoria area since 1991. On average, winter moth populations during the years 2003-2009 were the highest recorded since 1983 in the Greater Victoria area, although

Environmental Science Advisory Committee P031-08
30
populations have fluctuated considerably at individual sampling locations.
Parasitism by c. albicans increased at Naden (from 13.6% in 2007 to 38.8% in 2008), mirroring a similar increase throughout the Greater Victoria area as a whole (from 27.3% to 32.5%) for 2007 and 2008, respectively. in 2009, the average winter moth population in the Greater Victoria area remained at approximately the same level as in the previous year, with some minor variations among the plots. This may be due, in part, to the decreased presence of Cyzenis albicans in the Greater Victoria area during the last 9 years (since 2000, there have been 4 years when parasitism by Cyzenis albicans was 10% or lower). This reduction in parasitism by C. albicans has undoubtedly enabled the winter moth to maintain its current population levels, rather than declining to its pre-2000 levels (as occurred briefly between 2006 and 2007). Unfortunately, it is difficult to know what effect weather may also have played in reducing the effectiveness of the parasitoids (since the parasitoid rearings are done under controlled conditions in the laboratory). Parasitoid emergence is likely to be lower in the field when precipitation is lower than average, and the parasitoids may have trouble “chewing” their waythrough the dried out cocoons and crust of the duff or soil surface.
The biggest surprise was the unexpected increase in parasitism by Agrypon flaveolatum. Based on previous year’s data, and the last 20 years of monitoring, it was expected that parasitism Agrypon flaveolatum would remain at or below 1% in 2008.
it appears that a partial equilibrium may have been reached between the winter moth and its two introduced parasitoids. Data collected over the past 26 years indicates that these introduced parasitoids will not eliminate the winter moth (this was never expected), but that small fluctuations will increase in amplitude from time to time to the point where winter moth populations will temporarily “escape” from its parasitoids and cause light to moderate defoliation of
Garry oak in localized areas in the Greater Victoria area. it is not known what, if any, factors could disrupt this “natural balance” reached between the winter moth and its parasitoids. The infrequent application of Bacillus thuringiensis subsp. kurstaki against gypsy moth during eradication programs may temporarily disrupt this equilibrium reached between the winter moth and its two introduced parasitoids. Parasitoid emergence may also decrease during dryer than normal spring, when the “hardened” cocoon and duff surface may negatively affect parasitoid emergence.
P031-08. collecting Winter moth larvae.
conclusions:
monitoring the winter moth and its parasitoids indicates that the two introduced parasitoids, Cyzenis albicans and Agrypon flaveolatum, have controlled the winter moth in the Greater Victoria area. However, both the recent drought (which makes the soil dry and hard, making it difficult for the mature larvae to burrow into the soil to pupate in mid- to late may) and the eradication programs conducted against both Asian and European gypsy moths in the Greater Victoria area have made it difficult to predict with any certainty when, and at what host density levels, the winter moth and its parasitoids will reach or remain in equilibrium. in these eradication programs, the bioinsecticide, Bacillus thuringiensis subsp. kurstaki (Btk), was used. Although Btk has a much narrower target range than chemical insecticides, it still affects a number of Lepidoptera

Environmental Science Advisory Committee P031-08
31
species, including the winter moth. Therefore, it may be desirable to continue monitoring these insects. continued monitoring will not only reveal the stability of the equilibrium reached by the winter moth-parasitoid complex, it will also show if this equilibrium is affected by the periodic use of Btk to prevent the establishment of another invasive species, the gypsy moth. soil moisture conditions may also need to be monitored during this period when mature larvae drop to the ground to burrow into the soil, and during adult moth and parasitoid emergence.
One of the authors (i.s.Otvos) retired on November 6, 2009. The winter moth monitoring program will be written up as one or more manuscripts for publication in scientific journal(s).
acknowledgements:
We would like to thank the following people for helping with the cluster (branch-tip) sampling and processing the cluster samples, and for assisting with collecting and rearing the mass-collected winter moth larvae: caitlin Braun, chida Henry, saul Joseph, Karolina monge monge, Dean Rystaad, and Greg smith.
references:
Embree, D.G. 1971. Operophtera brumata (L.), winter moth (Lepidoptera: Geometridae). in: J.s. Kelleher, P. Harris, Reeks, W.A., Williamson, G.D., Prentice, R.m., and corbet, P.s. (coords.). Biological control Attempts against insects and Weeds in canada, 1959-1968. Technical communication 4, commonwealth institute of Biological control, Trinidad. commonwealth Agricultural Bureaux, farnham Royal, slough, United Kingdom. pp. 167-175.
Embree, D.G., and Otvos, i.s. 1984. Operophtera brumata (L.), winter moth (Lepidoptera: Geometridae). in: J.s. Kelleher, and m.A. Hulme.
Biological control Programmes against insects and Weeds in canada 1969-1980. commonwealth Agricultural Bureaux, farnham Royal, slough, United Kingdom. pp. 353-357.
fuchs, m.A. 2001. Towards a recovery strategy for Garry oak and associated ecosystems in canada: Ecological assessment and literature review. Technical Report GBEi/Ec-00-030. Environment canada, canadian Wildlife service, Pacific and Yukon Region. http://www.goert.ca/documents/litreview.pdf Last accessed Aug. 3, 2010.
Gillepsie, D.R., finlayson, T., Tonks, N.V., and Ross, D.A. 1978. Occurrence of winter moth, Operophtera brumata (Lepidoptera: Geometridae) on southern Vancouver island, British columbia. canadian Entomologist 110 (2): 223-224.
Hawboldt, L.s., and cumming, f.G. 1950. cankerworms and European winter moth in Nova scotia. Bi-monthly Progress Report 6 (1): 1.
Hunter, m.D., Watt, A.D., and Docherty, m. 1991. Outbreaks of the winter moth on sitka spruce in scotland are not influenced by nutrient deficiencies of trees, tree budburst, or pupal predation. Oecologia 86 (1): 62-69. DOi 10.1007/Bf00317390.
Otvos, i.s. 2009. monitoring winter moth and the parasites introduced for its control. in: Department of National Defense, Environmental science Advisory committee 2008/2009 Annual Report. Department of National Defense and Natural Resources canada, Victoria, B.c.

Environmental Science Advisory Committee P044-09
32
Environmental Science Advisory Committee
Project leader(s): Bruce cousens, J. charlene Leeorganization(s): Georgia Basin Ecological Assessment and Restoration society (GBEARs), in partnership with Rocky Point Bird Observatory societyaddress(es): #4 – 1150 N. Terminal Ave., Unit 117, Nanaimo, B.c., V9s 5L6telephone no.(s): (250) 758-2922Facsimile: (250) 758-2922 Email(s): [email protected]
PErmit #: P044-09location(S): cOLWOOD, ROYAL ROADs
Start datE: 1 APRiL 2009comPlEtion datE: 30 sEPTEmBER 2009ProjEct StatUS: 1998-ONGOiNG
Purple martin (Progne subis) origins and relationships
introduction:
Western Purple martins (Progne subis arboricola), the largest member of the swallow family in North America, are at the northwestern limit of their breeding range in southwest British columbia (B.c.). This partly accounts for the low abundance and Blue-listed conservation status (“Vulnerable”) in B.c., in combination with widespread habitat loss and competition for cavity nest sites from non-native species within their historic breeding range. This subspecies is considered at risk throughout the breeding range west of the Rocky mts., from B.c. to california (cA). in 1984 martin numbers had decreased to less than five known pairs in B.c. By 1995, in response to provision of man-made nest boxes for a decade, the total number of known active Purple martin nests in B.c. had increased to 55 (Bc ministry of Water, Land and Air Protection, 1997).
since 1997 Purple martin colonies in B.c. have been monitored systematically to document annual abundance and juvenile production. As well, from 75% to 98% of all nestlings produced at known breeding locations in B.c. have been banded each year with standard canadian Wildlife service (cWs) identification bands and with uniquely coded coloured
plastic or aluminum auxilliary marker bands; the latter are visible with binoculars and readable with a spotting scope. The goals of banding are to monitor inter-colony movements (natal dispersal and recruitment) and interactions, annual migration, population age structure, fledgling production and seasonal mortality.
conservation efforts have resulted in the B.c. martin population recovering to ~200 pairs at 16 colonies in 2000 (Darling et al. 2004), and to a peak of ~650 pairs at 46 colonies in 2007, before declining to ~500 pairs (-23%) at 45 colonies in 2009. The rapid growth prior to 2007 was caused by three nesting seasons with favourable weather that resulted in high nesting success, production and subsequent recruitment (cousens et al. 2005a, 2005b, Lee et al. 2007). The recent decline was the result of adult losses in spring 2008 and low recruitment after reduced nesting success and production in 2007 and 2008, caused by unfavourable spring and summer weather (finlay et al. 2009).
Study area and methods:
The DND colwood and Royal Roads colony sites, located on southern Vancouver island near Victoria,

Environmental Science Advisory Committee P044-09
33
results: After three years of unexplained nest failure and abandonment at the colwood colony (finlay et al. 2009), no adult martins returned to or tried to nest at this site in 2009, for the first time in over two decades, and later-arriving subadult martins did not re-occupy the site later in the season. The colwood colony was visited on 8 occasions between April 18 and July 26. Two adult male martins were seen and heard flying overhead on April 18, but did not visit or occupy the nest boxes during the site monitoring visit, and none were seen thereafter. since martins do not initiate nesting after early-mid July, there were no further observations here after July 26 and no opportunity to monitor nest boxes for nocturnal predator attacks with a remote infra-red motion-sensitive camera.
in contrast, the established colony at Royal Roads University experienced a substantial population increase, from six pairs in 2007 and only three pairs in 2008 to 12 pairs in 2009, occupying all but two of the 14 standard wooden nest boxes (but none of the five PVc nest tubes). The remaining nest boxes were used by swallows (several additional pairs were displaced by martins). The Royal Roads colony was visited and monitored on the same dates as the colwood site, with additional visits for banding nestlings in July and August, for a total of 15 visits. Two pairs of adult martins were first observed at the nest boxes on the evening of 30 April, seven to ten days after they arrived at many other south-central Vancouver island colonies, though they were settled into nest boxes and may have arrived a few days earlier. Additional adult and subadult birds continued to arrive throughout may and June, with all available nest boxes occupied by martins or swallows by the end of June. A total of 45 nestlings in 11 nest boxes (4.1 young/pair) were banded between July 17 and August 11, all of which apparently fledged.
several pairs also attempted to nest again in ports in the side of vessels temporarily berthed at Dockyard, as in some previous years. Attempts were made by ship’s
are two of 45 currently active nest box sites throughout the strait of Georgia in B.c. in 2009, 42 Purple martin colonies, including DND sites, were visited periodically to identify individuals banded in B.c. and Washington (WA) in previous years, inspect nests, document number of pairs and nesting success and band nestlings. The number of visits per colony varied depending on ease of access, with multiple monitoring and band-reading visits and 2-3 nest check and banding visits at accessible sites and at least one nest check and banding visit at more remote sites. Bands were read with 15-45x or 20-60x spotting scopes and the band codes were recorded. The number of eggs and/or nestlings were recorded in all accessible nest boxes inspected. Adults captured incidentally on the nest were examined and band numbers were recorded before the bird was replaced on the nest or released.
Productivity was determined for each colony on a per pair basis and used in combination with overall abundance and average overwinter survival from previous years to predict the returning population the following year from the B.c. population forecast model. Production in excess of ~2.5 young/pair indicates a probable population increase, while lower values typically indicate a decline. As well, the sample of birds identified and aged from incidental captures and band reading with spotting scopes was used to document subadult dispersal and recruitment from natal colonies and adult relocation from previous breeding sites, provide longevity data, and estimate age composition of the population.
Eight visits to the colwood colony and 15 to Royal Roads occurred between 15 April and 28 August for observations, nest box checks and banding nestlings, with more visits to Royal Roads for box checks and banding. Banding data and band resight records of identified individuals were compiled and submitted to the cWs Banding Office.

Environmental Science Advisory Committee P044-09
34
subadult martins (which are responsible for occupation of most vacant sites) are strongly attracted to established colonies with adult birds, usually occupying vacant sites when the population is growing and established colonies begin to saturate. This was not the case in B.c. in 2009; very few formerly vacant sites were utilized, and in all cases by relocating adults rather than subadult recruits. However, based on the successful nesting season and higher fledgling production rate in southern Vancouver island (3.2 young/pair) and B.c. as a whole (3.3 young/pair) in 2009, a higher subadult recruitment rate and a population increase are expected in 2010. if so, re-occupation of the colwood site next year may occur.
The dramatic increase from three to 12 nesting pairs at the Royal Roads University colony was atypical, given the overall population decline, with increases at only a few colonies, mainly in the Victoria area. Because of the adult losses and low fledgling production in 2008 (finlay et al. 2009), subadult recruitment in 2009 was low at most colonies, as predicted by the B.c. population forecast model. most colonies showed moderate population declines, except at several colonies in Baynes sound, where fledging success in 2008 and subadult recruitment in 2009 were above average. many of the “new” birds at Royal Roads this year were adults, suggesting they may have relocated from the nearby West Bay colony, where due to an oversight, nest box entrances remained plugged to deter House sparrows well into the nesting season, causing early arriving adults to relocate and nest elsewhere.
Raising only a single brood in a season, martins exhibit variably asynchronous nesting timing to reduce the impact risk from periods of adverse weather, with the early season timing determined by weather conditions. Unlike the previous two years with prolonged cold wet spring weather, the spring of 2009 was unusually warm and dry, resulting in early abundance of flying insects for food and very early nesting by earlier-arriving adults and some early subadult martins, with many adults laying eggs by the end of may. combined
crew to locate and remove the nests before eggs were laid and a protocol has been developed to identify and discourage such nesting attempts before eggs are laid in future.
We read band numbers on birds banded as nestlings in previous years, to determine where and when these birds were originally banded and fledged, which indicate the extent of dispersal and genetic mixing in the regional population. While reading ~250 bands at >20 colonies around the strait of Georgia in 2009, we found nine birds (<4%) at colonies widely distributed around the strait (Victoria, Ladysmith, Nanoose, Deep Bay and Vancouver) that had fledged at colwood in 2003-2005, prior to initial colony abandonment in 2006. One bird banded at the small Royal Roads colony in 2007 was seen at comox in 2009.
No bands were read at the colwood colony site in 2009, since no martins nested there. five bands were read on birds nesting at the Royal Roads colony on July 29, all fledged from colonies on eastern Vancouver is. (Patricia Bay, cowichan Bay, Newcastle island [Nanaimo], Nanoose Bay and fanny Bay) in 2004, 2007 and 2008. These reflect the usual diversity and mixing of natal origins found at established martin colonies in B.c.
discussion:
No adult (2+ years old) or subadult (1 year old) martins returned to and attempted to nest at the colwood DND diving dock site in 2009, after complete nest failure and colony abandonment in the previous three years. The cause of repeated abandonment remains unconfirmed, but is thought to be the result of nocturnal nest predation attempts by owls (finlay et al. 2009).
The lack of re-occupation of the colwood site in 2009 is not surprising, given the absence of returning adults, low nesting success and fledgling production in 2008, and the resulting very low subadult recruitment rate and continued B.c. population decline. Later-arriving

Environmental Science Advisory Committee P044-09
35
effects, which tend to regulate martin populations and cannot be avoided. However, based upon the good productivity in 2009, the recent losses may be compensated for by increased recruitment in 2010.
The ongoing monitoring and banding studies of Purple martins in B.c. have provided a well-documented record of the progress of recovery and continue to provide valuable biological data on productivity, dispersal, recruitment, longevity and population dynamics.
Over 1750 of ~9600 Purple martins banded as nestlings at B.c. colonies in 1997-2008 have been re-sighted at different colonies than their natal colonies in B.c., as well as in WA and Oregon, and in cA during migration. in addition, 30 of ~1400 birds banded in WA in 2001-2008 have been sighted throughout the breeding range in B.c. These data confirm that regional populations mix and overlap, as supported by the results of mitochondrial DNA analysis comparing west coast and eastern populations (Baker et al. 2008). The DNA study indicates that the B.c. colonies are part of a broader regionally stratified population in Bc-WA and throughout the west coast breeding range. (for further discussion of our recent western martin DNA studies see finlay et al. 2009.)
The band re-sight data also provide information on the average and maximum life span of Purple martins, as well as inter-annual variations in population age structure. Those data are critical to understanding population fluctuations and managing the recovery of this at-risk species. Recently, several 9 -11 year-old banded birds have been confirmed. As well, the proportion of subadult recruits in the B.c. population has declined annually since the period of high production and rapid growth in 2003-2006, from 50-60% in 2004 to only ~10% in 2009. This suggests an aging population with a growing proportion of older birds and potential for future collapse, as a result of insufficient recruitment to offset annual mortality losses. The relatively high production rate this year may reverse this trend in 2010 and restore a more balanced population age structure.
with the low number of later-arriving subadult recruits present in 2009, this synchronized most of the nesting in the earlier portion of the season (the reverse of the situation in 2008), again leaving the nestlings particularly vulnerable to periods of adverse weather during the critical early nestling rearing period.
fortunately, there was only one significant period of cool wet weather for several days in early July and nestling losses were not severe. As a result, overall fledgling production was relatively high (3.3 young/pair), resulting in a predicted population increase to 600-650 pairs (+20-30%) from the population forecast model for Purple martins in B.c. in 2010. should the predicted forecast materialize, this will largely offset the previous two years of declines.
The number of banded Purple martins from the once large (~50 pairs) colwood colony that are seen at other colonies (12 in 2008, nine in 2009) is declining. After four consecutive years without production at the colwood site, birds banded here in earlier years are becoming uncommon as older birds drop out of the population due to normal mortality. All banded birds of colwood origin seen in 2009 were at least 4 years old (i.e., they fledged between 2003 and 2005). The scarcity of banded birds from Royal Roads seen at other colonies in 2009 reflects the small size of the colony (1-6 pairs) and resulting low production in previous years.
conclusions:
After a prolonged decline in the mid-late 1900s, for the past two decades the Purple martin population has been increasing in B.c., prior to recent adverse weather-related declines. This recovery is the result of the provision of and continued availability of clustered single nest boxes. The volunteer-driven nest box-based recovery program for Purple martins since 1985 has been highly successful in preserving and recovering the B.c. martin population. The recent declines in abundance were caused by normal adverse weather

Environmental Science Advisory Committee P044-09
36
martin. Brochure.
cousens, B., J.c. Lee, s. Kostka, L.m. Darling, m. Tirhi, J.c. finlay and T.W. Gillespie. 2005a. Recovery of the Western Purple martin bordering the ‘salish sea’ - the Georgia Basin of British columbia and Puget sound, Washington. Proceedings of the 2005 Georgia Basin Puget sound Research conference, seattle WA. *
cousens, B., J.c. Lee, L.m. Darling, J.c. finlay and T.W. Gillespie. 2005b. Two decades of Purple martin stewardship and recovery in British columbia - successes and challenges. Proceedings of the 2005 Georgia Basin Puget sound Research conference, seattle, WA. *
Darling, L.m., J.c. finlay, T.W. Gillespie, B. cousens, s. Kostka and A. Baker. 2004. Recovery of the Purple martin in British columbia: more Than a Nest Box Program. in: T.D. Hooper (Ed.). Proceedings of the species at Risk 2004 Pathways to Recovery conference. march 2–6, 2004, Victoria, B.c. *
finlay, J.c., B. cousens and J.c. Lee. 2009. Purple martin (Progne subis) origins and relationships. 2008 Annual Report, Department of National Defense, Environmental science Advisory committee. Department of National Defense and Natural Resources canada, Victoria, Bc. pp. 28-32. <http://bookstore.cfs.nrcan.gc.ca/pdf.php?catalogNumber=30494>
Lee, J.c., and B. cousens, 2007. Update on Purple martin stewardship and recovery in British columbia, 2006. Proceedings of the 2007 Georgia Basin Puget sound Research conference, Vancouver, Bc. <http://www.engr.washington.edu/epp/psgb/2007psgb/2007proceedings/papers/p2_lee.pdf> *
(*These references are available on-line at <www.georgiabasin.ca/puma.htm>)
The recovery and monitoring program will continue in 2010, including all recent activities at the colwood site, with the hope of determining and if possible mitigating the cause of colony abandonment. in 2010, if there are sufficient numbers of martins at colwood and if funding permits, we may install a motion-sensitive, infra-red flash, wildlife monitoring camera for nocturnal monitoring to attempt to determine if owls are visiting the colony. The equipment will be installed as described and approved for the 2009 season.
We also intend to continue the monitoring, nestling banding and band reading sessions at the Royal Roads University colony, as in 2009. We hope to obtain access to colonies by 1 April 2010, as martins may return in early April, so that we can check for and read bands on any banded birds. Assuming birds return and successfully produce young, we will continue to monitor production and band nestlings, as part of the on-going population monitoring and nest box maintenance program throughout their breeding range in southwest B.c.
acknowledgements:
We wish to thank the Rocky Point Bird Observatory society for continued partnership and assistance with this program at DND sites near Victoria, as well as Tom Gillespie (volunteer south island Regional coordinator/Bander for the Purple martin recovery program), cam finlay and Linda Knox for their ongoing assistance and support. references:
Baker, A.J., A. Greenslade, L. Darling and J.c. finlay. 2008. High genetic diversity in the blue-listed Bc population of the Purple martin maintained by multiple sources of immigrants. conserv Genetics 9(3): 495-505.
B.c. ministry of Water, Land and Air Protection, August 1997, Wildlife in British columbia at Risk: Purple

Environmental Science Advisory Committee P074-09
37
nest sites are visited a minimum of three times.
Activity Survey:Between late march and the end of April, an initial site visit is used to determine activity at the nest sites. During that visit, we are extremely cautious to prevent disturbing the birds; observations involve either locating by calls or by viewing from a distance through binoculars or telescopes. During the initial visit we listen and look for evidence of new nest sites, and attempt to determine if the birds have shifted between alternate nests within a nesting territory.
Environmental Science Advisory Committee
introduction:
This report is an update for an ongoing research project. The Wildlife Tree stewardship (WiTs) Program began on Vancouver island, British columbia (B.c.) in 2000. The program has two main objectives: 1) to document the use of wildlife trees and the nesting success of raptors, using open nests, and other bird species (owls and woodpeckers) using cavities for nesting; and 2) to provide nest site inventory and monitoring data to regional government staff to help in securing protection of wildlife tree nesting sites.
The aspect of the WiTs program carried out on Department of National Defence (DND) lands at Rocky Point, Albert Head and colwood, to this date, includes the locating and monitoring of Bald Eagle (Haliaeetus leucocephalus) and Osprey (Pandion haliaetus) nests. As the Rocky Point and colwood sites are protected from much of the human related disturbance found at sites in more populated areas, these nesting territories are valuable for comparison with other sites.
Study area and methods:
The study area includes Bald Eagle and Osprey nests sites in the coastal forests of Rocky Point (map 1), Albert Head and colwood (map 2). Each year, known
Project leader(s): ian moul and Gwen Greenwood organization(s): Wildlife Tree stewardship Program (WiTs) federation of Bc Naturalists (fBcN)address(es): 1585 Birch Avenue, comox, B.c. V9m 2N5telephone no.(s): (250) 890-0713Email(s): [email protected]
PErmit #: P074-09location(S): ROcKY POiNT, ALBERT HEAD, AND cOLWOOD
Start datE: 1 APRiL 2009comPlEtion datE: 31 DEcEmBER 2009ProjEct StatUS: 2002-ONGOiNG
Wildlife tree Stewardship Program
map 1. Bald Eagle nest site locations and nesting territories at Rocky Point.
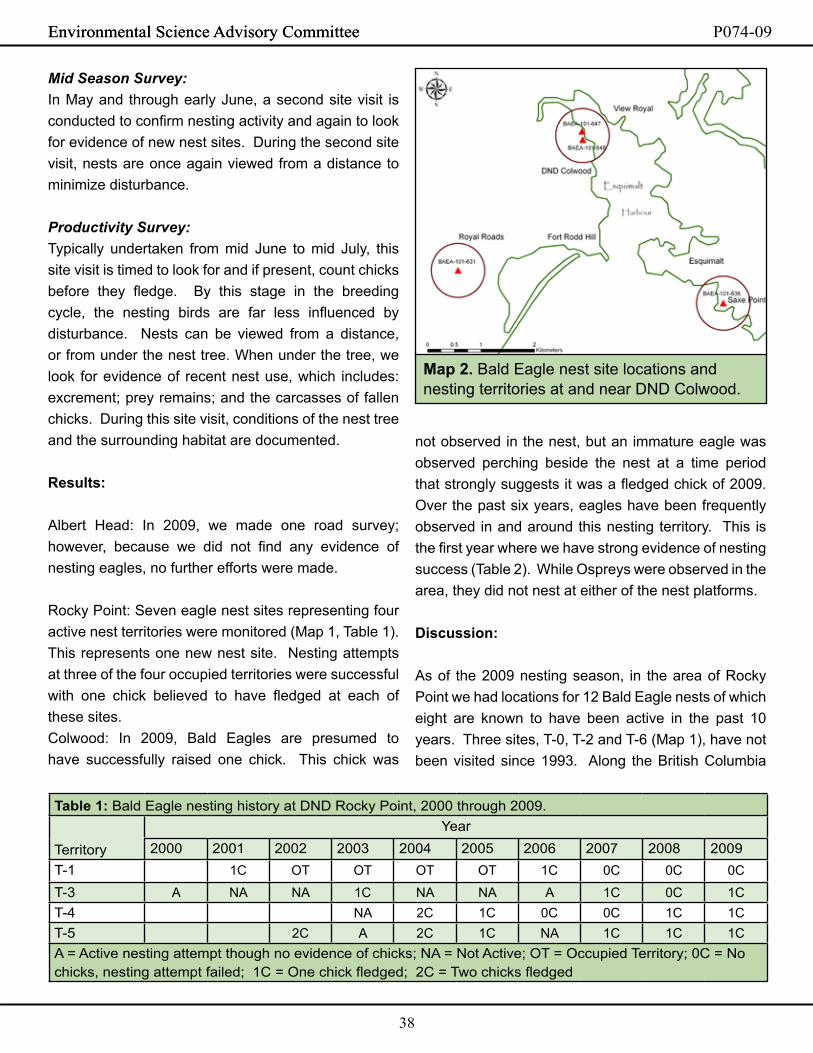
Environmental Science Advisory Committee P074-09
38
Environmental Science Advisory Committee
table 1: Bald Eagle nesting history at DND Rocky Point, 2000 through 2009.
Territory
Year2000 2001 2002 2003 2004 2005 2006 2007 2008 2009
T-1 1c OT OT OT OT 1c 0c 0c 0c
T-3 A NA NA 1c NA NA A 1c 0c 1cT-4 NA 2c 1c 0c 0c 1c 1cT-5 2c A 2c 1c NA 1c 1c 1cA = Active nesting attempt though no evidence of chicks; NA = Not Active; OT = Occupied Territory; 0c = No chicks, nesting attempt failed; 1c = One chick fledged; 2c = Two chicks fledged
Mid Season Survey: in may and through early June, a second site visit is conducted to confirm nesting activity and again to look for evidence of new nest sites. During the second site visit, nests are once again viewed from a distance to minimize disturbance.
Productivity Survey:Typically undertaken from mid June to mid July, this site visit is timed to look for and if present, count chicks before they fledge. By this stage in the breeding cycle, the nesting birds are far less influenced by disturbance. Nests can be viewed from a distance, or from under the nest tree. When under the tree, we look for evidence of recent nest use, which includes: excrement; prey remains; and the carcasses of fallen chicks. During this site visit, conditions of the nest tree and the surrounding habitat are documented.
results:
Albert Head: in 2009, we made one road survey; however, because we did not find any evidence of nesting eagles, no further efforts were made.
Rocky Point: seven eagle nest sites representing four active nest territories were monitored (map 1, Table 1). This represents one new nest site. Nesting attempts at three of the four occupied territories were successful with one chick believed to have fledged at each of these sites.colwood: in 2009, Bald Eagles are presumed to have successfully raised one chick. This chick was
map 2. Bald Eagle nest site locations and nesting territories at and near DND colwood.
not observed in the nest, but an immature eagle was observed perching beside the nest at a time period that strongly suggests it was a fledged chick of 2009. Over the past six years, eagles have been frequently observed in and around this nesting territory. This is the first year where we have strong evidence of nesting success (Table 2). While Ospreys were observed in the area, they did not nest at either of the nest platforms.
discussion:
As of the 2009 nesting season, in the area of Rocky Point we had locations for 12 Bald Eagle nests of which eight are known to have been active in the past 10 years. Three sites, T-0, T-2 and T-6 (map 1), have not been visited since 1993. Along the British columbia

Environmental Science Advisory Committee P074-09
39
Environmental Science Advisory Committee
1973).
Although the production of eagle chicks at Rocky Point is higher than found at more remote wilderness areas, such as clayoquot sound and Johnstone strait; it is lower than has been observed at several more developed locations around the strait of Georgia. Low eagle nest productivity in those presumably more pristine areas may be related to food supply during the time of rapid chick growth in may and June (Elliott et al. 1998). in clayoquot sound, an area of low productivity, successful nesting locations appeared to have been associated with proximity to the garbage dumps, fish processing areas or logging camps (i. moul, unpubl. data). The relatively low nesting success at Rocky Point may reflect its location as somewhat of a wilderness area that is yet not too distant from potential supplementary food sources in the Greater Victoria area.
conclusions:
The WiTs program would like to continue monitoring
young at Bald Eagle nests is based on a common method that records the number of chicks raised to fledging in each occupied territory (Postupalsky 1974). With only five eagle nesting territories at Rocky Point, the sample size is too small to make statistical comparison between the nests or to predict trends. However, if the data are pooled over the ten seasons, we have 25 observations of occupied territories that may be compared with data collected at other sites. Between 2000 and 2009 we had an average of 0.72 young produced per occupied territory. This is just above the 0.70 chicks per occupied territory thought necessary to sustain a local population (sprunt et al.
coast, Bald Eagles defend a nesting territory of approximately one kilometre of coastline. for reasons not completely known, most pairs of Bald Eagles have more than one nest in their territories and they will often switch nests from year to year. By considering the nest usage pattern and the distances between nests, we have divided the 12 known nesting sites into seven nesting territories (map 1). The one-kilometre circles on map 1 are centred on either the nest location or an average centre point of nests thought to make up a nesting territory. in the natural world, Bald Eagle nesting territories are never precise circles and will vary in size depending on habitat conditions. Territories are usually centred in locations with suitable tree where the eagles have a view of the surrounding area; in coastal areas this is often the ocean which provides the majority of their food. in areas where fish are often concentrated, nesting territories are expected to be smaller and closer together.
in the Rocky Point area, looking at the patterns of territories and the coastline configuration, we might expect to find at least three additional territories. The first would be on William Head, a location with a commanding view of the surrounding waters. Additional, potential territory sites are the west and east portions of Rocky Point. At the colwood site, if suitable trees were present we would expect to find nesting territories at either side of the mouth of Esquimalt Harbour. Given the urban development in the city of Esquimalt, no remaining nest trees are expected. On the west side of the entrance to Esquimalt Harbour, at the fort Rodd Hill National Historic Park, if suitable nest trees exist, we might expect the presence of eagles.
Across North America, measuring the production of
table 2: Bald Eagle nesting history at DND colwood, 2004 through 2009.Territory Name
Year2004 2005 2006 2007 2008 2009
DND colwood OT OT A A OT 1c
A = active nest though no evidence of chicks; 1c = one chick fledged; OT = occupied territory

Environmental Science Advisory Committee P074-09
40
Environmental Science Advisory Committee
the Bald Eagle nests at Rocky Point and other DND properties as they form a valuable data source to compare with other areas. in the future we hope to expand the sample of nests observed to sites along the Juan de fuca shore beyond the DND boundaries. acknowledgements:
We wish to thank Barb Begg, fern Walker, Jenny Hyndman, sue myerscough and Gaye Goldie for assisting in data collection for this project.
references:
Elliott, J.E., i.E. moul, and K.m. cheng. 1998. Variable reproductive success of Bald Eagles on the British columbia coast. Journal of Wildlife management 62:518-529.
moul, i. E. 1998. Nest inventory and productivity assessment for Bald Eagles in clayoquot sound, British columbia. Unpublished Report, B.c. ministry of Environment, Lands and Parks.
Postupalski, s. 1974. Raptor reproductive success: some problems with methods, criteria and terminology. Raptor Research Reports. 2:21-31.
sprunt, A., W.B. Robertson, s. Postupalsky, R.J. Hensel, c.E. Knoder, and f.J. Ligas 1973. comparative productivity of six Bald Eagle
populations. Transaction of the North American Wildlife and Natural Resources conference 38:96-106.
WiTs 2009. summary of Bald Eagle nesting results for the Deep Bay to Little qualicum River area of Vancouver island, British columbia. federation of Bc Naturalists, WiTs Local Area Report 2009:3 (in press).
table 3: comparison of nesting history and production of Bald Eagle nest sites at Rocky Point with other studies (WiTs 2010; Elliott et al. 1998).
study site Years Nesting attempts in occupied territories
successful nesting attempts
chicks per occupied territory
Rocky Point 2000-2009 27 15 0.72Deep Bay to qualicum 2001-2009 17 11 0.97south-east Vancouver island 1991-1995 32 20 0.95fraser River Delta 1993-1996 11 8 1.10Lower fraser Valley 1990-1996 21 18 1.20Barkley sound 1992-1995 33 15 0.56clayoquot sound 1992-1995 35 8 0.27Johnstone strait 1991-1995 27 7 0.30
P074-09. Bald Eagle.
Environmental Science Advisory Committee P079-09
41
Environmental Science Advisory Committee
Project leader(s): David Peter and Roderick Negrave organization(s): U.s. forest service Olympia forestry sciences Laboratory; B.c. ministry of forests address(es): 3625 93rd Avenue sW, Olympia, Washington 98512-9193; 2100 Labieux Rd., Nanaimo B.c., V9T 6E9 telephone no.(s): (360) 753-7654, (250) 751-7190Facsimile(s): 1 (360) 753-7737Email(s): [email protected]; [email protected]
PErmit #: P079-09 location(S): cfmETR AND ROcKY POiNT
Start datE: 10 sEPTEmBER 2009comPlEtion datE: 6 OcTOBER 2009ProjEct StatUS: 2001-ONGOiNG
Garry oak acorn Survey
introduction:
Garry oak (Quercus garryana) ecosystems from southern california to Vancouver island are disappearing or changing due to introduction of exotic species, fire suppression and land conversion for agricultural and urban uses (Agee 1993, Bell and Papanikolas 1997, chappell and crawford 1997, Reed and sugihara 1987, Tveten and fonda 1999). Garry oak-associated communities are among the most threatened ecosystems in canada and provide habitat to more than 100 red- and blue-listed species (Gedalof et al. 2006). Garry oak primarily reproduces from acorns, although root-crown sprouting may also occur if stems are heavily damaged (stein 1990).High annual and tree-to-tree variation in acorn production is characteristic of oak species in general (Koenig 1980), and Garry oak in particular (Peter and Harrington 2009), but more information on acorn crop variation or regularity in Garry oak is needed (stein 1990). The purpose of the Garry Oak Acorn Production study is to determine the spatial and temporal variation in acorn production and the factors that influence it. Annual acorn production is monitored from Vancouver island to southern Oregon with the help of volunteers
and cooperating agencies. To assist our volunteers and inform the general public, we created a website with background information, methods and forms used in the survey, and results of the survey (www.fs.fed.us/pnw/olympia/silv/oak-studies/acorn_survey). The Vancouver island sites are important as they are near the northernmost distribution of Garry oak and may thus reveal important information about climatic limitations on Garry oak distribution. in this report, we describe acorn production among sites on Vancouver island, including DND properties. Acorn production for adjacent areas in the Puget sound area of Washington state is presented for comparison.
Study area and methods:
The number of trees monitored annually on or near Vancouver island has increased from 54 trees in 2001 to 230 trees in 2005. in 2009, only 200 trees were monitored due to mortality (8 trees) and lack of access to one DND site (mary Hill: 16 trees) and one isolated location with boat access only (Pylades island: 3 trees) and three isolated trees that were dropped on the saanich Peninsula. The sample trees extend from courtenay in the north to Rocky Point southwest of

Environmental Science Advisory Committee P079-09
42
results: cfmETR had the lowest acorn production in 2009 (figure 1), which it consistently has had since 2003. southern woodland showed higher production that northern woodland, which has been the usual pattern. Production on juvenile trees was intermediate between southern and northern woodland areas. Acorn production was greatest on riparian-maritime sites; which is atypical, as cultivated areas are usually the most productive areas. The three trees at Drumbeg Provincial Park had quite small and wrinkled leaves, which may indicate declining health.
compared to groups in Washington state, acorn production was apparently greater in cultivated and riparian portions of Vancouver island (figure 2) but less in woodland locations. Among woodland groups, acorn production was highest in north Puget sound locations in 2009. Vancouver island woodlands appeared to have slightly lower acorn production than woodland groups in south Puget sound. discussion:
Results from this study indicate that long, warm, moist growing seasons and dry spring conditions benefit acorn production (Peter and courtin 2006, Peter and Harrington 2009). The generally moister conditions of cultivated and riparian areas are thus likely responsible for higher acorn production in these locations. in general, 2009 appears to have been an above-average year for acorn production on Vancouver island and the Puget sound area. since 2001 when we began measurements there have been three good production years (2004, 2006 and 2009), possibly suggesting that mast years occur about 3 years apart on average. conclusions:
We plan to continue acorn surveys for at least 3 more years, as each year of data adds clarity to geographic and climatic relationships to acorn production, and
Victoria in the south. mary Hill has been included in the results but as access to this site has been denied since 2006, it is likely that access will continue to be permanently denied in future.
We surveyed acorns in september and October and ranked acorn production from 1 to 4 with 1 indicating no acorns and 4 indicating a heavy crop (Graves 1980). Acorn class increments are not equal. for example, in total acorn counts from a small sample of trees, class 3 trees averaged about eight times as many acorns as class 2 trees. Results from trees greater than 10 cm dbh are reported here. Trees were assigned to groups based on location and site characteristics. These included: cultivated locations, such as lawns, pastures and parks, riparian locations, near water bodies; woodlands; and cfmETR, which is distinct in that it is very open and savannah-like. The woodland group was further separated into northern and southern groups at the latitude of Duncan. Rocky Point was included in the southern woodland group. A separate category for juvenile trees was also used.
for comparison, 2009 acorn production data are presented for cultivated, riparian and woodland areas in the south Puget sound (south of seattle) area and woodlands of the north Puget sound (north of seattle) area.
P079-09. Garry Oak acorns.

Environmental Science Advisory Committee P079-09
43
Figure 1. Average, annual, Garry Oak acorn production by group for Vancouver island.
Figure 2. Average 2009 acorn production by group for Vancouver island (Vi), Vancouver island North (Vi N.), Vancouver island south (Vi s.), south Puget sound (sPs) and North Puget sound (NPs).
0.0
0.5
1.0
1.5
2.0
2.5
vi cult
ivated
SPS cult
ivated
vi ripa
rian
SPS ripa
rian
vi n. W
oodla
nd
vi S. W
oodla
nd
nPS Woo
dland
SPS Woo
dland
vi cFm
Etr
vi juv
enile
aco
rn a
bu
nd
ance
Sco
re
vancouver isl.S. Puget Snd.n. Puget Snd.

Environmental Science Advisory Committee P079-09
44
coordinator), Proceedings of the symposium on the Ecology, management, and Utilization of california Oaks, UsDA forest service General Technical Report PsW-44. Pacific southwest forest and Range Experiment station, Berkeley, california.
Peter, D. H., and c. A. Harrington. 2009. synchronicity and geographic variation in Oregon White Oak acorn production in the Pacific Northwest. Northwest science 83:117-130.
Reed, L. J., and N. G. sugihara. 1987. Northern oak woodlands - ecosystem in jeopardy or is it already too late? Pages 59-63 in T. R. Plumb and N. H. Pillsbury, editors. Proceedings of the symposium on multiple-use management of california’s hardwood resources, Gen. Tech. Rep. PsW-100. U.s. Department of Agriculture, forest service, Pacific southwest forest and Range Experiment station, Berkeley, cA.
stein, W. i. 1990. Quercus garryana Dougl. ex Hook. Pages 650-660 in R. m. Burns and B. H. Honkala (technical coordinators), silvics of North America Volume 2, Hardwoods. UsDA forest service Agriculture Handbook 654. Washington, D. c.
Tveten, R. K., and R. W. fonda. 1999. fire effects on prairies and oak woodlands on fort Lewis, Washington. Northwest science 73:145-158.
hopefully continue the study as long as 2020. We expect this study will result in papers describing geographic and temporal masting patterns, and the effects of weather habitat and competition on acorn production in Garry oak. Data for this study is maintained at the UsDA Pacific Northwest forestry sciences Laboratory in Olympia, WA. references:
Agee, J. K. 1993. fire Ecology of Pacific Northwest forests. island Press, Washington, D. c.
Bell, R., and s. Papanikolas. 1997. Restoration planting of Oregon white oak seedlings in western Washington. Pages 247-257 in P. Dunn and K. Ewing (editors), Ecology and conservation of the south Puget sound Prairie Landscape. The Nature conservancy of Washington, seattle, Washington.
chappell, c. B., and R. c. crawford. 1997. Native vegetation of the south Puget sound prairie landscape. Pages 107-122 in P. Dunn and K. Ewing (editors), Ecology and conservation of the south Puget sound Prairie Landscape, The Nature conservancy of Washington, seattle, Washington.
Graves, W. c. 1980. Annual oak mast yields from visual estimates. Pages 270-274 in T. R. Plumb (technical coordinator), Proceedings of the symposium on the Ecology, management, and Utilization of california Oaks, UsDA forest service General Technical Report PsW-44. Pacific southwest forest and Range Experiment station Berkeley, california.
Gedalof, Z., Pellatt, m. and D.J. smith. 2006. from prairie to forest: Three centruries of environmental change at Rocky Point, Vancouver island, British columbia. Northwest science 80: 34 - 46
Koenig, W. D. 1980. Acorn storage by acorn woodpeckers in an oak woodland: an energetics analysis. Pages 265-269 in T. R. Plumb (technical P079-09. Garry Oak tree sampling at Rocky Point.

Environmental Science Advisory Committee P087-09
45
Environmental Science Advisory Committee
Project leader(s): matt Dodd organization(s): Royal Roads Universityaddress(es): 2005 sooke Road, Victoria, Bc, V9B 5Y2telephone no.(s): (250) 391-2583Facsimile: (250) 391-2587Email(s): [email protected]
PErmit #: P087-09 location(S): ROcKY POiNT
Start datE: 15 sEPTEmBER 2009comPlEtion datE: 31 DEcEmBER 2009ProjEct StatUS: 2002-2009; cOmPLETE
atmospheric monitoring and microclimate Station decommissioning
introduction: canada is committed to policy and actions for eliminating the production, use, and global atmospheric distribution of Persistent Organic Pollutants (POPs) under the stockholm convention on Persistent Pollutants (2004). These pollutants are among the most dangerous of substances released into the environment by human activities. Owing to 1) their long life in the environment, 2) high accumulation in living tissues, and 3) movement up food chains; these substances have resulted in global health problems (immune, nervous, and reproductive system damage) in humans and other organisms for many decades. many of the of 12 POPs listed on the stockholm convention, including pesticides (e.g., dichlorodiphenyltrichloroethane (DDT), chlordane, mirex) and other contaminants (e.g., polychlorinated biphenyls (PcBs)), are still either actively produced, used, and/or stockpiled in developing countries. Although the occurrence of hazardous air pollutants from Asia and other source areas are well documented in the canadian Arctic, there is little information on POPs in air masses reaching temperate coastal regions of western canada. studies in mountain environments of the canadian Rockies have revealed unusually high
concentrations of PcBs, DDT, and other pesticides in biological samples (e.g., fish, spruce and pine trees) that are likely attributable to more recent long range transport sources (Davidson et al. 2003; Demers et al. 2007; Lafrenière et al. 2006). The west coast region is particularly vulnerable to these toxic substances due to its diverse ecosystems, and economic and social importance as a key population centre for B.c. With these considerations, researchers at Royal Roads University (RRU) initiated an atmospheric monitoring program to ascertain whether POPs are present in air that reaches the west coast of Vancouver island, B.c. through long range transportation of atmospheric pollutants; and how the findings can help further inform canadian and international Policy on global environmental problems.
As part of this research program, three meteorological and air monitoring stations, comprising of the Royal Roads boathouse, christopher Point, and Rocky Point microclimate stations, were established by RRU researchers through direct and in-kind contributions from the canadian foundation for innovation, B.c. Knowledge Development fund, B.c. ministry of Environment, Environment canada, the capital Regional District, and RRU. meteorological conditions

Environmental Science Advisory Committee P087-09
46
Environmental Science Advisory Committee
installed at 20, 30, and 50 m elevations above ground beside the study trees to support temperature and relative humidity measurements. The shields housed temperature thermocouples equipped with data loggers which sent data on routine basis to a server at RRU. six thermocouples were deployed, three at the 30 m elevation and the remaining at the 50 m elevation. communication between the data loggers and RRU polling system was achieved through a code division multiple access (cDmA) cellular antenna system. Three soil moisture probes were installed at selected locations at adjoining sites. The communication equipment and other supporting instrumentation were housed in a small storage shed that was constructed at the site.
Other instrumentation planned for the site included a lysimeter to measure evapotranspiration rates, a 3-metre tripod stand with temperature, relative humidity sensors to provide a sensing level at the surface of the salal vegetation cover, and passive samples for the collection and laboratory analysis for persistent organic pollutants including PcBs, DDT and other pesticides.
The canopy station and the microclimate station were maintained by a technician. Periodic maintenance activities at the sites included removal of unsafe and fallen branches, adjustments to the ladder system, replacement of worn parts, and repairs to the boardwalk.
results:
installation of the data loggers and programming was completed in 2006. Temperature data from six of the probes in the study tree were sent via the communication system to a server at RRU. The data loggers operated for approximately 18 months until the solar battery packs failed in January 2008. A statistical summary of the temperature data is provided in Table 1. The entire polled data set is available as an Excel spreadsheet. The data indicated there were no significant differences between probes at the two elevations.
(i.e., temperature, relative humidity, wind speed and direction) are continuously recorded at these monitoring stations and, with other monitoring stations in the Georgia basin, provide supporting atmospheric information which can be used to differentiate air masses and assist with contaminant source apportioning.
The Rocky Point microclimate station is in a mature Douglas-fir (Pseudotsuga menziesii) forest ecosystem and constitutes the most southern portion of B.c. This report summarizes activities conducted by RRU at the Rocky Point microclimate station from 2004 to 2009. The main activities included the installation of sensors and the infrastructure required to download atmospheric and ecological information using data loggers on a regular basis via remote technology, as well as maintenance of the forest canopy station.
Study area and methods:
The Rocky Point microclimate station is ideally positioned for sampling air masses coming from the North Pacific. With cooperation from the Department of National Defence (DND) and EsAc, two towers were installed at the microclimate station in 2006. The top of the larger tower was level with the top of the forest canopy at approximately 45 m above the forest floor. This tower supported a quantum light sensor for the measurement of photosynthetic light, a wind speed and direction sensor, an aspirated temperature and relative humidity sensor, and a 750 watt solar panel that provided power for the microclimate station’s equipment. The smaller tower reached 30 m above the forest floor and supported a rain gauge and a Yagi antenna. A tipping bucket rain gauge was installed at the 10 m elevation on the tower to improve exposure to the atmosphere.
in 2006 the canopy station consisted of three Douglas-fir trees with tiered platforms that were accessible via a system of dynamic aerial rope ladders to enable ecological and biodiversity research in the upper canopy of the forest. Aspirated shields were

Environmental Science Advisory Committee P087-09
47
Environmental Science Advisory Committee
and deployed elsewhere.
references:
Davidson, D. A., Wilkinson, A.c., Blais, J.m., Kimpe, L.E., mcDonald K.m. and schindler, D.W. 2003. Orographic cold-trapping of persistent organic pollutants by vegetation in mountains of western canada. Environ. sci. Technol. 37 (2): 209–215
Demers, m.J., Kelly, E.N., Blais, J.m., Pick, f.R., st. Louis, V.L. and schindler, D. W. 2007. Organochlorine compounds in trout from lakes over a 1600 meter elevation gradient in the canadian Rocky mountains. Environ. sci. Technol. 41 (8): 2723–2729
Lafrenière, m.J., Blais, J.m., sharp,m.J., and schindler, D.W. 2006. Organochlorine pesticide and polychlorinated biphenyl concentrations in snow, snowmelt, and runoff at Bow Lake, Alberta. Environ. sci. Technol. 40 (16): 4909–4915.
stockholm convention on Persistent Organic Pollutants. 2004. Available from http://chm.pops.int/ [cited february 2, 2010].
discussion:
The main objective of the fully operational microclimate and canopy station at Rocky Point was to provide continuous atmospheric canopy and soil monitoring data in support of assessing environmental changes in concert with data from the ambient air quality monitoring stations at Royal Roads University and christopher Point. This information was intended to support current long-term studies in atmospheric, ecological, and human health in the southern Vancouver island region. By tracking windborne contaminants, including those generated locally and others that originated from countries across the world, it is possible to both establish the age of various chemicals and match the “fingerprint” to its original source.
challenges were encountered in securing funding for the maintenance and operation of the three monitoring stations. Limited funding was obtained through RRU, Environment canada, the capital Regional District and the Bc ministry of Environment. following further cutbacks in support from Environment canada and the ministry of Environment, all monitoring activities at Royal Roads Boathouse, christopher Point, and Rocky Point microclimate station were discontinued in 2009. The monitoring equipment and supporting infrastructure at Rocky Point, including the storage shed, antennas, communication modems, solar panels, and probes were removed in November and December 2009. They have since been deployed elsewhere. All that remains are the ladders and platforms on three trees and the boardwalk. The straps on the trees and the bands holding the platforms are currently very tight and in need of servicing or removal as soon as possible. conclusions:
Limited temperature data were gathered from the Rocky Point canopy station and the microclimate station in 2006 and 2007. These data were comparable to meteorological data in the region. All the monitoring equipment at Rocky Point has since been removed P087-09. microclimate monitoring canopy station.

Environmental Science Advisory Committee P087-09
48
Environmental Science Advisory Committee
Period Temperature (oc)
chan #1 chan #2 chan #3 chan #4 chan #5 chan #6
Jul-06 Average 19.47 19.17 19.28 19.32 20.14 22.36min 12.73 12.47 12.42 12.61 12.69 12.84max 27.56 28.48 26.93 29.07 36.00 31.23
Aug-06 Average 22.21 21.73 21.74 21.98 22.84 26.47min 11.39 11.34 11.48 11.67 11.48 12.05max 32.54 32.97 29.41 33.18 38.21 32.09
Apr-07 Average 9.37 9.25 8.98 9.21 9.45 9.60min 6.18 6.32 6.44 6.40 6.72 6.30max 13.45 15.06 11.54 11.44 13.04 18.45
may-07 Average 10.69 10.52 10.38 10.51 10.75 11.57min 6.58 6.71 6.40 6.40 6.96 6.40max 24.17 21.48 21.50 24.72 19.74 28.55
Jun-07 Average 12.68 12.31 12.12 12.46 12.44 13.29min 8.44 8.77 8.45 8.17 8.92 8.52max 23.63 21.75 22.84 22.36 18.65 29.27
Jul-07 Average 16.06 15.77 15.62 15.73 15.88 16.71min 11.23 10.32 10.16 10.55 10.78 10.87max 36.50 38.40 33.48 37.18 34.53 37.56
Aug-07 Average 22.16 22.71 22.19 22.11 22.41 23.39min 13.01 13.03 12.96 12.93 13.17 12.95max 31.01 39.87 31.76 32.04 39.49 38.44
sep-07 Average 20.78 21.73 20.90 20.73 21.25 21.35min 15.65 16.25 15.50 15.83 15.89 16.35max 29.50 34.77 30.39 29.51 39.01 32.73
Oct-07 Average 17.00 18.16 17.36 17.00 17.39 17.36min 6.12 6.76 6.56 5.77 6.86 6.03max 23.48 30.93 24.29 23.47 28.66 24.15
Nov-07 Average 7.12 7.50 7.30 6.99 7.65 6.96min 1.93 1.80 2.13 1.69 2.44 1.43max 15.58 16.36 15.99 15.62 17.55 15.64
Dec-07 Average 7.54 7.97 7.81 7.58 7.75 7.54min 0.74 0.89 0.70 0.88 1.37 0.76max 13.88 15.08 14.86 14.15 15.27 14.26
notes: chan #1 - 47.5m above surface north side of tree trunk.chan #2 - 47.5m above surface south side of tree trunk.chan #3 - 47.3m above surface on branch south of tree trunk.chan #4 - 31.0m above surface on north side of tree trunk.chan #5 - 30.8m above surface on south side of tree trunk.chan #6 - 30.5m above surface on branch south of tree
table 1. monthly mean, minimum and maximum Temperatures Recorded at the microclimate station at Rocky Point in 2006 and 2007.

Environmental Science Advisory Committee P090-09
49
Environmental Science Advisory Committee
Project leader(s): Dr. Jessica Hellmann, Jason Dzurisin, Derrick Parkerorganization(s): University of Notre Dameaddress(es): 186 Galvin Hall, Notre Dame, iN 46556telephone no.(s): (574) 631-0296Facsimile: (574) 631-7314Email(s): [email protected], [email protected], [email protected]
PErmit #: P090-09location(S): ROcKY POiNT, cfmETR
Start datE: 1 APRiL 2009comPlEtion datE: 30 JUNE 2009ProjEct StatUS: 2003-2009; cOmPLETE
Studies on the dynamics of Butterflies and their Host Plants in Garry oak Ecosystems
introduction:
To understand the potential for adaptation at the edge of a species’ range to prevent or slow a geographic range shift under climate change, it is necessary to understand if populations near the range boundary respond differently to climatic factors than populations near the range centre and what genes underlie that response. it is also important to determine if climate sets the northern range boundary of a species. in the past seven years, the Hellmann Lab has examined these attributes in two model butterfly species, Erynnis propertius (Duskywing skipper) and Papilio zelicaon (Anise swallowtail). These species have contrasting life history traits, both occupy Garry Oak (Quercus garryana) ecosystems, and they share a northern range boundary with many other oak-related species.
in previous years, Hellmann and her students discovered that both of these butterfly species are affected by climate at their range edge. specifically, their population densities and larval performance are strongly driven by temperature, and peripheral populations on Vancouver island are genetically differentiated relative to populations on the mainland (Zakharov and Hellmann 2008; Hellmann et al. 2008, Pelini et al. 2009). These results suggest that both
species have the potential to be locally adapted to peripheral conditions. Hellmann has pursued studies to examine this potential using translocation and common garden experiments and, more recently, has performed translocation experiments beyond the species’ range boundary to determine if climate is a range-limiting factor (see Hellmann et al. 2008; Prior et al. 2009; Pelini et al. 2009).
in 2009, Hellmann continued research with northern peripheral populations of E. propertius and P. zelicaon at Rocky Point, cfmETR, and other sites in four ways. first, Hellmann and colleagues continued butterfly surveys that have been pursued annually since 2003. This built upon a long-term data set and indicated the abundance of the two focal butterfly species and the composition of butterflies occupying each study site. second, Hellmann and colleagues continued the collection of weather data, adding to the long-term data set that began in 2003. Third, Hellmann and her Ph.D. student, Derrick Parker, performed an experiment with E. propertius that tested the degree to which climatic factors determine the species’ geographic range limit by examining how E. propertius individuals perform at sites within versus outside of their geographic range boundary. This experiment was initiated in 2008 and completed at the end of one full generation in spring,
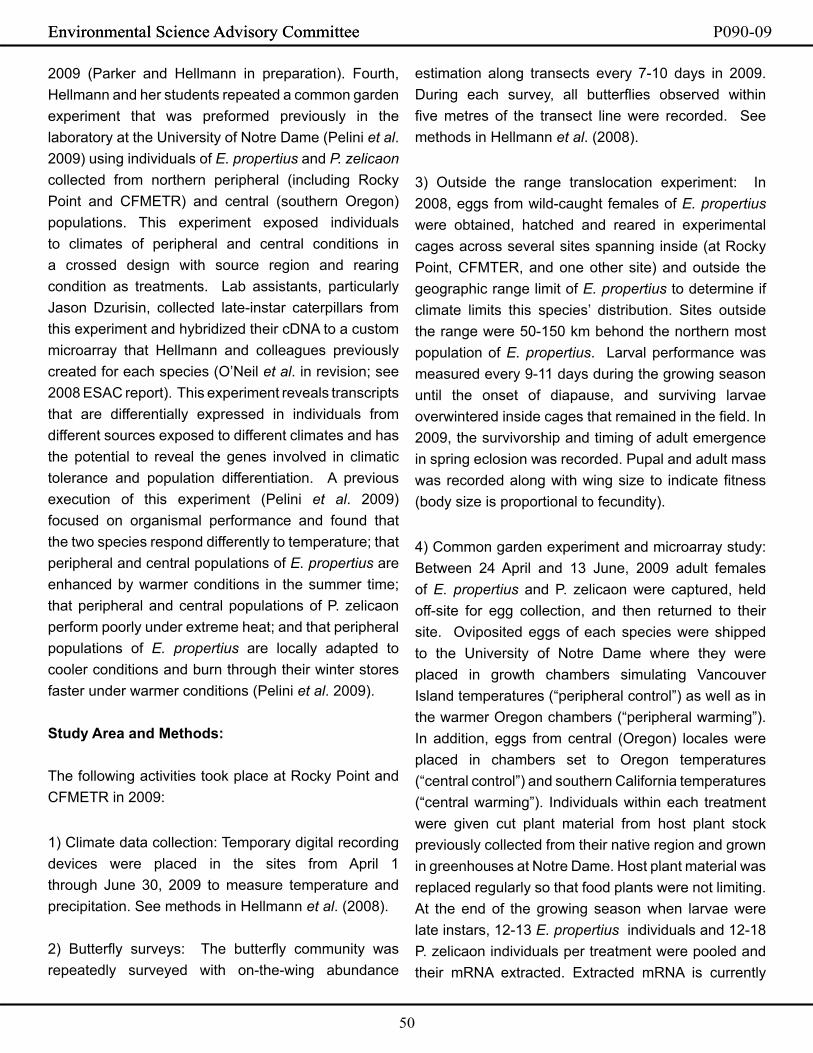
Environmental Science Advisory Committee P090-09
50
Environmental Science Advisory Committee
estimation along transects every 7-10 days in 2009. During each survey, all butterflies observed within five metres of the transect line were recorded. see methods in Hellmann et al. (2008).
3) Outside the range translocation experiment: in 2008, eggs from wild-caught females of E. propertius were obtained, hatched and reared in experimental cages across several sites spanning inside (at Rocky Point, cfmTER, and one other site) and outside the geographic range limit of E. propertius to determine if climate limits this species’ distribution. sites outside the range were 50-150 km behond the northern most population of E. propertius. Larval performance was measured every 9-11 days during the growing season until the onset of diapause, and surviving larvae overwintered inside cages that remained in the field. in 2009, the survivorship and timing of adult emergence in spring eclosion was recorded. Pupal and adult mass was recorded along with wing size to indicate fitness (body size is proportional to fecundity).
4) common garden experiment and microarray study: Between 24 April and 13 June, 2009 adult females of E. propertius and P. zelicaon were captured, held off-site for egg collection, and then returned to their site. Oviposited eggs of each species were shipped to the University of Notre Dame where they were placed in growth chambers simulating Vancouver island temperatures (“peripheral control”) as well as in the warmer Oregon chambers (“peripheral warming”). in addition, eggs from central (Oregon) locales were placed in chambers set to Oregon temperatures (“central control”) and southern california temperatures (“central warming”). individuals within each treatment were given cut plant material from host plant stock previously collected from their native region and grown in greenhouses at Notre Dame. Host plant material was replaced regularly so that food plants were not limiting. At the end of the growing season when larvae were late instars, 12-13 E. propertius individuals and 12-18 P. zelicaon individuals per treatment were pooled and their mRNA extracted. Extracted mRNA is currently
2009 (Parker and Hellmann in preparation). fourth, Hellmann and her students repeated a common garden experiment that was preformed previously in the laboratory at the University of Notre Dame (Pelini et al. 2009) using individuals of E. propertius and P. zelicaon collected from northern peripheral (including Rocky Point and cfmETR) and central (southern Oregon) populations. This experiment exposed individuals to climates of peripheral and central conditions in a crossed design with source region and rearing condition as treatments. Lab assistants, particularly Jason Dzurisin, collected late-instar caterpillars from this experiment and hybridized their cDNA to a custom microarray that Hellmann and colleagues previously created for each species (O’Neil et al. in revision; see 2008 EsAc report). This experiment reveals transcripts that are differentially expressed in individuals from different sources exposed to different climates and has the potential to reveal the genes involved in climatic tolerance and population differentiation. A previous execution of this experiment (Pelini et al. 2009) focused on organismal performance and found that the two species respond differently to temperature; that peripheral and central populations of E. propertius are enhanced by warmer conditions in the summer time; that peripheral and central populations of P. zelicaon perform poorly under extreme heat; and that peripheral populations of E. propertius are locally adapted to cooler conditions and burn through their winter stores faster under warmer conditions (Pelini et al. 2009).
Study area and methods:
The following activities took place at Rocky Point and cfmETR in 2009:
1) climate data collection: Temporary digital recording devices were placed in the sites from April 1 through June 30, 2009 to measure temperature and precipitation. see methods in Hellmann et al. (2008).
2) Butterfly surveys: The butterfly community was repeatedly surveyed with on-the-wing abundance
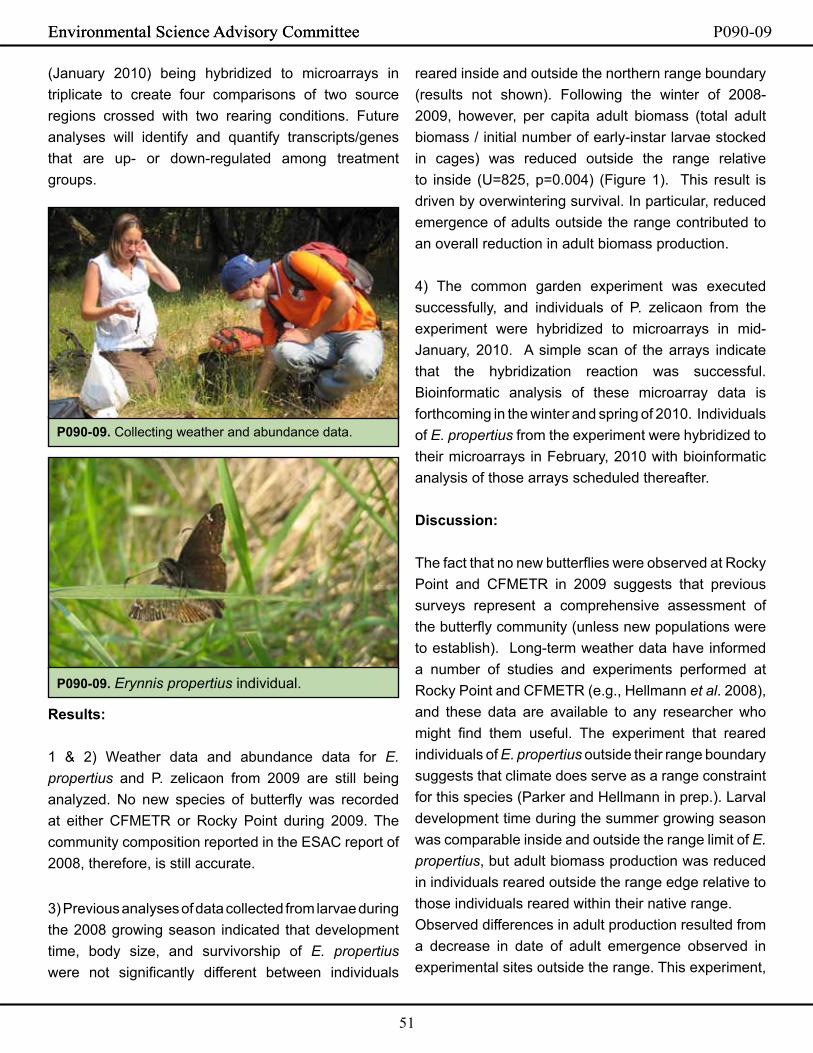
Environmental Science Advisory Committee P090-09
51
Environmental Science Advisory Committee
(January 2010) being hybridized to microarrays in triplicate to create four comparisons of two source regions crossed with two rearing conditions. future analyses will identify and quantify transcripts/genes that are up- or down-regulated among treatment groups.
results:
1 & 2) Weather data and abundance data for E. propertius and P. zelicaon from 2009 are still being analyzed. No new species of butterfly was recorded at either cfmETR or Rocky Point during 2009. The community composition reported in the EsAc report of 2008, therefore, is still accurate.
3) Previous analyses of data collected from larvae during the 2008 growing season indicated that development time, body size, and survivorship of E. propertius were not significantly different between individuals
reared inside and outside the northern range boundary (results not shown). following the winter of 2008-2009, however, per capita adult biomass (total adult biomass / initial number of early-instar larvae stocked in cages) was reduced outside the range relative to inside (U=825, p=0.004) (figure 1). This result is driven by overwintering survival. in particular, reduced emergence of adults outside the range contributed to an overall reduction in adult biomass production.
4) The common garden experiment was executed successfully, and individuals of P. zelicaon from the experiment were hybridized to microarrays in mid-January, 2010. A simple scan of the arrays indicate that the hybridization reaction was successful. Bioinformatic analysis of these microarray data is forthcoming in the winter and spring of 2010. individuals of E. propertius from the experiment were hybridized to their microarrays in february, 2010 with bioinformatic analysis of those arrays scheduled thereafter.
discussion:
The fact that no new butterflies were observed at Rocky Point and cfmETR in 2009 suggests that previous surveys represent a comprehensive assessment of the butterfly community (unless new populations were to establish). Long-term weather data have informed a number of studies and experiments performed at Rocky Point and cfmETR (e.g., Hellmann et al. 2008), and these data are available to any researcher who might find them useful. The experiment that reared individuals of E. propertius outside their range boundary suggests that climate does serve as a range constraint for this species (Parker and Hellmann in prep.). Larval development time during the summer growing season was comparable inside and outside the range limit of E. propertius, but adult biomass production was reduced in individuals reared outside the range edge relative to those individuals reared within their native range. Observed differences in adult production resulted from a decrease in date of adult emergence observed in experimental sites outside the range. This experiment,
P090-09. collecting weather and abundance data.
P090-09. Erynnis propertius individual.

Environmental Science Advisory Committee P090-09
52
Environmental Science Advisory Committee
together with previous results, suggests that the effects of climate on butterfly performance are differentially experienced across life stages with overwintering being an important period of susceptibility to climatic factors (Parker and Hellmann in prep.; Pelini et al. 2009; Williams et al. 2010).
conclusions:
The primary conclusion emerging from 2009 is that the poleward distribution of E. propertius is limited by both host plant availability and climate during the winter months. The former is indicated by the co-occurrence of the insect and its host plant on Vancouver island, and the later is indicated by a translocation experiment described above. conclusions from common garden experiments and associated microarray studies will be forthcoming in 2010. Papers will be submitted that describe: 1) the translocation experiment of E. propertius outside its range boundary (Parker and Hellmann in prep.); and 2) the climate tolerance (common garden) experiment and microarray analyses.
Hellmann does not anticipate major activities at cfmETR or Rocky Point during the field season of 2010 because grant funding that has enabled her recent research on Vancouver island expires in early 2010. However, she will continue to monitor Rocky Point and cfmETR, particularly with weather monitoring equipment, and will continue collaborations with Dr. Brent sinclair regarding his monitoring of climatic conditions in Garry oak meadows (see sinclair permit and report). Hellmann is currently seeking funding to enable experimental and observational research for the field season of 2011.
acknowledgements:
We thank A. Burnier, W. chick, J. Dzurisin, A. Gonzalez-Karlsson, s. O’Neil, D. Parker, and c. Williams for their assistance in the greenhouse and/or field. We thank the canadian Department of National Defence and other landowners for access to their property. s.
Emrich and N. Lobo provided advice on the project.
references:
Hellmann, J. J., s. L. Pelini, K. m. Prior, and J. D. K. Dzurisin. 2008. The response of two butterfly species to climatic variation at the edge of their range and the implications for poleward range shifts. Oecologia 157: 583-592.
O’Neil, s. T., J. D. K. Dzurisin, R. carmichael, N. R. Lobo, s. J. Emrich, and J. J. Hellmann. in revision. Population-level transcriptome sequencing of the non-model organisms, Erynnis propertius and Papilio zelicaon. Bmc Genomics.
Parker, D. and J. J. Hellmann. in prep. climate and host plants limit poleward range expansion of a specialist butterfly.
Pelini, s. L., J. D. K. Dzurisin, K. m. Prior, c. m. Williams, T. D. marsico, B. J. sinclair, and J. J. Hellmann. 2009. Translocation experiments with butterflies reveal limits to enhancement of poleward populations under climate change. Proceedings of the National Academy of sciences 106: 11160-11165.
Prior, K. m., J. D. K. Dzurisin, s. L. Pelini, and J. J. Hellmann. 2009. Biology of larvae and adults of Erynnis propertius at the northern edge of its range. The canadian Entomologist 141: 161-171.
Williams, c. m., s. L. Pelini, J. J. Hellmann, and B. J. sinclair. 2010. intra-individual variation allows an explicit test of the hygric hypothesis for discontinuous gas exchange in insects. Biology Letters. Online early, doi: 10.1098/rsbl.2009.0803.
Zakharov, E. V., and J. J. Hellmann. 2008. Genetic differentiation across a latitudinal gradient in two co-occurring butterfly species. molecular Ecology 71: 298-305

Environmental Science Advisory Committee P090-09
53
< Figure 1. Per capita adult biomass production per
enclosure in sites inside and outside of the northern
range boundary of E. propertius (bars are se). (a)
total adult biomass per enclosure, divided by the total
number of adult survivors (i.e., biomass of survivors
is equal between regions; f1,30=0.36, p=0.5) (b)
total adult biomass per enclosure, divided by the
total number of stocked, early-instar larvae (i.e.,
production of adult biomass differs between regions;
U=825, p=0.004). in both (a) and (b), there also are
site-level differences (stats not shown, p<0.05).
a)
b)
P090-09. Erynnis propertius mating pair. P090-09. Garry Oak potted seedling.

Environmental Science Advisory Committee P095-09
54
Environmental Science Advisory Committee
Project leader(s): Ann Nightingaleorganization(s): Victoria Natural History societyaddress(es): 1721 cultra Ave, saanichton, Bc, V8m 1T1telephone no.(s): (250) 514-6450Email(s): [email protected]
PErmit #: P095-09location(S): ROcKY POiNT, HEALs RANGE, ALBERT HEAD
Start datE: 19 DEcEmBER 2009comPlEtion datE: 27 DEcEmBER 2009ProjEct StatUS: 2003-ONGOiNG
christmas Bird count
introduction:
since 1900, the christmas Bird count (cBc) has been an annual event attracting thousands of birders across North America to census winter bird populations within a local 24 km circle. Long-term trends are analyzed and compiled now for more than 1800 counts across canada by Bird studies canada. However, significant habitats found on Department of National Defence (DND) properties were historically off-limits to Victoria and sooke cBc’s compilers, with sporadic coverage beginning in the late 1980’s and 1990’s. in recent years, EsAc and DND have provided access for members of the Victoria Natural History society into three key DND sites for the Victoria and sooke cBcs: Rocky Point, Heals Rifle Range and Albert Head. Study area and methods:
much of North America has been divided into cBc count circles circles which define the count area. The 24 km diameter circles are divided into discrete zones; each zone is assigned to a team of volunteers to avoid duplicate counting. survey teams cover as much of their assigned zones as possible, recording species and numbers of individuals they encounter.
During the Victoria (BcVi – British columbia Victoria) cBc which took place on 19 December 2009, participants completed surveys at two DND sites. coverage by counting parties consisted of three hours at Albert Head, and one and a half hours at Heals Range. Rocky Point, including Race Rocks, is part of the sooke (BcsO – British columbia sOoke) cBc, which occurred on 27 December 2009. Rocky Point received the greatest coverage of the three DND sites, with 8.5 hours of effort. Participants recorded all individual birds observed and/or identified by voice.
results:
The cBc participants observed 48 species and 714 individuals at Albert Head. At Heals Range, observers tallied 17 species and 420 individuals. The team at Rocky Point, (which includes the Race Rocks Ecological Reserve) reported 59 species and 3257 individuals. for detailed results, see Table 1.
discussion:
in the past, the Albert Head site has proven to have a high number of species (species richness) with as

Environmental Science Advisory Committee P095-09
55
Environmental Science Advisory Committee
many as 90 bird species using the area in winter (for shelter and/or for feeding. Both terrestrial and marine-associated species are well represented in Albert Head counts. in 2009, the numbers of marine-associated birds (gulls, cormorants and alcids) were well below average. Uncommon birds of interest included: Western Grebe (Aechmophorus occidentalis), Ancient murrelet (Synthliboramphus antiquus) and Trumpeter swan (Cygnus buccinator).
The Heals Range sub-area has never produced a high number of species or individuals on the cBc, due in part to the low habitat diversity. in 2009, 17 species were detected compared to the average of 20, but the number of individual birds (420) was above the average of 306.
The Rocky Point count area has averaged 5111 individuals and 58 species over six christmas Bird counts. This year’s results were average for species richness, but well below average for individuals, largely due to lower numbers of marine-associated species.
conclusions:
The 2009 Victoria and sooke cBc results from DND sites produced 4391 individuals of 74 species in total, well below the five-year average of 11,900 birds. The reduced total numbers of individuals and species was almost entirely attributed to the near absences of marine species. in some years, lack of food at higher elevations forces thrushes and jays into the region, boosting the cBc numbers, but that was not the situation in 2009.
Weather conditions, food supply and other volunteer effort can affect the results of a single-day survey such as the christmas Bird count. The primary value of continued survey efforts is in the contribution of these data to the larger international database managed by the Audubon society.
The DND sites are subject to less human disruption
than most of the other areas covered during the cBcs and they add to the variety of habitats monitored. it is worth continuing coverage to produce long-term trends for wintering birds on southern Vancouver island. references:
American Ornithological Union. 2010. check-List of North American Birds, http://www.aou.org/checklist/north/full.php, accessed 4 August 2010
P095-09. fox sparrow.
P095-09. steller’s Jay.

Environmental Science Advisory Committee P095-09
56
Environmental Science Advisory Committee
table 1. christmas Bird count ResultsNote: common Names are approved by the American Ornithological Union and are presented in taxonomic order (American Ornithological Union 2010)species Albert Head Heals Range Rocky Pointcanada Goose 156Trumpeter swan 4 9American Wigeon 85mallard 147 7Ring-necked Duck 2 1Harlequin Duck 1 8surf scoter 47Long-tailed Duck 3 1Bufflehead 5 160common Goldeneye 18Hooded merganser 2common merganser 6Red-breasted merganser 28california quail 6Pacific Loon 4 1common Loon 6Horned Grebe 2Red-necked Grebe 2 2Western Grebe 30 1Brandt's cormorant 38 875Double-crested cormorant 32 170Pelagic cormorant 2 155Great blue Heron 1Turkey Vulture 1Bald Eagle (adult) 1 1 5 (immature) 5sharp-shinned Hawk 2cooper's Hawk 1 2Red-tailed Hawk 1 2 2Peregrine falcon 1Black Oystercatcher 57spotted sandpiper 1Black Turnstone 4surfbird 17mew Gull 100 35

Environmental Science Advisory Committee P095-09
57
Environmental Science Advisory Committee
table 1 continued. christmas Bird count ResultsNote: common Names are approved by the American Ornithological Union and are presented in taxonomic order (American Ornithological Union 2010)species Albert Head Heals Range Rocky PointThayer's Gull 550Glaucous-winged Gull 90 23 405common murre 45 115Pigeon Guillemot. 17 8marbled murrelet 2 4Ancient murrelet 2Great Horned Owl 2Anna's Hummingbird 2Belted Kingfisher 1Downy Woodpecker 2Hairy Woodpecker 1 1 2Northern flicker 11 4 17steller's Jay 7Northwestern crow 2common Raven 2 6 9chestnut-backed chickadee 13 33Bushtit 2Red-breasted Nuthatch 5 19Brown creeper 2Bewick's Wren 8 1Pacific (formerly Winter) Wren 20 1 17Golden-crowned Kinglet 11 47Ruby-crowned Kinglet 1 6Hermit Thrush 16 3American Robin 53 38 35Varied Thrush 4European starling 2spotted Towhee 28 2 12savannah sparrow 2fox sparrow 14 2song sparrow 7 3 15Golden-crowned sparrow 5 1Dark-eyed Junco 78 19 55Red-winged Blackbird 4 85

Environmental Science Advisory Committee P095-09
58
Environmental Science Advisory Committee
table 1 continued. christmas Bird count ResultsNote: common Names are approved by the American Ornithological Union and are presented in taxonomic order (American Ornithological Union 2010)species Albert Head Heals Range Rocky PointPurple finch 1House finch 5 3Red crossbill 26 51Pine siskin 6 45# individuals 714 420 3257# species 48 17 59survey Date 19 December 2009 19 December 2009 27 December 2009
Effort # of observers: 4# hours on foot: 3Distance on foot: 2.5 km# hours by car: .33Distance by car: 2 km
# of observers: 2# hours on foot: 1.5Distance on foot: 2 km
# of observers: 3# hours on foot: 7Distance on foot: 5 km# hours by car: 1Distance by car: 11 km# hours by boat: 0.5Distance by boat: 6 km# hours owling: 1Distance owling: 5 km
P095-09. Varied Thrush. P0-09. Golden-crowned Kinglet.

Environmental Science Advisory Committee P104-09
59
Environmental Science Advisory Committee
Project leader(s): Darcy mathewsorganization(s): University of Victoriaaddress(es): Department of Anthropology, University of Victoria, P.O. Box 3050, sTN csc, Victoria, B.c., canada, V8W 3P5telephone no.(s): (250) 590-9297Facsimile: (250) 721-6215Email(s): [email protected]
PErmit #: P104-09location(S): ROcKY POiNT, ALBERT HEAD, cOLWOOD
Start datE: 1 JANUARY 2009comPlEtion datE: DEcEmBER 2009ProjEct StatUS: 2004-ONGOiNG
the Strait of Georgia mortuary landscape Project
introduction:
southern Vancouver island has been home to the straits salish people for millennia. The material remains of their ancient homes and villages are still visible today across the landscape of greater Victoria, including the Department of National Defence (DND) properties. At the Rocky Point Training Area, this record of precontact straits salish history is preserved in the shell midden village sites that ring the coastline, and in a myriad of other well-preserved types of archaeological sites (mathews 2004). The most numerous and visible of these ancient sites are the cemeteries of the straits salish people. Between about 1500-400 years ago, the residents of what is now Rocky Point built a distinctive form of interment for their dead. called burial cairns and mounds, these funerary features consist of an arrangement of rocks and soil carefully placed over the deceased. cairns are constructed primarily from stone, with only a minor or moderate amount of soil packed between the stones (figure 1). Burial mounds are essentially burial cairns covered with a thick layer of soil (figure 2). There is remarkable variation in the shape and size of these monuments, ranging from a small concentration of fewer than a dozen stones,
to massive features with many tonnes of rocks, and measure more than ten metres in diameter. individual rocks people moved weighed as much as three tonnes. some features are circular, some square or rectangular. But within this variability are also some discernable patterns in how these features were built. Burial cairn and mound sites may have as few as one or as many as 300 or more features (mathews 2006b). sadly, there are very few intact burial cairn and mound sites left in British columbia, although they at one time were ubiquitous across the landscape. in Victoria, for example, they would have numbered in the many of thousands, based upon the observations of early European settlers. During the late nineteenth century, burial cairns in the Victoria area attracted international attention from early researchers (smith and fowke 1901) but have received virtually no archaeological attention during most of the twentieth century. most cairns and mounds have been destroyed by looters and even more so by residential and commercial development. The DND properties, particularly Rocky Point, mary Hill, and Albert Head, have the best remaining record of these ancient cairn and mound cemeteries on southern Vancouver island, largely due to the early awareness of these features by the men

Environmental Science Advisory Committee P104-09
60
The objective of this project is twofold. firstly, collection of data on the physical form and spatial location of individual burial cairns is being undertaken. Patterns in cairn size, construction, and orientation, in addition to spatial analytical variables, may be reflective of underlying local social structures, such as group identity and status. secondly, intrasite landscape spatial data are being collected. The geographic layout of cairn sites in relation to each other and to the natural and cultural elements of the local landscape are informative regarding larger scale regional concepts of space and group identity. Study area and methods:
in total, data were collected from seven localities, six of which were within the Rocky Point property. The two largest of these localities were the Rocky Point site (DbRv-3) at Eyde Point (figure 3) and the Yates site (figure 4), which straddles the northernmost edge of Area c at Rocky Point and an adjacent private property. Other data collection localities at Rocky Point included small cemeteries at manor Point, cape calver, the north shore of Eemdyk Passage, and Bentinck island (figure 3). A seventh data collection area outside of DND purview was on Race Rocks, in close geographic proximity to Rocky Point.
in order for the intrasite spatial analysis of burial cairn sites to be successful, it was necessary to first inventory the Rocky Point landscape with systematic pedestrian survey. A crew of three to five experienced archaeologists walked systematic transects with a two-metre interval between surveyors, recording the location of each archaeological feature with a Trimble 2005 GeoXT GPs. With differential correction, these data were accurate to one to two metres. The spatial data were imported into a Geographic information system (Gis). Relevant landscape features, such as bedrock outcrops and hydrological features, were also recorded.
for the analysis of individual cairns, a total of 18
and women who staffed and used these properties, and more recently by the initiatives of the DND (such as the EsAc program) to identify and manage these unique and irreplaceable heritage sites.
Burial cairn research in British columbia is a remarkable but largely unexplored avenue for exploration into the social aspects of ancient straits salish life. The Rocky Point property offers an unprecedented opportunity to study burial cairns and mounds on a large scale, as it has some of the best remaining cairns and mounds cemeteries in the province. This was first realized between 2004-2006, when the largest burial cairn site in the province, DbRv-3 (the Rocky Point site) was recorded under EsAc Permits P104-04 to 06 (figure 3). Working in consultation with the scia’new first Nation, over 300 cairns and mounds were identified, mapped, and recorded at the Rocky Point site in great detail. Under EsAc permits P104-07 to 09, work has continued at the Rocky Point site; research has also expanded to include cairn and mound cemeteries elsewhere on the Rocky Point property, as well as on provincial and private land adjacent to the DND property.
i hypothesize that the manner in which cairns and mounds were built, and where on the landscape they were placed, may be important signifiers of the social identity of the person buried within. Historic and contemporary Eurocanadian grave markers say important things about the social affiliations of the dead and cemeteries are also divided into sections based on attributes of the dead person’s place in society. similarly, burial cairns at the Rocky Point cemetery can be reasonably viewed as memorials, built to express the identity of the deceased. Although burial cairns do not have written biographical text like Western headstones, the manner in which mortuary space is used – the style, material choice, size, and placement of cairns – has great interpretive potential to identify socially meaningful patterns in how precontact straits salish peoples articulated and negotiated their social, economic, and spiritual relationships.

Environmental Science Advisory Committee P104-09
61
has identified six distinct types of mortuary features. concurrently, a spatial analysis defined seven distinct areas within the site. Analysis of the distribution of the six types of cairns throughout the seven different areas identified distinct patterns. This patterning indicated that the distribution of burial cairns at Rocky Point may reflect the burial localities of separate households. The Rocky Point site is contrasted with the newly recorded Yates site. Both cemeteries are situated close to the villages in which the living resided. While the Rocky Point site had over 300 relatively small features in a 3-hectare area, the Yates site had over 100 features in the same area, but the mean feature size is significantly larger. There were also several previously unknown types of burial features at the Yates site that had not been observed at the Rocky Point site, or elsewhere. This may represent two contemporaneous, adjacent communities, each with many similarities in funerary ritual, but also exerting differences in the types of constructed features, and perhaps different classes or categories of people being buried in each cemetery. discussion:
The 2009 field season was the longest, most spatially extensive field season to date for the strait of Georgia mortuary Landscape Project. The aim of the research will continue to focus on gathering detailed information on individual cairn morphology from Rocky Point and using this information to spatially and statistically test associations between individual cairns and the spatial associations between cairn sites and the natural landscapes of DND properties, as well as at other non-DND properties throughout the strait of Georgia and Puget sound. conclusions:
i hypothesize that the use of mortuary space at multiple scales of interaction, from the village level to the region, is a snapshot in time of ancient straits salish social relationships—presenting an unparalleled opportunity for archaeologists to investigate in unusually good
analytical variables were collected, in addition to the production of photographs, and detailed diagrams of significant cairns. The metric attributes of each feature, information on the specific type, amount, shape, and size of the constituent rock, and the structure of each cairn were recorded on a standardized form. some cairns required at least partial clearing of accumulated vegetal matter, particularly from invasive species such as scotch broom and gorse. cairns were otherwise not affected by the research. This clearing substantially enhanced the amount of visible data and, therefore, the interpretative potential of the site. Previously cleaned cairns were observed to be re-vegetated within a year.
Gis was instrumental as a means of data quantification and management, ensuring a high level of accuracy in mapping and analysis, and a method by which to group data. By using Gis as a management tool, mortuary features were quantified, reorganized, and reassigned into analytical units based on quantifiable spatial and morphological attributes.
results:
While research is ongoing, patterns are emerging in the dataset to date. Prior to this research, there had not been a comprehensive and encompassing examination of the spatial distribution of burial cairns in the strait of Georgia, despite the fact that the cairns were one of the earliest types of archaeological sites studied in the region (mathews 2006a). Additionally, there had not been a comprehensive inventory of burial cairns in the Victoria region. from a culture history perspective, this research generated a systematic and detailed survey of significant parts of metchosin; the largest single systematic archaeological survey conducted in the Victoria area. in addition, over 600 cairns were inventoried, mapped, and entered into a Gis spatial database. This type of non-invasive detailed analysis of the individual burial cairns at Rocky Point is the first of its kind in the province, and possibly in North America.
At DbRv-3, the Rocky Point site, analysis to date

Environmental Science Advisory Committee P104-09
62
Archives, and the Royal British columbia museum for access to future researchers and resource managers.
references:
mathews, D. 2004 Rocky Point, An Archaeological inventory. Report on file at the Archaeology and Registry services Branch, Victoria.
—. 2006a. Ancient cities of the dead revisted: early burial cairn investigations in Victoria. The midden 38:14-20.
—. 2006b. Burial cairn taxonomy and the mortuary landscape of Rocky Point, British columbia. m.A. Thesis, University of Victoria, Department of Anthropology, Victoria, B.c.
smith, H. i., and fowke, G. 1901. cairns of British columbia and Washington. Jesup North Pacific Expedition, memoirs, 3 (2) pp. 55-75. New York: American museum of Natural History.
detail a pivotal time in this precontact society. Burial cairns and the funerals in which they were built were an institution of ceremonial exchanges, a network that linked people from separate villages within the wider regional community. Together with marriage and the cultivation of other strategic social, economic, and political ties, i argue that burial cairns may have simultaneously provided a forum in which identity and inequality at the local kin or village-based level could be created, contested, and renegotiated. Being one of the largest and best-preserved burial cairn landscapes in British columbia, the ongoing research at Rocky Point will form the theoretical and methodological stepping off point from which a regional analysis can be approached. The regional analysis will focus on sites throughout the strait of Georgia and Puget sound.
The results of the doctoral dissertation stemming from this research, which i anticipate defending in 2011, will be the basis for a book and multiple articles on the burial cairns and mounds of the strait of Georgia. The resulting data will be curated with the Environmental
science Advisory committee, The University of Victoria Figure 1. Example of a burial cairn, from the Yates site (1 m scale bar).

Environmental Science Advisory Committee P104-09
63
Figure 2. Example of a burial mound, from the Yates site (1 m scale bar).
Figure 3. Burial cairn and mound sites, Area B, Rocky Point.
Figure 4. The Yates site, Area c, Rocky Point.

Environmental Science Advisory Committee P108-09
64
Environmental Science Advisory Committee
Project leader(s): Trudy chatwinorganization(s): B.c. ministry of Environmentaddress(es): 2080 Labieux Road, Nanaimo, B.c. V9R 6R1telephone no.(s): (250) 751-3150Facsimile: (250) 751-3208Email(s): [email protected]
PErmit #: P108-09location(S): ROcKY POiNT AND cfmETR
Start datE: 1 mARcH 2009comPlEtion datE: 31 DEcEmBER 2009 ProjEct StatUS: 2005-ONGOiNG
Western Bluebird nestbox Program
introduction:
The Georgia Basin population of Western Bluebirds (Sialia mexicana) bred regularly on southern Vancouver island until the 1980’s. However, this population has suffered serious population declines in this area since the 1950’s and has since been considered to be extirpated. it is now Red-listed in British columbia and is included in the Garry Oak and Associated Ecosystems Recovery strategy. Population declines are thought to have been caused by a series of wet springs, pesticide application and the resulting lack of insects for feeding, and perhaps also competition for nesting cavities by introduced species such as the European starling (Sturnus vulgaris) and the house sparrow (Passer domesticus).
The Western Bluebird Nestbox Project is part of the larger ‘Bring Back the Bluebirds’ (BBTB) program of the Garry Oak Ecosystems Recovery Team, Vertebrates at Risk Recovery implementation Group; the goal of which is to establish a viable canadian population of Western Bluebirds. This project was established in 2005 to increase the amount of suitable nesting sites for the Western Bluebirds should they return. suitable sites consist of open habitat with some perches to be used for hunting insects, including Garry oak meadows
as well as open farms and grasslands. Nestboxes have been monitored sporadically since their establishment for signs of nesting by Western Bluebirds, and additional boxes have been installed in most years. No evidence of nesting by Western Bluebirds has been observed, though a number of individuals have been sighted in the area in recent years.
Population declines in neighbouring Washington state have prompted a similar nestbox program at fort Lewis. This program has been successful. The Bluebird population at this site is now recovering from only a couple of pairs, when the program began, to over 200 pairs. A Western Bluebird reintroduction program was also implemented in 2007, on nearby san Juan island, using the fort Lewis population as a source for breeding pairs. This reintroduction program has resulted in pairs successfully nesting, some even producing second broods, and at least one pair of young returning to nest the following year. These are the first Western Bluebirds known to have hatched on san Juan island since 1965, which would be the nearest population to the species’ historic canadian range if it becomes established. As part of the BBTB program, there are plans to reintroduce Western Bluebirds from the fort Lewis population to a canadian site in 2012. maintaining a network of suitable nestboxes will
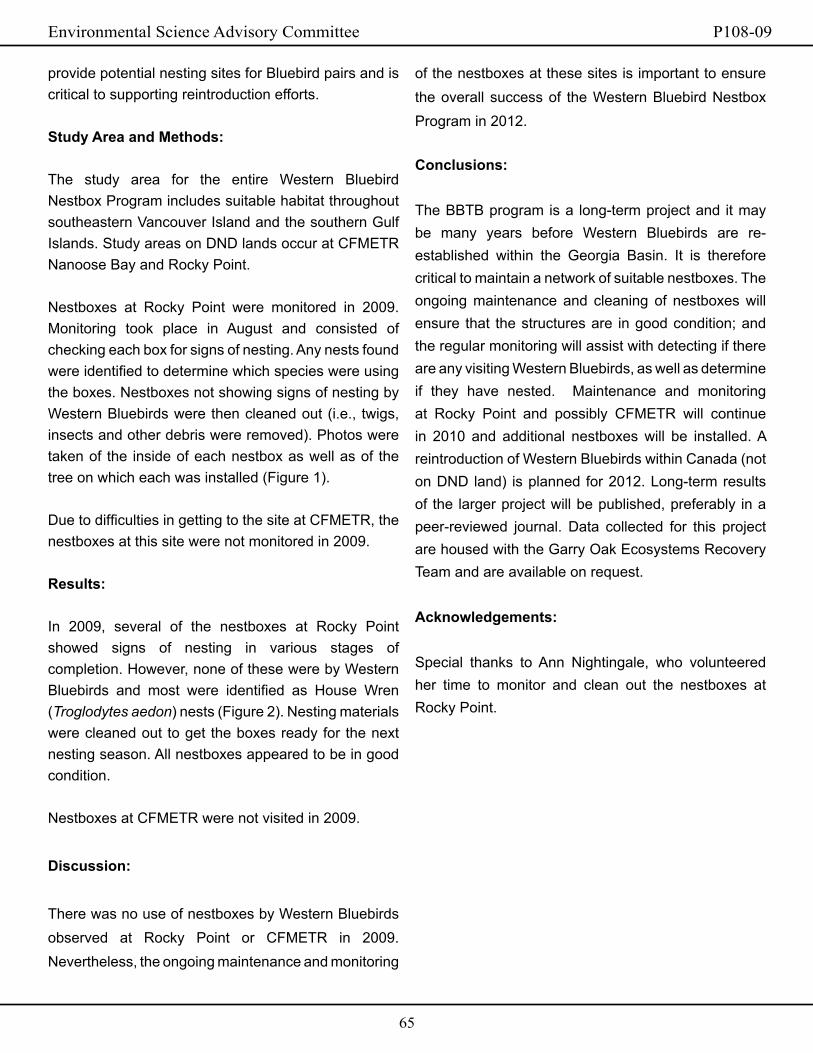
Environmental Science Advisory Committee P108-09
65
of the nestboxes at these sites is important to ensure the overall success of the Western Bluebird Nestbox Program in 2012.
conclusions:
The BBTB program is a long-term project and it may be many years before Western Bluebirds are re-established within the Georgia Basin. it is therefore critical to maintain a network of suitable nestboxes. The ongoing maintenance and cleaning of nestboxes will ensure that the structures are in good condition; and the regular monitoring will assist with detecting if there are any visiting Western Bluebirds, as well as determine if they have nested. maintenance and monitoring at Rocky Point and possibly cfmETR will continue in 2010 and additional nestboxes will be installed. A reintroduction of Western Bluebirds within canada (not on DND land) is planned for 2012. Long-term results of the larger project will be published, preferably in a peer-reviewed journal. Data collected for this project are housed with the Garry Oak Ecosystems Recovery Team and are available on request.
acknowledgements:
special thanks to Ann Nightingale, who volunteered her time to monitor and clean out the nestboxes at Rocky Point.
provide potential nesting sites for Bluebird pairs and is critical to supporting reintroduction efforts.
Study area and methods:
The study area for the entire Western Bluebird Nestbox Program includes suitable habitat throughout southeastern Vancouver island and the southern Gulf islands. study areas on DND lands occur at cfmETR Nanoose Bay and Rocky Point.
Nestboxes at Rocky Point were monitored in 2009. monitoring took place in August and consisted of checking each box for signs of nesting. Any nests found were identified to determine which species were using the boxes. Nestboxes not showing signs of nesting by Western Bluebirds were then cleaned out (i.e., twigs, insects and other debris were removed). Photos were taken of the inside of each nestbox as well as of the tree on which each was installed (figure 1).
Due to difficulties in getting to the site at cfmETR, the nestboxes at this site were not monitored in 2009.
results:
in 2009, several of the nestboxes at Rocky Point showed signs of nesting in various stages of completion. However, none of these were by Western Bluebirds and most were identified as House Wren (Troglodytes aedon) nests (figure 2). Nesting materials were cleaned out to get the boxes ready for the next nesting season. All nestboxes appeared to be in good condition.
Nestboxes at cfmETR were not visited in 2009.
discussion:
There was no use of nestboxes by Western Bluebirds observed at Rocky Point or cfmETR in 2009. Nevertheless, the ongoing maintenance and monitoring
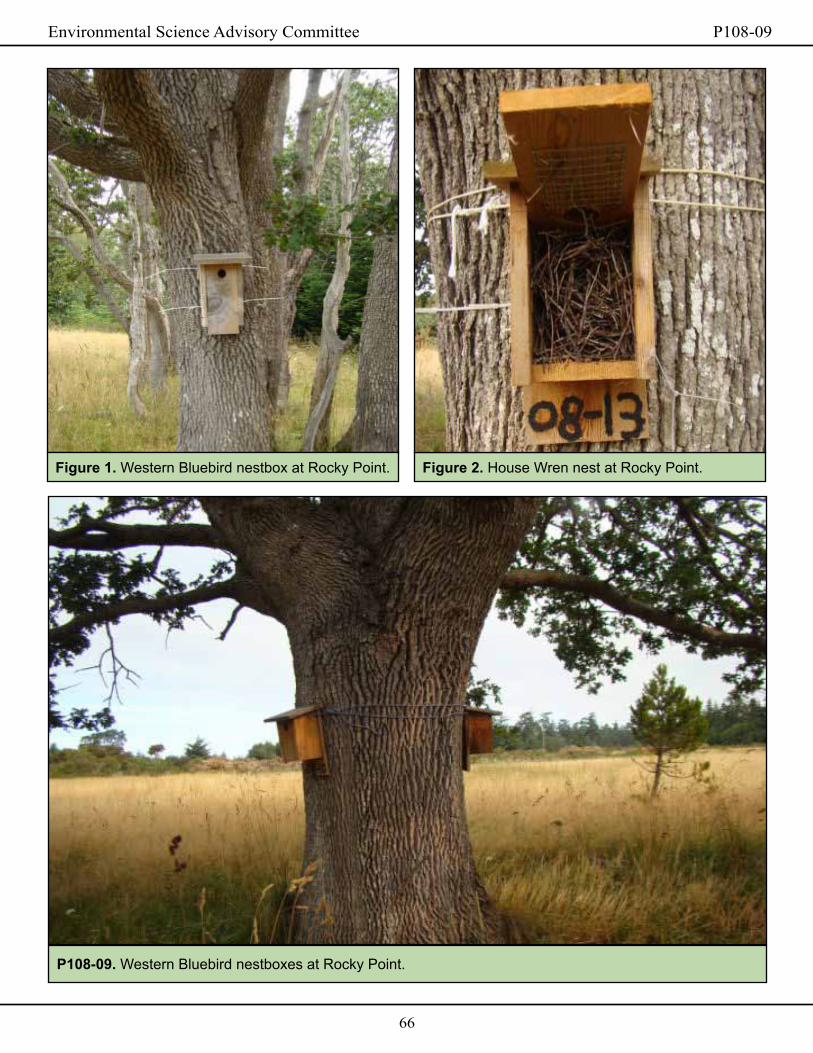
Environmental Science Advisory Committee P108-09
66
P108-09. Western Bluebird nestboxes at Rocky Point.
Figure 2. House Wren nest at Rocky Point. Figure 1. Western Bluebird nestbox at Rocky Point.

Environmental Science Advisory Committee P109-09
67
Environmental Science Advisory Committee
Project leader(s): René mcKibbin organization(s): Environment canadaaddress(es): 5421 Robertson Rd., Delta, B.c., V4K 3N2telephone no.(s): (604) 940-4726Facsimile: (604) 946-7022Email(s): [email protected] and [email protected]
PErmit #: P109-09location(S): mD ALDERGROVE
Start datE: 1 mARcH 2009comPlEtion datE: 31 OcTOBER 2009 ProjEct StatUS: 1999-ONGOiNG
monitoring of the oregon Spotted Frog (Rana pretiosa)
introduction:
The Oregon spotted frog (Rana pretiosa), is a Pacific Northwest species (corkran and Thoms 1996) and it occurs at three sites in the south-west corner of Bc including: maintenance Detachment (mD) Aldergrove, mountain slough Agassiz, and maria slough seabird island (Haycock 2000a).
The Oregon spotted frog was designated “Endangered” in November 1999 by the committee on the status of Endangered Wildlife in canada (cOsEWic) (Haycock 2000b) because it had been reduced to three sites in canada (mentioned above), each containing very low numbers. As well, the species has been adversely affected by habitat loss due to urban expansion, agriculture, exotic vegetation and exotic competitors (cOsEWic 2000).
The mD Aldergrove population, particularly, has seen steady annual declines from 90 egg masses in 1997 to 5 egg masses in 2006 (unpublished data) for unknown reasons. This study is aimed at: determining the number of egg masses oviposited at mD Aldergrove, their embryonic survivorship and genetic diversity, increasing the breeding population by captive rearing programs, and determining the survivorship of adults
previously reared at the breeding facilities and released at mD Aldergrove. Study area and methods:
Study Site:Research was conducted at the Department of National Defence’s mD Aldergrove facility which consisted of three subsites: Pipeline, frog Restoration site (fRs) and 264th. Pipeline and 264th are connected via open wetlands with a mix of open water and vegetation. fRs was altered in 2002 and is now a large body of open water with little vegetation in the littoral zone.
Embryonic Survivorship, Captive Rearing, and DNA Analysis:Embryonic survivorship, captive rearing, and DNA analysis were not conducted in 2009.
Oregon Spotted Frog Trapping:sixty collapsible minnow traps were divided equally between subsites Pipeline and fRs and deployed in the spring from 24 march to 3 April and in the fall from 28 september to 1 October, 2009. During the spring, traps were deployed on monday morning of week one and checked the following Tuesday, Wednesday, and Thursday mornings, with removal from the wetland

Environmental Science Advisory Committee P109-09
68
were collected for captive rearing or DNA analysis. Oregon Spotted Frog Trapping:A total of six amphibian species were caught during trapping including: Pacific Tree frog (Pseudacris regilla), North-western salamander (Ambystoma gracile), Rough-skinned Newt (Taricha granulosa), Bull frog, Red-legged frog (Rana aurora), and Oregon spotted frog. The most abundant species caught was the North-western salamander (Table 1). One Oregon spotted frog was caught and was marked with red elastomer on the left rear foot. This individual weighed 20.9 grams (sex undetermined), had a sVL of 57 millimeters, and was swabbed for chytrid. swab results are pending.
Water Temperature:Water temperatures between Pipeline and fRs were similar in both spring and fall. spring mean minimum and mean maximum temperatures were 5.67ºc (sD ±0.75) and 9.98ºc (sD ±3.31) respectively. fall mean minimum and maximum temperatures were 10.15ºc (sD±1.01ºc) and 13.0ºc (sD±1.22ºc) respectively (Tables 2 and 3).
discussion:
Oregon spotted frogs usually breed in february and march, soon after snow melt with minimum and maximum temperature limits for embryos approximately 6 and 28 °c (Licht 1971). During 2009, oviposition site temperatures were in the low range of tolerance limits for Oregon spotted frogs but were still within acceptable limits for successful breeding.
chytrid fungus has been linked to amphibian mortalities and declines around the world (Bosch et al. 2001, Green et al. 2002, Lips et al. 2006) and was found at mD Aldergrove in 2008, but 2009 results are pending. Thus, it is still essential to maintain the strict protocol for cleaning and storing of equipment when working on wetlands.
Thursday. Traps were deployed the following Tuesday morning at a new location within each subsite. Traps were then checked the following Wednesday, Thursday, and friday mornings. in the fall, traps were deployed on a monday morning and checked Tuesday, Wednesday, and Thursday morning. Traps were deployed in numerical order near documented oviposition sites with GPs readings taken at each trap to ensure all traps were checked during each visit. Traps were removed from the wetland on the last day of trapping in both the spring and the fall.
Data recorded for amphibians trapped included: species, sex (if possible), snout-vent-length (sVL), and total length (for salamanders and newts only). Any Oregon spotted frogs caught were examined for marks between the webbing of the toes. if marked, location and colour of the dye enabled us to identify the rearing facility and release year. if unmarked, individuals were marked with an elastomer dye. Additionally, these individuals were swabbed for chytrid fungus (Batrachochytrium dendroba). swabs were analyzed by Dr. Govindarajulu of the Bc ministry of Environment. All trapped amphibians were released at the site of capture with the exception of Bull frogs (Lithobates catesbeiana) which were removed from the wetland and euthanized with ms-222 per canadian Animal care Guidelines. Disposable gloves were worn at all times.
Water Temperature:stowaway® “tidbit” thermometers were placed in the water during amphibian trapping in the spring and fall with water temperature recorded every 60 minutes.
results:
Embryonic Survivorship, Captive Rearing, and DNA Analysis:surveys for egg masses were conducted at the three sub sites during march and April of 2009. No egg masses were found and therefore embryonic survivorship study was not conducted and no eggs

Environmental Science Advisory Committee P109-09
69
masses versus those at husbandry facilities to allow us to determine optimal rearing conditions. Lastly, continuing amphibian trapping will provide insight into whether population declines are due to poor early or late life-stage survival. This information is vital for the recovery team and other groups to ensure successful management and recovery of the species.
acknowledgements:
Thanks to Rene mckibbin, Dennis Knopp, christine Bishop, David Toews, Vanessa Kilburn, stacey Boks, Dan shervill, ingrid Pollet, and steve shisko for their assistance during surveys and amphibian trapping and cfB Esquimalt for access to the property. references:
Bosch, J., martínez-solano, i. and García-París, m. 2001. Evidence of a chytrid fungus infection involved in the decline of the common midwife Toad (Alytes obstetricans) in protected areas of central spain. Biological conservation 97: 331–337.
committee on the status of Endangered Wildlife in canada [cOsEWic]. 2000. cOsEWic assessment and status report on the Oregon spotted frog Rana pretiosa in canada. Ottawa, ON.
corkran, c.c., and Thoms, c. 1996. Amphibians of Oregon, Washington and British columbia. - a field identification guide. Lone Pine Publishing, Vancouver, B.c.
General of the Environment, National Defence Headquarters, Ottawa., canada, 30 pp + appendices.
Green, D.E., converse, K.A. and schrader, A.K. 2002.
Epizootiology of sixty-four amphibian morbidity and mortality events in the UsA, 1996–2001. Annals of the New York Academy of sciences 969: 323–339.
The one Oregon spotted frog caught during this season had red markings on its left foot (figure 1). We do not have any records of marking frogs with red in this location but records are not available from 2003 to 2004 and it is likely that this frog was marked during this time. This find is important because it indicates that previously captive reared and released Oregon spotted frogs are surviving to maturity.
conclusions:
A main objective of the Oregon spotted frog Recovery Team is to increase population size at existing sites (Haycock 2001). captive rearing and release can assist in accomplishing this objective (Hawkes 2006). However, in order to rear Oregon spotted frogs in captivity, egg mass surveys need to be conducted annually to enable egg collection and estimate population size. Egg collection will also enable investigation of potential genetic bottlenecks of the population.
Although no egg masses have been found at mD Aldergrove since 2006, it can take 2-3 years for Oregon spotted frogs to reach sexual maturity (Jones et al. 2005). Thus, it is necessary to continue egg mass surveys to determine if previously captive reared Oregon spotted frogs released at this site are surviving and breeding. As well, these surveys will enable us to conduct embryonic survivorship studies on wild egg
Figure 1. Red markings on Oregon spotted frog.

Environmental Science Advisory Committee P109-09
70
prepared for World Wildlife fund canada. 35 pp.
Jones, L.c., Leonard, W.P., and Olson D.H. (eds). 2005. Amphibians of the Pacific Northwest. seattle Audubon society. seattle, WA.
Licht, L.E. 1971. Breeding habits and embryonic thermal requirements of the frogs, Rana aurora aurora and Rana pretiosa pretiosa in the Pacific Northwest. Ecology 52 (1): 116-124.
Lips, K.R., Brem, f., Brenes, R., Reeve, J.D., Alford, R.A., Voyles, J., carey, c., and collins, J.P. 2006. infectious disease and global biodiversity loss: pathogens and enigmatic amphibian extinctions. Proceedings of the National Academy of sciences, UsA 103: 3165–3170.
Hawkes, V.c. 2006. Oregon spotted frog (Rana pretiosa) pathology, marking and release at mDA Aldergrove, september 2006. Report prepared for Public works and Government services canada.
Haycock, R.D. 2000a. cOsEWic status report on the Oregon spotted frog Rana pretiosa in canada. in: cOsEWic assessment and status report on the Oregon spotted frog Rana pretiosa in canada. cOsEWic, Ottawa, 22 pp.
Haycock, R.D. 2000b. status update and management plan for the Oregon spotted frog (Rana pretiosa) at the Naval Radio section Aldergrove. Director General of the Environment, National Defence Headquarters, Ottawa., canada, 30 pp + appendices.
Haycock, R.D. 2001. A canadian Recovery Plan for the Oregon spotted frog (Rana pretiosa). Report
P109-09. Oregon spotted frog at Aldergrove.

Environmental Science Advisory Committee P109-09
71
table 2. Water temperatures during amphibian trap-ping 2009 - mD Aldergrove, subsite fRs.
date min temp (ºc)
max temp (ºc)
mean temp (ºc)
Std dev
24-mar 6.66 8.11 7.57 0.51
25-mar 5.51 11.29 7.78 2.01
26-mar 4.64 10.42 7.34 2.26
27-mar 6.95 9.27 8.18 0.69
28-mar 6.08 8.11 6.91 0.68
29-mar 4.93 12.44 8.10 2.82
30-mar 5.79 8.11 6.88 0.66
31-mar 6.08 12.16 8.34 2.18
01-Apr 5.79 7.82 6.72 0.65
02-Apr 4.93 6.37 5.59 0.48
03-Apr 5.51 18.61 11.25 5.45
28-sep 11.17 14.35 13.19 1.06
29-sep 9.44 12.9 11.09 1.22
30-sep 8.86 14.06 11.18 1.95
01-Oct 10.3 11.17 10.72 0.33
table 3. Water temperature during amphibian trapping 2009 – mD Aldergrove, subsite Pipeline.
date min temp (ºc)
max temp (ºc)
mean temp (ºc)
Std dev
24-mar 6.54 7.7 7.31 0.40
25-mar 5.67 10.02 7.49 1.43
26-mar 4.22 9.15 6.76 1.75
27-mar 6.83 8.57 7.62 0.57
28-mar 6.25 7.7 6.93 0.49
29-mar 5.09 11.17 7.72 2.15
30-mar 5.96 7.7 6.77 0.58
31-mar 5.96 12.03 8.14 2.24
01-Apr 5.67 7.99 6.79 0.71
02-Apr 4.81 6.25 5.40 0.49
03-Apr 4.81 18.49 10.03 5.51
28-sep 11.87 13.89 13.09 0.67
29-sep 9.85 12.73 11.27 0.92
30-sep 9.27 13.6 11.28 1.43
01-Oct 10.42 11.29 10.80 0.31
table 1. Number of amphibians trapped at mD Aldergrove during 2009.
# per speciesDate Pseudacris
regillaAmbystoma
gracileTaricha
granulosaLithobates
catesbeianusRana aurora
Rana pretiosa
Total/trap night
# of am-phibians per trap
24-mar 0 52 2 0 0 1 55 0.9225-mar 1 52 0 0 1 0 54 0.9026-mar 2 38 2 0 1 0 43 0.7201-Apr 1 46 8 0 1 0 56 0.9302-Apr 5 33 4 0 0 0 42 0.7003-Apr 1 25 6 0 1 0 33 0.5529-sep 5 12 0 4 0 0 21 0.3530-sep 4 4 0 7 0 0 15 0.2501-Oct 3 3 0 3 0 0 9 0.15total 22 265 22 14 4 1 328

Environmental Science Advisory Committee P124-09
72
Environmental Science Advisory Committee
Project leader(s): Brent J. sinclairorganization(s): University of Western Ontario address(es): BGs 2078, Department of Biology, The University of Western Ontario, London, ON, canada N6A 5B7telephone no.(s): (519) 661-2111 ext 83138Facsimile: (519) 661-3935Email(s): [email protected]
PErmit #: P124-09location(S): ROcKY POiNT
Start datE: 1 JANUARY 2009comPlEtion datE: 31 DEcEmBER 2009 ProjEct StatUS: 2007-ONGOiNG
year-round microclimates Experienced by Butterfly larvae in Garry oak Ecosystems
introduction:
This project addresses the impacts of overwintering conditions and climate change on the biology of species at the edge of their geographic range. it is complementary to, and conducted in consultation with, Dr Jessica Hellmann at University of Notre Dame. The overall goals of the project are to determine the effects of microclimatic conditions on the energy utilization, survival, and subsequent reproductive potential of overwintering individuals of the butterflies Erynnis propertius and Papilio zelicaon. Physiological work is being conducted in the laboratory in London, ON, using larvae collected on Vancouver island, and these physiological data will be interpreted using the long-term microclimate temperature recordings. The primary questions to be addressed using microclimate temperature data collected from Rocky Point and other locations on Vancouver island are as follows:
1. to what extent is reproductive output determined by energy consumption during the overwintering period;2. what is the relative importance of temperature conditions in fall and winter in determining energy reserves remaining for spring reproduction in these
species; and 3. is there a risk of mortality for these species due to low temperature exposures of short or long duration?
Thus to address the central question of this study: “Do overwintering conditions, whether through mortality or energy expenditure, determine the northern geographic limit for these species?”, the microclimate data from Rocky Point site will be combined with data from other microclimate stations (to be established in Oregon and elsewhere on Vancouver island) along with the results of the physiological measurements.
Overall, this study will provide important information for ongoing studies on the flora and fauna of the Garry oak (Quercus garryana) ecosystem, will provide information for future conservation and management of the butterfly species, and will address a number of knowledge gaps concerning the effects of changing winter conditions on insect population biology.
Study area and methods:
microclimate temperature recording stations were established in October 2007 in Garry oak meadows at Rocky Point in close proximity to transects used for on-

Environmental Science Advisory Committee P124-09
73
discussion:
This project is still ongoing. We believe we have solved the problem of moisture damage by encasing the data loggers in plastic containers filled with desiccant. We anticipate being able to use the data in conjunction with physiological data after the 2009/10 winter (when we will have three winters’ data). conclusions:
We have successfully established and maintained microclimate temperature monitoring sites at Rocky Point, as well as at two other Vancouver island locations and two locations in Oregon. Related work on the physiology of the butterfly species (collected under Dr Hellmann’s permit) is currently in progress. This work has thus far resulted in two journal publications (Pelini et al. 2009; Williams et al. 2010).
Our plan for 2010 is to use the microclimate data (in conjunction with data from sites in Oregon and elsewhere on Vancouver island) to build a model of the field-responses of overwintering larvae and pupae of E. propertius and P. zelicaon. We will use metabolic rate-temperature relationships and rates and nature of metabolic fuel use under different temperature regimes to predict overwinter energy consumption in the field, and to compare overwinter energy consumption between the core and edge of the range of these species.We also plan to continue the maintenance of the data loggers. Long-term, ecologically-relevant temperature data sets are very rare, and a 10 year data set will allow us to revisit the physiological data to examine longer-term trends.
acknowledgements:
We are grateful to the field crews from the Hellmann and sinclair labs on Vancouver island (Wesley chick and Andre Burnier) and in Oregon (Jason Dzurisin and Adrea Gonzalez-Karlsson) for their hard work. We are
the-wing butterfly surveys carried out by Dr Hellmann.
Each microclimate station consists of two iButton Ds1922 dataloggers, which make time-stamped temperature recordings at one-hour intervals. The data loggers at each of four stations were deployed in pairs – one was affixed to a branch in the canopy at 1.8 to 2 m height (representative of ‘leaf temperature’, experienced by growing caterpillars and by caterpillars overwintering in leaf rolls that do not drop to the ground), while one was anchored to a tent peg and placed in the leaf litter directly below the canopy data loggers to provide temperature measurements representative of overwintering habitat in the leaf litter. Each pair of iButtons was encased in a plastic vial filled with silica gel to prevent moisture damage. Ground level iButtons were shaded with a white-painted pie plate to reduce radiant heat gain. This configuration was also used at two other sites in Garry oak meadows on Vancouver island and at two sites in Oregon. The level of replication within and between locations was necessary to allow a determination of the variability of temperature conditions both among and within sites.
Data download and maintenance of the dataloggers was done on-site using a laptop computer.
results: Dataloggers were checked and data downloaded on 18 April 2009 and again on 9 June 2009 at which time the loggers were set to run unmonitored for 360 days to avoid difficulties in having to return prematurely to reset the loggers (anticipated for April 2010). Hourly temperature data from each of the four stations from October 2007 to June 2009 were collated and mean monthly minima, maxima and means calculated. moisture damage over winter resulted in failure of four data loggers, and these data loggers were replaced. Plastic vials were refilled with fresh silica gel and old silica gel removed from the site and regenerated for reuse.
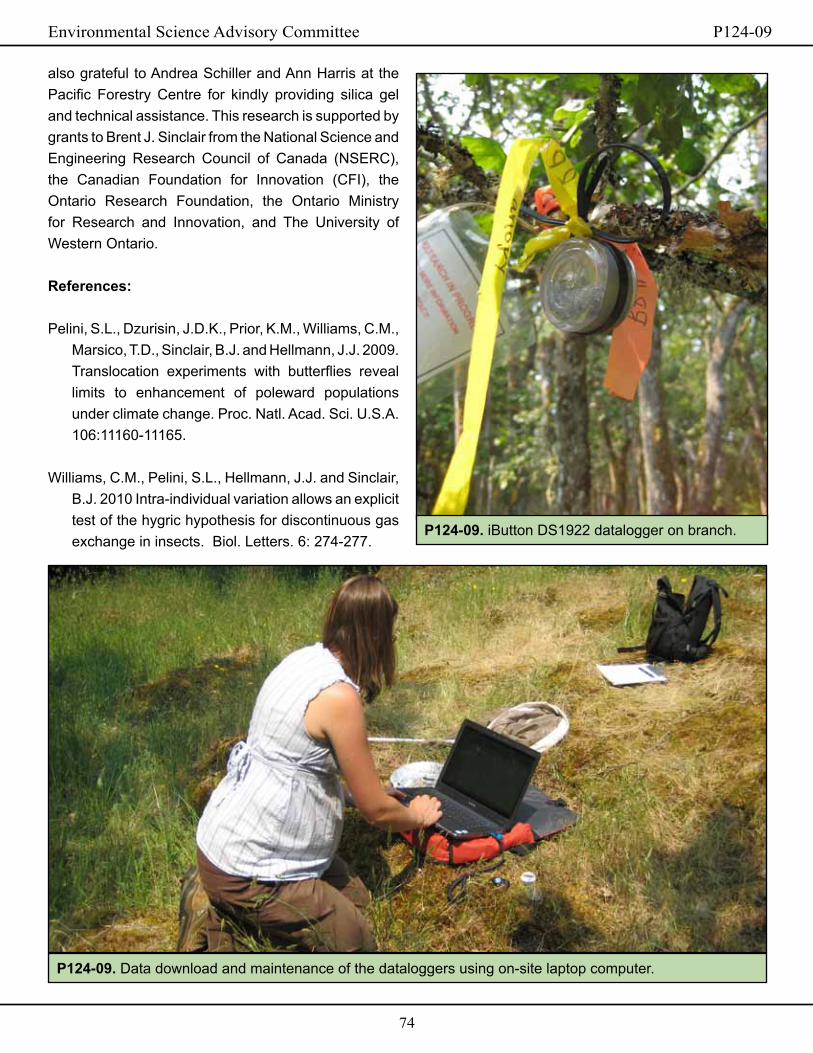
Environmental Science Advisory Committee P124-09
74
also grateful to Andrea schiller and Ann Harris at the Pacific forestry centre for kindly providing silica gel and technical assistance. This research is supported by grants to Brent J. sinclair from the National science and Engineering Research council of canada (NsERc), the canadian foundation for innovation (cfi), the Ontario Research foundation, the Ontario ministry for Research and innovation, and The University of Western Ontario. references:
Pelini, s.L., Dzurisin, J.D.K., Prior, K.m., Williams, c.m., marsico, T.D., sinclair, B.J. and Hellmann, J.J. 2009. Translocation experiments with butterflies reveal limits to enhancement of poleward populations under climate change. Proc. Natl. Acad. sci. U.s.A. 106:11160-11165.
Williams, c.m., Pelini, s.L., Hellmann, J.J. and sinclair, B.J. 2010 intra-individual variation allows an explicit test of the hygric hypothesis for discontinuous gas exchange in insects. Biol. Letters. 6: 274-277.
P124-09. Data download and maintenance of the dataloggers using on-site laptop computer.
P124-09. iButton Ds1922 datalogger on branch.

Environmental Science Advisory Committee P126-09
75
Environmental Science Advisory Committee
Project leader(s): Dr. Leland m. Humbleorganization(s): Natural Resources canada, canadian forest service address(es): 506 West Burnside Road, Victoria, B.c., V8Z 1m5 telephone no.(s): (250) 363-0644Facsimile: (250) 363-6005, (250) 363-0775Email(s): [email protected]
PErmit #: P126-09location(S): ROcKY POiNT
Start datE: 05 OcTOBER 2009comPlEtion datE: 31 DEcEmBER 2009 ProjEct StatUS: 2009-2011
Efficacy testing of Pheromones and Kairomones for Woodboring coleoptera
introduction:
Detection of populations of introduced cerambycidae in urban and natural forests remain problematic as there are currently no efficient pheromone based detection tools for the majority of the species of cerambycidae. Lacey et al. (2004) reported the first verified occurrence of a male produced aggregation pheromone in the cerambycidae subsequently, Ray et al. (2006) surveyed 65 species in 24 tribes of the subfamily cerambycinae and demonstrated that gland pores thought to be the site of pheromone release were present in the males of at least 49 species, while Ginzel and Hanks (2005) demonstrated that volatiles released by host trees also play a role in attraction to susceptible hosts. silk et al. (2007) showed that at least two species of coniferous feeding cerambycids from Europe, Tetropium fuscum and Tetropium castaneum (cerambycidae: spondylinae), also respond to specific pheromones. These studies represent the first demonstrations of functional long range attractants for this economically important group of species that include a significant number of invasive species in canada and around the world.
The primary objective of this study is to determine if any native cerambycidae exhibit species-specific responses to generic c-6 and c-8 diol and ketol lures with and in the absence of ethanol. These research trials are part of a larger national study attempting to identify lure systems useful for surveillance monitoring for invasive species of cerambycidae. Parallel studies were conducted in in 2009 in forest habitats near Ottawa, Ontario by Dr. B. Gill (canadian food inspection Agency) and in the maritimes by Dr. J. sweeney (Natural Resources canada - canadian forest service (NRcan-cfs), Atlantic forestry centre, fredericton NB).
Study area and methods:
Lures and trapsRacemic and chiral c-6 ketols and racemic c-8 ketols were synthesized by Dr. Peter silk (Natural Resources canada - canadian forest service, Atlantic forestry centre, fredericton NB) and supplied to Pherotech international, inc. (Delta, Bc) for incorporation into release devices. Ultra-high release rate ethanol (UHR-EtOH) lures were obtained from Pherotech international, inc. All experiments were conducted

Environmental Science Advisory Committee P126-09
76
emitted by the beetles.
Rearing of host materialTwenty-three collections of dead branches of tree species were collected at DND Rocky Point between 25 and 28 may 2009 and reared in emergence tubes to determine the host associations for the cerambycidae recovered in trapping experiments. The number of collections and species of cerambycidae emerging are noted in Table 11. With the exception of Xestoleptura behrensii, all of the species recovered belong to the subfamily cerambycinae.
Trap and Specimen Processing and Species IdentificationUpon return to the laboratory, contents of each Whirl-Pac bag were washed in running water and then preserved in 95% ethanol. All coleoptera recovered were subsequently sorted from plant debris in the traps and either direct pinned or preserved in 95% ethanol prior to identification. All target species (bark and woodborers) were then identified to species, counted and representative specimens of each species mounted and labeled for accession into the reference collection at NRcAN- cfs-Pacific forestry centre (PfcA). All cerambycidae and curculionidae were initially identified at Pfc. Pinned voucher specimens of all cerambycidae were subsequently submitted to serge Laplante (canadian National collection, Agriculture and Agri-food canada, Ottawa) for confirmation of the identifications.
results: in total 2,589 adult curculionidae and 1,431 adult cerambycidae have been processed to date from the three separate lure trials at DND-Rocky Point.
Note:1Numbers represent the total number of collections and the number
of individual collections from which the listed species emerged
(square brackets).
using 12-funnel Lindgren traps with the wet-trap option (PheroTech international, inc.). The collecting cup of each trap contained 125 ml of food grade propylene glycol to retain any specimens captured and traps were hung from metal hangers placed in the ground. The minimum separation between traps was 30 meters. Traps were serviced on monthly basis at which time trap contents were collected into Whirl-Pac bags and the propylene glycol in the cups replenished.
All trap trials were conducted at DND-Rocky Point. Trap locations were established between 15 and 26 may 2009. Lures for experiment 1: “Phymatodes aeneus optically active lures trial” were placed on the traps on 27 may; those for experiment 2: “Neoclytus conjunctus lure confirmation trial” set up on 26 may; and lures for experiment 3: “Monarthrum scutellare trial” were established on 27 may. Trap collections were made on 9-10 June, 29 June; 14 July; 27 July; 6 August and 14 August 2009 and all equipment was removed by 31 August 2009. Lure trials were set up in a randomized complete block designs.
Live trapping for Phymatodes aeneus and Neoclytus conjunctus was conducted in conjunction with the lure trials for the two species. A single baited trap with no trap solution in the capture cup was established in the vicinity of the lure trial replicates to obtain live material for the aeration experiments to determine which compounds are released by each of the species.
Aeration experimentsAdult beetles recovered from live traps and rearings (identified to species and separated by sex) were pooled by sex and species and placed in aeration chambers. charcoal filtered air was drawn through the chambers and volatiles emitted by the test subjects (minimum of 20 individuals), captured on chemical absorbents (e.g. super-q, Alltech Associates, Deerfield, illinois) and placed in the outflow stream from the aeration chamber. Analyses of the adsorbed volatiles is to be conducted by Drs. J. sweeney and P. silk to determine the chemical composition of the volatiles (if any)

Environmental Science Advisory Committee P126-09
77
Additional trap studies are being planned for 2010 using both racemic and optically active c-6 and c-8 ketols and c-6 diols. When the trap captures over the last two years are examined in conjunction with the results of the limited rearings conducted in 2009 the data illustrates that at least one of the more abundant reared species, Eumichthus oedipus, is not responding to the compounds tested to date.
acknowledgements:
The assistance of meghan Noseworthy (NRcan, cfs, Victoria) for trap set-up and monitoring; chelsea Burdge and Esme John (NRcan, cfs, Victoria) for preliminary identifications as well as sorting, mounting, labeling and sexing the target taxa; and serge Laplante (canadian National collection, Agriculture and Agri-food canada, Ottawa) for confirming cerambycid identifications is gratefully acknowledged.
Processing of the curculionidae from the Phymatodes aeneus and Neoclytus conjunctus lure trials have not yet been completed. Total number of individuals for each family and subfamily by lure trial are given in Table 2. The species recovered and identified to date are noted in Table 3.
Live trapping of adult beetles in conjunction with the Phymatodes aeneus and Neoclytus conjunctus lure trials was unsuccessful. Only two adult P. aenus and one adult N. conjunctus were recovered in the dry traps, while 1,253 and 56 adults respectively were recovered in the lure trials where trap solution was used in the collecting cups.
Aerations were completed for Phymatodes aeneus. Analysis of the captured volatiles is ongoing.
discussion:
The results of the 2009 trapping experiments at Rocky Point confirmed that multiple species of cerambycidae were attracted to racemic c-6 ketols. The more targeted sampling conducted in 2009 reduced the variability in trap captures across blocks and has provided statistically significant data for the targeted species (Monarthrum scutellare, Neoclytus conjunctus and Phymatodes aeneus). A draft manuscript has been prepared documenting the response of M. scutellare to the compounds tested. Work will continue over the winter to complete the identifications in the scolytinae and to analyze the data from 2009. conclusions:
While trap results suggest that multiple species are utilizing c-6 ketols as semiochemicals further research is needed to determine the identity of the specific compounds and demonstrate their function as attractants. Ultrastructural examinations with a scanning electron microscope are currently underway to determine the presence or absence of gland pores in each sex of the species responding to ketol lures. P126-09. 12-funnel Lindgren trap.
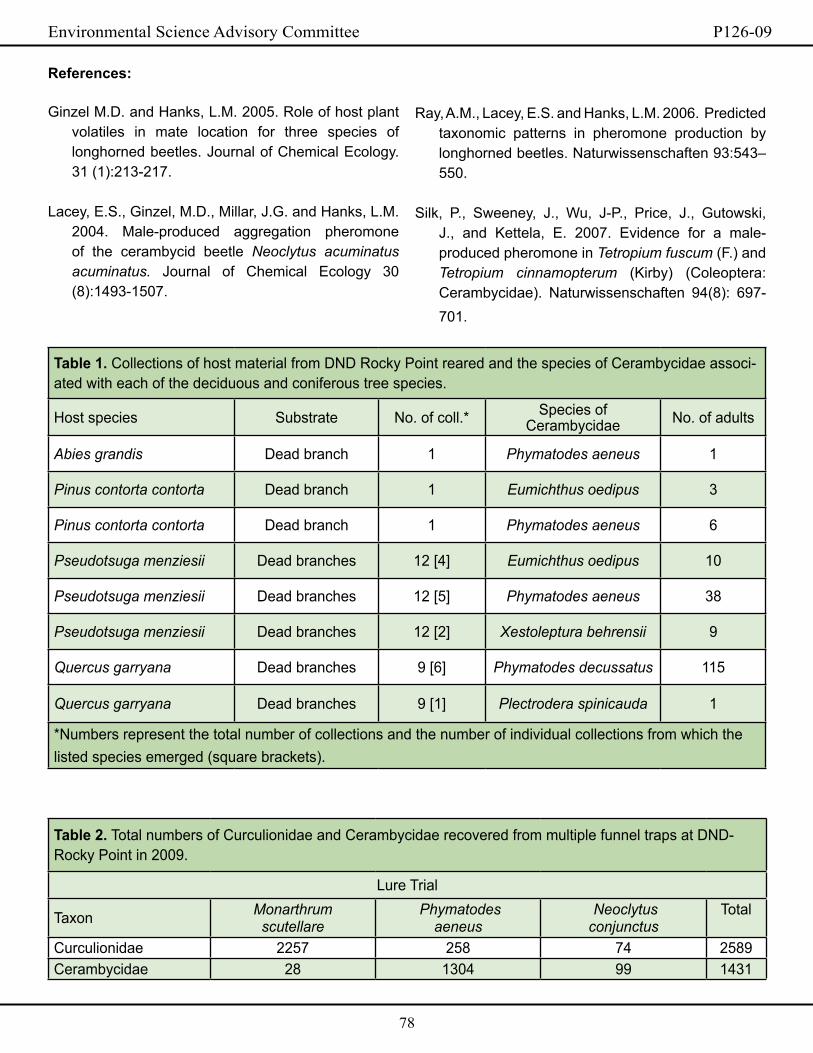
Environmental Science Advisory Committee P126-09
78
Ray, A.m., Lacey, E.s. and Hanks, L.m. 2006. Predicted taxonomic patterns in pheromone production by longhorned beetles. Naturwissenschaften 93:543–550.
silk, P., sweeney, J., Wu, J-P., Price, J., Gutowski, J., and Kettela, E. 2007. Evidence for a male-produced pheromone in Tetropium fuscum (f.) and Tetropium cinnamopterum (Kirby) (coleoptera: cerambycidae). Naturwissenschaften 94(8): 697-701.
references:
Ginzel m.D. and Hanks, L.m. 2005. Role of host plant volatiles in mate location for three species of longhorned beetles. Journal of chemical Ecology. 31 (1):213-217.
Lacey, E.s., Ginzel, m.D., millar, J.G. and Hanks, L.m. 2004. male-produced aggregation pheromone of the cerambycid beetle Neoclytus acuminatus acuminatus. Journal of chemical Ecology 30 (8):1493-1507.
table 2. Total numbers of curculionidae and cerambycidae recovered from multiple funnel traps at DND-Rocky Point in 2009.
Lure Trial
Taxon Monarthrumscutellare
Phymatodesaeneus
Neoclytusconjunctus
Total
curculionidae 2257 258 74 2589cerambycidae 28 1304 99 1431
table 1. collections of host material from DND Rocky Point reared and the species of cerambycidae associ-ated with each of the deciduous and coniferous tree species.
Host species substrate No. of coll.* species of cerambycidae No. of adults
Abies grandis Dead branch 1 Phymatodes aeneus 1
Pinus contorta contorta Dead branch 1 Eumichthus oedipus 3
Pinus contorta contorta Dead branch 1 Phymatodes aeneus 6
Pseudotsuga menziesii Dead branches 12 [4] Eumichthus oedipus 10
Pseudotsuga menziesii Dead branches 12 [5] Phymatodes aeneus 38
Pseudotsuga menziesii Dead branches 12 [2] Xestoleptura behrensii 9
Quercus garryana Dead branches 9 [6] Phymatodes decussatus 115
Quercus garryana Dead branches 9 [1] Plectrodera spinicauda 1
*Numbers represent the total number of collections and the number of individual collections from which the listed species emerged (square brackets).

Environmental Science Advisory Committee P126-09
79
table 3. Genera and species of curculionidae and cerambycidae recovered from each of the lure trials and total num-ber of individuals identified from DND-Rocky Point in 2009. Note that identifications and numbers of scolytinae from the Neoclytus conjunctus and Phymatodes aeneus trials are incomplete as identifications have not yet been completed.
Lure TrialTaxon Monarthrum
scutellareNeoclytusconjunctus
Phymatodesaeneus
No. ofindividuals
cerambycidaeCallidium vancouverenese + 2Centrodera spurca + 1Clytus planifrons + 1Eumichthus oedipus + + 8Leptalia macilenta + 1Leptura obliterata obliterata + + 5Megasemum asperum + 14Molorchus longicollis + 1Necydalis cavipennis + + 3Necydalis laevicollis + + 5Neoclytus conjunctus + + 61Ortholeptura valida + 2Phymatodes aeneus + + + 1299Phymatodes decussatus decussatus + 4Phymatodes lecontei + 1Strophiona laeta + 1Xestoleptura behrensi + + 9Xestoleptura crassipes + + 7Xylotrechus longitarsis + + 6curculionidae: ScolytinaeAlniphagus aspericollis + 2Cryphalus pubescens + + 107Dendroctonus pseudotsugae + 1Gnathotrichus retusus + + 6Gnathotrichus sulcatus + + 230Hylastes nigrinus + + + 25Hylastes ruber + + 2Hylurgops porosus + 1Monarthrum scutellare + + + 2050Phloeosinus sequoiae + 3Pityophthorus sp. + 1Pseudohylesinus granulatus + 3Pseudohylesinus sericeus + + 6Trypodendron lineatum + + 70Trypodendron retusum + 1Xyleborus dispar + + 7

Environmental Science Advisory Committee P130-09
80
Environmental Science Advisory Committee
Project leader(s): matt fairbarns organization(s): Aruncus consultingaddress(es): 2130 Kings Road Victoria Bc V8s 4L8 telephone no.(s): (250) 592-8752 Facsimile: NA Email(s): [email protected]
PErmit #: P130-09location(S): cfmETR AND ROcKY POiNT
Start datE: 01 mAY 2009 comPlEtion datE: 31 DEcEmBER 2009 ProjEct StatUS: 2005-ONGOiNG
monitoring Seed Establishment by Purple Sanicle and Seaside Bird’s-foot lotus and Fluctuations of a coast microseris Population
introduction:
seaside Bird’s-foot Lotus (Lotus formosissimus) is a species at Risk Act (sARA) - listed nationally endangered species (cOsEWic 1996) and Purple sanicle (Sanicula bipinnatifida) is a sARA-listed nationally threatened species (cOsEWic 2001). Recovery plans for the two species call for the establishment of new populations and enlargement of existing populations in order to achieve population viability goals (Parks canada Agency 2006). These objectives cannot be achieved without knowing what techniques are likely to successfully lead to the establishment of new plants. Permanent plots were established in 2005 to test the success of establishment by direct seeding and no further seeding will be conducted. These seedbank plots are experimental and do not occur in natural populations
coast microseris (Microseris bigelovii) is a sARA-listed nationally endangered species (cOsEWic 2006). Recovery goals for this species are more effectively assessed if natural levels of population fluctuation can be quantified. The presence of multi-
year data from permanent plots established in 2005 in a naturally occurring population at church Hill provides a solid baseline for continued monitoring to track population fluctuations. The data can also be used in the preparation of status report updates and in the evaluation of DND’s effectiveness in managing the population.
The project has two components. One involves tracking germination success and survival in permanent plots established at Rocky Point to study seaside Bird’s-foot Lotus and at Albert Head to study Purple sanicle. The other component involves tracking population characteristics of coast microseris at Rocky Point.
Study area and methods:
Monitoring Seed Establishment by Purple Sanicle and Seaside Bird’s-foot LotusPermanent plots, established in 2005, were revisited on 07 July 2009 in order to count the number of plants growing in 2009. in 2005, three treatments were applied in a 3 x 3 Latin square design. One treatment (light scrape) involved removing loose dead plant

Environmental Science Advisory Committee P130-09
81
which survive into the fourth growing season indicates that even under the deep scrape treatment, direct seeding is at best a slow means of establishing new populations.
seaside Bird’s-foot Lotus plots at church Hill also grew slowly. There was a moderate degree of mortality between 2008 and 2009. Based on the four growing seasons studied, it appears that most mortality occurs in the seedbank as with Purple sanicle. Unlike Purple sanicle, most germination occurred in the second year after seeding, rather than in the growing season immediately following seeding. As with Purple sanicle, however, most mortality occurred in the year following germination. The slow growth of plants which survive into the third growing season indicates that regardless of treatment, direct seeding is at best a slow means of establishing new populations. conclusions:
The slow growth of Purple sanicle plants which survive into the fourth growing season indicates that even under the deep scrape treatment, direct seeding is at best a slow means of establishing new populations. The slow growth of seaside Bird’s-foot Lotus plants which survive into the third growing season indicates that regardless of treatment, direct seeding is at best a slow means of establishing new populations.
acknowledgements:
The canadian forest service (Andrea schiller) and Department of National Defence (Tracy cornforth) supported this project.
references:
cOsEWic 1996. cOsEWic Assessment and status Report on the seaside Birds-foot Lotus Lotus formosissimus in canada. committee on the status
material from the soil surface by lightly combing it with fingers. The second treatment (deep scrape) involved the removal of the top cm of plant litter and soil to expose mineral soil. The third treatment was a control.
Monitoring Fluctuations of a Coast Microseris PopulationPermanent plots, established in 2005, were revisited on 07 July 2009 in order to count the number of plants growing in 2009.
results: Monitoring Seed Establishment by Purple Sanicle and Seaside Bird’s-foot LotusTwenty Purple sanicle seedlings were observed in the experimental plot at Albert Head. All were in deep scrape quadrats. Nineteen of the seedlings had 1-3 leaves while the other had 4-7 leaves.
Only six seedlings were observed in the seaside Bird’s-foot Lotus plots at church Hill, four in one of the deep scrape quadrats and two in one of the shallow scrape quadrats.
Monitoring Fluctuations of a Coast Microseris PopulationThe coast microseris population, which collapsed in the 2008 growing season, showed negligible signs of recovery in 2009 so population data were not collected.
discussion:
Monitoring Seed Establishment by Purple Sanicle and Seaside Bird’s-foot LotusPurple sanicle plants at Albert Head continued to grow slowly and there was little mortality between 2008 and 2009. Based on the four growing seasons studied, it appears that most mortality occurs in the seedbank and that mortality among germinated plants is greatest in the first growing season. The slow growth of plants

Environmental Science Advisory Committee P130-09
82
of Endangered Wildlife in canada. Ottawa. 1-18pp.
cOsEWic 2001. cOsEWic Assessment and status Report on the Purple sanicle Sanicula bipinnatifida in canada. committee on the status of Endangered Wildlife in canada. Ottawa. 1-15pp.
cOsEWic 2006. cOsEWic assessment and status report on the coast microseris Microseris bigelovii in canada. committee on the status of Endangered Wildlife in canada. Ottawa. vi + 26 pp. (www.sararegistry.gc.ca/status/status_e.cfm).
Parks canada Agency. 2006. Recovery strategy for multi-species at Risk in maritime meadows Associated with Garry Oak Ecosystems in canada. in species at Risk Act Recovery strategy series. Ottawa: Parks canada Agency. 93 pps.
P130-09. seaside Bird’s-foot Lotus.
P130-09. Purple sanicle.

Environmental Science Advisory Committee P131-09
83
Environmental Science Advisory Committee
Project leader(s): mikaela Davis (transferred to John Elliott and sandi Lee)organization(s): Environment canada (science & Technology Branch)address(es): 5421 Robertson Rd, RR#1, Delta, Bc, V4K 3N2, canadatelephone no.(s): (604) 940-4700Facsimile: (604) 940-7022Email(s): [email protected] or [email protected]
PErmit #: P131-09location(S): ROYAL ROADs, cOLWOOD, NADEN, DOcKYARD, AND WORK POiNT
Start datE: 25 JANUARY 2009comPlEtion datE: 22 mARcH 2009 ProjEct StatUS: 2009-ONGOiNG
investigations into Environmental contaminants in the diets of coastal river otters
introduction:
Bioaccumulation and biomagnification of polyhalogenated aromatic hydrocarbon (PHAH) contaminants such as polychlorinated biphenyls (PcBs), dioxins (PcDDs) and furans (PcDfs) have been well documented in aquatic systems, and high concentrations have been reported in predatory birds and marine mammals at the top of aquatic food webs. Victoria Harbour is one of the most contaminated marine environments in British columbia due to industrial, commercial, and transportation related activities (city of Victoria 2001). concern about PHAHs in Victoria Harbour is based on a variety of data: (1) sediment PcB levels (particularly in the inner and upper harbour) are higher in Victoria Harbour than other coastal sites in British columbia (Transport canada, unpubl. data); (2) Dungeness crab (Cancer magister) contain higher concentrations of PcDD/fs and PcBs than other sites in coastal British columbia, and accordingly, crab harvest restrictions were invoked in this area (iknonomou et al. 2002, Knapp and Grant 2008); and (3) English sole (Parophrys vetulus) contain higher
tissue concentrations of PcBs in Victoria Harbour than adjacent sites (Environment canada, unpubl. data).
The North American river otter (Lontra canadensis) is a semi-aquatic mustelid that inhabits the nearshore marine waters of Victoria Harbour (Guertin 2009). Published literature has identified these and other mustelids as being sensitive to the toxic effects of some PHAH contaminants, especially PcBs (Olsson and sandegren 1983, mason 1989, Leonards et al. 1994). Because otters are elusive and cryptic in nature, studies have relied on the analysis of field-collected feces as a non-invasive and cost-effective alternative to blood and/or tissue sampling to assess contaminant burdens in wild otter populations (smit et al. 1994). Recently, it has been reported that river otter feces from Victoria Harbour in 1998, 2004, and 2006 contained the highest PcB levels out of all sites sampled in coastal British columbia. in all years, geometric mean total-PcB concentrations in Victoria Harbour exceeded criteria for reproductive effects in otter species (Elliott et al. 2008, Guertin et al. in press a). An assessment of individual river otter exposure to

Environmental Science Advisory Committee P131-09
84
all locations, each sampling point was located in the general vicinity of active river otter latrine sites.
fish and crab samples were obtained from each sampling point by employing a variety of techniques. Upon arriving at the sampling location, the shoreline was searched for any of the targeted species which may take shelter under rocks at low tide. in areas that were suitable (flat bottom and sand/mud sediment), a beach seine was conducted. Baited minnow traps and standard commercial crab traps were also deployed at each site. These were placed within 20 m from the shoreline and no deeper than 15 m, a plausible range for river otters. Each area (Upper, middle and Outer Victoria Harbour, Upper, middle, Outer, Dockyard/Naden Esquimalt Harbour, Esquimalt Lagoon/Royal Roads, and reference site) was usually sampled over two days.
Data on the composition of the river otter diet in the Victoria Harbour region, provided by Guertin et al. (in press b), were used to establish the relevance of captured fish and crab species to the otter. species constituting an important part of the otter’s diet were preferentially retained and included in the analysis. individual fish and crab samples from each sampling point were wrapped in acetone:hexane rinsed aluminum foil, placed in a plastic bag, and immediately frozen at –20°c. Prey samples were pooled by prey family for analysis whenever possible. At least four prey types were selected for contamination analysis from each sampling location – species of the family cancridae [Dungeness crab (Cancer magister), red rock crab (Cancer productus), and slender crab (Cancer gracilus)], species of the family Varunidae [purple shore crab (Hemigrapsus nudus)], species of the family stichaeidae (also known as pricklebacks or eelblenies) [high cockscomb (Anoplarchus purpurescens), snake prickleback (Lumpernus sagitta), rock pricklebacks (Xiphister mucosus)], and species of the family cottidae (unidentified sculpins).
PcBs in the Victoria region provided further evidence of Victoria Harbour as a PcB source compared to the adjacent coastline (Guertin et al. in press a).
River otters foraging within Victoria Harbour feed largely on intertidal fish and other aquatic invertebrates and vertebrates (Guertin et al. in press b), and can therefore be exposed to relatively high levels of pollutants. While several studies have assessed levels of PcBs and other PHAH contaminants in the feces of otters, studies investigating PHAH concentrations in both feces and prey samples from the same location are rare. Therefore, the aim of this study was to determine PHAH concentrations in river otter prey species (intertidal fish and crustaceans) in Victoria Harbour, and to examine if patterns of such prey contaminant burdens are consistent with contaminant patterns measured in river otter fecal samples previously collected from Victoria Harbour.
Study area and methods:
Two different harbours were targeted in this study (Victoria and Esquimalt), as well as Esquimalt lagoon, and a non-harbour reference site near Albert Head. Victoria Harbour was divided into three main areas for sampling: Upper Harbour (selkirk Trestle to Johnston street Bridge), middle Harbour (Johnston street Bridge to Lime Bay), and Outer Harbour (Work Point to mcLoughlin Point). fishing at all sites, except Work Point as an EsAc permit was pending, took place from 25 January to 31 January 2009 and was conducted at low tides ranging from 0.6 to 0.9m. Esquimalt Harbour was divided into four main areas: Upper (Above colwood and across the top of the harbor before bridge), middle (colwood/Yew Point), Outer (fort Rodd Hill Park and Outer Dockyard), and then the Naden/Dockyard area. fishing at these sites, as well as at Esquimalt lagoon/Royal Roads and the reference site, took place from 15 march to 21 march 2009 and was also at low tides within the range of 0.6 to 0.9m. for

Environmental Science Advisory Committee P131-09
85
duplicate (a repeat analysis of the same sample). final extracts of the duplicates were injected and analyzed twice.
for the purpose of this report, ND and NDR values were substituted with zeros when summarizing PcDD/f, NO-PcB, and PBDE data.
Data Presentationin the case of the cancridae and shrimp, only one composite sample from each site was analyzed. However, for stichaeidae and cottidae, species were grouped according to overall length (i.e., small and large) and analyzed as distinct samples as previously described. smit et al. (1996) reported that it is not necessary to separate fish into size classes, as long as all specimens are within the size range normally consumed by otters. Therefore, the data presented and discussed in this report are based on average values per prey type per site. This value was computed by averaging both the small and large composite samples at a particular site. for samples in which replicates and duplicates were analyzed, this value was computed by averaging the original sample and the replicate/duplicate first, then averaging the separate composite samples.
Toxic Equivalents (TEQs)The toxicity of a given dioxin/furan or PcB is assessed, in relative terms, using an internationally accepted system of comparison known as “toxicity equivalent factors” (TEfs). TEfs are assigned to compounds on the basis of comparison with 2,3,7,8 T4cDD (the most toxic congener), which is assigned a TEf value of 1.0. The TEf of each compound is multiplied by its concentration to arrive at the Toxic Equivalent (TEq). The sum of the TEqs (Total-TEq) describes the total dioxin/furan and/or PcB toxic potential. for the purpose of this report, ND and NDR values were substituted with zeroes when calculating a TEq. Total TEqs were calculated for each sample at each site. TEq values
species of unidentified shrimp were also captured from two sampling locations. specimens of stichaeidae and cottidae were initially separated by size (i.e. > 15 cm in length or < 15 cm in length) and analyzed separately. We recognize that the limited time period of our study may represent a possible source of bias, especially if river otter diet shifts with season. However, stenson et al. (1984) reported a lack of seasonality in the diet of marine-foraging river otters in the nearby Gulf islands, Bc. Therefore, we considered our sampling sufficient.
Sample Analysissamples from Victoria Harbour were sent for contaminant analysis (samples from remaining areas have not yet been sent, dependent on further funding). As otters consume their prey whole (at least when the prey items are relatively small), specimens from each sampling point were ground whole in a blender and pooled according to the above strategy before analysis. The number of specimens per composite sample was between one (cancridae) and 14 (shrimp) depending on how many specimens were obtained during sampling (Table 1a).
fish and crab were analyzed for PcDD/fs, non-ortho (NO) PcBs, and PBDEs. sample weights varied greatly, from 200 g for one of the large crabs to 2.5 g for one of the pricklebacks (referred to in this report as blennies). in most cases, half of the available material, up to a maximum of 50 g, was used as the analytical aliquot. Due to the small amount of material available in two cases, the entire sample was used. in order to ensure quality control, samples were extracted and analyzed in batches (maximum 12 samples per batch). With each batch, a procedural lab blank, a replicate sample (a second sample from the same original sample, selected randomly) and an in-house reference sample [Wmf-01, freeze dried tissue of Lake Ontario chinook salmon (Oncorhynchus tschawytscha)] (Wellington Labs) was co-extracted and analyzed. Three randomly selected samples were also extracted and analyzed in

Environmental Science Advisory Committee P131-09
86
NO-PCBs NO-PcB concentrations (pg/g wet weight) for river otter prey samples collected from Victoria Harbour are shown in figure 2. concentrations of these chemicals were highest in samples collected from the middle Harbour sampling site (figure 2). The pattern of NO-PcBs in river otter prey specimens was dominated by PcB-77 at all sampling locations. All other NO-PcB congeners were relatively low at all sampling sites. However, concentrations of PcB-77 among the five prey categories were not uniform within sampling sites. for example, species of cancridae, shrimp, and sculpins had higher concentrations of PcB-77 than Varunidae and blennies at the middle Harbour site. A similar pattern was observed for the Upper Harbour site (recall that crabs belonging to the family Varunidae were not analyzed from the Upper Harbour).
PBDEsPBDE concentrations (pg/g wet weight) for river otter prey samples collected from Victoria Harbour are shown in figure 3. The pattern of PBDEs in river otter prey specimens was dominated by PBDE-47 at all sampling locations. concentrations of all other PBDE congeners were relatively low at all sampling sites. species of sculpins had highest concentrations of PBDE-47 at the upper and middle harbour sampling site. species of blennies had the highest concentration of PBDE-47 at the outer harbour sampling site.
Data on toxicity equivalents (TEq’s) have yet to be reviewed. conclusions:
No further work is planned at this time; however, contamination screening of Esquimalt Harbor, Esquimalt lagoon, and the reference site have yet to be conducted. further research into otter scat and populations is currently being conducted and contaminant fish data from this project is likely to be
for stichaeidae and cottidae were determined by averaging small and large specimens as previously discussed. All TEqs were calculated using 1998 TEfs developed by the World Health Organization (Van den Berg et al. 1998).
results: see Table 1-a,b,c for the number of specimens obtained from Victoria Harbor, Esquimalt Harbour, and other sites. The following results and discussion refer to samples from Victoria Harbour and are in general, based on visual observations of trends. statistical analysis and interpretation of results is pending. samples from Esquimalt Harbour, Esquimalt Lagoon, and our reference site near Albert Head have yet to be sent for contaminant screening.
Total Dioxins and Furans Total-PcDD/fs concentrations (pg/g wet weight) for river otter prey samples collected from Victoria Harbour are shown in figure 1. concentrations of total-PcDD/fs were relatively consistent among prey types at a particular sampling site, but varied spatially among sampling sites. Generally, total PcDD/fs in prey specimens ranged from the lowest concentrations detected at the Outer Harbour site to highest concentrations detected at the Upper Harbour site, except for cancridae, which had similar total-PcDD/f concentrations at the middle and Upper Harbour sites (42.4 and 38.9 pg/g wet weight, respectively). Highest concentrations of PcDD/fs were measured in sculpins from the Upper Harbour site (50.2 pg/g wet weight).The overall percentage increase in total-PcDD/fs in from the Outer Harbour site to the Upper Harbour site was 161% for cancridae (14.9 to 38.9 pg/g wet weight), 776% for shrimp (3.8 to 33.6 pg/g wet weight), 321% for blennies (5.1 to 21.6 pg/g wet weight), and 863% for sculpins (5.2 to 50.2 pg/g wet weight). Varunidae were not collected at the Upper Harbour, and therefore, no data is available.
Environmental Science Advisory Committee P131-09
87
Cancer magister, from Victoria and Esquimalt Harbours, 1987-2003. Report 2849. canadian manuscript Report of fisheries and Aquatic sciences, Vancouver, Bc.
Leonards PEG, smit mD, de Jongh AWJJ, van Hattum AGm. 1994. Evaluation of dose-response relatinships for the effects of PcBs on the reproduction of mink (Mustela vison). Report 4-94/6. institute for Environmental studies, Vrije Universiteit, Amsterdam.
mason, c.f. 1989. Water pollution and otter distribution: a review. Lutra 32:97-131.
Olsson, m., and sandegren f. 1983. is PcB partly responsible for the decline of the otter in Europe? in: Reuther c, and R. Rochert. (Eds.), Proceedings, V. international Otter colloquium, Habitat 6, Hankensbuttel, Germany, pp 223-227.
smit, m.D., P.E.G. Leonards, van Hattum, and de Jongh AWJJ. 1994. PcBs in European otter (Lutra lutra) populations. Report R-94/7. institute for Environmental studies, Vrije Universiteit, Amsterdam, The Netherlands.
smit mD, Leonards PEG, madsen AB, van Hattum BGm, murk AJ, de Jongh AWJJ. 1996. Bioaccumulation of PcBs in Danish otter habitats. in: smit mD, Leonards PEG, murk AJ, van Hattum BGm, de Jongh AWJJ, (Eds.). Development of otter-based quality objectives for PcBs: institute for Environmental studies, Vrije Universiteit, Amsterdam, The Netherlands.
incorporated into this project.
acknowledgements:
We would like to acknowledge assistants: Dan Guertin, cait Nelson, and Leo Neitzel for their efforts in participating with fieldwork. references:
city of Victoria. Victoria harbour plan; 2001. Victoria, Bc, canada, 51 pp. Accessed at http://www.victoria.ca/common/pdfs/planning_harbourplan.pdf.
Elliott, J.E., Guertin, DA, Balke JmE. 2008. chlorinated hydrocarbon contaminants in feces of river otters from the southern Pacific coast of canada, 1998-2004. sci Total Environ 397: 58-71.
Guertin, D.A. 2009. Assessment of contaminated exposure, diet, and population metrics of river otters Lontra canadensis along the coast of southern Vancouver island. m.sc. thesis, simon fraser University, Burnaby, British columbia, canada.
Guertin DA, Harestad As, Ben-David m, Drouillard KG, Elliott JE. in Press a. fecal genotyping and contaminant analyses reveals variation in individual river otter exposure to persistent pollutants. Environ Toxicol chem.
Guertin, DA, Harestad As, Elliott, JE. in Press b. summer feeding habits of river otters inhabiting a contaminated coastal marine environment. Northwest sci.
ikonomou mG, fernandez mP, Knapp W, sather P. 2002. PcBs in dungeness crab reflect distinct source fingerprints among harbor/industrial sites in British columbia. Environ sci Technol 36: 2545-2551.
Knapp WD, Grant DL. 2008. Dioxin/furan and polychlorinated biphenyl in Dungeness crab,

Environmental Science Advisory Committee P131-09
88
table 1. Pooling strategy for river otter prey specimens: a) Victoria Harbour, Bc b) Esquimalt Harbour, Bc c) Esquimalt Lagoon and reference site, Bc (2009).1a. Victoria sample No. General Area Prey Group No. specimens in Pool
1 Outer Victoria Harbour cancridae 22 Outer Victoria Harbour Varunidae 53 Outer Victoria Harbour shrimp 54 Outer Victoria Harbour sculpin – small 55 Outer Victoria Harbour sculpin – large 66 Outer Victoria Harbour Blenny – small 137 Outer Victoria Harbour Blenny – large 118 middle Victoria Harbour cancridae 19 middle Victoria Harbour Varunidae 110 middle Victoria Harbour shrimp 1411 middle Victoria Harbour sculpin – small 912 middle Victoria Harbour sculpin – large 813 middle Victoria Harbour Blenny – small 1214 middle Victoria Harbour Blenny – large 1115 Upper Victoria Harbour cancridae 116 Upper Victoria Harbour shrimp 617 Upper Victoria Harbour sculpin – small 618 Upper Victoria Harbour sculpin – large 719 Upper Victoria Harbour Blenny – small 320 Upper Victoria Harbour Blenny – large 4
1b. Esquimalt1 Naden/Dockyard Varunidae 72 Naden/Dockyard shrimp 53 Naden/Dockyard sculpin 24 Upper Esquimalt Harbour cancridae 25 Upper Esquimalt Harbour shrimp 16 Upper Esquimalt Harbour Blenny 57 middle Esquimalt Harbour Varunidae 18 middle Esquimalt Harbour shrimp 59 middle Esquimalt Harbour sculpin 5
10 Outer Esquimalt Harbour cancridae 311 Outer Esquimalt Harbour Varunidae 212 Outer Esquimalt Harbour shrimp 513 Outer Esquimalt Harbour sculpin 5

Environmental Science Advisory Committee P131-09
89
table 1 continued. Pooling strategy for river otter prey specimens: a) Victoria Harbour, Bc b) Esquimalt Harbour, Bc c) Esquimalt Lagoon and reference site, Bc (2009).1c. Lagoon and Referencesample No. General Area Prey Group No. specimens in Pool
1 Esquimalt Lagoon Varunidae 12 Esquimalt Lagoon Blenny 13 Reference cancridae 24 Reference sculpin 35 Reference Blenny – small 56 Reference Blenny – large 5
Figure 1. Total dioxin/furan concentrations (pg/g wet weight) in river otter prey specimens, Victoria Harbour, Bc (2009).
P131-09. setting up traps near Yew Point. P131-09. specimen.

Environmental Science Advisory Committee P131-09
90
0
100
200
300
400
500
600
700
Pc
B-7
7
Pc
B-8
1
Pc
B-1
26
Pc
B-1
69
Pc
B-7
7
Pc
B-8
1
Pc
B-1
26
Pc
B-1
69
Pc
B-7
7
Pc
B-8
1
Pc
B-1
26
Pc
B-1
69
pg/g
(wet
wei
ght)
crab (cancridae)
crab (Varunidae)
shrimp
Blenny
sculpin
Outer-Hb Mid-Hb Upper-Hb
Figure 2. NO-PcB concentrations (pg/g wet weight) in river otter prey specimens, Victoria Harbour, Bc (2009).
Figure 3. PBDE concentrations (pg/g wet weight) in river otter prey specimens, Victoria Harbour, Bc (2009).

Environmental Science Advisory Committee P132-09
91
Environmental Science Advisory Committee
Project leader(s): James miskellyorganization(s): NA address(es): 657 Beaver Lake Rdtelephone no.(s): (250) 477-0490Facsimile: NAEmail(s): [email protected]
PErmit #: P132-09location(S): ROcKY POiNT
Start datE: mAY 2009 comPlEtion datE: JUNE 2009 ProjEct StatUS: cOmPLETE
Surveys for Seaside Bird’s-foot lotus (Lotus formosissimus) at rocky Point
introduction:
seaside bird’s-foot lotus (Lotus formosissimus) was listed as endangered in canada in 2000 and subsequently added to schedule 1 of the species at Risk Act. This plant is presently known from only three locations in canada, one of which is Rocky Point. As part of a reassessment of the species, a complete census of the canadian population was undertaken in 2009 and habitat information was collected. This report summarizes data collected for seaside bird’s-foot lotus at Rocky Point in 2009.
Study area and methods:
All sites at Rocky Point where seaside bird’s-foot lotus had been previously recorded were visited. At each site, a thorough search was made and all individuals of the species were counted. seaside bird’s-foot lotus produces multiple stems that branch below the surface of the substrate, making it sometimes difficult to definitively identify individuals. To account for this uncertainty, population counts are listed as estimates and sometimes include a range. The associated vegetation, general habitat description, and estimate of the area occupied were also recorded, as well as the UTm coordinates of the occurrence.
Between sites where seaside bird’s-foot lotus had been previously recorded, potential habitat was systematically traversed in an attempt to locate new occurrences. if a new occurrence was located, it was described as above.
results: fourteen subpopulations of seaside bird’s-foot lotus were found in three distinct areas of the Rocky Point property: Area B, Bentinck island, and church Point. The species was not found at two sites where it had been previously recorded but was found at one site where it had not been previously recorded. The total population of seaside bird’s-foot lotus at Rocky Point is estimated at 255 – 365 mature individuals (Table 1).
seaside bird’s-foot lotus was found in maritime meadows, vernal seepage areas, open woodlands, and one small wetland. commonly associated native species were california oatgrass (Danthonia californica), red fescue (Festuca rubra), and yellow monkey flower (Mimulus guttatus). commonly associated non-native species were common velvet grass (Holcus lanatus), sweet vernal grass (Anthoxanthum odoratum), and scotch broom (Cytisus scoparius). The tree canopy ranged from
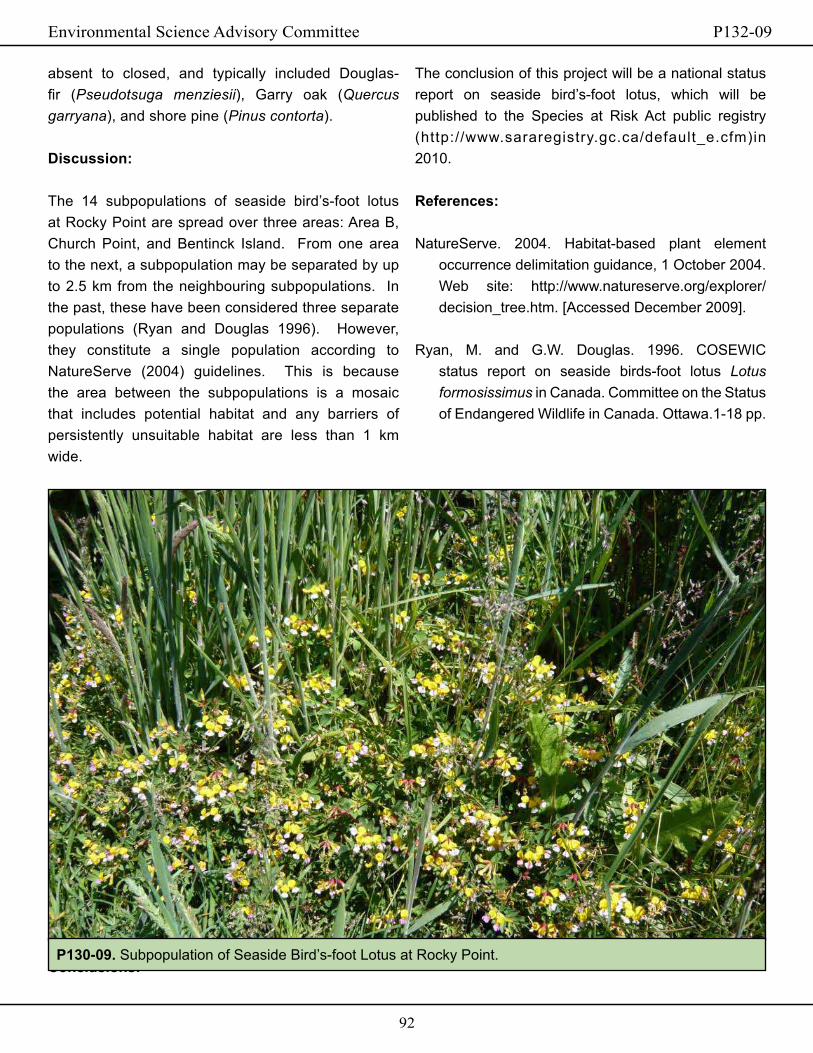
Environmental Science Advisory Committee P132-09
92
The conclusion of this project will be a national status report on seaside bird’s-foot lotus, which will be published to the species at Risk Act public registry (http://www.sararegistry.gc.ca/default_e.cfm)in 2010. references:
Natureserve. 2004. Habitat-based plant element occurrence delimitation guidance, 1 October 2004. Web site: http://www.natureserve.org/explorer/decision_tree.htm. [Accessed December 2009].
Ryan, m. and G.W. Douglas. 1996. cOsEWic status report on seaside birds-foot lotus Lotus formosissimus in canada. committee on the status of Endangered Wildlife in canada. Ottawa.1-18 pp.
absent to closed, and typically included Douglas-fir (Pseudotsuga menziesii), Garry oak (Quercus garryana), and shore pine (Pinus contorta).
discussion:
The 14 subpopulations of seaside bird’s-foot lotus at Rocky Point are spread over three areas: Area B, church Point, and Bentinck island. from one area to the next, a subpopulation may be separated by up to 2.5 km from the neighbouring subpopulations. in the past, these have been considered three separate populations (Ryan and Douglas 1996). However, they constitute a single population according to Natureserve (2004) guidelines. This is because the area between the subpopulations is a mosaic that includes potential habitat and any barriers of persistently unsuitable habitat are less than 1 km wide.
conclusions:P130-09. subpopulation of seaside Bird’s-foot Lotus at Rocky Point.

Environmental Science Advisory Committee P133-09
93
Environmental Science Advisory Committee
Project leader(s): matt fairbarns organization(s): Aruncus consultingaddress(es): 2130 Kings Road Victoria Bc V8s 4L8telephone no.(s): (250) 592-8752Facsimile: NAEmail(s): [email protected]
PErmit #: P133-09 location(S): cfmETR AND ROcKY POiNT
Start datE: 01 mAY 2009 comPlEtion datE: 31 DEcEmBER 2009 ProjEct StatUS: cOmPLETE
Foothill Sedge and lindley’s False Silverpuffs critical Habitat mapping
introduction: foothill sedge (Carex tumulicola) is a nationally endangered plant species (cOsEWic 2008a), known to occur at Rocky Point and Albert Head. Lindley’s false silverpuffs (Uropappus lindleyi) is a nationally endangered plant species (cOsEWic 2008b), known to occur at cfmETR. Both species have been proposed for listing under the species at Risk Act (sARA). Under sARA, a recovery strategy must be prepared within 12 months of a species being listed as endangered. The recovery strategy must map and describe critical habitat according to the best available knowledge. The sARA responsible agency (Parks canada) awarded matt fairbarns with a contract to prepare draft recovery strategies for both species for 2009/10. To do this effectively, he conducted field surveys during the flowering/fruiting season (may-June 2009).
Study area and methods:
Known occurrences of each species were examined in the field. The number of mature individuals was counted at each site and notes were taken describing
the nature of the area occupied by each occurrence as well as the surrounding area essential to support the existing plants. The location of each patch was mapped using a hand-held GPs unit as was the extent of essential supporting habitat.
results: Lindley’s false silverpuffs at cfmETR: in 2009, two subpopulations of Lindley’s false silverpuffs were found at cfmETR. Together, they contained 152 mature individuals. The eastern subpopulation occupied 72 m2 and was enclosed within a 2,293 m2 polygon which included the supporting habitat. The western subpopulation occupied 154 m2 and was enclosed within a 1,498 m2 polygon which included the supporting habitat.
foothill sedge at Albert Head: in 2009, two subpopulations of foothill sedge were examined at Albert Head. The inland subpopulation consisted of four low vigour tussocks. The shoreline subpopulation, which was far more vigorous, consisted of 5-10 tussocks.

Environmental Science Advisory Committee P133-09
94
subpopulations. most of the subpopulations are also so small that they are likely prone to loss through chance events. The four subpopulations examined in 2009 under permit 133-09 are all small. The largest of them was the “Birder’s Loop” subpopulation which consisted of 79 tussocks. The “Birder’s Loop” subpopulation is suffering from invasive species and from excessive shading, the result of forest encroachment. The other subpopulations are also threatened by invasive species.
foothill sedge at Rocky Point: in 2009, several subpopulations of foothill sedge were examined at Rocky Point. The subpopulations under permit 133-09 included:1.The Whirl Bay subpopulation consisted of three tussocks.2.The manor Point subpopulation consisted of seven tussocks.3.The “Birder’s Loop” subpopulation, on the east shores of Rocky Point, consisted of 79 tussocks.4.The Garry Oak woodland subpopulation, along the eastern perimeter road, consisted of three tussocks.5.The wet meadow subpopulation, just east of cfAD, consisted of 16 tussocks.
discussion:
Lindley’s false silverpuffs at cfmETR: The cfmETR population of Lindley’s false silverpuffs was discovered several years ago when two subpopulations were noted, but its location was incorrectly described and the population was believed to have disappeared. it was rediscovered during the course of surveys for california Hedge-parsley in 2008, when a single subpopulation was encountered. The 2009 surveys re-examined the subpopulation discovered in 2008 and found another subpopulation. it cannot be determined if the two subpopulations found in 2008-9 correspond to the two subpopulations previously reported. This species, an annual which is difficult to detect when not in flower and therefore easily overlooked, may occur elsewhere on the property.
foothill sedge at Albert Head: The foothill sedge population at Albert Head consists of two subpopulations. Both are so small that they are likely prone to loss through chance events and the inland population is further disadvantaged because it is growing in a shaded environment which appears to be causing a decline in vigour.
foothill sedge at Rocky Point: The foothill sedge population at Rocky Point consists of numerous
P133-09. Lindley’s false silverpuffs flower.
P133-09. Lindley’s false silverpuffs fruit.

Environmental Science Advisory Committee P133-09
95
conclusions:
There are extant populations of Lindley’s false silverpuffs at cfmETR and foothill sedge at Albert Head and Rocky Point. Draft recovery strategies, containing a map and description of areas of proposed critical habitat on DND lands, will be proposed for inclusion within the species At Risk Registry. This includes information on the distribution of foothill sedge on portions of Rocky Point not covered under this permit. information on the nature and location of critical habitat for these species will also be submitted to DND. similar information has been collected for occurrences of these species on other federal lands as well as on some private lands.
The species at risk act requires that federal agencies provide effective protection for species at risk on federal lands. if Lindley’s false silverpuffs and/or foothill sedge are added to the list of species protected under the federal species at Risk Act then an Action Plan will be prepared detailing management actions necessary for their protection on federal lands such as DND properties.
acknowledgements:
The canadian forest service (Andrea schiller) and Department of National Defence (Tracy cornforth) supported this project. Kevin Barnard provided assistance in the field at Rocky Point.
references:
cOsEWic. 2008a. cOsEWic assessment and status report on the foothill sedge Carex tumulicola in canada. committee on the status of Endangered Wildlife in canada. Ottawa. vi + 37 pp. (www.sararegistry.gc.ca/status/status_e.cfm).
cOsEWic. 2008b. cOsEWic assessment and status
report on the Lindley’s false silverpuffs Uropappus lindleyi in canada. committee on the status of Endangered Wildlife in canada. Ottawa. vii + 22 pp. (www.sararegistry.gc.ca/status/status_e.cfm).
P133-09. foothill sedge at Rocky Point.

Environmental Science Advisory Committee P134-09
96
Environmental Science Advisory Committee
Project leader(s): marty Kranabetter and Heather Klassen (née West)organization(s): British columbia ministry of forests and Rangeaddress(es): 4300 North Rd, Victoria, B.c., V8Z 5J3 & 2100 Labieux Road, Nanaimo, B.c., V9T 6E9telephone no.(s): (250) 952-4438, (250) 751-7114Facsimile: (250) 952-4119, (250) 751-7101Email(s): [email protected] and [email protected]
PErmit #: P134-09location(S): ROcKY POiNT, HEALs RifLE RANGE, ROYAL ROADs AND NANAimO RifLE RANGE
Start datE: mAY 2009 comPlEtion datE: mARcH 2010ProjEct StatUS: 2009-2010
old Growth Stand Structure
introduction:
The coastal Douglas-fir (cDf) moist maritime (mm) subzone is a small biogeoclimatic unit located on southeastern Vancouver island, the adjacent mainland, and the Gulf islands. The cDf has among the lowest percentages of unlogged, old-growth forest of any biogeoclimatic units in the province (macKinnon and Vold 1998). information on late-seral forest communities in the cDf is quite limited, as is data on old-growth stand structure (only three of 541 cDf plots within the provincial classification database have structural data) and quantity of coarse woody debris (cWD). Department of National Defense cfB Esquimalt lands provide one of the few opportunities to collect this information. The objective of our work is to locate and describe suitable late-seral forests on DND properties using the biogeoclimatic ecosystem classification (BEc) system, and to collect benchmark measures of old forest structure, including species composition, coarse woody debris and snags.
Study area and methods:
sites were located using forest cover and ecosystem maps of the properties and verified in the field. sample plots 20m X 20m (400m2) were subjectively located to characterize ecosystem and stand types, and at each site we dug a small soil pit (50 x 50 cm wide, and 50-75 cm deep) for soil descriptions. We recorded site location (lat/long), aspect, slope position and elevation, vegetative cover by species, soil horizons, soil colour and texture, coarse fragment content, moisture and nutrient regime, successional status and other site features as listed in field manual for Describing Terrestrial Ecosystems (1998).
One variable radius cruise plot was established for each plot. An appropriate prism basal area factor (BAf) was selected to include seven to 11 trees in each cruise plot. All coniferous and deciduous trees greater than 7.5 cm diameter at breast height (DBH) were recorded: living (both standing and down), dead useless, and dead potential. The tree species, DBH, height, tree class, pathological remarks, and crown class were recorded for each tree in the cruise plot.

Environmental Science Advisory Committee P134-09
97
stand structure of the forests is often characterized by a small component of large diameter veteran trees, likely many hundreds of years old, amongst a larger component of smaller diameter maturing trees. This structure suggests relatively frequent ground fires, perhaps every 100 years or so, that were not severe enough to cause complete tree mortality. site productivity covered a very wide gradient; tree heights of the dominant canopy, for example, range from approximately 25 m on the poorest, driest 02 sites to over 60 m on the moist, rich 06 ecosystems. Tree species diversity also tends to increase with soil fertility (the 04 and 06 site series), and includes Douglas-fir (Pseudotsuga menziesii), Grand fir (Abies grandis), western hemlock (Tsuga heterophylla), western red cedar (Thuja plicata), and big leaf maple (Acer macrophyllum). Average coarse woody debris loads across the 15 plots is 174 m3 ha-1, but range from as little as 21 m3 ha-1 on the poorest sites to 741 m3 ha-1 on the most productive sites.
conclusions:
The plant and soil data from these 15 plots will be part of a larger report on dry coastal forest ecosystems of Bc, and eventually incorporated into a new edition of the coastal BEc fieldguide. modeled projections of future climatic conditions suggest that the extent of cDfmm will expand (e.g., Hamann and Wang 2006); areas now in cDf will experience climates that do not currently exist in the coast forest Region. These quantitative associations to existing site and vegetation conditions will help form the basis for detection of reorganization of ecosystems with climate change (campbell et al. 2009). Overall, classification of these forests supported by structural data will improve our ability to rank occurrences of late successional forest for conservation value and to conduct effective planning for representation at a landscape-level (e.g., in response to requirements of land use plans).
A follow up study will be proposed for 2010 to examine soil nitrogen (N) dynamics in the temperate forests
Two coarse woody debris transects were established for each site. Each 24 m transect began at plot centre, one at a random bearing, and one at that same bearing plus 90°. Each piece of wood the transect crosses was recorded for species, length, diameter, decay class, tilt, and height above ground.
results:
A total of 15 plots appropriate for BEc classification were located on three DND properties in the Victoria area (Royal Roads, Rocky Point and Heal’s Rifle Range), but no suitable plots were found at the Nanaimo Rifle Range. site, soil and plant data collected from these plots are summarized in Tables 1 and 2. mensuration and cWD data were compiled using a timber cruising (BcmOf 2000) and slash loading program (Deas and macadam 1985), respectively, and presented in Table 3. All plot data are housed within the provincial BEc database; requests for access to full plot data are made online at http://www.for.gov.bc.ca/hre/becweb/resources/information-requests/index.html.
discussion:
in our classification work we find reasonable correlations between the observed plant communities on DND lands with those described in the coast field Guide (Green and Klinka 1994), including the 02 fdPl – Arbutus, the 03 fd – Oniongrass, the 01 fd – salal, the 04 fdBg – Oregon grape, the 05 cwfd – Kindbergia and the 06 cwBg – foamflower. The arrangement of the plant associations via moisture and nutrient regime on the edaptopic grid will likely change from the current version, however. The soil profiles are unusual for coniferous forests in having an acidic, dark brown, organic-rich horizon at the surface, with little overlying forest floor (perhaps due to introduced earthworms). This mineral horizon is characterized as an Ah(f) (Broersma and Lavkulich 1980), and the soils typically classified either as sombric Humo ferric Podzols (a B horizon of 7.5YR or redder) or Orthic sombric Brunisols.

Environmental Science Advisory Committee P134-09
98
fsP Year-end report.
Deas, A. and macadam, A.m. 1985. A computer program for calculating fuel loading and consumption for prescribed fire studies. Bc min. for., Victoria Bc. Res. Rep. 85004-PR.
Green, R.N., and Klinka, K. 1994. A field guide to site identification and interpretation for the Vancouver forest Region. Bc ministry of forests, Victoria, Bc. field Handbook No. 28.
Hamann, A. and Wang, T. 2006. Potential effects of climate change on ecosystem and tree species distribution in British columbia. Ecology 87: 2773-2786.
Kranabetter, J.m., and macKenzie, W.m. 2010. contrasts among mycorrhizal plant guilds in foliar nitrogen concentration and δ15N along productivity gradients of a boreal forest. Ecosystems 13: 108-117.
macKinnon, A., and Vold, T. 1998. Old-growth forests inventory for British columbia, canada. Nat. Areas J. 18: 309-318.
of the cDf (in part incorporating these DND sites), in particular comparing the balance between organic and inorganic N supply that can influence biotic communities under colder, less productive climates (Kranabetter and macKenzie 2010).
references:
Bc ministry of Environment, Lands, and Parks and Bc ministry of forests. 1998. field manual for Describing Terrestrial Ecosystems. Land management Handbook No. 25. Bc min. for. and Bc min. Environ., Lands and Parks, Victoria, Bc.
Bc ministry of forests. 2000. cruising manual. Revenue Branch, Victoria Bc.
Broersma, K., and Lavkulich, L.m. 1980. morphology and classification of some dark-coloured soils of Vancouver island, British columbia. can. J. soil sci. 60: 747-755.
campbell, E., saunders, s., macKillop, D., and Haeussler, s. 2009. Towards a framework for operational indicators of ecological resilience. fiA-
P134-09. Royal Roads University - coastal Douglas fir moist maritime biogeoclimatic zone.

Environmental Science Advisory Committee P134-09
99
table 1. site and soil properties for the BEc plots located on DND properties
Plot No. 08-1047 08-1048 08-1049 08-1050 08-1051 08-1052 08-0974 08-0975
Latitude48o 26’11.5”
48o 26’02.4”
48o 26’03.8”
48o 26’06.5”
48o 26’02.9”
48o 26’04.5”
48o 32’51.3”
48o 32’54.9”
Longitude123o 28’08.3”
123o 27’48.9”
123o 27’57.6”
123o 28’39.2”
123o 28’44.7”
123o 28’54.2”
123o 27’53.9”
123o 27’54.6”
Property Royal Roads
Royal Roads
Royal Roads
Royal Roads
Royal Roads
Royal Roads
Heal’s Range
Heal’s Range
BEc classification cD-fmm01
cD-fmm01
cDf 01/04
cD-fmm04
cD-fmm06
cD-fmm04
cD-fmm01
cD-fmm03
moist/nutrient regime 3 B 3 c 4 c 4 D 5 E 4 D 4 c 2 B
SiteElevation (m) 60 50 40 90 100 50 129 151slope (%) 15 5 15 0 0 <5 24 13Aspect (degrees) 200 170 200 999 999 999 99 249mesoslope a mD mD mD LV LV LV mD UPHumusDepth (cm) 7 6 2 1 2 3 2 2classification b TD RD VL VL VL VL VL VLmineral soilDominant texture c Ls sL sL sL si sL sL LsDrainage class d r w w w m w w rcoarse fragment (%) 15 10 0 20 0 50 30 50
Rooting depth (cm) 55 55 50 40 50 50 50 40classification e O.DYB sm.HfP sm.HfP sm.HfP sm.HfP sm.HfP sm.HfP O.sBnotes:a LV = level, UP = upper, mD = middleb TD = leptomoder, RD = mormoder, VL = vermimull, HR = hemimorc Ls = loamy sand, sL = sandy loam, si = siltd r = rapidly drained, w = well drained, m = moderately well drainede O.DYB = orthic dystric brunisol, sm.HfP = sombric humo ferric podzol, O.sB = orthic sombric brunisol, O.fHP = orthic ferro humic podzol

Environmental Science Advisory Committee P134-09
100
table 1 continued. site and soil properties for the BEc plots located on DND properties
Plot No. 08-0976 08-0977 08-1088 08-1089 08-1090 08-1091 08-1092
Latitude48o 32’ 43.9”
48o 32’ 42.8”
48o 19’ 06.2”
48o 19’ 04.1”
48o 19’ 54.9”
48o 19’ 00.0”
48o 19’ 17.0”
Longitude123o 27’28.0”
123o 27’29.2”
123o 34’48.0”
123o 34’48.0”
123o 35’00.4”
123o 34’57.1”
123o 34’23.4”
Property Heal’s Range
Heal’s Range
Rocky Point
Rocky Point
Rocky Point
Rocky Point
Rocky Point
BEc classification cD-fmm06
cD-fmm04
cD-fmm02
cD-fmm01
cD-fmm06
cD-fmm05
cD-fmm03
moist/nutrient regime 5 D+ 4+ c+ 1 B 3 c 5 D+ 4+ c+ 2 B
SiteElevation (m) 69 96 100 90 70 80 45slope (%) 47 14 3 194 10 30 0Aspect (degrees) 12 21 999 23 300 210 999mesoslope LW mD cR mD mD mD LVHumusDepth (cm) 2 2 8 2 4 6 4classification VL VL RD RD VL VL HRmineral soilDominant texture sL sL siL siL sL fsL fsLDrainage class w m r r m w rcoarse fragment (%)
20 30 60 55 20 50 10
Rooting depth (cm) 60 50 65 70 75 50 30classification O.sB O.sB O.HfP O.fHP O.fHP sm.HfP sm.HfP
P134-09. Plot 08-1052 at Royal Roads: cDfmm P134-09. Heals Rifle Range: cDfmm.

Environmental Science Advisory Committee P134-09
101
table 2. Plant species and % cover by canopy, shrub, herb and moss layer.
Plant species 08-1047 08-1048 08-1049 08-1050 08-1051 08-1052 08-0974 08-0975
canopy layerPseudotsuga menziesii
85 65 40 85 25 60 45
Thuja plicata 4 55 25Abies grandis 7 15 3 15 15 30 3Tsuga heterophylla 2 5 5Acer macrophyllum 55Arbutus menziesii 5Shrub layerGaultheria shallon 42 65 80 30 4 8 40 20mahonia nervosa 42 5 3 30 9 60 45 15Vaccinium parviflorum
2 1 4 3
Rosa gymnocarpa 1 2 2 3 < 0.1 6 2Holodiscus discolor 4 2 4 26 < 0.1 3 7Herb layerRubus ursinus 2 3 8 0.5 < 0.01 < 0.01 < 0.01 1Linneae borealis 2 0.5 1 6 2Polystichum munitum
< 0.1 7 2 55 7 < 0.01 < 0.01
Trientalis latifolia 1 7 3 1 2Achlys triphylla 15 15melica subulata 0.5 0.1 < 0.01 15moss layerHylocomium splendens
1 0.5 25 5 10 7
Kindbergia oregana 4 1 0.5 2 15 35 80Rhytidiadelphus triquetrus
1 0.5 3 3
table 3. stand mensuration and coarse woody debris for the BEc plots located on EsAc properties
08-1047 08-1048 08-1049 08-1050 08-1051 08-1052 08-0974 08-0975stand volume (m3 ha-1) 1411 994 1064 1040 1488 1433 555 732Basal area (m2 ha-1) 126 108 96 84 120 96 66 104codominant height (m) 41.1 42.6 48.5 46.6 55.6 49.2 35.5 35.9No. of stems per ha 418 369 121 326 186 303 339 500cWD volume (m3 ha-1) 67 89 208 29 41 138 149 21

Environmental Science Advisory Committee P134-09
102
table 2 continued. Plant species and % cover by canopy, shrub, herb and moss layer.
Plant species 08-0976 08-0977 08-1088 08-1089 08-1090 08-1091 08-1092canopy layerPseudotsuga menziesii
50 5 70 60 6 70 80
Thuja plicata 6 70Abies grandis 10 2 35 42 40Tsuga heterophylla 10 35 8Acer macrophyllum 5 1Arbutus menziesii 10Shrub layerGaultheria shallon 50 20 93 32 98 72mahonia nervosa 4 30 2 3 2 6Vaccinium parviflorum
2 < 0.01 < 0.01 2 2
Rosa gymnocarpa 1 < 0.01 3Holodiscus discolor < 0.01 2Herb layerRubus ursinus < 0.01 0.5Linneae borealis 1 < 0.01 0.5Polystichum munitum
65 4 2 3 60 1 2
Trientalis latifolia 1 2Achlys triphylla 2 8melica subulata 2 0.5moss layerHylocomium splendens
2 8 44 5
Kindbergia oregana 3 2 1 0.5 1 4Rhytidiadelphus triquetrus
44 1 8
table 3 continued. stand mensuration and coarse woody debris for the BEc plots located on EsAc properties
08-0976 08-0977 08-1088 08-1089 08-1090 08-1091 08-1092stand volume (m3 ha-1) 1275 528 517 1346 957 1073 672Basal area (m2 ha-1) 112 48 88 132 70 84 80codominant height (m) 66.4 43.5 24.5 37.8 45.8 42.6 30.5No. of stems per ha 545 203 530 351 271 267 463cWD volume (m3 ha-1) 84 198 94 221 741 417 107

Environmental Science Advisory Committee P135-09
103
Environmental Science Advisory Committee
Project leader(s): Nicole Kroeker and Aimée Pelletierorganization(s): Parks canada Agencyaddress(es): fort Rodd Hill National Historic site of canada, 603 fort Rodd Hill Road, Victoria, B.c. V9c 2W8telephone no.(s): (250) 478-5118Facsimile: (250) 478-2816Email(s): [email protected] or [email protected]
PErmit #: P135-09location(S): ROcKY POiNT
Start datE: 10 JUNE 2009comPlEtion datE: 7 JULY 2009 ProjEct StatUS: cOmPLETE
introduction:
To be effective and successful, conservation and recovery of rare plants requires a multi-faceted approach. for some species, such as Lotus formosissimus (seaside birds-foot lotus), an endangered species listed under schedule 1 of the species at Risk Act (sARA), habitat restoration and protection are insufficient on their own for species recovery.
L. formosissimus is a sprawling perennial, 20-50 cm long with compound leaves. it has 3 to 9 yellow and pink to purple pea-like flowers occurring in clusters along the stem. it occurs in deep soil, mesic, maritime meadows associated with Garry oak ecosystems (Garry Oak Ecosystem Recovery Team 2003; Parks canada Agency 2006; fairbarns 2008). The five known extant populations of L. formosissimus in canada are on southern Vancouver island and small nearby islands. Threats to population persistence at these sites include habitat degradation and competition due to incursions of alien invasive species, fire suppression and trampling due to public access (Ryan and Douglas 1996).
it is highly unlikely that propagules of this species will re-establish at other sites in a timely manner without human intervention (i.e., translocation). Establishing new populations is necessary to provide robustness in the face of stochastic environmental changes and to attain a distribution of L. formosissimus throughout its historic range including the Victoria area. The canadian populations of L. formosissimus are disjunct from the nearest populations in Washington state and one canadian population has become extirpated (Parks canada Agency 2006).
This project is specifically designed to enhance the recovery of L. formosissimus and to meet the recovery goals laid out in the Recovery strategy for multi-species at Risk in maritime meadows Associated with Garry Oak Ecosystems in canada (Parks canada Agency 2006). specifically, the recovery strategy establishes the following goal: “To attain viable and self-sustaining populations of seaside birds-foot lotus throughout its historic range with a minimum of at least six populations by: 1) maintaining all five extant populations/subpopulations, increasing small populations and conserving larger populations at their current levels of abundance; and,
Seed collection of Lotus formosissimus for an Experimental translocation Project

Environmental Science Advisory Committee P135-09
104
Study area and methods:
The L. formosissimus population at church Hill, Rocky Point is the largest and healthiest population within close proximity of fRHNHs (fairbarns 2008). it was therefore selected as the most suitable donor population for the translocation project. With over 200 flowering shoots, the size of the population at church Hill, Rocky Point and the species’ protected status suggest that it has an excellent probability of persistence. most of the plants are vigorous and produce abundant flowers and fruit. A sARA permit was obtained from Environment canada prior to the commencement of any work at church Hill, Rocky Point. seeds were collected when seed pods were beginning to split. information collected included the name of collector, collection date, collection site, number of seeds collected and number of plants from which seed was collected. GPs coordinates as well as photographs of each collection site were recorded and have been submitted to EsAc.
in order to maximize genetic diversity of the new population, seed was collected from a large number of donor plants ranging from small to large plants. Every precaution was taken to minimize negative effects on the L. formosissimus population at church Hill, Rocky Point. To minimize viability and germination depression of donor plants, no more than one capsule in 20 were harvested. However, all seeds from a capsule were collected. seed capsules on the ground were not collected as they are more susceptible to contamination from pathogens. To prevent introducing new weeds, pathogens or diseases to Rocky Point, all clothing, gear, and tools were visually inspected to ensure they were free of other seeds and soil. seed capsules were collected using secateurs sterilized with a 10% bleach solution. As seed collection was carried out in under an hour by a single person, and seeds were collected while standing on a trail or rocks, no L. formosissimus plants were trampled and soil compaction was negligable. All effort was made to
2) Establishing one additional population containing at least 100 flowering individuals per year”.
This project addresses the second goal above by aiming to establish an experimental population of L. formosissimus at fort Rodd Hill National Historic site (fRHNHs) while retaining the genetic integrity and diversity of the species. Habitat suitable for the establishment of a new population of L. formosissimus was identified in five areas all located on protected federal land at fRHNHs (fairbarns 2008). This project has been approved by the Plants at Risk Recovery implementation Group of the Garry Oak Ecosystem Recovery Team (GOERT) and a detailed translocation plan has been developed. The project involves seed collection at a donor site at church Hill, Rocky Point, ex situ propagation of seedlings at a controlled facility, transplanting propagated seedlings into experimental plots at recipient sites, monitoring of seedling survival, and possible exotic plant control.
Translocation of L. formosissimus will benefit the recovery of this species in a number of ways. The translocation will address key knowledge gaps; a greater understanding of the biology and ecology of the species will not only inform future translocation efforts, but may also help determine management options for extant populations and help determine the causes of extant population declines. The project will also advance the science of translocation for other plant species at risk. The specific project goals include:1. to increase what is known about the biology, ecology and demography of L. formosissimus through translocation experiments;2. to develop appropriate habitat management techniques for restoring and maintaining the habitat of translocated L. formosissimus populations;3. to guide management decisions regarding translocation so they are based on sound scientific background; and,4. to develop the science of translocation for rare plant species through careful documentation and publication of all results of the project.

Environmental Science Advisory Committee P135-09
105
conclusions:
At this time, no additional collections or activities are planned for Rocky Point under this project. The seeds collected from church Hill, Rocky Point were immediately cleaned under a dissecting microscope and have been sown at a controlled greenhouse facility for ex situ propagation. seedlings will be transplanted in late fall 2010 to recipient sites at fRHNHs previously identified as most suitable.
The expected end products of this project includes the successful propagation of a sufficient number of L. formosissimus seedlings for translocation to fRHNHs, transplanting the propagated seedlings into experimental plots at the recipient sites, and subsequent monitoring of the experimental population. Various reports summarizing the progress and outcome of the translocation project will be developed. This work may be presented at scientific workshops and may be submitted for publication in a peer-reviewed journal. All data obtained under this project will be shared with the B.c. conservation Data centre (cDc), Garry Oak Ecosystem Recovery Team (GOERT), and if requested, DND.
acknowledgements:
collection of L. formosissimus seed at church Hill, Rocky Point was undertaken by matt fairbarns, a local rare plant botanist and consultant. Ex situ propagation is being undertaken at the Pacific forestry centre under the supervision of Rob Hagel.
references:
fairbarns, m. 2008. Report on potential critical habitat in Garry oak ecosystems. Prepared for the Ecosystems Branch, Bc ministry of Environment, Victoria, B.c.
step only on common, weedy species when traveling to and from the site.
results: seeds were collected from a total of 27 plants of various sizes from the L. formosissimus population at church Hill, Rocky Point on 7 July 2009. A total of 471 seeds were collected from 50 seed capsules. it was estimated that there were >4,000 capsules in the population at the time of seed collection. most fruits were green at the time of collection, but numerous ripe fruits were also noted. flowers were observed on a small number of plants.
discussion:
The science of translocation for plant species at risk is still in its infancy. Translocation is an ambitious, long-term undertaking and many translocations have failed in the past. Translocations have the potential to cause unintended harm to species at risk and to habitat, especially if they are poorly planned. Translocations may be expensive and often have low success rates; they may use significant amounts of the limited resources available for species at risk recovery (maslovat 2007). for these reasons, this translocation project and seed collection activity have been carefully planned to take into account the amount of seed required for the translocation, the amount of non-viable seed, germination percentages, losses during propagation, and the final number of plants required. The amount of seed collected accounts for far less than 1 % of the annual seed production of the L. formosissimus population at church Hill, Rocky Point. for this reason, the translocation project is not expected to undermine the conservation and protection of extant populations of L. formosissimus, and is expected to enhance the status of the canadian population as a whole.
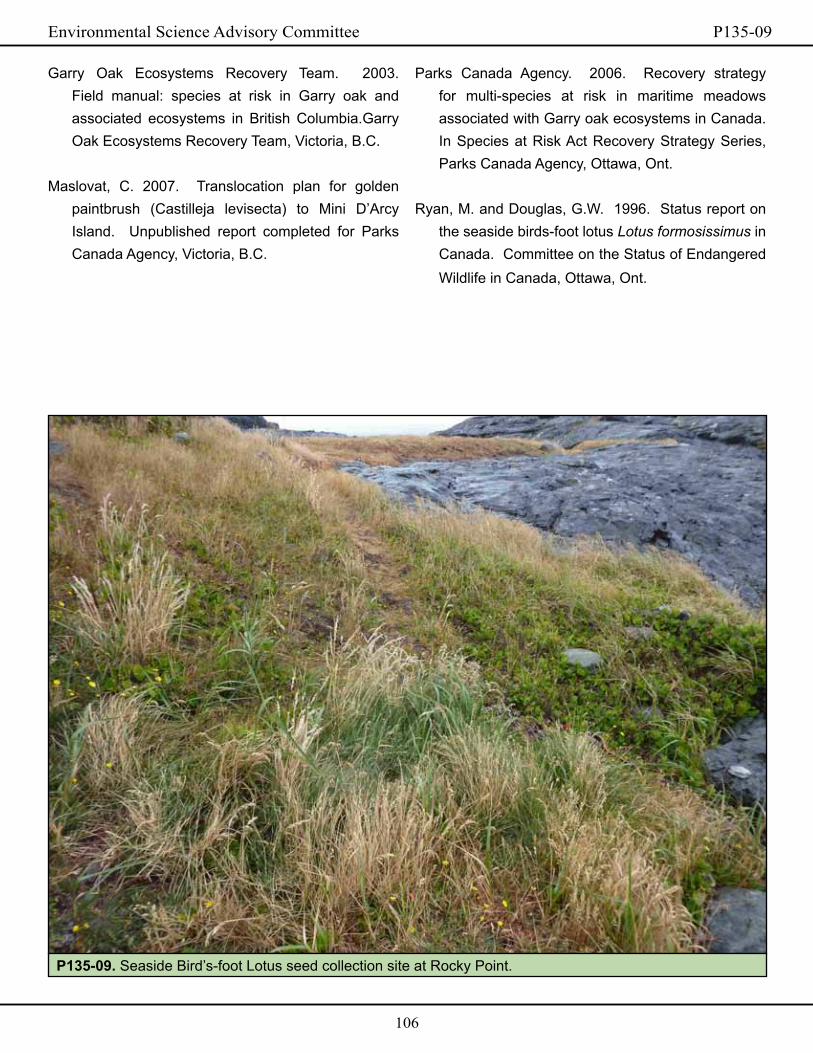
Environmental Science Advisory Committee P135-09
106
Parks canada Agency. 2006. Recovery strategy for multi-species at risk in maritime meadows associated with Garry oak ecosystems in canada. in species at Risk Act Recovery strategy series, Parks canada Agency, Ottawa, Ont.
Ryan, m. and Douglas, G.W. 1996. status report on the seaside birds-foot lotus Lotus formosissimus in canada. committee on the status of Endangered Wildlife in canada, Ottawa, Ont.
Garry Oak Ecosystems Recovery Team. 2003. field manual: species at risk in Garry oak and associated ecosystems in British columbia.Garry Oak Ecosystems Recovery Team, Victoria, B.c.
maslovat, c. 2007. Translocation plan for golden paintbrush (castilleja levisecta) to mini D’Arcy island. Unpublished report completed for Parks canada Agency, Victoria, B.c.
P135-09. seaside Bird’s-foot Lotus seed collection site at Rocky Point.

Environmental Science Advisory Committee P136-09
107
Environmental Science Advisory Committee
Project leader(s): Dr. Purnima Govindarajuluorganization(s): B.c. ministry of Environmentaddress(es): PO Box 9338 stn Prov Govt, Victoria, B.c. V8W 9m1telephone no.(s): (250) 387-9755Facsimile: (250) 356-9145Email(s): [email protected]
PErmit #: P136-09location(S): ALDERGROVE
Start datE: AUGUsT 25 2009 comPlEtion datE: DEcEmBER 31 2009 ProjEct StatUS: 2009-ONGOiNG
assessing Potential for Population augmentation of Endangered oregon Spotted Frogs: radio-telemetry to determine immediate Fate of captive reared Frogs released on site
introduction:
maintenance Detachment Aldergrove (Aldergrove) is one of only four known breeding sites for Oregon spotted frog (Osf, Rana pretiosa) in canada. in 1997, the Aldergrove site had the largest population of Osf. since then this population has declined to a point where successful breeding has not been detected over the past three years. Other than an ambitious wetland rehabilitation effort to improve breeding habitat for Osf, this site has not undergone many changes. Therefore, it is very important to understand why this population of Osf has declined so dramatically. it is thought that the Bullfrog (Rana catesbiana) population has increased in the past few years and that either predation from Bullfrogs or disease (Batrachochytrium dendrobatidis - Bd) transmission from Bullfrogs is the primary reason for the decline of Osf at this site. We need detailed information on the fate and habitat use by captive reared and released Osf at the Aldergrove site to test these hypotheses. if all the released Osf are predated by Bullfrogs or succumb to disease soon after release, then release of hundreds of captive reared frogs will not be effective in recovering the Osf population at this site. However, if the captive-reared and radio-
telemetered frogs survive, they will provide us with valuable data on habitat use by the frogs that will then be used in plans for the recovery of this species at the Aldergrove site. This study was designed to be a pilot project to test radio-telemetry methods (transmitter models, methods of attachment, receivers) and to assess logistic difficulties in conducting such a study at the Aldergrove site.
The objectives of the study were to: 1) Assess radio-telemetry methods and field logistics for Osf released into Aldergrove; 2) Assess mortality factors of captive reared and released Osf, in particular predation by bullfrogs and impact of the disease Bd; 3) Assess patterns of habitat use, threats, and over-wintering sites of Osf to aid in the delineation of critical habitat and provide information for species recovery plans.
Study area and methods:
We fitted juvenile 2008 frogs and metamorphic 2009 frogs with small transmitters from Holohil (figure 1). The models were selected to be within 5 to 10% of the average body weight of the frogs (Table 1).
Environmental Science Advisory Committee P136-09
108
and did not produce useful information. The remaining frogs were tracked for a minimum of two weeks providing useful habitat use and survival information. One frog was brought back into captivity to recover from chafe. flexiflex belly belts were used on the replacement frogs and did not cause further chafing.
Tracking frogs to their overwintering sites posed logistical challenges. Water levels rose over 90cm in late september and stayed high through December. in addition, ice cover on the wetland in December caused very dangerous conditions and surveys were suspended for 4 weeks until thaw. Deep water, cold temperatures and the frogs’ escape behavior (diving and staying under water for long periods) posed significant challenges to retrieving the frogs and replacing transmitters.
Objective 2: Fate of captive reared and released frogsThere were two clear instances of mortality in the nine frogs that were tracked (22%). frog f28 was found dead but the cause of mortality is not known. The transmitter of a second frog (f34) was found on top of a pile of crayfish shells and likely represents predation by an otter. None of the frogs tracked exhibited symptoms of the disease Bd. Predation by Bullfrogs was not recorded in our study, although the fates of 4 of the nine tracked frogs are as yet unknown.
Objective 3: Habitat use of Oregon spotted frogsData analysis of this part of the project is ongoing and so only an observational summary is presented in this report. Overall, Osf occupied diverse habitat, including floating mats of reed canary grass, hardhack islands, detritus in shallow and deep water, and within beaver dams. At first, the three metamorphs (mV09) were consistently found in tunnels within dense hardhack patches or embankments. frogs remained in very specific locations until they were captured for belt replacement, after which they moved long distances in short periods. frogs preferred habitats with complex emergent vegetation near open water with submergent
Transmitters were initially attached using belly belts of silk ribbon as tested by Dr. marc Hayes in Oregon. However, these belts caused chafe injuries and were replaced with belts made of flexifix, a flexible plastic burn dressing. This attachment had been successfully tested by Dr. Karl Larsen on Great Basin spadefoots (spea intermontana).
frogs were released at the north end of the Aldergrove wetland on 23 september 2009 and tracked as long as transmitters were expected to function (figure 2). On smaller frogs (mV09, mV08) expected transmitter life was short (21 and 28 days respectively) and these frogs were caught for transmitter replacement. frogs were tracked one to four times per week by Andrea Gielens (graduate student) with field assistance from stacey Boks and Jill miners for a total of 39 days of tracking to date.
Researchers wore waders in shallow water and used kayaks to navigate deeper water. The frogs were located using receiver model R1000 from Telonics. Locations were recorded using handheld GPs units, and detailed microhabitat data was collected, including hydrological parameters (water depth at frog, distance of frog to water surface, sediment depth, substrate), thermal parameters (surface water temperature, frog depth temperature from telemetry transmitter), and structural parameters to estimate habitat selection above and below the water surface.
When frogs were visually located they were caught to monitor body condition (weight, growth, health, belt impacts). injured frogs were removed from the study, treated with antibiotics and allowed to heal in captivity.
results: Objective 1: Testing methods and project logisticsThe pilot project demonstrated that radio-telemetry methods can be used successfully to track captive reared and released Osf at the Aldergrove site. Two of the eleven transmitters (18%) failed early in the study

Environmental Science Advisory Committee P136-09
109
this study to reduce the incidence of injury to the frogs. However, the new flexiflex belly belts do not degrade quickly and may cause injury to frogs if transmitters fail or cannot be retrieved. We will further research attachments methods over the winter and assess deterioration rates of flexiflex belts.
A primary objective of the study was to assess whether captive-reared and released frogs succumbed quickly to either Bd infection or to Bullfrog predation. None of the frogs in the study exhibited signs of Bd, even though previous surveys at this site indicate that Bd is widespread at the Aldergrove site (unpublished data, P. Govindarajulu). Also, frogs susceptibility to Bd infection increases during the low temperature periods in the fall and spring (Berger et al. 2004). Therefore, it is encouraging that we did not observe overt signs of the disease during our study.
We also did not observe predation by Bullfrogs. Although Green frogs (Rana clamitans) were abundant, we did not observe Bullfrogs at the release site. These preliminary data suggest that captive reared frogs do not succumb immediately to environmental pressures. Although encouraging, further study is necessary before concluding that captive rearing and releasing frogs is a suitable method for recovering Oregon spotted frogs at Aldergrove. movement data analysis is in progress, and will compare movement and habitat use of captive-reared frogs to that of captive reared and wild frogs at other sites in Bc and to stable Osf populations in the United states (Watson et al. 2003).
conclusions:
This project was a pilot study for three-year research (2009-2012) program that will examine fate, survival, and habitat use by Osf at extant (maria slough), historical (Aldergrove) and introduced/reintroduced sites in the fraser Valley. This will provide more detailed information necessary to guide recovery plans for Osf.
vegetation and deep sediment. frogs also took up temporary residence within beaver dams. four of the nine frogs have been tracked to their overwintering sites: an active beaver dam, a submerged hardhack island, a small hardhack island connected to an inactive beaver dam, and shallow water near the shore where hard hack roots and debris are thick.
discussion:
The objectives of the study were met. The pilot project demonstrated that radio-telemetry can be used to study the fate and habitat use by Osf at the Aldergrove site, and many logistical lessons were learned. Data analysis is in progress, and will not only be used in refining further radio-telemetry studies but will also contribute to the overall goal which is to assess the potential for successful recovery of Osf at Aldergrove. This pilot project demonstrated the challenges of navigating through the environment used by the frogs. Tracking was slow and arduous as the murky underwater environment is littered with dead wood from beaver activity, deep holes and soft sediment. Researcher safety was a significant concern, and demonstrated that it was crucial to work in pairs. Kayaks were necessary in deeper water but were difficult to maneuver in the densely vegetated habitat, littered with dead wood.
The challenges increased in the fall with decreasing temperatures. A cold snap formed thick ice on the wetland which was too thin to walk on yet too thick to break with a kayak. in these conditions, frog capture is very difficult and sometimes dangerous. in response, we trialed methods of finding frogs using coaxial cable antennae and small rare earth magnets on poles (fellers and Kleeman 2003). We were partially successful, as frog location was easier with the pole; however, we were not successful in retrieving frogs using a magnet and all frogs had to be captured by hand.
Transmitter attachment methods were refined during

Environmental Science Advisory Committee P136-09
110
sheppard, N., Williams, c. and Tyler, m.J. 2004. Effect of season and temperature on mortality in amphibians due to chytridiomycosis. Australian Veterinary Journal 82:434-439.
fellers, G.m. and P. Kleeman. 2003. A technique for locating and recovering radiotransmitters at close range. Herp. Rev. 34: 123.
Watson, J.W., K.R. mcAllister, and D.J. Pierce. 2003. Home ranges, movements, and habitat selection of Oregon spotted frogs (Rana pretiosa). J. Herpetology. 37: 292-300.
acknowledgements:
field work was conducted by Andrea Gielens (Aldergrove) and monica Pearson (maria slough), Lead field Researchers with able assistance at Aldergrove from Jill miners and stacey Boks, Volunteer field Assistants. Additional project guidance was provided by Dr. christine Bishop, canadian Wildlife service. site facilitation was provided by Tracy cornforth and the staff of DND in Victoria and at Aldergrove.
references:
Berger, L., speare, R., Hines, H.B., marantelli, G., Hyatt, A.D., mcDonald, K.R., skerratt, L.f., Olsen, V., clarke, J.m., Gillespie, G., mahony, m.,
table 1. summary of frog condition at release, transmitter model. mV2009 frogs were metamorphs from 2009 eggs that were raised at mountainview conservation centre; mV 2008 and GVZ 2008 were juveniles from 2008 eggs that were raised at mountainview and the Greater Vancouver Zoo, respectively.
source
frogfROG PiT#
Release
date
Transmitter
model / Wt
frog
Weight at
Release
(g)
sVL at
release
(mm)
shank
length at
release
(mm)
sex
# of
location
data
points
frog
fate
mV
2009
3D9.1c2D1fD048 22-sep-05 BD-2NT / 0.50 g 7.9 40 20.1 ?
in progress3D9.1c2D1D189E 22-sep-05 BD-2NT / 0.50 g 8.7 40.3 20.6 ?
3D9.1c2D1D0D0A 22-sep-05 BD-2NT / 0.50 g 10 45 22.1 ?
mV
2008
3D9.1c2D292675 22-sep-05 BD-2NT / 0.64 g 21.7 55.6 28.5 m
in progress3D9.1c2D1D1448 22-sep-05 BD-2NT / 0.64 g 22.5 54.5 26.2 m
391.1c2D182D7A 22-sep-05 BD-2NT / 0.64 g 10 45 22.1 f
GVZ
2008
3D9.1c2D318606 22-sep-05 BD-2T / 1.95 g 26.8 57.9 29.5 m
in progress
3D9.1c2D31Ac94 22-sep-05 BD-2T / 1.95 g 27.8 57 29.5 m
3D9.1c2D291f06 22-sep-05 BD-2T / 1.95 g 39.8 63.5 32.1 f
3D9.1c2D182A11 22-sep-05 BD-2T / 1.95 g 52.3 67.6 32 f
3D9.1c2D318cA7 22-sep-05 BD-2T / 1.95 g 40.3 62.7 32 m

Environmental Science Advisory Committee P136-09
111
Figure 2: Area of habitat use by the radio-telemetered Osf within the Aldergrove site.
Figure 1: Osf with radio-transmitter basking on floating vegetation.

Environmental Science Advisory Committee P137-09
112
Environmental Science Advisory Committee
Project leader(s): cait Nelson organization(s): Bc ministry of Environment, UBc, and Environment canadaaddress(es): 4th floor - 2975 Jutland Road, Victoria Bc, V8W 9m1 telephone no.(s): (250) 893-3606Facsimile: NAEmail(s): [email protected]
PErmit #: P137-09location(S): ALBERT HEAD
Start datE: 05 OcTOBER 2009comPlEtion datE: 31 DEcEmBER 2009 ProjEct StatUS: 2009-2011
contaminant Exposure in river otters (Lontra canadensis): an assessment of Spatial and Geographic trends in Home range and Population demographics
introduction:
As part of an ongoing initiative by Environment canada to investigate the impacts of persistent organic pollutants (POPs) on wildlife, a River Otter (Lontra canadensis) population is being studied to investigate the fine scale effects of new and residual toxins in the environment. Victoria and Esquimalt Harbours on southern Vancouver island are known hot spots for POPs, particularly polychlorinated biphenyls (PcBs) that have accumulated in the marine ecosystem through industrial effluent. The bioaccumulative nature of these toxins has posed a particular threat to top predator wildlife species inhabiting these ecosystems. River Otters are well suited for monitoring local sources of contamination as they are exposed to POPs through diet, have relatively small and seasonally constant home ranges and do not hibernate or migrate over long distances. if their home range is positioned close to a source of contamination, exposure could be chronic and body burden would represent accumulated contaminants within the system.
The purpose of this project is to increase the knowledge base of coastal River Otter ecology and ecosystem health on southern Vancouver island. This study will contribute to effective management and conservation through the following objectives: (1) to define habitat use by investigating home range and movement patterns, (2) to relate individual trends to contaminant exposure and stress, and (3) to evaluate the effectiveness of non-invasive techniques in River Otters.
This research combines spatial, genetic, toxicological and physiological analyses. As there have been few multi-disciplinary studies of this kind within Bc, this project will facilitate a unique and collaborative approach to management and conservation efforts. The information gathered will inform the public, stakeholders and management agencies of the current environmental issues and implications to wildlife and their habitats.
Research has demonstrated that otters are being
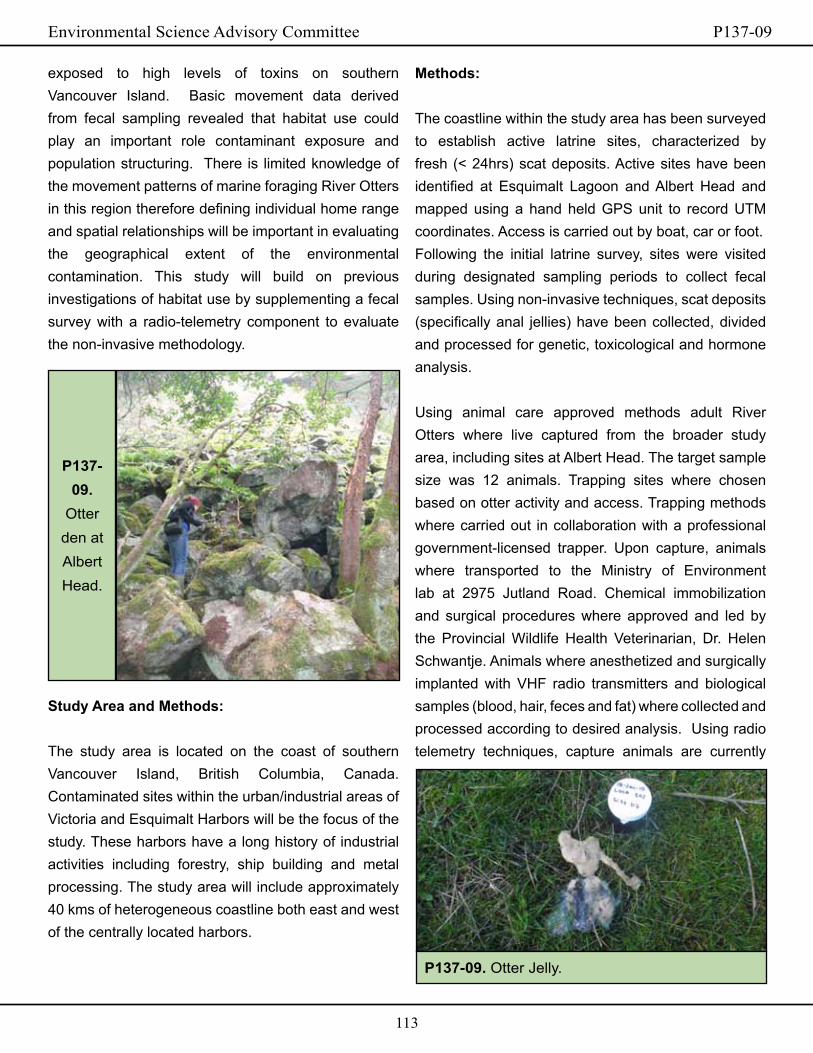
Environmental Science Advisory Committee P137-09
113
methods:
The coastline within the study area has been surveyed to establish active latrine sites, characterized by fresh (< 24hrs) scat deposits. Active sites have been identified at Esquimalt Lagoon and Albert Head and mapped using a hand held GPs unit to record UTm coordinates. Access is carried out by boat, car or foot.following the initial latrine survey, sites were visited during designated sampling periods to collect fecal samples. Using non-invasive techniques, scat deposits (specifically anal jellies) have been collected, divided and processed for genetic, toxicological and hormone analysis.
Using animal care approved methods adult River Otters where live captured from the broader study area, including sites at Albert Head. The target sample size was 12 animals. Trapping sites where chosen based on otter activity and access. Trapping methods where carried out in collaboration with a professional government-licensed trapper. Upon capture, animals where transported to the ministry of Environment lab at 2975 Jutland Road. chemical immobilization and surgical procedures where approved and led by the Provincial Wildlife Health Veterinarian, Dr. Helen schwantje. Animals where anesthetized and surgically implanted with VHf radio transmitters and biological samples (blood, hair, feces and fat) where collected and processed according to desired analysis. Using radio telemetry techniques, capture animals are currently
exposed to high levels of toxins on southern Vancouver island. Basic movement data derived from fecal sampling revealed that habitat use could play an important role contaminant exposure and population structuring. There is limited knowledge of the movement patterns of marine foraging River Otters in this region therefore defining individual home range and spatial relationships will be important in evaluating the geographical extent of the environmental contamination. This study will build on previous investigations of habitat use by supplementing a fecal survey with a radio-telemetry component to evaluate the non-invasive methodology.
Study area and methods:
The study area is located on the coast of southern Vancouver island, British columbia, canada. contaminated sites within the urban/industrial areas of Victoria and Esquimalt Harbors will be the focus of the study. These harbors have a long history of industrial activities including forestry, ship building and metal processing. The study area will include approximately 40 kms of heterogeneous coastline both east and west of the centrally located harbors.
P137-09. Otter Jelly.
P137-09.
Otter den at Albert Head.

Environmental Science Advisory Committee P137-09
114
being tracked to investigate home range, habitat use and foraging behavior relative to the contaminated sites.
results:
As of 31 December 2009, 6 River Otters have been captured, tagged and sampled; further trapping is ongoing. The locations, movement patterns and behaviour of the tagged animals are currently being recorded. A utilization distribution and home range analysis will be carried out after 12 months of data collection. At this time there are no formal results to report as the project is in the early stages of field data collection.
conclusions:
mapping of latrine sites in Esquimalt Harbor are planned for early 2010; fecal collections and radio-telemetry will continue until september 2010, and lab work and analysis will start in may 2010. A final report and thesis will be submitted on or before 31 December 2011.
acknowledgements:
i would like to acknowledge the canadian Wildlife service of Environment canada, and the Bc ministry of Environment for field and lab support. i would also like to sincerely thank Dr. Helen schwantje for her guidance and expertise, as well as caeley Thacker, Dan Guertin and my supervisors Dr. Kim cheng and Dr. John Elliot.
P137-09. Group or ‘raft’ of otters.
P137-09. Otter sighting near the water at Albert Head.

Environmental Science Advisory Committee 2009/2010 Annual Report
115
acKnoWlEdGEmEntS
maritime forces Pacific, cfB Esquimalt and EsAc would like to thank:
• All 2009 EsAc permit holders for their cooperation and contribution to the knowledge of flora, fauna, and ecology on cfB Esquimalt properties.
• The canadian forest service – Pacific forestry centre for coordinating and hosting the annual workshop and to the National forest information system staff for facilitating the live webcast of the workshop.
• All of the individuals who presented at and/or attended the EsAc annual workshop in february 2010. Your attendance and participation are valued.
rEFErEncES
list of Environmental Science reports for 2009
Biolinx Environmental Research Ltd. 2009. surveys for the blue-grey taildropper slug (Prophysaon coeruleum) on federal lands on southern Vancouver island, Bc, in 2008. Biolinx Environmental Research Ltd., sidney, Bc.
Englestoft, c. and Ovaska, K. 2009. sharp-tailed snake inventory and population monitoring on federal lands on southern Vancouver island and Gulf islands, April 2008 – march 2009. Alula Biological consulting, saanichton, Bc.
fairbarns, m. 2009a. survey of white meconella (Meconella oregana) at cfmETR. Aruncus consulting, Victoria, Bc.
fairbarns, m. 2009b. Rare Plant inventory miles Hills Rocky Point, cfB Esquimalt. Aruncus consulting,
Victoria, Bc.fairbarns, m. 2009c. Population Restoration studies
of Plant species at Risk. Aruncus consulting, Victoria, Bc.
Guertin, D. 2009. Assessment of contaminant exposure, diet, and populatin metrics of river otters (Lontra Canadensis) along the coast of southern Vancouver island. m.sc. Thesis. simon fraser University.
Hawkes, V.c. 2009. salish sucker (Catostomus sp.) and Oregon spotted frog (Rana pretiosa) Habitat investigations and Effluent Review at maintenance Detachment Aldergrove with a Proposed critical Habitat Delineation for Oregon spotted frog. Unpublished report by LGL Limited, LGL Project EA3132 for Public Works and Government services canada, Victoria, Bc. 67p + Appendices.
Knopp, D. and L. Larkin. Oregon spotted frog and red-legged from egg mass survey Navel Radio station (NRs) Aldergrove. B.c.’s Wild Heritage Environmental consultants. sardis, B.c.
marsico, T.D. and J.J. Hellmann. 2009. Dispersal limitation inferred from an experimental translocation of Lomatium (Apiaceae) species outside their grographic ranges. Oikos 118: 1783-1792.
mcintosh, T. 2009. Report on an inventory and a critical habitat assessment for rigid apple moss (Bartramia stricta) at mary Hill (DND) Vancouver island. Vancouver, B.c. 34p.
mcLean, J.A., A.L. Behennah and m. fairbarns. 2009. Ground beerles (coleoptera: carabidae) associated with Garry oak ecosystems on southern Vancouver island, British coulumbia. Journal of the Entomological society of British columbia 160: 47-51.
miskelly, J. 2009. 2009 surveys for Sanicula

Environmental Science Advisory Committee 2009/2010 Annual Report
116
rEFErEncES continUEd
bipinnatifida and Lupinus densiflorus at macaulay Point, Esquimalt. Victoria, Bc.
Polster, D. macaulay Point stewardship: Vegetation monitoring plan development and implementation. Polster Environmental services Ltd. Duncan, B.c.
Tomimatsu, H. , s.R. Kephart and m. Vellend. Phylogeography of camassia quamash in western North America: postglacial colonization and transport by indigenous peoples. molecular Ecology 18: 3918-3928.
Yazvenko, s. 2009. survey for phantom orchid at Heals Rifle Range, saanich Peninsula, Bc. LGL Limited Environmental Research Associates. sidney, Bc.
list of Environmental Science reports for 2008
Knopp, D and Larkin, L. 2008. Oregon spotted frog and red-legged frog egg mass survey: Navel Radio station (NRc) Aldergrove. B.c.’s Wild Heritage Environmental consultants. sardis, B.c. 28p.
Englestoft, c. and Ovaska, K. 2008. sharp-tailed snake surveys on DND, NRc, and Parks canada Properties on southern Vancouver island and Gulf islands, 2007-2008. Alula Biological consulting, saanichton, Bc. 26p + appendices.
fairbarns 2008a. survey for Meconella oregana (white meconella): canadian forces maritime Experimental and Testing Ranges (cfmETR) April-June 2007. Aruncus consulting, Victoria, Bc. 16p.
fairbarns 2008b. Demographic and phonological patterns of Microseris bigelovii (coast microseris) march 2008. Aruncus consulting, Victoria, Bc. 18p.
fairbarns 2008c. Population restoration studies of plant
species at risk march 2008. Aruncus consulting, Victoria, Bc. 23p.
Golder Associates. 2008. survey for Vancouver island beggarticks (Bidens amplissima) at the decommissioned sewage lagoon: maintenance Detachment Aldergrove. Golder Associated Ltd. Burnaby, B.c. 5p + appendix.
miskelly, J. 2008. 2008 surveys for Sanicula bipinnatifida and Lupinus densiflorus at macaulay Point, Esquimalt. Oatgrass Environmental, Victoria, Bc. 22p.
Yazvenko, s. 2008. survey for phantom orchid at Heals Rifle Range, saanich Peninsula, Bc. LGL Limited Environmental Research Associates. sidney, Bc. 15p.
Zakharov, E. V., and J. J. Hellmann. 2008. Genetic differentiation across a latitudinal gradient in two co-occurring butterfly species: revealing population differences in a context of climate change. molecular Ecology 17: 189-208.

Environmental Science Advisory Committee 2009/2010 Annual Report
117
contact inFormation - mEmBErS
Dr. Elizabeth campbellResearch Ecologist Research BranchB.c. ministry of forestsP.O. Box 9519 stn Prov GovtVictoria, B.c. V8W 9c2Tel: (250) 387-6715fax: (250) [email protected]
Bruce chambersconstruction Engineering Environment Officer Base construction Engineering OfficecfB Esquimalt,Building 575 DockyardP.O. Box 17000, station forcesVictoria, Bc V9A 7N2Tel: (250) 363-5454fax: (250) [email protected]
Tracy cornforthEnvironment Officerformation safety and EnvironmentcfB Esquimalt, Bldg 199 DockyardP.O. Box 17000, station forcesVictoria, Bc V9A 7N2Tel: (250) 363-1073fax: (250) [email protected]
Dr. matt DoddAssociate ProfessorRoyal Roads University2005 sooke RoadVictoria, B.c. V9B 5Y2Tel: (250) 391-2583fax: (250) [email protected]
Ken morganPelagic seabird Biologistcanadian Wildlife serviceEnvironment canadainstitute of Ocean sciencesP.O. Box 6000sidney, B.c. V8L 4B2Tel: (250) 363-6537fax: (250) [email protected]
Dr. Réal RoyAssistant ProfessorDepartment of Biology,University of VictoriaP.O. Box 3020Victoria, B.c. V8W 3N5Tel: (250) 721-5071fax: (250) [email protected]
sgt. fraser ThompsonRange control Booking NcOBase Operations - camp Albert HeadP.O. Box 17000, station forcesVictoria, Bc V9A 7N2 Tel: (250) 391-4184 [email protected]
Dr. Tony Trofymow (chair)Research scientistNatural Resources canadacanadian forest service, Pacific forestry centre506 West Burnside RoadVictoria, B.c. V8Z 1m5Tel: (250) 363-0600fax: (250) [email protected]

Environmental Science Advisory Committee 2009/2010 Annual Report
118
contact inFormation - altErnatE and otHErS
Wendy EastonLandbird Biologistcanadian Wildlife serviceEnvironment canadaPacific Wildlife Research centreRR#1, 5421 Robertson RoadDelta, B.c. V4K 3N2Tel: (604) 940-4673fax: (604) [email protected]
Arthur Robinsonforestry Development OfficerNatural Resources canadacanadian forest service, Pacific forestry centre506 West Burnside RoadVictoria, B.c. V8Z 1m5Tel: (250) 363-0729fax: (250) [email protected]
Andrea schillerforestry field TechnicianNatural Resources canadacanadian forest service, Pacific forestry centre506 West Burnside RoadVictoria, B.c. V8Z 1m5Tel: (250) 363-0729fax: (250) [email protected]
mike WatersEnvironment Officerformation safety and EnvironmentcfB Esquimalt, Bldg 199 DockyardP.O. Box 17000, station forcesVictoria, B.c. V9A 7N2Tel: (250) 363-2177fax: (250) [email protected]
cfB Esquimalt Real Estate servicesBuilding 575 DockyardP.O. Box 17000, station forcesVictoria, Bc V9A 7N2Tel: (250) 363-7918fax: (250) 363-7980

FOR MORE INFORMATION
For more information on ESAC, please visit our website at: http://cfs.nrcan.gc.ca/subsite/esac
For more information on MARPAC/CFB Esquimalt environmental programs and initiatives
please visit our website at: http://www.navy.forces.gc.ca/marpacor contact:
MARPAC - CFB EsquimaltFormation Environment Office
(250) 363-5063
Produced by Formation Safety and Environment, CFB Esquimalt, Maritime Forces Pacific