
EROS INTERNATIONAL PLC REPORTS THIRD QUARTER...
22
EROS INTERNATIONAL PLC REPORTS THIRD QUARTER FISCAL YEAR 2014 RESULTS 02/13/2014 Financial Highlights Third Quarter Ended December 31, 2013 Revenues increased by 22.3% to $87.2 million, compared to $71.3 million in the prior year period Currency comparable revenues increased by 29.8% Adjusted EBITDA increased by 53.7% to $45.2 million, compared to $29.4 million in the prior year period Net income decreased by 9.9% to $19.1 million, compared to $21.2 million in the prior year period Nine Months Ended December 31, 2013 Revenues increased by 5.5% to $172.2 million, compared to $163.2 million in the prior year period Currency comparable revenues increased by 12.7% Adjusted EBITDA increased by 42.1% to $67.2 million, compared to $47.3 million in the prior year period Net income increased by 15.4% to $30.8 million, compared to $26.7 million in the prior year period LONDON--(BUSINESS WIRE)--Eros International Plc (NYSE:EROS) (“Eros” or “the Company”), a leading global company in the Indian film entertainment industry, today reported financial results for the third quarter ended December 31, 2013.
Transcript of EROS INTERNATIONAL PLC REPORTS THIRD QUARTER...
EROS INTERNATIONAL PLC REPORTS THIRD QUARTER FISCAL YEAR 2014 RESULTS
02/13/2014
Financial Highlights
Third Quarter Ended December 31, 2013
Revenues increased by 22.3% to $87.2 million, compared to $71.3 million in the prior year period
Currency comparable revenues increased by 29.8%
Adjusted EBITDA increased by 53.7% to $45.2 million, compared to $29.4 million in the prior year
period
Net income decreased by 9.9% to $19.1 million, compared to $21.2 million in the prior year period
Nine Months Ended December 31, 2013
Revenues increased by 5.5% to $172.2 million, compared to $163.2 million in the prior year period
Currency comparable revenues increased by 12.7%
Adjusted EBITDA increased by 42.1% to $67.2 million, compared to $47.3 million in the prior year
period
Net income increased by 15.4% to $30.8 million, compared to $26.7 million in the prior year period
LONDON--(BUSINESS WIRE)--Eros International Plc (NYSE:EROS) (“Eros” or “the Company”), a leading
global company in the Indian film entertainment industry, today reported financial results for the
third quarter ended December 31, 2013.

Jyoti Deshpande, Eros’ Managing Director and Chief Executive Officer, said "Our strong third quarter
results demonstrate the success of our strategy of investing in high quality Indian film content and
our ability to monetize it across numerous distribution platforms, both within India and in
international markets. Our investment in content has allowed us to systematically scale our business
and build a valuable library of over 2,000 films that is a significant competitive advantage for us, and
fuels our digital initiatives such as ErosNow for online content distribution and our HBO
collaboration for premium television within India. As we look ahead, we are confident in our ability
to accelerate our growth, especially given the positive structural trends in the Indian entertainment
industry that we believe will continue to provide significant momentum for us. Finally, the successful
completion of our IPO in the United States in November, 2013 has further strengthened our balance
sheet with the capital raised, but has also given us access to the global capital markets which, along
with our existing leadership position within our industry, will allow us to create a compelling long-
term shareholder value proposition for our investors.”
Operational Highlights
• Four out of the top 10 Hindi box office films in India in the nine months ended December 31, 2013
were Eros films, namely ‘Goliyon Ki Rasleela – RamLeela’, ‘Grand Masti’, ‘R…Rajkumar’ and
‘Raanjhanaa’ of which two films were released in the third quarter.
• Television syndication continued to be strong and Eros signed deals with MSM Satellite
(Singapore), Private Limited (Sony) and Viacom 18 Media Private Limited (Colours) during the third
quarter as well as continuing to deliver films from previously executed contracts for new and library
films.
• The Eros-HBO Asia collaboration gained momentum, as the HBO Defined and HBO Hits premium
channels were launched on Tata Sky DTH platform on December 31, 2013. The channels are now
available on most major DTH and digital cable platforms within India and Eros believes the latest
carriage deal should provide momentum for subscriber growth for the channels within India.
• Eros’ films continue to be released in non-traditional emerging markets such as Taiwan, South
Korea, the Middle East and Europe where the films are dubbed and/or subtitled to localize the
content for those audiences with high-margin contributions from these markets.
• ErosNow, the Company’s unique online service offering full length films and music videos,
launched its “Freemium” model during the third quarter. Certain Eros content can now be accessed
for free, while other content is also being offered on a transactional or subscription basis. The
Company’s ErosNow YouTube channel, a leading Indian channel, has crossed over 1.7 billion video
views in aggregate and averages over 80 million video views per month.
• On November 13, 2013, Eros completed an initial public offering ("IPO") on the NYSE of 5,000,000
shares of common stock, at a price to the public of $11.00 per share, raising $55 million in new
capital, making Eros the first Indian media company to be listed on the NYSE.
• The Company’s fiscal fourth quarter ended March 31, 2014 has started off well with two major
releases, Jai Ho (Hindi) starring Salman Khan and One Nennokodine (Telegu), starring Mahesh Babu,
both underpinned by strong pre-sale revenues. Apart from this, there will be other Tamil, Hindi and
overseas only films that will be released before the end of FY 2014. The release date of Rajinikanth’s

Kochadaaiyaan (Tamil) has been announced for April 11, 2014 and the music for the film will be
released in March, 2014.
• Slate visibility is an important strategy employed by Eros as it allows the Company to manage its
portfolio of films by pre-selling, de-risking and bringing some predictability to a business that is not
to be measured quarter on quarter. FY 2015 has releases such as, Kochadaaiyaan, Action Jackson,
Happy Ending, Dekho Magar Pyar Se, Purani Jeans and Telegu untitled (Pawan Kalyan) in the first
half of the year and releases such as Tewar, NH 10, Untitled (by Balki), Chalo China, Illuminati Films
Untitled (by Sriram Raghavan), Tamil untitled (Ajith) to name a few in the second half of the year.
Eros International Plc Financial Highlights:
Three Months Ended
December 31,
Nine Months Ended
December 31,
(dollars in
millions) 2013 2012
%
change 2013 2012
%
change
Revenue $ 87.2 $ 71.3 22.3% $ 172.2 $ 163.2 5.5%
Gross Profit 50.5 35.1 43.9% 80.8 64.1 26.1%
Operating profit 37.7 28.8 29.5% 52.3 46.6 12.2%
Adjusted EBITDA(1) 45.2 29.4 53.7% 67.2 47.3 42.1%
(1) Reconciliations of the non-GAAP financial measures discussed within this release to our GAAP
operating results are included at the end of this release. See also “Non-GAAP Financial Measures.”
Constant currency comparable revenues for the three months and the nine months ended
December 31, 2012 are $68.4 million and $154.4 million, respectively, based on the average rates of
exchange for the three and nine months ended December 31, 2013. In the three and nine months
ended December 31, 2013, the average rate of exchange used to convert Indian Rupee were INR
60.1 to $1.00 and INR 58.3 to $1.00, respectively.
Financial Results for the Three and Nine Months Ended December 31, 2013
Revenue
Eros is a leading global company in the Indian film entertainment industry that co-produces, acquires
and distributes Indian language films in multiple formats worldwide. The Company’s success is built
on the relationships it has cultivated over the past 30 years with leading talent, production
companies, exhibitors and other key participants in the industry. Leveraging these relationships, Eros

has aggregated rights to over 2,000 titles in its library, plus approximately 700 additional films for
which it holds digital rights only, including recent and classic titles that span different genres,
budgets and languages. The Company has also distributed a portfolio of over 230 new films over the
last three completed fiscal years and 41 in the nine months ended December 31, 2013. New film
distribution across theatrical, television and digital channels along with library monetization provide
the Company with diversified revenue streams.
Revenue increased by 22.3% to $87.2 million in the three months ended December 31, 2013,
compared to $71.3 million in the three months ended December 31, 2012. For the nine months
ended December 31, 2013, revenue increased by 5.5% to $172.2 million, compared to $163.2 million
in the nine months ended December 31, 2012. Eros released 15 new films in the three months
ended December 31, 2013, of which there were three high budget films and two medium budget
films, compared to 24 films in the three months ended December 31, 2012, of which three were high
budget films and two were medium budget films. Eros has released 41 new films in the nine months
ended December 31, 2013, compared to 66 in the nine months ended December 31, 2012. For
further information on the definition of high and medium budget films see the Company’s
Prospectus, dated November 12, 2013, filed with the U.S. Securities and Exchange Commission ("the
Registration Statement").
The Company’s primary revenue streams are derived from three channels: theatrical, television
syndication and digital and ancillary. For the three months ended December 31, 2013, the aggregate
revenue from theatrical, television syndication and digital and ancillary was $41.3 million, $33.0
million and $12.9 million, respectively, compared to $40.6 million, $17.1 million and $13.6 million,
respectively, for the three months ended December 31, 2012. For the nine months ended December
31, 2013, the aggregate revenue from theatrical, television syndication and digital and ancillary was
$77.9 million, $65.0 million and $29.3 million, compared to $95.1 million, $36.8 million and $31.3
million, respectively, for the nine months ended December 31, 2012.
Revenue by customer location from India increased 1.2% to $43.2 million in the three months ended
December 31, 2013, compared to $42.7 million in the three months ended December 31, 2012, due
to overall increases in revenue from comparable new releases offset by a $1.8 million reduction in
revenue due to lower translation of Indian Rupee revenues when converted into US Dollars due to
exchange rate movement. In the nine months ended December 31, 2013, revenue by customer
location in India decreased 20.2% to $86.6 million, compared to $108.5 million in the nine months
ended December 31, 2012, primarily attributable to a $8.8 million reduction in revenue as a result of
the translation impact due to exchange rate movement, together with lower revenue due to the
change in the mix of film releases and the quarterly release pattern of films.
Revenue from Europe increased 16.9% to $8.3 million in the three months ended December 31,
2013, compared to $7.1 million in the three months ended December 31, 2012, primarily due to
overall increases in revenue from comparable new releases and catalogue sales. In the nine months
ended December 31, 2013 revenue from Europe decreased 15.2% to $17.9 million, compared to
$21.1 million in the nine months ended December 31, 2012, due to a decline in production services
revenue in the nine months ended December 31, 2013, partially offset by increased contributions
from television sales.
Revenue from North America increased 3.2% to $3.2 million in the three months ended December
31, 2013, compared to $3.1 million in the three months ended December 31, 2012. In the nine
months ended December 31, 2013 revenue from North America increased 40.0% to $9.1 million,

compared to $6.5 million in the nine months ended December 31, 2012, due to increased digital and
syndication revenues.
Revenue from the rest of the world increased 76.6% to $32.5 million in the three months ended
December 31, 2013, compared to $18.4 million in the three months ended December 31, 2012, due
to increased television syndication and digital revenues. In the nine months ended December 31,
2013 revenues from the rest of the world increased 116.2% to $58.6 million, compared to $27.1
million in the nine months ended December 31, 2012, due to an increase in catalogue sales with
respect to television as well as digital and ancillary rights, along with the wider theatrical release of
some of the Company’s films.
Cost of sales
Cost of sales increased by 1.4% to $36.7 million in the three months ended December 31, 2013,
compared to $36.2 million in the three months ended December 31, 2012, primarily due to an
increase in amortization costs of $1.1 million reflecting the reduced capitalised cost of the new
release slate offset by additions to amortisation of the catalogue films, and a decrease in print and
advertising costs of $0.6 million due to the change in the film release pattern in the comparable
quarters and variations in costs associated with regional versus Hindi releases. Cost of sales
decreased 7.8% to $91.4 million in the nine months ended December 31, 2013, compared to $99.1
million in the nine months ended December 31, 2012. The decrease in cost of sales for the nine
months ended December 31, 2013 was mainly the result of a $3.5 million reduction in amortization
due in part to the lower capitalized cost of the Company’s new release slate in the nine months
ended December 31, 2013 as compared to the release slate in the nine months ended December 31,
2012.
Gross profit
Gross profit was $50.5 million in the three months ended December 31, 2013, compared to $35.1
million in the three months ended December 31, 2012 and $80.8 million in the nine months ended
December 31, 2013, compared to $64.1 million in the nine months ended December 31, 2012. As a
percentage of revenue, the Company’s gross profit margin increased to 57.9% in the three months
ended December 31, 2013 compared to 49.2% in the three months ended December 31, 2012. Gross
profit margin for the nine months ended December 31, 2013 increased to 46.9%, compared to 39.3%
in the nine months ended December 31, 2012. The increase in gross profit margin for the three and
nine months ended December 31, 2013 is primarily attributable to revenues from the new release
slate relative to their cost as well as the significant contribution on revenue from catalogue sales
which tend to be very high margin.
Adjusted EBITDA
Adjusted EBITDA was $45.2 million in the three months ended December 31, 2013 compared to
$29.4 million in the three months ended December 31, 2012. The increase in Adjusted EBITDA is
primarily attributable to a 53.7% increase in revenues combined with increased margin due to the
change in mix of revenue. In the nine months ended December 31, 2013 adjusted EBITDA was $67.2
million compared to $47.3 million in the nine months ended December 31, 2012 an increase of
42.1%.
Conference Call
Eros will host a conference call today at 8:00 a.m. ET. To access the call please dial (877) 201-0168
from the United States, or (647) 788-4901 from outside the U.S. The conference call I.D. number is

58903272. Participants should dial in 5 to 10 minutes before the scheduled time and must be on a
touch-tone telephone to ask questions.
A replay of the call can be accessed through February 24, 2014 by dialing (855) 859-2056 from the
U.S., or (404) 537-3406 from outside the U.S. The conference call I.D. number is 58903272.
This call will also be available as a live webcast which can be accessed at Eros’ Investor Relations
Website at http://ir.erosplc.com/investor-relations/default.aspx.
Non-GAAP Financial Measures
Adjusted EBITDA
In addition to the results prepared in accordance with International Financial Reporting Standards
("IFRSs") provided in this release, the Company has presented Adjusted EBITDA. The company uses
Adjusted EBITDA ("Adjusted Earnings Before Interest, Tax, Depreciation and Amortization) along
with other IFRSs measures to evaluate operating performance. Adjusted EBITDA is defined by the
Company as net income before interest expense, income tax expense and depreciation and
amortization (excluding amortization of capitalized film content and debt issuance costs) adjusted
for impairments of available-for-sale financial assets, profit/loss on held for trading liabilities
(including profit/loss on derivatives) share based payments and restructuring charges.
Adjusted EBITDA, as used and defined by us, may not be comparable to similarly-titled measures
employed by other companies and is not a measure of performance calculated in accordance with
GAAP. Adjusted EBITDA should not be considered in isolation or as a substitute for operating
income, net income, cash flows from operating investing and financing activities, or other income or
cash flow statement data prepared in accordance with GAAP. Adjusted EBITDA provides no
information regarding a company’s capital structure, borrowings, interest costs, capital expenditures
and working capital movement or tax position. However, our management team believes that
Adjusted EBITDA is useful to an investor in evaluating our results of operations because these
measures:
• are widely used by investors to measure a company’s operating performance without regard to
items excluded from the calculation of such term, which can vary substantially from company to
company depending upon accounting methods and book value of assets, capital structure and the
method by which assets were acquired, among other factors;
• help investors to evaluate and compare the results of our operations from period to period by
removing the effect of our capital structure from our operating structure; and
• are used by our management team for various other purposes in presentations to our board of
directors as a basis for strategic planning and forecasting.
See the supplemental financial schedules for reconciliations to IFRSs measures.
Cautionary Statement Concerning Forward-Looking Statements
Some of the information presented in this press release and in related comments by Eros'
management contains forward-looking statements. In some cases, these forward-looking statements
are identified by terms and phrases such as “aim,” ‘‘anticipate,’’
‘‘believe,’’ “feel,” “contemplate,” ‘‘intend,’’ ‘‘estimate,’’ ‘‘expect,’’ ‘‘continue,’’ ‘‘should,’’ ‘‘could,’’ ‘‘
may,’’ ‘‘plan,’’ ‘‘project,’’ ‘‘predict,’’ ‘‘will,’’ “future,” “goal,” “objective,” and similar expressions and
include references to assumptions and relate to Eros' future prospects, developments and business

strategies. Similarly, statements that describe Eros' strategies, objectives, plans or goals are forward-
looking statements and are based on information available to Eros as of the date of this press
release. Forward-looking statements are subject to risks, uncertainties and assumptions that could
cause actual results to differ materially from those contemplated by the relevant statement. Such
risks and uncertainties include a variety of factors, some of which are beyond Eros' control, including
but not limited to market conditions and economic conditions. Information concerning these and
other factors that could cause results to differ materially from those contained in the forward-
looking statements is contained under the caption "Risk Factors" in Eros' Registration Statement on
Form F-1 filed with the U.S. Securities and Exchange Commission. Eros undertakes no obligation to
revise the forward-looking statements included herein to reflect any future events or circumstances,
except as required by law. Eros' actual results, performance or achievements could differ materially
from the results expressed in, or implied by, these forward-looking statements.
Seasonality
The Groups’ financial position and results of operations for any period fluctuate due to film release
schedules. Film Release schedules take account of holidays and festivals in India and elsewhere,
competitor film releases and sporting events.
About Eros International Plc
Eros International Plc (NYSE: EROS) is a leading global company in the Indian film entertainment
industry that acquires, co-produces and distributes Indian films across all available formats such as
cinema, television and digital new media. Eros International Plc became the first Indian media
company to list on the New York Stock Exchange. Eros International has experience of over three
decades in establishing a global platform for Indian cinema. The Company has a competitive
advantage through its extensive and growing movie library comprising of over 2,000 films, which
include Hindi, Tamil, and other regional language films for home entertainment distribution. Eros
International has built a dynamic business model by combining the release of new films every year
with the exploitation of its film library. For further information please visit: www.erosplc.com.
EROS INTERNATIONAL PLC
CONDENSED CONSOLIDATED STATEMENTS FINANCIAL POSITION
(Unaudited; in thousands)
December 31, March 31,
2013 2013
ASSETS
Non-Current assets:

Property, Plant and Equipment $ 10,225 $ 11,680
Goodwill 1,878 1,878
Intangible Assets-trade name 14,000 14,000
Intangible assets-content 572,932 535,304
Intangible assets-Others 1,744 2,117
Available-for-sale financial assets 30,385 30,385
Deferred Tax assets 440 569
Total Non- current assets $ 631,604 $ 595,933
Current Assets
Inventories $ 740 $ 793
Trade Receivables and Other receivables 120,779 93,327
Current tax receivable 969 962
Cash and cash equivalents 141,042 107,642
263,530 202,724
Total assets $ 895,134 $ 798,657
LIABILITIES
Current liabilities:
Trade and other payables $ 33,714 $ 28,979
Short-term borrowings 92,043 79,902
Current Tax Payable 7,235 1,846
Total current liabilities $ 132,992 $ 110,727
Non- current liabilities
Long-term borrowings 167,718 165,898
Other long-term liabilities 421 357
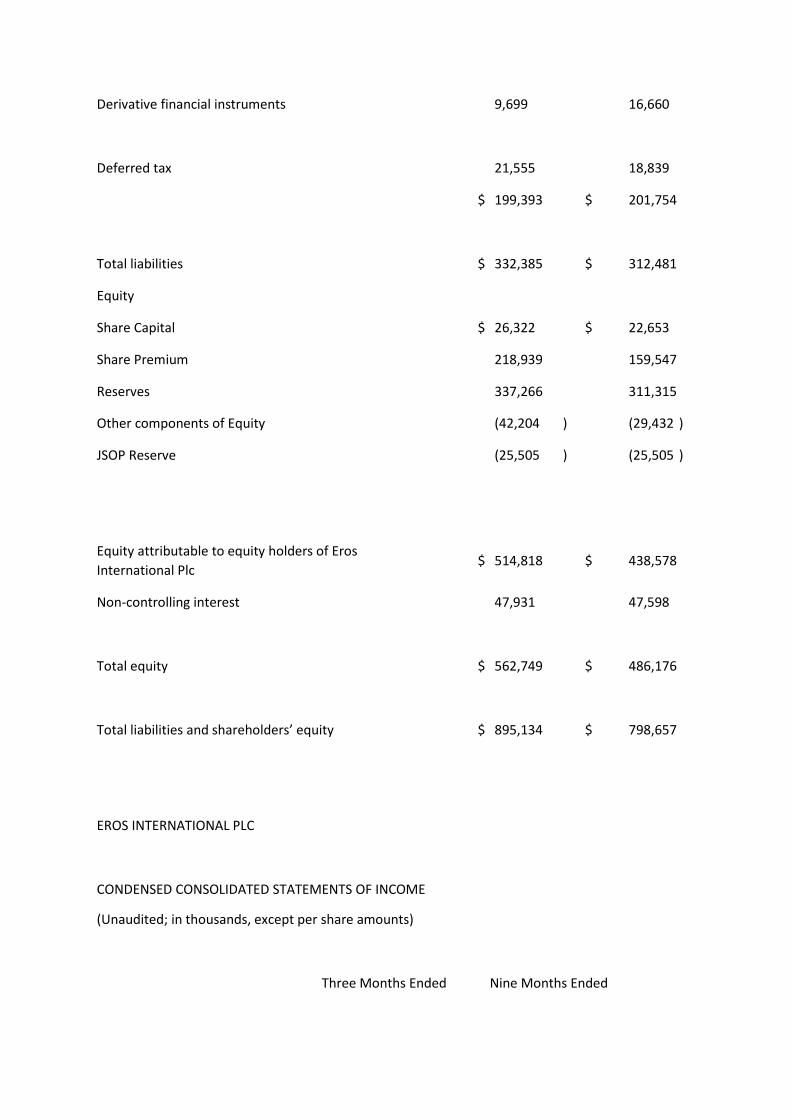
Derivative financial instruments 9,699 16,660
Deferred tax 21,555 18,839
$ 199,393 $ 201,754
Total liabilities $ 332,385 $ 312,481
Equity
Share Capital $ 26,322 $ 22,653
Share Premium 218,939 159,547
Reserves 337,266 311,315
Other components of Equity (42,204 ) (29,432 )
JSOP Reserve (25,505 ) (25,505 )
Equity attributable to equity holders of Eros
International Plc $ 514,818 $ 438,578
Non-controlling interest 47,931 47,598
Total equity $ 562,749 $ 486,176
Total liabilities and shareholders’ equity $ 895,134 $ 798,657
EROS INTERNATIONAL PLC
CONDENSED CONSOLIDATED STATEMENTS OF INCOME
(Unaudited; in thousands, except per share amounts)
Three Months Ended Nine Months Ended
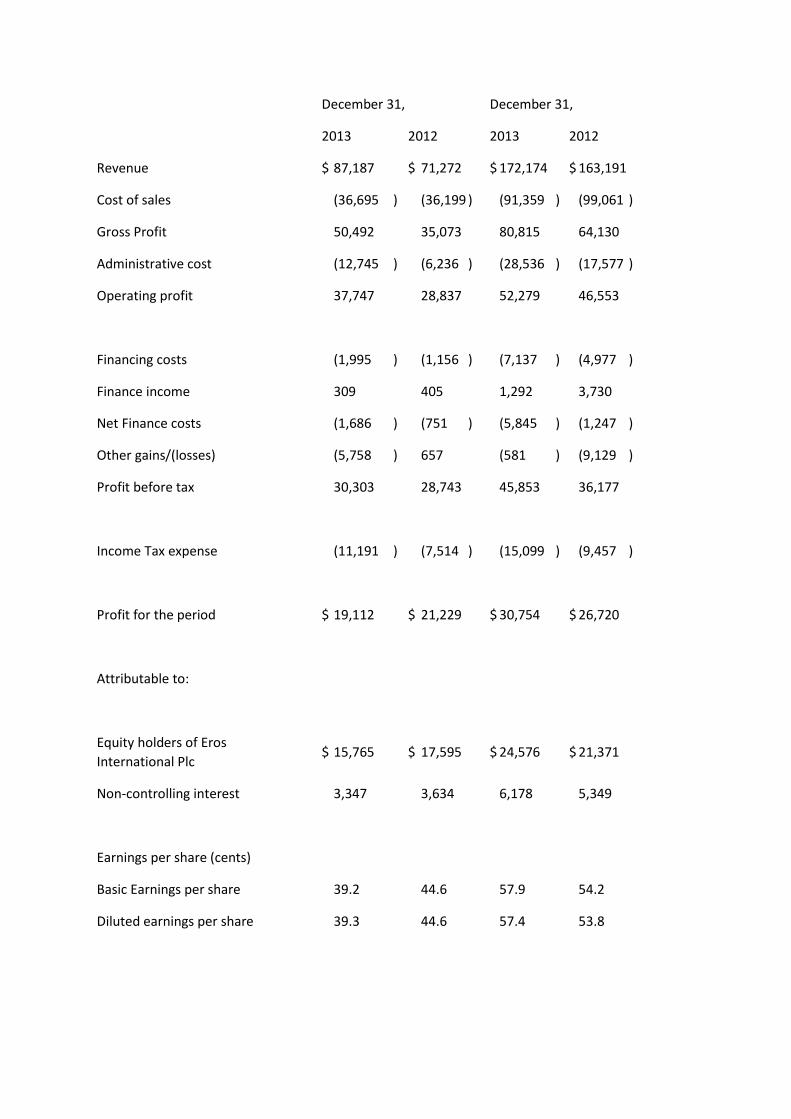
December 31, December 31,
2013 2012 2013 2012
Revenue $ 87,187 $ 71,272 $ 172,174 $ 163,191
Cost of sales (36,695 ) (36,199 ) (91,359 ) (99,061 )
Gross Profit 50,492 35,073 80,815 64,130
Administrative cost (12,745 ) (6,236 ) (28,536 ) (17,577 )
Operating profit 37,747 28,837 52,279 46,553
Financing costs (1,995 ) (1,156 ) (7,137 ) (4,977 )
Finance income 309 405 1,292 3,730
Net Finance costs (1,686 ) (751 ) (5,845 ) (1,247 )
Other gains/(losses) (5,758 ) 657 (581 ) (9,129 )
Profit before tax 30,303 28,743 45,853 36,177
Income Tax expense (11,191 ) (7,514 ) (15,099 ) (9,457 )
Profit for the period $ 19,112 $ 21,229 $ 30,754 $ 26,720
Attributable to:
Equity holders of Eros
International Plc $ 15,765 $ 17,595 $ 24,576 $ 21,371
Non-controlling interest 3,347 3,634 6,178 5,349
Earnings per share (cents)
Basic Earnings per share 39.2 44.6 57.9 54.2
Diluted earnings per share 39.3 44.6 57.4 53.8

EROS INTERNATIONAL PLC
CONDENSED CONSOLIDATED STATEMENTS OF COMPREHENSIVE INCOME
(Unaudited; in thousands)
Three Months Ended
December 31,
Nine Months Ended
December 31,
2013 2012 2013 2012
Profit for the period $ 19,112 $ 21,229 $ 30,754 $ 26,720
Other comprehensive income/(loss):
Items that will not be subsequently
reclassified to profit and loss
Revaluation of Property - 121 - 121
Items that will be subsequently
reclassified to profit and loss
Exchange differences on translating
foreign operations 1,841 (4,653 ) (19,542 ) (14,094 )
Cash flow hedges
Reclassification to profit and loss 308 - 925 -
Total other comprehensive
income/(loss) for the period $ 2,149 $ (4,532 ) $ (18,617 ) $ (13,973 )
Total other comprehensive income
for the period, net of tax $ 21,261 $ 16,697 $ 12,137 $ 12,747
Attributable to:
Owners of Eros International Plc $ 17,383 $ 14,405 $ 11,804 $ 10,135
Non-controlling interests 3,878 2,292 333 2,612

EROS INTERNATIONAL PLC
CONDENSED CONSOLIDATED STATEMENTS OF CASH FLOWS
FOR THE NINE MONTHS ENDING DECEMBER 31, 2013
(in thousands)
Nine Months Ended
December 31
2013 2012
Cash flows from operating activities:
Profit before tax $ 45,853 $ 36,177
Adjustments for:
Depreciation 519 689
Share-based payment 13,721 1,371
Amortization of intangibles assets -
content 71,566 75,079
Amortization of other intangibles assets 325 457
Non cash items (6,372 ) 8,528
Net finance charge 5,845 1,247
Loss on sale of property,plant and
equipment 5 389
Movement in trade and other
receivables (31,608 ) (19,014 )
Movement in Inventories 31 194
Movement in trade and other payables (764 ) 19,556
Cash generated from operations 99,121 124,673
Interest paid (5,215 ) (4,645
Income taxes paid (3,297 ) (5,007 )

Net cash generated from operating
activities $ 90,609 $ 115,021
Cash flows from investing activities:
Purchases of property,plant and
equipment (90 ) (55 )
Proceeds from disposal of property,
plant and equipment 12 241
Purchase of intangible film rights and
related content (128,132 ) (144,301 )
Purchase of intangible assets others (84 ) (199 )
Interest received 2,004 4,562
Net cash used in investing activities
$ (126,290 )
$ (139,752 )
Cash flows from financing activities:
Proceeds from issue of share capital 50,554 -
Proceeds from Disposal of Subsidiary
Shares - 9,527
Repayment of short term debt (2,875 ) (14,334 )
Proceeds from issuance of short term
debt 21,291 6,937
Proceeds from long term borrowings 18,095 -
Repayment of long term borrowings (13,977 ) (5,857 )
Net cash generated from financing
activities $ 73,088 $ (3,727 )
Net increase /(decrease)in cash and
cash equivalents 37,407 (28,458 )
Effect of exchange rate changes on cash
and cash equivalents (4,007 ) (5,037 )

Cash and cash equivalents, beginning of
period 107,642 145,422
Cash and cash equivalents, end of
period $ 141,042 $ 111,927
SUPPLEMENTAL FINANCIAL DATA
REVENUE BY CUSTOMER LOCA
TION
Three Months
Ended
December 31,
Nine Months Ended
December 31,
2013 2012 2013 2012
India $ 43,21
3 $
42,68
7 $ 86,614 $ 108,455
Europe 8,315 7,137 17,870 21,148
North America 3,162 3,089 9,075 6,508
Rest of the world 32,49
7
18,35
9 58,615 27,080
Total revenue $ 87,18
7 $
71,27
2 $
172,17
4 $ 163,191
DEBT
Nominal As at

Interest
Rate
%
Maturit
y
December 31,
2013
March
31,
2013
(in thousands)
Asset backed borrowings
Term loan LIBOR+5.5% 2014-
15 $ 322 $ 928
Term loan LIBOR+8.5% 2014-
15 - 1,055
Term Loan 13.30-
15.00%
2014-
15 862 633
Vehicle Loans 10.00-
15.00%
2014-
15 45 91
Term loan BPLR+1.80% 2016-
17 16,166 18,421
Term Loan BPLR+2.75% 2017-
18 7,390 6,401
Export credit and overdraft BPLR+1.00-
3.50% 2014 23,296 25,600
Export credit and overdraft LIBOR+3.5% 2014 11,465 13,997
Short Term loan BPLRR+2.75
% 2014 10,457 4,605
Unsecured borrowings
Other borrowings 10.5% 2021-
22 9,508 10,257
$175 million revolving facility
LIBOR
+1.9% -
2.9% and
Mandatory
Cost
2016-
17
167,50
0
150,00
0
Commercial Paper 10.65% –
12.25% 2014 15,358 16,579

262,36
9
248,56
7
Cumulative effect of unamortized
costs (2,608 ) (2,767 )
Less Installments due within one
year and
short term borrowings
(92,04
3 )
(79,90
2 )
Long term borrowings - at
amortized
cost
$ 167,71
8 $
165,89
8
Base rate (“BR”) is the Indian equivalent to LIBOR. Asset backed borrowings are secured by fixed and
floating charges over certain group assets.
On July 31, 2013, HSBC acceded as a lender to the revolving credit facility. HSBC’s participation in
the facility is $25.0 million. This increased the total facility amount to $167.5 million, following an
amortization of $7.5 million which occurred in July 2013
ISSUED SHARE CAPITAL
Number of
Shares GBP
(in
thousands)
Authorized
200,000,000 ordinary shares of
10p each (“Ordinary Shares”)
at March 31, 2013
200,000,000 20,000

200,000,000 ordinary shares of
30p each (“Ordinary Shares”)
at December 31, 2013
66,666,667 20,000
Number of
Shares USD
(in
thousands)
Allotted, called up and fully paid A Ordinary 30p
Shares
B Ordinary
30p
Shares
Ordinary 10p
Shares
As at March 2012, - 118,316,424 21,687
Issued of shares on April
24,2012 - - 6,000,943 966
As at March 31,2013 - - 124,317,367 22,653
Issued of shares on August 12,
2013 - - 1,431,000 221
Issued of shares on September
18, 2013 - - 5,029,935 800
One-for-three stock split and
conversion on November 18
2013
18,037,548 25,555,220 (130,778,302) 23,674
Issued of shares on November
18, 2013 5,481,792 - - 2,648
As at December 31, 2013 23,519,340 25,555,220 - 26,322
The one-for-three stock split and conversion of shares from Ordinary 10p shares to A Ordinary 30p
shares and B Ordinary 30p shares is detailed further in the Registration Statement. The issue of
shares A Ordinary 30p shares on November 18, 2013 comprised 5,000,000 shares offered for sale
and 481,792 to satisfy the Share Awards and certain contractual arrangements with one of our
Directors in accordance with the Registration Statement.
SHARE BASED COMPENSATION PLANS

The compensation cost recognized with respect to all outstanding plans and by grant of shares,
which are all equity settled instruments, is as follows:
Three Months Ended
December 31,
Nine Months Ended
December 31,
2013 2012 2013 2012
JSOP $ 47 $ 360 $ 984 $ 922
Staff Grant 6,869 - 12,346 -
IPO India Plan 136 173 391 449
Total $ 7,052 $ 533 $ 13,721 $ 1,371
The vesting and service conditions of the plans are consistent with the arrangements disclosed in
the Registration Statement subject to changes in respect of share numbers and values based on the
three to one share consolidation and the conversion to US dollar based share values based on the
exchange rate ruling on the date the share were listed on the NYSE. This charge has been included in
administrative costs in the Income statement.
EARNINGS PER SHARE
(in thousands, except earnings per share and the number of shares)
Earnings
per share
Three months ended
December 31, 2013 Three months ended
December 31, 2012 Nine months ended
December 31, 2013 Nine months ended
December 31, 2012
Earnings Basic
Diluted Basic Diluted Basic Diluted Basic Diluted
Earnings
attributab $ 15,765 $ 15,765 $ 17,595 $ 17,595 $ 24,576 $ 24,576 $ 21,371 $ 21,371

le to the
equity
holders of
the
parent
Potential
dilutive
effect
related to
share
based
compensa
tion
scheme in
subsidiary
undertaki
ng
- (41 ) - (14 ) - (175 ) - (171 )
Adjusted
earnings
attributab
le to
equity
holders of
the
parent
$ 15,765 $ 15,724 $ 17,595 $ 17,581 $ 24,576 $ 24,401 $ 21,371 $ 21,200
Number
of shares
Weighted
average
number
of shares
40,172,
320
40,172,
320
39,438,
958
39,438,
958
42,449,
756
42,449,
756
39,438,
958
39,438,
958
Potential
or dilutive
effect
related to
share
- 13,899 - 14,524 - 59,112 - 14,524

based
compensa
tion
scheme
Adjusted
weighted
average
number
of shares
4,172,3
20
40,186,
219
39,438,
958
39,453,
482
42,449,
756
42,508,
868
39,438,
958
39,453,
482
Earnings
per share
Earnings
attributab
le to the
equity
holders of
the
parent
per share
(cents)
39.2 39.3 44.6 44.6 57.9 57.4 54.2 53.8
The above table does not split the Earnings per share separately for the A Ordinary 30p shares and
the B Ordinary 30p shares as there is no variation in their entitlement to dividends and capital. The
earnings per share for prior periods have all been restated to reflect the 3-for-1 stock split
conversion on November 18, 2013.
OTHER GAINS AND LOSSES
(in thousands)
Three Months Ended
December 31,
Nine Months Ended
December 31,

2013 2012 2013 2012
Loss on sale of fixed asset $ 5 $ 148 $ 5 $ 389
Net foreign exchange (profit)/ losses (192 ) 214 (367 ) 1,407
Net (profit)/ loss on held for trading
financial liabilities (1,959 ) (1,019 ) (6,961 ) 7,333
Restructuring charges 7,904 - 7,904 -
$ 5,758 $ (657 ) $ 581 $ 9,129
The net (profit)/loss on held for trading financial liabilities principally relates to derivative
instruments not designated in a hedging relationship. Restructuring charges in the three months
ended December 31, 2013 comprise the balance of the NYSE listing costs and AIM delisting costs not
charged to equity, which in total was $13,211,000.
The following table sets forth the reconciliation of the Company's net income to Adjusted EBITDA
Adjusted EBITDA Three Months Ended
December 31,
Nine Months Ended
December 31,
2013 2012 2013 2012
Net Income $ 19,112 $ 21,229 $ 30,754 $ 26,720,
Income tax
expense 11,191 7,514 15,099 9,457
Net finance costs 1,686 751 5,845 1,247
Depreciation 160 205 519 689
Amortization (1) 73 198 325 457
Share based
payments (2) 7,051 533 13,721 1,371
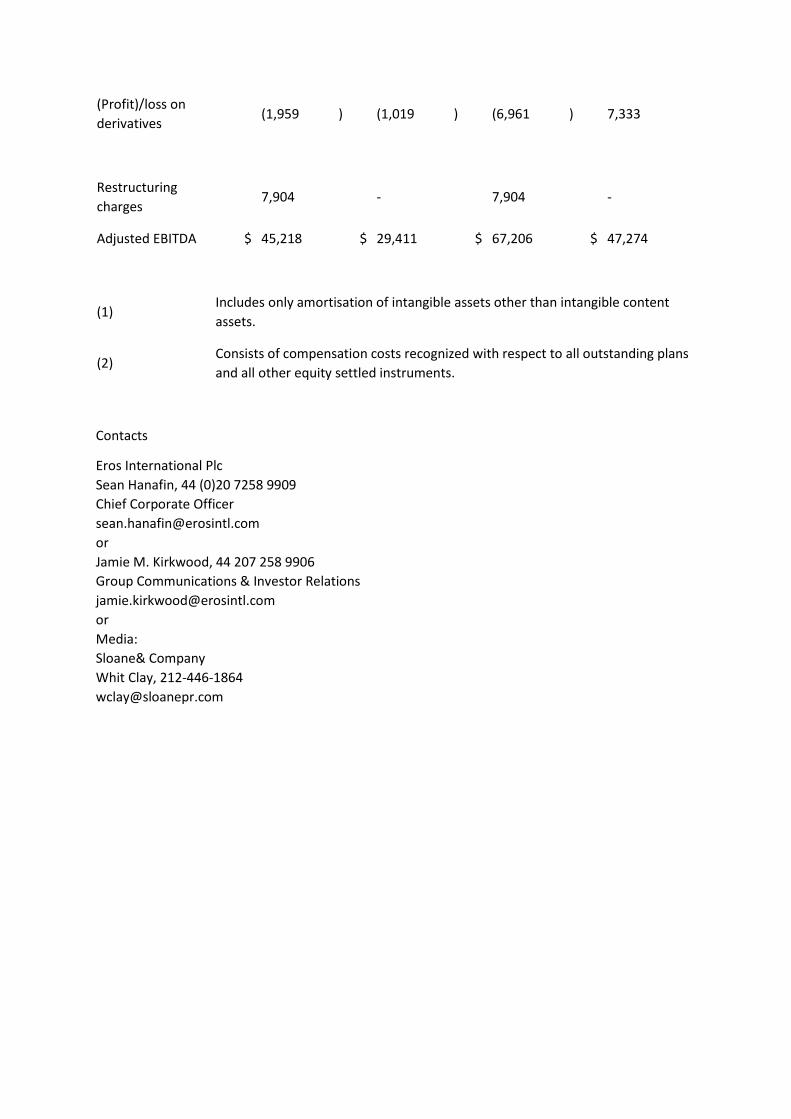
(Profit)/loss on
derivatives (1,959 ) (1,019 ) (6,961 ) 7,333
Restructuring
charges 7,904 - 7,904 -
Adjusted EBITDA $ 45,218 $ 29,411 $ 67,206 $ 47,274
(1) Includes only amortisation of intangible assets other than intangible content
assets.
(2) Consists of compensation costs recognized with respect to all outstanding plans
and all other equity settled instruments.
Contacts
Eros International Plc
Sean Hanafin, 44 (0)20 7258 9909
Chief Corporate Officer
or
Jamie M. Kirkwood, 44 207 258 9906
Group Communications & Investor Relations
or
Media:
Sloane& Company
Whit Clay, 212-446-1864


![[XLS] · Web viewELECTRIC WORD EROS INTERNATIONAL GALLEON HOLDINGS HASGROVE PLC HUVEAUX PLC I-DESIGN GROUP PLC INCAGOLD INDEPENDENT MEDIA DISTRIBUTION ...](https://static.fdocuments.net/doc/165x107/5ae6b44a7f8b9a8b2b8d9cc8/xls-viewelectric-word-eros-international-galleon-holdings-hasgrove-plc-huveaux.jpg)
