
ERNEST ORLANDO LAWRENCE BERKELEY NATIONAL · PDF file... Lynn Price, Ali Hasanbeigi China...
23
Potential for reducing paper mill energy use and carbon dioxide emissions through plant-wide energy audits: A case study in China Lingbo Kong, Lynn Price, Ali Hasanbeigi China Energy Group Environmental Energy Technologies Division Lawrence Berkeley National Laboratory Huanbin Liu, Jigeng Li State Key Laboratory of Pulp and Paper Engineering, South China University of Technology Reprint version of journal article published in “Applied Energy”, Volume 102, February 2013 March 2013 This work was supported by the China Sustainable Energy Program of the Energy Foundation through the U.S. Department of Energy under Contract No. DE-AC02- 05CH11231. ERNEST ORLANDO LAWRENCE BERKELEY NATIONAL LABORATORY LBNL-6170E
-
Upload
trinhtuong -
Category
Documents
-
view
215 -
download
0
Transcript of ERNEST ORLANDO LAWRENCE BERKELEY NATIONAL · PDF file... Lynn Price, Ali Hasanbeigi China...
Potential for reducing paper mill energy use and carbon dioxide emissions through plant-wide energy audits: A case study in China Lingbo Kong, Lynn Price, Ali Hasanbeigi
China Energy Group
Environmental Energy Technologies Division
Lawrence Berkeley National Laboratory
Huanbin Liu, Jigeng Li
State Key Laboratory of Pulp and Paper Engineering,
South China University of Technology
Reprint version of journal article published in “Applied Energy”,
Volume 102, February 2013
March 2013
This work was supported by the China Sustainable Energy Program of the Energy
Foundation through the U.S. Department of Energy under Contract No. DE-AC02-
05CH11231.
ERNEST ORLANDO LAWRENCE
BERKELEY NATIONAL LABORATORY
LBNL-6170E
Disclaimer
This document was prepared as an account of work sponsored by the United States Government. While
this document is believed to contain correct information, neither the United States Government nor any
agency thereof, nor The Regents of the University of California, nor any of their employees, makes any
warranty, express or implied, or assumes any legal responsibility for the accuracy, completeness, or
usefulness of any information, apparatus, product, or process disclosed, or represents that its use would
not infringe privately owned rights. Reference herein to any specific commercial product, process, or
service by its trade name, trademark, manufacturer, or otherwise, does not necessarily constitute or
imply its endorsement, recommendation, or favoring by the United States Government or any agency
thereof, or The Regents of the University of California. The views and opinions of authors expressed
herein do not necessarily state or reflect those of the United States Government or any agency thereof,
or The Regents of the University of California.
Ernest Orlando Lawrence Berkeley National Laboratory is an equal opportunity employer.
This article was originally published in “Applied Energy” (Volume 102, February 2013, Pages 1334-1342)
1
NOTICE: this is the author’s version of a work that was accepted for publication in Applied Energy. Changes
resulting from the publishing process, such as peer review, editing, corrections, structural formatting, and other
quality control mechanisms may not be reflected in this document. Changes may have been made to this work since
it was submitted for publication. A definitive version was subsequently published in Applied Energy, Volume 102,
February 2013, Pages 1334-1342
Potential for reducing paper mill energy use and carbon
dioxide emissions through plant-wide energy audits:
A case study in China
Lingbo Kong1,2, Lynn Price1, Ali Hasanbeigi1, Huanbin Liu2, Jigeng Li2
1China Energy Group
Environmental Energy Technologies Division
Lawrence Berkeley National Laboratory
2State Key Laboratory of Pulp and Paper Engineering
South China University of Technology
Abstract
The pulp and paper industry is one of the most energy-intensive industries worldwide. An energy audit is
a primary step toward improving energy efficiency at the facility level. This paper describes a plant-wide
energy audit aimed at identifying energy conservation and carbon dioxide (CO2) mitigation opportunities
at a paper mill in Guangdong province, China. We describe the energy audit methods, relevant Chinese
standards, methods of calculating energy and carbon indicators, baseline energy consumption and CO2
emissions of the audited paper mill, and nine energy-efficiency improvement opportunities identified by
the audit. For each of the nine options, we evaluate the energy conservation and associated CO2
mitigation potential. The total technical energy conservation potential for these nine opportunities is
967.8 terajoules (TJ), and the total CO2 mitigation potential is equal to 93,453 tonnes CO2 annually,
representing 14.4 percent and 14.7 percent, respectively, of the mill’s total energy consumption and CO2
emissions during the audit period.
1. Introduction
Energy efficiency is one of the most important and cost effective means for reducing industrial energy
consumption and carbon dioxide (CO2) emissions, especially in the near and medium term (Metz,
Davidson, Bosch, Dave, & Meyer, 2007; Worrell, Bernstein, Roy, Price, & Harnisch, 2009). Industrial
This article was originally published in “Applied Energy” (Volume 102, February 2013, Pages 1334-1342)
2
energy efficiency can be improved by various means, including management, technology, policy, and
regulatory strategies (Abdelaziz, Saidur, & Mekhilef, 2011). For almost all energy-saving strategies, a first
step is an energy audit that aims to improve energy efficiency without negatively affecting the facility’s
output (Lu & Price, 2011). Energy audits have contributed significantly to improving energy efficiency in
China (Shen, Price, & Lu, 2012); energy-efficiency opportunities identified through energy audits and
implemented by enterprises reduced China’s energy intensity by 19.1 percent during the 11th five-year
plan (2006-2010).
Energy audits have been carried out in many countries during recent years, and a number of recent
publications support their value and popularity. For example, Schleich (2004) reports that energy audits
could help overcome several barriers to improving energy efficiency in Germany, including providing
missing information about energy consumption patterns and energy-saving measures. Lu and Price
(2011) surveyed 22 industrial energy audit programs offered by governments in 15 countries worldwide
and one region (the European Union) as the basis for recommendations for policy makers on
establishing robust energy audit programs. Shen et al. (2012) studied China’s national energy audit
policies and guidelines and found that energy audits not only helped enterprises identify energy
conservation opportunities but also helped them to improve their energy management structure. As of
December 2011, the U.S. Industrial Assessment Centers had performed a cumulative total of 15,230
plant-wide assessments and made more than 114,227 recommendations for the U.S. industrial plants
(DOE, 2011).
As the fourth largest industrial energy consumer worldwide, the pulp and paper industry consumed 6.87
exajoules (EJ) of final energy in 2007, which accounted for 5 percent of total global industrial energy
consumption and 2 percent of global direct CO2 emissions from the industrial sector in that year
(Trudeau, Tam, Graczyk, & Taylor, 2011). China’s pulp and paper industry alone used 0.75 EJ of final
energy, which represented 11 percent of total final energy used in the global pulp and paper industry in
that year (NBSC., 2010). Recent studies have examined opportunities to reduce the pulp and paper
industry’s energy consumption and CO2 emissions. Klugman et al. (2007) audited a Scandinavian pulp
mill and concluded that 22 percent of electricity and 1 percent of process heat could be saved per year,
for overall energy savings of 113 gigawatt hours (GWh) per year. Gong et al. (2011) using Simprosys
software carried out an energy audit on a paperboard drying line in Slovakia and found three possible
ways to improve dryer energy performance: decreasing heat loss, effectively recovering waste heat, and
shortening drying time. With a data-based energy audit operation in two UK paper machines, Afshar et
al. (2012) found that improving drainage and eliminating over-drying of the sheet provided two
important opportunities for thermal energy reduction in papermaking process. Hong et al. (2011)
analyzed the energy flow of the pulp and paper industry in Taiwan and identified 3.2 petajoules (PJ) of
total energy conservation potential per year, equal to 6.5 percent of Taiwanese pulp and paper industry
energy consumption in 2009. Reese (2012) conducted performance and energy evaluations on more
than 300 paper machines in North America and found that 25 percent of energy consumption in these
paper machines could be reduced without significant capital expenditures.
This article was originally published in “Applied Energy” (Volume 102, February 2013, Pages 1334-1342)
3
To date, few analyses have been published on the potential to improve the energy efficiency and CO2
emissions in China’s pulp and paper industry. This paper reports on an energy audit to identify energy
conservation and CO2 mitigation opportunities at a paper mill located in Guangdong province, South
China. Nine energy-efficiency improvement opportunities were identified based on the audit results.
The energy conservation and CO2 mitigation potential of each measure was evaluated and an economic
analysis was performed. For confidentiality reasons, the name and exact location of the mill are not
identified.
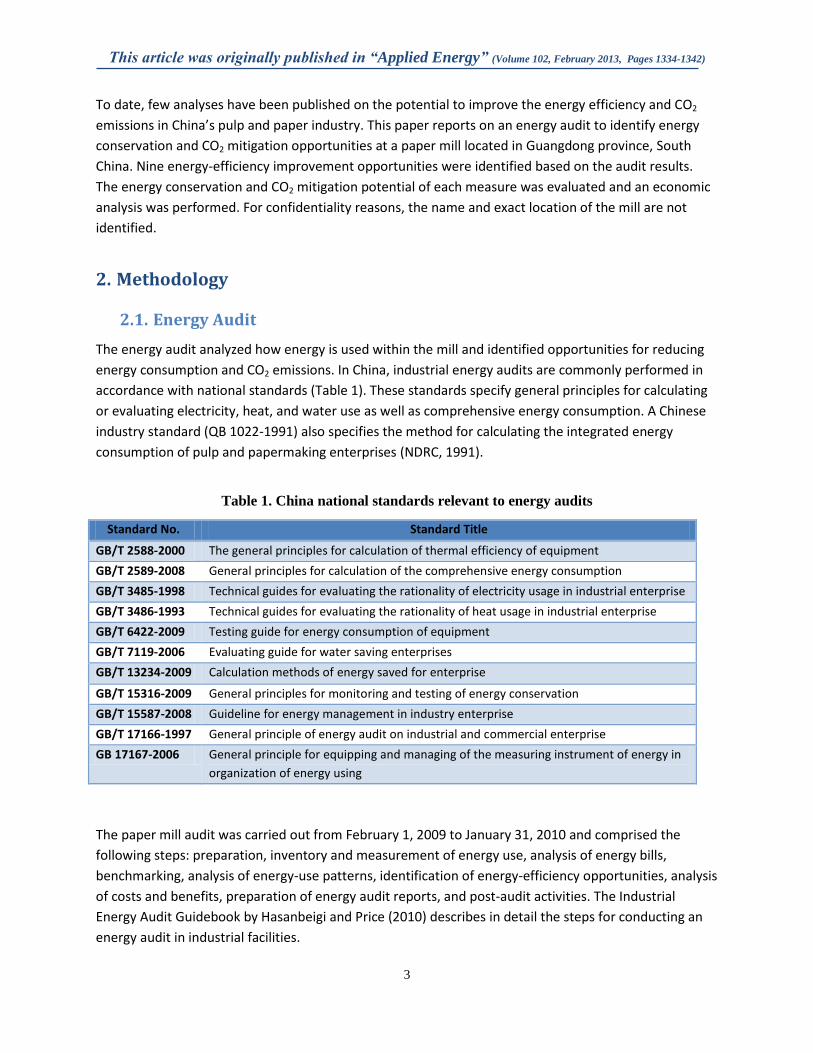
2. Methodology
2.1. Energy Audit
The energy audit analyzed how energy is used within the mill and identified opportunities for reducing
energy consumption and CO2 emissions. In China, industrial energy audits are commonly performed in
accordance with national standards (Table 1). These standards specify general principles for calculating
or evaluating electricity, heat, and water use as well as comprehensive energy consumption. A Chinese
industry standard (QB 1022-1991) also specifies the method for calculating the integrated energy
consumption of pulp and papermaking enterprises (NDRC, 1991).
Table 1. China national standards relevant to energy audits
Standard No. Standard Title
GB/T 2588-2000 The general principles for calculation of thermal efficiency of equipment
GB/T 2589-2008 General principles for calculation of the comprehensive energy consumption
GB/T 3485-1998 Technical guides for evaluating the rationality of electricity usage in industrial enterprise
GB/T 3486-1993 Technical guides for evaluating the rationality of heat usage in industrial enterprise
GB/T 6422-2009 Testing guide for energy consumption of equipment
GB/T 7119-2006 Evaluating guide for water saving enterprises
GB/T 13234-2009 Calculation methods of energy saved for enterprise
GB/T 15316-2009 General principles for monitoring and testing of energy conservation
GB/T 15587-2008 Guideline for energy management in industry enterprise
GB/T 17166-1997 General principle of energy audit on industrial and commercial enterprise
GB 17167-2006 General principle for equipping and managing of the measuring instrument of energy in
organization of energy using
The paper mill audit was carried out from February 1, 2009 to January 31, 2010 and comprised the
following steps: preparation, inventory and measurement of energy use, analysis of energy bills,
benchmarking, analysis of energy-use patterns, identification of energy-efficiency opportunities, analysis
of costs and benefits, preparation of energy audit reports, and post-audit activities. The Industrial
Energy Audit Guidebook by Hasanbeigi and Price (2010) describes in detail the steps for conducting an
energy audit in industrial facilities.
This article was originally published in “Applied Energy” (Volume 102, February 2013, Pages 1334-1342)
4
The data used in this audit came chiefly from the mill’s statistical report, plant energy bills, discussions
with plant operators, and field measurements conducted at the mill. The best available technology (BAT)
energy intensity values for different paper grades that we used for benchmarking were cited from a
study by Jacobs Engineering and the Institute of Paper Science and Technology (2006) (Kinstrey & White).
Considering the paper machines use the majority of energy at a paper mill, and some operational
parameters for paper machines are not available, Kong et al. (2011) introduced a method of making field
measurements to determine the energy performance of a papermaking process, which we used for this
analysis.
2.2. Energy Intensity (EI)
The papermaking process mainly uses energy in the form of electricity and heat, so the energy intensity
of the process is expressed using electricity intensity, thermal energy intensity, final energy intensity,
and primary energy intensity (Eq. (1)). This energy intensity calculation can be used to benchmark any
similar paper machine or mill.
)(
)(
rtonne pape Production
kWh or GJ sumptionEnergy conEI
PM
PM,i
PM,i (1)
Where EIPM,i is the energy intensity of the paper machine or paper mill in the form of electricity, thermal
energy, final energy, or primary energy (kilowatt hour [kWh] or gigajoule [GJ]/tonne paper).
A factor of 3.6 MJ/kWh is used to convert electricity to final energy. Primary energy is converted from
final energy with related conversion factors. Note that the factor for converting electricity (CFelec) from
final to primary energy might vary for different paper mills, because some mills only use self-generated
electricity while others, especially small and medium paper mills, also use electricity purchased from the
power grid. For the power purchased from the grid, a CFelec of 2.97 can be used for China’s pulp and
paper industry. This factor is calculated from the average net heat rates of coal-fired power plants and
includes the transmission and distribution losses of China’s power grid (CEC & EDF 2011). For the portion
of electricity that is self generated, the CFelec is specific and depends on the net heat rate of supplied
electricity in the mill. Because electricity is self generated in the paper mill studied here, a conversion
factor of 3.17 is used in our analysis. This value is equivalent to the average net generation heat rate at
the mill in 2009.
2.3. CO2 Intensity
Emissions of CO2 are expressed in tonnes. The basic equation for calculating CO2 intensity is:
per) (tonne paoduction
)O (tonnes C emissionsCOensity CO
PM
PMPM
Print 22
2 (2)
The overall CO2 emissions from a paper mill or paper machine are calculated by multiplying the energy
consumption of each type of fuel by the associated emission factor (EFi):
i
iPMiPM2 sumptionEnergy conEF emissionsCO )( , (3)
This article was originally published in “Applied Energy” (Volume 102, February 2013, Pages 1334-1342)
5
The emissions factors (EF) used for calculating CO2 emissions from fossil fuel consumption are taken
from the 2006 Intergovernmental Panel on Climate Change Guidelines for National Greenhouse Gas
Inventories (IPCC, 2006). The power grid emissions factors vary for different regions in China and can be
obtained from China’s Baseline Emission Factors for Regional Power Grids in 2009 (NDRC, 2009). For the
South China Power Grid, the emissions factor was 0.788 kilograms (kg) CO2/kWh in 2009. This emission
factor is specific for those paper mills that self-generate electricity.
2.4. Energy Intensity Index (EII)
We use the energy intensity index (EII) to benchmark actual energy performance of the paper machines.
The EII indicates how much energy could be saved if BAT were applied to the machine. EII can be
calculated from the ratio between the actual energy intensity (EIPM) and the benchmark energy intensity
(EIBAT), as follows (Hasanbeigi, Price, Lu, & Wang, 2010; Phylipsen, Blok, Worrell, & Beer, 2002):
EIoduction
sumptionEnergy con
EI
EIEII
BATPM
PM,i
BAT
PMPM
Pr100100 (4)
in which EIIPM is the energy intensity index of a paper machine, EIPM is the actual energy intensity of a
paper machine (GJ/tonne paper), and EIBAT is the benchmark energy intensity of the similar paper
machine with the unit of GJ/tonne paper.
The energy conservation potential can be estimated from Eq. (4). The EII would equal to 100 only if the
paper machine used BAT. Actual paper machines will have an EII higher than 100. The gap between
actual and benchmark intensities can be viewed as the energy-efficiency potential of the machine.
3. Overview of the Paper Mill
3.1. The Mill and Papermaking Process
The paper mill studied in this report is located in Guangdong province and is one of the Top-1,000
energy-consuming enterprises in China. It is a standalone paper mill. The raw material for papermaking
is non-deinked pulp made from recycled waste paper. The mill has four paper production lines that
manufactured corrugated medium and linerboard. Table 2 shows the details of each of the mill’s paper
machine.
This article was originally published in “Applied Energy” (Volume 102, February 2013, Pages 1334-1342)
6
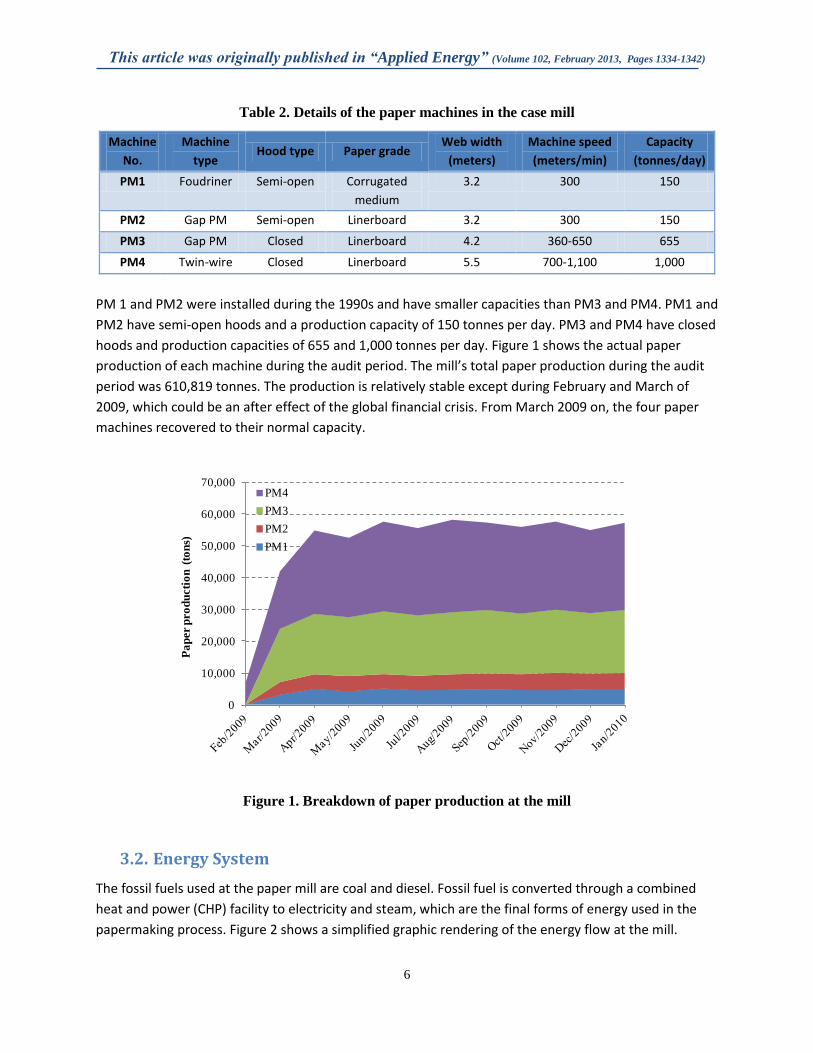
Table 2. Details of the paper machines in the case mill
Machine
No.
Machine
type Hood type Paper grade
Web width
(meters)
Machine speed
(meters/min)
Capacity
(tonnes/day)
PM1 Foudriner Semi-open Corrugated
medium
3.2 300 150
PM2 Gap PM Semi-open Linerboard 3.2 300 150
PM3 Gap PM Closed Linerboard 4.2 360-650 655
PM4 Twin-wire Closed Linerboard 5.5 700-1,100 1,000
PM 1 and PM2 were installed during the 1990s and have smaller capacities than PM3 and PM4. PM1 and
PM2 have semi-open hoods and a production capacity of 150 tonnes per day. PM3 and PM4 have closed
hoods and production capacities of 655 and 1,000 tonnes per day. Figure 1 shows the actual paper
production of each machine during the audit period. The mill’s total paper production during the audit
period was 610,819 tonnes. The production is relatively stable except during February and March of
2009, which could be an after effect of the global financial crisis. From March 2009 on, the four paper
machines recovered to their normal capacity.
0
10,000
20,000
30,000
40,000
50,000
60,000
70,000
Pa
per p
ro
du
cti
on
(to
ns)
PM4
PM3
PM2
PM1
Figure 1. Breakdown of paper production at the mill
3.2. Energy System
The fossil fuels used at the paper mill are coal and diesel. Fossil fuel is converted through a combined
heat and power (CHP) facility to electricity and steam, which are the final forms of energy used in the
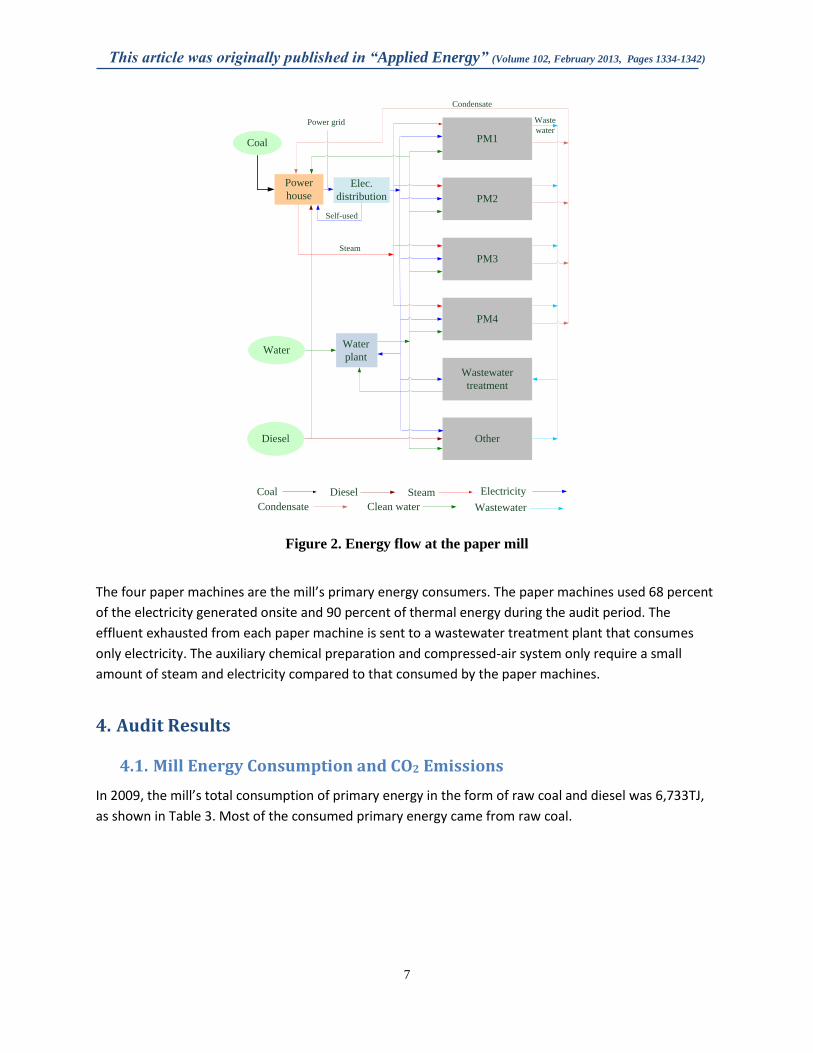
papermaking process. Figure 2 shows a simplified graphic rendering of the energy flow at the mill.
This article was originally published in “Applied Energy” (Volume 102, February 2013, Pages 1334-1342)
7
Coal
Water
Diesel
Power
house
PM1
PM3
PM4
Wastewater
treatment
Other
Steam
Water
plant
Diesel Electricity
Elec.
distribution PM2
Clean water
Self-used
Steam
Waste
water
Coal
Wastewater
Power grid
Condensate
Condensate
Figure 2. Energy flow at the paper mill
The four paper machines are the mill’s primary energy consumers. The paper machines used 68 percent
of the electricity generated onsite and 90 percent of thermal energy during the audit period. The
effluent exhausted from each paper machine is sent to a wastewater treatment plant that consumes
only electricity. The auxiliary chemical preparation and compressed-air system only require a small
amount of steam and electricity compared to that consumed by the paper machines.
4. Audit Results
4.1. Mill Energy Consumption and CO2 Emissions
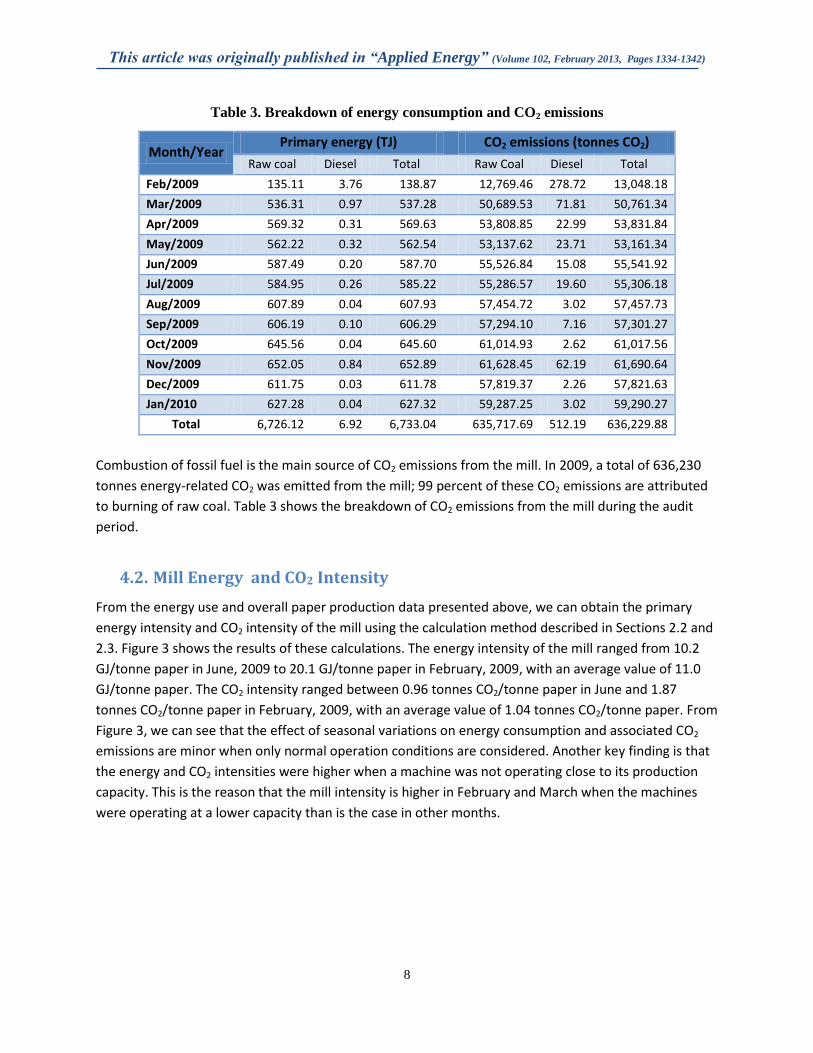
In 2009, the mill’s total consumption of primary energy in the form of raw coal and diesel was 6,733TJ,
as shown in Table 3. Most of the consumed primary energy came from raw coal.
This article was originally published in “Applied Energy” (Volume 102, February 2013, Pages 1334-1342)
8
Table 3. Breakdown of energy consumption and CO2 emissions
Month/Year Primary energy (TJ)
CO2 emissions (tonnes CO2)
Raw coal Diesel Total
Raw Coal Diesel Total
Feb/2009 135.11 3.76 138.87 12,769.46 278.72 13,048.18
Mar/2009 536.31 0.97 537.28 50,689.53 71.81 50,761.34
Apr/2009 569.32 0.31 569.63 53,808.85 22.99 53,831.84
May/2009 562.22 0.32 562.54 53,137.62 23.71 53,161.34
Jun/2009 587.49 0.20 587.70 55,526.84 15.08 55,541.92
Jul/2009 584.95 0.26 585.22 55,286.57 19.60 55,306.18
Aug/2009 607.89 0.04 607.93 57,454.72 3.02 57,457.73
Sep/2009 606.19 0.10 606.29 57,294.10 7.16 57,301.27
Oct/2009 645.56 0.04 645.60 61,014.93 2.62 61,017.56
Nov/2009 652.05 0.84 652.89 61,628.45 62.19 61,690.64
Dec/2009 611.75 0.03 611.78 57,819.37 2.26 57,821.63
Jan/2010 627.28 0.04 627.32 59,287.25 3.02 59,290.27
Total 6,726.12 6.92 6,733.04 635,717.69 512.19 636,229.88
Combustion of fossil fuel is the main source of CO2 emissions from the mill. In 2009, a total of 636,230
tonnes energy-related CO2 was emitted from the mill; 99 percent of these CO2 emissions are attributed
to burning of raw coal. Table 3 shows the breakdown of CO2 emissions from the mill during the audit
period.
4.2. Mill Energy and CO2 Intensity
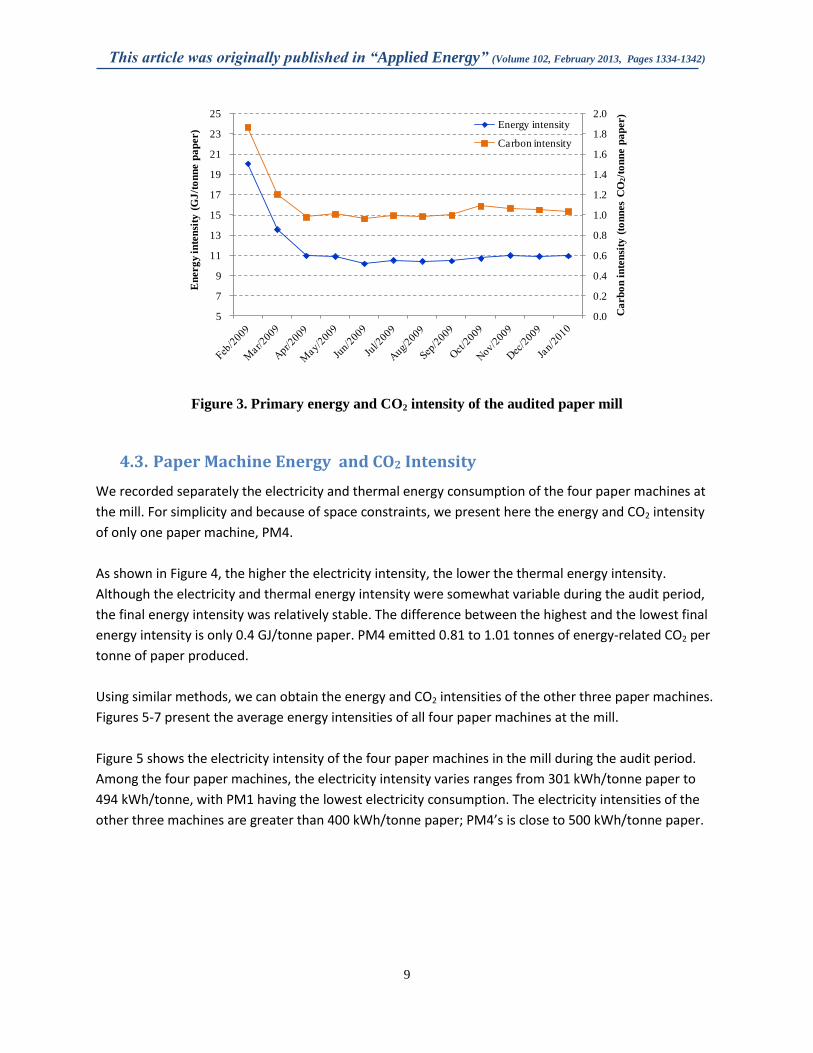
From the energy use and overall paper production data presented above, we can obtain the primary
energy intensity and CO2 intensity of the mill using the calculation method described in Sections 2.2 and
2.3. Figure 3 shows the results of these calculations. The energy intensity of the mill ranged from 10.2
GJ/tonne paper in June, 2009 to 20.1 GJ/tonne paper in February, 2009, with an average value of 11.0
GJ/tonne paper. The CO2 intensity ranged between 0.96 tonnes CO2/tonne paper in June and 1.87
tonnes CO2/tonne paper in February, 2009, with an average value of 1.04 tonnes CO2/tonne paper. From
Figure 3, we can see that the effect of seasonal variations on energy consumption and associated CO2
emissions are minor when only normal operation conditions are considered. Another key finding is that
the energy and CO2 intensities were higher when a machine was not operating close to its production
capacity. This is the reason that the mill intensity is higher in February and March when the machines
were operating at a lower capacity than is the case in other months.
This article was originally published in “Applied Energy” (Volume 102, February 2013, Pages 1334-1342)
9
0.0
0.2
0.4
0.6
0.8
1.0
1.2
1.4
1.6
1.8
2.0
5
7
9
11
13
15
17
19
21
23
25
En
erg
y in
ten
sity
(G
J/t
on
ne p
ap
er)
Energy intensity
Carbon intensity
Ca
rb
on
in
ten
sity
(to
nn
es
CO
2/t
on
ne p
ap
er)
Figure 3. Primary energy and CO2 intensity of the audited paper mill
4.3. Paper Machine Energy and CO2 Intensity
We recorded separately the electricity and thermal energy consumption of the four paper machines at
the mill. For simplicity and because of space constraints, we present here the energy and CO2 intensity
of only one paper machine, PM4.
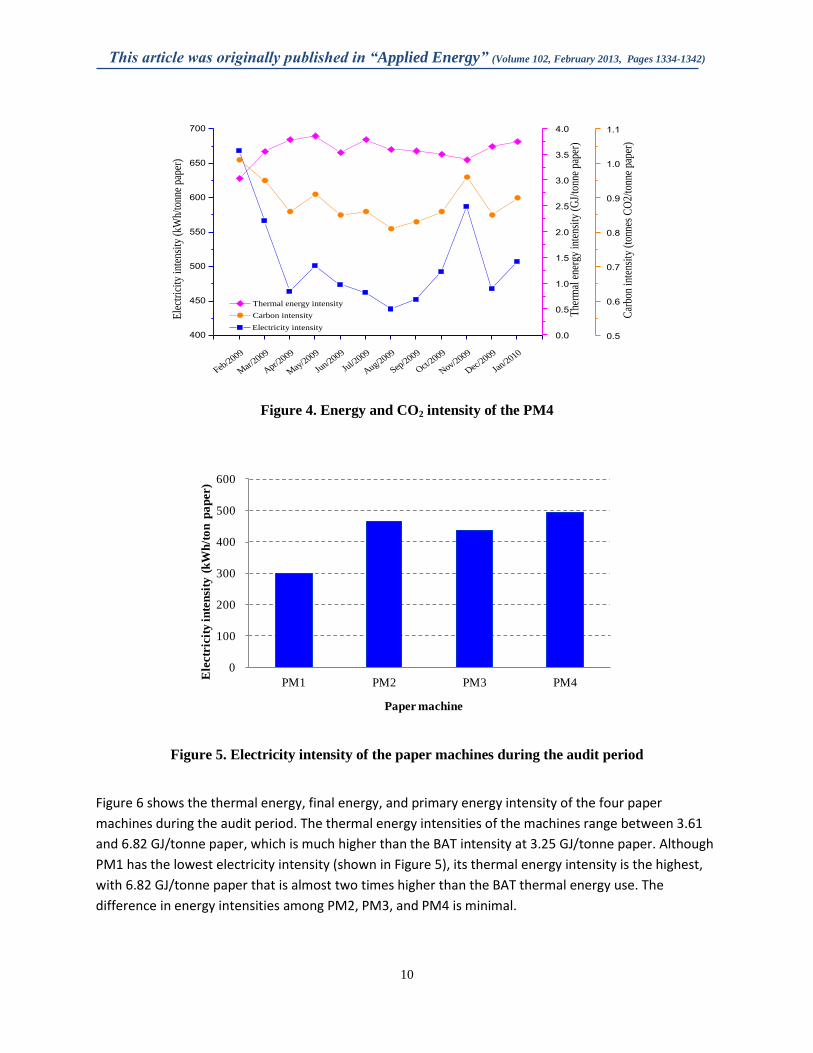
As shown in Figure 4, the higher the electricity intensity, the lower the thermal energy intensity.
Although the electricity and thermal energy intensity were somewhat variable during the audit period,
the final energy intensity was relatively stable. The difference between the highest and the lowest final
energy intensity is only 0.4 GJ/tonne paper. PM4 emitted 0.81 to 1.01 tonnes of energy-related CO2 per
tonne of paper produced.
Using similar methods, we can obtain the energy and CO2 intensities of the other three paper machines.
Figures 5-7 present the average energy intensities of all four paper machines at the mill.
Figure 5 shows the electricity intensity of the four paper machines in the mill during the audit period.
Among the four paper machines, the electricity intensity varies ranges from 301 kWh/tonne paper to
494 kWh/tonne, with PM1 having the lowest electricity consumption. The electricity intensities of the
other three machines are greater than 400 kWh/tonne paper; PM4’s is close to 500 kWh/tonne paper.
This article was originally published in “Applied Energy” (Volume 102, February 2013, Pages 1334-1342)
10
Feb/2009
Mar/
2009
Apr/2009
May
/2009
Jun/2009
Jul/2
009
Aug/2009
Sep/2009
Oct/2009
Nov/2009
Dec/2009
Jan/2010
400
450
500
550
600
650
700
Ele
ctri
city
inte
nsit
y (k
Wh/
tonn
e pa
per)
Electricity intensity0.0
0.5
1.0
1.5
2.0
2.5
3.0
3.5
4.0
Thermal energy intensity
The
rmal
ene
rgy
inte
nsit
y (G
J/to
nne
pape
r)
0.5
0.6
0.7
0.8
0.9
1.0
1.1
Car
bon
inte
nsit
y (t
onne
s C
O2/
tonn
e pa
per)
Carbon intensity
Figure 4. Energy and CO2 intensity of the PM4
0
100
200
300
400
500
600
PM1 PM2 PM3 PM4
Ele
ctr
icit
y in
ten
sity
(k
Wh
/to
n p
ap
er)
Paper machine
Figure 5. Electricity intensity of the paper machines during the audit period
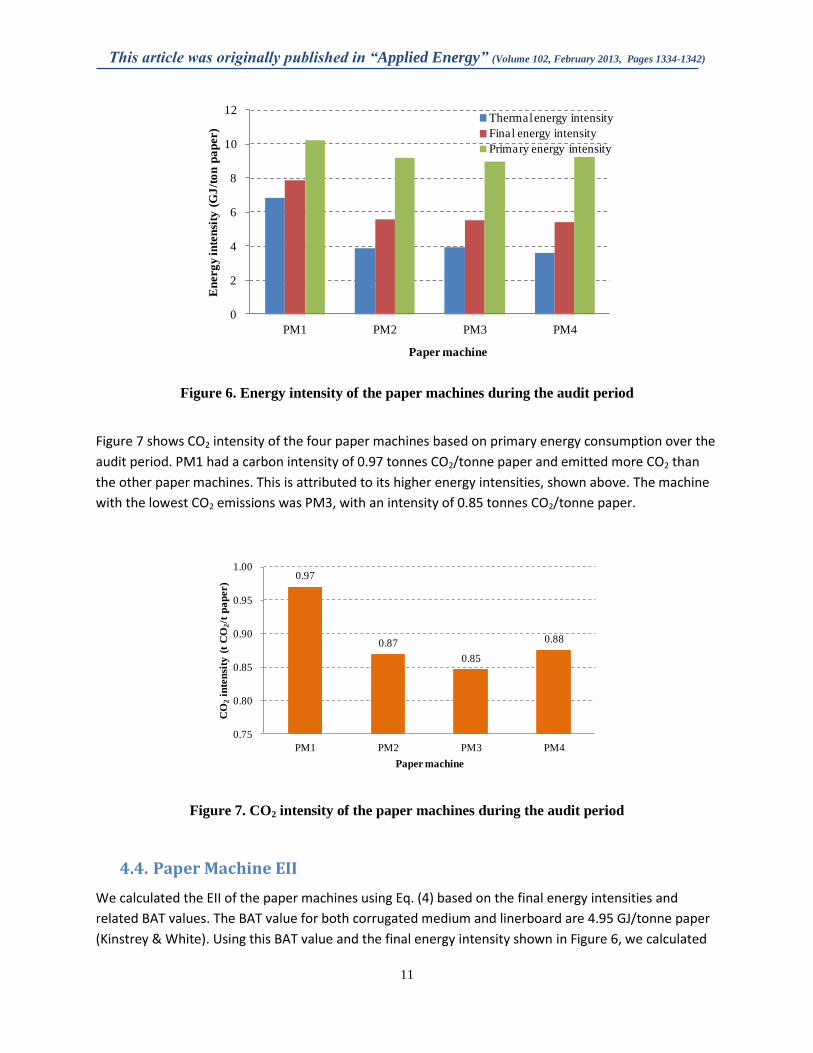
Figure 6 shows the thermal energy, final energy, and primary energy intensity of the four paper
machines during the audit period. The thermal energy intensities of the machines range between 3.61
and 6.82 GJ/tonne paper, which is much higher than the BAT intensity at 3.25 GJ/tonne paper. Although
PM1 has the lowest electricity intensity (shown in Figure 5), its thermal energy intensity is the highest,
with 6.82 GJ/tonne paper that is almost two times higher than the BAT thermal energy use. The
difference in energy intensities among PM2, PM3, and PM4 is minimal.
This article was originally published in “Applied Energy” (Volume 102, February 2013, Pages 1334-1342)
11
0
2
4
6
8
10
12
PM1 PM2 PM3 PM4
En
erg
y in
ten
sity
(G
J/t
on
pa
per)
Paper machine
Thermal energy intensity
Final energy intensity
Primary energy intensity
Figure 6. Energy intensity of the paper machines during the audit period
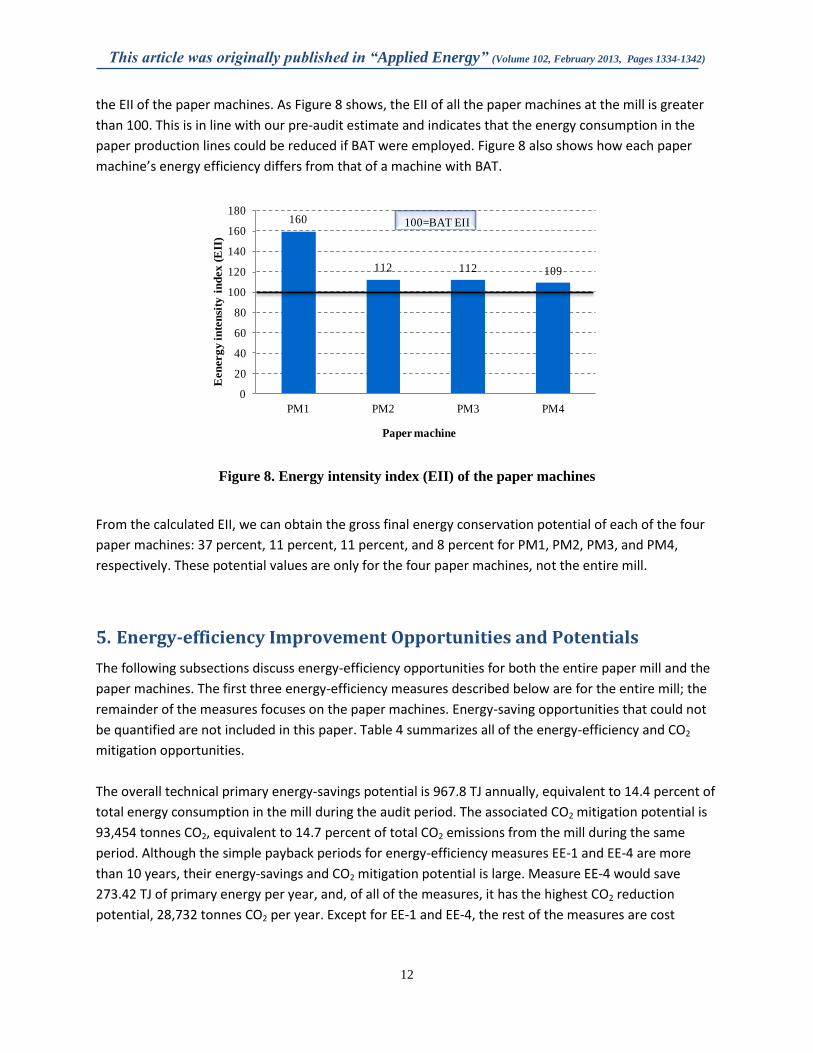
Figure 7 shows CO2 intensity of the four paper machines based on primary energy consumption over the
audit period. PM1 had a carbon intensity of 0.97 tonnes CO2/tonne paper and emitted more CO2 than
the other paper machines. This is attributed to its higher energy intensities, shown above. The machine
with the lowest CO2 emissions was PM3, with an intensity of 0.85 tonnes CO2/tonne paper.
0.97
0.87
0.85
0.88
0.75
0.80
0.85
0.90
0.95
1.00
PM1 PM2 PM3 PM4
CO
2in
ten
sity
(t
CO
2/t
pa
per)
Paper machine
Figure 7. CO2 intensity of the paper machines during the audit period
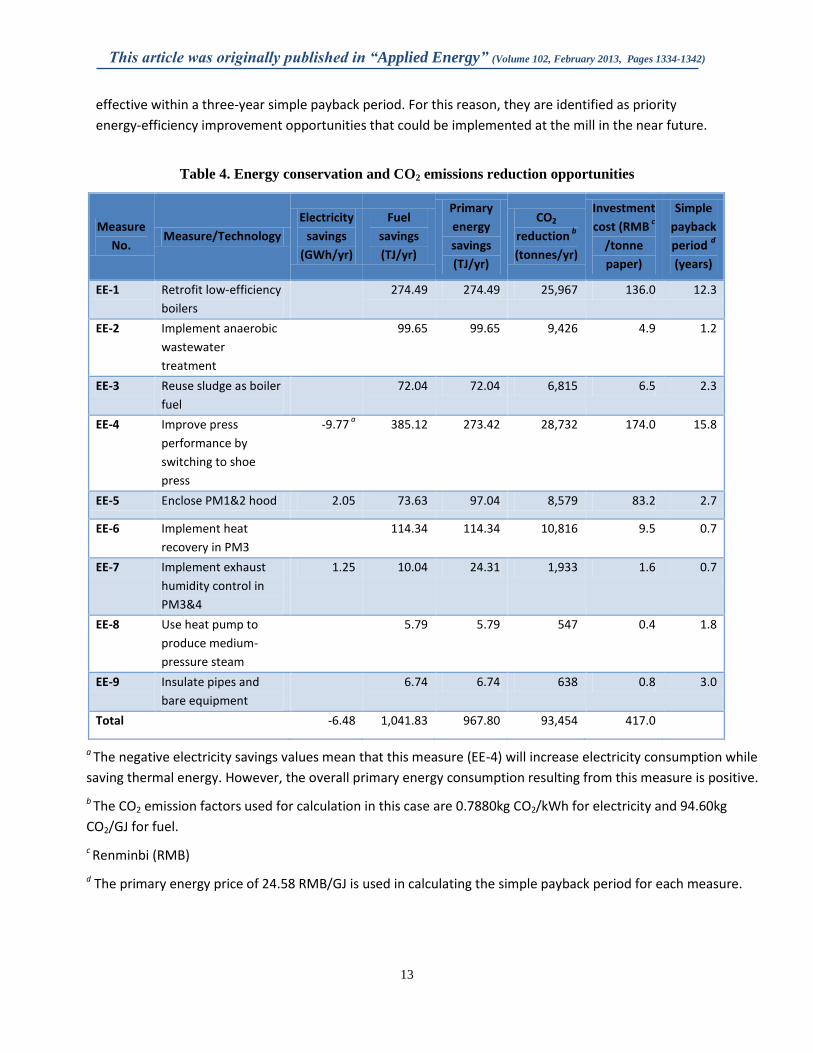
4.4. Paper Machine EII
We calculated the EII of the paper machines using Eq. (4) based on the final energy intensities and
related BAT values. The BAT value for both corrugated medium and linerboard are 4.95 GJ/tonne paper
(Kinstrey & White). Using this BAT value and the final energy intensity shown in Figure 6, we calculated
This article was originally published in “Applied Energy” (Volume 102, February 2013, Pages 1334-1342)
12
the EII of the paper machines. As Figure 8 shows, the EII of all the paper machines at the mill is greater
than 100. This is in line with our pre-audit estimate and indicates that the energy consumption in the
paper production lines could be reduced if BAT were employed. Figure 8 also shows how each paper
machine’s energy efficiency differs from that of a machine with BAT.
160
112 112 109
0
20
40
60
80
100
120
140
160
180
PM1 PM2 PM3 PM4
Een
erg
y in
ten
sity
in
dex
(E
II)
Paper machine
100=BAT EII
Figure 8. Energy intensity index (EII) of the paper machines
From the calculated EII, we can obtain the gross final energy conservation potential of each of the four
paper machines: 37 percent, 11 percent, 11 percent, and 8 percent for PM1, PM2, PM3, and PM4,
respectively. These potential values are only for the four paper machines, not the entire mill.
5. Energy-efficiency Improvement Opportunities and Potentials
The following subsections discuss energy-efficiency opportunities for both the entire paper mill and the
paper machines. The first three energy-efficiency measures described below are for the entire mill; the
remainder of the measures focuses on the paper machines. Energy-saving opportunities that could not
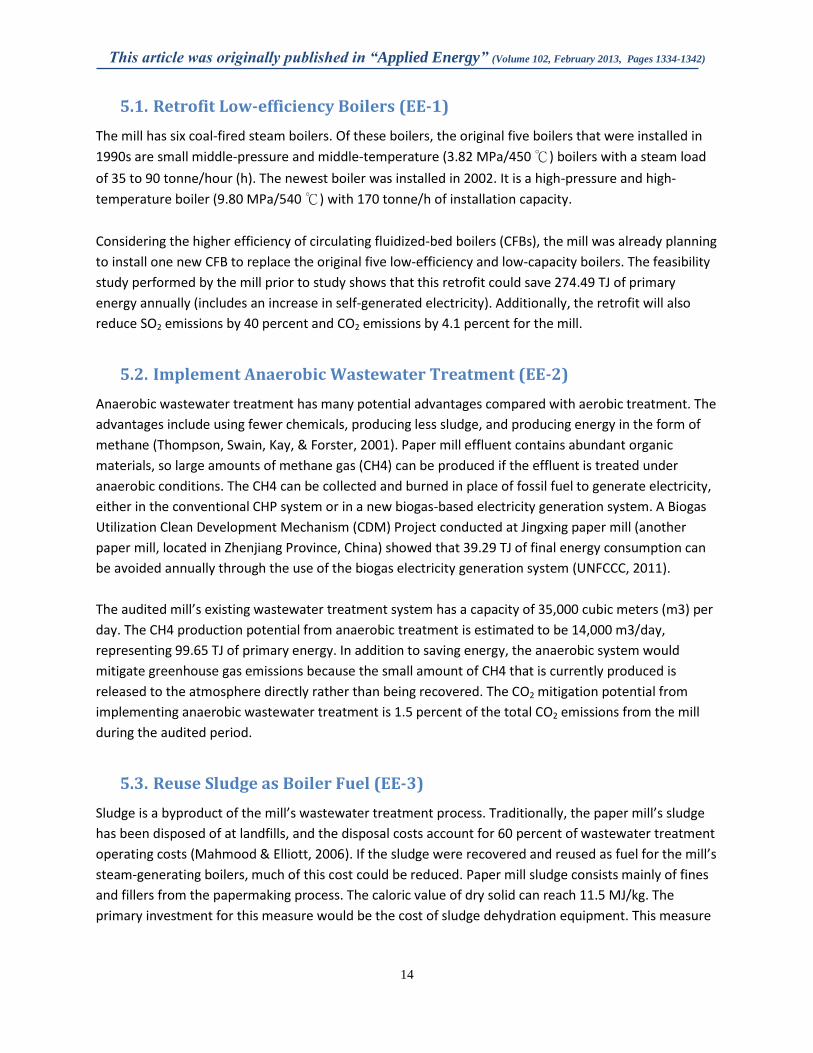
be quantified are not included in this paper. Table 4 summarizes all of the energy-efficiency and CO2
mitigation opportunities.
The overall technical primary energy-savings potential is 967.8 TJ annually, equivalent to 14.4 percent of
total energy consumption in the mill during the audit period. The associated CO2 mitigation potential is
93,454 tonnes CO2, equivalent to 14.7 percent of total CO2 emissions from the mill during the same
period. Although the simple payback periods for energy-efficiency measures EE-1 and EE-4 are more
than 10 years, their energy-savings and CO2 mitigation potential is large. Measure EE-4 would save
273.42 TJ of primary energy per year, and, of all of the measures, it has the highest CO2 reduction
potential, 28,732 tonnes CO2 per year. Except for EE-1 and EE-4, the rest of the measures are cost
This article was originally published in “Applied Energy” (Volume 102, February 2013, Pages 1334-1342)
13
effective within a three-year simple payback period. For this reason, they are identified as priority
energy-efficiency improvement opportunities that could be implemented at the mill in the near future.
Table 4. Energy conservation and CO2 emissions reduction opportunities
Measure
No. Measure/Technology
Electricity
savings
(GWh/yr)
Fuel
savings
(TJ/yr)
Primary
energy
savings
(TJ/yr)
CO2
reduction b
(tonnes/yr)
Investment
cost (RMB c
/tonne
paper)
Simple
payback
period d
(years)
EE-1 Retrofit low-efficiency
boilers
274.49 274.49 25,967 136.0 12.3
EE-2 Implement anaerobic
wastewater
treatment
99.65 99.65 9,426 4.9 1.2
EE-3 Reuse sludge as boiler
fuel
72.04 72.04 6,815 6.5 2.3
EE-4 Improve press
performance by
switching to shoe
press
-9.77 a
385.12 273.42 28,732 174.0 15.8
EE-5 Enclose PM1&2 hood 2.05 73.63 97.04 8,579 83.2 2.7
EE-6 Implement heat
recovery in PM3
114.34 114.34 10,816 9.5 0.7
EE-7 Implement exhaust
humidity control in
PM3&4
1.25 10.04 24.31 1,933 1.6 0.7
EE-8 Use heat pump to
produce medium-
pressure steam
5.79 5.79 547 0.4 1.8
EE-9 Insulate pipes and
bare equipment
6.74 6.74 638 0.8 3.0
Total -6.48 1,041.83 967.80 93,454 417.0
a The negative electricity savings values mean that this measure (EE-4) will increase electricity consumption while
saving thermal energy. However, the overall primary energy consumption resulting from this measure is positive.
b The CO2 emission factors used for calculation in this case are 0.7880kg CO2/kWh for electricity and 94.60kg
CO2/GJ for fuel.
c Renminbi (RMB)
d The primary energy price of 24.58 RMB/GJ is used in calculating the simple payback period for each measure.
This article was originally published in “Applied Energy” (Volume 102, February 2013, Pages 1334-1342)
14
5.1. Retrofit Low-efficiency Boilers (EE-1)
The mill has six coal-fired steam boilers. Of these boilers, the original five boilers that were installed in
1990s are small middle-pressure and middle-temperature (3.82 MPa/450 ℃) boilers with a steam load
of 35 to 90 tonne/hour (h). The newest boiler was installed in 2002. It is a high-pressure and high-
temperature boiler (9.80 MPa/540 ℃) with 170 tonne/h of installation capacity.
Considering the higher efficiency of circulating fluidized-bed boilers (CFBs), the mill was already planning
to install one new CFB to replace the original five low-efficiency and low-capacity boilers. The feasibility
study performed by the mill prior to study shows that this retrofit could save 274.49 TJ of primary
energy annually (includes an increase in self-generated electricity). Additionally, the retrofit will also
reduce SO2 emissions by 40 percent and CO2 emissions by 4.1 percent for the mill.
5.2. Implement Anaerobic Wastewater Treatment (EE-2)
Anaerobic wastewater treatment has many potential advantages compared with aerobic treatment. The
advantages include using fewer chemicals, producing less sludge, and producing energy in the form of
methane (Thompson, Swain, Kay, & Forster, 2001). Paper mill effluent contains abundant organic
materials, so large amounts of methane gas (CH4) can be produced if the effluent is treated under
anaerobic conditions. The CH4 can be collected and burned in place of fossil fuel to generate electricity,
either in the conventional CHP system or in a new biogas-based electricity generation system. A Biogas
Utilization Clean Development Mechanism (CDM) Project conducted at Jingxing paper mill (another
paper mill, located in Zhenjiang Province, China) showed that 39.29 TJ of final energy consumption can
be avoided annually through the use of the biogas electricity generation system (UNFCCC, 2011).
The audited mill’s existing wastewater treatment system has a capacity of 35,000 cubic meters (m3) per
day. The CH4 production potential from anaerobic treatment is estimated to be 14,000 m3/day,
representing 99.65 TJ of primary energy. In addition to saving energy, the anaerobic system would
mitigate greenhouse gas emissions because the small amount of CH4 that is currently produced is
released to the atmosphere directly rather than being recovered. The CO2 mitigation potential from
implementing anaerobic wastewater treatment is 1.5 percent of the total CO2 emissions from the mill
during the audited period.
5.3. Reuse Sludge as Boiler Fuel (EE-3)
Sludge is a byproduct of the mill’s wastewater treatment process. Traditionally, the paper mill’s sludge
has been disposed of at landfills, and the disposal costs account for 60 percent of wastewater treatment
operating costs (Mahmood & Elliott, 2006). If the sludge were recovered and reused as fuel for the mill’s
steam-generating boilers, much of this cost could be reduced. Paper mill sludge consists mainly of fines
and fillers from the papermaking process. The caloric value of dry solid can reach 11.5 MJ/kg. The
primary investment for this measure would be the cost of sludge dehydration equipment. This measure
This article was originally published in “Applied Energy” (Volume 102, February 2013, Pages 1334-1342)
15
would reduce the fossil fuel used in boilers, thus mitigating the environmental impacts of obtaining the
fuel as well as the emissions from burning it.
The mill’s current sludge production is 100 tonnes per day, and the sludge water content is 75 to 80
percent. After the sludge is dehydrated to about 40 percent moisture, it can be mixed with fossil fuels
and fed into boilers, resulting in 72.04 TJ of primary energy savings per year. Using sludge in the boilers
will also reduce total CO2 emissions from the mill by 1.1 percent with a payback period of only 2.3 years.
5.4. Improve Press Performance by Switching to Shoe Press (EE-4)
The papermaking process is essentially a massive dewatering process. Most of the water is removed in
the wire section and press section of a paper machine; only about 1 percent of the original water
content is removed in the dryer section (Kong & Liu, 2012). However, the dryer section is the largest
energy user in terms of thermal energy utilization. Therefore, maximizing the performance of the press
section is critical to minimizing the dryers’ energy consumption (Reese, 2006). It is estimated that 3 to 8
percent of dryer steam can be reduced for every one-percent improvement in the solids content of web
exiting the press section. The shoe press was developed to extend dwell time and thus improve
mechanical dewatering in conventional roll presses. The web solids content leaving a shoe press can be
as much as 50 to 55 percent, which will improves the overall energy efficiency despite even though a
shoe press consumes more electricity than a conventional press does (Holik, 2006).
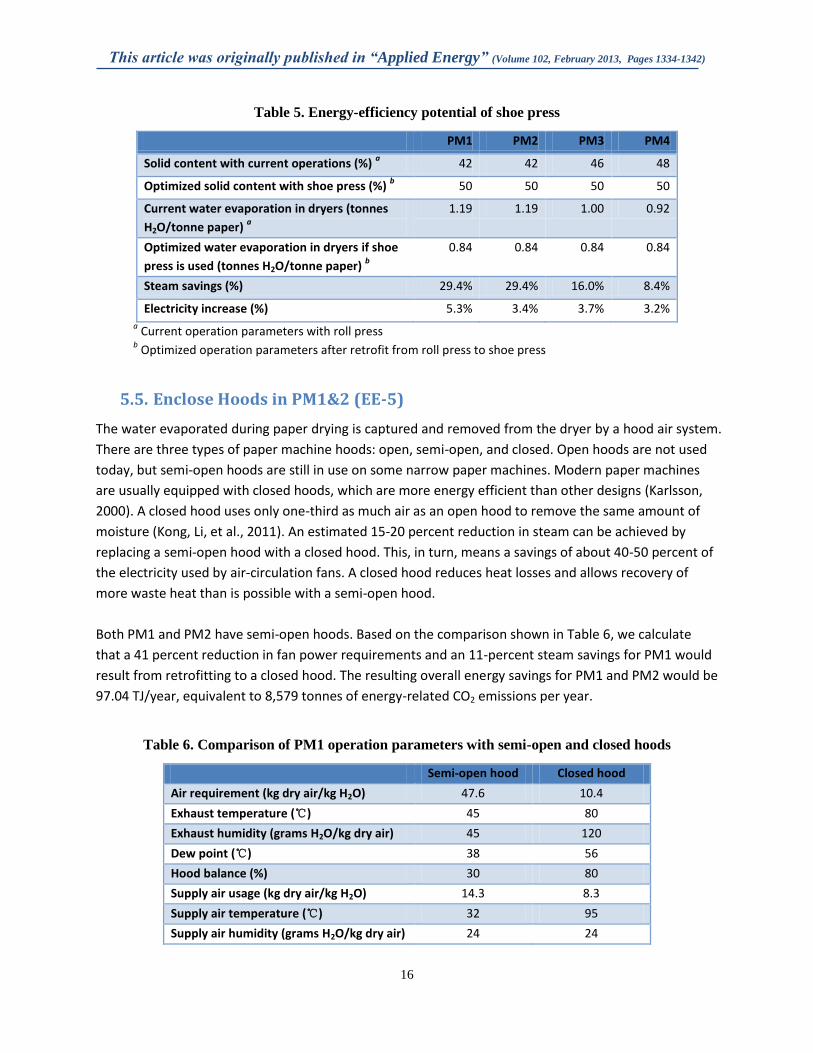
Table 5 shows the performance of the roll presses in the four paper machines at the mill. Even PM4,
which has the highest-percentage exit solids (48 percent), has at least a two-percent dryness
improvement potential. Assuming that retrofitting to a shoe press would result in exit solids of at least
50 percent, water evaporation in the dryer section would be reduced to 0.84 tonnes H2O/tonne paper.
This would saving 8.4 and 29.4 percent of the steam required for the paper machines. Although
electricity consumption would increase by 3.2 to 5.3 percent with the shoe press, this would be offset by
the large thermal energy savings. The total energy-efficiency improvement potential from switching to
shoe presses for the four paper machines is 4.06 percent, equivalent to 273.42 TJ/year. Although the
simple payback period of this measure is longer than for some of the other measures, the measure will
reduce annual CO2 emissions from the mill by 28,732 tonnes.
This article was originally published in “Applied Energy” (Volume 102, February 2013, Pages 1334-1342)
16
Table 5. Energy-efficiency potential of shoe press
PM1 PM2 PM3 PM4
Solid content with current operations (%) a 42 42 46 48
Optimized solid content with shoe press (%) b 50 50 50 50
Current water evaporation in dryers (tonnes
H2O/tonne paper) a
1.19 1.19 1.00 0.92
Optimized water evaporation in dryers if shoe
press is used (tonnes H2O/tonne paper) b
0.84 0.84 0.84 0.84
Steam savings (%) 29.4% 29.4% 16.0% 8.4%
Electricity increase (%) 5.3% 3.4% 3.7% 3.2% a Current operation parameters with roll press
b Optimized operation parameters after retrofit from roll press to shoe press
5.5. Enclose Hoods in PM1&2 (EE-5)
The water evaporated during paper drying is captured and removed from the dryer by a hood air system.
There are three types of paper machine hoods: open, semi-open, and closed. Open hoods are not used
today, but semi-open hoods are still in use on some narrow paper machines. Modern paper machines
are usually equipped with closed hoods, which are more energy efficient than other designs (Karlsson,
2000). A closed hood uses only one-third as much air as an open hood to remove the same amount of
moisture (Kong, Li, et al., 2011). An estimated 15-20 percent reduction in steam can be achieved by
replacing a semi-open hood with a closed hood. This, in turn, means a savings of about 40-50 percent of
the electricity used by air-circulation fans. A closed hood reduces heat losses and allows recovery of
more waste heat than is possible with a semi-open hood.
Both PM1 and PM2 have semi-open hoods. Based on the comparison shown in Table 6, we calculate
that a 41 percent reduction in fan power requirements and an 11-percent steam savings for PM1 would
result from retrofitting to a closed hood. The resulting overall energy savings for PM1 and PM2 would be
97.04 TJ/year, equivalent to 8,579 tonnes of energy-related CO2 emissions per year.
Table 6. Comparison of PM1 operation parameters with semi-open and closed hoods
Semi-open hood Closed hood
Air requirement (kg dry air/kg H2O) 47.6 10.4
Exhaust temperature (℃) 45 80
Exhaust humidity (grams H2O/kg dry air) 45 120
Dew point (℃) 38 56
Hood balance (%) 30 80
Supply air usage (kg dry air/kg H2O) 14.3 8.3
Supply air temperature (℃) 32 95
Supply air humidity (grams H2O/kg dry air) 24 24
This article was originally published in “Applied Energy” (Volume 102, February 2013, Pages 1334-1342)
17
5.6. Implement Heat Recovery in PM3 (EE-6)
A paper machine’s heat recovery system is vital to the overall energy economy of the papermaking
process (Sivill, Ahtila, & Taimisto, 2005). A large amount of the thermal energy used in the drying
process ends up in the exhaust air. For a modern paper machine with an efficient heat recovery system,
more than 60 percent of the exhaust heat from the dryer section can be recovered (Maltais, 1993;
Pettersson & Söderman, 2007).
However, PM3 does not have a heat recovery system at all, and field testing documented that the
temperature of PM3’s exhaust was greater than 70℃. Thus, recovering the waste heat from PM3
could dramatically decrease the paper machine's energy consumption. We estimate that 114.34 TJ of
thermal energy could be saved by installing a heat recovery system on PM3, which is equal to a
reduction of 10,816 tonnes of energy-related CO2 emissions. This measure is the most cost effective of
all the measures identified, with a simple payback period of only 0.7 years.
5.7. Exhaust Humidity Control in PM3&4 (EE-7)
The exhausted stream out of the paper machine hood is often used in place of fresh steam to heat
different process streams, such as supply air, process water and circulation water (Kong, Liu, Li, & Tao,
2011). If the exhaust from the dryer section is not close to its moisture saturation point, energy will be
wasted. Hood exhaust humidity control adjusts supply and exhaust air rates to ensure that the exhaust
air moisture content remains close to the saturation point (Karlsson, 2000). Exhaust humidity control
results in efficient drying performance and thus can reduce dryer thermal energy consumption as well as
fan electricity consumption because the need for ventilation is reduced.
Neither PM3 nor PM4 has a humidity control system. As a result, ventilation is not being adjusted
according to seasonal variations in environmental conditions. If exhaust humidity control were installed
on PM3 and PM4, 1.25 GWh of electricity and 10.04 TJ of thermal energy could be saved annually. The
associated carbon reduction potential is 1,933 tonnes CO2 with only 0.7 years simple payback period.
5.8. Other measures (EE-8 & EE-9)
Other energy-efficiency opportunities that would save less than 10 TJ/year of energy include EE-8, using
a heat pump to produce medium-pressure steam instead of directly producing high-pressure steam,
which would save 5.79 TJ/year of energy. EE-9, insulating steam pipes and other high-temperature
equipment, would save 6.74 TJ/year of energy. The potential carbon reductions from EE-8 and EE-9 are
547 and 638 tonnes CO2 per year, respectively.
This article was originally published in “Applied Energy” (Volume 102, February 2013, Pages 1334-1342)
18
6. Conclusions
A plant-wide energy audit with the purpose of identifying energy conservation and CO2 mitigation
opportunities was implemented in a paper mill located in Guangdong province, China. The general
energy audit methods and related Chinese national standards are illustrated. Also the calculation
methods of energy and carbon indicators are introduced in this paper. The case study also demonstrates
the significant energy savings potential that can be identified through plant-wide energy audits in paper
mills.
As one of the Top-1000 energy-consuming enterprises in China, the studied paper mill produced
610,819 tonnes of paper products with 6,733 TJ of primary energy consumptions and 636,230 tonnes
CO2 emissions during the audit period. The average primary energy intensity of the paper mill was 11.0
GJ/tonne paper, and the CO2 intensity was 1.04 tonnes CO2/tonne paper. The energy and CO2 intensities
of the four paper machines are also calculated respectively. The benchmarking of energy intensity index
for the four paper machines shows that PM1 has the largest energy saving potential, representing 37
percent of energy consumption in PM1. The potentials for the other three machines vary between 8
percent and 11 percent.
Of the nine energy-efficiency improvement opportunities we identified based on an energy audit and
calculation of energy and carbon indicators for a paper mill in Guangdong province, China, the top two
measures for saving energy and reducing carbon emissions were retrofitting of a low-efficiency boiler
and improving press performance by switching to a shoe press. The total technical energy savings
potential for the paper mill is 967.8 TJ, which represents 14.4 percent of the mill’s total energy
consumption during the audit period. The associated CO2 emissions reduction potential is 93,453 tonnes
CO2, which represents 14.7 percent of the total CO2 emissions from the mill during the audit period.
Acknowledgement
The authors would like to thank the personnel at the paper mill where the energy audit was performed.
Without their cooperation and support, this study would not been possible. The authors wish to thank
the China Scholarship Council (CSC) for supporting one research team member’s study at Berkeley Lab.
We are also grateful to Nan Wishner for editing this paper.
This article was originally published in “Applied Energy” (Volume 102, February 2013, Pages 1334-1342)
19
References
Abdelaziz, E. A., Saidur, R., & Mekhilef, S. (2011). A review on energy saving strategies in industrial sector. Renewable and Sustainable Energy Reviews, 15(1), 150-168.
Afshar, P., Brown, M., Austin, P., Wang, H., Breikin, T., & Maciejowski, J. (2012). Sequential modelling of thermal energy: New potential for energy optimisation in papermaking. Applied Energy, 89(1), 97-105.
China Electricity Council (CEC) and U.S. Environmental Defense Fund (EDF). (2011). The Current Status of Air Pollution Control for Coal-fired Power Plants in China. Beijing: China Electric Power Press.
U.S. Department of Energy (DOE). (2011). Industrial Assessment Center, December 31, 2011, from http://iac.rutgers.edu/database
Gong, Z.-X., Stanovský, J., & Mujumdar, A. S. (2011). Energy audit of a fiberboard drying production line using simprosys software. Drying Technology, 29(4), 408-418.
Hasanbeigi, A., & Price, L. (2010). Industrial Energy Audit Guidebook: Guidelines for Conducting an Energy Audit in Industrial Facilities. Berkeley (CA): Lawrence Berkeley National Laboratory, Environmental Energy Technologies Division; 2010 Oct. Report No.: LBNL-3991E.
Hasanbeigi, A., Price, L., Lu, H., & Wang, L. (2010). Analysis of energy-efficiency opportunities for the cement industry in Shandong Province, China: A case study of 16 cement plants. Energy, 35(8), 3461-3473.
Holik, H. (2006). Handbook of Paper and Board. Weinheim: WILEY-VCH Verlag GmbH & Co. KGaA.
Hong, G.-B., Ma, C.-M., Chen, H.-W., Chuang, K.-J., Chang, C.-T., & Su, T.-L. (2011). Energy flow analysis in pulp and paper industry. Energy, 36(5), 3063-3068.
Intergovernmental Panel on Climate Change (IPCC). (2006). Intergovernmental Panel on Climate Change Guidelines for National Greenhouse Gas Inventories, Vol.2 Energy.
Karlsson, M. (2000). Papermaking Part 2, Drying. In J. Gullichsen & H. Paulapuro (Eds.), Papermaking Science and Technology (pp. 168-191). Helsinki, Finland: Fapet Oy.
Kinstrey, R. B., & White, D. Pulp and Paper Industry Energy Bandwidth Study: Greenville (SC): Jacobs Engineering & Atlanta (GA): Institute of Paper Science and Technology (IPST) at Georgia Institute of Technology; 2006 Aug. Project Number: 16CX8700. Sponsored by the American Institute of Chemical Engineers (AIChE) and U.S. Department of Energy (DOE).
Klugman, S., Karlsson, M., & Moshfegh, B. (2007). A Scandinavian chemical wood pulp mill. Part 1. Energy audit aiming at efficiency measures. Applied Energy, 84(3), 326-339.
Kong, L., Li, J., Liu, H., & Yin, Y. (2011). Survey of Paper Machine Dryer System - A Method to Analysis Energy Efficiency for Corrugated Paper Drying Process. Paper presented at the 7th Asia-Pacific Drying Conference (ADC2011), Tianjin, China.
Kong, L., & Liu, H. (2012). A static energy model of conventional paper drying for multicylinder paper machines. Drying Technology, 30(3), 276-296.
This article was originally published in “Applied Energy” (Volume 102, February 2013, Pages 1334-1342)
20
Kong, L., Liu, H., Li, J., & Tao, J. (2011). Waste heat integration of coating paper machine drying process. Drying Technology, 29(4), 442-450.
Lu, H., & Price, L. (2011). Industrial Energy Assessments: A Survey of Programs Around the World. Paper presented at the 2011 ACEEE Summer Study on Energy Efficiency in Industry, Niagara Falls, New York. .
Mahmood, T., & Elliott, A. (2006). A review of secondary sludge reduction technologies for the pulp and paper industry. Water Research, 40(11), 2093-2112.
Maltais, D. (1993). Heat recovery on a paper machine hood. Pulp and Paper Canada, 94(12), 113-117.
Metz, B., Davidson, O. R., Bosch, P. R., Dave, R., & Meyer, L. A. (2007). (Eds.), Climate Change 2007: Mitigation. Contribution of Working Group III to the Fourth Assessment Report of the Intergovernmental Panel on Climate Change (IPCC). Cambridge University Press, Cambridge, United Kingdom and New York, NY, USA.
National Bureau of Statistics of China (NBSC). (2010). China Energy Statistical Yearbook 2009. Beijing, China Statistic Press.
National Development and Reform Commissioin (NDRC). (1991). Calculation method of integrated energy consumption of pulp and paper making enterprise (QB 1022-1991), Beijing.
National Development and Reform Commissioin (NDRC). (2009). Baseline emission factors for China's regional power Grids in 2009, December 20, 2011, from http://qhs.ndrc.gov.cn/qjfzjz/t20090703_289357.htm
Pettersson, F., & Söderman, J. (2007). Design of robust heat recovery systems in paper machines. Chemical Engineering and Processing, 46(10), 910-917.
Phylipsen, D., Blok, K., Worrell, E., & Beer, J. d. (2002). Benchmarking the energy efficiency of Dutch industry: an assessment of the expected effect on energy consumption and CO2 emissions. Energy Policy, 30(8), 663-679.
Reese, D. (2006). Save energy by optimizing paper machine clothing. Solutions - for People, Processes and Paper, 89(4), 21-29.
Reese, D. (2012). Improve Paper Machine Energy Performance. Dick Reese and Associates Inc. Personal communication.
Schleich, J. (2004). Do energy audits help reduce barriers to energy efficiency? An empirical analysis for Germany. International Journal of Energy Technology and Policy, 2(3), 226-239.
State Electricity Regulatory Commission (SERC). (2011). Power generation business briefing of China in 2010, December 20, 2011, from http://www.serc.gov.cn/zwgk/jggg/201109/t20110901_15293.htm
Shen, B., Price, L., & Lu, H. (2012). Energy audit practices in China: National and local experiences and issues. Energy Policy, 46(0), 346-358.
Sivill, L., Ahtila, P., & Taimisto, M. (2005). Thermodynamic simulation of dryer section heat recovery in paper machines. Applied Thermal Engineering, 25(8-9), 1273-1292.
Thompson, G., Swain, J., Kay, M., & Forster, C. F. (2001). The treatment of pulp and paper mill effluent: a review. Bioresource Technology, 77(3), 275-286.

This article was originally published in “Applied Energy” (Volume 102, February 2013, Pages 1334-1342)
21
Trudeau, N., Tam, C., Graczyk, D., & Taylor, P. (2011). Energy Transition for Industry: India and the Global Context. Paris, France: International Energy Agency (IEA), Energy Technology Policy Division.
United Nations Framework Convention on Climate Change (UNFCCC). (2011). Biogas Utilization Project in Zhejiang Jingxing Paper Joint Stock Co. Ltd. CDM project design document (Version 2.2).
Worrell, E., Bernstein, L., Roy, J., Price, L., & Harnisch, J. (2009). Industrial energy efficiency and climate change mitigation. Energy Efficiency, 2(2), 109-123.