ERIN RAY PASCARETTI EPIDEMIOLOGIST PUTNAM COUNTY DEPARTMENT OF HEALTH Data Review.
24
ERIN RAY PASCARETTI EPIDEMIOLOGIST PUTNAM COUNTY DEPARTMENT OF HEALTH Data Review
-
Upload
theresa-franklin -
Category
Documents
-
view
227 -
download
0
Transcript of ERIN RAY PASCARETTI EPIDEMIOLOGIST PUTNAM COUNTY DEPARTMENT OF HEALTH Data Review.

ERIN RAY PASCARETTIEPIDEMIOLOGIST
PUTNAM COUNTY DEPARTMENT OF HEALTH
Data Review

Community Health Assessment & Community Health Improvement Plan
Description of the community being assessed Demographics Health Status
Identification of main health challenges
Summary of assets and resources
Method for distribution to community
Identification of at least 2 priorities
Goals and objectives Individuals and
Organizations involvedOutcome and process
measuresStrategies and Best
Practices

Data Sources
Partners
Prevention Agenda
.

Prevention Agenda
.

Prevention Agenda – Health Disparities
Socio-economic GenderRace/EthnicityGeographyAgeOther

Prevention Agenda – Health Status & Disparities
Indicator Data
Years
Putnam
County
New
York
State
NYS 2017
Objective
l. Percentage of premature death (before age 65 years)
2008-2010
24.4 24.3 21.8
2. Ratio of Black non-Hispanics to White non-Hispanics
1.56+ 2.12 1.87
3. Ratio of Hispanics to White non-Hispanics 2.06 2.14 1.86
4. Age-adjusted preventable hospitalizations rate per 10,000 - Ages 18+ years
2008-2010
116.9 155.0 133.3
5. Ratio of Black non-Hispanics to White non-Hispanics
0.79 2.09 1.85
6. Ratio of Hispanics to White non-Hispanics 0.5 1.5 1.38
7. Percentage of adults with health insurance -Ages 18-64 years
2010 87.8 (86.6-89.0)
83.1(82.9-83.3)
100
8. Age-adjusted percentage of adults who have a regular health care provider - Ages 18+ years
2008-2009
91.1 (86.8-95.3)
83.0(80.4-85.5)
90.8

Prevention Agenda – Healthy & Safe Environment
IndicatorData Years Putnam County New York
State
NYS 2017 Objective
9.Rate of hospitalizations due to falls per 10,000 - Ages 65+ years 2008-2010
183.5 204.6 Maintain
10.Rate of emergency department visits due to falls per 10,000 - Ages 1-4 years 2008-2010
541.1 476.8 429.1
11. Assault-related hospitalization rate per 10,0002008-2010
1.4 4.8 4.3
12.Ratio of Black non-Hispanics to White non-Hispanics
s 7.43 6.69
13. Ratio of Hispanics to White non-Hispanics 1.77+ 3.06 2.75
14.Ratio of low income ZIP codes to non-low income ZIP codes
0.00+ 3.25 2.92
15.Rate of occupational injuries treated in ED per 10,000 adolescents - Ages 15-19 years 2008-2010
43.9 36.7 33.0
16.Percentage of population that lives in a jurisdiction that adopted the Climate
Smart Communities pledge
2012 0.0* 26.7 32.0
17.Percentage of commuters who use alternate modes of transportation 1 2007-2011
22.6 44.6 49.2
18.Percentage of population with low-income and low access to a supermarket or large
grocerystore
2010 5.4 2.5 2.24
19.Percentage of homes in Healthy Neighborhood Program that have fewer asthma
triggers during the home revisits
2008-2011NA 12.9 20
20.Percentage of residents served by community water systems with optimally fluoridated
water
2012 0.0* 71.4 78.5

Prevention Agenda – Chronic Disease
IndicatorData Years Putnam County New York
State
NYS 2017 Objective
21. Percentage of adults who are obese 2008-2009 25.8 (21.3-30.3) 23.2(21.2-25.3)
23.2
22. Percentage of children and adolescents who are obese 2010-2012 17.2 17.6 NYC: 19.7 ROS:
16.723. Percentage of cigarette smoking among adults 2008-2009 13.0 ( 9.9-16.1) 16.8
(15.1-
18.6)
15.0
24. Percentage of adults who receive a colorectal cancer screening based
on the most recent guidelines - Ages 50-75 years
2008-2009 70.6 (64.6-75.9) 66.3
(63.5-
69.1)
71.4
25. Asthma emergency department visit rate per 10,000 2008-201028.4 83.7 75.1
26. Asthma emergency department visit rate per 10,000 - Ages 0-4 years 2008-201058.0 221.4 196.5
27. Age-adjusted heart attack hospitalization rate per 10,000 2010 14.8 15.5 14.0
28. Rate of hospitalizations for short-term complications of diabetes per
10,000 - Ages 6-17 years
2008-2010 1.4* 3.2 3.06
29. Rate of hospitalizations for short-term complications of diabetes per
10,000 - Ages 18+ years
2008-20102.8 5.6 4.86

Prevention Agenda – HIV/STD, Vaccine Preventable
IndicatorData Years Putnam County New York
State
NYS 2017Objective
30.Percentage of children with 4:3:1:3:3:1:4 immunization series - Ages 19-
35 months3
2011 41.2 47.6
31.Percentage of adolescent females with 3-dose HPV immunization - Ages 13-17
years
2011 15.7 26.0 5
32.Age-adjusted percentage of adults with flu immunization - Ages 65+
years
2008-2009 77.9 (70.2-85.7) 75.0
(71.5-
78.5)
66.2
33. Newly diagnosed HIV case rate per 100,0002008-2010
5.7 21.6 14.7
34.Difference in rates (Black and White) of new HIV diagnoses
s 59.4 45.7
35.Difference in rates (Hispanic and White) of new HIV diagnoses s 31.1 22.3
36. Gonorrhea case rate per 100,000 women -Ages 15-44 years
2010 39.9* 203.4 183.1
37.Gonorrhea case rate per 100,000 men - Ages 15-44 years
2010 16.1* 221.7 199.5
38.Chlamydia case rate per 100,000 women -Ages 15-44 years
2010 421.9 1619.8 1,458
39.Primary and secondary syphilis case rate per 100,000 males
2010 0* 11.2 10.1
40.Primary and secondary syphilis case rate per 100,000 females
2010 0* 0.5 0.4

Prevention Agenda – Maternal Child Health
IndicatorData Years Putnam County New York
State
NYS 2017 Objective
41. Percentage of preterm births2008-2010
11.0 12.0 10.2
45.Percentage of infants exclusively breastfed in the hospital 2008-2010
62.6 42.5 48.1
49. Maternal mortality rate per 100,000 births2008-2010
s 23.3 21.0
50.Percentage of children who have had the recommended number of well child
visits in government sponsored insurance programs4
2011 74.9 69.9 76.9
54.Percentage of children with any kind of health insurance - Ages 0-19 years
201095.8 (94.8-96.8)
94.9(94.5-95.3)
100
55.Percentage of third-grade children with evidence of untreated tooth
decay
2009-2011 19.8 (15.8-23.8) 24.0
(22.6-
25.4)
21.6
57.Adolescent pregnancy rate per 1,000 females -Ages 15-17 years 2008-2010
5.0 31.1 25.6
60.Percentage of unintended pregnancy among live births
2011 14.2 26.7 24.2
64.Percentage of women with health coverage -Ages 18-64 years
201090.1 (88.6-91.6) 86.1
(85.8-
86.4)
100
65.Percentage of live births that occur within 24 months of a previous pregnancy 2008-2010
18.2 18.0 17.0

Prevention Agenda – Mental Health Substance Abuse
Indicator Data Years
Putnam County
New York State
NYS 2017 Objective
66. Age-adjusted percentage of adults with poor mental health for 14 or more days in the last month
2008-2009
9.5 (6.6-12.5)
10.2 (8.7 -11.7)
10.1
67. Age-adjusted percentage of adult binge drinking during the past month
2008-2009
19.8 (14.7-24.8)
18.1(16.1-20.2)
18.4
68. Age-adjusted suicide death rate per 100,000
2008-2010
6.4 7.1 5.9

Community Asset Survey
All Residents (work or live)
All AgesAdvertised
Newspaper Online PHC and County Employees Free Media County Website
340 Responses

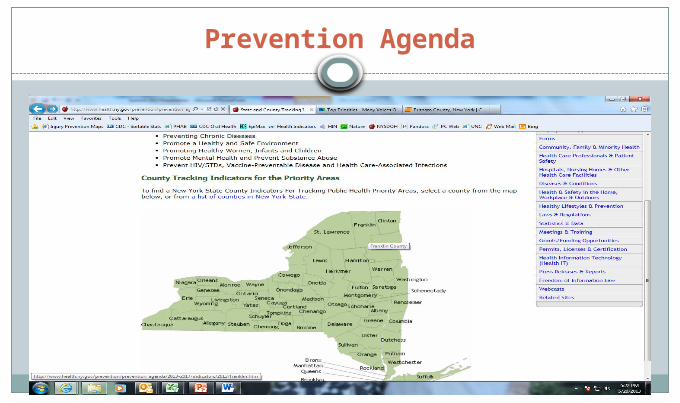
Community Asset Survey - Strengths of Community
24 P
olice
Fire
Res
cue
Basic H
ealth
Basic N
eeds
Met
Emer
genc
y Pre
pare
dnes
s
Health
y Env
ironm
ent
Health
y Foo
d Cho
ices
Low C
rime
Parks
& R
ecre
atio
n
Safe
Nei
ghbo
rhoo
ds
Senio
r Ser
vice
s0
40
80
120
160
# R
esp
onse
s
Community Asset Survey - Strengths of Community
Other Comments
Great Snow RemovalProximity to NYCQuietRuralVigorous Probation Services

Community Asset Survey - Focus Areas
Basic H
ealth
care
Bikea
ble
Wal
kabl
e
Econo
mic H
ealth
Emer
genc
y Pre
pare
dnes
s
Health
y Foo
ds
Help
Time
of S
tres
s
Housin
g A
fforda
bilit
y
Senio
r Ser
vice
s
Trans
porta
tion
Youth
Ser
vice
s0
20406080
100120140160
# R
esp
onse
s

Community Asset Survey - Focus Areas
Other Comments
Affordable gyms like YMCA
After School ProgramsDog Friendly ParksEliminate Duplicative
ServicesEnforce Immigration LawsLower Property Taxes
Lower School TaxesLitter RemovalMore Drug EnforcementMore Environmental ForumsMore ShoppingSafe Housing for Sex
OffendersSmaller Government

Community Asset Survey - Health Issues
Aging
Alcoho
l
Chron
ic DZ
Clean
Air
& W
ater
Drug
Abuse
MH G
ener
al
MH P
ersist
ant
Nutrit
ion
Obesit
y
Physica
l Ina
ctivi
ty0
20406080
100120140160180
# R
esp
onse
s

Community Asset Survey - Health Issues
Other Comments
Adult ProtectionAlcohol Abuse EducationCancer SupportFunctional MedicineGun Safety
HospicePalliative CareServices on Western
SideSubstance Abuse
EducationTetanus Shots for
Laborers

County Health Rankings
Population based health Health Outcomes Health Factors Policies & Programs
Ranked within StateNational & State dataPriority is to raise
awareness

County Health Rankings – Priority Areas
Premature Death Perception of health, physical health, and mental
healthObesity and physical inactivity Excessive drinkingUninsuredPrimary care physician & Dentist ratioDaily fine particulate matterLimited access to healthy foods

Many Voices One Valley
Telephone Survey Landline Cell
~300 Residents Third SurveyFocus
Living in Region Working in Region Priorities for Future Quality of Healthcare
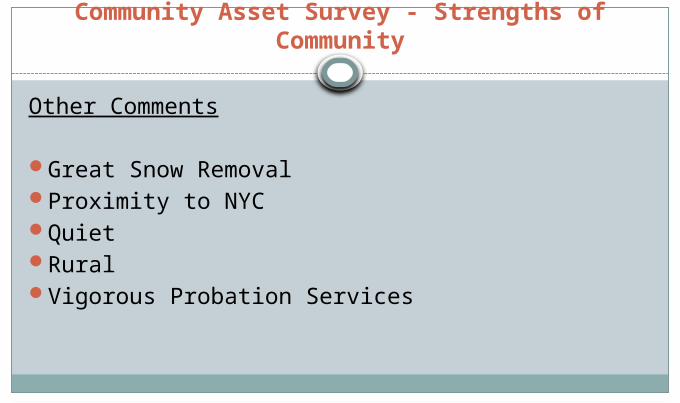
Many Voices One Valley – Priority Areas

What Now?
Pick priority areasIdentify strengths and weaknessesCreate Goals and ObjectivesAssess and MeasureMonitor over five years