Erik Anderson 1, James Ahrens 2, Gilbert Preston 3, Antonio Baptista 4, Claudio Silva 1 VisTrails:...
21
Erik Anderson 1 , James Ahrens 2 , Gilbert Preston 3 , Antonio Baptista 4 , Claudio Silva 1 VisTrails: Applications in Scientific Visualization 1 SCI Institute 2 Los Alamos National Lab. 3 University of Utah Dept. of Psychiatry 4 OGI School of Science and Engineering
-
date post
22-Dec-2015 -
Category
Documents
-
view
220 -
download
0
Transcript of Erik Anderson 1, James Ahrens 2, Gilbert Preston 3, Antonio Baptista 4, Claudio Silva 1 VisTrails:...

Erik Anderson1, James Ahrens2, Gilbert Preston3, Antonio Baptista4, Claudio Silva1
VisTrails: Applications in Scientific Visualization
1SCI Institute2Los Alamos National Lab.3University of Utah Dept. of Psychiatry4OGI School of Science and Engineering

Overview
Cosmology Joint work with James Ahrens at LANL
Schizophrenia Joint work with Gilbert Preston at U of U
River Inlet Studies Joint work with Antonio Baptista at OGI

VisTrails in Cosmology
Cosmology The quantitative
study of The Universe in its totality

Visualization in Cosmology
Simulations are particle-based
There are huge amounts of derived data
Different simulations give different results
Visualization in Cosmology
Demo

Visualization in Cosmology
What can be done better?
What was done well?

Visualization in Cosmology
What can be done better? More intuitive control over data exploration
processes More integrated interaction capabilities
What was done well? Scientists are exposed to their data in a new way New questions were asked about the structure of
their data

VisTrails in Schizophrenia
Collaboration with Dr. Gilbert Preston MD
Studying the effects of magnetic stimulation of the brain
Hugely multi-modal study

VisTrails in Schizophrenia
Multi-modal study EEG MEG MRI Genetics
Huge amount of data Approx. 300 GB of
raw data per person 1400 people
VisTrails in Schizophrenia
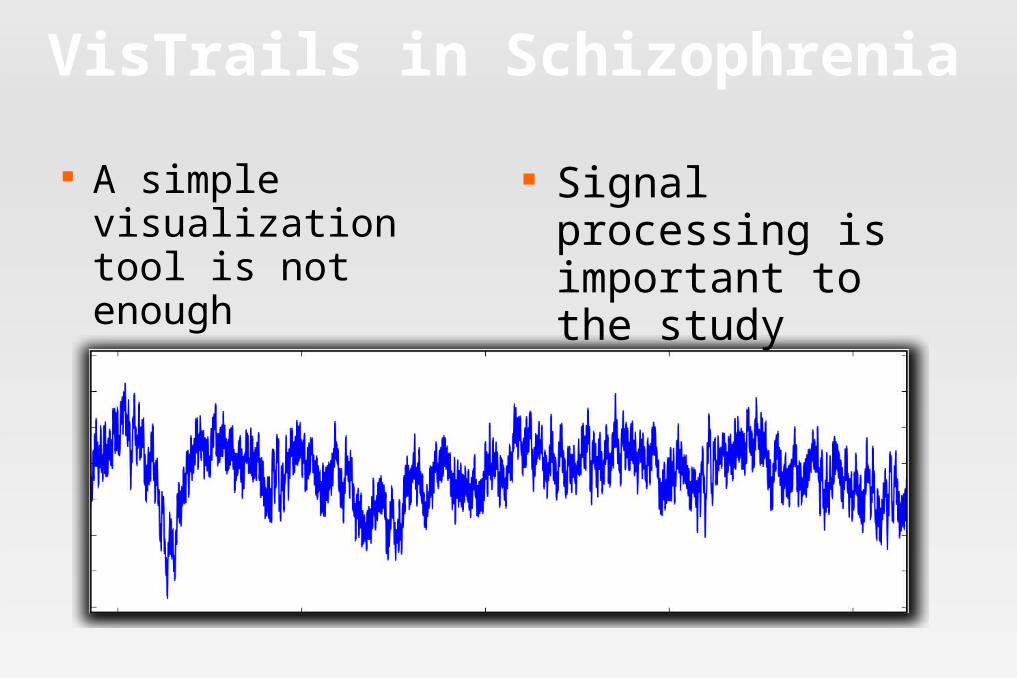
A simple visualization tool is not enough
Signal processing is important to the study
VisTrails in Schizophrenia
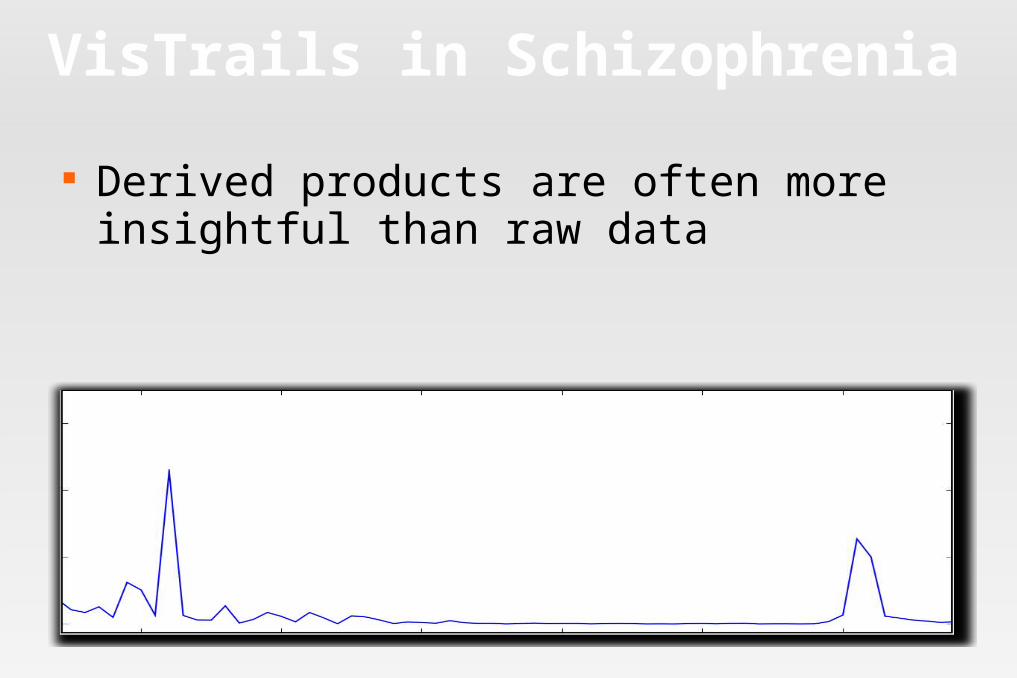
Derived products are often more insightful than raw data

VisTrails in Schizophrenia
Always look for new and better ways to visualize data.

VisTrails in Schizophrenia
Signal Processing Demo
VisTrails in Schizophrenia
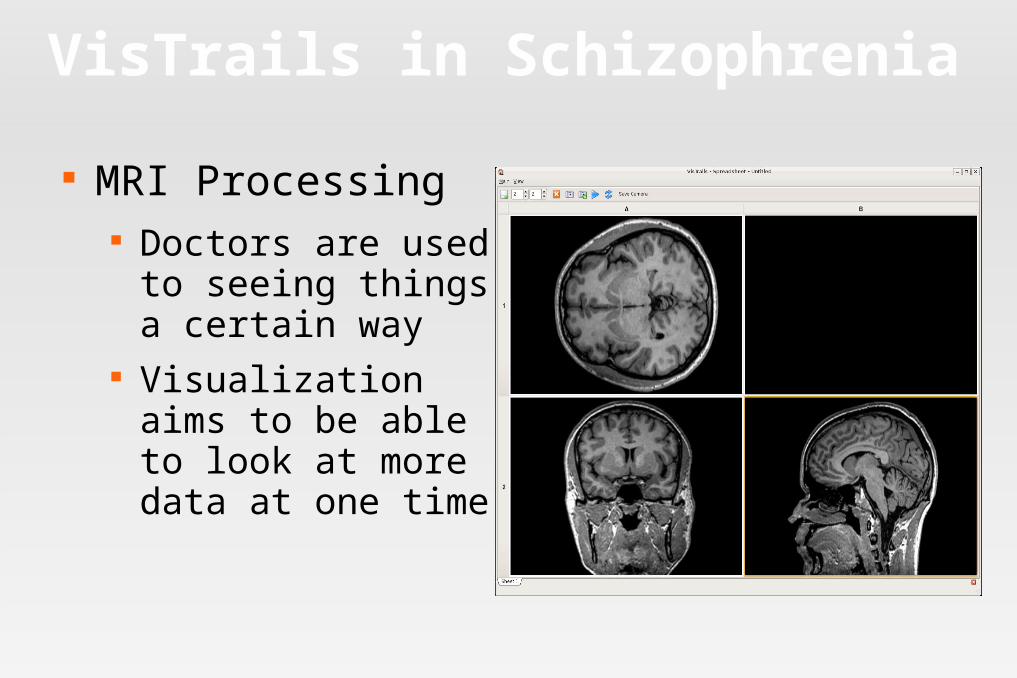
MRI Processing Doctors are used to
seeing things a certain way
Visualization aims to be able to look at more data at one time

VisTrails in Schizophrenia
MRIs are stored as regular volumetric grids. What can we do to add to the visualization? VisTrails Demo

Visualization in Schizophrenia
What can be done better?
What was done well?

Visualization in Schizophrenia
What can be done better? More intuitive control over data exploration
processes More integrated interaction capabilities
What was done well? Multi-modal integration can be controlled from a
single workflow New methods of visualization were used to better
describe data products

VisTrails in Oregon
Collaboration with Antonio Baptista from OGI
Visualization of time-based, peta-scale data

VisTrails in Oregon
VisTrails demo

VisTrails in Oregon
Interaction with scientists is more important than the visualization alone
Scientists need to be able to see an advantage in order to use a new visualization method

VisTrails in Oregon
Many people using the system concurrently
DB backend must deal with simultaneous transaction