ERDC TN-EMRRP-SR-49 'Development and Application of Flow ... · Development and Application of Flow...
12
Approved for public release; distribution is unlimted. ERDC TN-EMRRP-SR-49 February 2016 Development and Application of Flow Duration Curves for Stream Restoration by S. Kyle McKay 1 and J. Craig Fischenich 2 INTRODUCTION: Stream restoration does not exist as an isolated field of study but instead at the intersection of hydrologic and hydraulic engineering, terrestrial and aquatic ecology, geomorphology, geology, and biogeochemistry. Palmer and Bernhardt (2006) identify the linking of hydrologic processes with ecological outcomes as a starting point for effective, holistic stream restoration design. Accordingly, traditional engineering approaches of quantifying hydrologic processes may be adapted and applied to quantify ecological outcomes (Fischenich and McKay 2011). Poff et al. (1997) identified five critical components of a streamflow hydrograph that regulate ecological process in river ecosystems: magnitude, frequency, duration, timing, and rate of change. Importantly, many of these variables are correlated and care should be taken to avoid redundancy in analyses (Olden and Poff 2003). Quantification of magnitude, frequency, and duration may be — at least in part — accomplished by a traditional tool of the river engineer, the flow duration curve (FDC). FDCs illustrate the percent of time a flow occurred during a given period of record and provide a wealth of information regarding the flow character of a river in an easy-to-understand format. They have traditionally been used for a variety of purposes from hydropower engineering to instream flow quantification. This paper serves to (1) describe the generation of flow duration curves for gaged and ungaged basins; (2) discuss the potential pitfalls and errors associated with these analyses; and (3) highlight potential applications of these curves for stream restoration. CONSTRUCTION OF A FLOW DURATION CURVE: Stream FDCs have a long history in river science with general use in the field since about 1915 (Searcy 1959). Development of an FDC for a given location has historically been carried out by using long-term streamflow gage data of a particular time interval. However, as early as 1908, Daniel Mead presented methods for synthesizing flow duration curves in ungaged basins (Searcy 1959). Most research on flow duration curves can be coarsely divided into approaches emphasizing gaged and ungaged locations. Gaged basins. A flow duration curve in a gaged basin is computed by 1) compilation of streamflow discharge for a sufficient period of record at a relevant time scale for the river considered; 2) sorting of these discharges into class intervals (or bins) and; 3) calculation of the cumulative frequency of streamflow discharge (Searcy 1959). The fundamental process of 1 U.S. Army Engineer Research and Development Center (ERDC), Environmental Laboratory (EL), Athens, GA, Phone: 601- 415-7160, Email: [email protected] 2 ERDC-EL, Vicksburg, MS, Phone: 601-634-3449, Email: [email protected]
-
Upload
trinhkhuong -
Category
Documents
-
view
216 -
download
0
Transcript of ERDC TN-EMRRP-SR-49 'Development and Application of Flow ... · Development and Application of Flow...

Approved for public release; distribution is unlimted.
ERDC TN-EMRRP-SR-49 February 2016
Development and Application of
Flow Duration Curves for Stream Restoration
by S. Kyle McKay1 and J. Craig Fischenich2
INTRODUCTION: Stream restoration does not exist as an isolated field of study but instead at the intersection of hydrologic and hydraulic engineering, terrestrial and aquatic ecology, geomorphology, geology, and biogeochemistry. Palmer and Bernhardt (2006) identify the linking of hydrologic processes with ecological outcomes as a starting point for effective, holistic stream restoration design. Accordingly, traditional engineering approaches of quantifying hydrologic processes may be adapted and applied to quantify ecological outcomes (Fischenich and McKay 2011). Poff et al. (1997) identified five critical components of a streamflow hydrograph that regulate ecological process in river ecosystems: magnitude, frequency, duration, timing, and rate of change. Importantly, many of these variables are correlated and care should be taken to avoid redundancy in analyses (Olden and Poff 2003). Quantification of magnitude, frequency, and duration may be — at least in part — accomplished by a traditional tool of the river engineer, the flow duration curve (FDC).
FDCs illustrate the percent of time a flow occurred during a given period of record and provide a wealth of information regarding the flow character of a river in an easy-to-understand format. They have traditionally been used for a variety of purposes from hydropower engineering to instream flow quantification. This paper serves to (1) describe the generation of flow duration curves for gaged and ungaged basins; (2) discuss the potential pitfalls and errors associated with these analyses; and (3) highlight potential applications of these curves for stream restoration.
CONSTRUCTION OF A FLOW DURATION CURVE: Stream FDCs have a long history in river science with general use in the field since about 1915 (Searcy 1959). Development of an FDC for a given location has historically been carried out by using long-term streamflow gage data of a particular time interval. However, as early as 1908, Daniel Mead presented methods for synthesizing flow duration curves in ungaged basins (Searcy 1959). Most research on flow duration curves can be coarsely divided into approaches emphasizing gaged and ungaged locations.
Gaged basins. A flow duration curve in a gaged basin is computed by 1) compilation of streamflow discharge for a sufficient period of record at a relevant time scale for the river considered; 2) sorting of these discharges into class intervals (or bins) and; 3) calculation of the cumulative frequency of streamflow discharge (Searcy 1959). The fundamental process of
1 U.S. Army Engineer Research and Development Center (ERDC), Environmental Laboratory (EL), Athens, GA, Phone: 601-415-7160, Email: [email protected] 2 ERDC-EL, Vicksburg, MS, Phone: 601-634-3449, Email: [email protected]

ERDC TN-EMRRP-SR-49 February 2016
2
generating an FDC is rather simple; however, judgments made in the first two steps of the process can alter the resulting FDC (Biedenharn et al. 2000).
FDCs are highly dependent upon the temporal references chosen for the analysis. The interval between discharge measurements used should reflect the character of the basin under question. For instance, in a basin where time scales are long and the discharge is not expected to change dramatically (e.g., the lower Mississippi River), an interval of days, weeks, or possibly months may be sufficient to accurately define the discharge variability; however, in small, steep headwater streams, an interval of 1hr or even 15min may not be small enough to accurately capture the discharge variability (Figure 1). For this reason, the time interval of the data used in the creation of an FDC should be carefully scrutinized, depending upon the project needs and data availability, and FDCs should not be readily substituted for flood frequency analyses when identifying peak discharges. Searcy (1959) and Vogel and Fennessey (1995) note that daily discharges are most commonly applied to flow duration analyses, but longer discharge intervals (e.g., weekly, monthly) may be used to simplify the generation of an FDC. In the last decade, increasing computational ability has rendered long-time scales antiquated, and therefore, the authors recommend that daily discharge be regarded as a maximum collection interval for generating FDCs.
0%
10%
20%
30%
40%
50%
60%
70%
80%
90%
100%
100 1000 10000 100000
Discharge (cfs)
Perc
ent o
f Tim
e Le
ss th
an o
r Equ
al to
(%)
Monthly-1995-2004 Daily-1995-2004 15min-1995-2004
Figure 1. Flow duration curves for multiple collection intervals for the Etowah River at GA 1 Loop near Rome, GA (USGS Gage Number: 02395980).
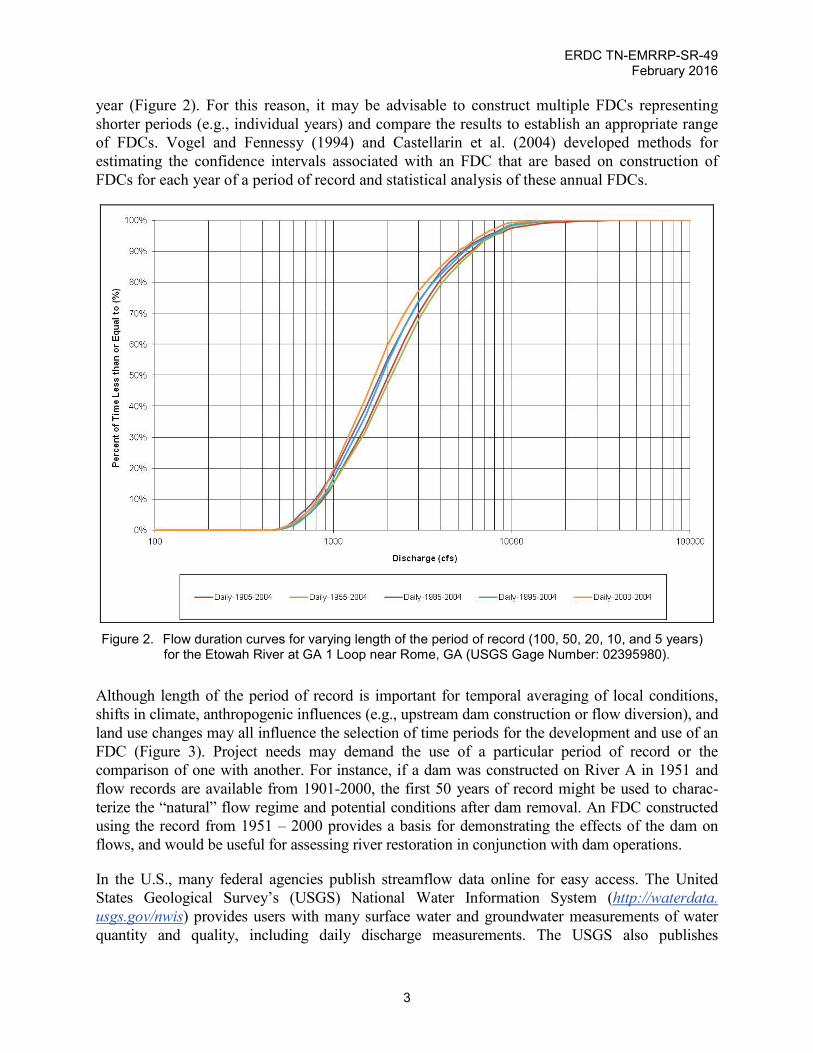
The length and timing of the period of record used can also drastically alter an FDC. Longer periods of record provide FDCs that better represent temporally averaged conditions within a watershed. If shorter periods are used, extreme climatic conditions (e.g., much wetter or drier than average) may influence the results and potentially the applicability of the FDC to a “typical”
ERDC TN-EMRRP-SR-49 February 2016
3
year (Figure 2). For this reason, it may be advisable to construct multiple FDCs representing shorter periods (e.g., individual years) and compare the results to establish an appropriate range of FDCs. Vogel and Fennessy (1994) and Castellarin et al. (2004) developed methods for estimating the confidence intervals associated with an FDC that are based on construction of FDCs for each year of a period of record and statistical analysis of these annual FDCs.
Figure 2. Flow duration curves for varying length of the period of record (100, 50, 20, 10, and 5 years)
for the Etowah River at GA 1 Loop near Rome, GA (USGS Gage Number: 02395980).
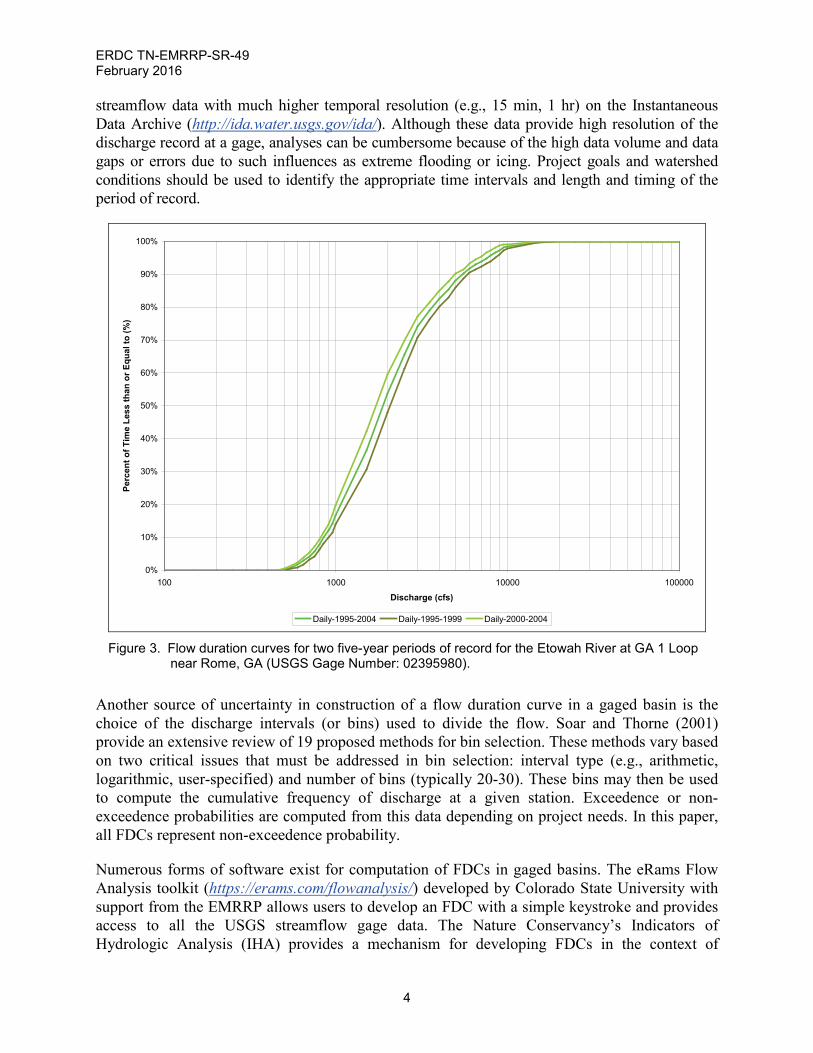
Although length of the period of record is important for temporal averaging of local conditions, shifts in climate, anthropogenic influences (e.g., upstream dam construction or flow diversion), and land use changes may all influence the selection of time periods for the development and use of an FDC (Figure 3). Project needs may demand the use of a particular period of record or the comparison of one with another. For instance, if a dam was constructed on River A in 1951 and flow records are available from 1901-2000, the first 50 years of record might be used to charac-terize the “natural” flow regime and potential conditions after dam removal. An FDC constructed using the record from 1951 – 2000 provides a basis for demonstrating the effects of the dam on flows, and would be useful for assessing river restoration in conjunction with dam operations.
In the U.S., many federal agencies publish streamflow data online for easy access. The United States Geological Survey’s (USGS) National Water Information System (http://waterdata. usgs.gov/nwis) provides users with many surface water and groundwater measurements of water quantity and quality, including daily discharge measurements. The USGS also publishes
ERDC TN-EMRRP-SR-49 February 2016
4
streamflow data with much higher temporal resolution (e.g., 15 min, 1 hr) on the Instantaneous Data Archive (http://ida.water.usgs.gov/ida/). Although these data provide high resolution of the discharge record at a gage, analyses can be cumbersome because of the high data volume and data gaps or errors due to such influences as extreme flooding or icing. Project goals and watershed conditions should be used to identify the appropriate time intervals and length and timing of the period of record.
0%
10%
20%
30%
40%
50%
60%
70%
80%
90%
100%
100 1000 10000 100000
Discharge (cfs)
Perc
ent o
f Tim
e Le
ss th
an o
r Equ
al to
(%)
Daily-1995-2004 Daily-1995-1999 Daily-2000-2004
Figure 3. Flow duration curves for two five-year periods of record for the Etowah River at GA 1 Loop near Rome, GA (USGS Gage Number: 02395980).
Another source of uncertainty in construction of a flow duration curve in a gaged basin is the choice of the discharge intervals (or bins) used to divide the flow. Soar and Thorne (2001) provide an extensive review of 19 proposed methods for bin selection. These methods vary based on two critical issues that must be addressed in bin selection: interval type (e.g., arithmetic, logarithmic, user-specified) and number of bins (typically 20-30). These bins may then be used to compute the cumulative frequency of discharge at a given station. Exceedence or non-exceedence probabilities are computed from this data depending on project needs. In this paper, all FDCs represent non-exceedence probability.
Numerous forms of software exist for computation of FDCs in gaged basins. The eRams Flow Analysis toolkit (https://erams.com/flowanalysis/) developed by Colorado State University with support from the EMRRP allows users to develop an FDC with a simple keystroke and provides access to all the USGS streamflow gage data. The Nature Conservancy’s Indicators of Hydrologic Analysis (IHA) provides a mechanism for developing FDCs in the context of

ERDC TN-EMRRP-SR-49 February 2016
5
identifying ecologically relevant components of a river hydrograph (TNC 2009). Colorado State University’s GeoTools offers an FDC computation focusing on the geomorphic implications of hydrology (Bledsoe et al. 2007). Powell et al. (2006) also provide FDC computation in a suite of spreadsheet tools known as the STREAM diagnostic modules.
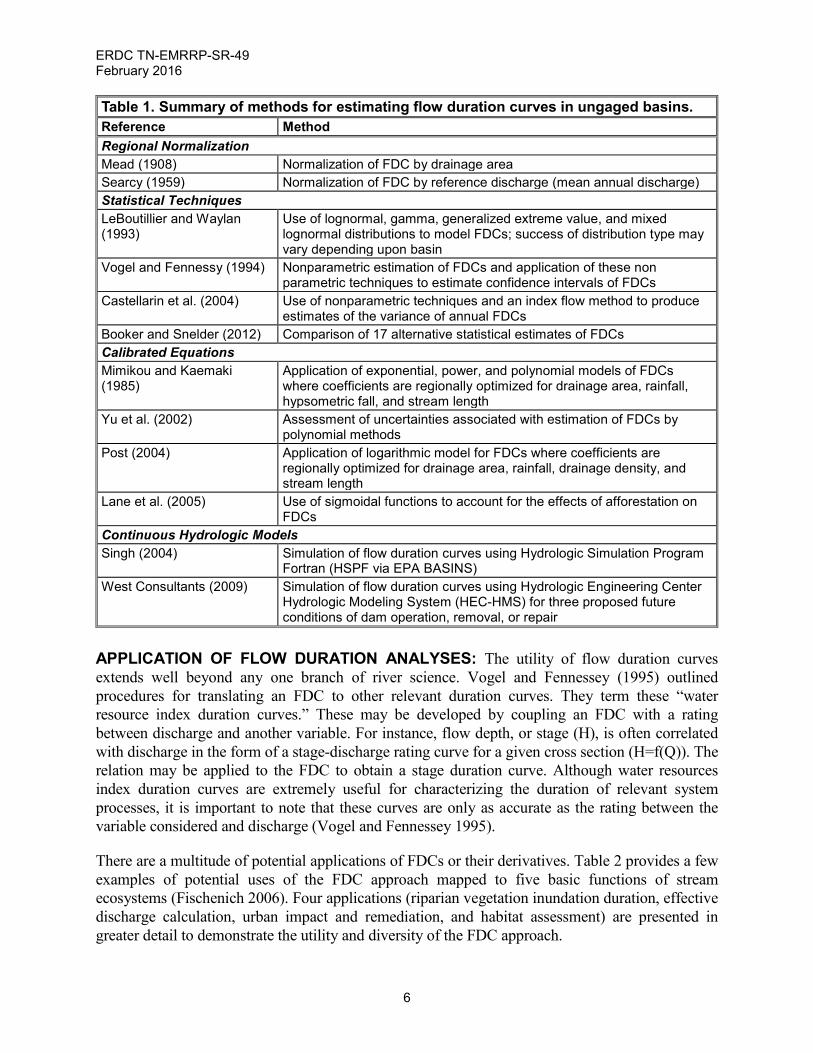
Ungaged basins. Many methods have been proposed for generation of FDCs in ungaged basins (Table 1). Most commonly, FDCs are transferred from nearby gages or estimated by a regional FDC using discharge normalized by a drainage area or a reference discharge (e.g., Q2, Qbankfull, Qmedian). Searcy (1959) states that the history of these types of regionally normalized curves extends as far back as the early 1900s, but even historical analyses acknowledge the significant amount of uncertainty associated with estimating FDCs in this manner. Figure 4 presents a typical set of flow duration curves normalized by drainage area.
Other analytical techniques used to estimate FDCs in ungaged basins include: parametric and nonparametric statistical techniques, calibrated regional equations, and continuous hydrologic modeling. Table 1 presents a summary of methods for estimating FDCs in ungaged basins (also reviewed by Dashora et al. 2014). Due to uncertainty in estimating FDCs in ungaged basins, appropriate methods of FDC generation should be carefully selected (Yu et al. 2002).
Figure 4. Flow duration data normalized by drainage area for six gages in the Catskill region of New
York.
ERDC TN-EMRRP-SR-49 February 2016
6
Table 1. Summary of methods for estimating flow duration curves in ungaged basins. Reference Method Regional Normalization Mead (1908) Normalization of FDC by drainage area Searcy (1959) Normalization of FDC by reference discharge (mean annual discharge) Statistical Techniques LeBoutillier and Waylan (1993)
Use of lognormal, gamma, generalized extreme value, and mixed lognormal distributions to model FDCs; success of distribution type may vary depending upon basin
Vogel and Fennessy (1994) Nonparametric estimation of FDCs and application of these non parametric techniques to estimate confidence intervals of FDCs
Castellarin et al. (2004) Use of nonparametric techniques and an index flow method to produce estimates of the variance of annual FDCs
Booker and Snelder (2012) Comparison of 17 alternative statistical estimates of FDCs Calibrated Equations Mimikou and Kaemaki (1985)
Application of exponential, power, and polynomial models of FDCs where coefficients are regionally optimized for drainage area, rainfall, hypsometric fall, and stream length
Yu et al. (2002) Assessment of uncertainties associated with estimation of FDCs by polynomial methods
Post (2004) Application of logarithmic model for FDCs where coefficients are regionally optimized for drainage area, rainfall, drainage density, and stream length
Lane et al. (2005) Use of sigmoidal functions to account for the effects of afforestation on FDCs
Continuous Hydrologic Models Singh (2004) Simulation of flow duration curves using Hydrologic Simulation Program
Fortran (HSPF via EPA BASINS) West Consultants (2009) Simulation of flow duration curves using Hydrologic Engineering Center
Hydrologic Modeling System (HEC-HMS) for three proposed future conditions of dam operation, removal, or repair
APPLICATION OF FLOW DURATION ANALYSES: The utility of flow duration curves extends well beyond any one branch of river science. Vogel and Fennessey (1995) outlined procedures for translating an FDC to other relevant duration curves. They term these “water resource index duration curves.” These may be developed by coupling an FDC with a rating between discharge and another variable. For instance, flow depth, or stage (H), is often correlated with discharge in the form of a stage-discharge rating curve for a given cross section (H=f(Q)). The relation may be applied to the FDC to obtain a stage duration curve. Although water resources index duration curves are extremely useful for characterizing the duration of relevant system processes, it is important to note that these curves are only as accurate as the rating between the variable considered and discharge (Vogel and Fennessey 1995).
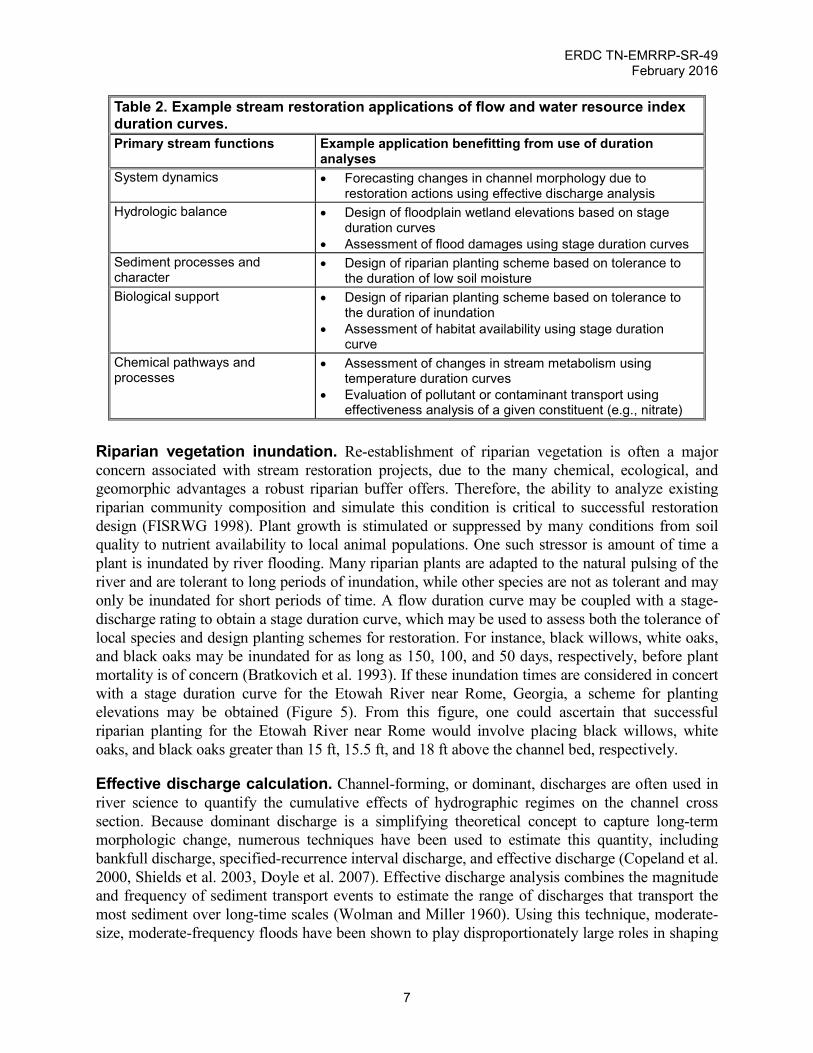
There are a multitude of potential applications of FDCs or their derivatives. Table 2 provides a few examples of potential uses of the FDC approach mapped to five basic functions of stream ecosystems (Fischenich 2006). Four applications (riparian vegetation inundation duration, effective discharge calculation, urban impact and remediation, and habitat assessment) are presented in greater detail to demonstrate the utility and diversity of the FDC approach.
ERDC TN-EMRRP-SR-49 February 2016
7
Table 2. Example stream restoration applications of flow and water resource index duration curves. Primary stream functions Example application benefitting from use of duration
analyses System dynamics • Forecasting changes in channel morphology due to
restoration actions using effective discharge analysis Hydrologic balance • Design of floodplain wetland elevations based on stage
duration curves • Assessment of flood damages using stage duration curves
Sediment processes and character
• Design of riparian planting scheme based on tolerance to the duration of low soil moisture
Biological support • Design of riparian planting scheme based on tolerance to the duration of inundation
• Assessment of habitat availability using stage duration curve
Chemical pathways and processes
• Assessment of changes in stream metabolism using temperature duration curves
• Evaluation of pollutant or contaminant transport using effectiveness analysis of a given constituent (e.g., nitrate)
Riparian vegetation inundation. Re-establishment of riparian vegetation is often a major concern associated with stream restoration projects, due to the many chemical, ecological, and geomorphic advantages a robust riparian buffer offers. Therefore, the ability to analyze existing riparian community composition and simulate this condition is critical to successful restoration design (FISRWG 1998). Plant growth is stimulated or suppressed by many conditions from soil quality to nutrient availability to local animal populations. One such stressor is amount of time a plant is inundated by river flooding. Many riparian plants are adapted to the natural pulsing of the river and are tolerant to long periods of inundation, while other species are not as tolerant and may only be inundated for short periods of time. A flow duration curve may be coupled with a stage-discharge rating to obtain a stage duration curve, which may be used to assess both the tolerance of local species and design planting schemes for restoration. For instance, black willows, white oaks, and black oaks may be inundated for as long as 150, 100, and 50 days, respectively, before plant mortality is of concern (Bratkovich et al. 1993). If these inundation times are considered in concert with a stage duration curve for the Etowah River near Rome, Georgia, a scheme for planting elevations may be obtained (Figure 5). From this figure, one could ascertain that successful riparian planting for the Etowah River near Rome would involve placing black willows, white oaks, and black oaks greater than 15 ft, 15.5 ft, and 18 ft above the channel bed, respectively.
Effective discharge calculation. Channel-forming, or dominant, discharges are often used in river science to quantify the cumulative effects of hydrographic regimes on the channel cross section. Because dominant discharge is a simplifying theoretical concept to capture long-term morphologic change, numerous techniques have been used to estimate this quantity, including bankfull discharge, specified-recurrence interval discharge, and effective discharge (Copeland et al. 2000, Shields et al. 2003, Doyle et al. 2007). Effective discharge analysis combines the magnitude and frequency of sediment transport events to estimate the range of discharges that transport the most sediment over long-time scales (Wolman and Miller 1960). Using this technique, moderate-size, moderate-frequency floods have been shown to play disproportionately large roles in shaping

ERDC TN-EMRRP-SR-49 February 2016
8
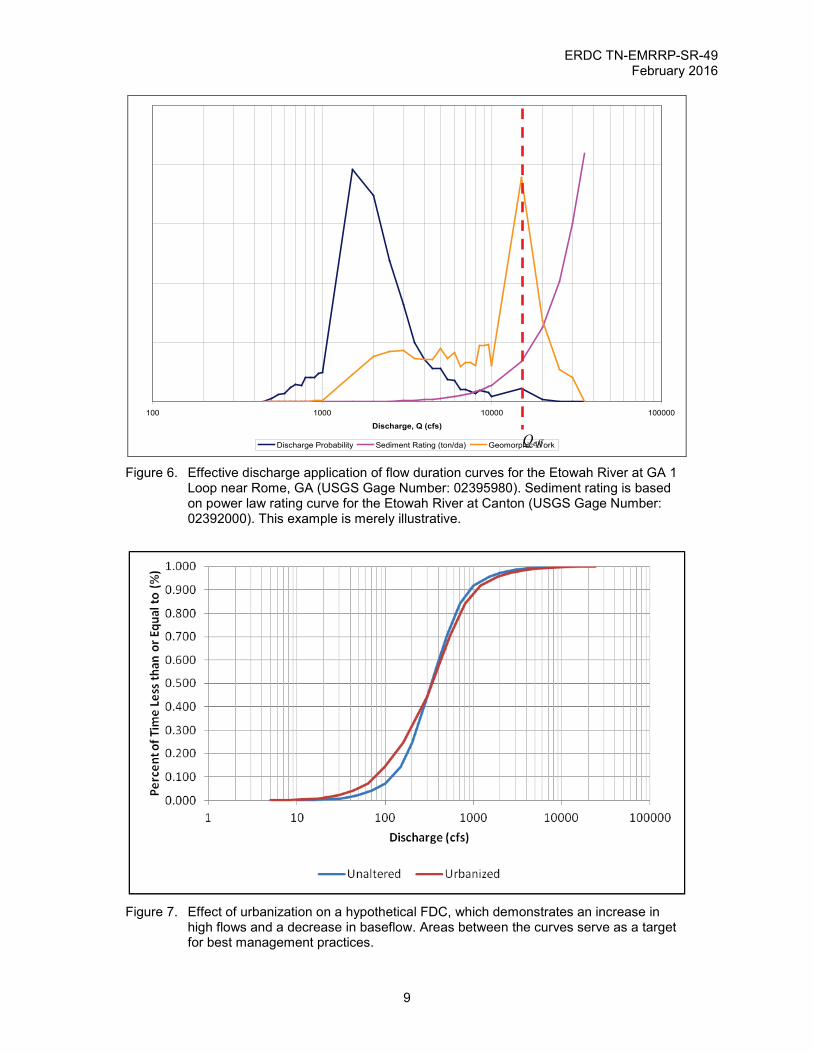
channel morphology by doing the most “geomorphic work” over time. Effective discharge is calculated by multiplying the probability distribution curve of river discharge (i.e., disaggregated FDC) with a sediment rating curve to develop an effectiveness curve; the peak of this curve is the most “effective” discharge (Qeff, Figure 6). The effective discharge is often used in calculations of channel stability and design of stream restoration projects and is merely presented here to demonstrate the utility of an FDC for geomorphic applications in river restoration. Biedenharn et al. (1999) provide a thorough review of effective discharge calculation. Doyle et al. (2005) proposed effectiveness analysis as a technique for assessing critical thresholds in ecological response to river discharge. They demonstrated the applicability of effectiveness analysis using geographically dispersed, available data sets for five ecological processes: organic matter transport, algal growth, flood transport of macroinvertebrates, nutrient transport and retention, and physical habitat availability.
Urban impact and remediation. The effects of urbanization on hydrology are well known; conversion of land from vegetation cover to impervious surface causes the magnitude of runoff from storms to increase and often causes a reduction in the baseflow of receiving streams (Booth and Bledsoe 2009). This effect is shown in the FDC displayed in Figure 7. The area between the curves for the higher discharge is the volume of added runoff due to urbanization; the area between the curves for lower discharge reflects a reduction in baseflow (though not a 1-for-1 relation). These differences can be used to help design remedial best management practices (e.g., detention basins, permeable surfaces, etc.). Vogel et al. (2007) recognize that these changes in the FDC can occur due to a variety of drivers and apply the generalized terms “ecosurplus” and “ecodeficit,” for high flows and low flows, respectively.
0%
10%
20%
30%
40%
50%
60%
70%
80%
90%
100%
12 16 20 24 28 32 36
Stage, H (ft)
Perc
ent o
f Tim
e Le
ss th
an o
r Equ
al to
(%)
Power BlackWillow WhiteOak BlackOak
Figure 5. Stage duration curve applied to vegetation inundation of the Etowah River at GA 1 Loop near Rome, GA (USGS Gage Number: 02395980). This example is merely illustrative.
ERDC TN-EMRRP-SR-49 February 2016
9
100 1000 10000 100000
Discharge, Q (cfs)
Discharge Probability Sediment Rating (ton/da) Geomorphic Work
Figure 6. Effective discharge application of flow duration curves for the Etowah River at GA 1 Loop near Rome, GA (USGS Gage Number: 02395980). Sediment rating is based on power law rating curve for the Etowah River at Canton (USGS Gage Number: 02392000). This example is merely illustrative.
Figure 7. Effect of urbanization on a hypothetical FDC, which demonstrates an increase in
high flows and a decrease in baseflow. Areas between the curves serve as a target for best management practices.
Qeff
ERDC TN-EMRRP-SR-49 February 2016
10
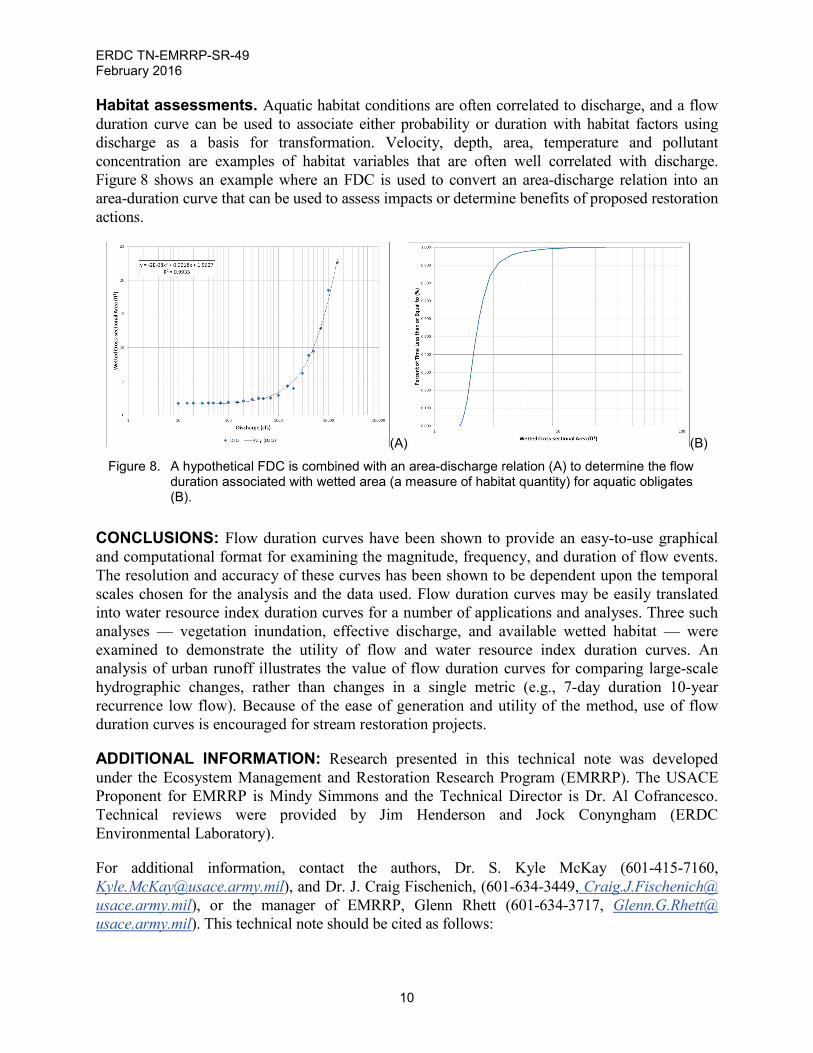
Habitat assessments. Aquatic habitat conditions are often correlated to discharge, and a flow duration curve can be used to associate either probability or duration with habitat factors using discharge as a basis for transformation. Velocity, depth, area, temperature and pollutant concentration are examples of habitat variables that are often well correlated with discharge. Figure 8 shows an example where an FDC is used to convert an area-discharge relation into an area-duration curve that can be used to assess impacts or determine benefits of proposed restoration actions.
(A) (B)
Figure 8. A hypothetical FDC is combined with an area-discharge relation (A) to determine the flow duration associated with wetted area (a measure of habitat quantity) for aquatic obligates (B).
CONCLUSIONS: Flow duration curves have been shown to provide an easy-to-use graphical and computational format for examining the magnitude, frequency, and duration of flow events. The resolution and accuracy of these curves has been shown to be dependent upon the temporal scales chosen for the analysis and the data used. Flow duration curves may be easily translated into water resource index duration curves for a number of applications and analyses. Three such analyses — vegetation inundation, effective discharge, and available wetted habitat — were examined to demonstrate the utility of flow and water resource index duration curves. An analysis of urban runoff illustrates the value of flow duration curves for comparing large-scale hydrographic changes, rather than changes in a single metric (e.g., 7-day duration 10-year recurrence low flow). Because of the ease of generation and utility of the method, use of flow duration curves is encouraged for stream restoration projects.
ADDITIONAL INFORMATION: Research presented in this technical note was developed under the Ecosystem Management and Restoration Research Program (EMRRP). The USACE Proponent for EMRRP is Mindy Simmons and the Technical Director is Dr. Al Cofrancesco. Technical reviews were provided by Jim Henderson and Jock Conyngham (ERDC Environmental Laboratory).
For additional information, contact the authors, Dr. S. Kyle McKay (601-415-7160, [email protected]), and Dr. J. Craig Fischenich, (601-634-3449, Craig.J.Fischenich@ usace.army.mil), or the manager of EMRRP, Glenn Rhett (601-634-3717, Glenn.G.Rhett@ usace.army.mil). This technical note should be cited as follows:
ERDC TN-EMRRP-SR-49 February 2016
11
McKay S. K. and J. C. Fischenich. 2016. Development and application of flow duration curves for stream restoration. EBA Technical Notes Collection. ERDC TN-EMRRP-SR-49. Vicksburg, MS: U.S. Army Engineer Research and Development Center. http://cw-environment.usace.army.mil/eba/
REFERENCES:
Biedenharn, D. S., C. R.Thorne, P. J. Soar, R. D. Hey, and C. C. Watson. 1999. A practical guide to effective discharge calculation. In Channel rehabilitation: Processes, design, and implementation, ed. C. C.Watson, D. S.Biedenharn, and S. H.Scott, 263-296. Vicksburg, MS: U.S. Army Engineer Research and Development Center.
Biedenharn, D. S., R. R. Copeland, C. R. Thorne, P. J. Soar, R. D. Hey, and C. Watson. 2000. Effective discharge calculation: A practical guide. ERDC/CHL TR-00-15. Vicksburg, MS: U.S. Army Engineer Research and Development Center.
Bledsoe, B. P., M. C. Brown, and D. A. Raff. 2007. GeoTools: A toolkit for fluvial system analysis. Journal of the American Water Resources Association 43 (3): 757-772.
Booker, D. J., and T. H.Snelder. 2012. Comparing methods for estimating flow duration curves at ungauged sites. Journal of Hydrology Vol. 434-435, 78-94.
Booth, D. B., and B. P. Bledsoe. 2009. Streams and urbanization. Chapter 6 In The Water Environment of Cities, ed. L. A. Baker, 93-123. New York: Springer.
Bratkovich, S., L. Burban, S. Katovich, C. Locey, J. Pokorny, and R. Wiest. 1993. Flooding and its effects on trees. U.S. Department of Agriculture, Forest Service. Accessed 31 May 2012. http://www.na.fs.fed.us/spfo/pubs/n_resource/flood/cover.htm.
Castellarin, A., R. M. Vogel, and A. Brath. 2004. A stochastic index flow model of flow duration curves. Water Resources Research 40 (3): 1-10.
Copeland, R. R., D. S. Biedenharn, and J. C. Fischenich 2000. Channel-forming discharge. CHETN-VIII-05. Vicksburg, MS: U.S. Army Corps of Engineers.
Dashora, I., S. K. Singal, and D. K. Srivastav. 2014. Regional flow duration curve methods for hydropower development: A review. Journal of Indian Water Resources Society 34 (3): 7-15.
Doyle, M. W., E. H. Stanley, D. L. Strayer, R. B. Jacobson, and J. C. Schmidt. 2005. Effective discharge analysis of ecological processes in streams. Water Resources Research 41 (W11411).
Doyle, M. W., D. Shields, K. F. Boyd, P. B. Skidmore, and D. Dominick. 2007. Channel-forming discharge selection in river restoration design. Journal of Hydraulic Engineering 133 (7): 831-837.
Federal Interagency Stream Restoration Working Group (FISRWG). 1998. Stream corridor restoration: Principles, processes, and practices. GPO Item No. 0120-A. Federal Interagency Stream Restoration Working Group (15 Federal agencies of the US government).
Fischenich, J. C. 2006. Functional objectives for stream restoration. ERDC TN-EMRRP-SR-52. Vicksburg, MS: U.S. Army Engineer Research and Development Center.
Fischenich, J. C., and S. K. McKay 2011. Hydrologic analyses for stream restoration design. ERDC TN-EMRRP-EBA-08. Vicksburg, MS: U.S. Army Engineer Research and Development Center.
Lane, P. N. J., A. E. Best, K. Hickel, and L. Zhang. 2005. The response of flow duration curves to afforestation. Journal of Hydrology 310: 253-265.
LeBouttilier, D. W., and P. R. Waylen. 1993. A stochastic model of flow duration curves. Water Resources Research 29 (10): 3535-3541.
Mimikou, M., and S. Kaemaki. 1985. Regionalization of flow duration characteristics. Journal of Hydrology 82: 77-91.

ERDC TN-EMRRP-SR-49 February 2016
12
Olden, J. D., and N. L. Poff. 2003. Redundancy and the choice of hydrologic indices for characterizing streamflow regimes. River Research and Applications 19: 101-121.
Palmer, M. A., and E. S. Bernhardt. 2006. Hydroecology and river restoration: Ripe for synthesis. Water Resources Research 42 (2): 1-4.
Poff, N. L., J. D. Allan, M. B. Bain, J. R. Karr, K. L. Prestegaard, B. D. Richter, R. E. Sparks, and J. C. Stromberg. 1997. The natural flow regime. Bioscience 47: 769-784.
Post, D. A. 2004. A new method for estimating flow duration curves: An application to the Burdekin River catchment, North Queensland, Australia. In Complexity and Integrated Resources Management, Transactions of the 2nd Biennial Meeting of the International Environmental and Modelling Software Society, Manno, Switzerland: iEMSs.
Powell, G. E., D. E. Mecklenbeurg, and A. D. Ward. 2006. Spreadsheet tools for river evaluation, assessment, and monitoring: The STREAM diagnostic modules. ASCE World Environmental and Water Resources Congress, Omaha, Nebraska.
Searcy, J. K. 1959. Flow-duration curves. In Manual of Hydrology. Water Supply Paper 1542-A, Washington, DC: United States Geological Survey.
Shields, F. D., R. R. Copeland, P. C. Klingeman, M. W. Doyle, and A. Simon. 2003. Design for stream restoration. Journal of Hydraulic Engineering 129 (8): 575-584.
Singh, J. 2004. Hydrologic model of the Vermilion River watershed for streamflow simulations. Illinois Department of Natural Resources and Illinois State Geological Survey. Illinois State Water Survey Contract Report 2004-10.
Soar, P. J., and C. R. Thorne. 2001. Channel restoration design for meandering rivers. ERDC/CHL CR-01-1, Vicksburg, MS: U.S. Army Engineer Research and Development Center.
The Nature Conservancy (TNC). 2009. Indicators of hydrologic alteration: Version 7.1 User’s Manual. The Nature Conservancy.
Vogel, R. M., and N. M. Fennessey. 1994. Flow duration curves I: New interpretation and confidence intervals. Journal of Water Resources Planning and Management 120 (4): 485-504.
Vogel, R. M., and N. M. Fennessey. 1995. Flow duration curves II: A review of applications in water resources planning. Water Resources Bulletin 31 (6): 1029-1039.
Vogel, R. M., J. Sieber, S. A. Archfield, M. P. Smith, C. D. Apse, and A. Huber-Lee. 2007. Relations among storage, yield, and instream flow. Water Resources Research, 43 (W05403).
West Consultants, Inc. 2009. Canyon Creek Meadows dam and reservoir hydrologic analysis. Appendix A in DRAFT - Canyon Creek Meadows Dam Evaluation Report Grant County, Oregon Sections 28 and 29, T15S, R33E, W.M. Oregon Department of Fish and Wildlife.
Wolman, M. G., and J. P. Miller. 1960. Magnitude and frequency of forces in geomorphic processes. Journal of Geology 68: 54-74.
Yu, P. S., T. C. Yang, and Y. C. Wang. 2002. Uncertainty analysis of regional flow duration curves. Journal of Water Resources Planning and Management 128 (6): 424-430.
NOTE: The contents of this technical note are not to be used for advertising, publication, or promotional purposes. Citation of trade names does not constitute an official endorsement or
approval of the use of such products.