ERC LEP GrowthDashboard Presentation Leeds. 12th November 2014
32
Cluster Analysis and the LEP Growth Dashboard ERC and GrowthAccelerator LEP Presentation – Leeds 12 th November 2014
-
Upload
enterpriseresearchcentre -
Category
Business
-
view
59 -
download
1
Transcript of ERC LEP GrowthDashboard Presentation Leeds. 12th November 2014

Cluster Analysis and the LEP Growth Dashboard
ERC and GrowthAccelerator
LEP Presentation – Leeds 12th November 2014

State of Small Business Britain
http://enterpriseresearch.ac.uk/home-8/report-back-state-small-business-britain-conference-2014/
Structure
• Background – developing policy context
• LEP Cluster Analysis
• LEP Growth Dashboard
• Discussion

Background
• BIS commissioned the Enterprise Research Centre (ERC) to undertake an analysis of industrial clusters in the UK – Anyadike-Danes et al (2013) “Localisation of Industrial Activity across England’s LEPs: 2008 & 2012”
• Local Enterprise Partnerships (LEPs) the sub-national spatial frame in England.
• ERC working with the BIS Local Growth team, the What Works Centre and Grant Thornton/Growth Accelerator to provide analysis on the LEPs and Growth Hubs.

Developing Policy Agenda around Growth
• LEP SEPs and ESIFs submitted and funding allocated
• Growth Hubs – initial pathfinders; Wave 2 Cities (Lancaster University RGF Programme)
• BIS - Simplifying the Local Business Support Landscape - a guide for Cities and LEPs – 3 pilots: EM3 LEP; Northamptonshire LEP; Sheffield City Region LEP
Clusters

2012 Top 20 by LQ Humber
SIC Sites (GB) Jobs (GB) Sites (LEP) Jobs (LEP) LQ (LEP) SIC description
29203 112 3931 22 2529 46.52 Manufacture of caravans
10200 369 13897 56 3165 16.47 Processing and preserving of fish, crustaceans and molluscs
20150 100 2183 10 420 13.91 Manufacture of fertilisers and nitrogen compounds
1460 759 3656 78 470 9.30 Raising of swine/pigs
10920 157 4946 11 462 6.75 Manufacture of prepared pet foods
52220 967 21838 39 1911 6.33 Service activities incidental to water transportation
46380 1529 16202 113 1401 6.25 Wholesale of other food, including fish, crustaceans and molluscs
52241 110 1862 10 147 5.71 Cargo handling for water transport activities of division 50
47230 876 2478 76 187 5.46 Retail sale of fish, crustaceans and molluscs in specialised stores
1130 5246 38162 241 2789 5.28 Growing of vegetables and melons, roots and tubers
29202 232 5525 10 387 5.06 Manufacture of trailers and semi-trailers
31020 963 12878 21 781 4.38 Manufacture of kitchen furniture
10120 145 17980 11 1060 4.26 Processing and preserving of poultry meat
1110 9040 40346 483 2064 3.70 Growing of cereals (except rice), leguminous crops and oil seeds
8120 708 7870 21 396 3.64 Operation of gravel and sand pits; mining of clays and kaolin
81222 1075 10962 25 543 3.58 Specialised cleaning services
18130 1683 10565 20 514 3.52 Pre-press and pre-media services
33120 2199 28141 60 1348 3.46 Repair of machinery
46220 871 7618 17 363 3.45 Wholesale of flowers and plants
1190 513 5347 18 254 3.43 Growing of other non-perennial crops
256387 21191 8.3% Top 20 LEP SICs % of GB SIC jobs
Table 5.16.3: Top 20 Sectors by LQ 2012 - Humber
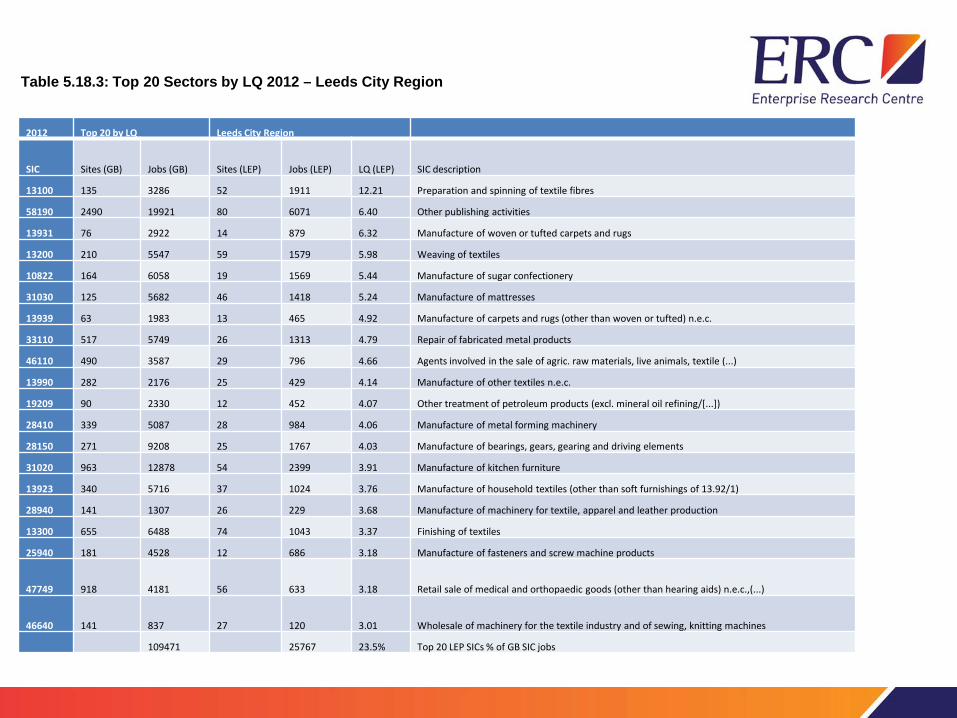
2012 Top 20 by LQ Leeds City Region
SIC Sites (GB) Jobs (GB) Sites (LEP) Jobs (LEP) LQ (LEP) SIC description
13100 135 3286 52 1911 12.21 Preparation and spinning of textile fibres
58190 2490 19921 80 6071 6.40 Other publishing activities
13931 76 2922 14 879 6.32 Manufacture of woven or tufted carpets and rugs
13200 210 5547 59 1579 5.98 Weaving of textiles
10822 164 6058 19 1569 5.44 Manufacture of sugar confectionery
31030 125 5682 46 1418 5.24 Manufacture of mattresses
13939 63 1983 13 465 4.92 Manufacture of carpets and rugs (other than woven or tufted) n.e.c.
33110 517 5749 26 1313 4.79 Repair of fabricated metal products
46110 490 3587 29 796 4.66 Agents involved in the sale of agric. raw materials, live animals, textile (...)
13990 282 2176 25 429 4.14 Manufacture of other textiles n.e.c.
19209 90 2330 12 452 4.07 Other treatment of petroleum products (excl. mineral oil refining/[...])
28410 339 5087 28 984 4.06 Manufacture of metal forming machinery
28150 271 9208 25 1767 4.03 Manufacture of bearings, gears, gearing and driving elements
31020 963 12878 54 2399 3.91 Manufacture of kitchen furniture
13923 340 5716 37 1024 3.76 Manufacture of household textiles (other than soft furnishings of 13.92/1)
28940 141 1307 26 229 3.68 Manufacture of machinery for textile, apparel and leather production
13300 655 6488 74 1043 3.37 Finishing of textiles
25940 181 4528 12 686 3.18 Manufacture of fasteners and screw machine products
47749 918 4181 56 633 3.18 Retail sale of medical and orthopaedic goods (other than hearing aids) n.e.c.,(...)
46640 141 837 27 120 3.01 Wholesale of machinery for the textile industry and of sewing, knitting machines
109471 25767 23.5% Top 20 LEP SICs % of GB SIC jobs
Table 5.18.3: Top 20 Sectors by LQ 2012 – Leeds City Region

2012 Top 20 by LQ Sheffield City Region
SIC Sites (GB) Jobs (GB) Sites (LEP) Jobs (LEP) LQ (LEP) SIC description
25710 33 361 21 257 29.63 Manufacture of cutlery
24520 115 3082 18 786 10.61 Casting of steel
24100 268 21788 38 3851 7.36 Manufacture of basic iron and steel and of ferro-alloys
25930 470 7793 29 1295 6.92 Manufacture of wire products, chain and springs
10890 690 26434 16 4299 6.77 Manufacture of other food products n.e.c.
25730 1085 13615 97 2105 6.43 Manufacture of tools
23200 110 2413 14 341 5.88 Manufacture of refractory products
24450 100 4198 11 560 5.55 Other non-ferrous metal production
82200 999 72636 27 8373 4.80 Activities of call centres
25290 172 4011 12 416 4.32 Manufacture of other tanks, reservoirs and containers of metal
31020 963 12878 22 1172 3.79 Manufacture of kitchen furniture
33170 558 8820 19 732 3.45 Repair and maintenance of other transport equipment
28930 407 6171 18 512 3.45 Manufacture of machinery for food, beverage and tobacco processing
25500 759 18305 31 1433 3.26 Forging, pressing, stamping and roll-forming of metal; powder metallurgy
27400 705 14302 22 1116 3.25 Manufacture of electric lighting equipment
42120 366 8009 19 620 3.22 Construction of railways and underground railways
25610 1404 20041 55 1481 3.08 Treatment and coating of metals
28960 798 5121 27 375 3.05 Manufacture of plastics and rubber machinery
46720 1927 26148 132 1795 2.86 Wholesale of metals and metal ores
43342 1883 6796 43 461 2.82 Glazing
282922 31980 11.3% Top 20 LEP SICs % of GB SIC jobs
Table 5.30.3: Top 20 Sectors by LQ 2012 – Sheffield City Region

2012 Top 20 by LQ Tees Valley
SIC Sites (GB) Jobs (GB) Sites (LEP) Jobs (LEP) LQ (LEP) SIC description
20140 143 10389 15 1908 19.52 Manufacture of other organic basic chemicals
35110 1152 25756 12 1389 5.73 Production of electricity
31020 963 12878 13 657 5.42 Manufacture of kitchen furniture
25620 11574 85054 153 3815 4.77 Machining
64921 2623 27860 49 954 3.64 Credit granting by non-deposit taking finance houses and (...)
25110 2944 47542 41 1355 3.03 Manufacture of metal structures and parts of structures
71121 7822 43940 239 1174 2.84 Engineering design activities for industrial process and production
43390 15058 45785 81 1129 2.62 Other building completion and finishing
43999 11330 71566 128 1598 2.37 Specialised construction activities (other than scaffold erection) n.e.c.
10890 690 26434 12 579 2.33 Manufacture of other food products n.e.c.
43310 3548 10519 23 229 2.31 Plastering
81222 1075 10962 11 233 2.26 Specialised cleaning services
61900 8814 173701 65 3667 2.24 Other telecommunications activities
39000 521 3185 10 66 2.20 Remediation activities and other waste management services
71200 4536 41406 141 832 2.14 Technical testing and analysis
38320 2143 24066 22 465 2.05 Recovery of sorted materials
87100 4704 204756 80 3875 2.01 Residential nursing care activities
68201 7883 88363 75 1654 1.99 Renting and operating of Housing Association real estate
56301 9231 77593 134 1412 1.93 Licensed clubs
43342 1883 6796 21 112 1.75 Glazing
1038551 27103 2.6% Top 20 LEP SICs % of GB SIC jobs
Table 5.34.3: Top 20 Sectors by LQ 2012 – Tees Valley

2012 Top 20 by LQ North Eastern
SIC Sites (GB) Jobs (GB) Sites (LEP) Jobs (LEP) LQ (LEP) SIC description
74901 1575 5689 59 1060 6.73 Environmental consulting activities
27320 224 8386 12 1286 5.54 Manufacture of other electronic and electric wires and cables
20301 388 12319 16 1434 4.20 Manufacture of paints, varnishes and similar coatings, mastics and sealants
17230 299 4582 10 504 3.97 Manufacture of paper stationery
43130 258 1420 20 152 3.87 Test drilling and boring
90020 1513 4838 14 492 3.67 Support activities to performing arts
29320 1124 43762 42 4058 3.35 Manufacture of other parts and accessories for motor vehicles
84130 636 56356 25 5180 3.32 Regulation of and contribution to more efficient operation of businesses
84300 557 55896 27 5121 3.31 Compulsory social security activities
29100 770 60654 15 5363 3.19 Manufacture of motor vehicles
23190 273 2330 18 205 3.18 Manufacture and processing of other glass, including technical glassware
27400 705 14302 19 1221 3.08 Manufacture of electric lighting equipment
23120 446 9519 16 753 2.86 Shaping and processing of flat glass
23630 847 4950 34 382 2.79 Manufacture of ready-mixed concrete
25500 759 18305 24 1391 2.74 Forging, pressing, stamping and roll-forming of metal; powder metallurgy
22210 567 24043 22 1772 2.66 Manufacture of plastic plates, sheets, tubes and profiles
28250 972 22540 35 1646 2.64 Manufacture of non-domestic cooling and ventilation equipment
13921 1238 12535 48 889 2.56 Manufacture of soft furnishings
28220 908 16225 34 1127 2.51 Manufacture of lifting and handling equipment
36000 889 28293 32 1925 2.46 Water collection, treatment and supply
406944 35961 8.8% Top 20 LEP SICs % of GB SIC jobs
Table 5.25.3: Top 20 Sectors by LQ 2012 – North Eastern
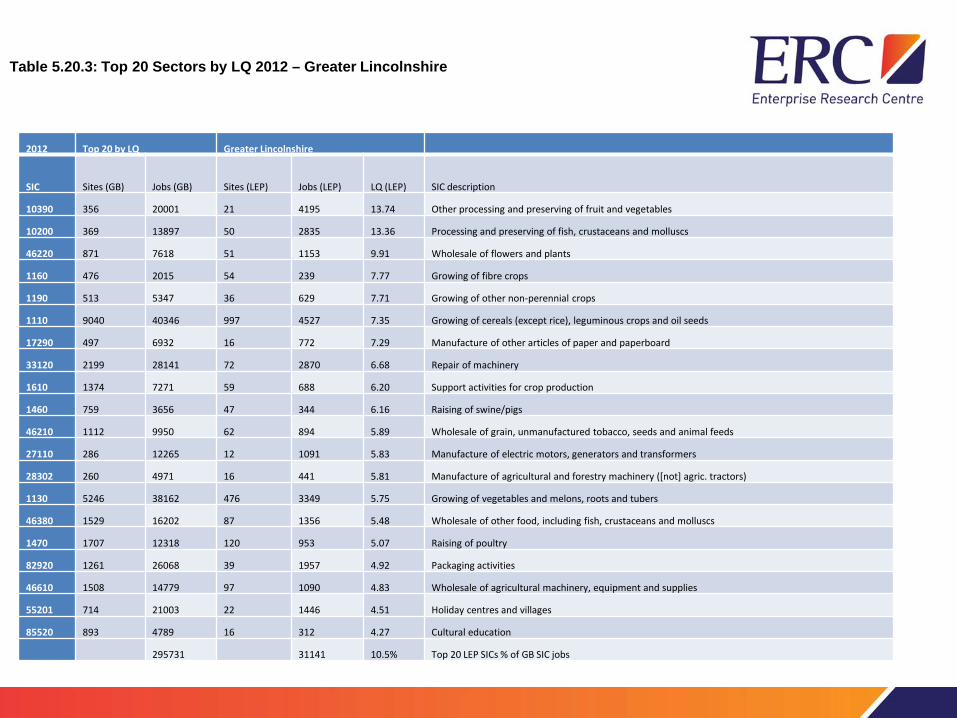
2012 Top 20 by LQ Greater Lincolnshire
SIC Sites (GB) Jobs (GB) Sites (LEP) Jobs (LEP) LQ (LEP) SIC description
10390 356 20001 21 4195 13.74 Other processing and preserving of fruit and vegetables
10200 369 13897 50 2835 13.36 Processing and preserving of fish, crustaceans and molluscs
46220 871 7618 51 1153 9.91 Wholesale of flowers and plants
1160 476 2015 54 239 7.77 Growing of fibre crops
1190 513 5347 36 629 7.71 Growing of other non-perennial crops
1110 9040 40346 997 4527 7.35 Growing of cereals (except rice), leguminous crops and oil seeds
17290 497 6932 16 772 7.29 Manufacture of other articles of paper and paperboard
33120 2199 28141 72 2870 6.68 Repair of machinery
1610 1374 7271 59 688 6.20 Support activities for crop production
1460 759 3656 47 344 6.16 Raising of swine/pigs
46210 1112 9950 62 894 5.89 Wholesale of grain, unmanufactured tobacco, seeds and animal feeds
27110 286 12265 12 1091 5.83 Manufacture of electric motors, generators and transformers
28302 260 4971 16 441 5.81 Manufacture of agricultural and forestry machinery ([not] agric. tractors)
1130 5246 38162 476 3349 5.75 Growing of vegetables and melons, roots and tubers
46380 1529 16202 87 1356 5.48 Wholesale of other food, including fish, crustaceans and molluscs
1470 1707 12318 120 953 5.07 Raising of poultry
82920 1261 26068 39 1957 4.92 Packaging activities
46610 1508 14779 97 1090 4.83 Wholesale of agricultural machinery, equipment and supplies
55201 714 21003 22 1446 4.51 Holiday centres and villages
85520 893 4789 16 312 4.27 Cultural education
295731 31141 10.5% Top 20 LEP SICs % of GB SIC jobs
Table 5.20.3: Top 20 Sectors by LQ 2012 – Greater Lincolnshire

Industrial Sectors Analysis • Witty Review sought to examine ways in which universities
can support economic growth working in conjunction with organisations such as Local Enterprise Partnerships (LEPs).
• Two main hypotheses: – strongest basis for regional economic growth is based on a
comprehensive understanding of a locality’s comparative economic advantage;
– much of the UK’s comparative economic advantage could be derived from its universities and research in fields relevant to the Industrial Strategy sectors and technologies.
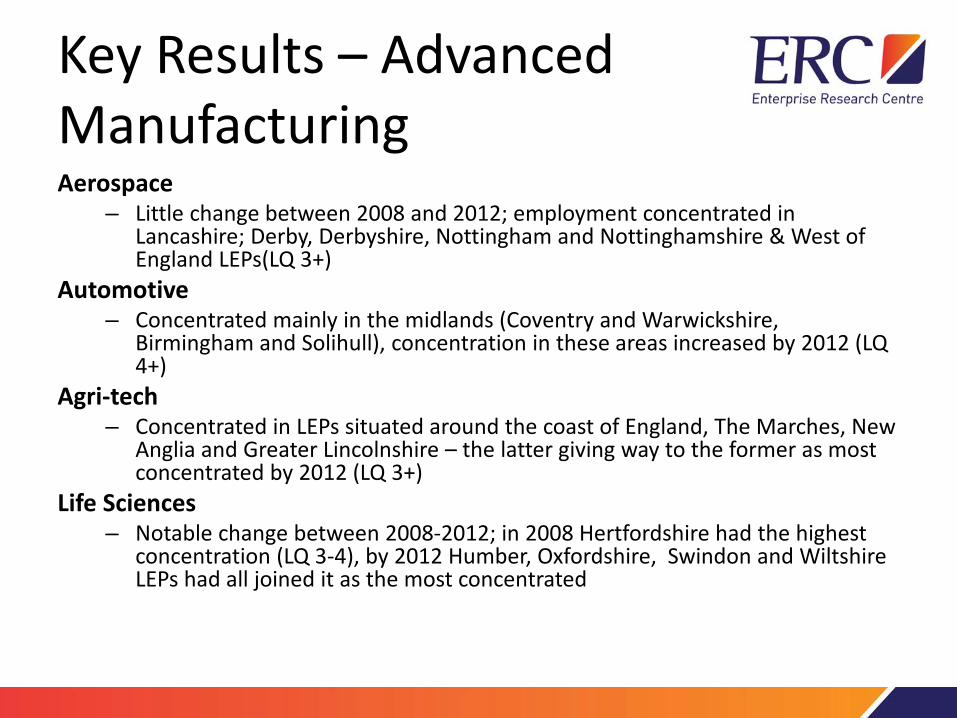
Key Results – Advanced Manufacturing Aerospace
– Little change between 2008 and 2012; employment concentrated in Lancashire; Derby, Derbyshire, Nottingham and Nottinghamshire & West of England LEPs(LQ 3+)
Automotive – Concentrated mainly in the midlands (Coventry and Warwickshire,
Birmingham and Solihull), concentration in these areas increased by 2012 (LQ 4+)
Agri-tech – Concentrated in LEPs situated around the coast of England, The Marches, New
Anglia and Greater Lincolnshire – the latter giving way to the former as most concentrated by 2012 (LQ 3+)
Life Sciences – Notable change between 2008-2012; in 2008 Hertfordshire had the highest
concentration (LQ 3-4), by 2012 Humber, Oxfordshire, Swindon and Wiltshire LEPs had all joined it as the most concentrated

Key Results – Knowledge Intensive Traded Services Professional and Business Services
– Not particularly concentrated in any LEP, those in the South of England higher than average, by 2012 the Midlands also higher than average (LQs 1-2)
Information Economy – Concentrated within a few LEPS, mainly in the South (Thames Valley
Berkshire, Enterprise M3). In 2008 Cheshire and Warrington was the only Northern LEP with a higher than average concentration (LQ 1-2), by 2012 this was below average
Education – Not particularly concentrated in any LEP, no change between 2008 and
2012
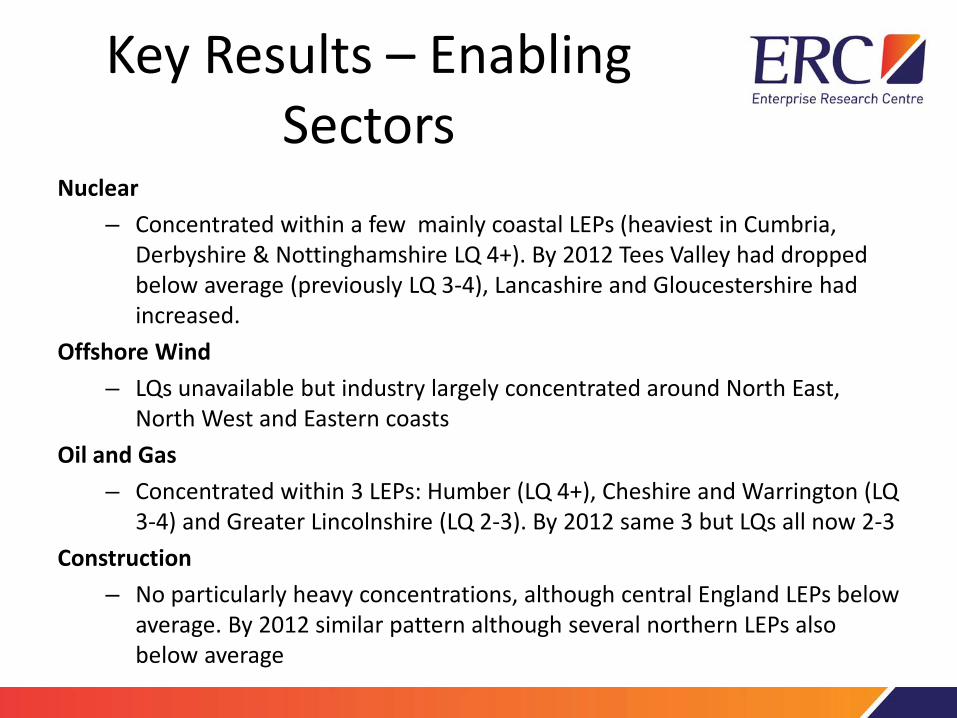
Key Results – Enabling Sectors
Nuclear – Concentrated within a few mainly coastal LEPs (heaviest in Cumbria,
Derbyshire & Nottinghamshire LQ 4+). By 2012 Tees Valley had dropped below average (previously LQ 3-4), Lancashire and Gloucestershire had increased.
Offshore Wind – LQs unavailable but industry largely concentrated around North East,
North West and Eastern coasts Oil and Gas
– Concentrated within 3 LEPs: Humber (LQ 4+), Cheshire and Warrington (LQ 3-4) and Greater Lincolnshire (LQ 2-3). By 2012 same 3 but LQs all now 2-3
Construction – No particularly heavy concentrations, although central England LEPs below
average. By 2012 similar pattern although several northern LEPs also below average

UK Industrial Sectors - Summary • Overall, few changes between 2008-2012 • Increase in Life Sciences amongst Oxfordshire, Swindon and
Wiltshire and Humber LEPs • Majority of industry concentrated largely where it has been
historically: – Heavy advanced manufacturing concentrated in the
midlands area – Information and Professional Services skewed towards
Southern areas – Enabling sectors situated in Northern coastal areas
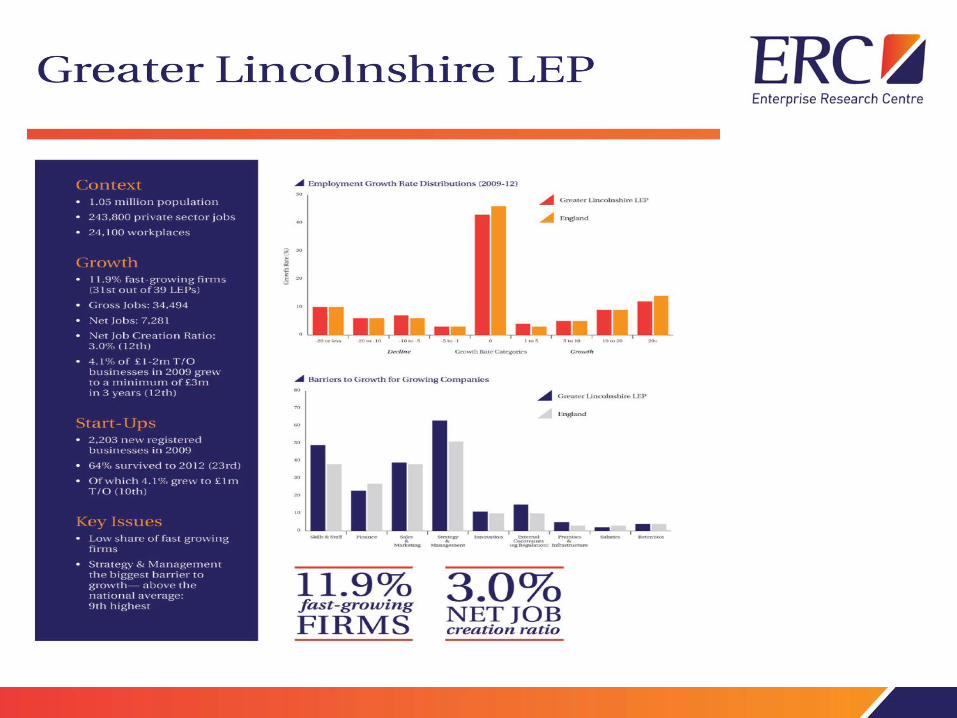
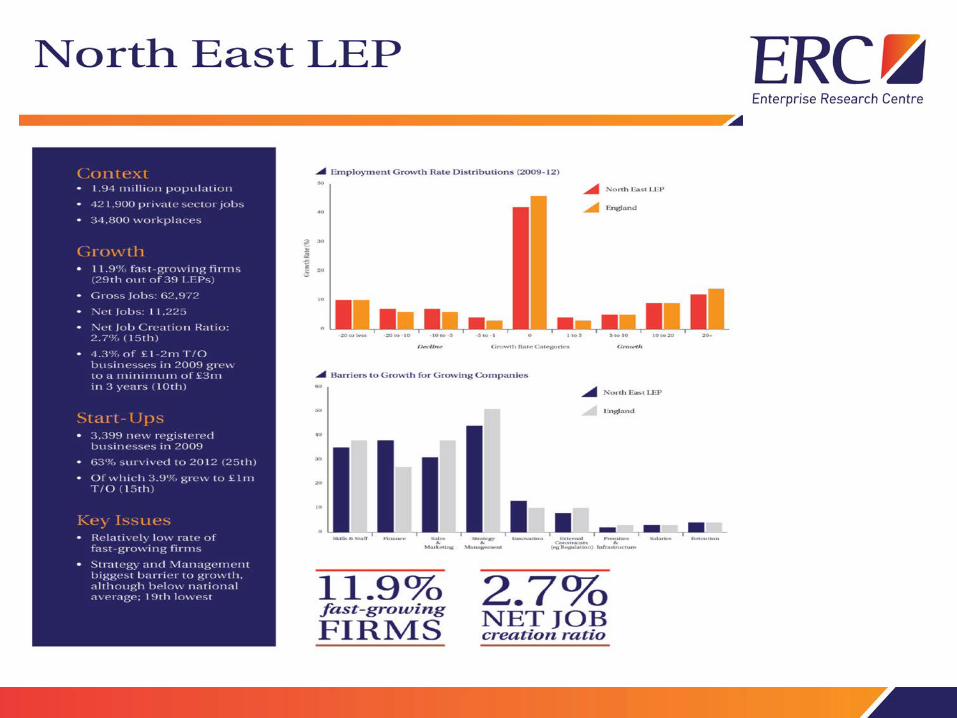
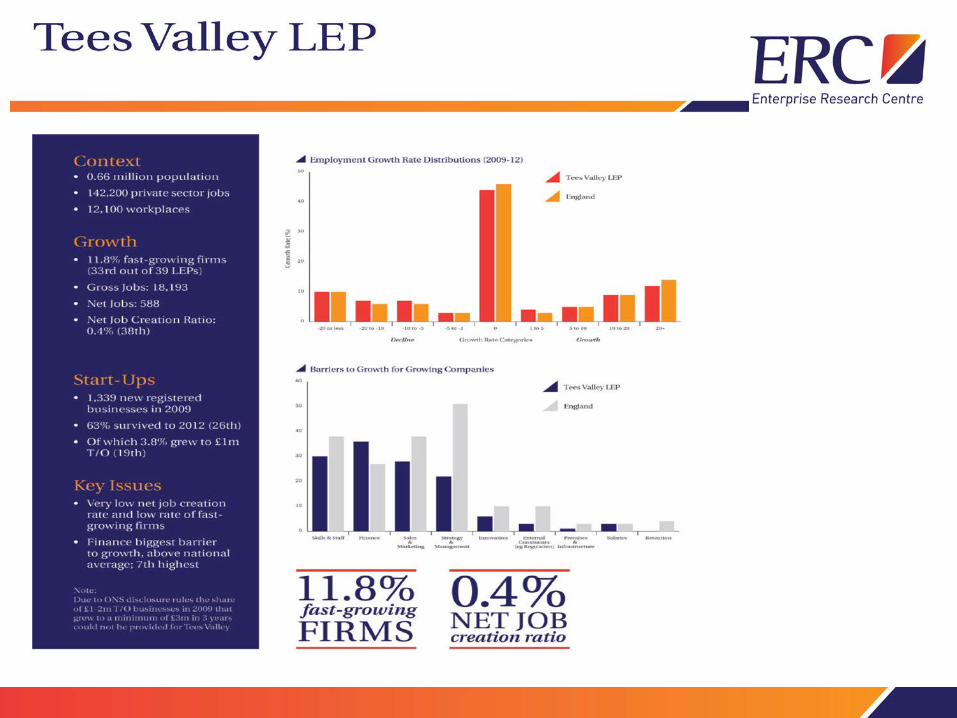
LEP Growth Dashboard
Joint venture between ERC and GrowthAccelerator

What is it?
• Its purpose is to provide each LEP with a set of simple metrics on the growth of existing firms and start-ups in the LEP area.
• Set alongside the key barriers to growth flagged by businesses
who are seeking to grow and have become a participant in the GrowthAccelerator programme.
• The Dashboard, based primarily on ONS data, can be used as
a source of evidence to inform discussions on priorities in business support and includes easily understood metrics which can be readily updated on an annual basis.

Metrics
• Proportion of fast-growing firms (jobs) in the business population (2009-12)
• Net job creation ratios for 2011-12 • 3-year survival rates of start-ups (2009-12) • Proportion of surviving start-ups that reach £1m T/O
(2009-12_ • Proportion of existing £1-2m T/O businesses which
grow to £3m T/O (2009-12)


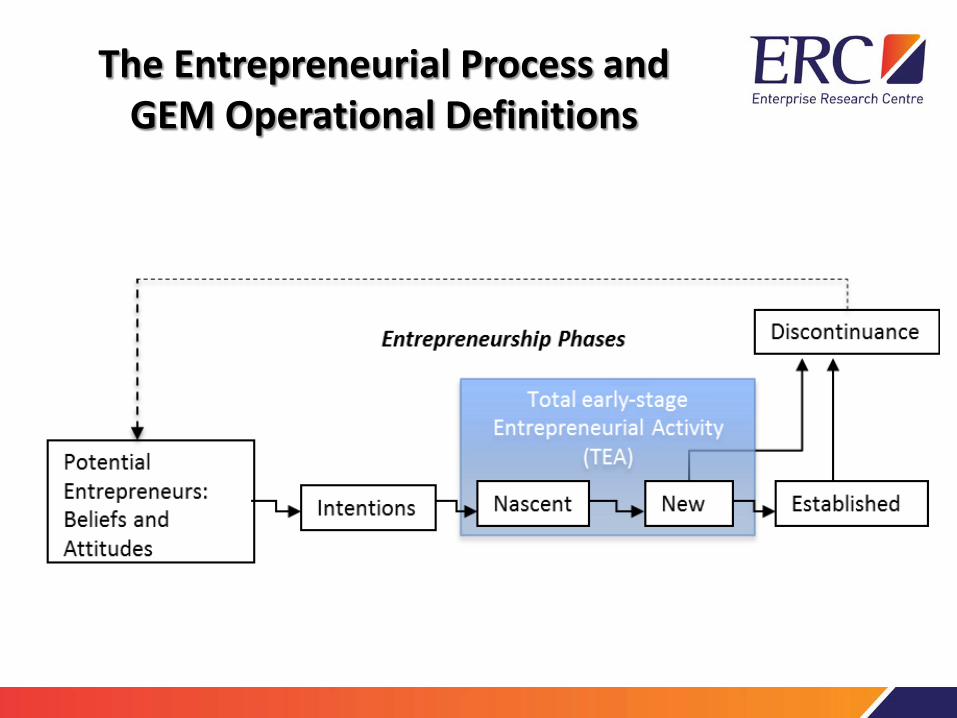
The Entrepreneurial Process and GEM Operational Definitions
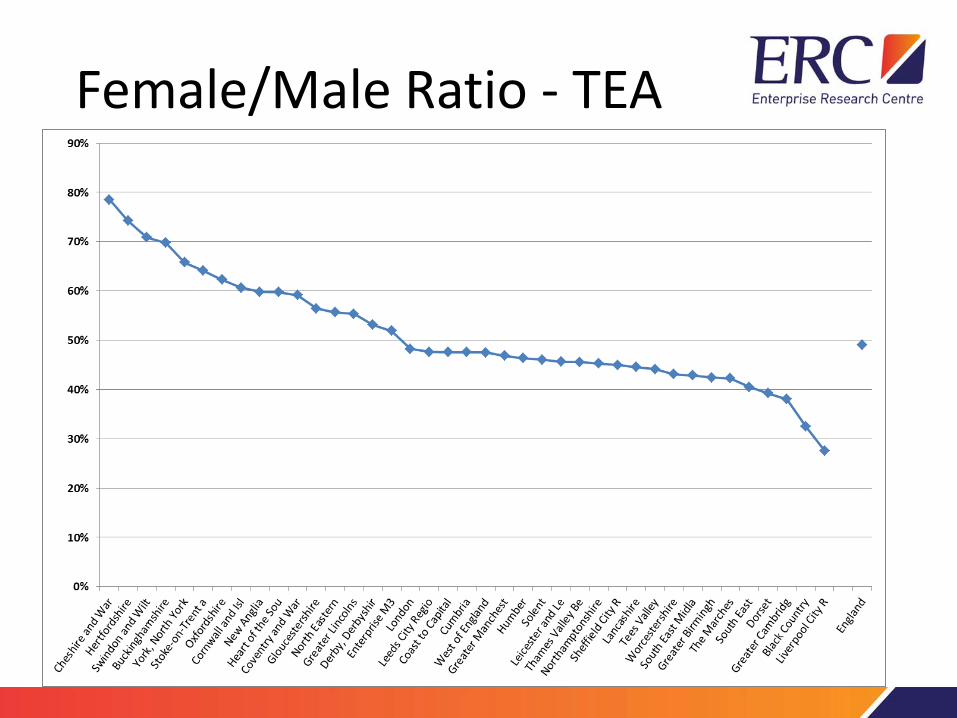
Female/Male Ratio - TEA

Summary
• Clusters: connecting cluster analysis to policy – the art of the possible? - there is no simple 'read-through' from a ‘cluster’ identified by high LQs to a strategy.
• LEP Dashboard: a complex LEP geography which provides a challenge to some of the preconceptions held about the ‘hotspots’ of growth across England while confirming others.

Discussion
• Building a robust evidence base for effective policy design – how can ERC assist
• Connecting metrics to LEP strategy and policy
initiatives? • What other metrics would be useful?

Contact us:
If you would like any more information about the ERC and any of its activities please contact the Theme Lead, Mark Hart at [email protected]
More details about the activities of the ERC and our latest events can be
found at: www.enterpriseresearch.ac.uk