equivalent concentrations of the colloids plus the · 2003-01-21 · equivalent concentrations of...
15
28 Metals Transport in the Sacramento River, California, 1996–1997. Volume 2: Interpretation of Metal Loads equivalent concentrations of the colloids plus the dissolved concentrations were shown to have strong positive correlations for most constituents (Alpers and others, 2000). Because constituent loads are directly proportional to concentrations, the correlations of total-recoverable loads with the sum of colloidal and dissolved loads are identical to the correlations among similar concentrations. Thus, in general, total recoverable (whole-water) loads correlate well with the sum of the dissolved and colloidal loads discussed above. However, there are three probable causes for those cases where there are systematic differences between the total recoverable (whole-water) loads and the sum of the colloidal and dissolved loads. First, the colloid material was obtained from larger samples that were probably more representative of the river than the smaller samples collected for whole-water determina- tions. The whole-water samples were 250 mL sub- samples taken from 8 to 15 L of water collected in churns, whereas samples collected for the isolation of colloidal material generally were 50 to 100 L of river water per sample. Second, the total recoverable digestion procedure on whole-water samples is a partial digestion involving a hydrochloric acid (HCl) extraction that followed field preservation with nitric acid (HNO 3 ), a procedure that does not completely dissolve recalcitrant minerals. In contrast, the colloidal material was completely decomposed using an HCl–HNO 3 –HF (HF is hydrofluoric acid) total digestion procedure (Alpers and others, 2000). Finally, the whole-water samples may have contained both silt- and sand-sized material in addition to colloidal material, because they were subsampled prior to size separation. Sand and silt would be (at most) minor components of the colloidal samples because the 25-L carboys containing the colloid samples were allowed to settle at least one hour prior to sample filtration. Colloid Speciation Data There were three sampling periods for which metals speciation data from colloids were collected using sequential extraction techniques: December 1996, January 1997, and May–June 1997. The sequential extractions consisted first of a chemical reduction step with HCl-acidified hydroxylamine hydrochloride designed to remove metals weakly bound to the sediment and those associated with iron or manganese oxide coatings. This fraction is referred to as the “reducible phase.” The residue from this extraction was treated with a potassium persulfate solution to oxidize any organic coatings or organic particles. This fraction is referred to as the “oxidizable phase.” Finally, an HCl–HNO 3 –HF acid microwave digestion, identical to that used for total digestions, was performed on the residue from the oxidizable phase extraction. This fraction is termed the “residual phase.” The speciated loads of cadmium, copper, lead, and zinc based on sequential extraction of colloid concentrates are represented graphically in figures 16 (A–D), 17 (A–D), and 18 (A–D) for December 1996, January 1997, and May–June 1997, respectively. Each figure has two sets of pie charts and a map of the Sacramento River area; the set in red and blue displays the relative proportion of dissolved and colloidal loads to the total load, similar to the pie charts in figures 10 through 15. However, the pie charts in figures 16 through 18 differ from those in figures 10 through 15 in that the areas of the pies in figures 16 through 18 are proportional to the constituent load at each site, and they show available data from tributaries. The second set of pie charts colored orange, green, and yellow on figures 16 through 18 represent the proportions of the constituent colloidal load that were associated with reducible, oxidizable, and residual phases, as just described. Similar to the red and blue pie charts showing dissolved and colloidal loads, the areas of the pies showing colloidal speciation are proportional to the total colloidal loads. These plots show how the various forms of the metals change with downstream transport, both proportionally and in absolute quantity. The trends on these graphs are discussed in later sections of this report. Uncertainties in Metal Loads Uncertainties in metal-load data consist of a combination of uncertainties from the concentration data and the discharge data that are multiplied together to compute the loads. Uncertainties in concentration data arise from variations in both accuracy and pre- cision. The accuracy of trace element data in this study was determined using frequent analysis of standard reference materials (SRM) and spike recoveries, both of which show accuracy consistent with the project’s data quality objectives (Alpers and others, 2000). Replicate laboratory determinations were used to
Transcript of equivalent concentrations of the colloids plus the · 2003-01-21 · equivalent concentrations of...
equivalent concentrations of the colloids plus the dissolved concentrations were shown to have strong positive correlations for most constituents (Alpers and others, 2000). Because constituent loads are directly proportional to concentrations, the correlations of total-recoverable loads with the sum of colloidal and dissolved loads are identical to the correlations among similar concentrations. Thus, in general, total recoverable (whole-water) loads correlate well with the sum of the dissolved and colloidal loads discussed above.
However, there are three probable causes for those cases where there are systematic differences between the total recoverable (whole-water) loads and the sum of the colloidal and dissolved loads. First, the colloid material was obtained from larger samples that were probably more representative of the river than the smaller samples collected for whole-water determina-tions. The whole-water samples were 250 mL sub-samples taken from 8 to 15 L of water collected in churns, whereas samples collected for the isolation of colloidal material generally were 50 to 100 L of river water per sample. Second, the total recoverable digestion procedure on whole-water samples is a partial digestion involving a hydrochloric acid (HCl) extraction that followed field preservation with nitric acid (HNO3), a procedure that does not completely dissolve recalcitrant minerals. In contrast, the colloidal material was completely decomposed using an HCl–HNO3–HF (HF is hydrofluoric acid) total digestion procedure (Alpers and others, 2000). Finally, the whole-water samples may have contained both silt- and sand-sized material in addition to colloidal material, because they were subsampled prior to size separation. Sand and silt would be (at most) minor components of the colloidal samples because the 25-L carboys containing the colloid samples were allowed to settle at least one hour prior to sample filtration.
Colloid Speciation Data
There were three sampling periods for which metals speciation data from colloids were collected using sequential extraction techniques: December 1996, January 1997, and May–June 1997. The sequential extractions consisted first of a chemical reduction step with HCl-acidified hydroxylamine hydrochloride designed to remove metals weakly bound to the sediment and those associated with iron or manganese oxide coatings. This fraction is referred
to as the “reducible phase.” The residue from this extraction was treated with a potassium persulfate solution to oxidize any organic coatings or organic particles. This fraction is referred to as the “oxidizable phase.” Finally, an HCl–HNO3–HF acid microwave digestion, identical to that used for total digestions, was performed on the residue from the oxidizable phase extraction. This fraction is termed the “residual phase.”
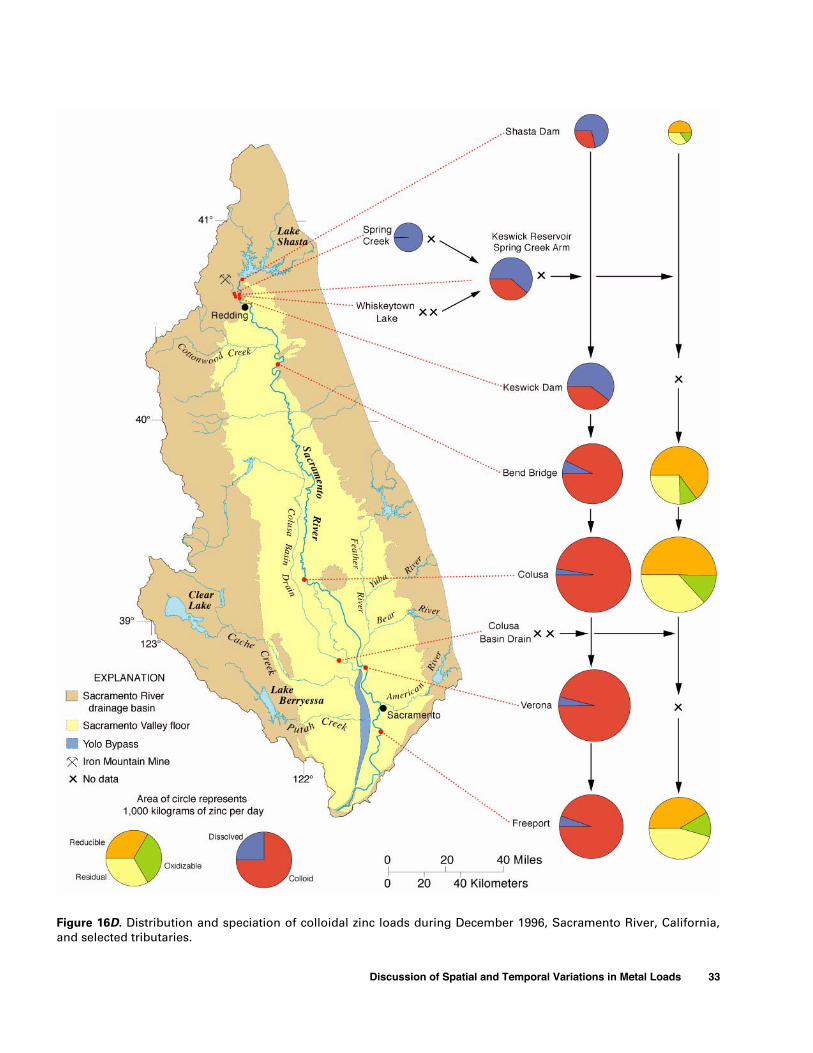
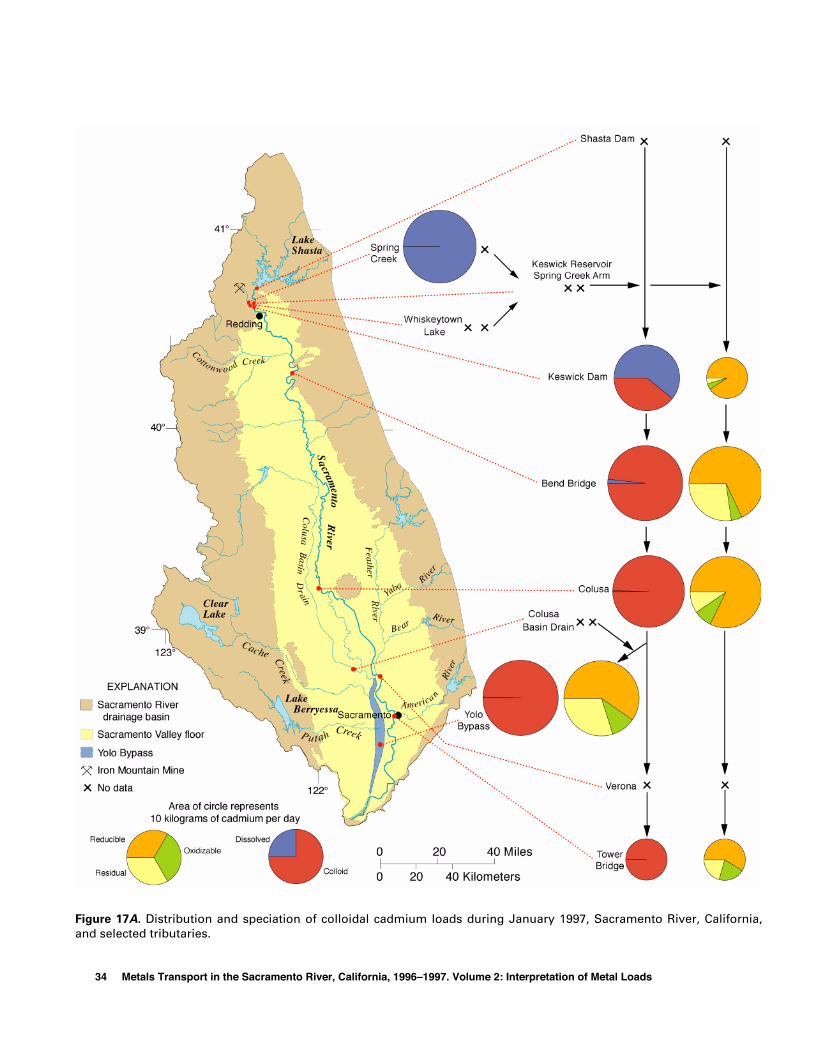
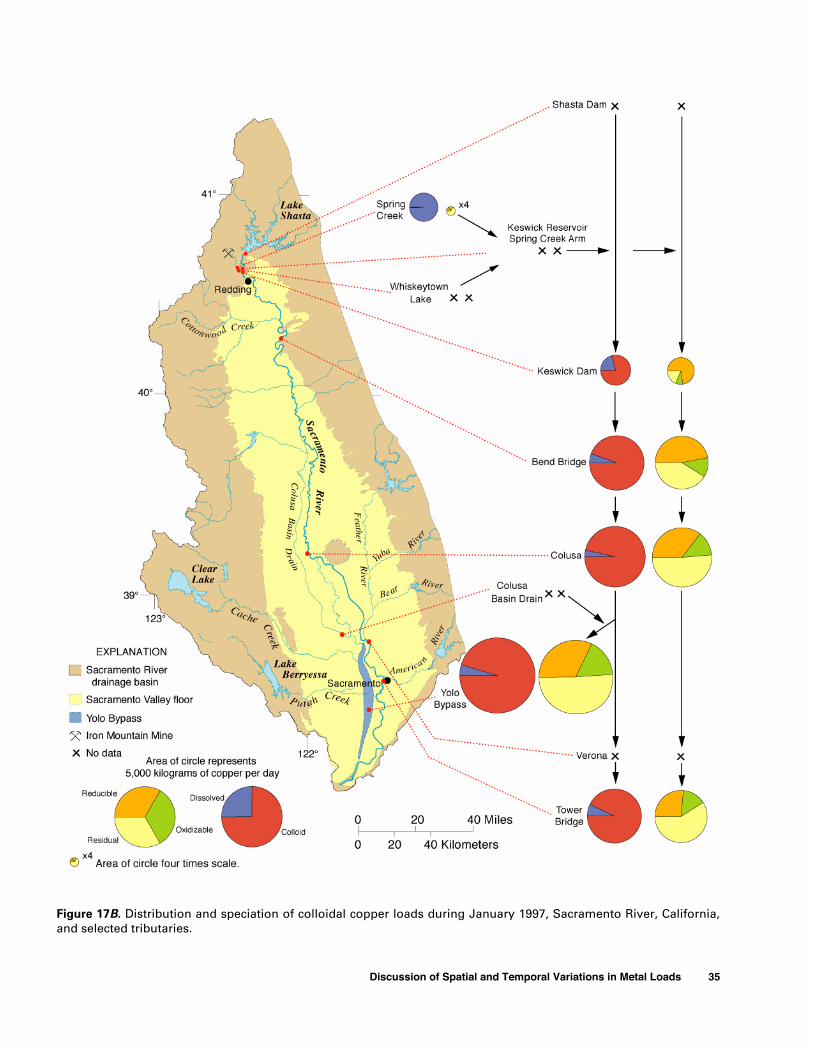
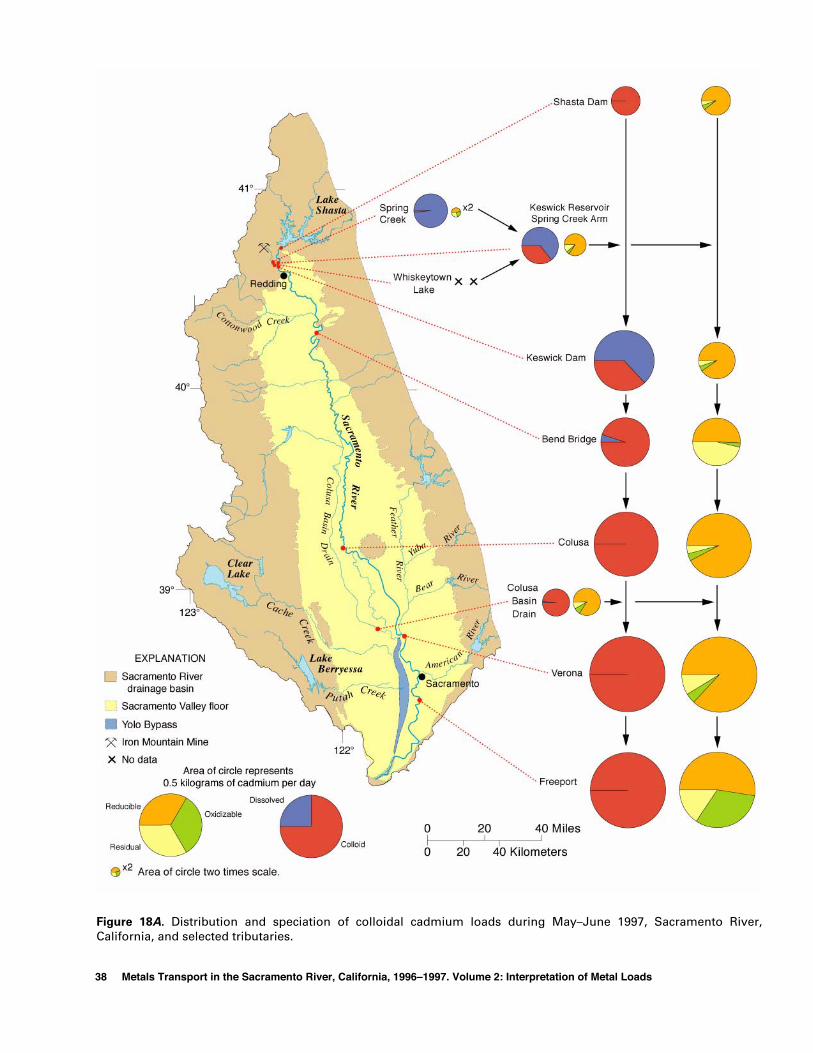
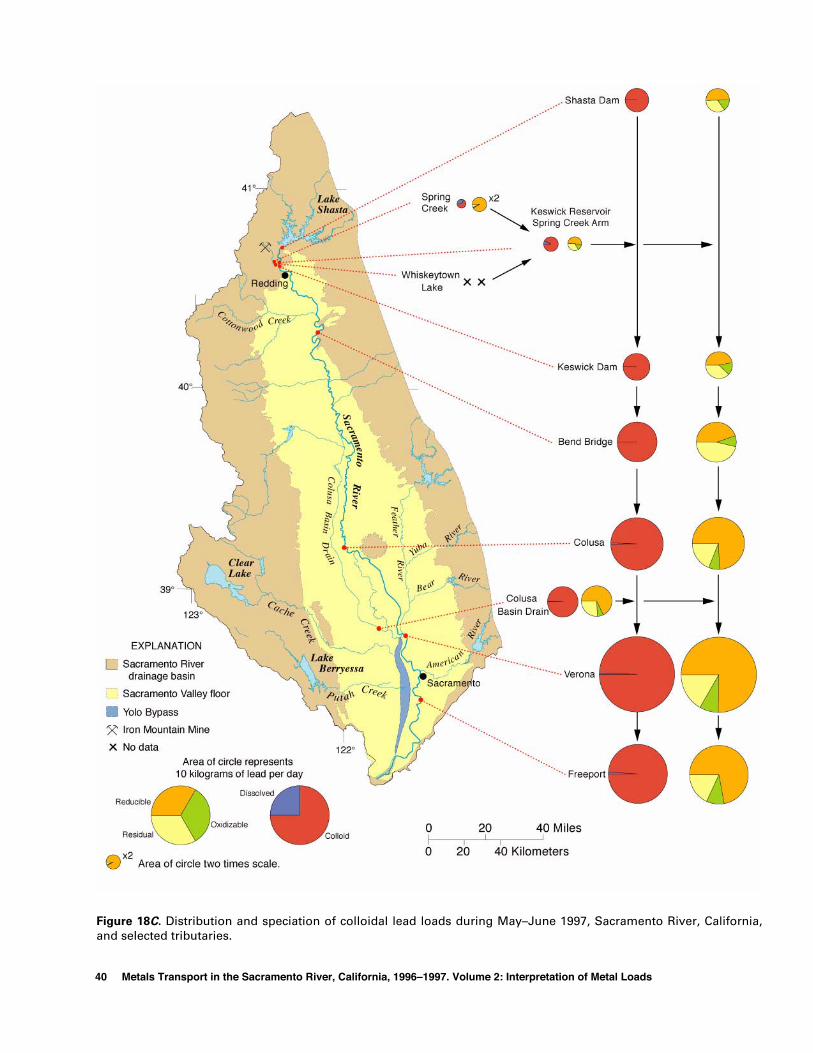
The speciated loads of cadmium, copper, lead, and zinc based on sequential extraction of colloid concentrates are represented graphically in figures 16 (A–D), 17 (A–D), and 18 (A–D) for December 1996, January 1997, and May–June 1997, respectively. Each figure has two sets of pie charts and a map of the Sacramento River area; the set in red and blue displays the relative proportion of dissolved and colloidal loads to the total load, similar to the pie charts in figures 10 through 15. However, the pie charts in figures 16 through 18 differ from those in figures 10 through 15 in that the areas of the pies in figures 16 through 18 are proportional to the constituent load at each site, and they show available data from tributaries.
The second set of pie charts colored orange, green, and yellow on figures 16 through 18 represent the proportions of the constituent colloidal load that were associated with reducible, oxidizable, and residual phases, as just described. Similar to the red and blue pie charts showing dissolved and colloidal loads, the areas of the pies showing colloidal speciation are proportional to the total colloidal loads. These plots show how the various forms of the metals change with downstream transport, both proportionally and in absolute quantity. The trends on these graphs are discussed in later sections of this report.
Uncertainties in Metal Loads
Uncertainties in metal-load data consist of a combination of uncertainties from the concentration data and the discharge data that are multiplied together to compute the loads. Uncertainties in concentration data arise from variations in both accuracy and pre-cision. The accuracy of trace element data in this study was determined using frequent analysis of standard reference materials (SRM) and spike recoveries, both of which show accuracy consistent with the project’s data quality objectives (Alpers and others, 2000). Replicate laboratory determinations were used to
28 Metals Transport in the Sacramento River, California, 1996–1997. Volume 2: Interpretation of Metal Loads
estimate analytical precision. For analyses in concentration ranges greater than ten times the detection limit, variability in precision generally was less than 5 percent of the amount present. In the concentration range less than ten times the detection limit, deter-minations are less precise and, therefore, the uncertainties are greater. In this study, with regard to the metals of principal concern (Al, Cd, Cu, Fe, Pb, and Zn) the detection limit was important only for dissolved samples, that is the ultrafiltrates that passed through 10,000 NMWL tangential-flow ultrafilters (equivalent to 0.005-µm pore-size diameter). Dissolved aluminum, cadmium, iron, and lead concen-trations at some localities were near the detection limits; therefore, the analytical uncertainties associated with dissolved loads for these constituents are relatively high, perhaps as high as 50 percent. Dissolved copper and zinc concentrations were generally greater than ten times the detection limits, so the analytical uncertainties associated with dissolved copper and zinc concentrations are much lower, probably in the range of 3 to 5 percent. This variance does not take into account the potential problems related to the collection of a representative field sample. The estimation of the magnitude of that variability is beyond the scope of this study.
Colloids were freeze dried and digested prior to analysis. Analytical uncertainties in colloid analyses come from the digestion methods and the fact that aluminum analyses were used as a basis for converting the solid concentrations to equivalent colloid concen-trations (Alpers and others, 2000). On the basis of precision data from replicate analyses, it is estimated that the analytical uncertainty on colloid analyses is about 5 percent for most elements, which is consistent with the reporting of most concentration data to two decimal places.
The other major component of uncertainty in the calculated metal loads is the uncertainty in stream discharge data. Most samples were collected at, or close to, stream gaging stations operated by the USGS. River stage (elevation of the water surface) is contin-uously recorded at each gage, and instantaneous discharge measurements are made at the site during the year, including critical times of very high or very low flows. These instantaneous measurements of gage height and discharge are used to determine a stage-discharge relationship (rating) for each station. The rating is used with the continuous gage height record to develop a continuous record of discharge. The
accuracy of discharge records at these sites is dependent on the stability of the stage-discharge relation and the accuracy of instantaneous measure-ments of stage and discharge used to develop the rating. The daily mean discharges from gaged sites used in this report are considered accurate to within 10 percent of the discharge 95 percent of the time (Rockwell and others, 1998).
The Colusa Basin Drain site was not gaged, so discharge was measured at the time of sample collection using current meter methods described by Rantz and others (1982). Considering the channel characteristics of this site, measurements are typically accurate to within 5 percent of the measured flow (Sauer and Meyer, 1992).
Discharge measurements for the Sacramento River below Shasta Dam and below Keswick Dam were determined from outflow records for Shasta and Keswick dams. Release rates from Shasta Dam, Keswick Dam, and the Spring Creek Power Plant (SCPP) were provided by the Bureau of Reclamation. Accuracy of the data from Shasta Dam, Keswick Dam, and the SCPP is believed to be within 2 percent of the recorded values (Valerie Ungvari, Bureau of Reclamation, oral commun., November 17, 1999). Discharge from the Spring Creek arm of Keswick Reservoir was determined by adding flows released from the SCPP and flows from the gaging station on Spring Creek. Uncertainty is likely between 2 and 10 percent, depending on relative flows from the two sources.
Combining the information about uncertainty from the concentration and discharge data, the mini-mum uncertainty is 10 to 15 percent, with approxi-mately half of the uncertainty from concentration measurements and half from the discharge estimates. This would be consistent with reporting all metal loads to one significant figure. This minimum uncertainty relates to the accuracy of the loads. Because the preci-sion of the loads is considered better than the accuracy, loads are presented in this report with two significant figures so that relative comparisons can be made.
Discussion of Spatial and Temporal Variations in Metal Loads
The observations that follow focus mainly on four trace elements: cadmium, copper, lead, and zinc. In addition, variations in iron and aluminum loads are described; these two elements are major components
Discussion of Spatial and Temporal Variations in Metal Loads 29

30 Metals Transport in the Sacramento River, California, 1996–1997. Volume 2: Interpretation of Metal Loads
Figure 16A. Distribution and speciation of colloidal cadmium loads during December 1996, Sacramento River,California, and selected tributaries.

Discussion of Spatial and Temporal Variations in Metal Loads 31
Figure 16B. Distribution and speciation of colloidal copper loads during December 1996, Sacramento River, California,and selected tributaries.

32 Metals Transport in the Sacramento River, California, 1996–1997. Volume 2: Interpretation of Metal Loads
Figure 16C. Distribution and speciation of colloidal lead loads during December 1996, Sacramento River, California, andselected tributaries.
Discussion of Spatial and Temporal Variations in Metal Loads 33
Figure 16D. Distribution and speciation of colloidal zinc loads during December 1996, Sacramento River, California,and selected tributaries.
34 Metals Transport in the Sacramento River, California, 1996–1997. Volume 2: Interpretation of Metal Loads
Figure 17A. Distribution and speciation of colloidal cadmium loads during January 1997, Sacramento River, California,and selected tributaries.
Discussion of Spatial and Temporal Variations in Metal Loads 35
Figure 17B. Distribution and speciation of colloidal copper loads during January 1997, Sacramento River, California,and selected tributaries.

36 Metals Transport in the Sacramento River, California, 1996–1997. Volume 2: Interpretation of Metal Loads
Figure 17C. Distribution and speciation of colloidal lead loads during January 1997, Sacramento River, California, andselected tributaries.

Discussion of Spatial and Temporal Variations in Metal Loads 37
Figure 17D. Distribution and speciation of colloidal zinc loads during January 1997, Sacramento River, California, andselected tributaries.
38 Metals Transport in the Sacramento River, California, 1996–1997. Volume 2: Interpretation of Metal Loads
Figure 18A. Distribution and speciation of colloidal cadmium loads during May–June 1997, Sacramento River,California, and selected tributaries.

Discussion of Spatial and Temporal Variations in Metal Loads 39
Figure 18B. Distribution and speciation of colloidal copper loads during May–June 1997, Sacramento River, California,and selected tributaries.
40 Metals Transport in the Sacramento River, California, 1996–1997. Volume 2: Interpretation of Metal Loads
Figure 18C. Distribution and speciation of colloidal lead loads during May–June 1997, Sacramento River, California,and selected tributaries.

Discussion of Spatial and Temporal Variations in Metal Loads 41
Figure 18D. Distribution and speciation of colloidal zinc loads during May–June 1997, Sacramento River, California,and selected tributaries.
in colloids and are likely to play an important role in controlling trace metal distribution. Spatial and temporal variations in mercury loads for concurrent samples are described elsewhere (David Roth, U.S. Geological Survey, written commun., 1999), although dissolved and colloidal mercury loads for each sampling period are tabulated in Appendix 1 of this report (table A1-7). Other trace metals of environ-mental concern such as nickel are discussed briefly.
Temporal Variations in Dissolved and Colloidal Loads
The greatest metal loads carried by the Sacramento River during this study are associated with the January 1997 sampling period (figs. 4 through 9) because of a combination of highest discharge and highest colloid concentrations (figs. 10 through 15). Metal loads during the December 1996 sampling period were consistently the second largest of the six sampling periods. In general, January 1997 metal loads exceeded those of all of the other sampling periods, except December 1996, by a factor of 20 to 30, and exceeded December 1996 loads by a factor of 3 to 4. For example, at Colusa during sampling in early January 1997, the Sacramento River was transporting 30 kg of cadmium per day, 8,400 kg of zinc per day, and 4,800 kg of copper per day. In mid-December 1996, the corresponding loads were 8.2 kg of cadmium per day, 2,500 kg of zinc per day and 1,200 kg of copper per day. As discussed in more detail in a later section, the other four sampling periods took place during lower-flow conditions, with correspondingly lower metal transport rates at Colusa: less than 3 kg of cadmium per day, less than 400 kg of zinc per day, and less than 300 kg of copper per day.
In contrast to the large differential between metal loads during January 1997 and other sampling periods, discharges during January 1997 at most sampling sites were only about twice the discharges in December 1996 and only up to about ten times the discharges for the other four, lower-flow sampling periods. Suspended colloidal concentrations (that is, the mass of colloids being carried in the river per unit volume) followed similar patterns to discharge. On average, suspended colloid concentrations were about 3 to 4 times higher in January 1997 than in December 1996 and 3 to 10 times the concentrations during any of the other four sampling periods.
About 70 percent of the total annual discharge of the Sacramento River system (measured at Freeport and the Yolo Bypass; fig. 1) during the water year July 1996 to June 1997 occurred from December 1, 1996 to February 28, 1997 (Alpers and others, 2000). Periodic measurements of suspended sediment concentration at Freeport showed a positive correlation with discharge (fig. 19). Increased discharge and increased suspended sediment concentrations (including colloids) resulted in substantially larger metal loads during the high-flow periods. These observations indicate that for the water year during which the study was made (July 1, 1996 through June 30, 1997), most of metals in the Sacramento River were transported during a relatively short period of time, during highest flow conditions.
Among the four sampling periods during lower-flow conditions (July, September, and November 1996 and May–June 1997), the period with the highest loads varied among the sampling sites. In relation to the upstream sampling sites at Shasta Dam, Keswick Dam, and Bend Bridge, the loads of cadmium, copper, lead, and zinc during July 1996 generally were higher than the loads during the other lower-flow sampling periods. At the downstream sampling sites Verona and Freeport, the September 1996 loads for these metals generally were the highest among the four lower-flow sampling periods. At Colusa, the four lower-flow sampling periods showed similar loads for each of these trace metals, with the exception that lead and zinc loads were lowest among these four sampling periods during September 1996 (figs. 8 and 9), whereas copper loads were highest during September 1996 (fig. 6). Iron loads at Colusa also were at a minimum in September 1996 (fig. 7); therefore, the higher copper loads during this sampling period likely were not associated with iron-rich colloids.
Spring Creek was sampled during three of the sampling periods (December 1996, January 1997, and May–June 1997), during which the temporal varia-bility of metals loads was similar to that observed at the mainstem Sacramento River sites. For Spring Creek, January 1997 loads were much greater than those of December 1996, which in turn surpassed those of May–June 1997 for Al, Cd, Cu, Fe, Pb, and Zn (Appendix 1). The major contrast between Spring Creek and the mainstem river sites was the magnitude of the temporal variability. Spring Creek loads in January 1997 tended to exceed loads in December 1996 by factors of 5 to 12, and by factors of more than
42 Metals Transport in the Sacramento River, California, 1996–1997. Volume 2: Interpretation of Metal Loads