Equity Technical Weekly Report (2 May- 6 May)
6
EQUITY TECHNICAL REPORT WEEKLY [2 MAY to 6 MAY 2016] ZOID RESEARCH TEAM
-
Upload
zoid-research -
Category
Investor Relations
-
view
241 -
download
0
Transcript of Equity Technical Weekly Report (2 May- 6 May)
EQUITY TECHNICAL REPORT WEEKLY [2 MAY to 6 MAY 2016]
ZOID RESEARCH TEAM

WEEKLY TECHNICAL REPORT
2 MAY TO 6 MAY 16
www.zoidresearch.com ZOID RESEARCH TEAM
NIFTY 50 7849.80 (-49.50) (-0.63)
The proceedings for the week began Volatility were
witnessed there in the market on the first day of
expiry week. The market fell down due to heavy
selling in power, metal, and infrastructure and
PSU stocks amid weak global cues on Monday. On
Tuesday Stock market showcased an enthusiastic
performance Markets, after a gap-down start,
recovered gradually to enter into green terrain in
noon deals. On Wednesday again saw the Nifty
confined within a narrow breath. On Thursday
Market fall over 1%, tracking bearish regional
markets after the Bank of Japan unexpectedly
chose not to expand its monetary stimulus and as
sentiment remained subdued amid the expiry of
April derivative contracts. The Nifty nosedived over
1.50 % today on account of selling in frontline blue
chip counters amid F&O expiry. We had
recommended on last week research report (see
our weekly report 18 APR to 23 APR) [WE
ADVISED TO BUY NIFTY FUTURE AROUND
7850 TARGET 8000. OUR TARGET ACHIEVED
ON THURSDAY 21 APR 2016 NIFTY MADE HIGH
AT 8000]. On Friday the headline indices kicked of
May derivatives series on a tepid note tracking
negative trend seen in Asian and European
markets as the follow-through from Thursday's
Bank of Japan decision weighed on the sentiment.
In a highly volatile trade, ended flat below its
crucial psychological level of Nifty 7850. The
Nifty50 opened the week at 7894.80, made a high
of 7992, low of 7788.70 and closed the week at
7849.80. Thus the Nifty closed the week with a
losing of -49.5 points or -0.63%
Formations
The 20 days EMA are placed at
7788.79
The 5 days EMA are placed at
7882.67
Future Outlook:
On Friday session was represented by a
‘Doji’ candle on the technical daily chart.
We advised to if Nifty future trade above
7855 target 8000. The Nifty future selling
pressure below at 7750. Nifty upside
weekly Resistance is 8000-8100 level. On
the downside strong support at 7835-
7770.

WEEKLY TECHNICAL REPORT
2 MAY TO 6 MAY 16
www.zoidresearch.com ZOID RESEARCH TEAM
Weekly Pivot Levels for Nifty 50 Stocks
Script Symbol Resistance2 Resistance1 Pivot Support 1 Support 2
NIFTY 50 8080 7965 7877 7762 7674
AUTOMOBILE
BAJAJ-AUTO 2632.95 2562.45 2512.65 2442.15 2392.35
BOSCHLTD 20724.73 20194.37 19869.63 19339.27 19014.53
EICHERMOT 20609.53 20322.27 20086.13 19798.87 19562.73
HEROMOTOCO 3095.80 2996.60 2924.30 2825.10 2752.80
M&M 1428.15 1379.55 1348.40 1299.80 1268.65
MARUTI 4047.28 3920.97 3806.43 3680.12 3565.58
TATAMTRDVR 350.10 373.95 333.60 357.45 317.10
TATAMOTORS 434.42 421.38 412.22 399.18 390.02
CEMENT & CEMENT PRODUCTS
ACC 1489.05 1466.10 1436.05 1413.10 1383.05
AMBUJACEM 232.53 226.77 222.93 217.17 213.33
GRASIM 4231.58 4159.17 4074.58 4002.17 3917.58
ULTRACEMCO 3390.62 3276.03 3213.02 3098.43 3035.42
CONSTRUCTION
LT 1306.20 1280.40 1262.95 1237.15 1219.70
CONSUMER GOODS
ASIANPAINT 910.75 888.50 872.25 850.00 833.75
HINDUNILVR 912.23 890.07 874.63 852.47 837.03
ITC 345.98 335.47 323.98 313.47 301.98
ENERGY
BPCL 1013.40 995.70 977.05 959.35 940.70
GAIL 386.52 373.43 363.62 350.53 340.72
NTPC 147.50 143.40 139.75 135.65 132.00
ONGC 232.32 224.78 217.87 210.33 203.42
POWERGRID 149.13 146.27 143.38 140.52 137.63
RELIANCE 1067.60 1025.15 1002.00 959.55 936.40
TATAPOWER 74.37 72.43 70.37 68.43 66.37
FINANCIAL SERVICES
AXISBANK 498.63 485.52 471.78 458.67 444.93
BANKBARODA 168.53 163.22 158.03 152.72 147.53
HDFCBANK 1170.05 1151.20 1117.85 1099.00 1065.65
HDFC 1155.82 1122.13 1098.17 1064.48 1040.52
ICICIBANK 265.25 251.10 241.20 227.05 217.15
INDUSINDBK 1104.85 1076.85 1025.50 997.50 946.15
KOTAKBANK 751.38 734.27 702.68 685.57 653.98
SBIN 208.77 198.88 192.67 182.78 176.57
YESBANK 1003.48 973.22 922.18 891.92 840.88
WEEKLY TECHNICAL REPORT
2 MAY TO 6 MAY 16
www.zoidresearch.com ZOID RESEARCH TEAM
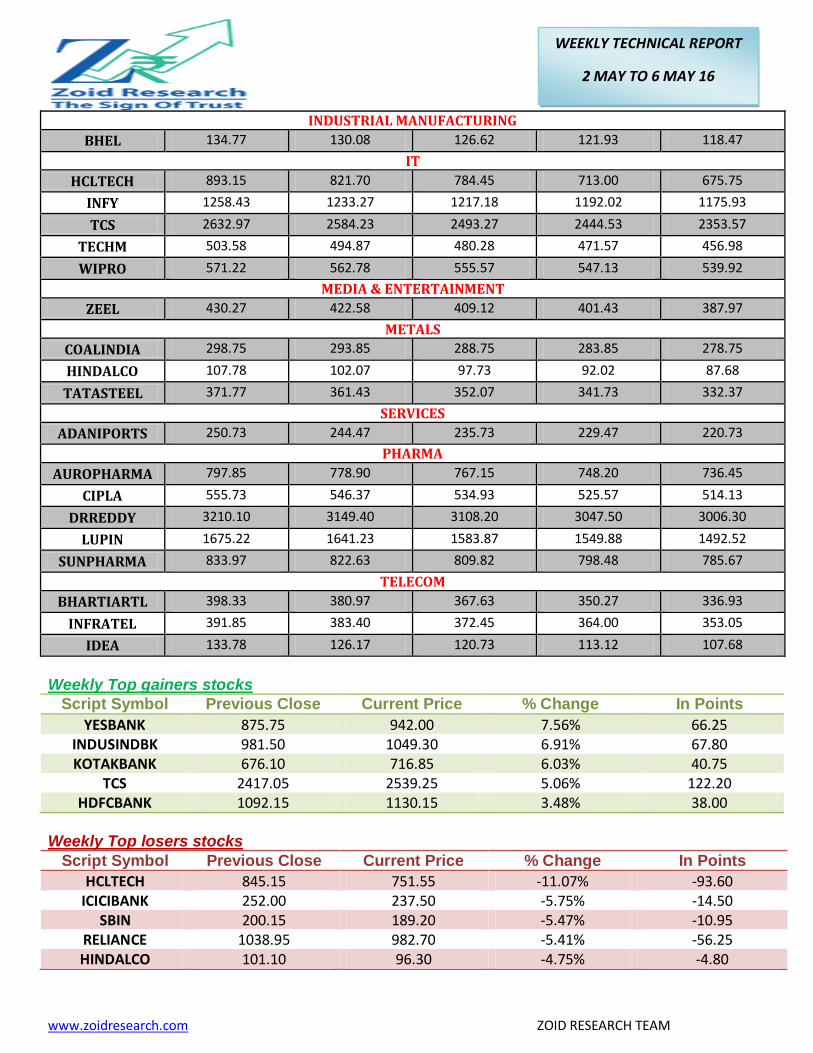
INDUSTRIAL MANUFACTURING
BHEL 134.77 130.08 126.62 121.93 118.47
IT
HCLTECH 893.15 821.70 784.45 713.00 675.75
INFY 1258.43 1233.27 1217.18 1192.02 1175.93
TCS 2632.97 2584.23 2493.27 2444.53 2353.57
TECHM 503.58 494.87 480.28 471.57 456.98
WIPRO 571.22 562.78 555.57 547.13 539.92
MEDIA & ENTERTAINMENT
ZEEL 430.27 422.58 409.12 401.43 387.97
METALS
COALINDIA 298.75 293.85 288.75 283.85 278.75
HINDALCO 107.78 102.07 97.73 92.02 87.68
TATASTEEL 371.77 361.43 352.07 341.73 332.37
SERVICES
ADANIPORTS 250.73 244.47 235.73 229.47 220.73
PHARMA
AUROPHARMA 797.85 778.90 767.15 748.20 736.45
CIPLA 555.73 546.37 534.93 525.57 514.13
DRREDDY 3210.10 3149.40 3108.20 3047.50 3006.30
LUPIN 1675.22 1641.23 1583.87 1549.88 1492.52
SUNPHARMA 833.97 822.63 809.82 798.48 785.67
TELECOM
BHARTIARTL 398.33 380.97 367.63 350.27 336.93
INFRATEL 391.85 383.40 372.45 364.00 353.05
IDEA 133.78 126.17 120.73 113.12 107.68
Weekly Top gainers stocks
Script Symbol Previous Close Current Price % Change In Points
YESBANK 875.75 942.00 7.56% 66.25 INDUSINDBK 981.50 1049.30 6.91% 67.80 KOTAKBANK 676.10 716.85 6.03% 40.75
TCS 2417.05 2539.25 5.06% 122.20 HDFCBANK 1092.15 1130.15 3.48% 38.00
Weekly Top losers stocks
Script Symbol Previous Close Current Price % Change In Points
HCLTECH 845.15 751.55 -11.07% -93.60 ICICIBANK 252.00 237.50 -5.75% -14.50
SBIN 200.15 189.20 -5.47% -10.95 RELIANCE 1038.95 982.70 -5.41% -56.25 HINDALCO 101.10 96.30 -4.75% -4.80

WEEKLY TECHNICAL REPORT
2 MAY TO 6 MAY 16
www.zoidresearch.com ZOID RESEARCH TEAM
Weekly FII’S Statistics*
DATE Buy Value Sell Value Net Value
29/APR/2016 4399.71 4605.01 -205.30
28/APR/2016 9061.04 8940.41 120.63
27/APR/2016 4412.63 4001.63 411.00
26/APR/2016 4855.69 4343.47 512.22
25/APR/2016 5698.59 5476.25 222.34
Weekly DII’S Statistics*
DATE Buy Value Sell Value Net Value
29/APR/2016 1649.24 1621.11 28.13
28/APR/2016 2245.92 2662.13 -416.21
27/APR/2016 1656.53 1951.60 -295.07
26/APR/2016 1488.41 1467.20 21.21
25/APR/2016 1075.18 1823.13 -747.95
MOST ACTIVE NIFTY CALLS & PUTS
EXPIRY DATE TYPE STRIKE PRICE VOLUME OPEN INTEREST
26/MAY/2016 CE 8000 251417 3687600
26/MAY/2016 CE 8100 181717 3557550
26/MAY/2016 CE 7900 178737 2652675
26/MAY/2016 PE 7800 244531 3667650
26/MAY/2016 PE 7700 191187 4234725
26/MAY/2016 PE 7600 136620 2483700
MOST ACTIVE BANK NIFTY CALLS & PUTS
EXPIRY DATE TYPE STRIKE PRICE VOLUME OPEN INTEREST
26/MAY/2016 CE 17500 46493 362820
26/MAY/2016 CE 17000 42904 320490
26/MAY/2016 CE 18000 30790 218310
26/MAY/2016 PE 16500 47339 246630
26/MAY/2016 PE 16000 34779 309600
26/MAY/2016 PE 15500 22712 150930

WEEKLY TECHNICAL REPORT
2 MAY TO 6 MAY 16
www.zoidresearch.com ZOID RESEARCH TEAM
Weekly Recommendations:
DATE SYMBOL STRATEGY ENTRY TARGET STATUS
30 APR 16 GLENMARK BUY ON DEEP 828-825 862-900 OPEN
22 APR 16 PFC BUY ON DEEP 175-173 182-190 1ST TARGET ACHIEVED
14 APR 16 RCOM BUY ON DEEP 52.75-52.50 55-58 2ND TARGET
AT 57.85
9 APR 16 AJANTPHARM BUY ON DEEP 1460 1520-1580 BP AT 1500
2 APR 16 TATAMOTORS BUY ON DEEP 378-380 395-412 1ST TARGET ACHIEVED
26 MAR 16 BATAINDIA BUY ON DEEP 500-498 520-550 1ST TARGET ACHIEVED
19 MAR 16 DLF BUY ABOVE 108.5 114-120 ALL TARGET ACHIEVED
12 MAR 16 TATAMOTORS BUY ON DEEP 348-350 365-380 ALL TARGET ACHIEVED
5 MAR 16 SBIN BUY ON DEEP 180-178 187-199 1ST TARGET ACHIEVED
27 FEB 16 CROMPGREAV BUY ABOVE 130 136-145 ALL TARGET ACHIEVED
20 FEB 16 ADANIPORT BUY ON DEEP 210-208 219-222 ALL TARGET ACHIEVED
13 FEB 16 APOLLOTYRE BUY ON DEEP 148-146 155-165 1ST TARGET ACHIEVED
30 JAN 16 IRB BUY ON DEEP 240-238 250 1ST TARGET ACHIEVED
23 JAN 16 CENTURYTEX BUY ON DEEP 520-517 545-570 EXIT AT 500
* FII & DII trading activity on NSE, BSE, and MCX’SX in Capital Market Segment (in Rs. Crores)
DISCLAIMER
Stock trading involves high risk and one can lose Substantial amount of money. The recommendations made herein do
not constitute an offer to sell or solicitation to buy any of the Securities mentioned. No representations can be made that recommendations contained herein will be profitable or they will not result in losses. Readers using the
information contained herein are solely responsible for their actions. The information is obtained from sources deemed to be reliable but is not guaranteed as to accuracy and completeness. The above recommendations are based on
technical analysis only. NOTE WE HAVE NO HOLDINGS IN ANY OF STOCKS RECOMMENDED ABOVE
Zoid Research
Office 101, Shagun Tower A.B. Commercial Road, Indore
452001 Mobile: +91 9039073611
Email: [email protected] Website: www.zoidresearch.com