EQUITY RESEARCH - Arafura · EQUITY RESEARCH RCR OCTOBER 2017 ... (EVs) and generators for wind...
10
EQUITY RESEARCH RCR OCTOBER 2017 Disclaimer & disclosure attached. Copyright © 2017 by RCR Pty Ltd. All rights reserved. 1 INVESTMENT POINTS ♦ A looming major supply deficit of magnet feed NdPr looks likely, due to increased demand mainly from the impending electric vehicle (EV) revolution. ♦ After years of low magnet metal prices, we are now seeing strong price rises for NdPr oxide which will stimulate investment in new non-Chinese production and is definitely stimulating investor interest in the sector. ♦ Lynas Corporation (ASX:LYC) owns the only magnet metals mining and processing project in operation outside China. LYC’s revenues have more than doubled in the past year, and the share price is up by >400%, a sure sign that the sector is moving back into favour. ♦ The world’s EV component suppliers will want increased secure, stable NdPr supply established in low geopolitical risk regions outside China. ♦ We think ARU’s Australian-based Nolans Rare Earths Project is competitively positioned to become one of the new generation suppliers of NdPr. It is one of only a handful of projects that is well advanced in the feasibility study process. ♦ Nolans is underpinned by a world-class long-life NdPr resource which will ensure a mine life in excess of 30 years. ♦ Projected unit costs per kg of NdPr are lowest in class for development projects, while ARU’s ratio of enterprise value to forecast NdPr production suggests significant under-valuation. ♦ Our forecasts predict ARU will achieve revenues of A$428M per annum and EBITDA of A$238M per annum when the Nolans Project reaches full capacity. ♦ To achieve those metrics a gold company would need to produce ~240kozpa at an all-in sustaining cost of US$632 per ounce. COMPANY STATISTICS 19 OCTOBER 2017 AUSTRALIA (NT) RARE EARTHS (NdPr), PHOSPHORIC ACID FEASIBILITY STUDY EXCHANGE: ASX:ARU CAPITAL PROFILE DIRECTORS Ian Kowalick (Chairman) Gavin Lockyer ( MD) Chris Tonkin (Non Exec Dir) Terry Grose (Non Exec Dir) Quansheng Zhang (Non Exec Dir) Mr Gavin Lockyer Managing Director Arafura Resources Limited Tel: +61 8 6210 7666 Perth, WA, Australia www.arultd.com Analyst: Dr Tony Parry [email protected] 52 week range (A$/share) 0.05 to Debt (A$M) - Sep 17F Enterprise value (A$M) Avg monthly volume (M) Cash (A$M) - Sep 17F Price/Cash (x) Price/Book (x) Listed company options: 18.8 12.2 2.5 0.4 No Market capitalisation (undiluted) (A$M) 73.8 0.0 61.6 Major shareholders: JP Morgan Nominees (21.3%) East China Min Expl & Devel Bureau (ECE), (20.1%) Options and warrants (M) 8.4 Converting notes (M) 0.0 Fully diluted (M) 555.3 Share price (A$) 0.135 0.155 Number of shares (M) 546.9 0.00 0.02 0.04 0.06 0.08 0.10 0.12 0.14 0.16 Oct-16 Nov-16 Dec-16 Feb-17 Mar-17 Apr-17 May-17 Jun-17 Jul-17 Aug-17 Oct-17 Share Price ($/Share) ARU – Arafura Resources Ltd ARAFURA RESOURCES LIMITED Recent strong price rises and predicted supply shortages confirm that magnet metals should benefit from the very strong projected future growth in electric vehicles. ARU presents a prime opportunity for exposure to the anticipated upside in this sector. Share Price: A$0.135 Speculative Buy The recognition of the impending electric vehicle revolution in the global automotive industry is creating strong investor interest in sectors with upside leverage. The lithium sector has been the main beneficiary, but recently strong rises in NdPr magnet metals prices is seeing an awakening of investor interest in this sector which we think is only the beginning. Company valuations in the development space are still very low. In relative terms ARU looks the most under-valued, despite recent share price gains.
Transcript of EQUITY RESEARCH - Arafura · EQUITY RESEARCH RCR OCTOBER 2017 ... (EVs) and generators for wind...
EQUITY RESEARCH
RCR OCTOBER 2017 Disclaimer & disclosure attached. Copyright© 2017 by RCR Pty Ltd. All rights reserved. 1
INVESTMENT POINTS
♦ A looming major supply deficit of magnet feed NdPr looks likely, due to increased demand mainly from the impending electric vehicle (EV) revolution.
♦ After years of low magnet metal prices, we are now seeing strong price rises for NdPr oxide which will stimulate investment in new non-Chinese production and is definitely stimulating investor interest in the sector.
♦ Lynas Corporation (ASX:LYC) owns the only magnet metals mining and processing project in operation outside China. LYC’s revenues have more than doubled in the past year, and the share price is up by >400%, a sure sign that the sector is moving back into favour.
♦ The world’s EV component suppliers will want increased secure, stable NdPr supply established in low geopolitical risk regions outside China.
♦ We think ARU’s Australian-based Nolans Rare Earths Project is competitively positioned to become one of the new generation suppliers of NdPr. It is one of only a handful of projects that is well advanced in the feasibility study process.
♦ Nolans is underpinned by a world-class long-life NdPr resource which will ensure a mine life in excess of 30 years.
♦ Projected unit costs per kg of NdPr are lowest in class for development projects, while ARU’s ratio of enterprise value to forecast NdPr production suggests significant under-valuation.
♦ Our forecasts predict ARU will achieve revenues of A$428M per annum and EBITDA of A$238M per annum when the Nolans Project reaches full capacity.
♦ To achieve those metrics a gold company would need to produce ~240kozpa at an all-in sustaining cost of US$632 per ounce.
COMPANY STATISTICS
19 OCTOBER 2017
AUSTRALIA (NT)
RARE EARTHS (NdPr), PHOSPHORIC ACID
FEASIBILITY STUDY
EXCHANGE: ASX:ARU
CAPITAL PROFILE
DIRECTORS
Ian Kowalick (Chairman) Gavin Lockyer ( MD) Chris Tonkin (Non Exec Dir) Terry Grose (Non Exec Dir) Quansheng Zhang (Non Exec Dir)
Mr Gavin Lockyer Managing Director Arafura Resources Limited Tel: +61 8 6210 7666 Perth, WA, Australia www.arultd.com
Analyst: Dr Tony Parry [email protected]
52 week range (A$/share) 0.05 to
Debt (A$M) - Sep 17F
Enterprise value (A$M)
Avg monthly volume (M)
Cash (A$M) - Sep 17F
Price/Cash (x)
Price/Book (x)
Listed company options:
18.8
12.2
2.5
0.4
No
Market capitalisation (undiluted) (A$M) 73.8
0.0
61.6
Major shareholders: JP Morgan Nominees (21.3%)
East China Min Expl & Devel Bureau (ECE), (20.1%)
Options and warrants (M) 8.4
Converting notes (M) 0.0
Fully diluted (M) 555.3
Share price (A$) 0.135
0.155
Number of shares (M) 546.9
0.00
0.02
0.04
0.06
0.08
0.10
0.12
0.14
0.16
Oct-
16
No
v-1
6
De
c-1
6
Fe
b-1
7
Mar-
17
Ap
r-1
7
Ma
y-1
7
Ju
n-1
7
Ju
l-1
7
Au
g-1
7
Oct-
17
Sh
are
Pri
ce
($/S
hare
)
ARU – Arafura Resources Ltd
ARAFURA RESOURCES LIMITED
Recent strong price rises and predicted supply shortages confirm that magnet metals should benefit from the very strong projected future growth in electric vehicles. ARU presents a prime opportunity for exposure to the anticipated upside in this sector.
Share Price: A$0.135 Speculative Buy
The recognition of the impending electric vehicle revolution in the global automotive industry is creating strong investor interest in sectors with upside leverage. The lithium sector has been the main beneficiary, but recently strong rises in NdPr magnet metals prices is seeing an awakening of investor interest in this sector which we think is only the beginning. Company valuations in the development space are still very low. In relative terms ARU looks the most under-valued, despite recent share price gains.
EQUITY
RCR OCTOBER 2017 Disclaimer & disclosure attached. Copyright© 2017 by RCR Pty Ltd. All rights reserved. 2
COMPANY COMMENT Overview: ARU’s flagship is the advanced Nolans Rare Earths Project (Northern Territory (NT), Australia). The Nolans deposit is 135km NNW of Alice Springs, and has Measured and Indicated JORC resources of 34.9Mt @ 2.79% total rare earth oxides (TREO) and 12.1% phosphate (P2O5). This is equivalent to over 970,000t of contained TREO. The current mine plan supports a mine life of >30 years at a production level of 14ktpa equivalent TREO. The project is world scale, and strategically important with a high content of potentially critical magnet metal rare earths (REs) neodymium (“Nd”) and praseodymium (“Pr”) which will drive the economics. Electric Vehicles and Wind Turbines to Drive RE Demand. When we talk of RE demand we are really focusing on one key RE component – NdPr oxide (“NdPr”) which is a critical raw material input to permanent magnets that are essential in the development of permanent magnet synchronous motors found in most hybrid, plug-in hybrid and battery electric vehicles (EVs) and generators for wind turbines. NdPr magnets are about three times stronger and one tenth of the weight of conventional magnets, and there is no known substitute to achieve similar performance. As much as the lithium sector has been ignited by the projected rapid demand growth for lithium in relation to lithium-ion battery energy storage for the impending EV revolution, we see similar demand potential for NdPr being driven by the same revolution in EVs – cars, light duty vehicles, mass transit vehicles and bikes. Demand growth of 8% CAGR looks readily achievable, which means that demand for NdPr oxide could increase by around 30,000tpa in the next 7-8 years. Typically, new magnet metals development projects are expected to each supply around 3,000-5,000 tpa of NdPr oxide (ARU’s Nolans Project is 3,600 tpa) so to avoid a major supply shortfall quite a few magnet metals projects will need to come online in the next decade. Magnet Metal Supply – Diversifying away from China. Currently about 85% of the world’s REs comes from Chinese-sourced (sanctioned and illegal) supply. The graphic on page 4 indicates that Chinese supply of magnet metals is unlikely to increase in the next few years. Potential end-users of NdPr oxide, particularly those in the western world, will no doubt place great importance on security of supply when establishing offtake agreements as the demand from EVs and wind turbine manufacture grows. They will be particularly keen to enter into supply agreements with non-Chinese suppliers with mining and processing operations in stable, low sovereign risk countries, which is likely to underwrite the financing and development of RE projects in these jurisdictions. In this regard ARU’s Nolans Project is one of the standouts. Currently Lynas Corporation (ASX:LYC) with 5,500ktpa NdPr production is the only western world supplier of magnet metals. Price Rises Igniting Investor Interest in Magnet Metals: In the past four months NdPr oxide prices have almost doubled (see chart page 3) to nearly US$80/kg, but have taken a breather and eased to currently US$67/kg. This is a sure sign of the tightening in the market and anticipation of the increased rate of demand to come. These price rises have transformed the profitability of LYC which is now exhibiting strong cashflow that all of a sudden can comfortably cover its (current) ~A$360M debt servicing requirements, dramatically reducing the company’s perceived risk profile. As the charts on page 4 indicate, LYC’s revenue has more than doubled from 3Q16 to 3Q17, and its share price has increased more than fourfold in 12 months. This is a sure sign of increased investor confidence in this sector, which is now starting to flow towards companies with magnet metals development projects such as ARU. ARU’s share price has approximately doubled in the past twelve months, but our contention, based on the Nolans Project attributes and relative value compared to its development peers, is that it has much further to go. Nolans Status and Development Timetable: The Nolans Environmental Impact Statement was lodged in May 2016. ARU is now focusing on pilot plant operation to confirm (to Definitive Feasibility Study level) key aspects of the processing flowsheet. The ore beneficiation, phosphoric acid production
and bulk pre-leach stages have been successfully piloted. Currently the acid bake process is being piloted, with the completion of pilot plant work on rare earth processing and rare earth separation expected to be completed by end of 2Q18. The final Feasibility Study should be completed in 4Q18, paving the way for detailed engineering and financing in mid CY19 and a possible first production in 4Q20 or 1H21. The Nolans Project has attained Major Project status with the Australian and NT governments which should help reduce approvals timelines. Production and Earnings Forecasts: As shown on page 5, Nolans is forecast to produce 3,600tpa NdPr oxide out of a total output of 14,000tpa total TREO and 110,000tpa of phosphoric acid by-product. In terms of revenue, the NdPr magnet metals will dominate – forecast 75.1% of revenue, phosphoric acid 11.6% and other REOs just 6.5%. Our model forecasts FY23 (full nameplate capacity) revenue of A$428M pa and EBITDA of A$238M pa. RCR Project Valuation: Our after-tax valuation (based on a 10% discount rate, 100% equity basis and 30-year mine life) A$424M or A$0.78 per share. The base case assumes a long-term NdPr price of US$67/kg, which is similar to the current spot price. We consider this to be a conservative price forecast based on the demand outlook. Each US$10/kg increase in the NdPr price increases the assessed after-tax NPV by ~A$240M or ~A$0.44 per share. ASX-Listed Peer Group Comparison: We have compared forecast operational and cost metrics for ARU and four other ASX-listed magnet metal development companies, as well as benchmarking against the current producer LYC. ARU is a stand-out in this emerging producer group in relation to having the lowest projected operating costs (US$ per kg NdPr oxide), long mine life, low sovereign-risk mining jurisdiction and low ratio of enterprise value to projected NdPr production. Gold Company Analogy: We have taken our steady state production and earnings forecasts for ARU and re-stated them in terms of the equivalent that a gold mining company would need to achieve. This analysis shows that ARU’s forecast FY2023 revenue and profitability is equivalent to that of a gold company producing ~240kozpa with an all-in sustaining cost of just US$632/ounce. At the same time we have identified a yawning gap between gold mine development company valuations and rare earths developers. We are not saying the gap will be eliminated, but it is starting to look way too big with recent NdPr price rises and the improved outlook for the sector. Corporate: As at 26 September 2017 ARU’s cash balance was A$12.2M. The cash burn rate for project development, project evaluation and overheads has averaged just under A$2M per quarter in FY2017. We don’t see a pressing need for a further capital raising until 2H18, however the company has always sought to maintain a sizeable cash buffer. Key ‘Big Brother’ Partnerships: ARU has entered into a MOU with South Korean chemical giant OCI to establish a Joint Venture Rare Earth Separation Plant in South Korea to toll process Nolans material. OCI also operates chemical plants in the USA, China and Europe. There are significant operational and financial benefits in co-locating the proposed JV RE Separation Plant near OCI’s existing Gunsan chemical plant in South Korea. The MOU will assess the opportunity for joint funding and technical collaboration.
Investment Comment: We have previously commented that share market investors are starting to spot a “lithium look-alike” in the magnet feed NdPr sector. This appears to be coming to fruition with strong recent price rises for magnet metals and the share price of the western world’s only producer Lynas Corporation (ASX:LYC) leading the way (showing you can make money out the much maligned rare earths) soaring by ~400% in the past year. Now there are signs that the share prices of the small cohort of ASX-listed magnet project development companies are starting to react with some strong gains in the past six months. We believe this is only the beginning, and for investors to go along for the ride, ARU is our favoured entry.
EQUITY
RCR OCTOBER 2017 Disclaimer & disclosure attached. Copyright© 2017 by RCR Pty Ltd. All rights reserved. 3
DEVELOPMENTS IN MAGNET METALS MARKETS
Source: ARU
Source: Lynas Corporation
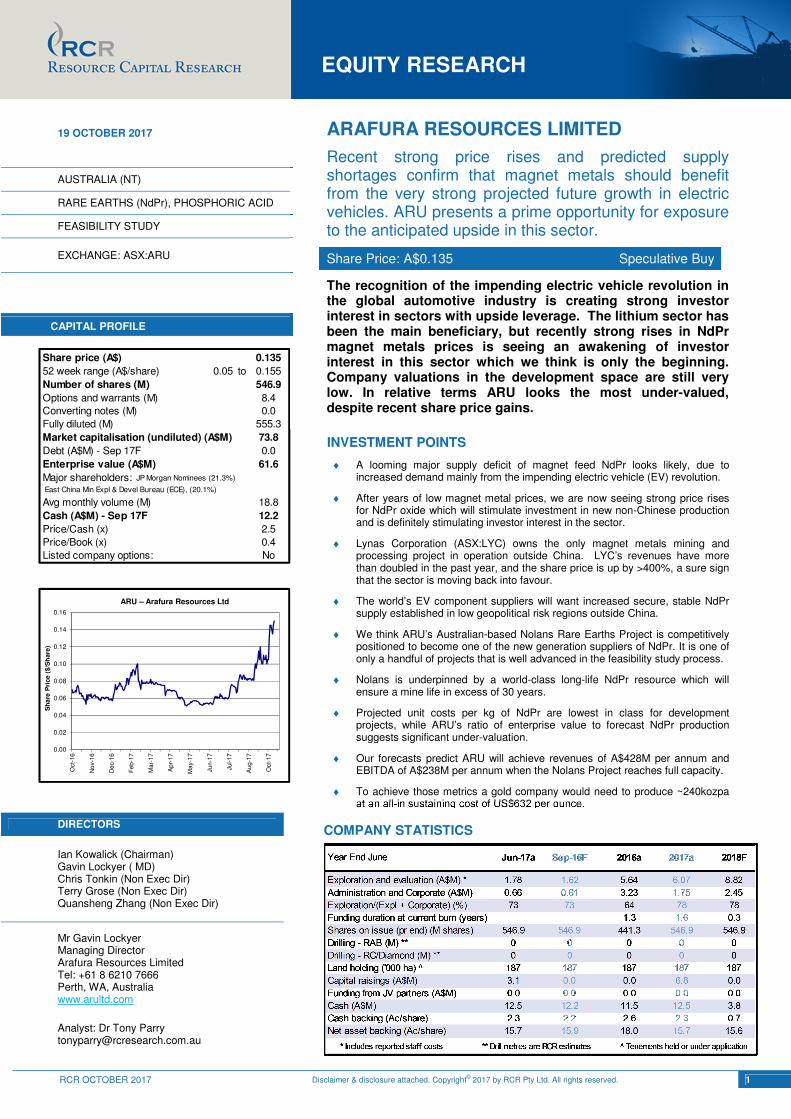
After a long period of depressed prices, we are finally seeing a strong resurgence in pricing for the key magnet metals rare earths neodymium (Nd) and praseodymium (Pr). Prices rose particularly strongly in August and September 2017 and have since eased slightly to around US$67/kg, up by ~70% on prices at the start of CY2017.
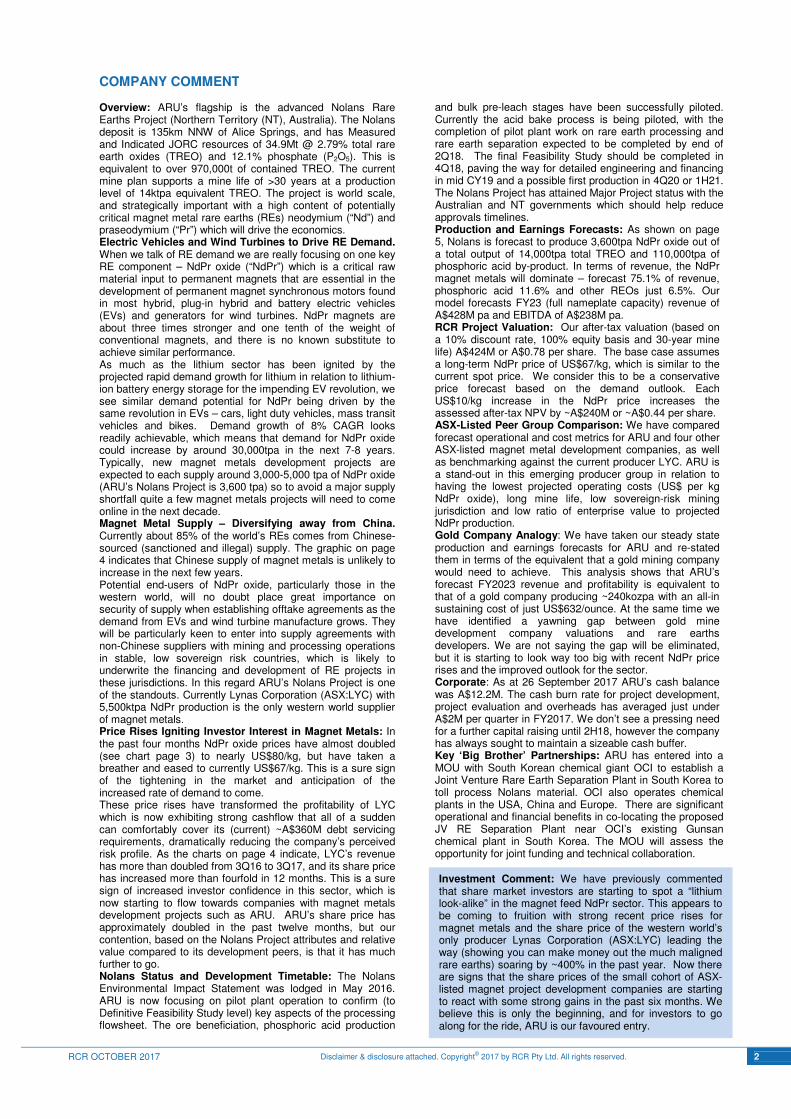
To summarise the reason for the strength of magnet metals prices we have borrowed this chart from a recent Lynas Corporation (ASX:LYC) presentation. They assert the EV revolution will require a new Lynas (i.e. 5,500tpa of NdPr oxide) every four years. To put that in perspective, ARU’s Nolans Project is forecast to produce 3,600 tpa of NdPr oxide.
EQUITY
RCR OCTOBER 2017 Disclaimer & disclosure attached. Copyright© 2017 by RCR Pty Ltd. All rights reserved. 4
Source: ARU
0
20
40
60
80
100
120
3Q16 4Q16 1Q17 2Q17 3Q17
Qu
art
erl
y R
eve
nu
e (
A$
M)
ASX:LYC Sales Revenue
0.00
0.05
0.10
0.15
0.20
0.25
Oct
-16
Nov
-16
Dec
-16
Feb
-17
Mar
-17
Apr
-17
May
-17
Jun-
17
Jul-1
7
Aug
-17
Sep
-17
Sh
are
Pri
ce (
$/S
har
e)
LYC – Lynas Corporation Ltd
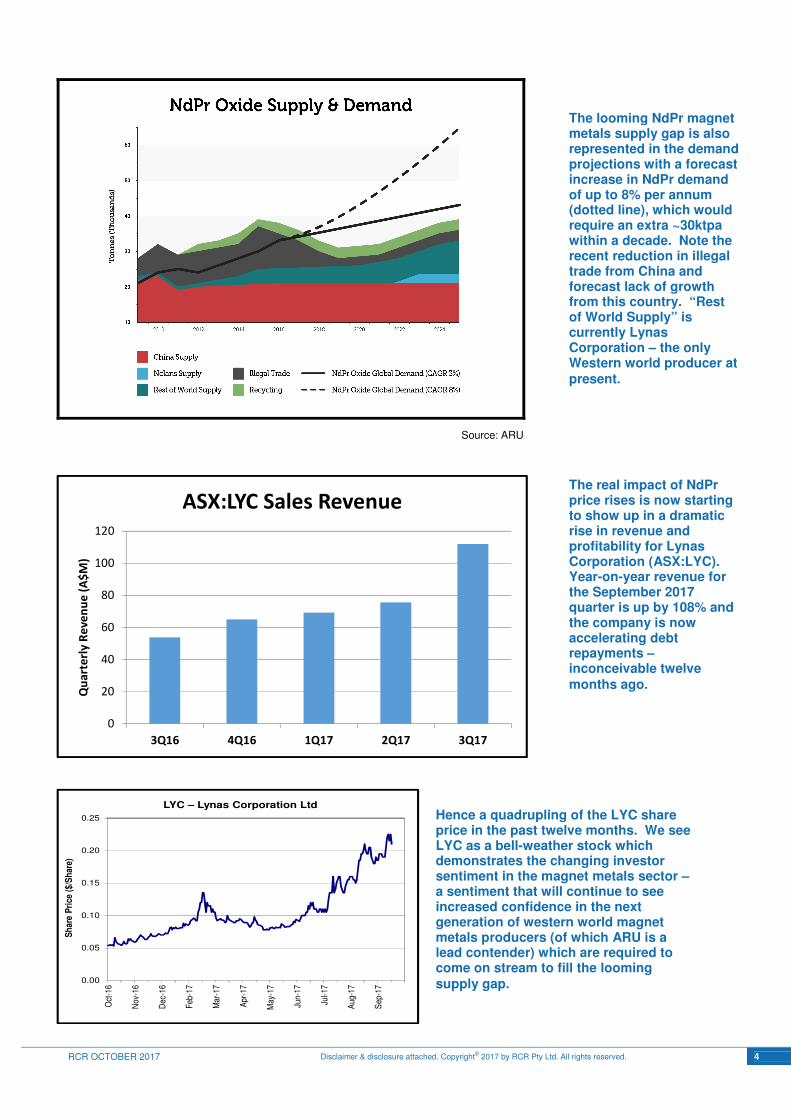
The looming NdPr magnet metals supply gap is also represented in the demand projections with a forecast increase in NdPr demand of up to 8% per annum (dotted line), which would require an extra ~30ktpa within a decade. Note the recent reduction in illegal trade from China and forecast lack of growth from this country. “Rest of World Supply” is currently Lynas Corporation – the only Western world producer at present.
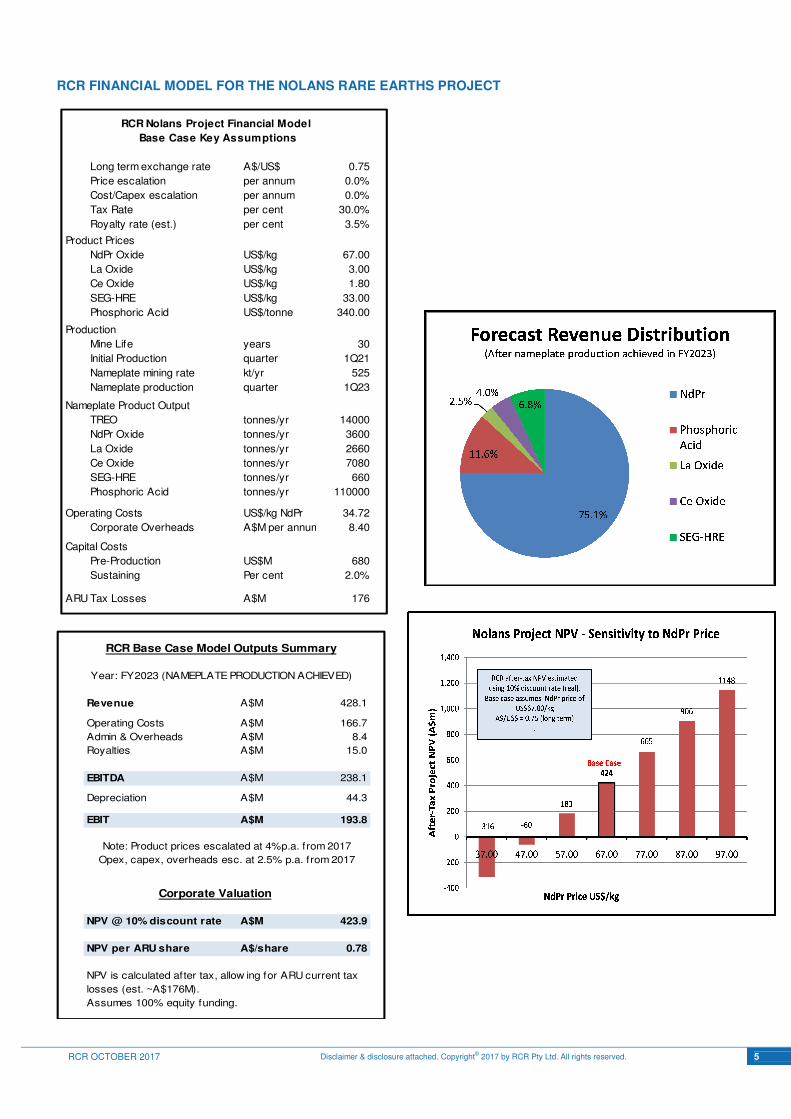
The real impact of NdPr price rises is now starting to show up in a dramatic rise in revenue and profitability for Lynas Corporation (ASX:LYC). Year-on-year revenue for the September 2017 quarter is up by 108% and the company is now accelerating debt repayments – inconceivable twelve months ago.
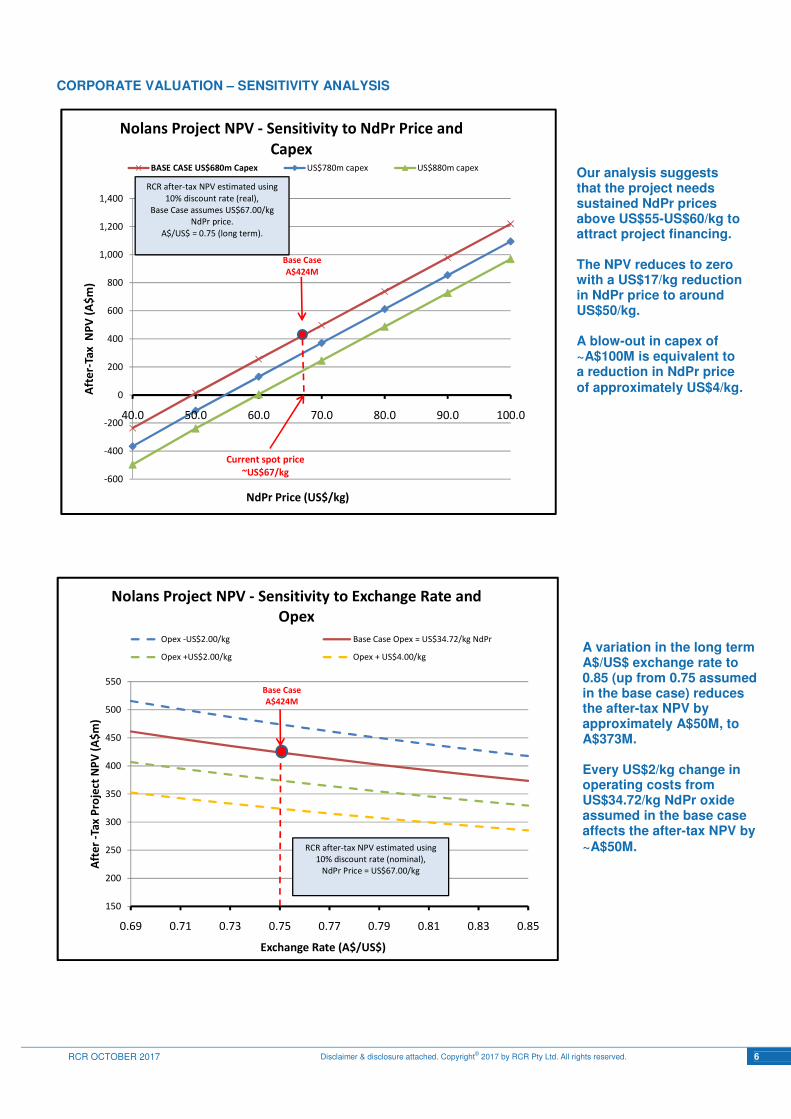
Hence a quadrupling of the LYC share price in the past twelve months. We see LYC as a bell-weather stock which demonstrates the changing investor sentiment in the magnet metals sector – a sentiment that will continue to see increased confidence in the next generation of western world magnet metals producers (of which ARU is a lead contender) which are required to come on stream to fill the looming supply gap.
EQUITY
RCR OCTOBER 2017 Disclaimer & disclosure attached. Copyright© 2017 by RCR Pty Ltd. All rights reserved. 5
RCR FINANCIAL MODEL FOR THE NOLANS RARE EARTHS PROJECT
Long term exchange rate A$/US$ 0.75
Price escalation per annum 0.0%
Cost/Capex escalation per annum 0.0%
Tax Rate per cent 30.0%
Royalty rate (est.) per cent 3.5%
Product Prices
NdPr Oxide US$/kg 67.00
La Oxide US$/kg 3.00
Ce Oxide US$/kg 1.80
SEG-HRE US$/kg 33.00
Phosphoric Acid US$/tonne 340.00
Production
Mine Life years 30
Initial Production quarter 1Q21
Nameplate mining rate kt/yr 525
Nameplate production quarter 1Q23
Nameplate Product Output
TREO tonnes/yr 14000
NdPr Oxide tonnes/yr 3600
La Oxide tonnes/yr 2660
Ce Oxide tonnes/yr 7080
SEG-HRE tonnes/yr 660
Phosphoric Acid tonnes/yr 110000
Operating Costs US$/kg NdPr 34.72
Corporate Overheads A$M per annum 8.40
Capital Costs
Pre-Production US$M 680
Sustaining Per cent 2.0%
ARU Tax Losses A$M 176
RCR Nolans Project Financial Model
Base Case Key Assumptions
Revenue A$M 428.1
Operating Costs A$M 166.7
Admin & Overheads A$M 8.4
Royalties A$M 15.0
EBITDA A$M 238.1
Depreciation A$M 44.3
EBIT A$M 193.8
NPV @ 10% discount rate A$M 423.9
NPV per ARU share A$/share 0.78
Year: FY2023 (NAMEPLATE PRODUCTION ACHIEVED)
NPV is calculated after tax, allow ing for ARU current tax
losses (est. ~A$176M).
Assumes 100% equity funding.
RCR Base Case Model Outputs Summary
Corporate Valuation
Note: Product prices escalated at 4%p.a. from 2017
Opex, capex, overheads esc. at 2.5% p.a. from 2017
EQUITY
RCR OCTOBER 2017 Disclaimer & disclosure attached. Copyright© 2017 by RCR Pty Ltd. All rights reserved. 6
CORPORATE VALUATION – SENSITIVITY ANALYSIS
-600
-400
-200
0
200
400
600
800
1,000
1,200
1,400
40.0 50.0 60.0 70.0 80.0 90.0 100.0
Aft
er-
Tax
NP
V (
A$
m)
NdPr Price (US$/kg)
Nolans Project NPV - Sensitivity to NdPr Price and
CapexBASE CASE US$680m Capex US$780m capex US$880m capex
Current spot price
~US$67/kg
RCR after-tax NPV estimated using
10% discount rate (real),
Base Case assumes US$67.00/kg
NdPr price.
A$/US$ = 0.75 (long term).
Base Case
A$424M
150
200
250
300
350
400
450
500
550
0.69 0.71 0.73 0.75 0.77 0.79 0.81 0.83 0.85
Aft
er
-Ta
x P
roje
ct N
PV
(A
$m
)
Exchange Rate (A$/US$)
Nolans Project NPV - Sensitivity to Exchange Rate and
Opex
Opex -US$2.00/kg Base Case Opex = US$34.72/kg NdPr
Opex +US$2.00/kg Opex + US$4.00/kg
RCR after-tax NPV estimated using
10% discount rate (nominal),
NdPr Price = US$67.00/kg
Base Case
A$424M
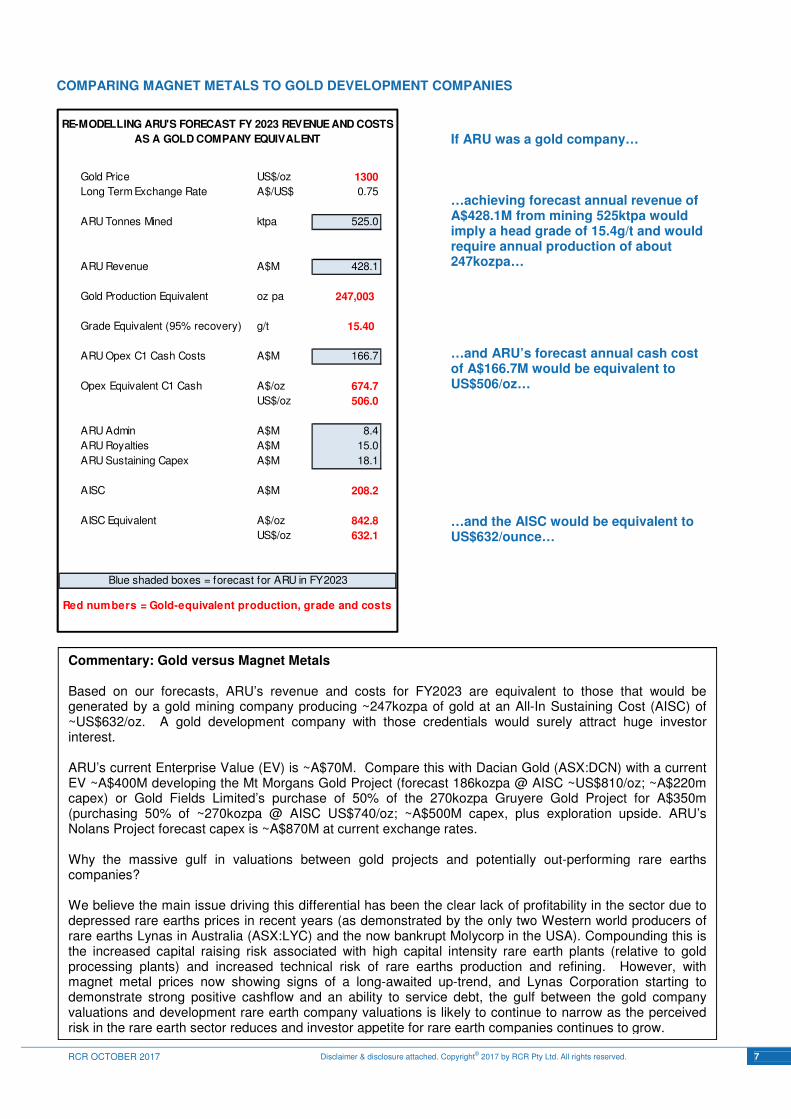
Our analysis suggests that the project needs sustained NdPr prices above US$55-US$60/kg to attract project financing. The NPV reduces to zero with a US$17/kg reduction in NdPr price to around US$50/kg. A blow-out in capex of ~A$100M is equivalent to a reduction in NdPr price of approximately US$4/kg.
A variation in the long term A$/US$ exchange rate to 0.85 (up from 0.75 assumed in the base case) reduces the after-tax NPV by approximately A$50M, to A$373M. Every US$2/kg change in operating costs from US$34.72/kg NdPr oxide assumed in the base case affects the after-tax NPV by ~A$50M.
EQUITY
RCR OCTOBER 2017 Disclaimer & disclosure attached. Copyright© 2017 by RCR Pty Ltd. All rights reserved. 7
COMPARING MAGNET METALS TO GOLD DEVELOPMENT COMPANIES
Gold Price US$/oz 1300
Long Term Exchange Rate A$/US$ 0.75
ARU Tonnes Mined ktpa 525.0
ARU Revenue A$M 428.1
Gold Production Equivalent oz pa 247,003
Grade Equivalent (95% recovery) g/t 15.40
ARU Opex C1 Cash Costs A$M 166.7
Opex Equivalent C1 Cash A$/oz 674.7
US$/oz 506.0
ARU Admin A$M 8.4
ARU Royalties A$M 15.0
ARU Sustaining Capex A$M 18.1
AISC A$M 208.2
AISC Equivalent A$/oz 842.8
US$/oz 632.1
RE-MODELLING ARU'S FORECAST FY 2023 REVENUE AND COSTS
AS A GOLD COMPANY EQUIVALENT
Red numbers = Gold-equivalent production, grade and costs
Blue shaded boxes = forecast for ARU in FY2023
If ARU was a gold company… …achieving forecast annual revenue of A$428.1M from mining 525ktpa would imply a head grade of 15.4g/t and would require annual production of about 247kozpa… …and ARU’s forecast annual cash cost of A$166.7M would be equivalent to US$506/oz… …and the AISC would be equivalent to US$632/ounce…
Commentary: Gold versus Magnet Metals Based on our forecasts, ARU’s revenue and costs for FY2023 are equivalent to those that would be generated by a gold mining company producing ~247kozpa of gold at an All-In Sustaining Cost (AISC) of ~US$632/oz. A gold development company with those credentials would surely attract huge investor interest. ARU’s current Enterprise Value (EV) is ~A$70M. Compare this with Dacian Gold (ASX:DCN) with a current EV ~A$400M developing the Mt Morgans Gold Project (forecast 186kozpa @ AISC ~US$810/oz; ~A$220m capex) or Gold Fields Limited’s purchase of 50% of the 270kozpa Gruyere Gold Project for A$350m (purchasing 50% of ~270kozpa @ AISC US$740/oz; ~A$500M capex, plus exploration upside. ARU’s Nolans Project forecast capex is ~A$870M at current exchange rates. Why the massive gulf in valuations between gold projects and potentially out-performing rare earths companies? We believe the main issue driving this differential has been the clear lack of profitability in the sector due to depressed rare earths prices in recent years (as demonstrated by the only two Western world producers of rare earths Lynas in Australia (ASX:LYC) and the now bankrupt Molycorp in the USA). Compounding this is the increased capital raising risk associated with high capital intensity rare earth plants (relative to gold processing plants) and increased technical risk of rare earths production and refining. However, with magnet metal prices now showing signs of a long-awaited up-trend, and Lynas Corporation starting to demonstrate strong positive cashflow and an ability to service debt, the gulf between the gold company valuations and development rare earth company valuations is likely to continue to narrow as the perceived risk in the rare earth sector reduces and investor appetite for rare earth companies continues to grow.
EQUITY
RCR OCTOBER 2017 Disclaimer & disclosure attached. Copyright© 2017 by RCR Pty Ltd. All rights reserved. 8
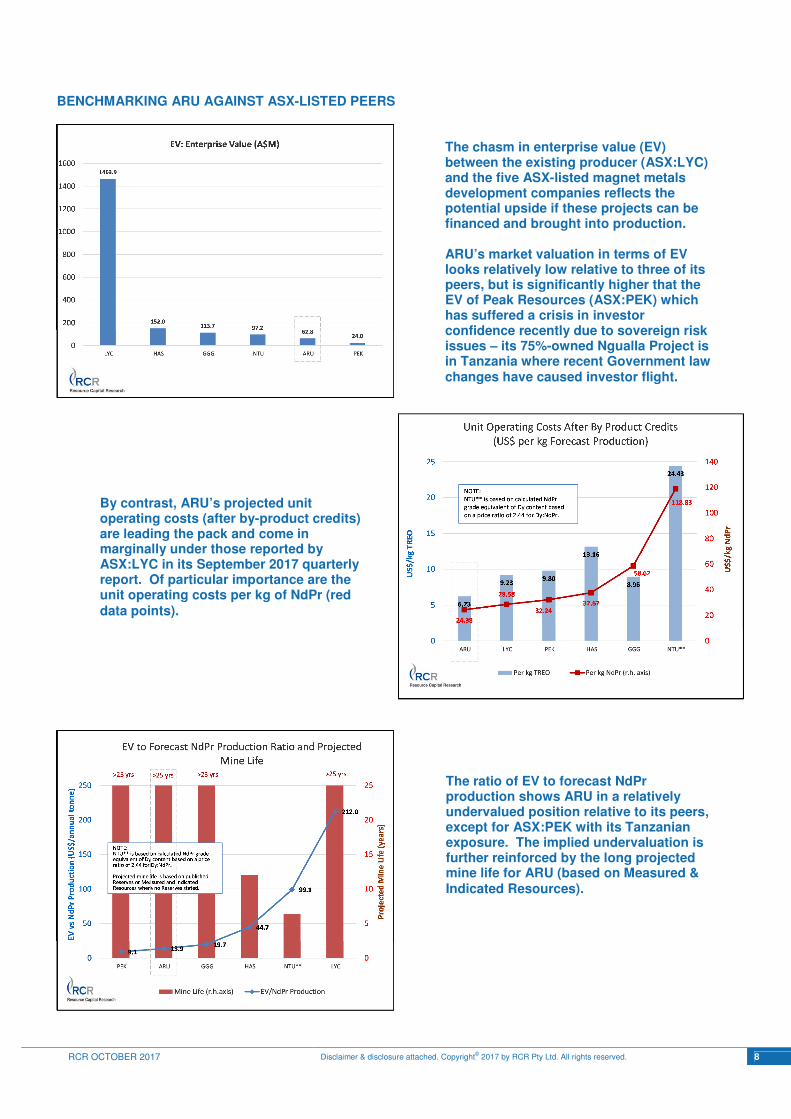
BENCHMARKING ARU AGAINST ASX-LISTED PEERS
The chasm in enterprise value (EV) between the existing producer (ASX:LYC) and the five ASX-listed magnet metals development companies reflects the potential upside if these projects can be financed and brought into production. ARU’s market valuation in terms of EV looks relatively low relative to three of its peers, but is significantly higher that the EV of Peak Resources (ASX:PEK) which has suffered a crisis in investor confidence recently due to sovereign risk issues – its 75%-owned Ngualla Project is in Tanzania where recent Government law changes have caused investor flight.
By contrast, ARU’s projected unit operating costs (after by-product credits) are leading the pack and come in marginally under those reported by ASX:LYC in its September 2017 quarterly report. Of particular importance are the unit operating costs per kg of NdPr (red data points).
The ratio of EV to forecast NdPr production shows ARU in a relatively undervalued position relative to its peers, except for ASX:PEK with its Tanzanian exposure. The implied undervaluation is further reinforced by the long projected mine life for ARU (based on Measured & Indicated Resources).
EQUITY
RCR OCTOBER 2017 Disclaimer & disclosure attached. Copyright© 2017 by RCR Pty Ltd. All rights reserved. 9
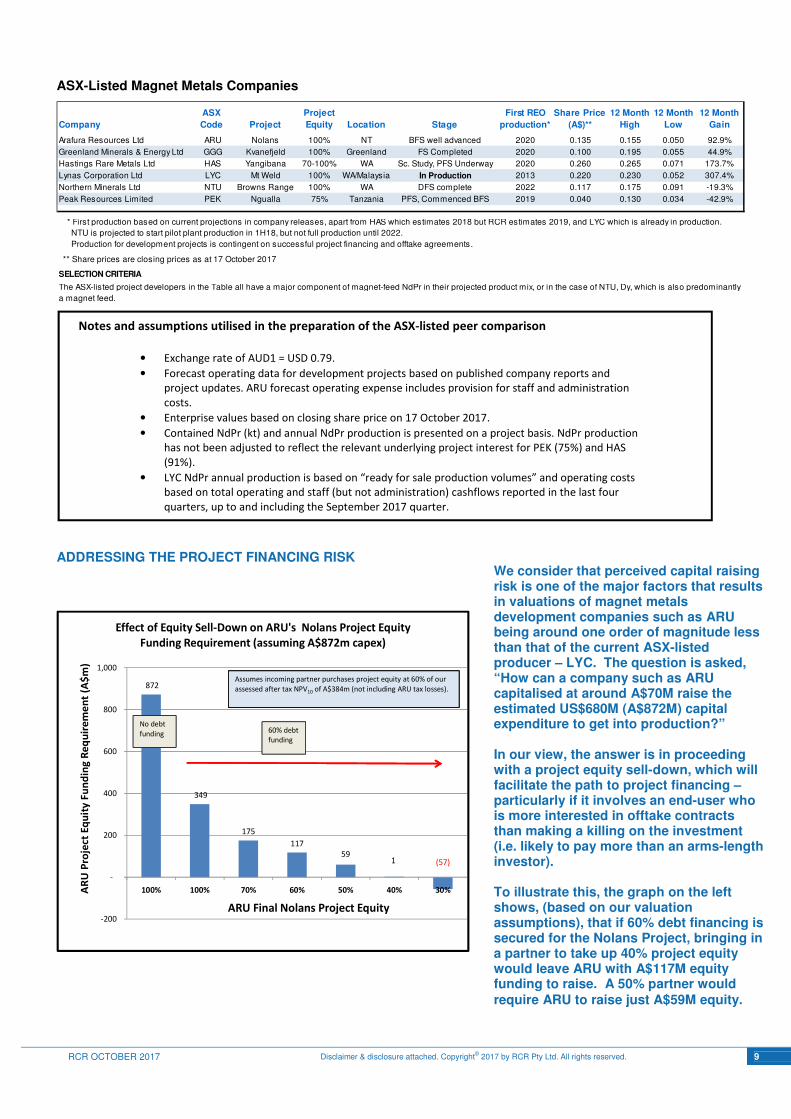
ASX-Listed Magnet Metals Companies
ADDRESSING THE PROJECT FINANCING RISK
Company
ASX
Code Project
Project
Equity Location Stage
First REO
production*
Share Price
(A$)**
12 Month
High
12 Month
Low
12 Month
Gain
Arafura Resources Ltd ARU Nolans 100% NT BFS well advanced 2020 0.135 0.155 0.050 92.9%
Greenland Minerals & Energy Ltd GGG Kvanefjeld 100% Greenland FS Completed 2020 0.100 0.195 0.055 44.9%
Hastings Rare Metals Ltd HAS Yangibana 70-100% WA Sc. Study, PFS Underway 2020 0.260 0.265 0.071 173.7%
Lynas Corporation Ltd LYC Mt Weld 100% WA/Malaysia In Production 2013 0.220 0.230 0.052 307.4%
Northern Minerals Ltd NTU Browns Range 100% WA DFS complete 2022 0.117 0.175 0.091 -19.3%
Peak Resources Limited PEK Ngualla 75% Tanzania PFS, Commenced BFS 2019 0.040 0.130 0.034 -42.9%
** Share prices are closing prices as at 17 October 2017
SELECTION CRITERIA
* First production based on current projections in company releases, apart from HAS which estimates 2018 but RCR estimates 2019, and LYC which is already in production.
NTU is projected to start pilot plant production in 1H18, but not full production until 2022.
Production for development projects is contingent on successful project financing and offtake agreements.
The ASX-listed project developers in the Table all have a major component of magnet-feed NdPr in their projected product mix, or in the case of NTU, Dy, which is also predominantly
a magnet feed.
872
349
175
117
59 1 (57)
-200
-
200
400
600
800
1,000
100% 100% 70% 60% 50% 40% 30%AR
U P
roje
ct E
qu
ity
Fu
nd
ing
Re
qu
ire
me
nt
(A$
m)
ARU Final Nolans Project Equity
Effect of Equity Sell-Down on ARU's Nolans Project Equity
Funding Requirement (assuming A$872m capex)
60% debt
funding
No debt
funding
Assumes incoming partner purchases project equity at 60% of our
assessed after tax NPV10 of A$384m (not including ARU tax losses).
60% debt
funding
No debt
funding
Assumes incoming partner purchases project equity at 60% of our
assessed after tax NPV10 of A$384m (not including ARU tax losses).
We consider that perceived capital raising risk is one of the major factors that results in valuations of magnet metals development companies such as ARU being around one order of magnitude less than that of the current ASX-listed producer – LYC. The question is asked, “How can a company such as ARU capitalised at around A$70M raise the estimated US$680M (A$872M) capital expenditure to get into production?” In our view, the answer is in proceeding with a project equity sell-down, which will facilitate the path to project financing – particularly if it involves an end-user who is more interested in offtake contracts than making a killing on the investment (i.e. likely to pay more than an arms-length investor). To illustrate this, the graph on the left shows, (based on our valuation assumptions), that if 60% debt financing is secured for the Nolans Project, bringing in a partner to take up 40% project equity would leave ARU with A$117M equity funding to raise. A 50% partner would require ARU to raise just A$59M equity.
Notes and assumptions utilised in the preparation of the ASX-listed peer comparison
• Exchange rate of AUD1 = USD 0.79.
• Forecast operating data for development projects based on published company reports and
project updates. ARU forecast operating expense includes provision for staff and administration
costs.
• Enterprise values based on closing share price on 17 October 2017.
• Contained NdPr (kt) and annual NdPr production is presented on a project basis. NdPr production
has not been adjusted to reflect the relevant underlying project interest for PEK (75%) and HAS
(91%).
• LYC NdPr annual production is based on “ready for sale production volumes” and operating costs
based on total operating and staff (but not administration) cashflows reported in the last four
quarters, up to and including the September 2017 quarter.
EQUITY
RCR OCTOBER 2017 Disclaimer & disclosure attached. Copyright© 2017 by RCR Pty Ltd. All rights reserved. 10
CONTACT
Resource Capital Research ACN 111 622 489
Level 21, 68 Pitt Street Sydney NSW 2000
T +612 9439 1919 E [email protected]
www.rcresearch.com.au
DISCLOSURE AND DISCLAIMER Important Information Resource Capital Research Pty Limited (referred to as “we”, “our”, or “RCR” herein) ACN 111 622 489 holds an Australian Financial Services Licence (AFS Licence number 325340). General advice is provided by RCR’s Authorised Representatives Dr Tony Parry (Authorised Representative number 328842) and Mr Geoff Muers (Authorised Representative number 001252594). The FSG is available at www.rcresearch.com.au. All references to currency are in Australian dollars unless otherwise noted.
This report and its contents are intended to be used or viewed only by persons resident and located in the United States and Australia and therein only where RCR’s services and products may lawfully be offered. The information provided in this report is not intended for distribution to, or use by, any person or entity in any jurisdiction or country where such distribution or use would be contrary to law or regulation or which would subject RCR or its affiliates to any registration requirement within such jurisdiction or country.
This report and its contents are not intended to constitute a solicitation for the purchase of securities or an offer of securities. The information provided in this report has been prepared without taking account of your particular objectives, financial situation or needs. You should, before acting on the information provided in this report, consider the appropriateness of the purchase or sale of the securities of the companies that are the subject of this report having regard to these matters and, if appropriate, seek professional financial, investment and taxation advice. RCR does not guarantee the performance of any investment discussed or recommended in this report. Any information in this report relating to the distribution history or performance history of the securities of the companies that are the subject of this report, should not be taken as an indication of the future value or performance of the relevant securities.
In preparing this report, RCR analysts have relied upon certain information provided by management of the companies that are the subject of this report or otherwise made publicly available by such companies. The information presented and opinions expressed herein are given as of the date hereof and are subject to change. We hereby disclaim any obligation to advise you of any change after the date hereof in any matter set forth in this report. THE INFORMATION PRESENTED, WHILE OBTAINED FROM SOURCES WE BELIEVE RELIABLE, IS CHECKED BUT NOT GUARANTEED AGAINST ERRORS OR OMISSIONS AND WE MAKE NO WARRANTY OR REPRESENTATION, EXPRESSED OR IMPLIED, AND DISCLAIM AND NEGATE ALL OTHER WARRANTIES OR LIABILITY CONCERNING THE ACCURACY, COMPLETENESS OR RELIABILITY OF, OR ANY FAILURE TO UPDATE, ANY CONTENT OR INFORMATION HEREIN.
This report and the information filed on which it is based may include estimates and projections which constitute forward looking statements that express an expectation or belief as to future events, results or returns. No guarantee of future events, results or returns is given or implied by RCR. Estimates and projections contained herein, whether or not our own, are based on assumptions that we believe to be reasonable at the time of publication, however, such forward-looking statements are subject to risks, uncertainties and other factors which could cause actual results to differ materially from the estimates and projections provided to RCR or contained within this report.
This report may, from time to time, contain information or material obtained from outside sources with the permission of the original author or links to web sites or references to products, services or publications other than those of RCR. The use or inclusion of such information, material, links or references does not imply our endorsement or approval thereof, nor do we warrant, in any manner, the accuracy of completeness of any information presented therein.
RCR, its affiliates and their respective officers, directors and employees may hold positions in the securities of the companies featured in this report and may purchase and/or sell them from time to time and RCR and its affiliates may also from time to time perform investment banking or other services for, or solicit investment banking or other business from, entities mentioned in this report. Arafura Resources Limited commissioned RCR to compile this report. In consideration, RCR received from the company a cash consultancy fee of less than $15,000. RCR may receive ongoing consulting fees, and/or referral fees from issuing companies or their advisors in respect of investors that RCR refers to companies looking to raise capital. Those fees vary, but are generally between 0 - 1% of the value of capital raised from referrals made by RCR. At the date of this report, neither RCR, nor any of its associates, hold any interests or entitlements in shares mentioned in this report with the exception that John Wilson owns shares in BHP and the AN Parry Superfund owns shares in ARU.
Analyst Certification: All observations, conclusions and opinions expressed in this report reflect the personal views of RCR analysts and no part of the analyst’s or RCR’s compensation was, is, or will be, directly or indirectly related to specific recommendations or views expressed in the report. Officers, directors, consultants, employees and independent contractors of RCR are prohibited from trading in the securities of U.S. companies that are, or are expected to be, the subject of research reports or other investment advice transmitted to RCR clients for a blackout window of 14 days extending before and after the date such report is transmitted to clients or released to the market.
Cautionary Note to Foreign Investors Concerning Estimates of Measured, Indicated and Inferred Resources: RCR publishes mineral resources based on standards recognized and required under securities legislation where listed mining and exploration companies make their exchange filings and uses the terms “measured", "indicated" and "inferred" mineral resources. Foreign investors are advised that while such terms are recognized and required under foreign securities legislation, certain foreign exchanges (such as the U.S. SEC) allows disclosure only of mineral deposits that can be economically and legally extracted. Foreign investors are cautioned not to assume that all or any part of measured, indicated or inferred resources can be converted into reserves or economically or legally mined.
Not for Distribution or Release in the United States.