
equity Perspectives: Global equities – Disappointment ...
10
T. ROWE PRICE Investment Viewpoint EXECUTIVE SUMMARY Global equities delivered negative returns between 1999 and 2009 in both nominal and real terms. This period is now commonly referred to as “the lost decade,” and sections of the media have once again declared the “death of equities,” as they did at the end of the 1970s – the last time equities disap- pointed on such a large scale. When taken in conjunction with fears sur- rounding future growth and heightened equity volatility, the lost decade has damaged investor sentiment and prompted meaning- ful outflows from equities. Given a strong tailwind for government bonds as interest rates have fallen over the very same decade, fixed income has been a beneficiary of capital flows. However, following more than a decade of de-rating from the peak of the technology bubble in 2000, equities are now trading at a significant valuation discount versus histori- cal averages and implying a gloomy outlook for corporate prospects. Valuation is one of the key drivers of future returns for equities and history shows that starting points matter for long-term returns. Global equities look cheap, especially when compared with government bonds. Despite near-term uncertainty, we believe that equities will deliver over the long term from today’s valuation start point. This point is enforced by our belief that many corporates are in good shape from a balance sheet, cost, and long-term earnings growth perspective. We believe that the market’s pessimism and focus on the near term leaves room for material upside for investors willing to take a disciplined, contrarian and long- term stance. THE LOST DECADE FOR EQUITIES Although recent equity market history has been defined by extremes, one of the most important trends to impact investors since the turn of the century has been a sustained period of poor returns for equities. Investors in equities during this period will be all too familiar with this backdrop, but how does the lost decade com- pare with historic periods of equity weakness and what, if any, lessons can be learnt to help future decision–making. While there are some limitations to comparing long-term data on a like-for-like basis, history suggests that the lost decade rivals almost any period in the past century in terms of the mag- nitude of disappointment, if not duration, for investors. Figure 1 shows the pattern of Equity Perspectives: Global Equities – Disappointment, Volatility and Opportunity Scott Berg, CFA Portfolio Manager is investment viewpoint reflects the views of Scott Berg, Portfolio Manager of our Global Large-Cap Equity Strategy. August 2012
Transcript of equity Perspectives: Global equities – Disappointment ...
T. Rowe PRice
Investment Viewpoint
ExEcutivE Summary
�� Global equities delivered negative returns between 1999 and 2009 in both nominal and real terms. This period is now commonly referred to as “the lost decade,” and sections of the media have once again declared the “death of equities,” as they did at the end of the 1970s – the last time equities disap-pointed on such a large scale.
�� When taken in conjunction with fears sur-rounding future growth and heightened equity volatility, the lost decade has damaged investor sentiment and prompted meaning-ful outflows from equities. Given a strong tailwind for government bonds as interest rates have fallen over the very same decade, fixed income has been a beneficiary of capital flows.
�� However, following more than a decade of de-rating from the peak of the technology bubble in 2000, equities are now trading at a
significant valuation discount versus histori-cal averages and implying a gloomy outlook for corporate prospects.
�� Valuation is one of the key drivers of future returns for equities and history shows that starting points matter for long-term returns. Global equities look cheap, especially when compared with government bonds.
�� Despite near-term uncertainty, we believe that equities will deliver over the long term from today’s valuation start point. This point is enforced by our belief that many corporates are in good shape from a balance sheet, cost, and long-term earnings growth perspective. We believe that the market’s pessimism and focus on the near term leaves room for material upside for investors willing to take a disciplined, contrarian and long-term stance.
thE loSt dEcadE for EquitiES Although recent equity market history has been defined by extremes, one of the most important trends to impact investors since the turn of the century has been a sustained period of poor returns for equities. Investors in equities during this period will be all too familiar with this backdrop, but how does the lost decade com-pare with historic periods of equity weakness
and what, if any, lessons can be learnt to help future decision–making.
While there are some limitations to comparing long-term data on a like-for-like basis, history suggests that the lost decade rivals almost any period in the past century in terms of the mag-nitude of disappointment, if not duration, for investors. Figure 1 shows the pattern of
equity Perspectives: Global equities – Disappointment, Volatility and opportunity
Scott Berg, CFA Portfolio Manager
This investment viewpoint reflects the views of Scott Berg, Portfolio Manager of our Global Large-Cap Equity Strategy.
August 2012

T. Rowe PR ice invesTmenT v iewPo inT2
annualized rolling 10-year returns for U.S. equities (where we have the longest data set available) and high-lights just how rare lost decades have been.
Over the past century, U.S. equities have only delivered negative real returns in periods encapsulating World War I, the Great Depression of the 1930s, the 1970s when the so-called “misery index” (inflation and unemployment) hit its high point of the 20th century; and, most recently, the period spanning the collapse of the technology bubble and the global financial crisis. Being even more specific, the 10-year period ending 31 December 2008 ranks as the single worst period over 110 years on a per annum real return basis for U.S. equi-ties at -4.1% p.a. The calendar decade concluding at the end of 2009 (which includes part of the rally post the global financial crisis) led to a return of -2.7% p.a., the sixth-worst period on record.
Figure 2 focuses on the calendar decade ended 31 December 2009 and explicitly shows nominal returns for global developed and emerging market equities. Even without adjusting for the impact of inflation, the promise of superior returns for developed world global equity investors failed to materialize in spectacular fashion. We will comment on the contrasting fortunes of emerging market equity returns later in this report.
The Roots of the Lost Decade
The roots of disappointment felt by equity investors can be traced back to the collapse of the technology bubble in 2000. As dynamic technological change occurred alongside a buoyant global economy and rapid credit and wealth expansion, optimism abounded and equity valua-tions rose aggressively. However, both the global economy and corporate earnings were about to enter a period of exceptional volatility over the next 10 years. This conflu-ence of events led to the decade of disappointment for developed world global equity investors.
Of course there have been many bear markets over the past century, but few have been as deep or prolonged. The obvious questions are why have returns been so poor over such a long period of returns of time and, even more importantly, is the trend likely to continue in the future?
We highlight below several factors that we believe have contributed to this unusually poor period of returns for equities:
�� The overvaluation of equities at the outset of the decade as investor sentiment exceeded company fundamentals
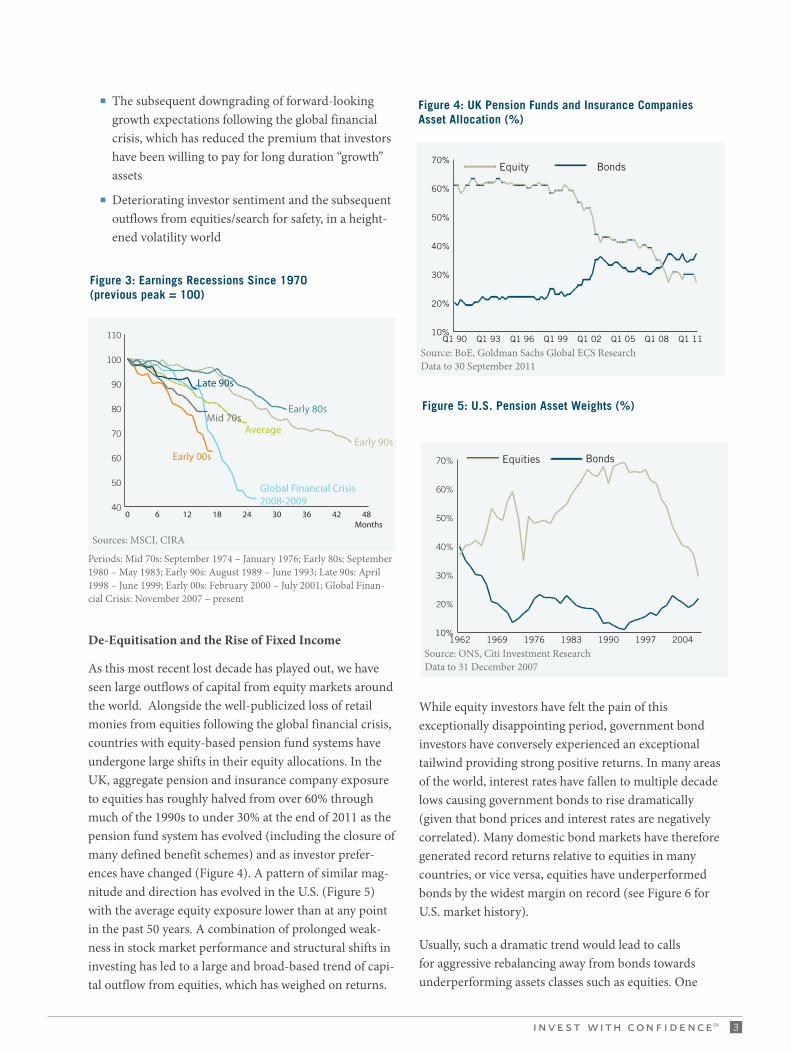
�� Below-par earnings growth, with the decade encom-passing the two largest earnings recessions of the past 40 years (Figure 3)
Sources: Robert Shiller, DataStream, Goldman Sachs Global ECS Research.
Figure 1: Annualized Real Return of S&P 500 (Rolling 10 Years, 1900-2012)
-10
-5
0
5
10
15
20 Annualized real return 10-year holding period
20001990198019701960195019401930192019101900
Sources: FactSet, MSCI, Goldman Sachs Global ECS Research
Figure 2: The Lost Decade (January 2000 – December 2009)
0
50
100
150
200
250
300
350
400
MSCI Emerging Markets (+162%)
MSCI World (-18%)
FTSE All-Share (-15%)
12/0912/0812/0712/0612/0512/0412/0312/0212/0112/0012/99
3
�� The subsequent downgrading of forward-looking growth expectations following the global financial crisis, which has reduced the premium that investors have been willing to pay for long duration “growth” assets
�� Deteriorating investor sentiment and the subsequent outflows from equities/search for safety, in a height-ened volatility world
De-Equitisation and the Rise of Fixed Income
As this most recent lost decade has played out, we have seen large outflows of capital from equity markets around the world. Alongside the well-publicized loss of retail monies from equities following the global financial crisis, countries with equity-based pension fund systems have undergone large shifts in their equity allocations. In the UK, aggregate pension and insurance company exposure to equities has roughly halved from over 60% through much of the 1990s to under 30% at the end of 2011 as the pension fund system has evolved (including the closure of many defined benefit schemes) and as investor prefer-ences have changed (Figure 4). A pattern of similar mag-nitude and direction has evolved in the U.S. (Figure 5) with the average equity exposure lower than at any point in the past 50 years. A combination of prolonged weak-ness in stock market performance and structural shifts in investing has led to a large and broad-based trend of capi-tal outflow from equities, which has weighed on returns.
While equity investors have felt the pain of this exceptionally disappointing period, government bond investors have conversely experienced an exceptional tailwind providing strong positive returns. In many areas of the world, interest rates have fallen to multiple decade lows causing government bonds to rise dramatically (given that bond prices and interest rates are negatively correlated). Many domestic bond markets have therefore generated record returns relative to equities in many countries, or vice versa, equities have underperformed bonds by the widest margin on record (see Figure 6 for U.S. market history).
Usually, such a dramatic trend would lead to calls for aggressive rebalancing away from bonds towards underperforming assets classes such as equities. One
Sources: MSCI, CIRA
Figure 3: Earnings Recessions Since 1970(previous peak = 100)
40
50
60
70
80
90
100
110
Average
Global Financial Crisis 2008-2009
Early 00s
Late 90s
Early 90s
Early 80sMid 70s
4842363024181260Months
Source: BoE, Goldman Sachs Global ECS ResearchData to 30 September 2011
Figure 4: UK Pension Funds and Insurance Companies Asset Allocation (%)
10%
20%
30%
40%
50%
60%
70%BondsEquity
Q1 11Q1 08Q1 05Q1 02Q1 99Q1 96Q1 93Q1 90
Source: ONS, Citi Investment ResearchData to 31 December 2007
Figure 5: U.S. Pension Asset Weights (%)
10%
20%
30%
40%
50%
60%
70% BondsEquities
2004199719901983197619691962
Periods: Mid 70s: September 1974 – January 1976; Early 80s: September 1980 – May 1983; Early 90s: August 1989 – June 1993; Late 90s: April 1998 – June 1999; Early 00s: February 2000 – July 2001; Global Finan-cial Crisis: November 2007 – present
T. Rowe PR ice invesTmenT v iewPo inT4
Sources: Robert Shiller, DataStream, Goldman Sachs Global ECS Research. Data: 1900 - 2002
Figure 6: Annualized excess return of S&P 500 (%)
-10
-5
0
5
10
15
20
25 Annualized excess return 10-year holding period
20001990198019701960195019401930192019101900
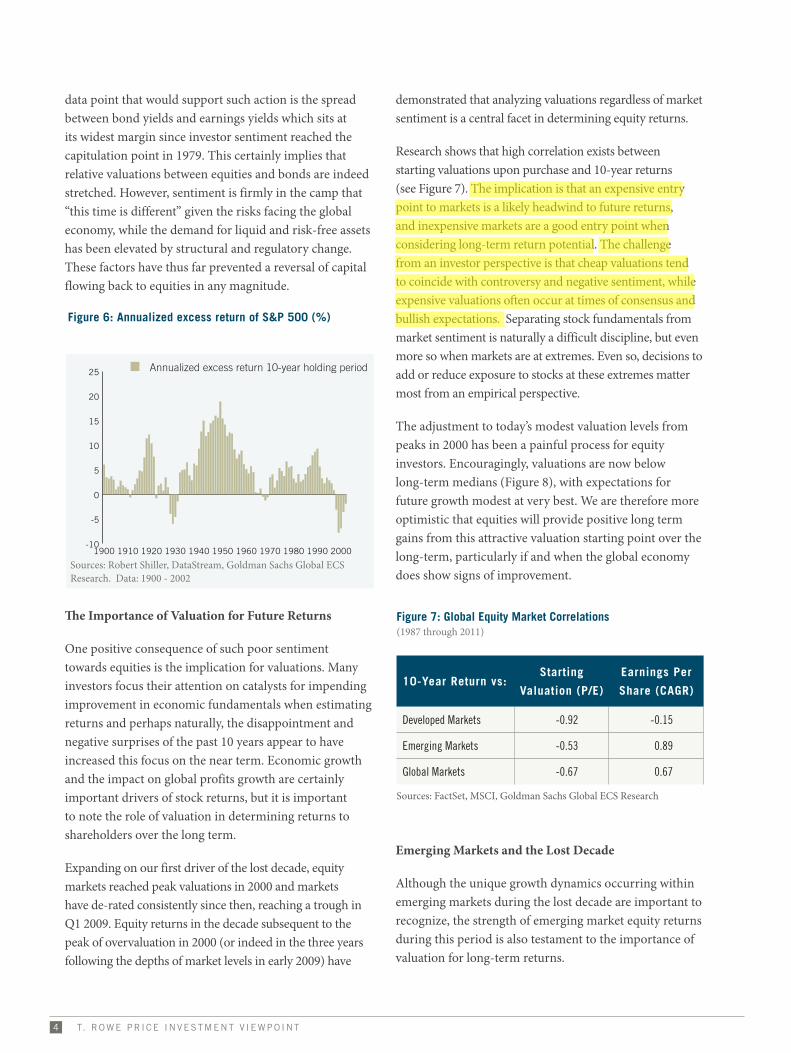
data point that would support such action is the spread between bond yields and earnings yields which sits at its widest margin since investor sentiment reached the capitulation point in 1979. This certainly implies that relative valuations between equities and bonds are indeed stretched. However, sentiment is firmly in the camp that “this time is different” given the risks facing the global economy, while the demand for liquid and risk-free assets has been elevated by structural and regulatory change. These factors have thus far prevented a reversal of capital flowing back to equities in any magnitude.
The Importance of Valuation for Future Returns
One positive consequence of such poor sentiment towards equities is the implication for valuations. Many investors focus their attention on catalysts for impending improvement in economic fundamentals when estimating returns and perhaps naturally, the disappointment and negative surprises of the past 10 years appear to have increased this focus on the near term. Economic growth and the impact on global profits growth are certainly important drivers of stock returns, but it is important to note the role of valuation in determining returns to shareholders over the long term.
Expanding on our first driver of the lost decade, equity markets reached peak valuations in 2000 and markets have de-rated consistently since then, reaching a trough in Q1 2009. Equity returns in the decade subsequent to the peak of overvaluation in 2000 (or indeed in the three years following the depths of market levels in early 2009) have
demonstrated that analyzing valuations regardless of market sentiment is a central facet in determining equity returns.
Research shows that high correlation exists between starting valuations upon purchase and 10-year returns (see Figure 7). The implication is that an expensive entry point to markets is a likely headwind to future returns, and inexpensive markets are a good entry point when considering long-term return potential. The challenge from an investor perspective is that cheap valuations tend to coincide with controversy and negative sentiment, while expensive valuations often occur at times of consensus and bullish expectations. Separating stock fundamentals from market sentiment is naturally a difficult discipline, but even more so when markets are at extremes. Even so, decisions to add or reduce exposure to stocks at these extremes matter most from an empirical perspective.
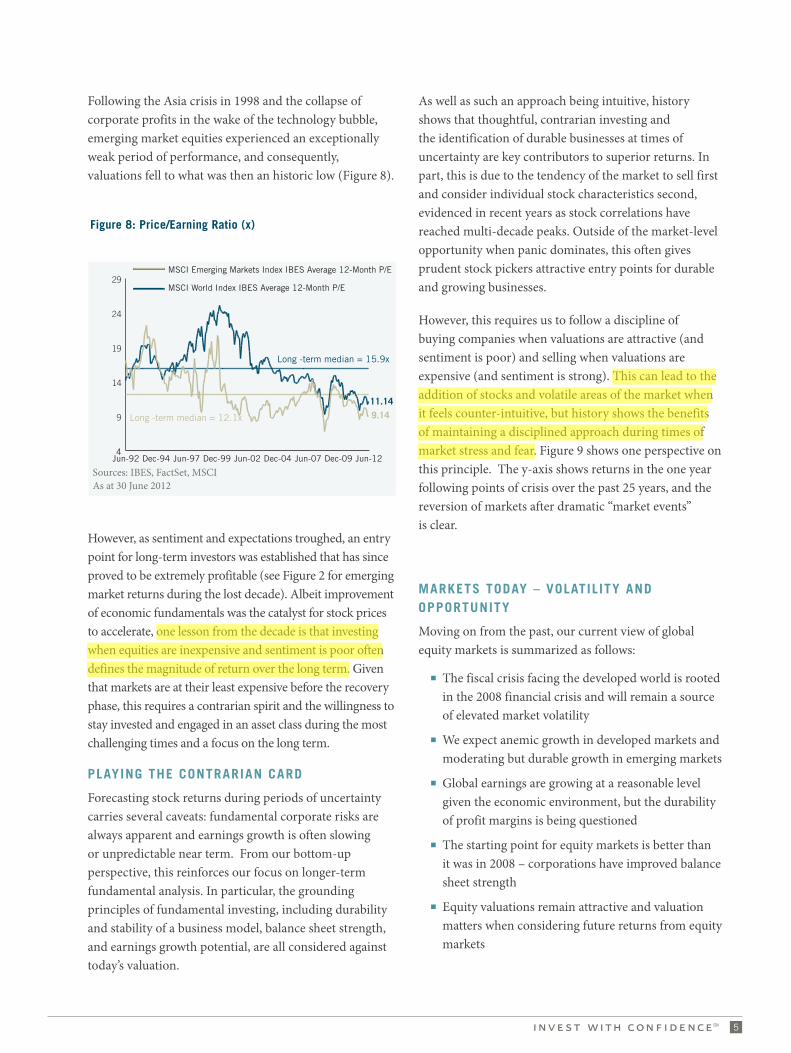
The adjustment to today’s modest valuation levels from peaks in 2000 has been a painful process for equity investors. Encouragingly, valuations are now below long-term medians (Figure 8), with expectations for future growth modest at very best. We are therefore more optimistic that equities will provide positive long term gains from this attractive valuation starting point over the long-term, particularly if and when the global economy does show signs of improvement.
Emerging Markets and the Lost Decade
Although the unique growth dynamics occurring within emerging markets during the lost decade are important to recognize, the strength of emerging market equity returns during this period is also testament to the importance of valuation for long-term returns.
figure 7: Global Equity market correlations (1987 through 2011)
10-year return vs:Starting
valuation (P/E)
Earnings Per
Share (caGr)
Developed Markets -0.92 -0.15
Emerging Markets -0.53 0.89
Global Markets -0.67 0.67
Sources: FactSet, MSCI, Goldman Sachs Global ECS Research
mbelang7
Highlight
mbelang7
Highlight
5
Sources: IBES, FactSet, MSCIAs at 30 June 2012
Figure 8: Price/Earning Ratio (x)
4
9
14
19
24
29
Long -term median = 15.9x
Long -term median = 12.1x
MSCI World Index IBES Average 12-Month P/E
MSCI Emerging Markets Index IBES Average 12-Month P/E
Jun-12Dec-09Jun-07Dec-04Jun-02Dec-99Jun-97Dec-94Jun-92
9.1411.14
Following the Asia crisis in 1998 and the collapse of corporate profits in the wake of the technology bubble, emerging market equities experienced an exceptionally weak period of performance, and consequently, valuations fell to what was then an historic low (Figure 8).
However, as sentiment and expectations troughed, an entry point for long-term investors was established that has since proved to be extremely profitable (see Figure 2 for emerging market returns during the lost decade). Albeit improvement of economic fundamentals was the catalyst for stock prices to accelerate, one lesson from the decade is that investing when equities are inexpensive and sentiment is poor often defines the magnitude of return over the long term. Given that markets are at their least expensive before the recovery phase, this requires a contrarian spirit and the willingness to stay invested and engaged in an asset class during the most challenging times and a focus on the long term.
PlayinG thE contrarian card
Forecasting stock returns during periods of uncertainty carries several caveats: fundamental corporate risks are always apparent and earnings growth is often slowing or unpredictable near term. From our bottom-up perspective, this reinforces our focus on longer-term fundamental analysis. In particular, the grounding principles of fundamental investing, including durability and stability of a business model, balance sheet strength, and earnings growth potential, are all considered against today’s valuation.
As well as such an approach being intuitive, history shows that thoughtful, contrarian investing and the identification of durable businesses at times of uncertainty are key contributors to superior returns. In part, this is due to the tendency of the market to sell first and consider individual stock characteristics second, evidenced in recent years as stock correlations have reached multi-decade peaks. Outside of the market-level opportunity when panic dominates, this often gives prudent stock pickers attractive entry points for durable and growing businesses.
However, this requires us to follow a discipline of buying companies when valuations are attractive (and sentiment is poor) and selling when valuations are expensive (and sentiment is strong). This can lead to the addition of stocks and volatile areas of the market when it feels counter-intuitive, but history shows the benefits of maintaining a disciplined approach during times of market stress and fear. Figure 9 shows one perspective on this principle. The y-axis shows returns in the one year following points of crisis over the past 25 years, and the reversion of markets after dramatic “market events” is clear.
markEtS today – volatility and oPPortunity
Moving on from the past, our current view of global equity markets is summarized as follows:
�� The fiscal crisis facing the developed world is rooted in the 2008 financial crisis and will remain a source of elevated market volatility
�� We expect anemic growth in developed markets and moderating but durable growth in emerging markets
�� Global earnings are growing at a reasonable level given the economic environment, but the durability of profit margins is being questioned
�� The starting point for equity markets is better than it was in 2008 – corporations have improved balance sheet strength
�� Equity valuations remain attractive and valuation matters when considering future returns from equity markets
mbelang7
Highlight
mbelang7
Highlight

T. Rowe PR ice invesTmenT v iewPo inT6
Economic Problems Persist, Growth Remains Muted
Addressing the problems at the macroeconomic level up front, we recognize the serious issues facing global equity markets and anticipate both elevated volatility as well as ongoing bouts of risk aversion in the near term. Sub-par economic growth, sovereign debt burdens and the inter-action effect between the two as governments cut spend-ing and stunt growth, are well documented. High levels of unemployment and the impact on aggregate demand will remain an issue together with today’s uneasy reliance on political decision makers to think long term in their policy making. On the growth front, Figure 10 shows that at +1.4% (as at 17 April 2012), developed world GDP growth is muted and is likely to remain so in the near term given the focus on deleveraging by many developed world governments. We would note that the aggregate figure disguises shifts in profit pools within industries and between companies, however, in what is a dynamic a world as ever.
It should also be noted that although the outlook is uncertain, on a global basis including emerging markets, growth is trending slightly above the 30-year average at 3.5% (as at 17 April 2012). This is due to the contribution by the emerging world to total global GDP, which will reach 38% in 2012, up from 20% in 2002. Many areas of the emerging world that were deemed almost uninvest-able 10 years ago now constitute some of the most robust growth stories within this figure. Following on from the volatility of the 1990s, South-East Asia and many parts of Latin America have made enormous strides forward from
a debt stability perspective in particular. This process of deleveraging and rebuilding is clearly now the central focus in parts of the developed world.
In aggregate, emerging markets as a whole are likely to constitute over 70% of total global GDP growth in 2012 which is cushioning the globe from the issues occurring in the developed world to some degree. However, emerg-ing nations are certainly not immune to the weakening global demand environment that we find ourselves in today and growth is slowing from peak levels.
Corporate Fundamentals Remain Attractive
Despite the low growth outlook, when we consider com-pany fundamentals we believe there is cause for optimism
Sources: Standard & Poor’s, MSCI Indices, analysis by T. Rowe PriceAs of 31 December 2010
Figure 9: One-Year Forward Equity Returns
Return %
-80
-60
-40
-20
0
20
40
60
80
100
EM
Global ex US EquitiesS&P
Jan-
11
Jan-
10
Jan-
09
Jan-
08
Jan-
07
Jan-
06
Jan-
05
Jan-
04
Jan-
03
Jan-
02
Jan-
01
Jan-
00
Jan-
99
Jan-
98
Jan-
97
Jan-
96
Jan-
95
Jan-
94
Jan-
93
Jan-
92
Jan-
91
Jan-
90
Jan-
89
Jan-
88
Jan-
87
Stock Market Crash
US Corporate Scandals
Asian crisis
Lehman bankruptcy
Gulf War
Peso crisis
Russian crisis
Europe Debt crisis
Sources: MSCI, IMF, Morgan StanleyAs of 17 April 2012
Figure 10: Real GDP Growth (Annual % Change)Actual data 1981 through 2011, IMF forecasts 2012 through 2016
-4
-2
0
2
4
6
8
10
2017201320092005200119971993198919851981
Advanced EconomiesEmerging and Developing EconomiesWorld
7
over both the medium and long term. Importantly, we believe that given the pessimism surrounding the global economy and global equity markets, these positive aspects are unappreciated and undervalued. This is a key point when thinking about long-term returns as we have discussed.
This cautiously optimistic outlook is primarily based on our view of bottom-up stock fundamentals and the discount that many stocks are currently trading at, versus our own expectation for medium-term earnings growth. Over the past 12 months, we have seen a deceleration of global earnings growth, which is not surprising at this stage of a cycle, but it has naturally been a source of volatility for stocks. As downgrades have gathered pace, skeptics have pointed towards the risk of another earnings recession to rival the 2008-2009 collapse, but we remain confident that we can identify companies with not only earnings growth potential, but with this scarce growth attached to balance sheet strength and a dis-counted valuation.
In contrast, many argue that the recovery in return on equity (ROE) levels since 2008 (Figure 11) is coming to an end given a belief that profit margins are at historic highs and cannot be maintained irrespective of changes to companies’ cost structure over the past decade. Albeit the outlook will be more dispersed on a company-by-company basis in an unequal and growth challenged world, we continue to find companies with both improv-ing and sustainable margins in both the developed and emerging world.
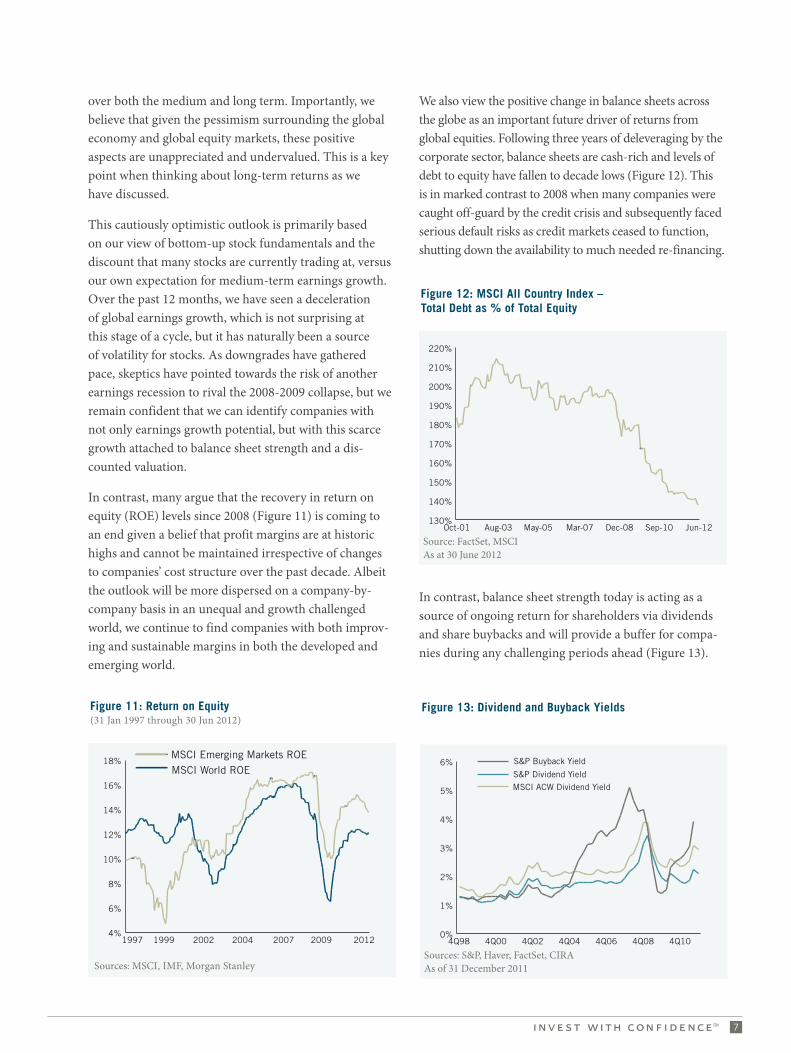
We also view the positive change in balance sheets across the globe as an important future driver of returns from global equities. Following three years of deleveraging by the corporate sector, balance sheets are cash-rich and levels of debt to equity have fallen to decade lows (Figure 12). This is in marked contrast to 2008 when many companies were caught off-guard by the credit crisis and subsequently faced serious default risks as credit markets ceased to function, shutting down the availability to much needed re-financing.
In contrast, balance sheet strength today is acting as a source of ongoing return for shareholders via dividends and share buybacks and will provide a buffer for compa-nies during any challenging periods ahead (Figure 13).
Sources: MSCI, IMF, Morgan Stanley
Figure 11: Return on Equity (31 Jan 1997 through 30 Jun 2012)
4%
6%
8%
10%
12%
14%
16%
18%MSCI World ROEMSCI Emerging Markets ROE
2012200920072004200219991997
Source: FactSet, MSCIAs at 30 June 2012
Figure 12: MSCI All Country Index – Total Debt as % of Total Equity
130%
140%
150%
160%
170%
180%
190%
200%
210%
220%
Jun-12Sep-10Dec-08Mar-07May-05Aug-03Oct-01
Sources: S&P, Haver, FactSet, CIRAAs of 31 December 2011
Figure 13: Dividend and Buyback Yields
0%
1%
2%
3%
4%
5%
6%
MSCI ACW Dividend YieldS&P Dividend Yield
S&P Buyback Yield
4Q104Q084Q064Q044Q024Q004Q98

T. Rowe PR ice invesTmenT v iewPo inT8
This trend is a clear positive if free cash flow levels allow a continuation of this source of return. With current yields of over 5% (2% from dividends and 3% from share buy-backs) U.S. equities compare very favorably with 10-year bonds yielding below 2%. This pattern of dividend yields rising above long bond yields is consistent across most developed world countries and as per the widening of the gap between earnings yields and bond yields mentioned earlier, this has historically been indicative of impending equity market strength. The likelihood of a prolonged low interest rate environment may indeed have changed the relationship between dividend yields and bond yields, but this is yet to be determined. Our belief remains that strong balance sheets are a good starting point for attrac-tive prospective returns and as a minimum, protection in times of economic hardship.
StronG focuS nEEdEd in thiS tranSition-inG world
Periods of volatility and dynamic change are invariably difficult for investors given the challenges of making deci-sions among the extremes of sentiment. We believe that a strong philosophy and consistent process is crucial during times of uncertainty. Through experience and the lessons of the past, we will continue to apply the following prin-ciples in our search for companies with long term growth potential, given a belief that these principles improve the chances of success in global equity investing:
1) Stay engaged with global equities, especially in times of disappointment
The scars left by two 50%+ falls in equity markets in the space of a decade and the prospect of anemic growth within the developed world economy have naturally caused some investors to distance themselves from global equities. As much as this is understandable, such periods of disillusionment and apathy are often indicative of an opportunity being created through falling valuations.
At a market level, we recognize the risks and overhangs on global equities and believe that volatility and nega-tive surprises will be a feature of investing for some time to come. However, we are confident that for those able to take a medium- to long-term focus, equities offer meaningful upside from today’s valuation start point and history suggests that a contrarian approach during times of uncertainty is beneficial to success long term. Posi-
tion sizing is an important mechanism in investing and we believe in both the principle of adding exposure when markets are weak as well as maintaining exposure to stocks we wish to hold long term, to ensure that opportu-nities are not missed.
At the stock level, we continue to see a broad range of opportunities in growing, well-run, and profitable companies, with the added advantage of attractive valu-ations attached. We have consistently used times of fear and panic to add to some of the highest conviction ideas we can find across the globe in developed and emerging markets and believe that through constant engagement with companies during times of uncertainty, we are well placed to make these decisions when markets retrench into risk aversion.
2) Maintain discipline, diversify and be respectful of the unknown
As markets have increasingly been driven by top-down events and a pattern of risk-on/risk-off sentiment, corre-lations have risen, theoretically dampening the benefits of diversification and causing some to question the opportu-nity for stock pickers in a new top-down world.
A narrow and short-term momentum-driven market environment clearly presents many investors with a challenge, but we do not believe that the principles of bottom-up investing or the benefits of diversification have been altered by recent market conditions. As with any trend of material strength, extreme correlations and narrow momentum markets create opportunity for unloved and overlooked stocks that fall out of favor. We remain respectful of the many unknowns in today’s world however and believe that diversification is both a prudent and effective tool to help navigate markets. Used effec-tively, diversification can increase conviction and enable what we believe clients ask their asset managers to deliver – a high-conviction portfolio with thoughtful use of risk to generate meaningful outperformance.
3) Focus on the long term, that’s where inefficiencies are most likely to occur
Given that uncertainty and pessimism dominates markets today, our primary focus remains on identifying com-panies with unique and enduring long-term growth characteristics. Such businesses are rarely acquired at discount valuations, but times of skepticism about global

9
t. rowE PricE at a GlancE
Established in 1937 by Thomas Rowe Price, Jr., T. Rowe Price is headquartered in Baltimore, MD, with offices located in the Americas, Asia, Australia, and Europe. It has over 5,000 associ-ates worldwide, including 403 investment professionals. T. Rowe Price is a publicly traded firm (TROW) and is one of the few independent investment management firms included in the S&P 500 Index.
growth often present an ideal opportunity to acquire such companies. We believe that whether analyzing the market in aggregate or on an individual stock basis, periods of stress in the market tend to focus investors on near term data points. By remaining focused on the long term, we believe that we stand ourselves in good stead to profit from such periods.
Whether investors can profit from long-term oppor-tunities while navigating near term risks will depend heavily on the research capabilities and expertise they are able to bring to bear on their buy and sell decisions. The ability to formulate and compare investment ideas across regions, and integrate those insights into a global perspective, will be crucial to investment success.
concluSionS
We continue to believe that equity markets will move higher over the medium term. Corporate fundamen-tals have held surprisingly firm in among deteriorating sentiment while balance sheets are strong. Importantly, equity valuations remain attractive and valuation matters when considering future returns from equity markets. The long-term growth outlook remains strong in emerg-ing markets, as they are buoyed by minimal debt burdens, healthy employment levels, rising wages, and growing consumer demand. Moreover, the recent pullbacks in emerging market equities have made valuations consider-ably attractive.
However, the encouraging long-term view remains hampered by near-term uncertainty. Unrest in the Middle East and North Africa, sovereign debt problems in the eurozone, political stalemate in the U.S., and deceleration of GDP and earnings growth are likely to cause further market volatility. Given this mixed environment, we remain leveraged to the relative certainty that exists in longer-term growth trends, while actively navigating through the inevitable surprises along the way.
mbelang7
Highlight

06264-11 122699
Important Information Investment Viewpoints are provided for informational and educational purposes only and are not intended to reflect a current or past recommendation, investment advice of any kind, or a solicitation of an offer to buy or sell any securities or investment services. This Investment Viewpoint provides opinions and commentary that do not take into account the investment objectives or financial situation of any particular investor or class of investor. Investors will need to consider their own circumstances before making an investment decision. Information contained herein is based upon sources we consider to be reliable; we do not, however, guarantee its accuracy.Past performance cannot guarantee future results. All charts and tables are shown for illustrative purposes only. The views contained herein are as of August 2012 and may have changed since that time. Issued in the U.S. by T. Rowe Price Associates, Inc., 100 East Pratt Street, Baltimore, MD 21202, which is regulated by the U.S. Securities and Exchange Commission. The material is not intended to be a solicitation for any product or service not available to U.S. investors, including the T. Rowe Price Funds SICAV, and may be distributed only to institutional investors.Issued in Japan by T. Rowe Price International Ltd, Tokyo Branch (TRPILTB) (KLFB Registration No. 445 (Financial Instruments Service Provider), JIAA Member-ship No. 011-01162), located at NBF Hibiya Building 20F, 1-7, Uchisaiwai-cho 1-chome, Chiyoda-ku, Tokyo 100-0011. This material is intended for use by profes-sional investors only and may not be disseminated without the prior approval of TRPILTB.Issued in Canada by T. Rowe Price (Canada), Inc. T. Rowe Price (Canada), Inc., enters into written delegation agreements with affiliates to provide investment management services. T. Rowe Price (Canada), Inc., is not registered to provide investment management business in all Canadian provinces. Our investment management services are only available to select clients in those provinces where we are able to provide such services. This material is intended for use by accredited investors only.Issued in Australia by T. Rowe Price International Ltd (TRPIL) (ABN 84 104 852 191), Level 50, Governor Phillip Tower, 1 Farrer Place, Suite 50B, Sydney, NSW 2000, Australia. TRPIL is exempt from the requirement to hold an Australian Financial Services license (AFSL) in respect of the financial services it provides in Australia. TRPIL is authorized and regulated by the UK Financial Services Authority (the FSA) under UK laws, which differ from Australian laws. This material is not intended for use by Retail Clients, as defined by the FSA, or as defined in the Corporations Act (Australia), as appropriate.Issued in New Zealand by T. Rowe Price International Ltd (TRPIL). TRPIL is authorized and regulated by the UK Financial Services Authority under UK laws, which differ from New Zealand laws. This material is intended only for use by persons who are not members of the public, by virtue of section 3(2)(a)(ii) of the Securities Act 1978 and is not intended for public distribution nor as a solicitation for investments from members of the public. This material may not be redistrib-uted without prior written consent from TRPIL.Issued in the Dubai International Financial Centre (DIFC) by T. Rowe Price International Ltd (TRPIL), 60 Queen Victoria Street, London EC4N 4TZ, which is authorized and regulated by the UK Financial Services Authority (the FSA). This material is communicated on behalf of TRPIL by the TRPIL Representative Office, which is regulated by the Dubai Financial Services Authority (DFSA) as a Representative Office. This material is not intended for use by Retail Clients, as defined by the FSA and DFSA. Retail Clients should not act upon information contained within this material.Issued in Hong Kong by T. Rowe Price Hong Kong Limited (TRPHK), 21/F, Jardine House, 1 Connaught Place, Central, Hong Kong, a Hong Kong limited company regulated by the Securities & Futures Commission. This material is intended for use by professional investors only and may not be redistributed without the prior approval of TRPHK.Issued in Switzerland by T. Rowe Price (Switzerland) GmbH (TRPSWISS), Talstrasse 65, 6th Floor, 8001 Zurich, Switzerland. This material is not intended for use by non-institutional clients and may not be redistributed without prior written consent from TRPSWISS. Issued outside the U.S., Japan, Canada, Australia, New Zealand, DIFC, Hong Kong, and Switzerland by T. Rowe Price International Ltd, 60 Queen Victoria Street, London EC4N 4TZ, which is authorized and regulated by the UK Financial Services Authority (the FSA). This material is not intended for use by Retail Clients, as defined by the FSA.This material is provided pursuant to specific request. It is intended for informational purposes only and is not intended to be a solicitation for any T. Rowe Price products or services. Recipients are advised that T. Rowe Price shall not offer any products or services without an appropriate license or exemption from such license in the relevant jurisdictions. This material may not be redistributed without prior written consent from T. Rowe Price. The contents of this material have not been reviewed by any regulatory authority in any jurisdiction where this presentation is being made or by any other regulatory authority. This material does not constitute investment advice and should not be exclusively relied upon. Investors will need to consider their own circumstances before making an investment decision.T. Rowe Price, Invest With Confidence, and the bighorn sheep logo is a registered trademark of T. Rowe Price Group, Inc., in the United States, European Union, Australia, Canada, Japan, and other countries. This material was produced in the United Kingdom.