Equity Market Outlook Sep 2019
28
Equity Market Outlook September 2019
Transcript of Equity Market Outlook Sep 2019

Equity Market Outlook
September 2019

Equity market outlook
Global growth trends have weakened mainly due to US-China standoff. Recent central bank actions,Brexit deal and possible US-China dispute resolution could support growth
India’s twin deficits – Fiscal and Current account in comfort zone; provide space to boost growth
Domestic lead economic indicators continue to show weakness
Consumption demand remains weak; however recent turnaround in food inflation, unspent budgetsshould support rural led recovery
Financial sector seeing fresh round of challenges, credit environment appears weak overall
Inflation continues to remain benign; offers scope for further monetary easing
Government-led infra spending to pick up in second half of the year
Government now using fiscal and monetary tools to spur economy
Domestic economy is well-placed for earnings recovery led by sectors such as Financials andIndustrials; Consumer Discretionary may remain in slow track in the short term
Large-cap valuations at 37% premium to the long-term average remain a challenge; however,valuations of midcaps and small caps have corrected and on an adjusted PE basis now trade at a 19%discount versus long term average of 14% discount
2

Global Macro
50
60
70
80
90
100
110
Jan-
05N
ov-0
5Au
g-06
May
-07
Feb-
08N
ov-0
8Se
p-09
Jun-
10M
ar-1
1D
ec-1
1Se
p-12
Jun-
13Ap
r-14
Jan-
15O
ct-1
5Ju
l-16
Apr-1
7Ja
n-18
Nov
-18
Aug-
19
U.S
. Con
sum
er C
onfid
ence
Inde
x (3
MM
A) Highest in decade
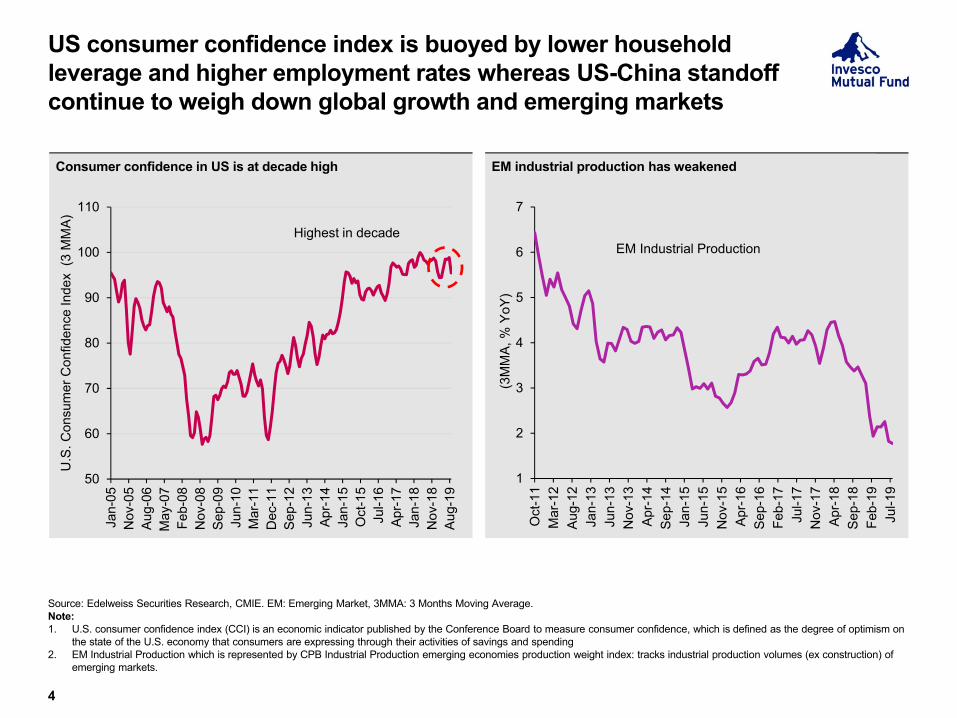
Consumer confidence in US is at decade high
1
2
3
4
5
6
7
Oct
-11
Mar
-12
Aug-
12Ja
n-13
Jun-
13N
ov-1
3Ap
r-14
Sep-
14Ja
n-15
Jun-
15N
ov-1
5Ap
r-16
Sep-
16Fe
b-17
Jul-1
7N
ov-1
7Ap
r-18
Sep-
18Fe
b-19
Jul-1
9
(3M
MA,
% Y
oY)
EM Industrial Production
EM industrial production has weakened
US consumer confidence index is buoyed by lower household leverage and higher employment rates whereas US-China standoff continue to weigh down global growth and emerging markets
4
Source: Edelweiss Securities Research, CMIE. EM: Emerging Market, 3MMA: 3 Months Moving Average.Note:1. U.S. consumer confidence index (CCI) is an economic indicator published by the Conference Board to measure consumer confidence, which is defined as the degree of optimism on
the state of the U.S. economy that consumers are expressing through their activities of savings and spending2. EM Industrial Production which is represented by CPB Industrial Production emerging economies production weight index: tracks industrial production volumes (ex construction) of
emerging markets.

18%
15%
18%
21%
24%
27%
Jan-
12
Oct
-12
Jun-
13
Mar
-14
Nov
-14
Jul-1
5
Apr-1
6
Dec
-16
Aug-
17
May
-18
Jan-
19
Sep-
19
Fede
ral R
eser
ve B
alan
ce S
heet
as
a %
of G
DP
1.56%
1.00%
1.50%
2.00%
2.50%
3.00%
3.50%
Jan-
12
Dec
-12
Dec
-13
Nov
-14
Nov
-15
Nov
-16
Oct
-17
Oct
-18
Oct
-19
10 Y
ear G
-Sec
Yie
ld (%
)
Recent change of Fed stance on rates and balance sheet reduction imply easing liquidity
5
Source: Bloomberg.

Indian Macro
0%
3%
6%
9%
12%
15%
Mar
-00
Mar
-01
Mar
-02
Mar
-03
Mar
-04
Mar
-05
Mar
-06
Mar
-07
Mar
-08
Mar
-09
Mar
-10
Mar
-11
Mar
-12
Mar
-13
Mar
-14
Mar
-15
Mar
-16
Mar
-17
Mar
-18
Mar
-19
Mar
-20
% o
f GD
P
PSE BorrowingsCombined Fiscal Deficit (inc. off-budget items)Augmented (inc PSE Borrowings)
-1.99%
-8%
-6%
-4%
-2%
0%
2%
Q1
FY12
Q3
FY12
Q1
FY13
Q3
FY13
Q1
FY14
Q3
FY14
Q1
FY15
Q3
FY15
Q1
FY16
Q3
FY16
Q1
FY17
Q3
FY17
Q1
FY18
Q3
FY18
Q1
FY19
Q3
FY19
Q1
FY20
CAD as % of GDP CAD excl. gold as % of GDP
5.15%3.28%
1%
5%
9%
13%
Jan-
12
Aug-
12
Mar
-13
Oct
-13
May
-14
Dec
-14
Jul-1
5
Feb-
16
Sep-
16
Apr-1
7
Dec
-17
Jul-1
8
Feb-
19
Sep-
19
Repo CPI
3.08%
3.00%3.50%4.00%4.50%5.00%5.50%6.00%6.50%7.00%7.50%
Aug-
10
Mar
-11
Oct
-11
May
-12
Nov
-12
Jun-
13
Jan-
14
Jul-1
4
Feb-
15
Sep-
15
Apr-1
6
Oct
-16
May
-17
Dec
-17
Jun-
18
Jan-
19
Aug-
19
% o
f GD
P
Fiscal Deficit (12 months trailing) Augmented Fiscal Deficit
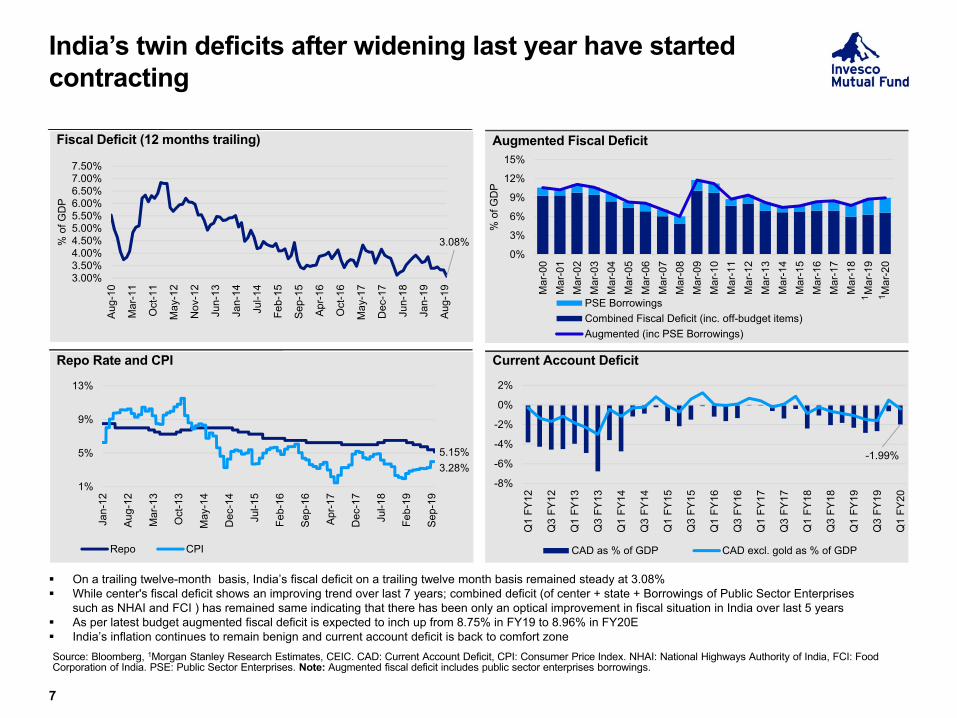
India’s twin deficits after widening last year have started contracting
7
Source: Bloomberg, 1Morgan Stanley Research Estimates, CEIC. CAD: Current Account Deficit, CPI: Consumer Price Index. NHAI: National Highways Authority of India, FCI: Food Corporation of India. PSE: Public Sector Enterprises. Note: Augmented fiscal deficit includes public sector enterprises borrowings.
Repo Rate and CPI Current Account Deficit
On a trailing twelve-month basis, India’s fiscal deficit on a trailing twelve month basis remained steady at 3.08% While center's fiscal deficit shows an improving trend over last 7 years; combined deficit (of center + state + Borrowings of Public Sector Enterprises
such as NHAI and FCI ) has remained same indicating that there has been only an optical improvement in fiscal situation in India over last 5 years As per latest budget augmented fiscal deficit is expected to inch up from 8.75% in FY19 to 8.96% in FY20E India’s inflation continues to remain benign and current account deficit is back to comfort zone
11

-38.71%-60%-40%-20%
0%20%40%60%80%
100%
Apr-1
0
Nov
-10
Jun-
11
Jan-
12
Aug-
12
Mar
-13
Oct
-13
May
-14
Dec
-14
Jul-1
5
Feb-
16
Sep-
16
Apr-1
7
Nov
-17
Jun-
18
Jan-
19
Aug-
19
9.92%0%5%
10%15%20%25%30%
Apr-1
0
Nov
-10
Jun-
11
Jan-
12
Aug-
12
Mar
-13
Oct
-13
May
-14
Dec
-14
Jul-1
5
Feb-
16
Sep-
16
Apr-1
7
Nov
-17
Jun-
18
Jan-
19
Aug-
19
-6.05%-40%
-20%
0%
20%
40%
60%
Apr-1
0O
ct-1
0M
ay-1
1N
ov-1
1Ju
n-12
Dec
-12
Jul-1
3Fe
b-14
Aug-
14M
ar-1
5O
ct-1
5Ap
r-16
Nov
-16
May
-17
Dec
-17
Jul-1
8Ja
n-19
Aug-
19
-8.70%-15%
-10%
-5%
0%
5%
10%
15%
Apr-1
0O
ct-1
0M
ay-1
1N
ov-1
1Ju
n-12
Dec
-12
Jul-1
3Fe
b-14
Aug-
14M
ar-1
5O
ct-1
5Ap
r-16
Nov
-16
May
-17
Dec
-17
Jul-1
8Ja
n-19
Aug-
19
Railway Freight Growth (%) Export Growth (%)
Lead indicators suggest weak trends
8Source: Kotak., Jefferies.
Commercial Vehicles (CV) Sales Growth (%) Credit Growth (%)
Lead indicators continue to suggest weak trends across the board Credit growth after last years revival has slow down to sub 10% Export growth continue to remain lackluster while freight remains muted with railway down 6% and ports up 3.5% YoY Commercial vehicles sales have slow down while electricity generation declined 0.3% YoY

11.10%
-7.50%
1.60%
25.50% 25.70%15.70%
2.90%
7.30%7.90%
3.00%
6.90%14.80%
4.90%
-14.80%-25%
-15%
-5%
5%
15%
25%
Mar
-07
Mar
-08
Mar
-09
Mar
-10
Mar
-11
Mar
-12
Mar
-13
Mar
-14
Mar
-15
Mar
-16
Mar
-17
Mar
-18
Mar
-19
Aug-
19
YoY(
%)
Two wheeler sales Average Growth
Average: 7.50%
-3.50%
0.60%
32.20%
19.80%11.30%
-1.70%
20.20%
-13.00%-10.50%
18.00%
22.10%
10.20%
-14.00%
Mar
-08
Mar
-09
Mar
-10
Mar
-11
Mar
-12
Mar
-13
Mar
-14
Mar
-15
Mar
-16
Mar
-17
Mar
-18
Mar
-19
Aug-
19
YoY(
%)
Tractor Domestic Sales growth Average Growth
Average: 7.05%
1.77%3.57%
-10%-5%0%5%
10%15%20%25%30%35%
Feb-
13
Sep-
13
Mar
-14
Sep-
14
Apr-1
5
Oct
-15
May
-16
Nov
-16
May
-17
Dec
-17
Jun-
18
Dec
-18
Jul-1
9
%
YoY(%) YoY(%), 3MMA
Domestic two wheeler sales
6.60% 6.60% 6.90%
2.50%
5.20%
8.00%
4.60%
FY14 FY15 FY16 FY17 FY 18 FY 19 1QFY20
YoY(
%)
Staples volume growth
Consumption – cyclical slowdown in last few months
9
Source: Bloomberg, Morgan Stanley, CEIC, Axis Capital. CPI: Consumer Price Index, 3 MMA: 3 months moving average. For consumer staple sector Britannia, Colgate, Dabur, Emami, GSK Consumers, Hindustan Unilever, Marico and Godrej Consumer Products have been taken and this is not exhaustive list. There are other companies operating in the same sector having different volume growth.
Air Passenger Traffic – Number of Passengers Flown Tractor sales growth
Tractor sales declined while both two wheelers and four wheeler sales continue to decelerate further. The slow down which started in H2FY19 will now start playing up in base and things could improve optically from hereon.
3.88%
3.06%
1.99%2.22%
2.46%
2.10%
1.70% 1.80%
2.50%
1Q18 2Q18 3Q18 4Q18 1Q19 2Q19 3Q19 4Q19 1Q20%
of p
revi
ous
year
adv
ance
s
10.28%9.91%
9.16%8.45%
8.01%7.64%
6.70%
5.80% 5.80%
1Q18 2Q18 3Q18 4Q18 1Q19 2Q19 3Q19 4Q19 1Q20
% o
f tot
al a
dvan
ces
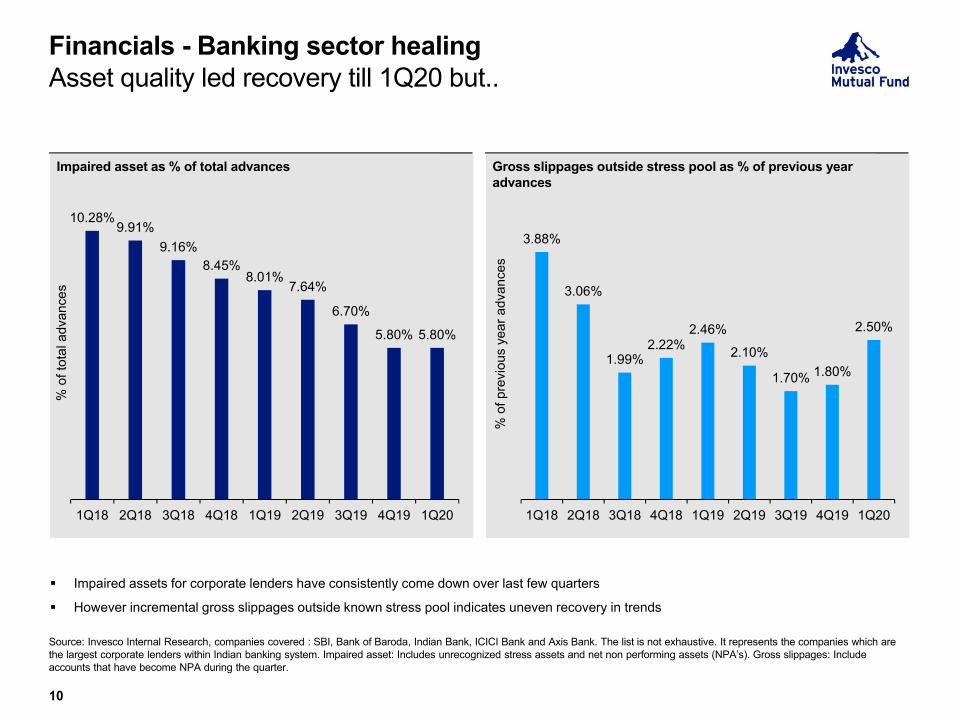
Impaired asset as % of total advances Gross slippages outside stress pool as % of previous year advances
Financials - Banking sector healing Asset quality led recovery till 1Q20 but..
10
Source: Invesco Internal Research, companies covered : SBI, Bank of Baroda, Indian Bank, ICICI Bank and Axis Bank. The list is not exhaustive. It represents the companies which are the largest corporate lenders within Indian banking system. Impaired asset: Includes unrecognized stress assets and net non performing assets (NPA’s). Gross slippages: Include accounts that have become NPA during the quarter.
Impaired assets for corporate lenders have consistently come down over last few quarters
However incremental gross slippages outside known stress pool indicates uneven recovery in trends

3.49
%
2.48
%
0.67
%
0.89
% 2.94
%
1.33
%
0.82
%
1.33
%
2.08
%
0.72
%
0.63
% 3.31
%
5.11
%
1.96
%
1.62
% 5.63
%
1.84
%
2.60
% 6.06
%
25.3
8%
2010
-11
2011
-12
2012
-13
2013
-14
2014
-15
2015
-16
2016
-17
2017
-18
2018
-19
2019
-20
% o
f tot
al ra
ted
debt
Upgrades Downgrades
0%10%20%30%40%50%60%70%80%90%
100%
2010
-11
2011
-12
2012
-13
2013
-14
2014
-15
2015
-16
2016
-17
2017
-18
2018
-19
2019
-20
% o
f tot
al ra
ted
debt
Highest Safety (AAA) Other Investment GradeNon-Investment Grade
Upgrades v/s Downgrades of corporate debt securities
Asset Quality – Fresh round of Pain
11
Source: SEBI; combined data of all rating agencies. Note: Other investment grade includes securities with High Safety (AA), Adequate Safety (A) and Moderate Safety (BBB) ratings
The financial sector has struggled with fresh round of delinquencies, however, downgrades still higher than upgrades indicating increasing vigilance and residual pain ahead.
Ratings assigned for long-term corporate debt securities (maturity > 1 year)
(Apr
19
–Au
g 19
)
(Apr
19
–Au
g 19
)

5.50%
6.30%
7.10%
7.90%
8.70%
9.50%
10.30%
Apr-19 May-19 Jun-19 Jul-19 Aug-19 Sep-19
CP
rate
s (%
)
Chola Bajaj Fin IIFL EdelJM Fin PEL HDFC LIC HF
9% 13% 17%30%
20%10%
6%
18%21%
26%
25%
19%
FY 2014 FY 2015 FY 2016 FY 2017 FY 2018 FY 2019E
Syst
em lo
an g
row
th (%
)
HFCs NBFCs
NBFCs/HFCs – major drivers of system loan growth in recent years
14%11%
-4%Strong Parentage and
Long VintageStrong Parentage but
Low VintageAll othersTo
tal B
orro
win
gs fr
om S
ep-1
8 to
Ju
ne-1
9 (%
cha
nge)
Strong NBFCs continues to have access to markets
NBFC – Divergence between strong and weak
12
Source: RBI, Company data, Morgan Stanley Research, Credit Suisse. Strong Parentage and Long Vintage companies are: HDFC, PFC, REC, LICHF, BAJAJ Finance, SHTF, MMFS, Cholamandalam, Sundaram Finance, SCUF, Gruh Finance; Strong Parentage but Low Vintage companies are: L&T Finance, PNB Housing Finance, Piramal Capital Housing; All others companies are: IHFL, Edelweiss, IIFL Finance, Muthoot Finance, SREI Equipment, BHAFIN, JM Financial , Magma Fincorp, Manappuram, SREI Infra, Repco Home Finance, Indostar, MAS Financial, Aspire Home Finance, Muthoot Capital
Funding cost for strong NBFCs has started coming down
5
15
25
35
45
55
65
Jul-1
5
Oct
-15
Jan-
16
Apr-1
6
Jul-1
6
Oct
-16
Jan-
17
Apr-1
7
Jul-1
7
Oct
-17
Jan-
18
Apr-1
8
Jul-1
8
Oct
-18
Jan-
19
Apr-1
9
Jul-1
9
Oct
-19
Spre
ads
(bas
is p
oint
s)
NBFC spreads over similar rated corporates normalizing

5.50
5.70
5.90
6.10
6.30
6.50
6.70
6.90
7.10
7.30
7.50
8.50%
9.00%
9.50%
10.00%
10.50%
11.00%
Jan-
18M
ar-1
8Ap
r-18
May
-18
May
-18
Jun-
18Ju
l-18
Aug-
18Se
p-18
Oct
-18
Nov
-18
Dec
-18
Jan-
19Fe
b-19
Mar
-19
Apr-1
9M
ay-1
9Ju
n-19
Jul-1
9Au
g-19
Sep-
19
yoy
(%)
M3 Money Supply (%) (LHS) Money Multiplier - (RHS)
7,361
9100
5,000
10,000
15,000
20,000
25,000
FY 2
013-
14
FY 2
014-
15
FY 2
015-
16
FY 2
016-
17
FY 2
017-
18
FY 2
018-
19
1H 2
018-
19
1H 2
019-
20
Rs
Bn
Flow of financial resources to the commercial sector Money multiplier and M3 broad money
Commercial sector faces liquidity shock amid risk aversion
13
Source: RBI, Citi Research. Money multiplier: It is the amount of money the banking system generates with each rupee of reserves.
Risk Aversion has stemmed credit flow to commercial sector. Total flow of financial resources to the commercial sector fell sharply by 88% (yoy) to INR 910bn in H1FY20
Velocity has gone down which explains a slowdown in overall demand
519 442
-200-100
0100200300400500600
Jun-
11
Dec
-11
Jun-
12
Dec
-12
Jun-
13
Dec
-13
Jun-
14
Dec
-14
Jun-
15
Dec
-15
Jun-
16
Dec
-16
Jun-
17
Dec
-17
Jun-
18
Dec
-18
Jun-
19
Rs.
billi
on10.00%10.40%
0%2%4%6%8%
10%12%14%16%18%
Sep-
15
Dec
-15
Mar
-16
Jun-
16
Sep-
16
Dec
-16
Mar
-17
Jun-
17
Sep-
17
Dec
-17
Mar
-18
Jun-
18
Sep-
18
Dec
-18
Mar
-19
Jun-
19
Sep-
19
%
Deposit growth (%, yoy) Credit growth (%, yoy)
9.27%
6%7%8%9%
10%11%12%13%14%
Q1F
Y17
Q2F
Y17
Q3F
Y17
Q4F
Y17
Q1F
Y18
Q2F
Y18
Q3F
Y18
Q4F
Y18
Q1F
Y19
Q2F
Y19
Q3F
Y19
Q4F
Y19
Q1F
Y20
Q2F
Y20
%
1
-1,000,000-500,0000500,0001,000,0001,500,0002,000,0002,500,000
5%6%6%7%7%8%8%
Apr-1
9
Apr-1
9
May
-19
Jun-
19
Jun-
19
Jul-1
9
Jul-1
9
Aug-
19
Sep-
19
Sep-
19
Rs.
Crs
%
Net liquidity position surplus (+)/deficit (-) (RHS)Repo (LHS)India 10 year G-sec yield (%) (LHS)
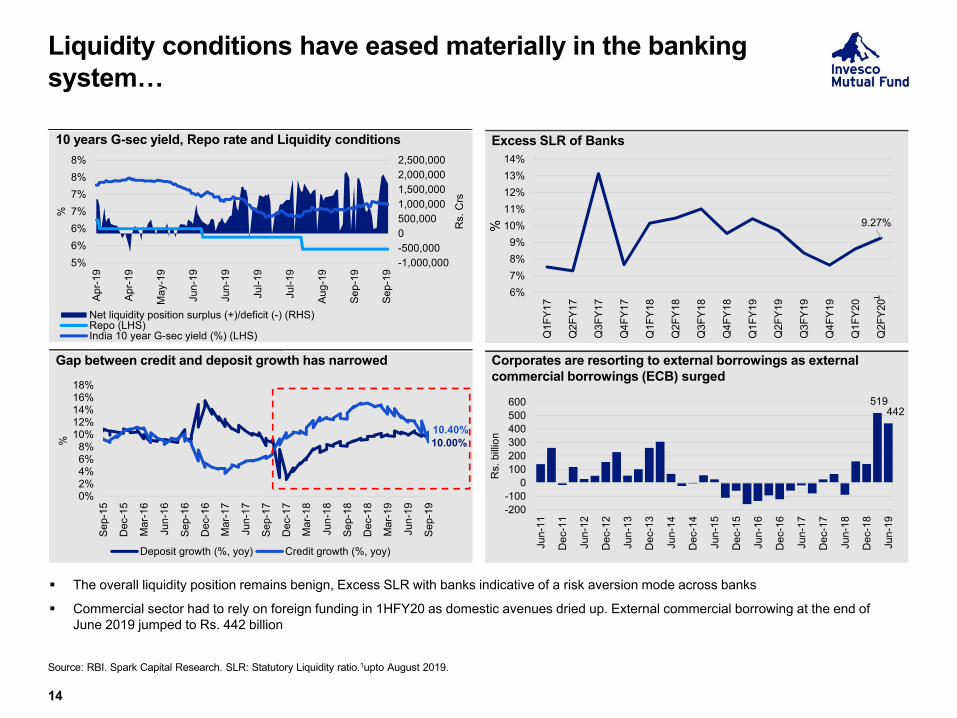
10 years G-sec yield, Repo rate and Liquidity conditions Excess SLR of Banks
Liquidity conditions have eased materially in the banking system…
14
Source: RBI. Spark Capital Research. SLR: Statutory Liquidity ratio.1upto August 2019.
Gap between credit and deposit growth has narrowed Corporates are resorting to external borrowings as external commercial borrowings (ECB) surged
The overall liquidity position remains benign, Excess SLR with banks indicative of a risk aversion mode across banks
Commercial sector had to rely on foreign funding in 1HFY20 as domestic avenues dried up. External commercial borrowing at the end of June 2019 jumped to Rs. 442 billion

20.00% 20.00%15.00% 15.00% 13.00%
11.00%17.40%
21.90%
-11.90%
5.10%7.00%
15.60%
FY 14 FY 15 FY 16 FY 17 FY 18 FY 19
Ord
er F
low
(%Yo
Y)
Guidance Actual
19%
-15%
-5%
5%
15%
25%
35%
Feb-
11
Sep-
11
Mar
-12
Sep-
12
Apr-1
3
Oct
-13
May
-14
Nov
-14
May
-15
Dec
-15
Jun-
16
Dec
-16
Jul-1
7
Jan-
18
Jul-1
8
Feb-
19
Aug-
19
Cre
dit t
o in
frast
ruct
ure
(ex
pow
er
and
tele
com
) (3M
MA,
%Yo
Y)
Sharp rebound
-
20,000
40,000
60,000
80,000
Dec
-09
Jun-
10
Jan-
11
Aug-
11
Mar
-12
Oct
-12
May
-13
Dec
-13
Jul-1
4
Feb-
15
Sep-
15
Mar
-16
Oct
-16
May
-17
Dec
-17
Jul-1
8
Feb-
19
Sep-
19
INR
bn
Government Private
-
200
400
600
800
1,000
1,200
1,400
1,600
FY11 FY12 FY13 FY14 FY15 FY16 FY17 FY18 FY19 FY20
Rs.
bn
Investment trends - Green shoots visible but weak overallCapex led by Government projects holds up
15
Source: Government Documents, SBICAP securities, Investec Research, Companies, Powergrids, Media Reports, Motilal Oswal Research. 1Revised estimates. 2Budget estimates.
India’s largest Industrial company order guidance vs actual performance over years
After two strong years (FY17, FY18), FY19 was weak for road order awards; However central plan outlay for roads continues to rise indicating improvement ahead
After a gap of many years, India’s largest Industrial company was able to meet his order inflow guidance Share of Government capex in gross projects continues to remain high as private sector continues to deleverage
Share of Government capex has increased
Bank lending to infrastructure has improved significantly Central Plan outlay for roads on rise
21

32.9%
34.3%
28.6%
22%
24%
26%
28%
30%
32%
34%
36%
FY99
FY00
FY01
FY02
FY03
FY04
FY05
FY06
FY07
FY08
FY09
FY10
FY11
FY12
FY13
FY14
FY15
FY16
FY17
FY18
FY19
% o
f GD
P
India’s investment (GFCF) rate increases from lows of FY 2018
Investment trends - Green shoots visible but weak overallCapex trends indicate prolonged under-investment in economy
16
Source: Motilal Oswal. GFCF: Gross Fixed Capital formation
Gross Fixed capital formation has slowed materially in last 5 years v/s a decade prior
As system capacity utilization approaches peak, this downtrend could likely reverse

30%28%
25% 25% 25% 25%24% 23.2%
20% 20% 20% 20%
17%
Philip
pine
s
Sri L
anka
Bang
lade
sh
Chi
na
Indo
nesi
a
Kore
a
Mal
aysi
a
Japa
n
Cam
bodi
a
Taiw
an
Thai
land
Viet
nam
Sing
apor
e
Cor
pora
te ta
x ra
te
Base corporate tax rate of major Asian economies, Calendar year-ends, 2019 (%)
Recent corporate tax rate can further spur capex over longer term; makes India competitive
17
Source: PWC. Deloitte, KPMG, Kotak Institutional Equities. 1New manufacturing company must be incorporated on or after 1 March 2016. 2New manufacturing company must be incorporated on or after 1 October 2019, must start production before March 2023. Surcharge and cess as applicable. Tax benefits are subject to the provisions of the Income Tax Act, 1961 and are subject to amendments, from time to time. Investors should be aware that the fiscal rules/ tax laws may change and there can be no guarantee that the current tax position may continue indefinitely. In view of individual nature of tax consequences, each investor is advised to consult his/ her own professional tax advisor.
Indian Corporate Tax Rates
Type of Domestic Company Base Tax Rate
Minimum Alternative Tax
Rate
Company claiming exemption 30% 15%
Company having total turnover during FY 2017-18 not exceeding INR 400 crores
25% 15%
Company engaged in manufacturing1 25% 15%
Company not claiming exemption 22% Not applicable
New Manufacturing Companies2 15% Not applicable
With recent tax rate changes, corporate India to become more competitive compared with other Asian economies

4.65%
0%
2%
4%
6%
8%
10%
Apr-1
5
Sep-
15
Jan-
16
May
-16
Sep-
16
Jan-
17
May
-17
Oct
-17
Feb-
18
Jun-
18
Oct
-18
Feb-
19
Jul-1
9
Nom
inal
rura
l wag
e gr
owth
(%
yoy)
5%
-10%-5%
-50%-40%-30%-20%-10%
0%10%20%30%
June
1st
W
June
2nd
W
June
3rd
W
June
4th
W
July
1st
W
July
2nd
W
July
3rd
W
July
4th
W
Aug
1st W
Aug
2nd
W
Aug
3rd
W
Aug
4th
W
Sep
1st W
Sep
2nd
W
Sep
3rd
W
Sep
4th
WRai
nfal
l as
% o
f LPA
2019 2018 2017
Good rainfall bodes well for the Kharif and upcoming rabi crops
-50%-30%-10%10%30%50%70%90%
110%
May
-09
Dec
-09
Jun-
10D
ec-1
0Ju
n-11
Dec
-11
Jun-
12Ja
n-13
Jul-1
3Ja
n-14
Jul-1
4Ja
n-15
Aug-
15Fe
b-16
Aug-
16Fe
b-17
Aug-
17Fe
b-18
Sep-
18M
ar-1
9Se
p-19
% y
oy
Sugar Rs./quintal wheat Rs./metric ton Pulses Rs./quintalMilk Rs./litre Soyabean Rs./15kg
Agri prices have started inching up – Milk, Pulses, Wheat and Soybean prices are up
Positive signs for Rural Economy
18
Source: Spark Capital. W: Week. LPA: Long Period Average
3.3%
-25.0%-20.0%-15.0%-10.0%
-5.0%0.0%5.0%
10.0%15.0%20.0%
Jan-
12Ju
l-12
Dec
-12
May
-13
Oct
-13
Mar
-14
Aug-
14Ja
n-15
Jun-
15N
ov-1
5Ap
r-16
Oct
-16
Mar
-17
Aug-
17Ja
n-18
Jun-
18N
ov-1
8Ap
r-19
Sep-
19
Glo
bal F
ood
Pric
e In
dex
(yoy
%)
Global food prices have started inching up, which is likely to keep domestic agri prices momentum
Rural nominal wage growth has also inched up
Good rainfall, improvement in agricultural prices and increase in nominal wages bode well for rural consumption growth ahead

1.2%
19.4% 20.7%
11.0% 9.8%
62.9%
11.2%
FY15 FY16 FY17 FY18 FY19 FY20(BE)
FY20(April toAugust)
Cen
tral g
over
nmen
t rur
al s
pend
ing
(%,Y
oY)
Central government is increasing rural spending
769
981
Amounts given in FY18 andFY19 budgets
Amounts left to be disbursedFa
rm lo
an w
aive
r dis
burs
ed b
y st
ates
(IN
R b
n)
States still have to disburse 60% of farm loan waiver in next two years
Increase in disbursals by government could provide impetus to rural economy…
19
Source: RBI, State budgets, central government budget documents, Edelweiss Research. PM-KISAN: Pradhan Mantri Kisan Samman Nidhi Scheme Mahatma Gandhi National Rural Employment Guarantee Act
Government push through schemes like MGNREGA, PM-Kisan likely to improve rural growth

Slew of recent reforms / measures by Government to spur economy
Corporate tax rate has been made more competitive
Promoting manufacturing through preferential base rate of 15% corporate tax for new entities1
Reversal of proposed higher surcharge on FPI
Consolidation of PSU banks
Rs 100bn for unfinished housing projects / relaxation of ECB norms for affordable housing
Automated refund route for input tax credit on GST to release working capital for industry
Boost to exports through scheme of remission of taxes and duties on export products
RBI’s recommendation on policy-linked lending rates to improve rate transmission
20
Source :Motilal Oswal. Government Publications. Fed: Federal Reserve. PE: Price to Earning. FPI: Foreign Portfolio Investor. GST: Goods & Services Tax. ECB: External Commercial Borrowing. 1New manufacturing company must be incorporated on or after 1 October 2019, must start production before March 2023. Surcharge and cess as applicable. Tax benefits are subject to the provisions of the Income Tax Act, 1961 and are subject to amendments, from time to time. . Investors should be aware that the fiscal rules/ tax laws may change and there can be no guarantee that the current tax position may continue indefinitely. In view of individual nature of tax consequences, each investor is advised to consult his/ her own professional tax advisor.

-7.8
7% -6.2
0%-6
.33%
-4.1
7%3.
04%
1.44
%4.
35%
5.83
%10
.31%
9.72
%10
.90% 13
.90%
15.2
9%16
.10%
26.1
1%22
.30%
10.4
3%6.
72%
1.33
%
Mar
-15
Jun-
15Se
p-15
Dec
-15
Mar
-16
Jun-
16Se
p-16
Dec
-16
Mar
-17
Jun-
17Se
p-17
Dec
-17
Mar
-18
Jun-
18Se
p-18
Dec
-18
Mar
-19
Jun-
19Se
p-19
1
Nifty Sales growth (%)
Earnings – Near term pain, but tax cuts may help FY 20 earnings
21
Source: Kotak, Nifty companies Profit Growth. PAT: Profit After Tax. 1E: Estimates. CAGR: Compounded Annualised Growth Rate. EPS: Earning Per Share
-9.0
7%6.
45%
-1.5
9%-1
.39%
3.06
%0.
83%
9.63
%10
.43%
14.6
2%-7
.55%
13.5
0%12
.70%
-8.8
5%13
.00%
11.2
3%3.
33%
18.6
2%3.
11%
-6.5
4%
Mar
-15
Jun-
15Se
p-15
Dec
-15
Mar
-16
Jun-
16Se
p-16
Dec
-16
Mar
-17
Jun-
17Se
p-17
Dec
-17
Mar
-18
Jun-
18Se
p-18
Dec
-18
Mar
-19
Jun-
19Se
p-19
1
Nifty PAT Growth (%)
398
384
439 449 48
0
558
690
Mar
-15
Mar
-16
Mar
-17
Mar
-18
Mar
-19
Mar
-20
Mar
-21 11
EPS Growth
For 2Q20E, Sales and earnings growth are expected to be weak as explained by weakness in consumption demand and global commodities However for FY20E Earnings growth is expected to recover strongly led by recovery in earnings of Financials & Healthcare and corporate tax
rate cut

1.73%2.03%
2.91%
4.54%
5.29%5.73%
6.89%7.27%
5.15%5.70%
5.34%
3.83%3.78%
3.50%3.31%
2.67% 2.75%
1.71%
2.67%
Average : 4.04%
FY01
FY02
FY03
FY04
FY05
FY06
FY07
FY08
FY09
FY10
FY11
FY12
FY13
FY14
FY15
FY16
FY17
FY18
FY19
PAT (% of GDP) Average
Corporate profit as a share of GDP is lowest in more than a decade
Corporate profit as a percentage of GDP still significantly below average
22
Source: CMIE, IIFL Research. Based on a standalone financials of more than 5,500 companies are considered for FY 19, whereas from FY 01 – FY 18 it ranged from 9,000 to 22,800 companies. PAT: Profit After Tax.
Cyclically low corporate profits have significant room to recover FY19 profitability has recovered from the bottom of FY 2018 but still has a long way to reach the average

26.95
0
5
10
15
20
25
30
35
Sep-
04
Oct
-05
Nov
-06
Dec
-07
Jan-
09
Feb-
10
Feb-
11
Mar
-12
Apr-1
3
May
-14
Jun-
15
Jun-
16
Jul-1
7
Aug-
18
Sep-
19
Sensex PE Ratio (trailing twelve months)
While valuations presently are at a premium to long term average…
23
Source: MOSL, Invesco Asset Management (India) Research, Bloomberg. PE: Price to Earning. Data as on 30 September 2019
Average since September 2004 : 19.69x
Sensex continues to trade at 37% premium to long term average

-19%
-50%
-40%
-30%
-20%
-10%
0%
10%
20%
30%
40%
Jan-
06Se
p-06
May
-07
Jan-
08O
ct-0
8Ju
n-09
Feb-
10O
ct-1
0Ju
l-11
Mar
-12
Nov
-12
Jul-1
3Ap
r-14
Dec
-14
Aug-
15Ap
r-16
Dec
-16
Sep-
17M
ay-1
8Ja
n-19
Oct
-19
(Dis
coun
t) / P
rem
ium
13 Years Average: -14%
-1%
-50%
-20%
10%
40%
70%
100%
130%
160%
Jan-
06Se
p-06
May
-07
Jan-
08O
ct-0
8Ju
n-09
Feb-
10O
ct-1
0Ju
l-11
Mar
-12
Nov
-12
Jul-1
3Ap
r-14
Dec
-14
Aug-
15Ap
r-16
Dec
-16
Sep-
17M
ay-1
8Ja
n-19
Oct
-19
(Dis
coun
t) / P
rem
ium
13 Years Average: 9%
Valuation of Mid cap vs. Large Caps - trailing twelve months (Mid caps over large caps)
Valuation of Mid cap vs. Large Caps - trailing twelve months positive PE (excluding loss making companies)(Mid caps over large caps)
Mid-caps now trade at attractive valuations versus large Caps
24
Source: Invesco Asset Management (India) Research, Bloomberg, Data as on 14 October 2019. Note: Valuations are based on FY19 Price to Earning MultiplePast performance may or may not be sustained in future.
While overall valuations continue to remain challenging, Midcap Index (Nifty Midcap 100) valuation has improved and now trades at a discount of 1% as compared to 9% premium being the long term average
And if one excludes loss-making companies, midcap index trades at 19% discount to large caps as compared to 14% discount being long term average

Market Outlook
25
Global growth trends have weakened mainly due to US-China standoff. Recent central bank actions, Brexit deal andpossible US-China dispute resolution could support growth
India’s twin deficits in comfort zone; provide fiscal space to boost growth
India’s lead indicators continue to show weakness. Consumption demand remains weak but improving liquidity and continued benign trends in inflation and fall in interest rates should improve growth characteristics
Financial sector seeing fresh round of challenges, credit environment appears weak overall. Liquidity conditions have improved however, risk aversion by banks has stemmed credit flow to commercial sector
Government now using both fiscal and monetary tools to spur economy
Building blocks in place for cyclical recovery in earnings over next few years largely led by improvement in asset quality for financials and improved order inflow for Industrials. Consumption growth may exhibit weak trends in the short run
Earnings are suppressed as compared to long term average and there is scope for mean reversion. Tax rate cuts could help in improvements of earnings
The Sensex is trading at a P/E of 25.6x trailing twelve months EPS, which is a 37% premium to the long-term average. Midcap and small cap valuations are now attractive as compared to their past and offer value to investors
Our portfolio stance remains pro-cyclical; current overweight sectors include industrials and consumer discretionary. We are also turning constructive on utilities sector due to combination of falling interest rates, improved earnings trajectory and attractive valuations
Note: The sectors referred above should not be construed as recommendations from Invesco Asset Management (India) Private Limited and/or Invesco Mutual Fund. The schemes may or may not have any present or future positions in these sectors.

Disclaimer
Disclaimer: This presentation is for information purposes only and is not an offer to sell or a solicitation to buy any mutual fund units/securities. The information alone is not sufficient and shouldn’t be used for the development or implementation of an investment strategy. It should not be construed as investment advice to any party. All opinions, figures, charts/graphs and data included in this presentation are as on date and are subject to change without notice. The sectors referred in this presentation are for illustrative purposes only and should not be construed as recommendations from Invesco Asset Management (India) Private Limited and/or Invesco Mutual Fund. Schemes of Invesco Mutual Fund may or may not have any present or future positions in these sectors. The content of this document is intended solely for the use of the addressee. If you are not the addressee or the person responsible for delivering it to the addressee, any disclosure, copying, distribution or any action taken or omitted to be taken in reliance on it is prohibited and may be unlawful. The data used in this presentation is obtained by Invesco Asset Management (India) Private Limited from the sources which it considers reliable. While utmost care has been exercised while preparing this document, Invesco Asset Management (India) Private Limited does not warrant the completeness or accuracy of the information and disclaims all liabilities, losses and damages arising out of the use of this information. Neither Invesco Asset Management (India) Private Limited nor any person connected with it accepts any liability arising from the use of this information. The recipient(s) before acting on any information herein should make his/their own investigation and seek appropriate professional advice.
Mutual Fund investments are subject to market risks, read all scheme related documents carefully.
26


Get in Touch
Corporate Office:Invesco Asset Management (India) Private Limited2101 A, 21st Floor, A- Wing, Marathon Futurex, N.M. Joshi Marg, Lower Parel, Mumbai – 400 013+91 22 67310000 F +91 22 23019422
To invest:Call 1800-209-0007 ∆ sms ‘Invest’ to 56677Invest Online www.invescomutualfund.com
Follow us on