
Equity Analysis and Valuation of B&G Foods, Inc.
181
Equity Analysis and Valuation of B&G Foods, Inc. David Hall [email protected] Juan Parra-Vazquez [email protected] Olzhas Alexandrov [email protected] Taylour Bennett [email protected] Tomy Otounga [email protected] TR 12:30-1:50 class
Transcript of Equity Analysis and Valuation of B&G Foods, Inc.

Equity Analysis and Valuation of B&G Foods, Inc.
David Hall [email protected]
Juan Parra-Vazquez [email protected]
Olzhas Alexandrov [email protected]
Taylour Bennett [email protected]
Tomy Otounga [email protected]
TR 12:30-1:50 class

B&G FOODS EVALUATION 2
Table of Contents
Executive Summary of B&G Foods, Inc. 7
Industry Analysis 7
Accounting Analysis 9
Financial Analysis 10
Valuation Analysis 13
Company Overview 14
Business Products 14
Sales Volume and Growth 15
Competitors 17
Industry: Processed and Packaged Goods 17
Market Capitalization of Firm 18
Location 18
Stock Performance 19
Introduction to the Five-Force Analysis 21
Rivalry among Existing Firms 22
Threat of new Entrants 26
Threat of Substitute Products 27
Bargaining Power of Buyers 28
Bargaining Power of Suppliers 29
Industry Sales and Growth 31
Revenue 32
Market Capitalization 33
Conclusion 34
Analysis of Key Success Factors for Value Creation in the Industry 35
First Mover Advantage 35
Diversified Products 37
Lower-Input Costs 38
Retailer Relations 40
Brand Awareness 41
B&G FOODS EVALUATION 3
Conclusion 42
Cost Leadership 43
Competitive Advantage 43
Economies of Scale and Scope 44
Efficient Production 45
Simpler Product Designs 45
Low-Cost Distribution 45
Conclusion 46
Accounting Analysis 47
Key Accounting Policies 48
Type 1 Accounting Policies 49
Cost Leadership 49
Product Quality 50
Type 2 Accounting Policies 51
Research & Development 51
Goodwill 52
Assessing Key Accounting Policies 53
Accounting strategy 53
Accounting for Goodwill 54
Accounting for pension Liabiliites 55
Conclusion 57
Evaluate Accounting Strategy 57
Research and Development 58
Goodwill and Intangibles 58
Capital vs. Operating leases 59
Currency Exchange 60
Conclusion 61
Quality of Disclosure 62
Internal and External control 64
Fair Value vs. Carrying value 64
Key financial disclosure 65
B&G FOODS EVALUATION 4
Areas lacking disclosure 67
Conclusion 68
Identify Potential Red Flags 68
Asset write-offs 69
Amortization of Intangible Assets 69
Operating Leases 70
Goodwill 71
Conclusion 71
Undo Accounting Distortions 72
Goodwill Analysis Summary 74
Income Statement Restated 75
Balance Sheet Restated 78
Introduction to Financial Analysis 83
Ratio Analysis 83
Liquidity Ratios 83
Current Ratio 84
Quick Asset Ratio 85
Conclusion 86
Operating Efficiency Ratios 86
Inventory Turnover 87
Days Supply Inventory 88
Accounts Receivable Turnover 89
Days Supply Outstanding 90
Cash to Cash Cycle 91
Working Capital Turnover 92
Conclusion 93
Profitability Ratios 93
Gross Profit Margin 93
Operating Profit Margin 95
Net Profit Margin 96
Asset Turnover Ratio 97
B&G FOODS EVALUATION 5
Return on Assets 98
Return on Equity 98
Conclusion 100
Capital Structure Ratios 100
Debt to Equity 101
Times Interest Earned 102
Altman’s Z-Score 103
Internal Growth Rate 104
Sustainable Growth Rate 105
Conclusion 106
Financial Forecasting 106
Income Statement 107
Balance Sheet 110
Cash Flow Statement 114
Conclusion 117
Cost of Capital Estimation 118
Cost of Debt 119
Cost of Equity 120
WACC 124
Conclusion 126
Method of Comparables 127
PE Ratio 128
PE Trailing Ratio 129
Price to Book 130
Dividend to Price 130
P.E.G. Ratio 131
Price to EBITDA Ratio 132
Price to Free Cash Flow Ratio 133
Enterprise Value 133
Intrinsic Valuation Methods 134
Discounted Dividends 134

B&G FOODS EVALUATION 6
Discounted Free-Cash Flows 136
The Residual Income Method 138
Abnormal Earnings Approach 139
Residual Income Perpetuity 141
Works Cited 143
Appendix 145
B&G FOODS EVALUATION 7
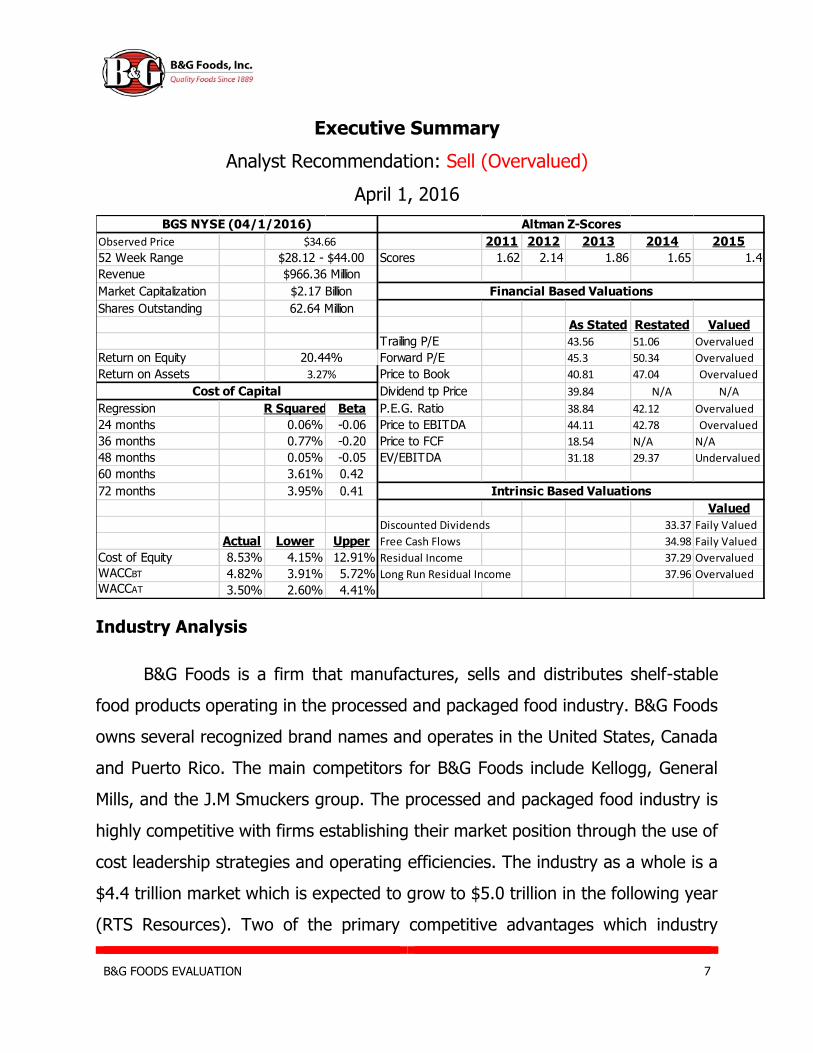
Executive Summary
Analyst Recommendation: Sell (Overvalued)
April 1, 2016
Industry Analysis
B&G Foods is a firm that manufactures, sells and distributes shelf-stable
food products operating in the processed and packaged food industry. B&G Foods
owns several recognized brand names and operates in the United States, Canada
and Puerto Rico. The main competitors for B&G Foods include Kellogg, General
Mills, and the J.M Smuckers group. The processed and packaged food industry is
highly competitive with firms establishing their market position through the use of
cost leadership strategies and operating efficiencies. The industry as a whole is a
$4.4 trillion market which is expected to grow to $5.0 trillion in the following year
(RTS Resources). Two of the primary competitive advantages which industry
Observed Price 2011 2012 2013 2014 2015
52 Week Range Scores 1.62 2.14 1.86 1.65 1.4
Revenue
Market Capitalization
Shares Outstanding
As Stated Restated Valued
Trailing P/E 43.56 51.06 Overvalued
Return on Equity Forward P/E 45.3 50.34 Overvalued
Return on Assets Price to Book 40.81 47.04 Overvalued
Dividend tp Price 39.84 N/A N/A
Regression R Squared Beta P.E.G. Ratio 38.84 42.12 Overvalued
24 months 0.06% -0.06 Price to EBITDA 44.11 42.78 Overvalued
36 months 0.77% -0.20 Price to FCF 18.54 N/A N/A
48 months 0.05% -0.05 EV/EBITDA 31.18 29.37 Undervalued
60 months 3.61% 0.42
72 months 3.95% 0.41
Valued
33.37 Faily Valued
Actual Lower Upper Free Cash Flows 34.98 Faily Valued
Cost of Equity 8.53% 4.15% 12.91% Residual Income 37.29 Overvalued
WACCBT 4.82% 3.91% 5.72% 37.96 OvervaluedWACCAT 3.50% 2.60% 4.41%
Long Run Residual Income
Discounted Dividends
Intrinsic Based Valuations
BGS NYSE (04/1/2016) Altman Z-Scores
$34.66
Financial Based Valuations
Cost of Capital
$28.12 - $44.00
$2.17 Billion
62.64 Million
$966.36 Million
20.44%
3.27%
B&G FOODS EVALUATION 8
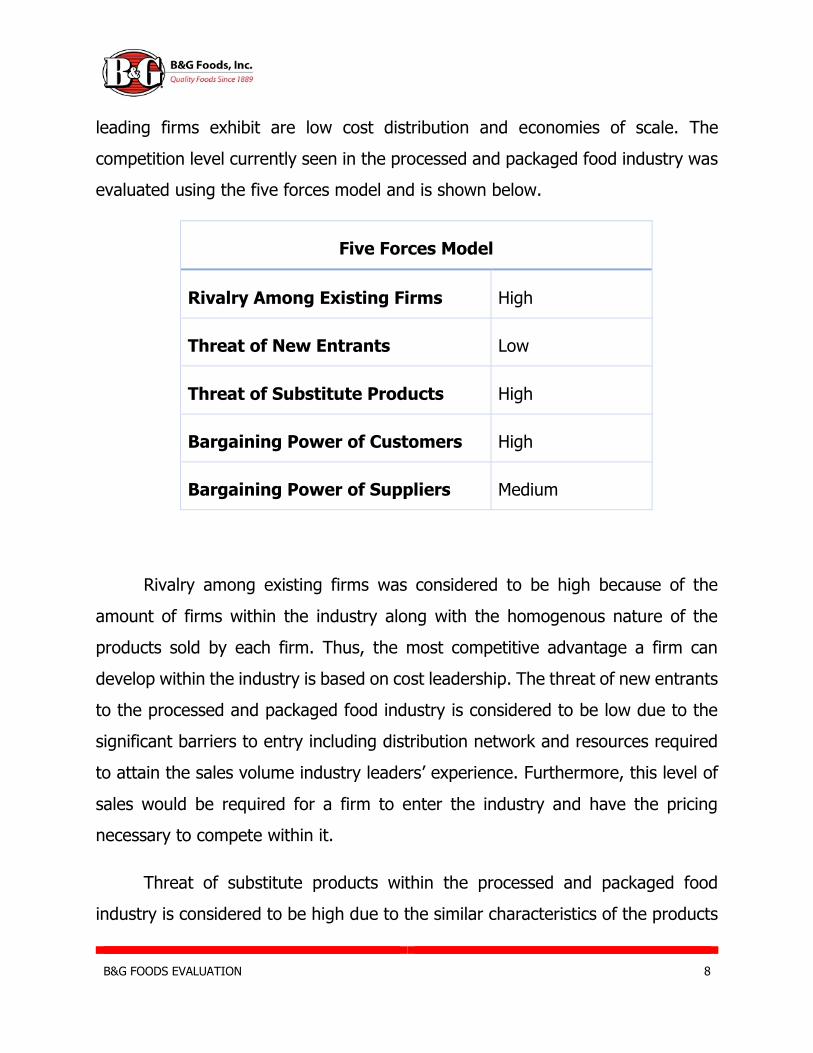
leading firms exhibit are low cost distribution and economies of scale. The
competition level currently seen in the processed and packaged food industry was
evaluated using the five forces model and is shown below.
Five Forces Model
Rivalry Among Existing Firms High
Threat of New Entrants Low
Threat of Substitute Products High
Bargaining Power of Customers High
Bargaining Power of Suppliers Medium
Rivalry among existing firms was considered to be high because of the
amount of firms within the industry along with the homogenous nature of the
products sold by each firm. Thus, the most competitive advantage a firm can
develop within the industry is based on cost leadership. The threat of new entrants
to the processed and packaged food industry is considered to be low due to the
significant barriers to entry including distribution network and resources required
to attain the sales volume industry leaders’ experience. Furthermore, this level of
sales would be required for a firm to enter the industry and have the pricing
necessary to compete within it.
Threat of substitute products within the processed and packaged food
industry is considered to be high due to the similar characteristics of the products
B&G FOODS EVALUATION 9
sold by firms. The synonymous nature of the products sold in this industry causes
the customer to seek out the lowest pricing rather than selecting a product based
on brand loyalty. Bargaining power of customers was found to be high within this
industry because of the similarity of products leading to a high availability of
substitute products. The bargaining power of the supplier is regarded as medium
primarily because of the differentiation present in the industry. Suppliers with a
larger network of clients are able to employ higher quality and lower distribution
costs therefore implementing cost leadership strategies.
After evaluating the five forces model, cost leadership proved to be the most
significant competitive advantage present in the industry. These cost leadership
strategies are achieved through the use of low cost distribution, economies of scale
and inventory management.
Accounting Analysis
In order to find the value of a company, it is necessary to look at key accounting
policies and how they affect the overall financials of the firm. Variability exists in
the reporting of key accounting policies as the Generally Accepted Accounting
Policies allows for it. This can drastically affect how a firm is valued and thus,
whether it is over or undervalued.
The amount a firm discloses in its financial reporting affects how assuredly a firm
can be accurately valued. By evaluating B&G Foods type 1 accounting policies, the
key success factors of the industry, and type 2 accounting policies, regarding
operating leases, we were able to determine possible red flag accounting policies
that could affect B&G Foods’ valuation.
B&G FOODS EVALUATION 10
Type 1 accounting policies dealt with the key success factors of firms in the
industry. B&G Foods has good disclosure of type 1 accounting policies in that they
meet or exceed the industry standard in information reported. Type 2 accounting
policies dealt with the disclosure of operating lease structures. B&G Foods had a
substantial amount of goodwill when compared to net fixed assets, which was thus
analyzed further for distortion. We found that B&G Foods’ goodwill needed to be
restated to accurately value the company. Overall, B&G Foods had a relatively low
amount of disclosure related to type 2 accounting policies.
Since goodwill is over 20% of net fixed assets, we had to restate the
financials to accurately display goodwill. In order to do so, we amortized goodwill
over a five year period. By doing so, we were able to restate the goodwill later in
the report, leading to higher disclosure allowing us to more accurately value the
firm. Due to the lack of financial disclosure in type 2 accounting policies, we found
that we could not accurately value B&G Foods. Therefore, it was necessary to
restate the financial statements to find an accurate valuation of the company.
Financial Analysis
Conducting a financial analysis of a firm consists of evaluating their liquidity,
profitability and capital structure ratios in order to assess their performance
relative to their benchmark competitors. Liquidity ratios are used to determine a
firm’s ability to repay their obligations in case they experience an unfavorable
economic event. The liquidity ratios we used include the quick asset, current,
inventory turnover, accounts receivable turnover, days’ supply inventory, accounts
receivable days, cash to cash cycle, and working capital turnover. Below is a table
listing B&G Foods’ standing in each of the liquidity ratios along with their relative
competitors.
B&G FOODS EVALUATION 11
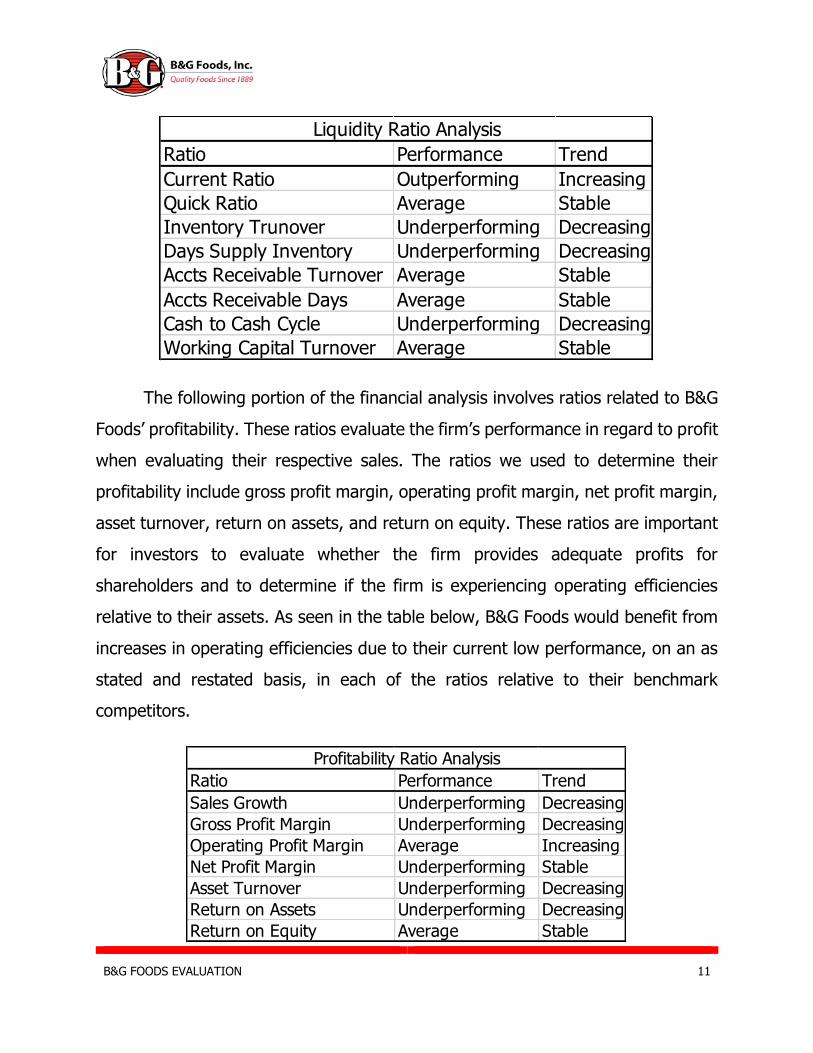
The following portion of the financial analysis involves ratios related to B&G
Foods’ profitability. These ratios evaluate the firm’s performance in regard to profit
when evaluating their respective sales. The ratios we used to determine their
profitability include gross profit margin, operating profit margin, net profit margin,
asset turnover, return on assets, and return on equity. These ratios are important
for investors to evaluate whether the firm provides adequate profits for
shareholders and to determine if the firm is experiencing operating efficiencies
relative to their assets. As seen in the table below, B&G Foods would benefit from
increases in operating efficiencies due to their current low performance, on an as
stated and restated basis, in each of the ratios relative to their benchmark
competitors.
Ratio Performance Trend
Current Ratio Outperforming Increasing
Quick Ratio Average Stable
Inventory Trunover Underperforming Decreasing
Days Supply Inventory Underperforming Decreasing
Accts Receivable Turnover Average Stable
Accts Receivable Days Average Stable
Cash to Cash Cycle Underperforming Decreasing
Working Capital Turnover Average Stable
Liquidity Ratio Analysis
Ratio Performance Trend
Sales Growth Underperforming Decreasing
Gross Profit Margin Underperforming Decreasing
Operating Profit Margin Average Increasing
Net Profit Margin Underperforming Stable
Asset Turnover Underperforming Decreasing
Return on Assets Underperforming Decreasing
Return on Equity Average Stable
Profitability Ratio Analysis

B&G FOODS EVALUATION 12
The final step in completing the financial analysis for B&G Foods involves
evaluating how the firm finances their assets. This portion of the financial analysis
is used to see what mix of debt financing and equity financing the firm is currently
using. The ratios we used to evaluate B&G Foods’ capital structure include debt to
equity, times interest earned and Altman’s Z-Score. Debt financing is considered
to be riskier for a firm due to the pressure to meet interest payments and avoid
bankruptcy. The Altman’s Z-Score is used to determine a firm’s bankruptcy
likelihood. Scores below 1.8 indicate the firm is likely to experience bankruptcy,
and scores above 3.0 indicate that the firm is unlikely to face bankruptcy. As seen
below, B&G Foods has historically maintained a low Altman Z-Score and also seems
to be underperforming their benchmark competitors in some of these capital
structure metrics.
Valuation Analysis
In order to conduct the valuation analysis two major valuation methods are
used: the method of comparables and the intrinsic models of valuation. The
intrinsic models of valuation are more accurate and reliable than the method of
comparables overall. Our team conducted the analysis based on the stock price on
April 1, 2016; its price at the moment was $34.66 per share. The method of
comparables consists of 8 different processes (shown in the following table) with
Ratio Performance Trend
Debt to Equity Average Increasing
Times Interest Earned Underperforming Stable
Altman's Z-Score Underperforming Stable
Capital Structure Ratio Analysis
B&G FOODS EVALUATION 13
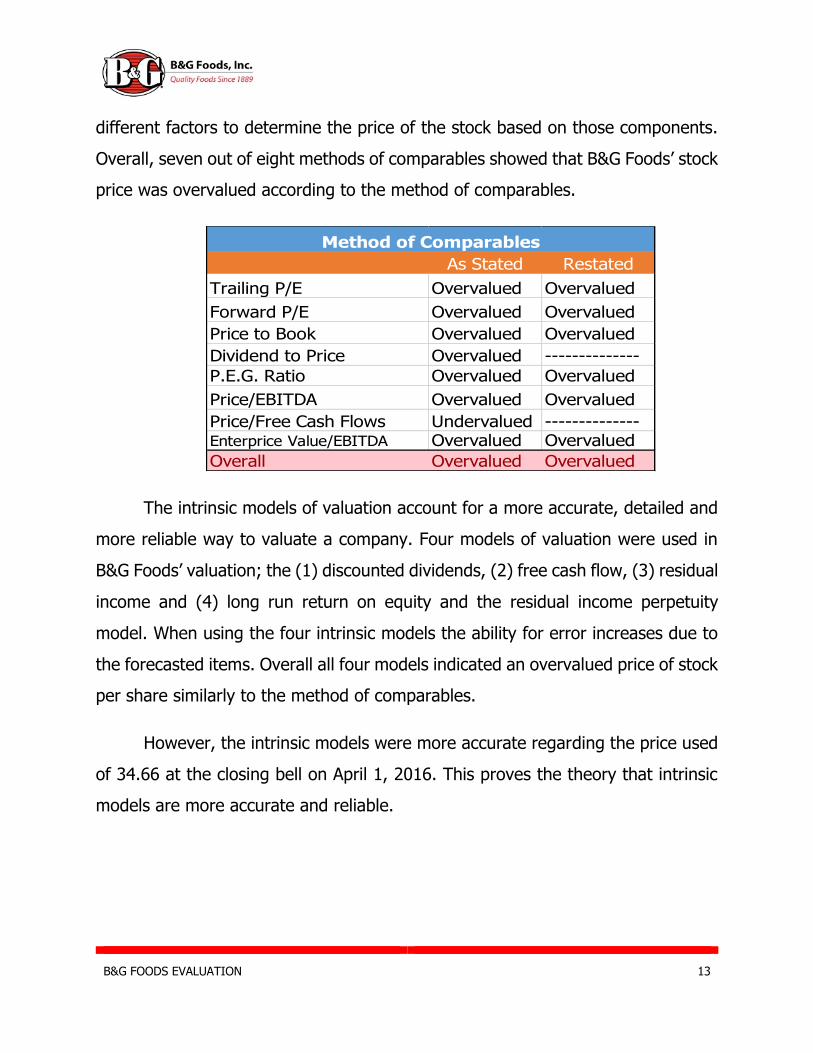
different factors to determine the price of the stock based on those components.
Overall, seven out of eight methods of comparables showed that B&G Foods’ stock
price was overvalued according to the method of comparables.
The intrinsic models of valuation account for a more accurate, detailed and
more reliable way to valuate a company. Four models of valuation were used in
B&G Foods’ valuation; the (1) discounted dividends, (2) free cash flow, (3) residual
income and (4) long run return on equity and the residual income perpetuity
model. When using the four intrinsic models the ability for error increases due to
the forecasted items. Overall all four models indicated an overvalued price of stock
per share similarly to the method of comparables.
However, the intrinsic models were more accurate regarding the price used
of 34.66 at the closing bell on April 1, 2016. This proves the theory that intrinsic
models are more accurate and reliable.
As Stated Restated
Trailing P/E Overvalued Overvalued
Forward P/E Overvalued Overvalued
Price to Book Overvalued Overvalued
Dividend to Price Overvalued --------------
P.E.G. Ratio Overvalued Overvalued
Price/EBITDA Overvalued Overvalued
Price/Free Cash Flows Undervalued --------------Enterprice Value/EBITDA Overvalued Overvalued
Overall Overvalued Overvalued
Method of Comparables
B&G FOODS EVALUATION 14
Company Overview
B&G Foods, Inc. is a parent holding company that operates as a
manufacturer, distributor, and seller of a variety of shelf-stable food products
under several recognized brand names. B&G Foods, along with its wholly owned
subsidiaries operates in the United States, Canada and Puerto Rico. B&G Foods
has been in business for over 125 years. The company originally started as a street
market in Manhattan, New York at the end of the 19th century under the
supervision of the Bloch & Guggenheimer families; that is where the actual name
is derived from (B&G). The company joined the New York Stock Exchange (NYSE)
on May 23, 2007 under the ticker “BGS,” the company is headquartered in
Parsippany, New Jersey, B&G Foods’ fiscal year ends on December 31, or the
Saturday closest. (B&G Foods 10-K.)
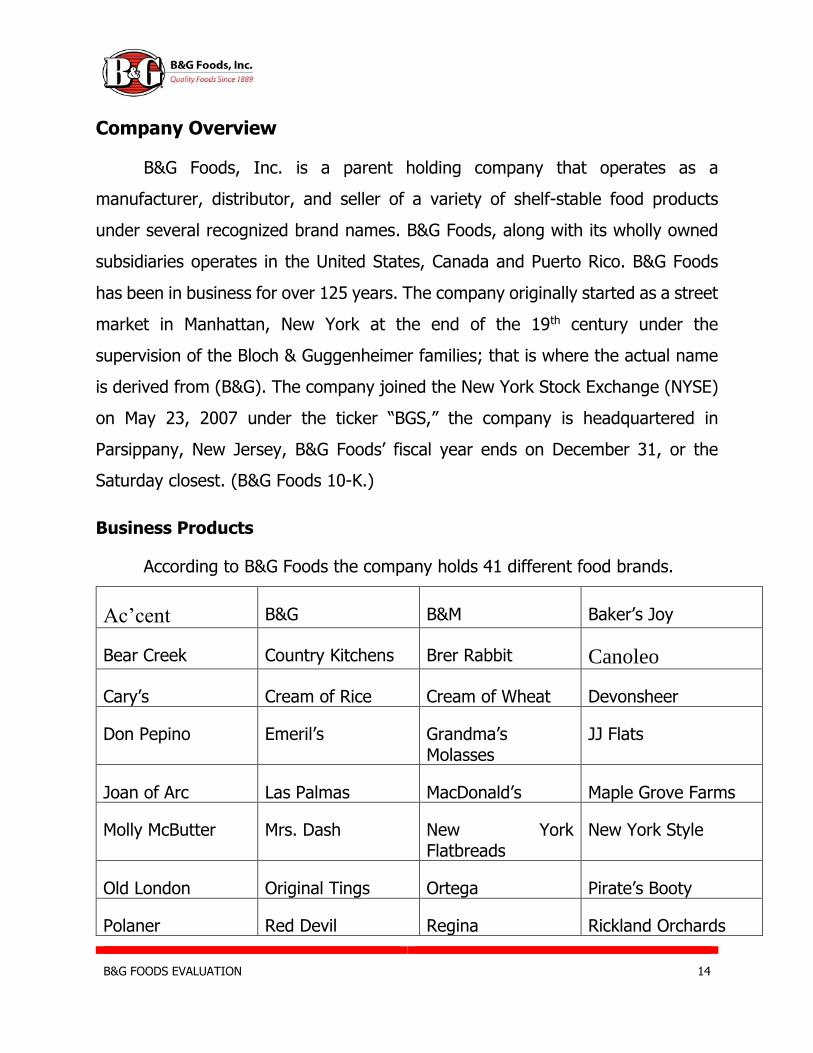
Business Products
According to B&G Foods the company holds 41 different food brands.
Ac’cent B&G B&M Baker’s Joy
Bear Creek Country Kitchens Brer Rabbit Canoleo
Cary’s Cream of Rice Cream of Wheat Devonsheer
Don Pepino Emeril’s Grandma’s Molasses
JJ Flats
Joan of Arc Las Palmas MacDonald’s Maple Grove Farms
Molly McButter Mrs. Dash New York Flatbreads
New York Style
Old London Original Tings Ortega Pirate’s Booty
Polaner Red Devil Regina Rickland Orchards
B&G FOODS EVALUATION 15
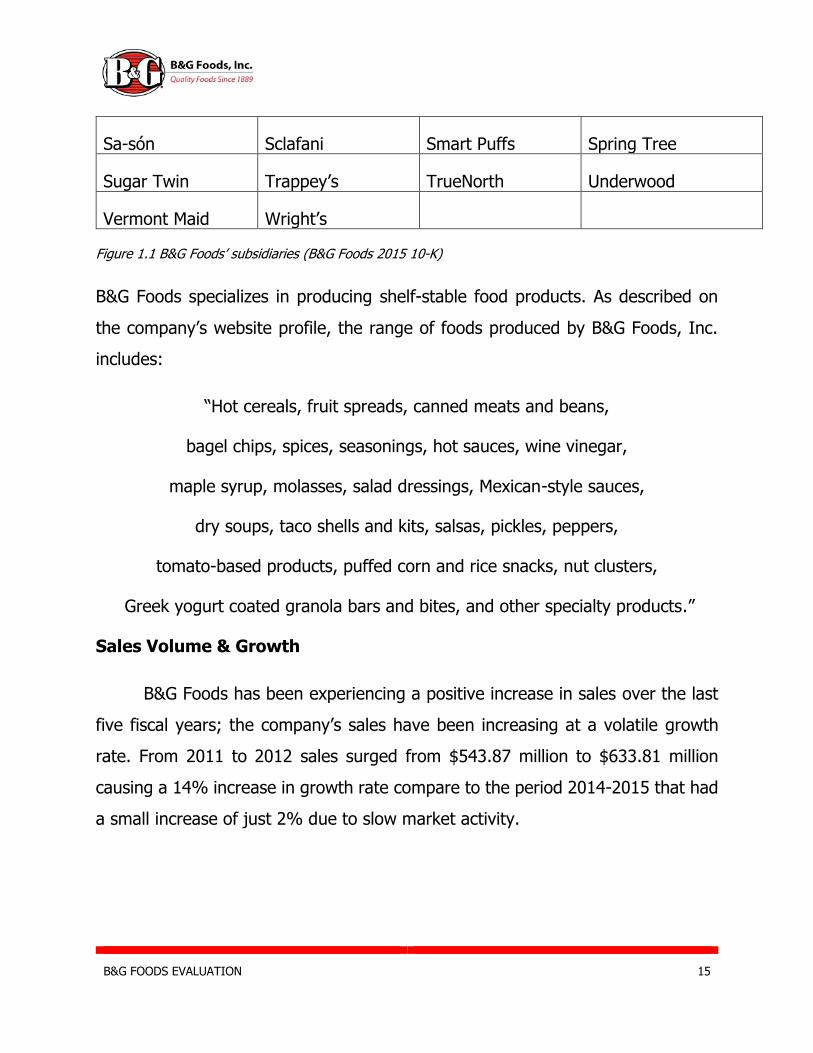
Sa-són Sclafani Smart Puffs Spring Tree
Sugar Twin Trappey’s TrueNorth Underwood
Vermont Maid Wright’s
Figure 1.1 B&G Foods’ subsidiaries (B&G Foods 2015 10-K)
B&G Foods specializes in producing shelf-stable food products. As described on
the company’s website profile, the range of foods produced by B&G Foods, Inc.
includes:
“Hot cereals, fruit spreads, canned meats and beans,
bagel chips, spices, seasonings, hot sauces, wine vinegar,
maple syrup, molasses, salad dressings, Mexican-style sauces,
dry soups, taco shells and kits, salsas, pickles, peppers,
tomato-based products, puffed corn and rice snacks, nut clusters,
Greek yogurt coated granola bars and bites, and other specialty products.”
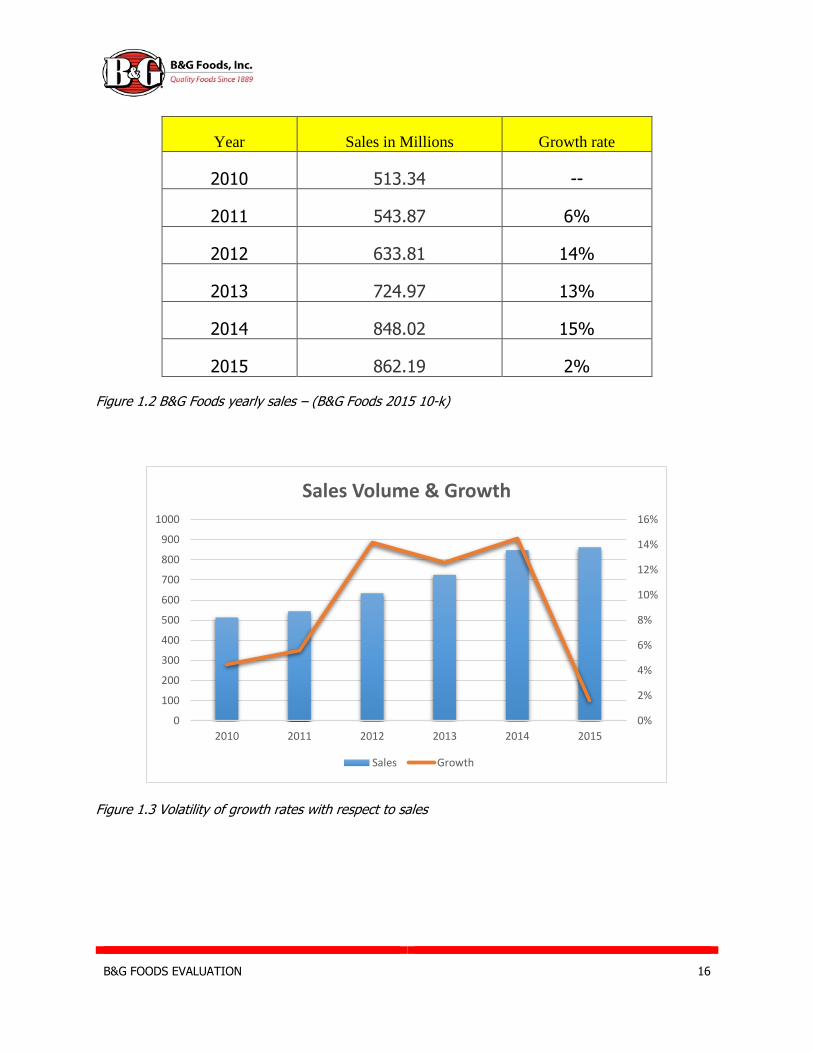
Sales Volume & Growth
B&G Foods has been experiencing a positive increase in sales over the last
five fiscal years; the company’s sales have been increasing at a volatile growth
rate. From 2011 to 2012 sales surged from $543.87 million to $633.81 million
causing a 14% increase in growth rate compare to the period 2014-2015 that had
a small increase of just 2% due to slow market activity.
B&G FOODS EVALUATION 16
Year Sales in Millions Growth rate
2010 513.34 --
2011 543.87 6%
2012 633.81 14%
2013 724.97 13%
2014 848.02 15%
2015 862.19 2%
Figure 1.2 B&G Foods yearly sales – (B&G Foods 2015 10-k)
Figure 1.3 Volatility of growth rates with respect to sales
0%
2%
4%
6%
8%
10%
12%
14%
16%
0
100
200
300
400
500
600
700
800
900
1000
2010 2011 2012 2013 2014 2015
Sales Volume & Growth
Sales Growth
B&G FOODS EVALUATION 17
Competitors
B&G Foods operates as a supplier in processed and packaged goods
industry, an industry that is characterized by the high degree of competition among
firms; moreover, the profit margin rarely exceeds above 30% (Food Industry
Costs, Profits, and Productivity.)
B&G Foods’ direct market competitors are (1) The J.M. Smucker Company
(SJM), (2) General Mills (GIS), Inc. and (3) The Seneca Food Corporation (SENEA).
B&G Foods’ competitors are subsidiaries holders similar to B&G Foods. All three
competitors offer a wide range of shelf-stable products very similar to those of
B&G Foods. Substitute products are extremely common within the food industry.
Nonetheless, food is the most basic product people consume, and the demand for
food and beverages continues to increase year after year because it is directly
linked to the growth rate of the population as a whole.
Industry: Processed and Packaged Goods
The Processed and Packaged Goods industry is a $4.4 trillion market that
will expand to $5.0 trillion in the following year (RTS Resources.) The processed
and packaged goods industry consists of enclosed food products, a variety of
different materials is used to enclose said products; ranging from plastic to
aluminum canning to preserve the goods for a long period of time. As previously
mentioned the processed and packaged goods industry is correlated to economic
growth, disposable income and population growth.

B&G FOODS EVALUATION 18
Market Capitalization of Firm
Firms are classified as either small, medium or large sized caps. A small-
sized firm has a market value of less than $2.0 Billion, a medium-sized firm has a
market value of more than $2.0 Billion but less than $10.0 Billion. Moreover, a
large-sized has a market value of more than $2.0 Billion but less than $10.0 Billion
(The Mutual Fund Store.) Based on the previous information, and by implementing
the market capitalization formula (Market Price per share x No. of Shares
Outstanding) B&G Foods is worth $2.04 Billion. Therefore, the company is
classified as a medium-sized cap.
Location
B&G Foods’ headquarters are located in Parsippany, New Jersey; the
company operates seven manufacturing facilities of which six are corporately
owned and only one is leased. B&G Foods’ seven manufacturing facilities serve as
warehouse/storage deposits as well.
As seen in the company’s latest “10-K” the manufacturing/warehouse
facilities, distribution centers, headquarters and the sales office (which is required
by “Wal-Mart” located in Bentonville, Arkansas) are located in the following cities.

B&G FOODS EVALUATION 19
Figure 1.4 B&G Foods facilities across the country – (B&G Foods 10-k)
Stock Performance
On May 23, 2007 B&G Foods conducted their Initial Public Offering (IPO)
with the New York Stock Exchange (NYSE). With an initial selling price of $13.60.
The company hit its lowest stock price of $2.56 on October 19, 2008 as a
consequence of the Subprime Mortgage Crisis. Nonetheless, the stock has
maintained an average growth rate of about 38.89% a year ever since 2008;
leading to the current price of $35.44.
B&G FOODS EVALUATION 20
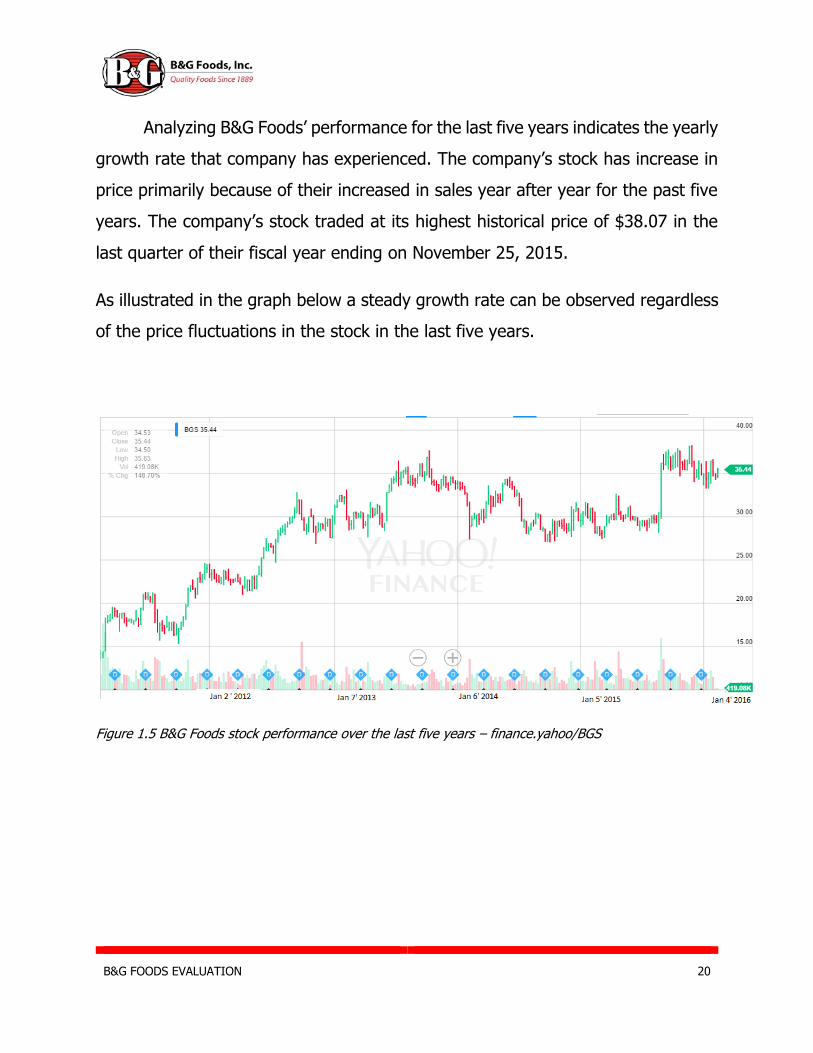
Analyzing B&G Foods’ performance for the last five years indicates the yearly
growth rate that company has experienced. The company’s stock has increase in
price primarily because of their increased in sales year after year for the past five
years. The company’s stock traded at its highest historical price of $38.07 in the
last quarter of their fiscal year ending on November 25, 2015.
As illustrated in the graph below a steady growth rate can be observed regardless
of the price fluctuations in the stock in the last five years.
Figure 1.5 B&G Foods stock performance over the last five years – finance.yahoo/BGS
B&G FOODS EVALUATION 21
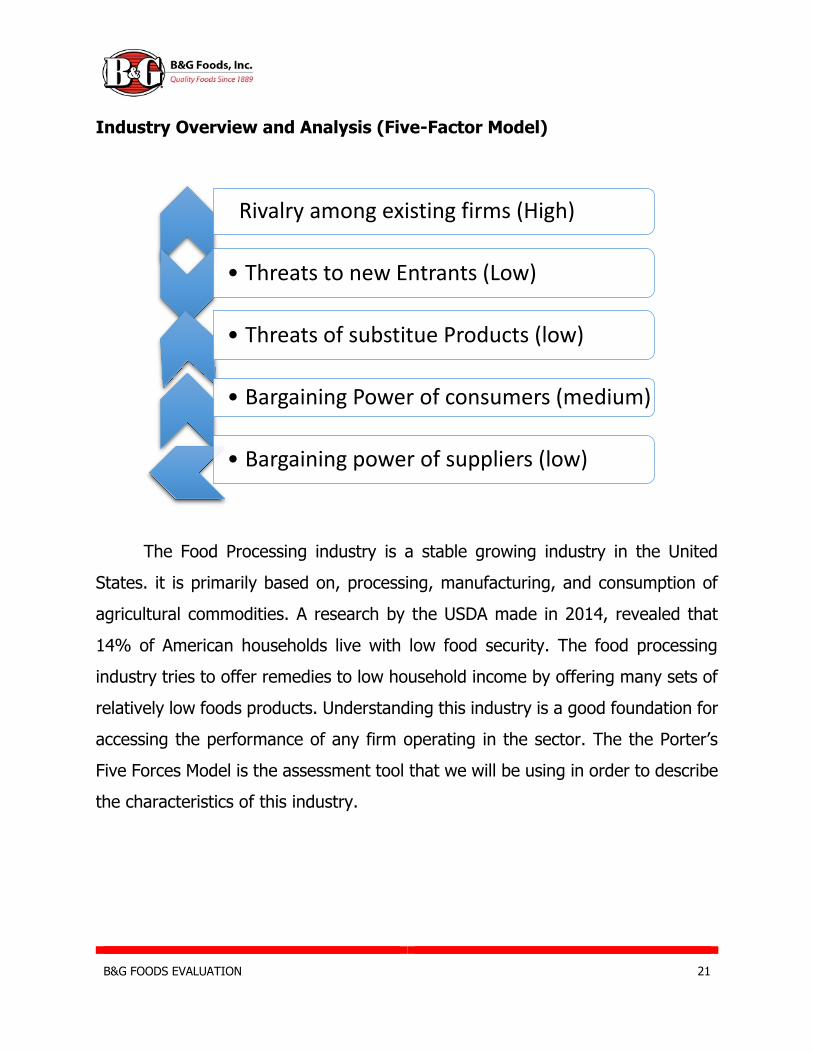
Industry Overview and Analysis (Five-Factor Model)
The Food Processing industry is a stable growing industry in the United
States. it is primarily based on, processing, manufacturing, and consumption of
agricultural commodities. A research by the USDA made in 2014, revealed that
14% of American households live with low food security. The food processing
industry tries to offer remedies to low household income by offering many sets of
relatively low foods products. Understanding this industry is a good foundation for
accessing the performance of any firm operating in the sector. The the Porter’s
Five Forces Model is the assessment tool that we will be using in order to describe
the characteristics of this industry.
Rivalry among existing firms (High)
• Threats to new Entrants (Low)
• Threats of substitue Products (low)
• Bargaining Power of consumers (medium)
• Bargaining power of suppliers (low)
B&G FOODS EVALUATION 22
Rivalry Among existing firms
The degree of rivalry among firms is the most viable scenario for an efficient
use of resources. The economic conditions of the US have shaped the food
processing industry as highly competitive sector. The industry is mainly Business
to Business, therefore firms need to battle to promote their products with whole
sellers and create healthy relationship with both distributors and suppliers. In their
2014 10-k under their competition section, B&G Foods one of the competitor in
the industry briefly explain the role of competition in their sector: “We face
competition in each of our product lines. Numerous brands and products compete
for shelf space and sales, with competition based primarily on product quality,
convenience, price, trade promotion, consumer promotion, brand recognition and
loyalty, customer service, advertising and other activities and the ability to identify
and satisfy emerging consumer preferences.” They talked about key success
factors that help a company stay in business in a very competitive industry.
This creates an environment where were no firm has a real advantage
resulting in low concentration, because no competitor is holding most of the
market share. All the competitors have a decent share in the market.
Switching cost
In the Food processing sector, the switching cost is relatively low, because
companies who charge higher price are most likely to be pushed out of the market
by customers purchasing competitors’ products of the same value at lower price.
The size of company in this industry is very important because it helps firms
increase their share of the market and reducing their costs (economy of scale).
Therefore, Companies need to be Efficient and effective to make profit.
B&G FOODS EVALUATION 23
Small companies are less likely to weaken bigger companies position in the short
run, but they are most likely to be acquired or absorb by with larger companies in
the long term. Merging and Acquiring give company a marketing advantage. Here
is a small selection of brand offered under the same companies (B&G Foods and
General Mills).
B&G Foods brands:” Certain of our brands, including Cream of Wheat,
Ac'cent, Crock Pot seasoning mixes, Underwood, Polaner, Static
Guard, Mrs. Dash, New York Style, Sugar Twin and Rickland Orchards…”
General Mills’ brands: ” Green Giant, Uncle Toby’s, Mountain High, el
Paso, Yoki, Häagen-Dazs, Pillsbury, Totino’s, Progresso, Green Giant, Yoplait
etc.”
By having different brand and products, companies take a step ahead
reducing the effect of switching cost.
In highly competitive industries often provides customers with a set of pretty
similar products, which is the case in this industry where companies have pretty
homogenous products (Low differentiation). It mainly causes the industry have
low differentiation. We’ve selected 4 firms in the industry, and we’ve found that in
all their 10-Ks, they all cited Wal-Mart as one of their most active buyers at roughly
22% of their sales on average.

B&G FOODS EVALUATION 24
percentage of sale by Wal-Mart
B&G Foods 19%
JM Smucker 27%
General Mills 21%
Kellogg 21%
average 22%
Which shows the level of competition in this industry is such that no
company has a real advantage over the other ones’. It also show that there is a
consistency in Walmart purchases of their products with.
Fixed Cost
As manufacturer, most of the fixed cost will come from Property plants and equipment’s
(warehouse, Machinery, land etc.).
PPE Total Assets PPE/TA
Kellogg 3,769 15,153 24.87%
B&G Foods 116 1649 7.04%
General Mils
3,783.30 21,964.50 17.22%
Average 16.38%
B&G FOODS EVALUATION 25
We created a table showing property, Plants, and equipment as a
percentage of Total assets in order to have a better assessment of the fixed costs.
We’ve learned that Net PPE represent on average 16.5% of total Assets with
intangible assets excluded. It shows that this industry relies on fixed costs to
reduce their productions costs while having a high level of output.
Variable costs will be mainly influence by the commodities market and his
fluctuations. The use of futures and forward contracts regarding commodities
comes very handy. In Kellogg 10-K for example, they state that:” The cost of such
commodities may fluctuate widely due to government policy and regulation,
weather conditions, climate change or other unforeseen circumstances.” How can
companies reduce risk from the commodities market? By locking a price in with
forward and futures contracts, companies can protect themselves from price
increase. Relationship with suppliers (contracts) is a big determinant of how
efficient a company is, because it helps control the risk from the commodities
market.
The exit barriers for the food industry are very reasonable exit costs. Most
of them comes from long term liabilities, intangible assets (Goodwill, copyrights
etc.) For example, Kellogg had approximately $5.9 Billions in long term liabilities,
Goodwill of 5.9 Billion and about $2.3 billions in intangible assets (Kellogg’ 2015
10-k page 39). Another example, General Mills had about $7.6 billions of long term
liabilities, Goodwill of $8.9Billions, and 4.7 of intangible Assets (general Mills’ 2015
10k page 53.) Those are components that make it, in those particular cases, a
relatively thoughtful process. It is important that the size of the company is
important, the bigger the company, the higher the exits barrier for those specific
companies.
B&G FOODS EVALUATION 26
Conclusion
The industry where B&G Foods operates is highly competitive. Companies
in this industry have competition in every product line. The industry has a low
concentration, meaning that all firms have no real advantages.
The switching cost is relatively low; it happens due to the inability of
suppliers to charge higher for the same goods. Otherwise, they would be pushed
out of the market since customers would simply purchase goods of other
companies. This leads us to the conclusion that this industry has a low
differentiation.
The fixed costs come primarily from the plants and equipment (warehouse,
machinery, land, etc.). The exit barriers for the food industry go in accordance
with the size of a company. Overall, we present affirm that this industry is
characterized by a high degree of competition.
Threats to New Entrant
In highly competitive industries, the level of threats to new entrants is relatively low,
because of the homogeneity of production throughout the industry. The size of a company often
determines how effectively the entrance of a new company in the market can affect the position
of existing companies. For example, B&G Food has a relatively good share in the US market ($1.7
Billion company) won’t really feel the presence of a new startup company in short run, but in the
long run the market “self-structured” which means the market adjust itself as the startup company
grows. The first mover advantage is low in this industry, but it is attainable through Research and
development (R&D). Companies in the industry are allocating budget in this sense with General
Mills spending $229millions in 2014, $199millions in 2014. New technologies to produce higher
quality products at lower cost for example, a company can differentiate itself for a short term,
but in the long term his competitors will have to update their resources to avoid lost sales.

B&G FOODS EVALUATION 27
The most difficult for new entrants will be contract with suppliers and platforms to display
their products, which can be very complicated for new entrants, how to increase their share? and
how does customers and distributors react to a new brand in a perfectly competitive industry?
Those are two questions that new entrants tend to answer throughout their business strategy
while entering the market.
The Food industry is a highly regulated industry due to the relationship between food and
health. Compliance to all those departments, government and agencies can make it a long process
for a new competitor to enter the market and to quickly compete effectively. In their 2015 10-K
B&G Foods makes statement about all the agencies that they need to comply to: “As a
manufacturer and marketer of food and household products, our operations are subject to
extensive regulation by the United States Food and Drug Administration (FDA), the United States
Department of Agriculture (USDA), the Federal Trade Commission (FTC), the Consumer Product
Safety … federal, state, local and foreign authorities. In addition, our meat processing operation
in Portland, Maine is subject to daily inspection by the USDA.” Which states the amount of
regulations in the Food processing industry.
Conclusion
Since the industry is highly competitive, the threats to new entrants is relatively low. The
main threats are the necessity to find platforms for product distribution and the logistics between
a supplier of raw materials and the marketplace. The industry is highly regulated, and Innovation
may help a company to earn economic profit, but in the long run every other competitor will
follow. The first mover advantage in the industry is not significant: First mover advantage is
relatively low.
Threats of substitute products
The treats to substitute represents the alternative products available to consumers that
are relatively capable of offering the same or really close amount of satisfaction. Their willingness
to switch often depends on the trade off from the evaluation of alternatives and the actual
product. In this industry, The Threats of substitute is relatively low, because it is commodity
based industry. There are few alternatives available to consumers. One would to produce
B&G FOODS EVALUATION 28
themselves what they will consumes as food, another one would be to take whatever is available.
A major discovery in R&D for example, could also create new products that could negatively affect
the demand for the Processed and packaged goods.
Consumers’ willingness is mainly based on price and incentives (coupon, discount, loyalty
program) that the market offers to make their products more appealing to consumers. One more
threat could be the decrease in price of healthy and organic food, with more and more awareness
in this sense, the healthy and organic interest group could possibly in the long-term represent a
serious threat to the processed food industry.
Conclusion
The threats of substitute products represent the alternatives available to the consumers that can
provide them with the same satisfaction. We found that a threat to substitutes will be the price
because it is a incentives for consumers to guide their consumption for specific products. In this
sense, the threat for substitutes products is actually low, because there is no actual alternative
beside consumers growing their own that can represent a direct threat to the processed food
industry.
Bargaining Power of Buyers
The buyers’ ability to drive price come from his ability to substitute products (low switching
cost) and influence firms’ revenues by decreasing sales is medium. Buyers are the core of any
business activities, therefore they play a huge role in the survival of businesses. Consumers could
influence the market by dragging the price low, thus reducing the profit margin of the firms. For
the Food industry, there is an interdependence between the consumers’ needs (primary need:
eat) and business opportunities. Which make this industry pretty stable and sustainable in long
run. For example, B&G Foods had an increase in sales in the United stated by 4.1% (2015 10-K
page 23). There will always be a demand for Food. There is an infinite consumer’s base, but
consumption processing food depends also on the geographic location of consumers.
B&G FOODS EVALUATION 29
Conclusion
Buyers have the ability to drive prices due to a variety of different suppliers and the low
potential switching costs between them. However, since there is always need for food, the buyers
still cannot push the reasonable degree of prices in this industry. There is a mutual interest
between the businesses, trying to make profits, and the consumers trying to feed themselves by
meeting their foods’ expectation. Overall the bargaining power of the buyers is medium, because
still considerable, but can definitely be overcome, because of the necessity of consumers to feed
themselves.
Bargaining Power of Suppliers
Looking at Supply chain, Suppliers play a major role in providing resources for businesses
to provide consumers with quality products. The decision of choosing a supplier is very important,
because the quality of your raw materials will affect the quality of the products produced. The
demand for food is slowly but very sustainably growing over the last years (Graph SALES
GROWTH).
In the Supplier side, the industry is very competitive, so it requires firms to have a large
amount of suppliers to try to reduce cost and most important reduce the risk of raw material
shortages. “The amount of bargaining power of suppliers can also be determined by their
geographic location. Which is very relevant in the effectiveness of companies’ supply chain, and
it can definitely reduce their production costs. “Kellogg in their 2015 10-K explains how they get
raw materials: “The principal ingredients in the products produced by us in the United States
include corn grits, wheat and wheat derivatives, potato flakes, oats, rice, cocoa and chocolate,
soybeans and soybean derivatives, various fruits, sweeteners, vegetable oils, dairy products,
eggs, and other filling ingredients, which are obtained from various sources.”
They produce some of their raw material in order to have better control on supplies.
The quality may vary from places to places. On this end, firms must maintain a certain
standard of quality in order to meet consumers’ expectations. For example, the beef produce in
Venezuela won’t necessarily have the same characteristics as the beef produce in West.
B&G FOODS EVALUATION 30
In a competitive market, a significant way by which businesses can hedge risk and improve
revenues is by being cost efficient while delivering the highest quality product possible. Those
are assessments needed for businesses to determine the choice of suppliers.
Accessing the number of suppliers in the market is nearly impossible to do, but Food
processing industry’s suppliers works in Associations, who mainly in the American continent, but
also internationally. The goal of those associations of suppliers is to facilitate connection between
food manufacturers and suppliers. For US industry those associations regroup suppliers from the
Americas mainly (Canada, Mexico, Puerto Rico etc.)
Conclusion
In this industry, there is a large amounts of suppliers, but companies can
also effectively grow (Commodities) their own raw materials, or even more
reasonably, produce and buy some of it just like Kellogg. On the other end, there
is a significant trade off that is largely influence by the business decisions of the
firm when deciding on which business strategy to use (Make or Buy). In this sector
of the food market, the bargaining power of suppliers is relatively low due to the
fact that companies might prefer the buying alternative because it gives more
variety of choice in term of quality, and more flexibility to switch from one supplier
to another one.
Conclusion
Finally, we can deduct that the Food and packaged good industry is a
competitive market that is characterized under the fives forces model by the
following aspects: low differentiation, low concentration, low threats to substitute,
medium bargaining powers of consumers, and finally low bargaining powers of
suppliers. there are relatively low barriers to entry. The first mover advantage
creates economic profit in the short run, not the long run. The barriers to exit are
medium due to some important usage properties, plant, and equipment needed
B&G FOODS EVALUATION 31
for the manufacturing process. Regardless of their importance in the business
activities, companies in the industry are price takers, most of the bargaining power
comes from consumers’ influence over the price, then Companies, and suppliers
comes last. Regardless of their importance in the business cycle of companies,
Suppliers bargaining remains low, because there are alternatives available on the
market weaken their influence in this industry.
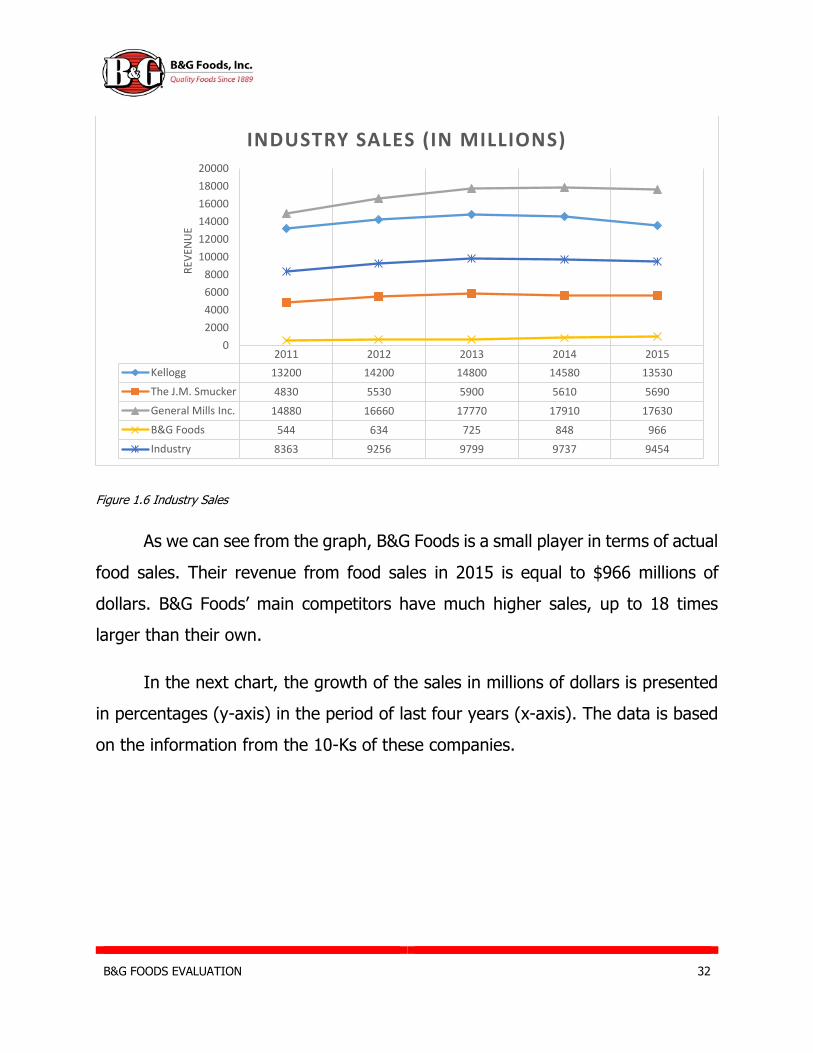
Industry Sales and Growth
The industry sales and growth are analyzed based on the revenue of
companies in the processed and packaged goods industry. The data is obtained
from the 10-Ks of B&G Foods and their competitors.
In the following scatter graph, we evaluate the revenue of the four
companies (y-axis), in the last five years (x-axis). It is important to emphasize that
despite having much more sales in terms of value of the sold items, it does not
necessarily mean that one company is performing better than the other.
According to Yahoo! Finance, the main competitors of B&G Foods are
General Mills Inc. (GIS), The J. M. Smucker Company (SJM), and Kellogg.
The industry data is the average of these four firms.
B&G FOODS EVALUATION 32
Figure 1.6 Industry Sales
As we can see from the graph, B&G Foods is a small player in terms of actual
food sales. Their revenue from food sales in 2015 is equal to $966 millions of
dollars. B&G Foods’ main competitors have much higher sales, up to 18 times
larger than their own.
In the next chart, the growth of the sales in millions of dollars is presented
in percentages (y-axis) in the period of last four years (x-axis). The data is based
on the information from the 10-Ks of these companies.
2011 2012 2013 2014 2015
Kellogg 13200 14200 14800 14580 13530
The J.M. Smucker 4830 5530 5900 5610 5690
General Mills Inc. 14880 16660 17770 17910 17630
B&G Foods 544 634 725 848 966
Industry 8363 9256 9799 9737 9454
0
2000
4000
6000
8000
10000
12000
14000
16000
18000
20000
REV
ENU
E
INDUSTRY SALES (IN MILLIONS)

B&G FOODS EVALUATION 33
Figure 1.7 Sales Growth
It is a growing industry, and the data shows that in the past five years, the
sales have been growing with a period of stagnation between 2014 and 2015. On
the other hand, the B&G Foods demonstrates growing sales in the last four years.
These facts lead us to an optimistic view of the future developments of the B&G
Foods.
Market Capitalization
In this section, market capitalization is analyzed based on the data gathered
from Yahoo! Finance.Investors use market capitalization, also called as market
cap, to understand how big a company is, which is composed of the number of
outstanding shares times stock price.
2012 2013 2014 2015
Kellogg 7.58% 4.23% -1.49% -7.20%
The J.M. Smucker 14.49% 6.69% -4.92% 1.43%
General Mills Inc. 11.96% 6.66% 0.79% -1.56%
B&G Foods 16.54% 14.38% 16.97% 13.95%
Industry 10.67% 5.86% -0.63% -2.91%
-10.00%
-5.00%
0.00%
5.00%
10.00%
15.00%
20.00%G
RO
WTH
IN %
SALES GROWTH
B&G FOODS EVALUATION 34
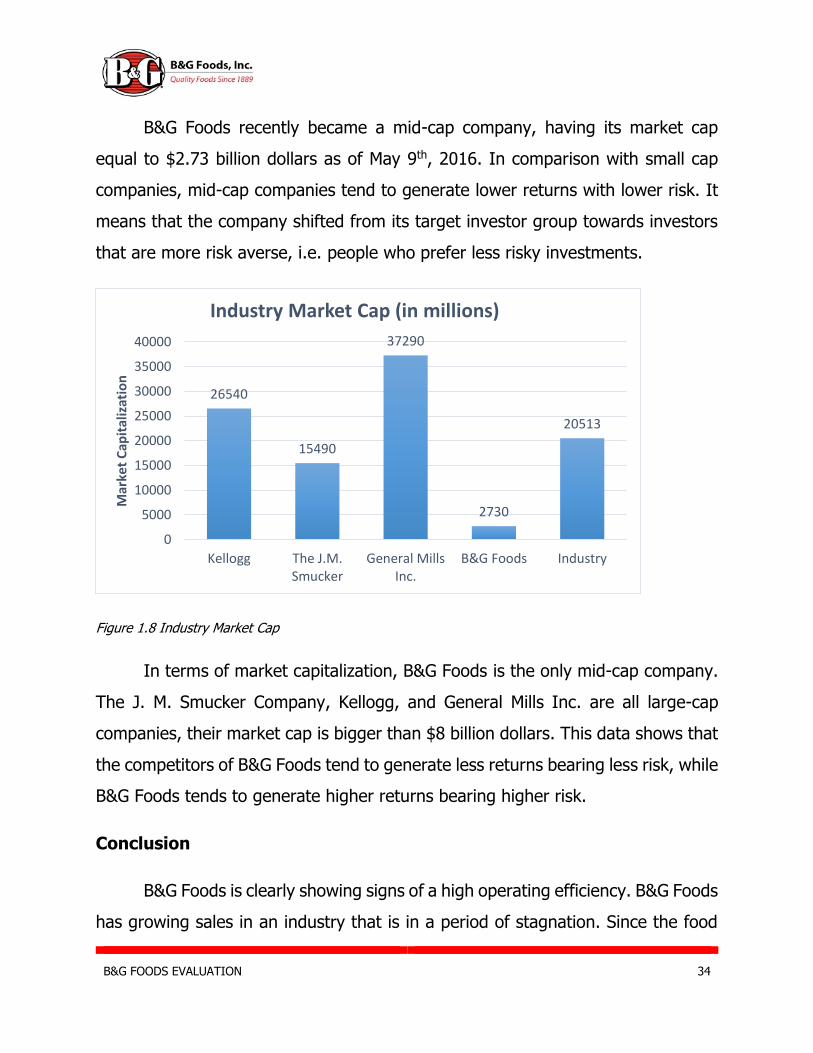
B&G Foods recently became a mid-cap company, having its market cap
equal to $2.73 billion dollars as of May 9th, 2016. In comparison with small cap
companies, mid-cap companies tend to generate lower returns with lower risk. It
means that the company shifted from its target investor group towards investors
that are more risk averse, i.e. people who prefer less risky investments.
Figure 1.8 Industry Market Cap
In terms of market capitalization, B&G Foods is the only mid-cap company.
The J. M. Smucker Company, Kellogg, and General Mills Inc. are all large-cap
companies, their market cap is bigger than $8 billion dollars. This data shows that
the competitors of B&G Foods tend to generate less returns bearing less risk, while
B&G Foods tends to generate higher returns bearing higher risk.
Conclusion
B&G Foods is clearly showing signs of a high operating efficiency. B&G Foods
has growing sales in an industry that is in a period of stagnation. Since the food
26540
15490
37290
2730
20513
0
5000
10000
15000
20000
25000
30000
35000
40000
Kellogg The J.M.Smucker
General MillsInc.
B&G Foods Industry
Mar
ket
Cap
ital
izat
ion
Industry Market Cap (in millions)

B&G FOODS EVALUATION 35
sales have increased in the past years. Based on the analyzed data, this company
has lower sales than their competitors. On the other hand, since their market
capitalization is less than the average, they tend to generate higher returns bearing
higher risks. B&G Foods has recently grown to a mid-cap company in February,
2016, their market capitalization reached $2 billion dollars in that month.
Analysis of Key Success Factors for Value Creation in the Industry
In the highly competitive processed and packaged goods industry, constant
value creation by firms is required to compete in the volatile global and regional
markets. There are many factors that contribute to the volatility of processed and
packaged goods industry markets and it is important to understand how effectively
managing these problems can create value. “Numerous brands and products
compete for shelf space and sales, with competition based primarily on product
quality, convenience, price, trade promotion, consumer promotion, brand
recognition and loyalty, customer service, advertising and other activities and the
ability to identify and satisfy emerging consumer preferences” (B&G Foods 10-K).
(Value creation is the performance of actions that increase the worth of goods,
services or even a business - Business Dictionary)
The following section will include a detailed analysis of specific value creating
strategies and how they directly impact the industry as a whole.
First Mover Advantage
With numerous firms competing in the processed and packaged goods
industry, value creation needs to be high enough to offset the fixed and variable
costs of implementing value creating strategies. Therefore, it is essential to not
only look at how a certain strategy might affect one area of the industry (such as

B&G FOODS EVALUATION 36
packaging), but also how it affects the overall economic strength (value) of the
industry. An example of this can be seen when analyzing how firms in the industry
adapt to trends in consumer tastes.
Over the past decade, consumer food trends have been rapidly evolving,
and PPFI firms have had to adapt accordingly. “Our success depends in part on
our ability to anticipate and offer products that appeal to the changing tastes,
dietary habits and product packaging preferences of consumers in the market
categories in which we compete” (B&G Foods 10-K). One such change can be seen
in consumers’ movement away from name brand foods to private label foods.
“These customers are also reducing their inventories and increasing their emphasis
on private label products” (B&G Foods 10-K). This change creates new niche
markets that allow firms to create new value adding goods. However, these new
goods need to be produced in a way that costs the firm less than the premium
that customers are willing to pay in a specific niche market.
Firms in the industry need to evaluate whether new products can create
enough value to outweigh the costs of introducing the new product to the niche
market. Successful implementation of new product introduction in niche markets
has created massive value for firms such as Chobani.
It is important to note however, that firms that initially introduce products
to a market niche typically find more value in their venture. This value adding
strategy is called the first mover advantage and has allowed many new firms to
enter the processed and packaged goods industry.
While it is harder for large companies to quickly adapt to new trends due to
specialized facilities with long production lines, small firms with relatively short
B&G FOODS EVALUATION 37
production lines can quickly adapt to trends and get their product to market first.
Big firms have had to adapt to this strategy by finding new ways to quickly
introduce products to market. They cannot construct a new facility in a timely
manner in order to capitalize on the first mover strategy, so most firms like General
Mills and B&G Foods Inc. have turned to the acquisition of firms exhibiting strong
first mover advantage value.
Diversified Products
Product diversification is essential for firms in the processed and packaged
goods industry that are seeking long term success. “Product diversification is a
process by which businesses attempt to expand their market reach and customer
base by delivering products somewhat different than the ones for which they are
known. These new products can simply be extensions of existing brands or they
may be entirely new. By engaging in product diversification, a company can extend
its business into new areas and markets, thereby increasing their opportunities for
profit” (Wise Geek).
For firms like B&G Foods, acquisitions are a value adding way to go about
diversifying their products. “A major part of our strategy is to grow through
acquisition” (B&G Foods 10-K). New niches in the processed and packaged goods
industry are repeatedly emerging and big firms with specialized facilities cannot
readily adapt to consumer tastes in a timely manner. These facilities are capable
of producing a wide range of related products, but struggle with highly diversified
products. Therefore, these big firms turn to small, highly specialized firms easily
capable of producing desired goods.
B&G FOODS EVALUATION 38
Buying out a small firm does not require a substantial amount of capital
allowing diversification against risk. The niches that show a positive growth attract
additional investments from the parental companies. If firms decided to take on
the diversification themselves, the main brand/company (Coca-Cola producing all
of its products under the Coca-Cola name) could be damaged by the potential
failure of the subsidiaries, thus increasing the risk of the venture.
Lower-Input Costs
It’s not always valuable to acquire a firm, however. It is more profitable in
some instances, to expand existing facilities within the main company. “We
regularly evaluate our co-packing arrangements to ensure the most cost-effective
manufacturing of our products and to utilize company-owned manufacturing
facilities most effectively” (B&G Foods 10-K). Such is the case with General Mills
and their cereal production. General Mills produces a number of cereals with similar
production processes. General Mills’ factories are capable of handling multiple
cereals by implementing machines that are capable of different functions. In this
case, it is much cheaper, and thus value adding to invest in an adaptable
production line than to go out and acquire a company that is capable of a specific
function.
As stated in the paragraph above, General Mills adopts such a strategy by
making sure that its cereal producing factories are able to meet the needs of future
consumer trends in cereal. With 12 different cereals, General Mills is able to
efficiently produce a large portion of their cereals without having to heavily modify
its existing infrastructure. Furthermore, new cereals will be introduced down the
line with relatively little startup costs due to factories that are able to handle a
wide-range of cereals.
B&G FOODS EVALUATION 39
Supply contracts are also necessary for keeping a low input cost.
“Supply contracts are types of contracts that establish the terms of a
working relationship between a vendor and a customer. A supply contract
is often necessary in order to lock in discounted pricing and other benefits
that the supplier is agreeing to provide to the client for a specific period of
time” (Wise Geek).
With an agreed upon discounted price, firms in the industry can produce
their products at a low, stable price. This strategy is particularly valuable when
commodity prices are increasing (currently they are) because it allows firms to pay
a low price for a set period of time regardless of the current market prices , thus
adding value to the firm. If costs are unexpectedly driven down, firms can
renegotiate, as long as the supplier is willing, the price down to meet future
expectations.
Regardless of the volatility of commodity markets in which firms in the
industry participate in, supply contracts provide relative stability to future costs
incurred by the firm. “Vegetables for the Green Giant brand are primarily purchased
under dedicated acreage supply contracts from a number of growers prior to each
growing season with the remaining demand being sourced directly from third
parties. We purchase certain other agricultural raw materials in bulk or pursuant
to short-term supply contracts” (B&G Foods 10-K). This can be particularly useful
when gauging how to allocate funds in the future. With this being said, suppliers
can set the terms to the contract as easily as firms can. This is especially true
when firms are supplier dependent. Supplier dependent means to rely heavily or
entirely on one supplier to supply the good a firm needs to produce its goods.
Suppliers in this instance can use this to their advantage by requiring higher
B&G FOODS EVALUATION 40
payments for their goods. Therefore, it is also value adding to ensure that a firm
is not supplier dependent.
Retailer Relations
In the processed and packaged goods industry, most firms do not sell their
products directly to individual consumers. It is very difficult for processed and
packaged goods firms to directly sell their products to individual consumers since
they produce in bulk quantities. Instead they sell to retailers such as Walmart.
Maintaining a good relationship with retailers is key if firms in the industry want to
distribute their products in sizeable volumes.
“In the past decade, the retail side of the food industry has seen a continuing
shift of sales to alternate food outlets such as supercenters, warehouse clubs,
dollar stores and drug stores”(B&G Foods 10-K).
All firms in the industry are price takers meaning that whatever retailers are
willing to pay for the goods is what suppliers can sell those goods for. Despite this,
if retailers are unwilling to buy the goods, suppliers will have a large stock of
expiring food in its inventory. Delivering products on time and ensuring quality are
some value adding ways firms in the industry can maintain good relations with
retailers.
Good relations are not important however, if a product is not selling.
Regardless of how favorable a firm is, a retailer will not sell an inferior good. Firms
in the industry need to ensure the quality of their products through buyback
programs. A buyback program is a guarantee on the quality of products sold to a
retailer. Products that are inferior can be shipped back to the supplier for a refund.
Regardless of quality, a product’s sales might dip in certain conditions.

B&G FOODS EVALUATION 41
To offset this, firms can implement a promotional program to save individual
consumers money and compensate the retailors for the loss through trade sales
promotions or some other means. “Our marketing organization is aligned by brand
and is responsible for the strategic planning for each of our brands. We focus on
deploying promotional dollars where we believe the spending will have the greatest
impact on sales” (B&G Foods 10-K). A value seeking firm should only implement a
promotional program if the firm believes the dip in demand or increase in
competition is only short term. It should not be used as a permanent fix to an
underselling product.
Brand Awareness
Product identification is important in how a certain product will sell. For
example, for products that list “value brand” on them consumers will immediately
identify the product as relatively cheap and of low quality. “Value brand” products
will attract those customers who value price over quality. “Our marketing
organization is aligned by brand and is responsible for the strategic planning for
each of our brands. We focus on deploying promotional dollars where we believe
the spending will have the greatest impact on sales” (B&G Foods 10-K). Therefore
it is important to know how to market a specific product in order to draw in the
target customer.
With many PPFI firms this problem becomes increasingly more complex.
Different products need to reach a different audience without conflicting with each
other. What we mean by this is if a company sells a “value brand” of a certain
category of food, they need to make sure any future endeavors into the category
target a different type of customer. Any conflict could potentially create additional

B&G FOODS EVALUATION 42
competition and thus lower sales. Correctly implementing a strategy where a PPFI
firms products can reach a wide range of customers is value adding.
Advertising is a key component to a brand’s image and appeal to customers.
Advertising can dramatically change how a product is received. “Our sales strategy
is centered on individual brands. We allocate promotional spending for each of our
brands and our regional sales managers coordinate promotions with customers.
Additionally, our marketing department works in conjunction with the sales
department to coordinate special account activities and marketing support, such
as couponing, public relations and media advertising” (B&G Foods 10-K).
With effective advertising, it is possible to increase a customer base for a
product by relating to a wide range of consumers. Effective advertising can also
relay to consumers why your product is unique from other products. With effective
advertising, firms in the industry can attract new consumers and stimulate
increased demand for their products thus adding value.
Conclusion
There are many ways to potentially add value to a firm. However, poor
implementation can result in a loss of value as with any strategy. It is crucial that
a firm looks at its available options and considers total firm impact to evaluate
whether a strategy is truly value adding. In many cases, in order to outperform
the market a company needs to make a strategy in a unique, efficient way.
Therefore, when valuing a firm it is crucial to look at a strategy’s efficiency and
implementation to find an accurate way of adding value. Only then can we truly
get a good idea of how much value is being added to the firm.
B&G FOODS EVALUATION 43
Competitive Advantage
Due to the large number of competitors present in the the processed and
packaged goods industry, it is increasingly important to achieve significant
competitive advantages over other firms. Some of the aspects B&G Foods focuses
on that create these competitive advantages include, economies of scale,
economies of scope, low cost distribution, and competitive pricing. One of B&G
Foods’ most valuable competitive advantages is low pricing without compromising
quality of the product, or shelf life. Product preservation is something that B&G
Foods is able to specialize in due to their respective economies of scale, and
economies of scope, within every product line. Through the use of these methods,
B&G Foods is able to achieve a competitive advantage that will be shown in detail
throughout the following sections.
Cost Leadership
As seen throughout the food industry, competitive pricing is essential to
success among competing firms. An effective pricing/cost strategy employed by
B&G Foods to compete with larger firms within the industry, that may be able to
achieve lower production costs, is to search for firms with which B&G Foods may
reach a contractual agreement with to manufacture, and package products at a
reduced cost.
“In addition to our own manufacturing facilities, we source a significant
portion of our products under ‘co-packing’ arrangements, a common
industry practice in which manufacturing is outsourced to other companies.
We regularly evaluate our co-packing arrangements to ensure the most cost-

B&G FOODS EVALUATION 44
effective manufacturing of our products and to utilize company-owned
manufacturing facilities most effectively.” (B&G Foods 10-K)
This cost strategy is essential to B&G Foods’ competitive pricing abilities,
and their market position in the food industry. Another cost leadership approach
B&G Foods implements, is the purchase of raw materials in bulk from wholesale
distributors ranging from agriculture producers, to companies specializing in
wholesale shipping and packaging materials such as cardboard, glass jars, etc.
Due to potential fluctuations in factors affecting the input prices of these raw
material suppliers, B&G Foods primarily focuses on establishing short-term
contracts to minimize cost volatility risk from said wholesalers, and maintain a
profitable contract with each respectively.
Economies of Scale and Scope
Although B&G Foods is considered one of the smaller companies operating
within the food industry, it effectively achieves both economies of scale and scope
through various different means. As previously discussed, B&G Foods relies heavily
on their contractual agreements with large manufacturers to obtain significant
profit margins on their products, essentially creating economies of scale that would
otherwise be unattainable to a firm of it’s size. In 2015 B&G Foods reported total
assets of $1.6 billion dollars, which is relatively small in the processed and
packaged goods industry. However, despite it’s small market share within the
industry, B&G Foods has established significant economies of scope in their
product lines. These economies of scope have been attained by B&G Foods
through the diversification of their product lines, and the use of existing
manufacturing facilities to produce these expansions within each product line.
B&G FOODS EVALUATION 45
Efficient Production
Efficient production is something that B&G Foods bases their entire
manufacturing process around, sticking to what their facilities are efficiently
capable of, and outsourcing the rest to the lowest cost manufacturer. Their
constant evaluation of profitability among the outsourced manufacturing insures
that they are operating at the lowest cost available and limits overhead costs to a
minimum.
“During the past three years, our cost saving measures and sales price
increases have substantially offset increases to our raw material, ingredient,
and packaging costs.” (B&G Foods 10K)
An attest to this statement is observed in B&G Foods’ constant research of
competing costs and pricing currently available.
Low-Cost Distribution
The distribution costs associated with the products manufactured by B&G
Foods are partially incurred by our wholesale customers such as Walmart, which
provide an access to their respective economies of scale and reduced costs. Due
to the nature of the industry in which B&G Foods operates, the distribution costs
related to the output of their products are directly related to the resources available
to the retailer which they sell to. Thus, B&G Foods’ primary concern when
considering potential wholesale customers, is to what extent customers can
facilitate distribution and minimize costs of transportation.

B&G FOODS EVALUATION 46
Inventory
Turnover
2011 2012 2013 2014 2015
B&G Foods 4.30 4.57 4.76 5.63 2.16
Kellogg 7.11 6.42 6.96 7.44 7.08
J.M.
Smucker
3.51 3.83 4.09 3.84 3.20
General
Mills Inc.
5.55 7.18 7.34 7.40 7.58
Figure 1.9 Inventory Turnover Table
There is an industry trend for inventory turnover values between 5-6 with
Kellogg having the highest throughout all periods. B&G Foods has one of the lowest
inventory turnovers in the industry with a decreasing value recently. This is an
indication that B&G Foods would benefit from an increase in inventory efficiency
in order to reduce costs and compete with firms within the processed and
packaged food industry.
Conclusion
B&G Foods has used several competitive advantages within their industry to
strategically position themselves and establish their market share. Their market
share, through the use of economies of scale, economies of scope, and low cost
distribution is one that is continually growing yearly. By simplifying product design,
lowering distribution costs, minimizing input costs, and manufacturing at the
highest efficiency possible, B&G Foods has achieved competitive advantages that
B&G FOODS EVALUATION 47
would otherwise be unattainable for firms of their size. Although B&G Foods is a
mid-sized competitor in the processed and packaged goods industry, their use of
competitive advantages has provided increased growth of their market share.
Accounting Analysis When a company lists shares of their corporation through an initial public
offering, they become subjected to the rules and regulations of the Securities and
Exchange Commission (SEC). These regulations mandate the public accessibility
of financial information concerning the daily operations of each firm. This
monitoring is essential to protect shareholders of all firms from receiving
information that may be misrepresented by the issuing firm in order to maximize
their stock value.
As previously discussed, firms must effectively leverage their use of the key
success factors they possess within the packaged and processed food industry in
order to further develop a competitive advantage in the market. When evaluating
financial statements released by a firm, it is important to understand the level of
disclosure implemented by the firm in order to identify any potential overstated or
understated occurrences. Even firms that are in compliance with Generally
Accepted Accounting Principles (GAAP) must be analyzed further in order to
determine the true value of the firm.
The degree to which firms release financial information apart from what is
required by GAAP varies from industry to industry, this is known as the firms
accounting strategy. The quality of the information which the firm may or may not
release is significant due to the consequential effect it may have to investors if it
is misstated. This is one of the primary reasons that firms must maintain a certain
B&G FOODS EVALUATION 48
level of transparency in their documents in order to instill trust in the shareholders
and provide them with the relevant information needed to make quality investment
decisions.
The accounting analysis process contains several steps in order to
accumulate, analyze, and interpret data correctly. Some factors which must be
constantly considered are the accuracy of the information released by the firm and
the form which they released it in. These factors dictate how useful the information
is to a current shareholder or potential investor. If any significant financial
information contained in the document the firms release is misstated or otherwise
faulty, it may negatively impact shareholders and is thus considered a red flag. In
the following sections we will discuss in further detail this accounting analysis
process and how to interpret and potentially restate this information in a manner
that may prove to be ultimately more informative.
Key Accounting Policies
In order to complete a successful accounting analysis, a firm’s key
accounting policies must first be identified. These policies vary from company to
company even within the same industry, this is in part due to the significance of
said policies. Although every firm must comply with the United States Generally
Accepted Accounting Principles (GAAP), the policies they wish to employ while
doing so are chosen by the firm. Sometimes firms may present some of their
financials in a way that may produce an over-optimistic representation of their
financials, thus it is important to review these key accounting policies in order to
develop a more accurate and objective understanding of the firm’s financial
performance.

B&G FOODS EVALUATION 49
Type One Key Accounting Policies
Type one accounting policies describe how a firm uses key success factors
to separate themselves from other firms within their industry and gain a
competitive advantage. How a firm develops a way to make their service unique
and provide value for their customers is called differentiation. There are several
ways that firms can stand out from their competitors, some of the methods include
product quality and variety, and cost leadership. In the processed and packaged
food industry differentiation is essential to remain competitive and retain
customers.
Cost Leadership
Reducing costs is an important part of any industry however, within the
packaged and processed food industry it is essential to stay competitive. There are
several ways which a firm can achieve cost leadership and they include low
distribution costs, economies of scale and efficient operations. When a company
expands its production capabilities or begins to see an increase in sales volume,
they may have a marginally reduced cost per item due to the constant overhead
expense and increased production, this is known as economies of scale. Another
way that a company may achieve economies of scale is through contractual
agreements with other larger companies to produce and manufacture products for
them at a rate that is lower than if the same volume were to be produced using
the own firms’ facilities. This production outsourcing is one of B&G Foods’ primary
key success factors which gives them a significant competitive advantage over
their direct competitors.

B&G FOODS EVALUATION 50
Within the processed and packaged food industry there are more than
30,000 competing suppliers to retailers which consequently leads the industry to
be price-takers rather than price-setters. Due to this increased competition,
retailers are able to leverage their bargaining power to select only the firms which
provide them with the cheapest costs or the largest profit margin. This forces
suppliers to maximize cost efficiencies in the manufacturing and distribution areas
in order to stay competitive.
Product Quality and Variety
Within the processed and packaged food industry there are many substitutes
for products among firms. Therefore, it is essential for firms to produce a variety
of options for the products they manufacture. B&G Foods has a wide variety of
high quality products food items within each of their product lines making them
one of the more diversified firms in the industry. Furthermore, when it comes to
products in the processed and packaged food industry, customers demand a high
quality at a reasonable price. B&G Foods provides customers with high quality
products through the use of contractual agreements with the industry’s leading
suppliers.
Although B&G Foods’ benchmark competitors strive to provide high variety
in their product lines, they often do so at the expense of quality. Differentiation
through quality is something which B&G Foods exemplifies through the use of
higher quality ingredients. Although there are cheaper alternatives to products
within B&G Foods’ manufacturing lines, they are able to entice customers through
this quality differentiation to other firms in the industry.

B&G FOODS EVALUATION 51
Type Two Key Accounting Policies
The way in which companies present their financial statements is considered
to be their type two accounting policies. These policies policies allow businesses
to report their financial statements in several different ways which can often lead
to a distorted presentation of their financials. Therefore, these accounting policies
must be examined in further detail in order to develop an objective understanding
of the firm’s financial performance.
These types of accounting policies are directly related to the firm’s reporting
of research and development expenses along with goodwill amortization. Although
the way in which a firm reports these elements of their financial statements is
legal, it is important to understand them to gain a clear knowledge of their
financials.
Research and Development
When considering Research and Development (R&D) in the processed and
packaged food industry, it is important to note the impact these expenses have on
the firm’s financial documents. In order for firms to be in compliance with GAAP
regulations they must expense the costs they incur relating to R&D in the year
which they were incurred. Consequently, firms who invest heavily in R&D may
report an income statement in which their expenses are overstated leading to an
overstatement in net income and equity on the balance sheet.
In that case a restatement of these expenses would present a more transparent
view of the impact that R&D expenses have on potential future profit. In the case
of B&G Foods, they list no R&D expenses meaning that there is no need for a
restatement because the firm does not allocate any funds to the activity

B&G FOODS EVALUATION 52
Goodwill
Goodwill is considered to be a form of an intangible asset which provides
value for the company during mergers and acquisitions. When goodwill is
expensed it reduces the value of the company assets and consequently many
companies often exclude any capitalized goodwill from their financial statements.
This is a very significant accounting strategy to consider when evaluating a firm
because it can be manipulated into presenting an overstated asset balance to show
a more positive company performance. Below in Figure 2-5 the goodwill listed on
B&G Foods annual reports is listed along with their respective PP&E, and total
assets.
B&G Foods Goodwill
(thousands) 2011 2012 2013 2014 2015
Goodwill 263,000 267,940 319,292 370,424 TBA
PP&E 92,000 104,746 110,374 116,197 TBA
Total Assets 1,133,000 1,192,000 1,484,343 1,649,353 TBA
Figure 2.1 B&G Foods Goodwill
Considering the fact that annual goodwill is a much greater than the net
amount of fixed assets for B&G Foods, it is evident that their intangible assets are
larger than their PP&E. This indicates that after capitalizing the goodwill with a
lifespan of five years the total assets will be decreased substantially. The
restatement of their goodwill will present a more accurate representation of B&G
Foods’s assets and thus a more accurate representation of the firm’s value.

B&G FOODS EVALUATION 53
Assessing Key Accounting Policies
The assessment of how management handles accounting policies deals with
how each key accounting policy is implemented and how it alters the valuation of
the company. Management is required to abide by GAAP’s rules, however, GAAP
allows for some estimates to be made. When numerous estimates are made to
portray bad financials as good financials, the valuation of a company can drastically
change.
Accounting Strategy
When deciding on an accounting strategy, management has to decide how
much it will disclose and how to estimate those disclosed numbers. When doing
so, it is important to look at competitors in the industry. Shareholders could
potentially be turned away if there isn’t enough relevant data on financials.
Regardless of whether a firm decides to disclose additional information, all
reporting firms must abide by GAAP’s mandatory minimums. A firm that fails to
meet these minimums (for financials intended to be released to the public) is at
risk of facing sanctions from the SEC. In reporting financials, some areas of
financials have more flexibility than others such as goodwill. It is management’s
role to determine how this flexibility will be used. This is where key accounting
policies (KAP) and key success factors come into play. The decisions made by
management related to KAP determine how net income will be stated. The KAP’s
for B&G Foods include goodwill, pension benefits, and the amortization of
intangible assets.

B&G FOODS EVALUATION 54
Accounting for Goodwill
Acquisitions make up a significant competitive advantage held by B&G
Foods. B&G Foods use acquisitions to ensure that their product line is differentiated
while hedging against volatility risk in new niche markets. Acquisitions can be sold
for premiums meaning that the price paid is in excess of the tangible assets.
Goodwill makes up the intangible asset side of a business that should justify the
premium paid.
Figure 2.2 – Acquisitions and Goodwill in 2015
Goodwill is an asset that is stated on the balance sheet. Goodwill has an
indefinite life, but is checked annually for impairment. When goodwill is impaired,
it means that the competitive advantage behind the goodwill has lost some (or all)
of its value. Firms are given some flexibility when deciding how much goodwill to
assign to a given competitive advantage and how that goodwill is impaired. This
can drastically affect the assets of an acquired company. As seen in figure 2.6,
goodwill dramatically affected the values of the acquired firms. This goodwill when
acquired is then added on to the acquiring company’s goodwill.
Mama Mary’s Acquisition: 2015 Specialty Brands Acquisition: 2015
Totals in thousands Totals in thousands
Purchase Price $51,025 Purchase Price $154,277
Goodwll $17,455 Goodwill $49,017
Amortized Intagible Assets $4,800 Amortized Intagible Assets
Unamortized Intangible Asset $38,000 Unamortized Intangible Assets $4,800
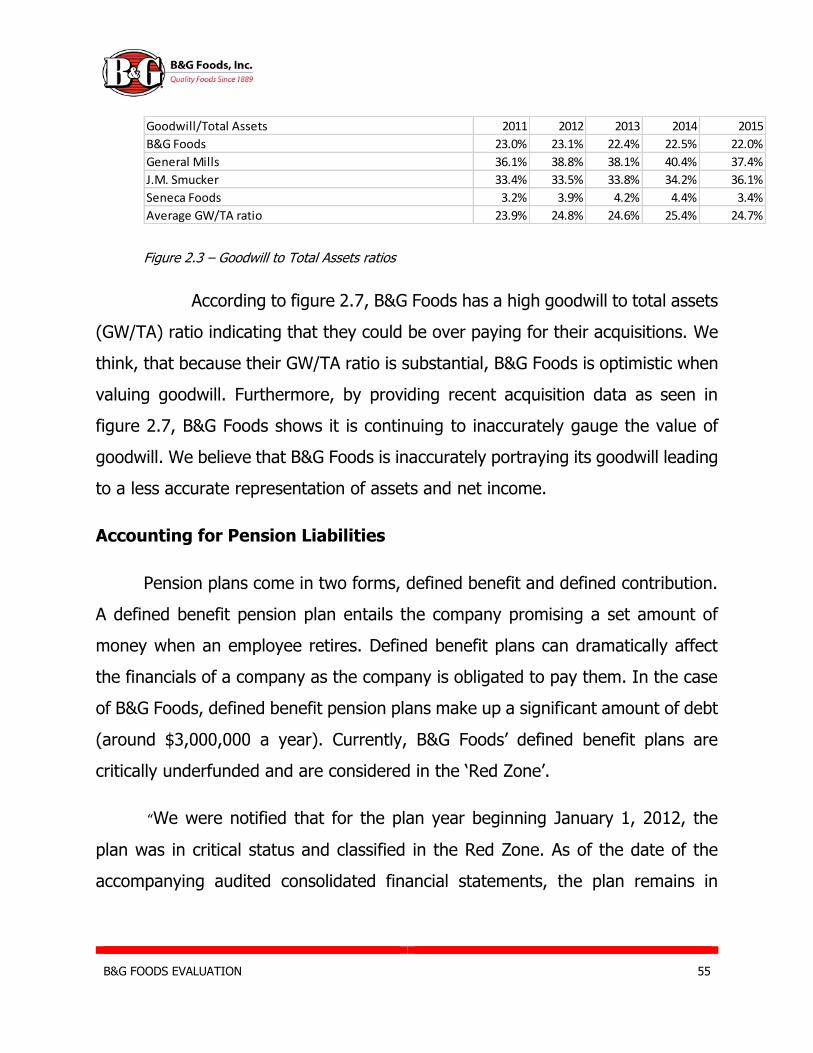
B&G FOODS EVALUATION 55
Figure 2.3 – Goodwill to Total Assets ratios
According to figure 2.7, B&G Foods has a high goodwill to total assets
(GW/TA) ratio indicating that they could be over paying for their acquisitions. We
think, that because their GW/TA ratio is substantial, B&G Foods is optimistic when
valuing goodwill. Furthermore, by providing recent acquisition data as seen in
figure 2.7, B&G Foods shows it is continuing to inaccurately gauge the value of
goodwill. We believe that B&G Foods is inaccurately portraying its goodwill leading
to a less accurate representation of assets and net income.
Accounting for Pension Liabilities
Pension plans come in two forms, defined benefit and defined contribution.
A defined benefit pension plan entails the company promising a set amount of
money when an employee retires. Defined benefit plans can dramatically affect
the financials of a company as the company is obligated to pay them. In the case
of B&G Foods, defined benefit pension plans make up a significant amount of debt
(around $3,000,000 a year). Currently, B&G Foods’ defined benefit plans are
critically underfunded and are considered in the ‘Red Zone’.
“We were notified that for the plan year beginning January 1, 2012, the
plan was in critical status and classified in the Red Zone. As of the date of the
accompanying audited consolidated financial statements, the plan remains in
Goodwill/Total Assets 2011 2012 2013 2014 2015
B&G Foods 23.0% 23.1% 22.4% 22.5% 22.0%
General Mills 36.1% 38.8% 38.1% 40.4% 37.4%
J.M. Smucker 33.4% 33.5% 33.8% 34.2% 36.1%
Seneca Foods 3.2% 3.9% 4.2% 4.4% 3.4%
Average GW/TA ratio 23.9% 24.8% 24.6% 25.4% 24.7%
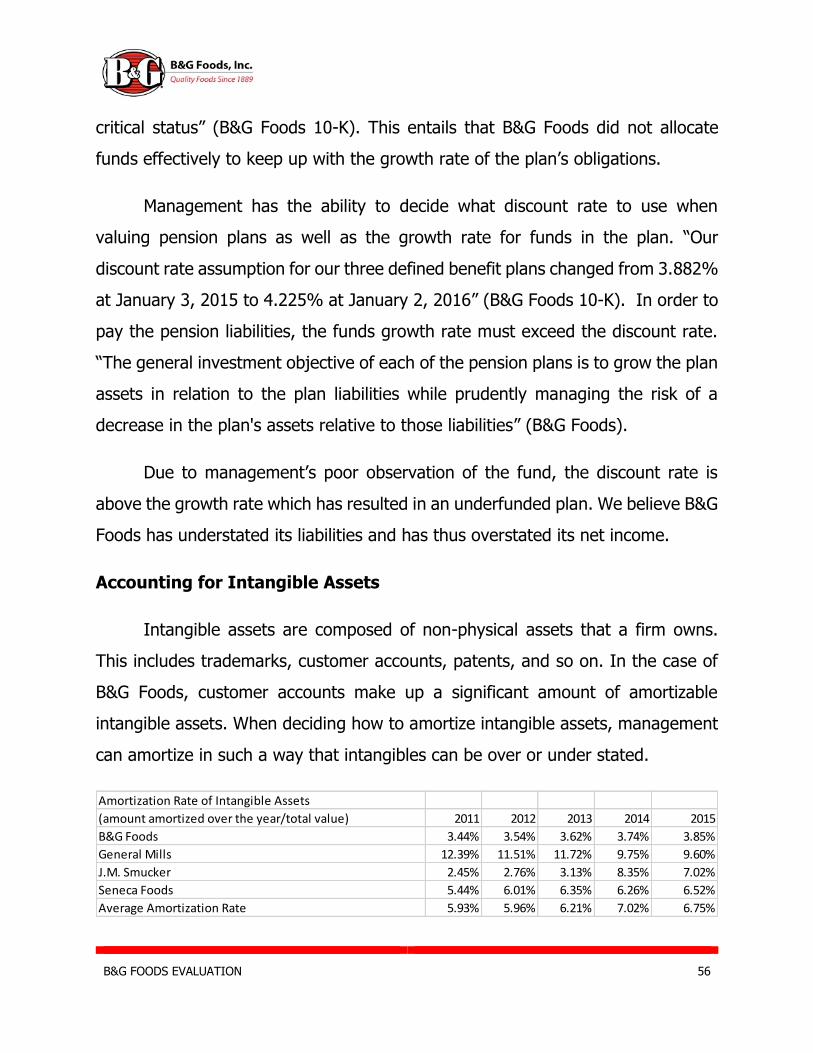
B&G FOODS EVALUATION 56
critical status” (B&G Foods 10-K). This entails that B&G Foods did not allocate
funds effectively to keep up with the growth rate of the plan’s obligations.
Management has the ability to decide what discount rate to use when
valuing pension plans as well as the growth rate for funds in the plan. “Our
discount rate assumption for our three defined benefit plans changed from 3.882%
at January 3, 2015 to 4.225% at January 2, 2016” (B&G Foods 10-K). In order to
pay the pension liabilities, the funds growth rate must exceed the discount rate.
“The general investment objective of each of the pension plans is to grow the plan
assets in relation to the plan liabilities while prudently managing the risk of a
decrease in the plan's assets relative to those liabilities” (B&G Foods).
Due to management’s poor observation of the fund, the discount rate is
above the growth rate which has resulted in an underfunded plan. We believe B&G
Foods has understated its liabilities and has thus overstated its net income.
Accounting for Intangible Assets
Intangible assets are composed of non-physical assets that a firm owns.
This includes trademarks, customer accounts, patents, and so on. In the case of
B&G Foods, customer accounts make up a significant amount of amortizable
intangible assets. When deciding how to amortize intangible assets, management
can amortize in such a way that intangibles can be over or under stated.
Amortization Rate of Intangible Assets
(amount amortized over the year/total value) 2011 2012 2013 2014 2015
B&G Foods 3.44% 3.54% 3.62% 3.74% 3.85%
General Mills 12.39% 11.51% 11.72% 9.75% 9.60%
J.M. Smucker 2.45% 2.76% 3.13% 8.35% 7.02%
Seneca Foods 5.44% 6.01% 6.35% 6.26% 6.52%
Average Amortization Rate 5.93% 5.96% 6.21% 7.02% 6.75%

B&G FOODS EVALUATION 57
Figure 2.4 – Amortization rate of intangible assets
As seen in figure 2.8, B&G Foods has a much lower amortization rate than
the average, meaning that B&G Foods believes their intangibles, namely customer
accounts, have a longer useful life than other firms in the industry. This means
that B&G Foods expects to continue to sell profitably to its customers longer than
the industry does. We believe that B&G Foods is using too low of an amortization
rate for their intangibles and are thus overstating their assets and understating
their expenses.
Conclusion
B&G Foods has estimated their financials in a way that makes the company
look better than it is. With pension liabilities and amortization of intangibles, B&G
Foods has overstated their assets, understated their liabilities, and understated
their expenses. Goodwill was accurately stated and thus does not cancel out any
of the previous items.
Evaluate Accounting Strategy
B&G Foods’ accounting strategy is similar to their competitors in the
processed and packaged goods industry such as General Mills, The J. M. Smucker
Company, and Seneca Foods Corporation. As any other companies, they have to
follow the generally accepted accounting principles (GAAP). Since accounting
strategies affect financial reports, firms can use it to hide or exaggerate their actual
performance. Therefore, it is significant to evaluate their accounting strategies.
In comparison to the competitors, B&G Foods provides with the most
detailed 10-Ks. B&G Foods reports their financial statements with a high disclosure
policy. They have broad and open reports that clearly show what they do. B&G
B&G FOODS EVALUATION 58
Foods reports their information beyond what is required. Transparent statements
allow analysts to gather a complete and more precise picture of a company.
Therefore, this company has a high disclosure policy.According to B&G Foods 2015
Form 10-K, there have not been any major changes in accounting policies in the
last five years.
Even though B&G Foods has not indicated their spending on research and
development, it is clear that a small portion is set to satisfy changing needs of their
customer base. We also assume that B&G Foods spends a significant portion on
their marketing methods; it is a common strategy for brand-building in the
processed and packaged goods industry.
Research and Development
Since B&G Foods reports in accordance with the GAAP, there is almost no
flexibility for the company due to the fact that GAAP requires research and
development to be expensed as soon as it appears.
One of the most recent R&D advancements is the purchase of the Green
Giant, a subsidiary of General Mills, Inc. Along with the new brand-image, the
purchase also provided B&G Foods with R&D of the Green Giant. That is based on
the fact that the company was fully acquired by B&G Foods.
Goodwill and Intangibles
The goodwill of B&G Foods is significantly lower than their main competitors
as seen from the following table.
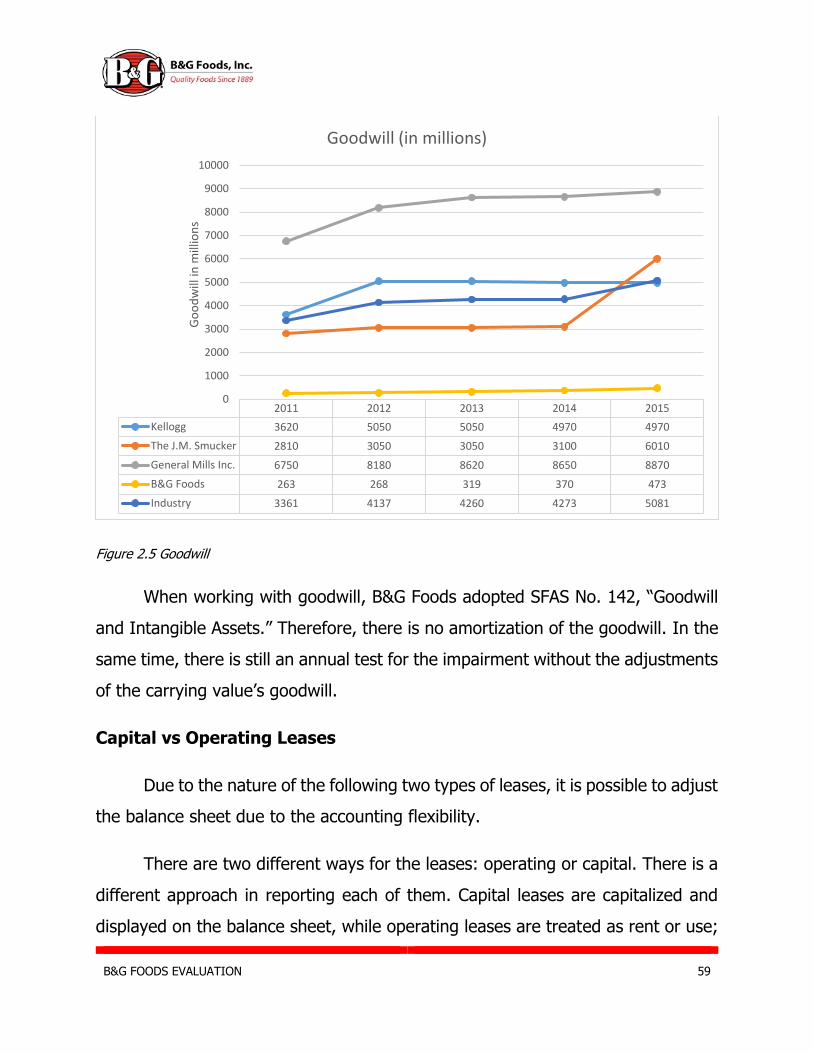
B&G FOODS EVALUATION 59
Figure 2.5 Goodwill
When working with goodwill, B&G Foods adopted SFAS No. 142, “Goodwill
and Intangible Assets.” Therefore, there is no amortization of the goodwill. In the
same time, there is still an annual test for the impairment without the adjustments
of the carrying value’s goodwill.
Capital vs Operating Leases
Due to the nature of the following two types of leases, it is possible to adjust
the balance sheet due to the accounting flexibility.
There are two different ways for the leases: operating or capital. There is a
different approach in reporting each of them. Capital leases are capitalized and
displayed on the balance sheet, while operating leases are treated as rent or use;
2011 2012 2013 2014 2015
Kellogg 3620 5050 5050 4970 4970
The J.M. Smucker 2810 3050 3050 3100 6010
General Mills Inc. 6750 8180 8620 8650 8870
B&G Foods 263 268 319 370 473
Industry 3361 4137 4260 4273 5081
0
1000
2000
3000
4000
5000
6000
7000
8000
9000
10000
Go
od
will
in m
illio
ns
Goodwill (in millions)

B&G FOODS EVALUATION 60
therefore, they are excluded from the balance sheet. Since operating leases reduce
liabilities, it is advised to work with operating leases.
Figure 2.6 Operating Leases
According to the 10-K of the B&G Foods, they project their operating leases
to decrease in the future.
Currency Exchange and Commodity Risk
Since the higher risk means the higher possible return, if a firm is able to
minimize risk for the same expected return, it would greatly increase the overall
profitability. As discussed in the previous sections, the higher market cap the less
return on equity it generates and the lower risks a firm takes. Since B&G Foods is
a mid cap company, having their market cap a little bit above two billion dollars,
this firm takes average risk in the processed and packaged goods industry.
One of the common methods to decrease riskiness of a business is through
the use of hedging; this applies not only to the processed and packaged goods
industry, but to many other industries as well.
In order to decrease the riskiness, B&G Foods uses the same methods as
their competitors, it hedges in commodity prices and currency exchange. It allows

B&G FOODS EVALUATION 61
to protect the company from market downturns. B&G Foods makes transactions
in multiple currencies and different types of contracts.
B&G Foods also deals with futures and forwards to decrease inflation and
riskiness. This method uses two different periods of transaction time, one is at the
time of purchase and another is at the time of the transaction.
According to their 10-K, B&G Foods manufactures, sells, and distributes their
portfolio of products not only in the United States, but also in Canada and Puerto
Rico. Their foreign sales are primarily to customers located in Canada. B&G Foods
has 6.7% of their net sales in foreign countries.
Conclusion
B&G Foods follows the generally accepted accounting policies. The company
truly has a high disclosure policy. Their reports cover information that goes beyond
what is required and provide analysts with a clear picture of the company.
Although, there is a tendency not to include details about the research and
development expenses in the processed and packaged goods industry.
Goodwill, intangibles, currency exchange, commodity risk, capital leases,
and operating leases provide with some flexibility for the companies in the industry
to adjust their reports towards their goals. On the other hand, there is no flexibility
by manipulating R&D.
The B&G Foods reports their financial documents passively. They still have
not posted their annual report for the 2015, while their main competitors have
already done so. Regarding their previous annual reports, B&G Foods has always
provided with the analysts with clear explanations, graphs, and multiple bullet
B&G FOODS EVALUATION 62
points that emphasize the data. After careful analysis, we believe that the data
provided by B&G Foods is accurate.
Quality of Disclosure
The quality of disclosure of a company is a very important aspect of
communication. It often determines the company’s credibility and will to make
analysts’ job less difficult. Quality disclosure helps the public to understand,
evaluate, and assess companies’ performances. Based on historical information, a
company disclosure can in this prospective influence investors’ decision making.
Providing truthful and clear information gives people that are not necessarily
familiar with financial reporting, a fair interpretation on a company’s credibility,
transparency, long term vision and performances.
We will evaluate B&G Foods financial to reconcile how well they
communicate about their financial activities. All the publically traded companies
are required to report information according to the Generally Accepted Accounting
Principles GAAP. Having companies reporting under same standards (GAAP)
facilitates benchmarking and the people’ ability to verify the accuracy of the
disclosed information. Managers often have motives to improve company
performance by making the financials look better than what it actually is.
Consequently, creditors, investors, and even people will be misled by lack of
transparency to show the exact situation of the company. B&G Foods does a good
job in their 10-K, more precisely in the sales section, where the give a presentation
of revenues by brand see figure below.
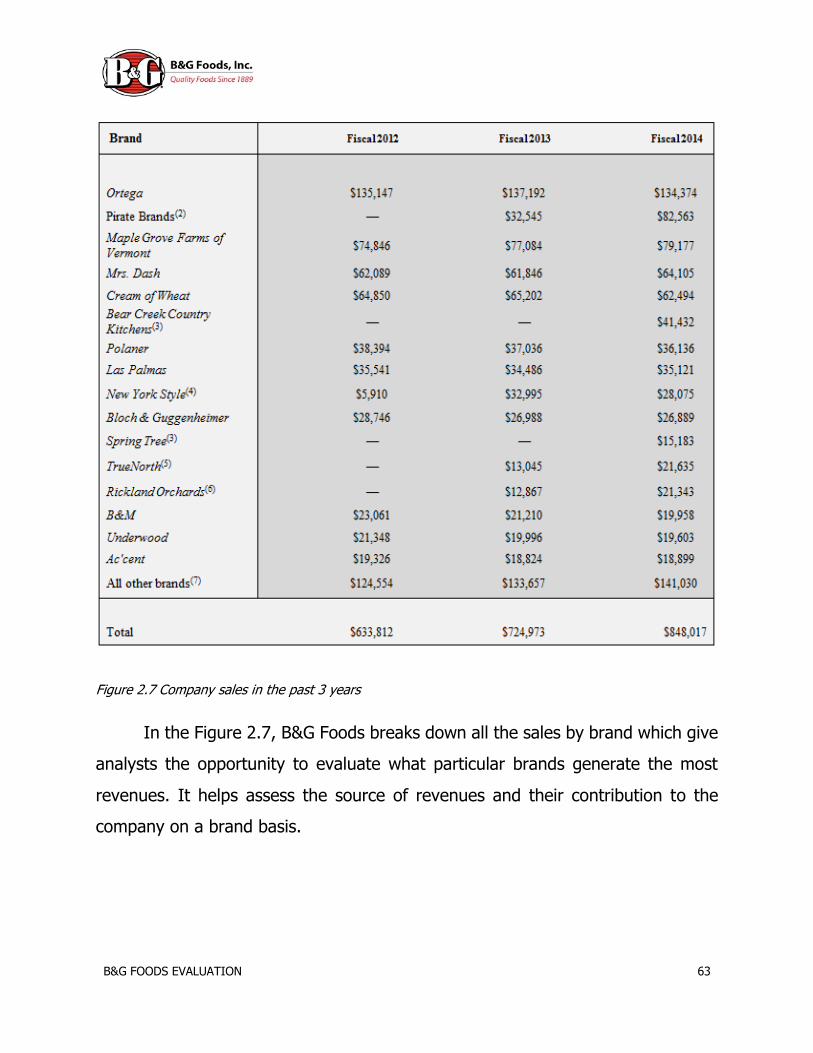
B&G FOODS EVALUATION 63
Figure 2.7 Company sales in the past 3 years
In the Figure 2.7, B&G Foods breaks down all the sales by brand which give
analysts the opportunity to evaluate what particular brands generate the most
revenues. It helps assess the source of revenues and their contribution to the
company on a brand basis.
B&G FOODS EVALUATION 64
Internal and External Control:
In the B&G Foods annual report, they dedicate a section to control and
procedures. In this part of their 10-K, they deal with internal control where
managers and officers are in charge of maintaining adequate control over
financials and verify the financials’ effectiveness. B&G Foods auditing is done by
KKPMG LLC, one of the big four accounting firm. It is a well-known firm in the
accounting. The fact that they present them it is a plus for investors, because
KPMG’s credibility gives an assurance of a minimum fairness and transparency in
the financials. In case of misstatements at the internal level, the chief executive
officer and chief financial officer are in charge for all the consolidations and errors.
The balance between internal and external control is very important, in the way
that it increases the financials’ accuracy and reduces the margin of errors. The
goal is to give to investors a clear and accurate view about the financial condition
of the firm.
Fair Value vs. Carrying Value
The principle of fair value vs carrying value is an important principle of
accounting estimates that helps evaluate financials of any company. Carrying value
is the value that companies hold on their balance sheet. It is usually obtained by
subtracting depreciation, and put the assets value up to date. Fair value on the
other end is the value if the asset was sold on the open market. In B&G Foods’
10-K, they use carrying value for their current assets:
“Cash and cash equivalents, trade accounts receivable, income tax
receivable, trade accounts payable, accrued expenses and dividends payable are
reflected on our consolidated balance sheets at carrying value, which approximates

B&G FOODS EVALUATION 65
fair value due to the short-term nature of these instruments (10-K Item 7-
Qualitative Disclosure about Market Risk).” They affirm using carrying value only
for current assets and liabilities, because of they are short-term and have a limited
exposure to market risk.
While, further in their 10-K, they talked about why they use fair value: “Our
principal market risks are exposure to changes in commodity prices, interest rates
on borrowings and foreign currency exchange rates and market fluctuation risks
related to our defined benefit pension plans (10-K Item 7).” In this part, they use
fair value for risk’s reduction purposes (Market risks, foreign currency risk, and
inflation risk et.) because of the long term nature of some assets and liabilities, it
increases risk. So, the complexity of the fair value estimate makes it more and
more difficult for analysts to determinate the accuracy of their estimation.
Even further, the fact that they use different estimate for different elements
in the balance sheet makes it even harder for analysts to consolidate their
observations with the information available in the annual report. So, there is a lack
of harmony, because the carrying value calculation is pretty exact and easy to
consolidate on one end, and the fair value is a very complex estimate difficult to
verify on the other end.
Key Financial Disclosure
B&G Foods has done a good job disclosing key financial tools to facilitate
analysts assessment of their company. In their 10-K, we can easily find key
financial tools like discount rate, rate of return, risk free rate of return etc.
Compared to direct competitors like General Mills and Seneca Group, B&G Foods
has done a good job disclosing important tools that we previously cited. We went
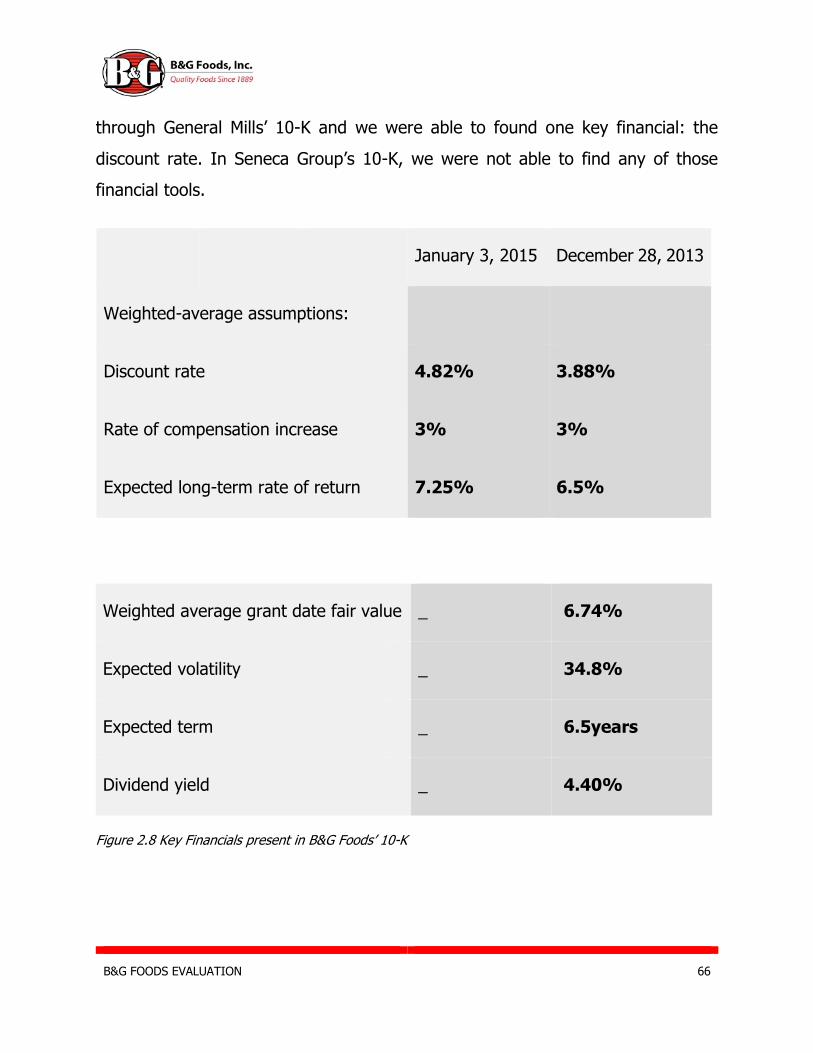
B&G FOODS EVALUATION 66
through General Mills’ 10-K and we were able to found one key financial: the
discount rate. In Seneca Group’s 10-K, we were not able to find any of those
financial tools.
Weighted average grant date fair value _ 6.74%
Expected volatility _ 34.8%
Expected term _ 6.5years
Dividend yield _ 4.40%
Figure 2.8 Key Financials present in B&G Foods’ 10-K
January 3, 2015 December 28, 2013
Weighted-average assumptions:
Discount rate 4.82% 3.88%
Rate of compensation increase 3% 3%
Expected long-term rate of return 7.25% 6.5%
B&G FOODS EVALUATION 67
In a industry with moderate disclosure, B&G foods does a better job than his direct
competitors disclosing essential information to facilitate analysts, outsiders, and
people’s look on what is going on with their company.
Areas Lacking Disclosure
Suppliers:
B&G Foods did not do a good job stating the origins of their raw materials.
They omitted to inform customers about what was in the food they are selling.
The only origin given regarding a specific product was their maple syrup which
mainly comes from Quebec. There is a growing awareness of people toward the
importance of carefully selecting what they consume. There is an increase of
“green” interest groups, Organic movements, and food relation to health issues in
the society. Our Analysis suggest that clarifying more people about what they eat
will have a positive impact on how consumers view B&G Foods and affiliates. In
the Processed and packaged goods health related concerns are restricted subjects.
It will play in B&G Foods’ favor to initiate in programs and edifications going in this
sense.
Production process: Here is another area lacking information and disclosure from
B&G Foods’ 10-K. It is important to rise concerns about production process and
clarify consumers about how the food they eat is produced. In what conditions are
the raw materials raised (Poultry, Beef, corn etc.)? What are the sanitary
conditions on site? How effective is the quality control from suppliers? those are
few questions that are not edified in their 10-K. for example: Nutriments labeling.
It helps inform consumers, but it is not very effective, because you cannot list
everything in such a small area in the back of can or a bottle.
B&G FOODS EVALUATION 68
Environmental Issues: There is many concerns regarding the possible
effects of Industrial agriculture on the environment. General Mills is one of the
companies making move in this sense to reduce the effects of industrial activities
on our planet. B&G foods does not disclose a lot about “pro-environmental”
actions. With the actual environmental concern raised, this could considerably
improve B&G Foods from a consumers’ standpoint.
Conclusion
Beside the lack of information regarding the origins of their suppliers and
few environmental concerns, our analysis concluded that in a moderately disclosed
industry B&G Foods does a good job providing public with quality financial
information that can help analysts, investors, and creditors to have a real and
accurate feel about the real condition of their company.
Identify Potential Red Flags
Red flags are indicators of undesirable characteristics of a company and its
related stock. Red flags are not necessarily a breach in GAAP rules, but reporting
in a format that may confuse, mislead, or otherwise derail investor’s ability to value
a company. Examples of red flags include last minute transactions, huge asset
write offs, unreasonably low amortization rates, unrealistic assumptions on
goodwill, significant use of operating leases, and a significant inflow of revenue at
the end of periods.
B&G FOODS EVALUATION 69
How accounting policies are implemented can drastically affect how each of
the stated items can come across. This in turn can dramatically change how
financial data comes across to the public. Figures that would normally indicate the
financial strength of a firm, such as P/E ratios, could mislead investors into a bad
investment. Therefore, it is important to look at potential red flags to accurately
value B&G Foods.
Asset Write-Offs
Write-offs are reductions in the value of an asset, and result from an
expense that is directly related to the asset. They also directly impact the taxable
income of a company. Therefore it is essential to look at write-offs since they affect
key items in company financials.
B&G Foods wrote off a number of items in 2015 including a loss on the
extinguishment of debt and loss of inventory due to excess, obsolete, and
unsaleable goods. The write-off of the extinguishment of debt was .9% of net
income while loss of inventory was unreported. This is probably due to loss of
inventory being insignificant in size. Since write-offs are only .9% of net income,
we believe write-offs are not a red flag.
Amortization of Intangible Assets
Throughout 2014 and 2015, B&G Foods’ amortization rate of its intangible
assets hovered around 3.8% which was 3% lower than the average (figure 1.3).
This indicates that B&G Foods’ management feels that their intangible assets have
a longer useful life than the rest of the industry. Most of B&G Foods’ amortizable
intangibles came from customer accounts. This indicates that B&G Foods expects
its customers to continue business for an extended period of time.
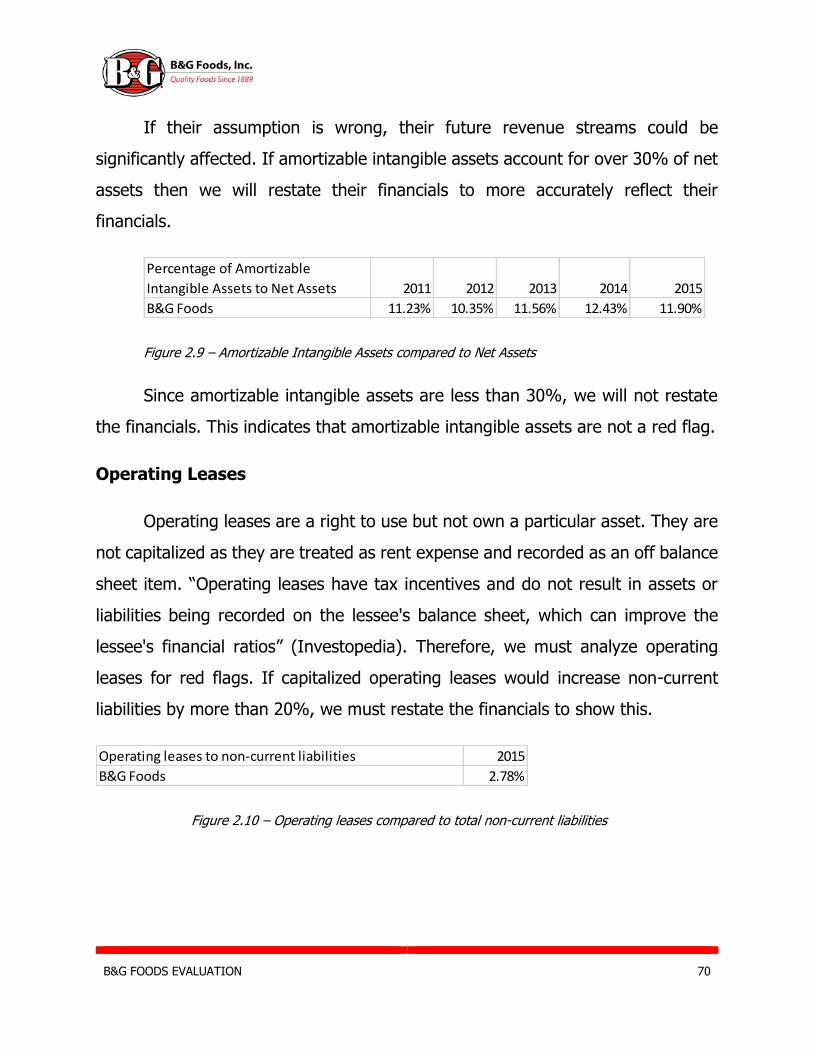
B&G FOODS EVALUATION 70
If their assumption is wrong, their future revenue streams could be
significantly affected. If amortizable intangible assets account for over 30% of net
assets then we will restate their financials to more accurately reflect their
financials.
Figure 2.9 – Amortizable Intangible Assets compared to Net Assets
Since amortizable intangible assets are less than 30%, we will not restate
the financials. This indicates that amortizable intangible assets are not a red flag.
Operating Leases
Operating leases are a right to use but not own a particular asset. They are
not capitalized as they are treated as rent expense and recorded as an off balance
sheet item. “Operating leases have tax incentives and do not result in assets or
liabilities being recorded on the lessee's balance sheet, which can improve the
lessee's financial ratios” (Investopedia). Therefore, we must analyze operating
leases for red flags. If capitalized operating leases would increase non-current
liabilities by more than 20%, we must restate the financials to show this.
Figure 2.10 – Operating leases compared to total non-current liabilities
Percentage of Amortizable
Intangible Assets to Net Assets 2011 2012 2013 2014 2015
B&G Foods 11.23% 10.35% 11.56% 12.43% 11.90%
Operating leases to non-current liabilities 2015
B&G Foods 2.78%
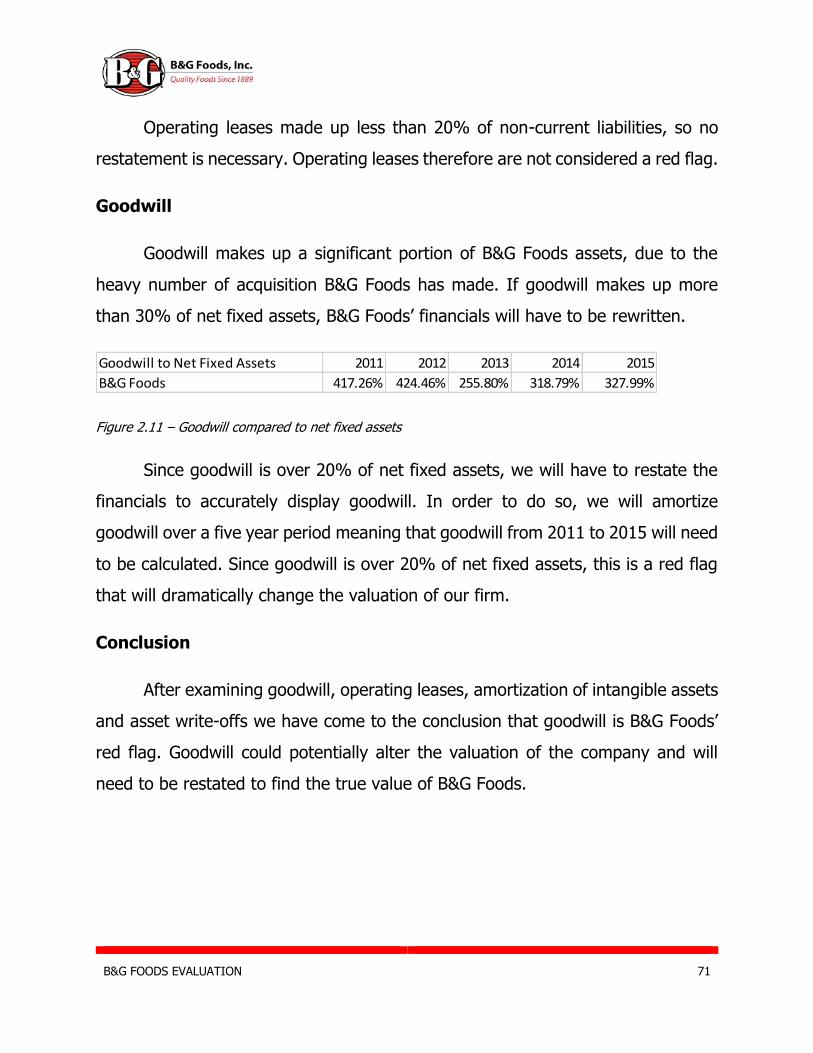
B&G FOODS EVALUATION 71
Operating leases made up less than 20% of non-current liabilities, so no
restatement is necessary. Operating leases therefore are not considered a red flag.
Goodwill
Goodwill makes up a significant portion of B&G Foods assets, due to the
heavy number of acquisition B&G Foods has made. If goodwill makes up more
than 30% of net fixed assets, B&G Foods’ financials will have to be rewritten.
Figure 2.11 – Goodwill compared to net fixed assets
Since goodwill is over 20% of net fixed assets, we will have to restate the
financials to accurately display goodwill. In order to do so, we will amortize
goodwill over a five year period meaning that goodwill from 2011 to 2015 will need
to be calculated. Since goodwill is over 20% of net fixed assets, this is a red flag
that will dramatically change the valuation of our firm.
Conclusion
After examining goodwill, operating leases, amortization of intangible assets
and asset write-offs we have come to the conclusion that goodwill is B&G Foods’
red flag. Goodwill could potentially alter the valuation of the company and will
need to be restated to find the true value of B&G Foods.
Goodwill to Net Fixed Assets 2011 2012 2013 2014 2015
B&G Foods 417.26% 424.46% 255.80% 318.79% 327.99%
B&G FOODS EVALUATION 72
Undo Accounting Distortions
Based on the accounting analysis conducted in the previous sections of this
draft, it is possible to identify the factors that would cause accounting distortions
in this company’s financial statements.
There are four concepts that investors look into when evaluating whether to
restate or nor the financial statements of a firm:
1. Goodwill > 30% of Net Fixed Assets
2. Goodwill Impairment eliminates > 30% Operating Income
3. R&D expense reduces operating income by more than 20%
4. Capitalized Operating Leases would increase non-current
liabilities by more than 20%
If any of the four statements above exceeds barriers, then financial
statements must be restored. By reviewing B&G Foods’ financials statements it is
evident that both 1 and 2 of the concepts above are exceeded. Therefore, the
financial statements must be restated for the past 5 or 6 years.
”Goodwill is an intangible asset that arises as a result of the acquisition of
one company by another for a premium value. A goodwill includes the company’s
brand name, solid customer base, good customer relations, employee relations
and any patents or proprietary technology. Goodwill is considered an intangible
asset because it is not a physical asset like buildings or equipment” (FASB.ORG).
B&G Foods has acquired multiple firms since the company was founded. The
company currently owns 41 different brands; thus, the amount of goodwill is
extremely high as compared to Net Fixed Assets.
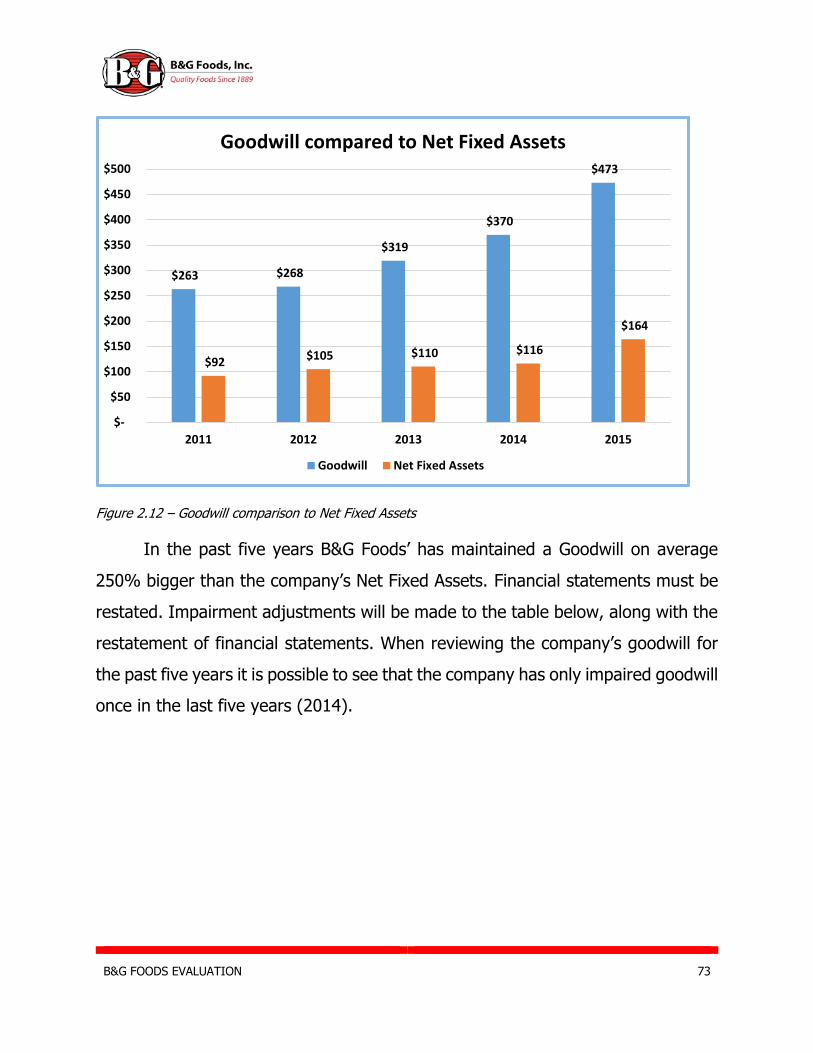
B&G FOODS EVALUATION 73
Figure 2.12 – Goodwill comparison to Net Fixed Assets
In the past five years B&G Foods’ has maintained a Goodwill on average
250% bigger than the company’s Net Fixed Assets. Financial statements must be
restated. Impairment adjustments will be made to the table below, along with the
restatement of financial statements. When reviewing the company’s goodwill for
the past five years it is possible to see that the company has only impaired goodwill
once in the last five years (2014).
$263 $268
$319
$370
$473
$92 $105 $110 $116
$164
$-
$50
$100
$150
$200
$250
$300
$350
$400
$450
$500
2011 2012 2013 2014 2015
Goodwill compared to Net Fixed Assets
Goodwill Net Fixed Assets
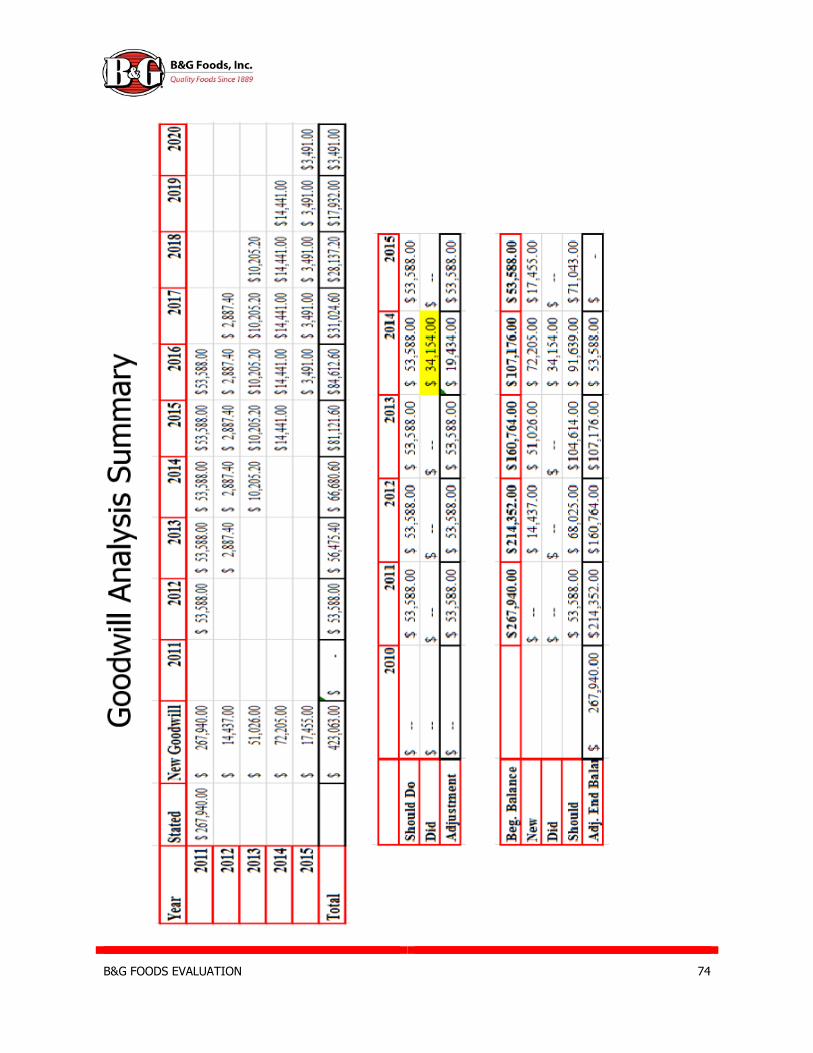
B&G FOODS EVALUATION 74
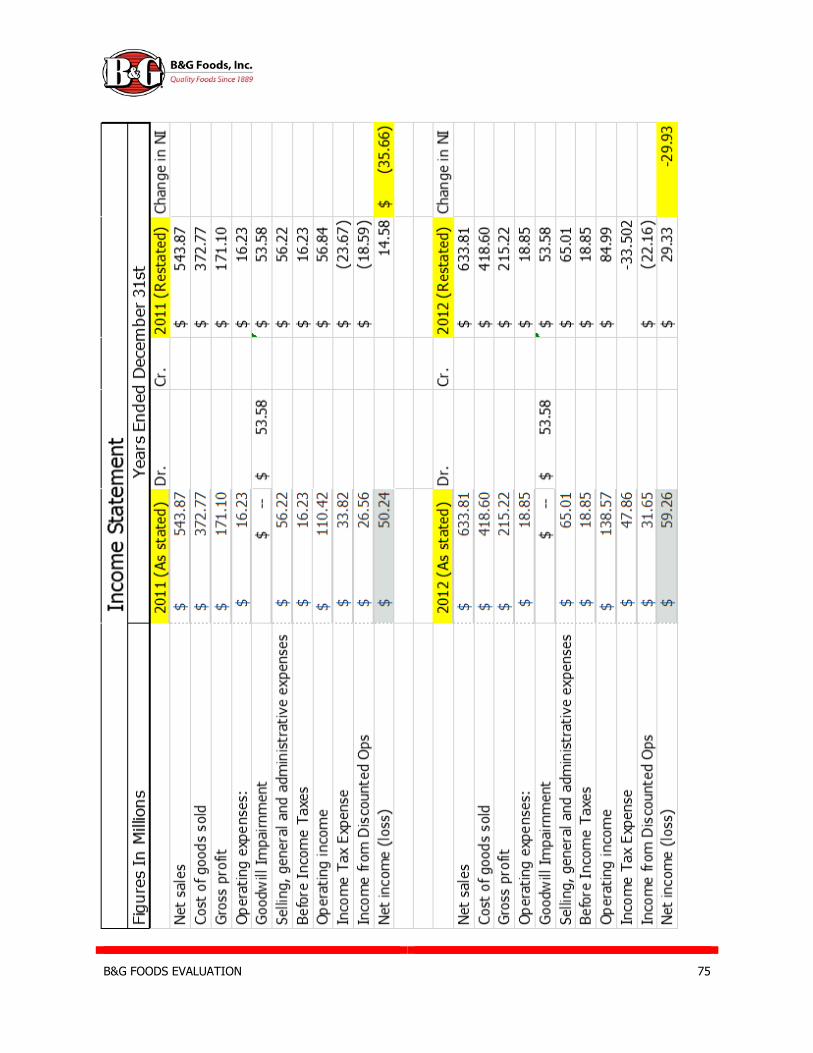
B&G FOODS EVALUATION 75

B&G FOODS EVALUATION 76

B&G FOODS EVALUATION 77
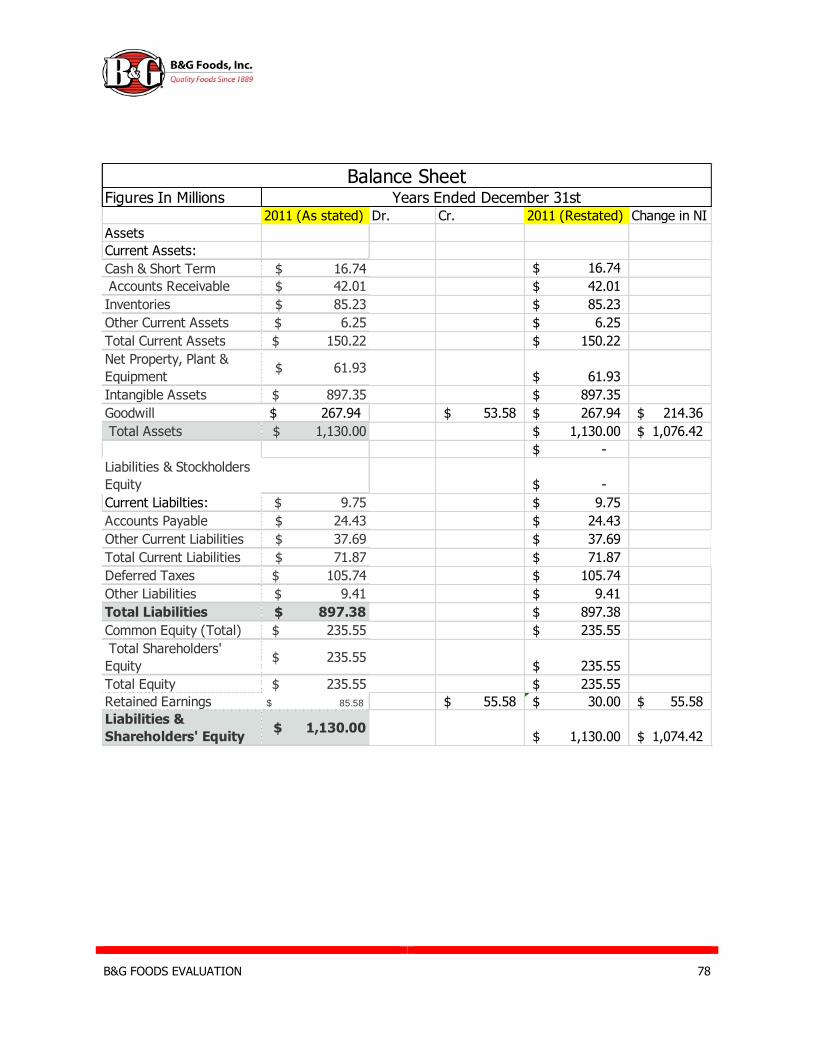
B&G FOODS EVALUATION 78
Figures In Millions2011 (As stated) Dr. Cr. 2011 (Restated) Change in NI
Assets
Current Assets:
Cash & Short Term $ 16.74 16.74$
Accounts Receivable $ 42.01 42.01$
Inventories $ 85.23 85.23$
Other Current Assets $ 6.25 6.25$
Total Current Assets $ 150.22 150.22$
Net Property, Plant &
Equipment $ 61.93
61.93$
Intangible Assets $ 897.35 897.35$
Goodwill 267.94$ 53.58$ 267.94$ 214.36$
Total Assets $ 1,130.00 1,130.00$ 1,076.42$
-$
Liabilities & Stockholders
Equity -$
Current Liabilties: $ 9.75 9.75$
Accounts Payable $ 24.43 24.43$
Other Current Liabilities $ 37.69 37.69$
Total Current Liabilities $ 71.87 71.87$
Deferred Taxes $ 105.74 105.74$
Other Liabilities $ 9.41 9.41$
Total Liabilities $ 897.38 897.38$
Common Equity (Total) $ 235.55 235.55$
Total Shareholders'
Equity $ 235.55
235.55$
Total Equity $ 235.55 235.55$
Retained Earnings 85.58$ 55.58$ 30.00$ 55.58$
Liabilities &
Shareholders' Equity $ 1,130.00
1,130.00$ 1,074.42$
Balance SheetYears Ended December 31st
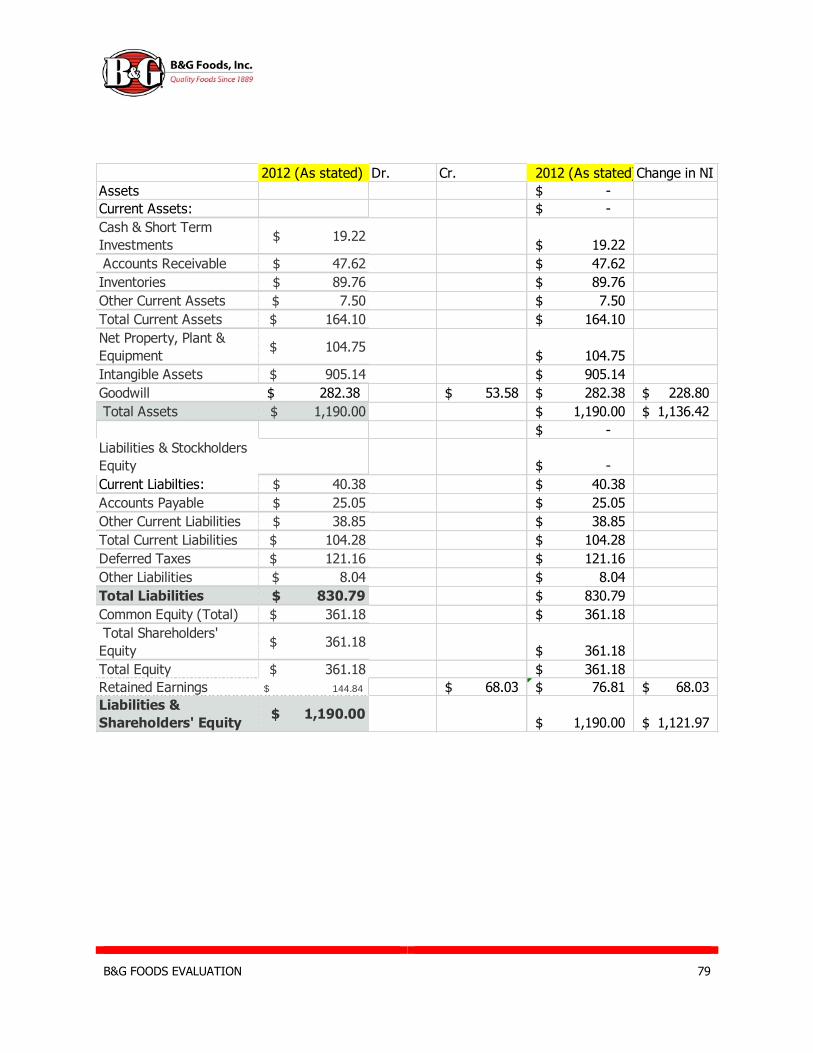
B&G FOODS EVALUATION 79
2012 (As stated) Dr. Cr. 2012 (As stated)Change in NI
Assets -$
Current Assets: -$
Cash & Short Term
Investments $ 19.22
19.22$
Accounts Receivable $ 47.62 47.62$
Inventories $ 89.76 89.76$
Other Current Assets $ 7.50 7.50$
Total Current Assets $ 164.10 164.10$
Net Property, Plant &
Equipment $ 104.75
104.75$
Intangible Assets $ 905.14 905.14$
Goodwill 282.38$ 53.58$ 282.38$ 228.80$
Total Assets $ 1,190.00 1,190.00$ 1,136.42$
-$
Liabilities & Stockholders
Equity -$
Current Liabilties: $ 40.38 40.38$
Accounts Payable $ 25.05 25.05$
Other Current Liabilities $ 38.85 38.85$
Total Current Liabilities $ 104.28 104.28$
Deferred Taxes $ 121.16 121.16$
Other Liabilities $ 8.04 8.04$
Total Liabilities $ 830.79 830.79$
Common Equity (Total) $ 361.18 361.18$
Total Shareholders'
Equity $ 361.18
361.18$
Total Equity $ 361.18 361.18$
Retained Earnings 144.84$ 68.03$ 76.81$ 68.03$
Liabilities &
Shareholders' Equity $ 1,190.00
1,190.00$ 1,121.97$

B&G FOODS EVALUATION 80
2013 (As stated) Dr. Cr. 2013 (As stated)Change in NI
Assets -$
Current Assets: -$
Cash & Short Term
Investments $ 4.11
4.11$
Accounts Receivable $ 66.19 66.19$
Inventories $ 101.25 101.25$
Other Current Assets $ 10.19 10.19$
Total Current Assets $ 181.74 181.74$
Net Property, Plant &
Equipment $ 110.37
110.37$
Intangible Assets $ 1,160.00 1,160.00$
Goodwill 318.97$ 53.58$ 318.97$ 265.39$
Total Assets $ 1,480.00 1,480.00$ 1,426.42$
-$
Liabilities & Stockholders
Equity -$
Current Liabilties: $ 26.25 26.25$
Accounts Payable $ 42.64 42.64$
Other Current Liabilities $ 36.83 36.83$
Total Current Liabilities $ 105.71 105.71$
Deferred Taxes $ 146.94 146.94$
Other Liabilities $ 8.69 8.69$
Total Liabilities $ 1,110.00 1,110.00$
Common Equity (Total) $ 378.36 378.36$
Total Shareholders'
Equity $ 378.36
378.36$
Total Equity $ 378.36 378.36$
Retained Earnings 197.19$ 104.61 92.58$ 104.61
Liabilities &
Shareholders' Equity $ 1,480.00
1,480.00$ 1,375.39$

B&G FOODS EVALUATION 81
2014 (As stated) Dr. Cr. 2014 (As stated)Change in NI
Assets -$
Current Assets: -$
Cash & Short Term
Investments $ 1.49
1.49$
Accounts Receivable $ 70.37 70.37$
Inventories $ 106.56 106.56$
Other Current Assets $ 18.11 18.11$
Total Current Assets $ 196.52 196.52$
Net Property, Plant &
Equipment $ 116.20
116.20$
Intangible Assets $ 1,320.00 1,320.00$
Goodwill 340.15$ 53.58$ 340.15$ 286.57$
Total Assets $ 1,650.00 1,650.00$ 1,596.42$
-$
Liabilities & Stockholders
Equity -$
Current Liabilties: $ 18.75 18.75$
Accounts Payable $ 38.05 38.05$
Other Current Liabilities $ 35.89 35.89$
Total Current Liabilities $ 92.69 92.69$
Deferred Taxes $ 204.21 204.21$
Other Liabilities $ 7.35 7.35$
Total Liabilities $ 1,310.00 1,310.00$
Common Equity (Total) $ 338.00 338.00$
Total Shareholders'
Equity $ 338.00
338.00$
Total Equity $ 338.00 338.00$
Retained Earnings 238.14$ 91.64 146.50$ 91.64
Liabilities &
Shareholders' Equity $ 1,650.00
1,650.00$ 1,558.36$
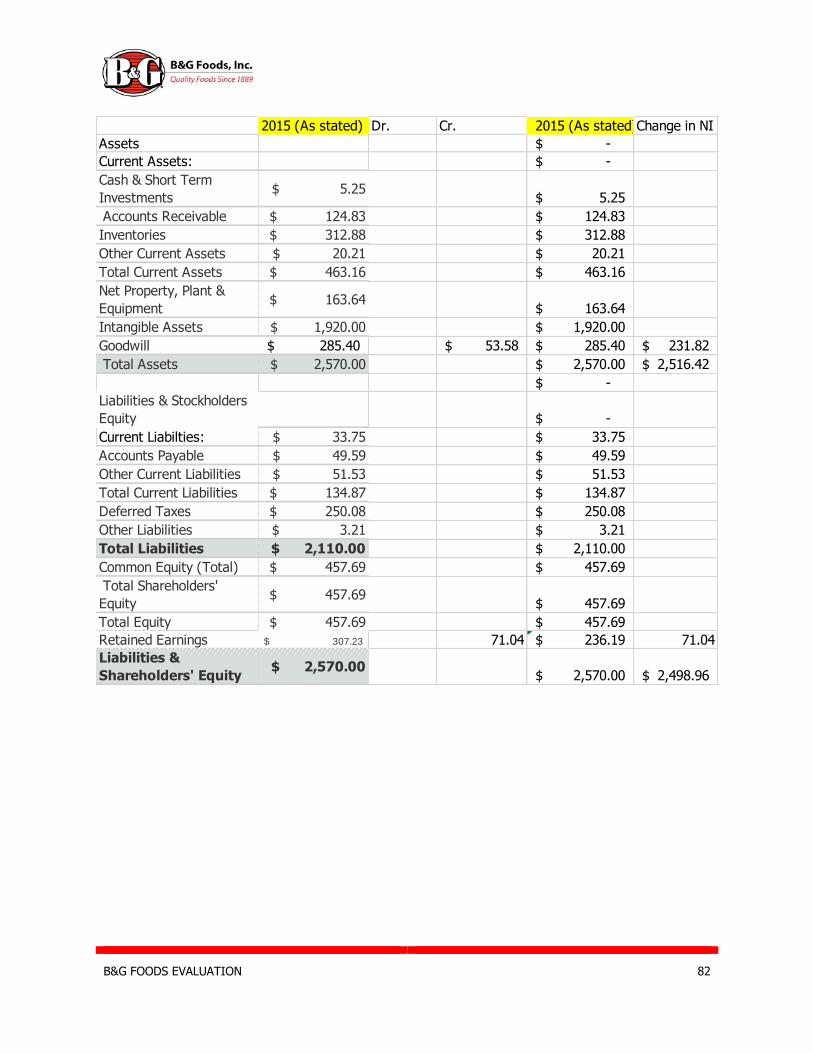
B&G FOODS EVALUATION 82
2015 (As stated) Dr. Cr. 2015 (As stated)Change in NI
Assets -$
Current Assets: -$
Cash & Short Term
Investments $ 5.25
5.25$
Accounts Receivable $ 124.83 124.83$
Inventories $ 312.88 312.88$
Other Current Assets $ 20.21 20.21$
Total Current Assets $ 463.16 463.16$
Net Property, Plant &
Equipment $ 163.64
163.64$
Intangible Assets $ 1,920.00 1,920.00$
Goodwill 285.40$ 53.58$ 285.40$ 231.82$
Total Assets $ 2,570.00 2,570.00$ 2,516.42$
-$
Liabilities & Stockholders
Equity -$
Current Liabilties: $ 33.75 33.75$
Accounts Payable $ 49.59 49.59$
Other Current Liabilities $ 51.53 51.53$
Total Current Liabilities $ 134.87 134.87$
Deferred Taxes $ 250.08 250.08$
Other Liabilities $ 3.21 3.21$
Total Liabilities $ 2,110.00 2,110.00$
Common Equity (Total) $ 457.69 457.69$
Total Shareholders'
Equity $ 457.69
457.69$
Total Equity $ 457.69 457.69$
Retained Earnings 307.23$ 71.04 236.19$ 71.04
Liabilities &
Shareholders' Equity $ 2,570.00
2,570.00$ 2,498.96$
B&G FOODS EVALUATION 83
Introduction to Financial Analysis
In order to develop a clear understanding of a firm’s value, a prospective
analysis must be conducted. The primary portion of this prospective analysis
consists of forecasting the firm’s restated financials as well as evaluating their
current ones through the use of profitability and liquidity ratios. This analysis will
show B&G Foods’ ability to repay their debt, their operating efficiencies, and their
potential future sales and costs of goods sold. Finally, this section will cover the
firm’s weighted average cost of capital (WACC) through the calculation of their
cost of debt and equity.
Ratio Analysis
The analysis of a firm’s ratios is a good indicator of the firm’s current
financial standing. These ratios show how well the firm is operating and their
relative efficiency compared to the firm’s benchmark competitors. The ratios
discussed in this section will show the profitability, liquidity, and capital structure
of the firm. These ratios are essential to forecasting the firm’s potential future
performance.
Liquidity Ratios
The ratios concerning the firm’s liquidity involve the cash and cash
equivalents that they currently have and their respective ability to repay their
current liabilities. Liquid assets are ones that may be quickly converted into cash
in the event of the firm having to repay their debt. The higher the liquidity of the
firm the more favorable they are to financial institutions which may lend the firm
funds in order to raise capital. Also, the higher the liquidity of the firm, the more
financially sound they are to potential investors. The ratios we will examine in this

B&G FOODS EVALUATION 84
section include the quick asset ratio, current ratio, working capital turnover,
inventory turnover, accounts receivable turnover, and cash to cash cycle.
Current Ratio
The firm’s current ratio relates to a firm’s current liabilities relative to their
current assets. This ratio is significant because it indicates a firm’s liquidity as well
as the composition of their balance sheet. The current ratio is computed simply by
taking the firm’s current assets divided by their current liabilities. The type of
current assets that the firm has must also be taken into account because some
current assets are easier to liquidate than others. However, if a firm has a ratio of
over one it is considered to be liquid and able to repay their current liabilities with
ease under regular economic conditions.
2011 2012 2013 2014 2015
B&G Foods 2.09 1.57 1.72 2.12 3.43
Kellogg 0.91 0.75 0.85 0.77 0.56
The J.M. Smucker 3.39 2.66 2.67 1.73 2.01
General Mills Inc. 1.07 0.96 0.81 0.81 0.77
Industry 1.87 1.49 1.51 1.36 1.69
0.00
0.50
1.00
1.50
2.00
2.50
3.00
3.50
4.00
Current ratio
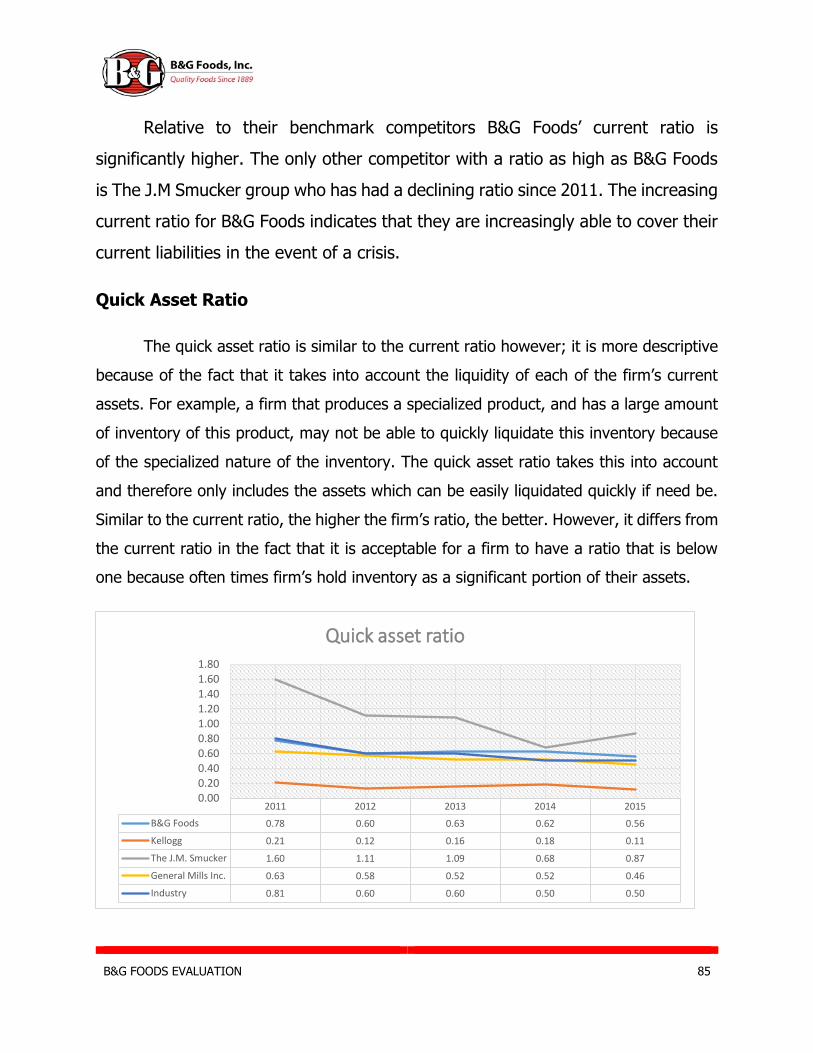
B&G FOODS EVALUATION 85
Relative to their benchmark competitors B&G Foods’ current ratio is
significantly higher. The only other competitor with a ratio as high as B&G Foods
is The J.M Smucker group who has had a declining ratio since 2011. The increasing
current ratio for B&G Foods indicates that they are increasingly able to cover their
current liabilities in the event of a crisis.
Quick Asset Ratio
The quick asset ratio is similar to the current ratio however; it is more descriptive
because of the fact that it takes into account the liquidity of each of the firm’s current
assets. For example, a firm that produces a specialized product, and has a large amount
of inventory of this product, may not be able to quickly liquidate this inventory because
of the specialized nature of the inventory. The quick asset ratio takes this into account
and therefore only includes the assets which can be easily liquidated quickly if need be.
Similar to the current ratio, the higher the firm’s ratio, the better. However, it differs from
the current ratio in the fact that it is acceptable for a firm to have a ratio that is below
one because often times firm’s hold inventory as a significant portion of their assets.
2011 2012 2013 2014 2015
B&G Foods 0.78 0.60 0.63 0.62 0.56
Kellogg 0.21 0.12 0.16 0.18 0.11
The J.M. Smucker 1.60 1.11 1.09 0.68 0.87
General Mills Inc. 0.63 0.58 0.52 0.52 0.46
Industry 0.81 0.60 0.60 0.50 0.50
0.000.200.400.600.801.001.201.401.601.80
Quick asset ratio
B&G FOODS EVALUATION 86
The quick asset ratio industry wide is considerably lower than the current
ratios due to the fact that inventories are removed. The industry seems to be
converging to a figure between .50-.80 besides two of the benchmark competitors.
B&G Foods has the second highest quick asset ratio meaning that they are able to
cover their current liabilities through their most liquid current assets better than
most of their benchmark competitors. However, a ratio below 1 is less than
desirable because in the case of a downturn in the economy the company must
be able to cover their current liabilities.
Conclusion
In the processed an packaged food industry many of the companies lack
sufficient liquidity. B&G Foods has a superior current ratio and an above industry
average quick asset ratio indicating that they would be able to cover their current
liabilities in the case of an economic downturn. The only concern in regard to B&G
Foods’ liquidity would be their quick asset ratio being below one however, this is
in part due to the inventory on hand. Besides The J.M Smucker Group, the industry
liquidity ratios have remained stable.
Operating Efficiency Ratios
A firm’s operating efficiency ratios indicate how quickly and efficiently the
firm is able to convert their inventory and accounts receivable into cash. Typically,
the higher the firm’s ratios, the more efficiently they are operating and they more
likely they are to be able to cover their current liabilities. Firm’s that operate more
efficiently are also usually able to keep less inventory on hand thus, have more
liquid current assets.
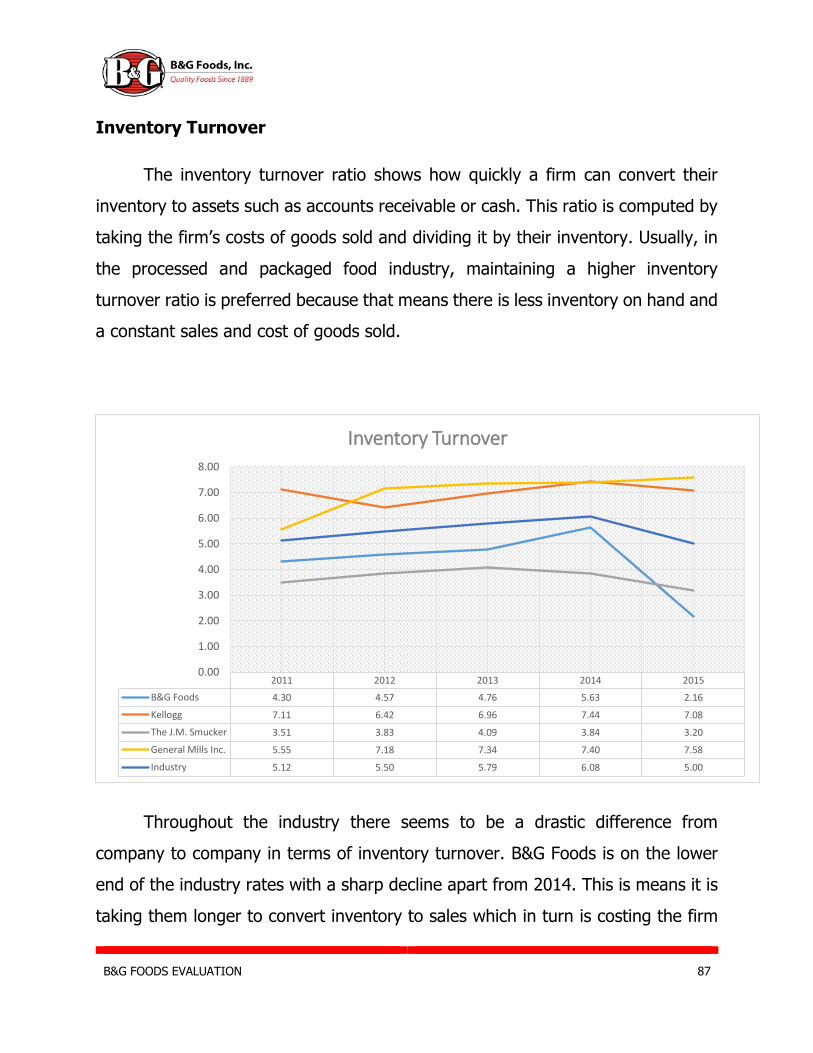
B&G FOODS EVALUATION 87
Inventory Turnover
The inventory turnover ratio shows how quickly a firm can convert their
inventory to assets such as accounts receivable or cash. This ratio is computed by
taking the firm’s costs of goods sold and dividing it by their inventory. Usually, in
the processed and packaged food industry, maintaining a higher inventory
turnover ratio is preferred because that means there is less inventory on hand and
a constant sales and cost of goods sold.
Throughout the industry there seems to be a drastic difference from
company to company in terms of inventory turnover. B&G Foods is on the lower
end of the industry rates with a sharp decline apart from 2014. This is means it is
taking them longer to convert inventory to sales which in turn is costing the firm
2011 2012 2013 2014 2015
B&G Foods 4.30 4.57 4.76 5.63 2.16
Kellogg 7.11 6.42 6.96 7.44 7.08
The J.M. Smucker 3.51 3.83 4.09 3.84 3.20
General Mills Inc. 5.55 7.18 7.34 7.40 7.58
Industry 5.12 5.50 5.79 6.08 5.00
0.00
1.00
2.00
3.00
4.00
5.00
6.00
7.00
8.00
Inventory Turnover
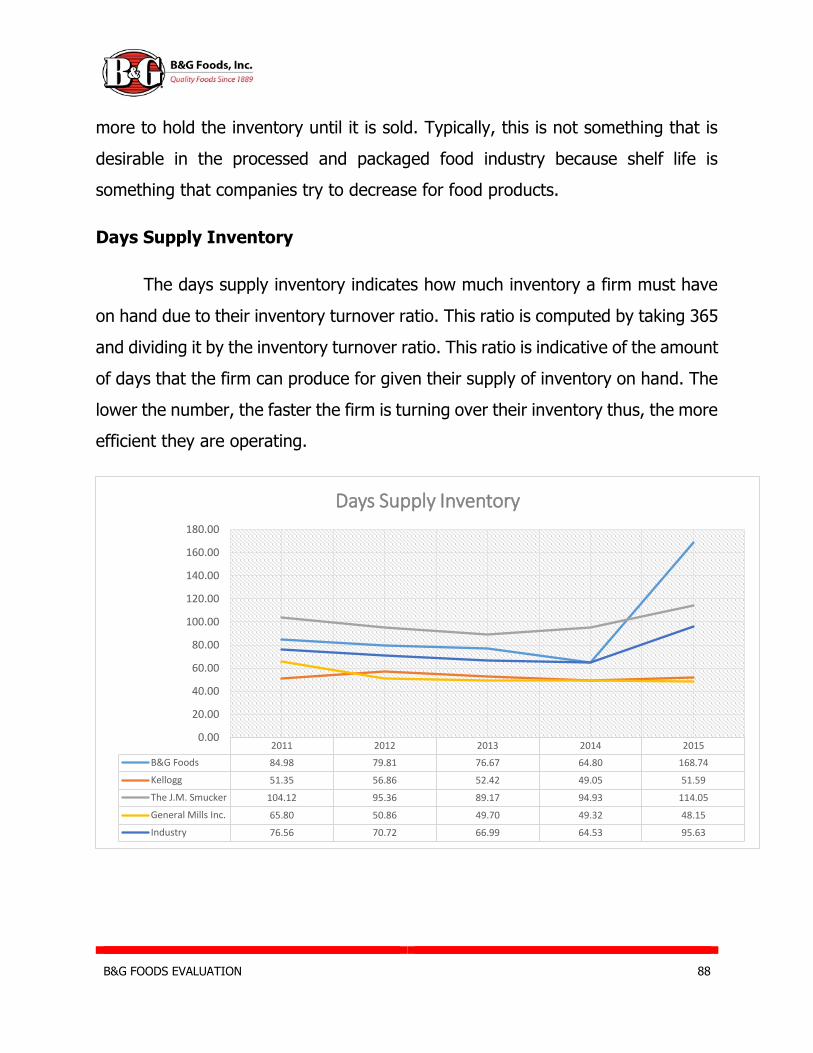
B&G FOODS EVALUATION 88
more to hold the inventory until it is sold. Typically, this is not something that is
desirable in the processed and packaged food industry because shelf life is
something that companies try to decrease for food products.
Days Supply Inventory
The days supply inventory indicates how much inventory a firm must have
on hand due to their inventory turnover ratio. This ratio is computed by taking 365
and dividing it by the inventory turnover ratio. This ratio is indicative of the amount
of days that the firm can produce for given their supply of inventory on hand. The
lower the number, the faster the firm is turning over their inventory thus, the more
efficient they are operating.
2011 2012 2013 2014 2015
B&G Foods 84.98 79.81 76.67 64.80 168.74
Kellogg 51.35 56.86 52.42 49.05 51.59
The J.M. Smucker 104.12 95.36 89.17 94.93 114.05
General Mills Inc. 65.80 50.86 49.70 49.32 48.15
Industry 76.56 70.72 66.99 64.53 95.63
0.00
20.00
40.00
60.00
80.00
100.00
120.00
140.00
160.00
180.00
Days Supply Inventory

B&G FOODS EVALUATION 89
Although the industry average has been increasing apart from 2014, B&G
Foods has the longest holding period relative to their benchmark competitors. Due
to the direct relation between inventory turnover and days supply inventory it
makes sense that B&G Foods has the longest holding period however, this may be
a cause for concern.
Accounts Receivable Turnover
The accounts receivable turnover ratio shows the company’s accounts
receivable as related to the company’s total sales. It is computed by taking the
total sales divided by the accounts receivable. The higher the number the more
frequently they are collecting their accounts receivable and in turn the lower their
days sales outstanding figure will be.
2011 2012 2013 2014 2015
B&G Foods 13.78 14.62 11.55 15.16 13.86
Kellogg 11.11 9.76 10.39 11.43 10.06
The J.M. Smucker 14.01 15.90 18.80 18.13 13.24
General Mills Inc. 12.80 12.59 12.29 12.07 12.71
Industry 12.93 13.22 13.26 14.20 12.47
0.00
2.00
4.00
6.00
8.00
10.00
12.00
14.00
16.00
18.00
20.00
Accounts Receivable Turnover
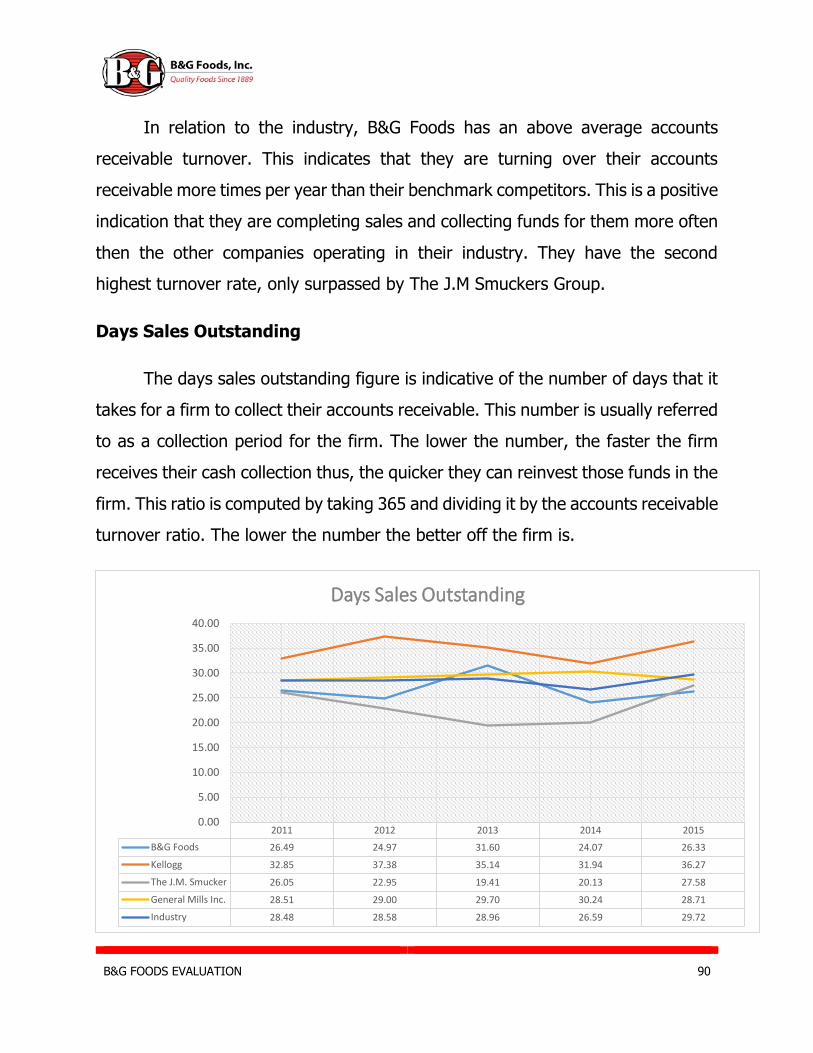
B&G FOODS EVALUATION 90
In relation to the industry, B&G Foods has an above average accounts
receivable turnover. This indicates that they are turning over their accounts
receivable more times per year than their benchmark competitors. This is a positive
indication that they are completing sales and collecting funds for them more often
then the other companies operating in their industry. They have the second
highest turnover rate, only surpassed by The J.M Smuckers Group.
Days Sales Outstanding
The days sales outstanding figure is indicative of the number of days that it
takes for a firm to collect their accounts receivable. This number is usually referred
to as a collection period for the firm. The lower the number, the faster the firm
receives their cash collection thus, the quicker they can reinvest those funds in the
firm. This ratio is computed by taking 365 and dividing it by the accounts receivable
turnover ratio. The lower the number the better off the firm is.
2011 2012 2013 2014 2015
B&G Foods 26.49 24.97 31.60 24.07 26.33
Kellogg 32.85 37.38 35.14 31.94 36.27
The J.M. Smucker 26.05 22.95 19.41 20.13 27.58
General Mills Inc. 28.51 29.00 29.70 30.24 28.71
Industry 28.48 28.58 28.96 26.59 29.72
0.00
5.00
10.00
15.00
20.00
25.00
30.00
35.00
40.00
Days Sales Outstanding
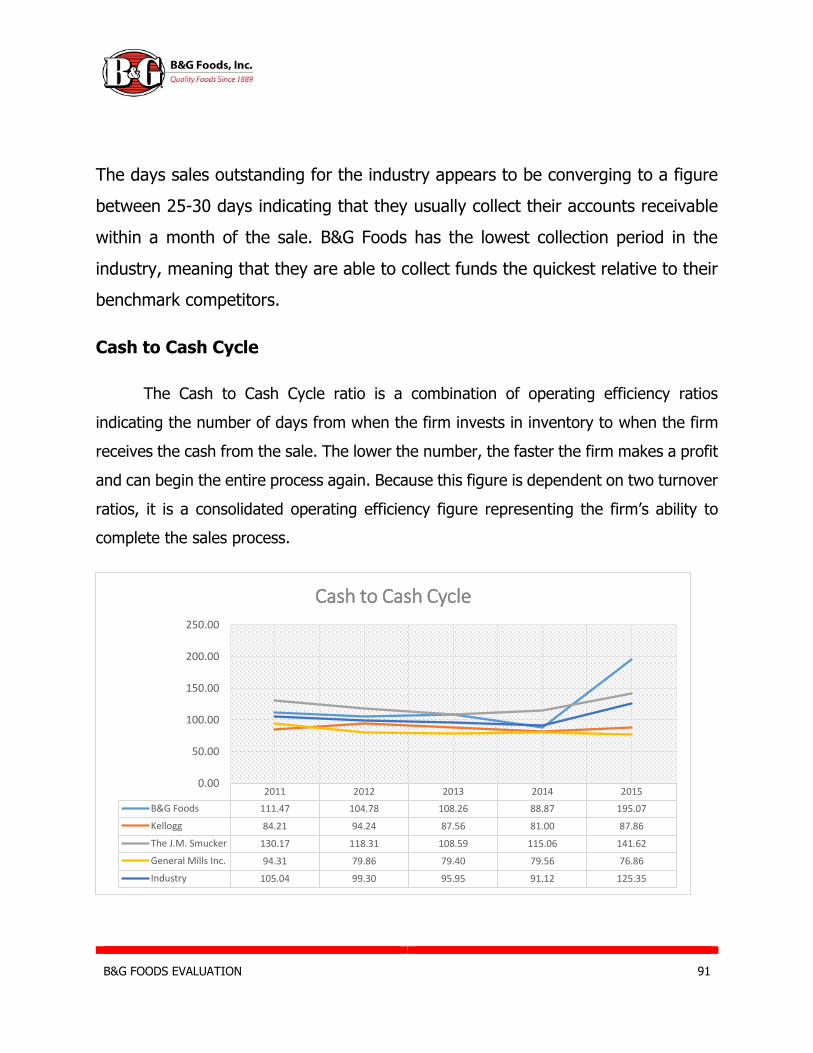
B&G FOODS EVALUATION 91
The days sales outstanding for the industry appears to be converging to a figure
between 25-30 days indicating that they usually collect their accounts receivable
within a month of the sale. B&G Foods has the lowest collection period in the
industry, meaning that they are able to collect funds the quickest relative to their
benchmark competitors.
Cash to Cash Cycle
The Cash to Cash Cycle ratio is a combination of operating efficiency ratios
indicating the number of days from when the firm invests in inventory to when the firm
receives the cash from the sale. The lower the number, the faster the firm makes a profit
and can begin the entire process again. Because this figure is dependent on two turnover
ratios, it is a consolidated operating efficiency figure representing the firm’s ability to
complete the sales process.
2011 2012 2013 2014 2015
B&G Foods 111.47 104.78 108.26 88.87 195.07
Kellogg 84.21 94.24 87.56 81.00 87.86
The J.M. Smucker 130.17 118.31 108.59 115.06 141.62
General Mills Inc. 94.31 79.86 79.40 79.56 76.86
Industry 105.04 99.30 95.95 91.12 125.35
0.00
50.00
100.00
150.00
200.00
250.00
Cash to Cash Cycle
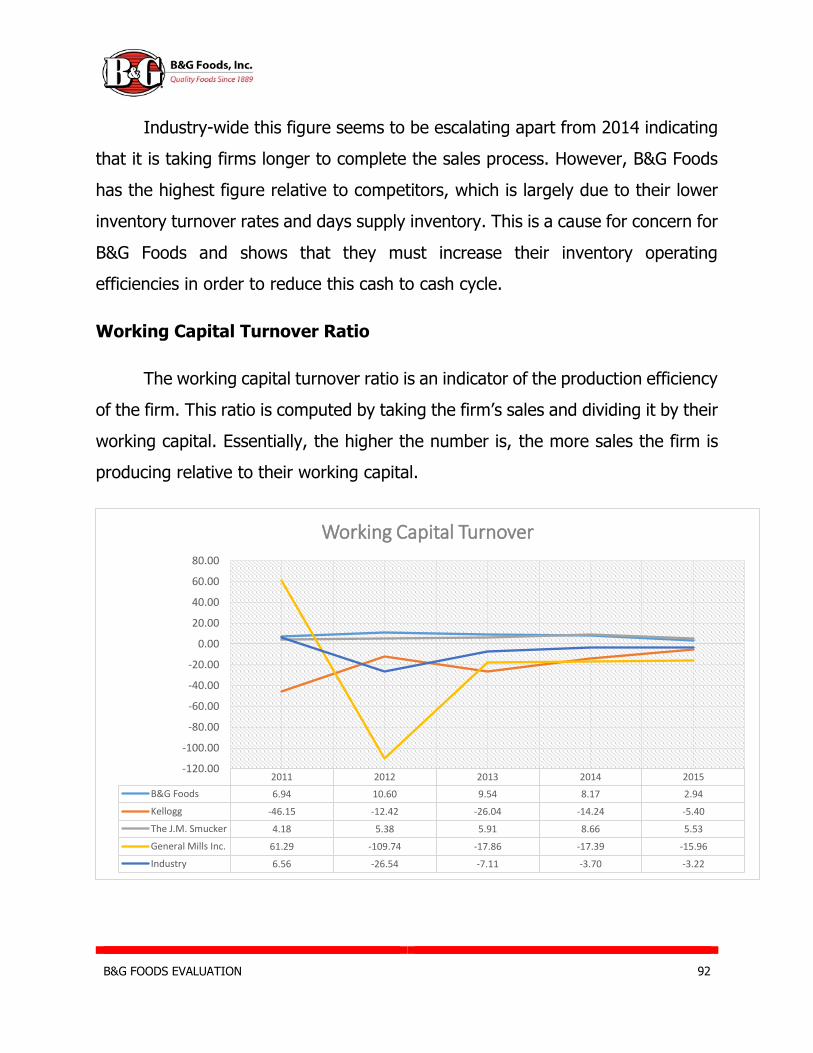
B&G FOODS EVALUATION 92
Industry-wide this figure seems to be escalating apart from 2014 indicating
that it is taking firms longer to complete the sales process. However, B&G Foods
has the highest figure relative to competitors, which is largely due to their lower
inventory turnover rates and days supply inventory. This is a cause for concern for
B&G Foods and shows that they must increase their inventory operating
efficiencies in order to reduce this cash to cash cycle.
Working Capital Turnover Ratio
The working capital turnover ratio is an indicator of the production efficiency
of the firm. This ratio is computed by taking the firm’s sales and dividing it by their
working capital. Essentially, the higher the number is, the more sales the firm is
producing relative to their working capital.
2011 2012 2013 2014 2015
B&G Foods 6.94 10.60 9.54 8.17 2.94
Kellogg -46.15 -12.42 -26.04 -14.24 -5.40
The J.M. Smucker 4.18 5.38 5.91 8.66 5.53
General Mills Inc. 61.29 -109.74 -17.86 -17.39 -15.96
Industry 6.56 -26.54 -7.11 -3.70 -3.22
-120.00
-100.00
-80.00
-60.00
-40.00
-20.00
0.00
20.00
40.00
60.00
80.00
Working Capital Turnover
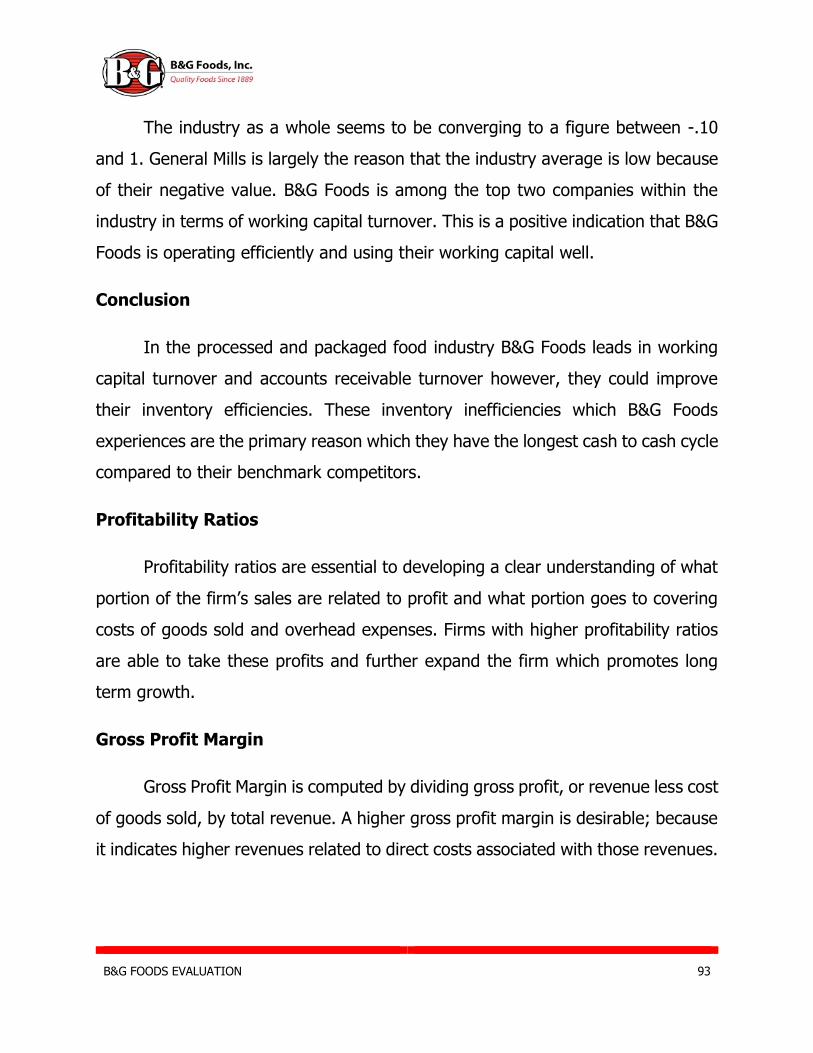
B&G FOODS EVALUATION 93
The industry as a whole seems to be converging to a figure between -.10
and 1. General Mills is largely the reason that the industry average is low because
of their negative value. B&G Foods is among the top two companies within the
industry in terms of working capital turnover. This is a positive indication that B&G
Foods is operating efficiently and using their working capital well.
Conclusion
In the processed and packaged food industry B&G Foods leads in working
capital turnover and accounts receivable turnover however, they could improve
their inventory efficiencies. These inventory inefficiencies which B&G Foods
experiences are the primary reason which they have the longest cash to cash cycle
compared to their benchmark competitors.
Profitability Ratios
Profitability ratios are essential to developing a clear understanding of what
portion of the firm’s sales are related to profit and what portion goes to covering
costs of goods sold and overhead expenses. Firms with higher profitability ratios
are able to take these profits and further expand the firm which promotes long
term growth.
Gross Profit Margin
Gross Profit Margin is computed by dividing gross profit, or revenue less cost
of goods sold, by total revenue. A higher gross profit margin is desirable; because
it indicates higher revenues related to direct costs associated with those revenues.
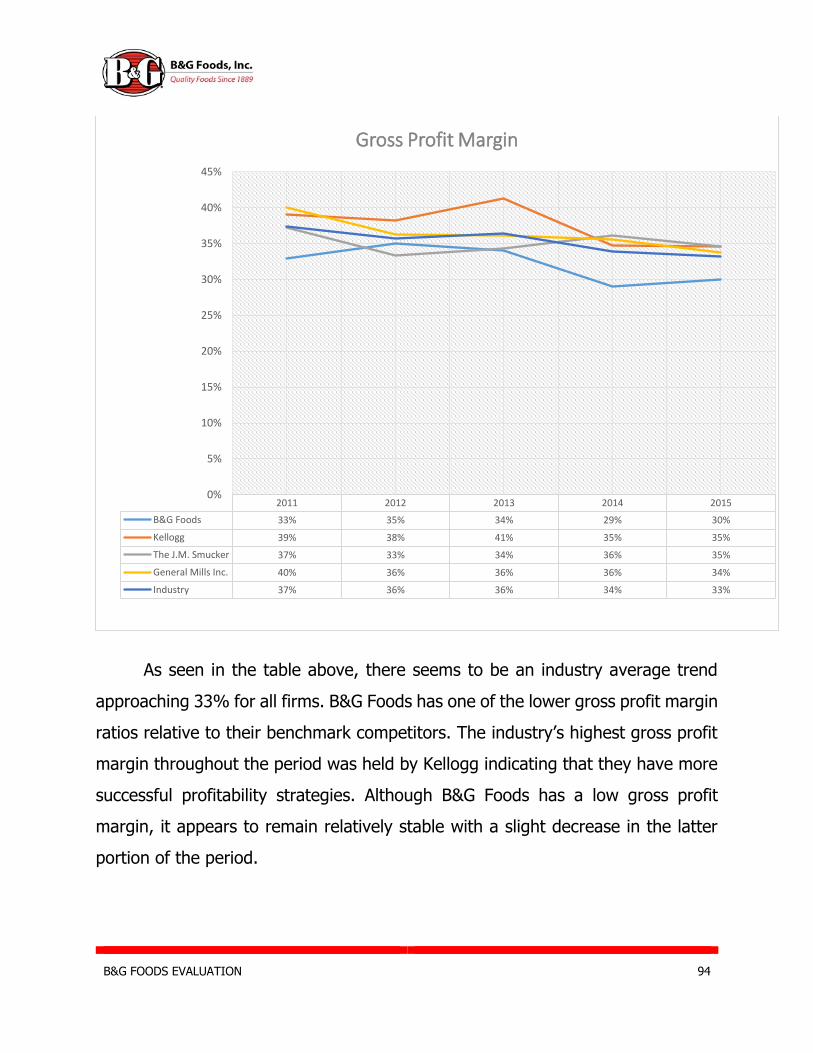
B&G FOODS EVALUATION 94
As seen in the table above, there seems to be an industry average trend
approaching 33% for all firms. B&G Foods has one of the lower gross profit margin
ratios relative to their benchmark competitors. The industry’s highest gross profit
margin throughout the period was held by Kellogg indicating that they have more
successful profitability strategies. Although B&G Foods has a low gross profit
margin, it appears to remain relatively stable with a slight decrease in the latter
portion of the period.
2011 2012 2013 2014 2015
B&G Foods 33% 35% 34% 29% 30%
Kellogg 39% 38% 41% 35% 35%
The J.M. Smucker 37% 33% 34% 36% 35%
General Mills Inc. 40% 36% 36% 36% 34%
Industry 37% 36% 36% 34% 33%
0%
5%
10%
15%
20%
25%
30%
35%
40%
45%
Gross Profit Margin
B&G FOODS EVALUATION 95
Operating Profit Margin
After operating expenses have been paid, a firm can divide the remaining
operating income by sales to compute the Operating Profit Margin. This ratio is
indicative of the portion of income from operations that is related to profit. It can
also be used as a great measure of how efficient the firm is being with regards to
operations such as pricing. The fewer operating expenses that a firm incurs, the
more profitable it’s income from operations will be.
Operating profit margins vary widely throughout the period with The J.M Smucker
group leading for the majority with the exception of 2012. The industry exhibits significant
2011 2012 2013 2014 2015
B&G Foods 21% 24% 21% 14% 18%
Kellogg 11% 11% 19% 7% 8%
The J.M. Smucker 26% 21% 24% 26% 21%
General Mills Inc. 20% 18% 16% 17% 12%
Industry 19% 19% 20% 16% 15%
Restated 10% 13% 10% 11% 12%
0%
5%
10%
15%
20%
25%
30%
Operating Profit Margin
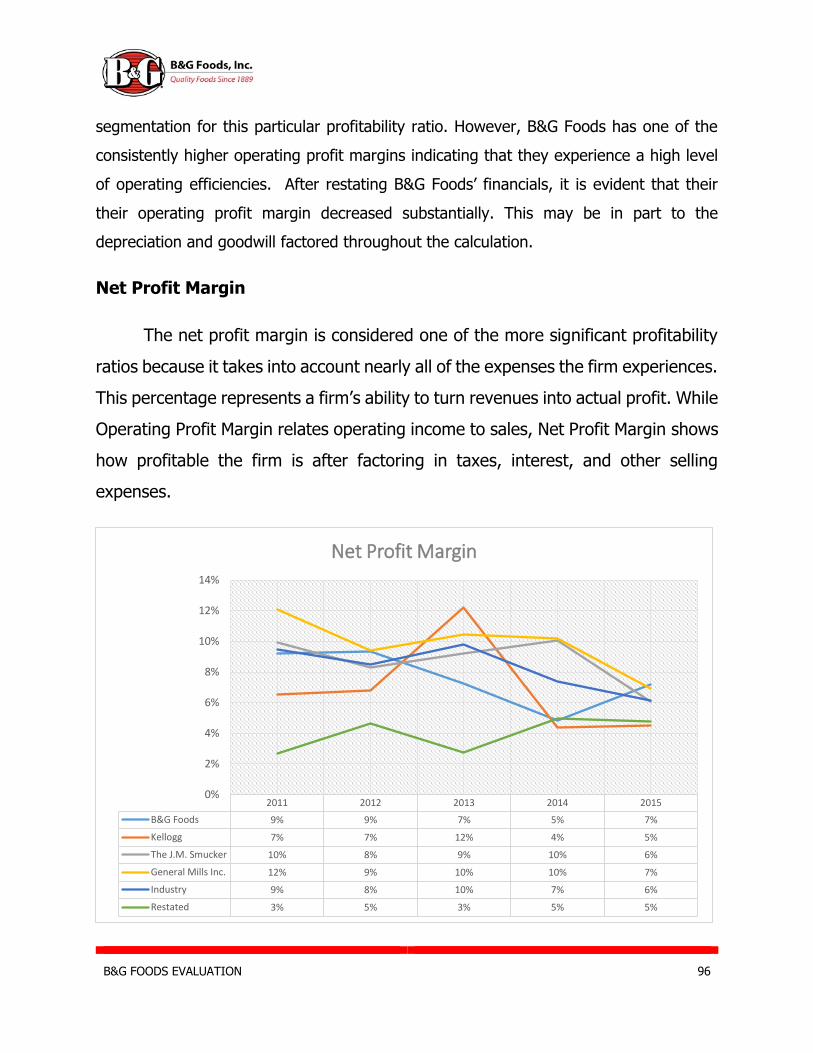
B&G FOODS EVALUATION 96
segmentation for this particular profitability ratio. However, B&G Foods has one of the
consistently higher operating profit margins indicating that they experience a high level
of operating efficiencies. After restating B&G Foods’ financials, it is evident that their
their operating profit margin decreased substantially. This may be in part to the
depreciation and goodwill factored throughout the calculation.
Net Profit Margin
The net profit margin is considered one of the more significant profitability
ratios because it takes into account nearly all of the expenses the firm experiences.
This percentage represents a firm’s ability to turn revenues into actual profit. While
Operating Profit Margin relates operating income to sales, Net Profit Margin shows
how profitable the firm is after factoring in taxes, interest, and other selling
expenses.
2011 2012 2013 2014 2015
B&G Foods 9% 9% 7% 5% 7%
Kellogg 7% 7% 12% 4% 5%
The J.M. Smucker 10% 8% 9% 10% 6%
General Mills Inc. 12% 9% 10% 10% 7%
Industry 9% 8% 10% 7% 6%
Restated 3% 5% 3% 5% 5%
0%
2%
4%
6%
8%
10%
12%
14%
Net Profit Margin
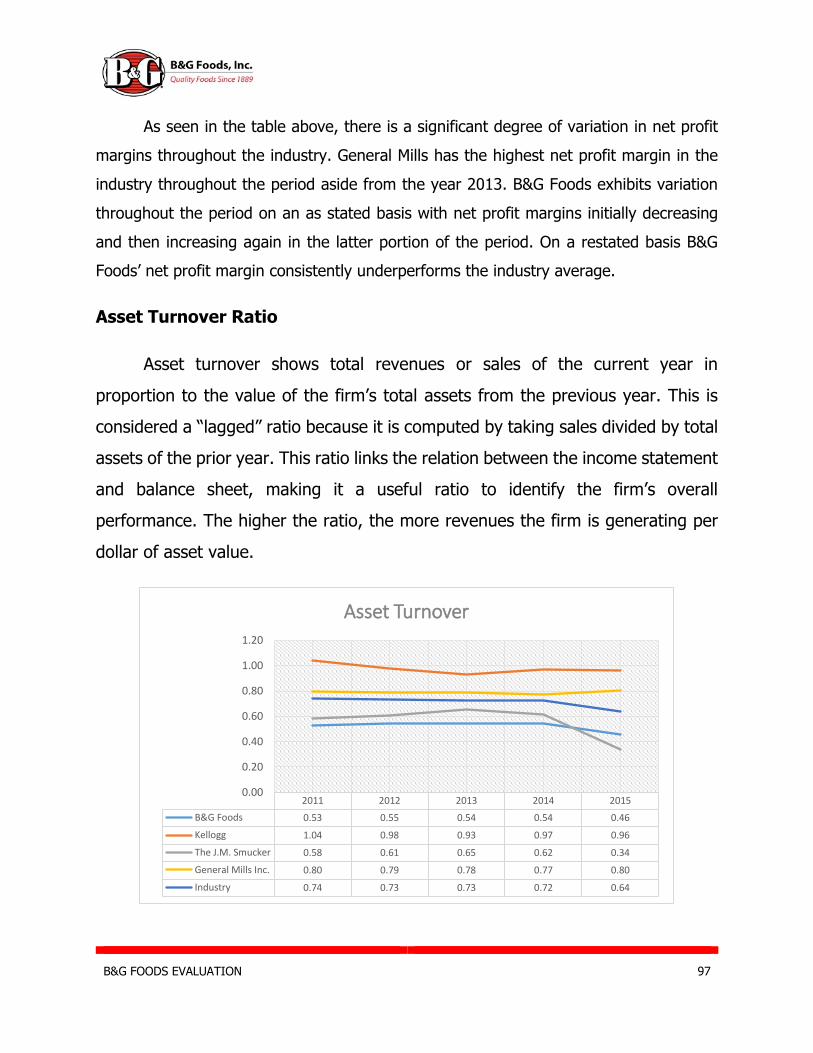
B&G FOODS EVALUATION 97
As seen in the table above, there is a significant degree of variation in net profit
margins throughout the industry. General Mills has the highest net profit margin in the
industry throughout the period aside from the year 2013. B&G Foods exhibits variation
throughout the period on an as stated basis with net profit margins initially decreasing
and then increasing again in the latter portion of the period. On a restated basis B&G
Foods’ net profit margin consistently underperforms the industry average.
Asset Turnover Ratio
Asset turnover shows total revenues or sales of the current year in
proportion to the value of the firm’s total assets from the previous year. This is
considered a “lagged” ratio because it is computed by taking sales divided by total
assets of the prior year. This ratio links the relation between the income statement
and balance sheet, making it a useful ratio to identify the firm’s overall
performance. The higher the ratio, the more revenues the firm is generating per
dollar of asset value.
2011 2012 2013 2014 2015
B&G Foods 0.53 0.55 0.54 0.54 0.46
Kellogg 1.04 0.98 0.93 0.97 0.96
The J.M. Smucker 0.58 0.61 0.65 0.62 0.34
General Mills Inc. 0.80 0.79 0.78 0.77 0.80
Industry 0.74 0.73 0.73 0.72 0.64
0.00
0.20
0.40
0.60
0.80
1.00
1.20
Asset Turnover

B&G FOODS EVALUATION 98
As seen above, there is a significant degree of segmentation throughout the
industry in asset turnover ratios. B&G Foods has an asset turnover ratio which
consistently underperformed the industry average. Moreover, their ratio was the
lowest in the industry for the majority of the period. This is a negative indication
of their sales performance relative to the dollar value of their total assets.
Return on Assets
Return on Assets, or ROA, is calculated by dividing Net Income by the Total
Assets for the previous year. This profitability ratio represents how well the firm
utilizes their assets to maximize their income. The higher the ratio, the more
profitable the firm and the more efficiently they are using their assets.
2011 2012 2013 2014 2015
B&G Foods 5% 5% 4% 3% 3%
Kellogg 7% 8% 12% 4% 4%
The J.M. Smucker 6% 5% 6% 6% 2%
General Mills Inc. 10% 7% 8% 8% 6%
Industry 7% 6% 8% 5% 4%
Return on Assets 2% 3% 3% 2% 2%
0%
2%
4%
6%
8%
10%
12%
14%
Return on Assets
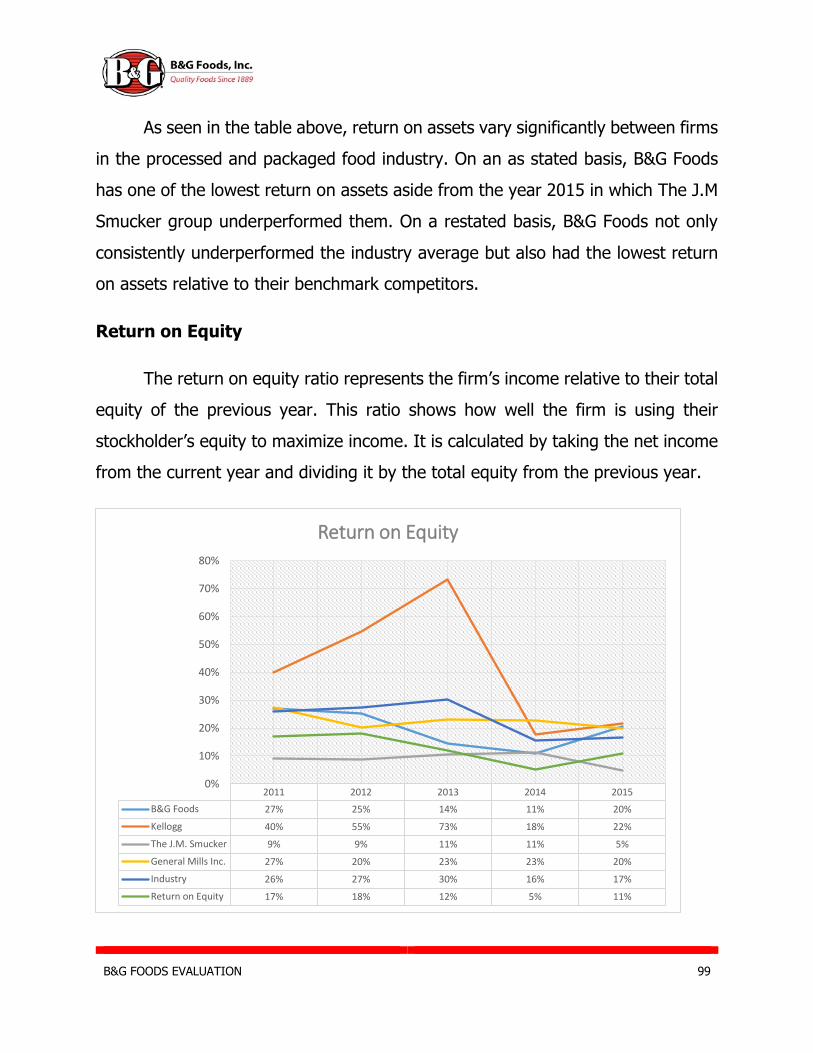
B&G FOODS EVALUATION 99
As seen in the table above, return on assets vary significantly between firms
in the processed and packaged food industry. On an as stated basis, B&G Foods
has one of the lowest return on assets aside from the year 2015 in which The J.M
Smucker group underperformed them. On a restated basis, B&G Foods not only
consistently underperformed the industry average but also had the lowest return
on assets relative to their benchmark competitors.
Return on Equity
The return on equity ratio represents the firm’s income relative to their total
equity of the previous year. This ratio shows how well the firm is using their
stockholder’s equity to maximize income. It is calculated by taking the net income
from the current year and dividing it by the total equity from the previous year.
2011 2012 2013 2014 2015
B&G Foods 27% 25% 14% 11% 20%
Kellogg 40% 55% 73% 18% 22%
The J.M. Smucker 9% 9% 11% 11% 5%
General Mills Inc. 27% 20% 23% 23% 20%
Industry 26% 27% 30% 16% 17%
Return on Equity 17% 18% 12% 5% 11%
0%
10%
20%
30%
40%
50%
60%
70%
80%
Return on Equity

B&G FOODS EVALUATION 100
There appears to be significant variation from firm to firm for ROE
throughout the industry as seen in the table above. The industry average
drastically decreased after the year 2013 and has been steadily dropping from that
point forward. Kellogg has the highest ROE for the majority of the period only
being surpassed by General Mills in 2014. All other factors aside, B&G Foods and
The J.M Smucker group are not utilizing shareholder wealth at optimal levels in
order to generate profits relative to their benchmark competitors.
Conclusion
B&G Foods appears to be in need of increases in operating efficiencies in order to
improve profitability. They have consistently been among the lower firms in the majority
of the above profitability ratios. Due to the lagged nature of some of these ratios, and
the difficulty of increasing efficiencies, they take some time to improve and are thus stable
through time. Kellogg and General Mills are the top competitors in the industry and B&G
Foods will need to improve profitability and efficiency in order to better compete with
them.
Capital Structure Ratios
A firm’s capital structure ratios are a measure of how their they finance their
assets through debt and equity. Typically, the more debt a firm has, the riskier the
firm is considered to be by investors. However, the the cost of debt is usually
cheaper than the cost of equity therefore it is something that must be considered
when evaluating a company.

B&G FOODS EVALUATION 101
Debt to Equity
The debt to equity ratio is representative of a firm’s capital structure. The
more leveraged the firm is, the higher the ratio will be. It is computed by taking
the total value of liabilities divided by the book value of stockholder’s equity. The
higher the leverage of the firm, the higher the return on equity they will produce.
However, this also indicates that the firm is considered riskier because equity
claims are residual and debt must be paid off first in the case of an economic crisis
for the firm.
As seen above, there is a segmentation of debt to equity ratios throughout
the industry with values ranging from 0 to 6.2. B&G Foods has a higher ratio than
most of their benchmark competitors with the exception of Kellogg. This high ratio
2011 2012 2013 2014 2015
B&G Foods 3.81 2.30 2.92 3.88 4.62
Kellogg 5.75 5.15 3.29 4.31 6.17
The J.M. Smucker 0.57 0.77 0.75 0.80 1.38
General Mills Inc. 1.82 1.73 1.80 1.90 2.56
Industry 2.99 2.49 2.19 2.72 3.68
0.00
1.00
2.00
3.00
4.00
5.00
6.00
7.00
Debt to Equity Ratio (total liabilities)

B&G FOODS EVALUATION 102
indicates that B&G Foods is more leveraged than their competitors within the
industry thus, considered riskier by investors. Although the ratios throughout the
industry are vary significantly, they have exhibited a steadily increasing rate apart
from 2014 meaning that most firms are slowly acquiring more debt.
Times Interest Earned
Times interest earned is a represents the firm’s ability to repay their debt’s
interest relative to their regular operating income. It is calculated by taking the
firm’s net income before interest and taxes divided by their interest expense. The
higher the ratio, the more easily a firm can pay their interest thus the more
favorable terms they will attain if they need to acquire debt to raise capital.
Although there is a range of values throughout the industry for the times
interest earned ratio, there is a declining pattern seen apart from 2014. B&G Foods
2011 2012 2013 2014 2015
B&G Foods 2.89 2.87 2.83 2.79 2.32
Kellogg 6.12 5.98 12.07 4.90 4.81
The J.M. Smucker 10.30 8.62 8.75 10.70 6.55
General Mills Inc. 7.37 7.71 8.00 8.78 5.59
Industry 6.67 6.30 7.91 6.79 4.82
0.00
2.00
4.00
6.00
8.00
10.00
12.00
14.00
Times Interest Earned Ratio

B&G FOODS EVALUATION 103
has the lowest value in the industry indicating that their interest expense accounts
for a large portion of their net income before interest and taxes. This low ratio
may be a cause for concern in the case that the firm is attempting to acquire new
debt because of the high proportion of their income already allotted to interest
expenses.
Altman’s Z-Score
The Altman Z-Score is a measurement of creditworthiness that consists of
five ratios. This measurement is used to predict the probability of bankruptcy for
a firm. A score below 1.81 indicates that bankruptcy is a greater possibility. A score
between 1.81 and 2.67 is the grey are in which it is undetermined and any score
about 2.67 is considered credit worthy with little to no risk of bankruptcy. The
calculation is computed as follows:
Z- Score= 1.2(net working capital/total assets) + 1.4(retained earnings/total assets) +
3.3(EBIT/total assets) + .6(MVE/BVL) + (sales/total assets).
2011 2012 2013 2014 2015
B&G Foods 1.62 2.14 1.86 1.65 1.40
Kellogg 3.99 3.41 4.09 3.87 3.92
The J.M. Smucker 1.20 1.17 1.28 1.21 0.66
General Mills Inc. 4.13 3.81 4.00 4.10 3.97
Industry 2.73 2.63 2.81 2.71 2.49
0.000.50
1.001.502.002.503.003.504.004.50
Altman's Z-Score
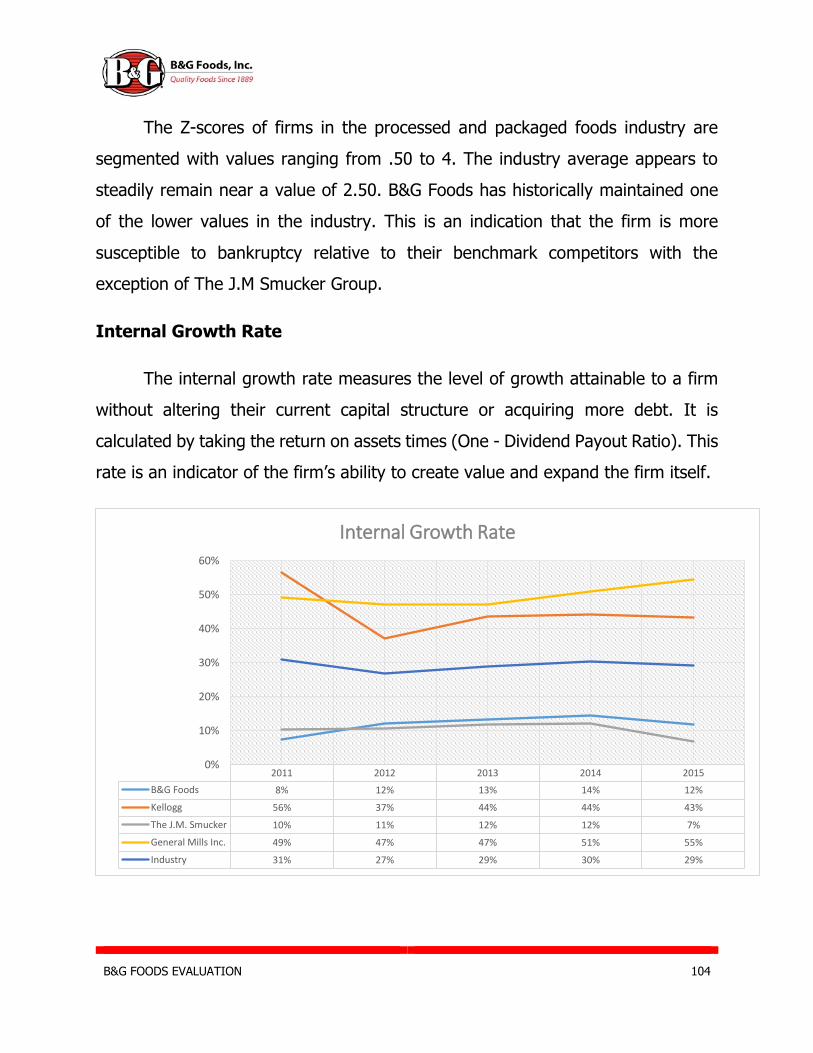
B&G FOODS EVALUATION 104
The Z-scores of firms in the processed and packaged foods industry are
segmented with values ranging from .50 to 4. The industry average appears to
steadily remain near a value of 2.50. B&G Foods has historically maintained one
of the lower values in the industry. This is an indication that the firm is more
susceptible to bankruptcy relative to their benchmark competitors with the
exception of The J.M Smucker Group.
Internal Growth Rate
The internal growth rate measures the level of growth attainable to a firm
without altering their current capital structure or acquiring more debt. It is
calculated by taking the return on assets times (One - Dividend Payout Ratio). This
rate is an indicator of the firm’s ability to create value and expand the firm itself.
2011 2012 2013 2014 2015
B&G Foods 8% 12% 13% 14% 12%
Kellogg 56% 37% 44% 44% 43%
The J.M. Smucker 10% 11% 12% 12% 7%
General Mills Inc. 49% 47% 47% 51% 55%
Industry 31% 27% 29% 30% 29%
0%
10%
20%
30%
40%
50%
60%
Internal Growth Rate

B&G FOODS EVALUATION 105
As seen above, the internal growth rate of firms within the processed and
packaged food industry are characterized by segmentation throughout the last five
years. B&G Foods, being one of the smaller firms in the industry, has experienced
a relatively stable rate of ten percent. Although this is one of the lower rates in
the industry, their growth is stable indicating that their dividend payout ratio has
remained constant. This rate could be improved by more efficient utilization of
their assets to further create value.
Sustainable Growth Rate
The sustainable growth rate (SGR) is similar to the internal growth rate
however, the difference lies in the fact that more debt can be acquired in with the
SGR as long as the same amount of equity is issued. It can be calculated as the
return on equity times (One – Dividend Payout Ratio). This ratio shows the rate at
which a firm can grow with it’s current capital structure proportions.
2011 2012 2013 2014 2015
B&G Foods 5% 2% -4% -8% -3%
Kellogg 14% 21% 48% 0% -2%
The J.M. Smucker 13% 13% 15% 16% 16%
General Mills Inc. 16% 10% 12% 10% 3%
Industry 12% 11% 18% 4% 4%
-20%
-10%
0%
10%
20%
30%
40%
50%
60%
Sustainable Growth Rate

B&G FOODS EVALUATION 106
The sustainable growth rates exhibited in the line graph above show an
industry average converging to a value of five percent. B&G Foods has consistently
remained below the industry average however; it has been increasing in the last
couple years indicating that they have decreased their dividend payout ratio in
order to reinvest in the firm. This reduction in dividends provides a more positive
outlook for the firm going forward due to the increase in reinvestment.
Conclusion
The capital structure of firms in the processed and packaged food industry
varies vastly from company to company. Many companies use very little debt to
finance their operations however, B&G Foods is one of the more leveraged firms
in the industry. This leverage provides investors with a higher return but in turn
causes B&G Foods to be widely considered riskier than their benchmark
competitors. The only cause for concern regarding B&G Foods would be their
Altman Z-score value however, this value is exhibiting an increasing trend meaning
that the firm is moving away from debt financing in attempts to reduce their
mandatory interest payments. All other capital structure ratios for B&G Foods show
that the firm is able to generate and maintain growth and cover their debt liabilities
with their current capital structure.
Financial Forecasting
Forecasting financials is crucial to determining the intrinsic value of a firm.
Therefore, it is important that financials are forecasted in a fair way. In order to
forecast in a fair way, it is important to look at historical data, analyze ratios, and
look at industry trends. With this being said, forecasts can be inaccurate with
inaccuracies becoming more pronounced as time goes on. For the 2016 fiscal year,
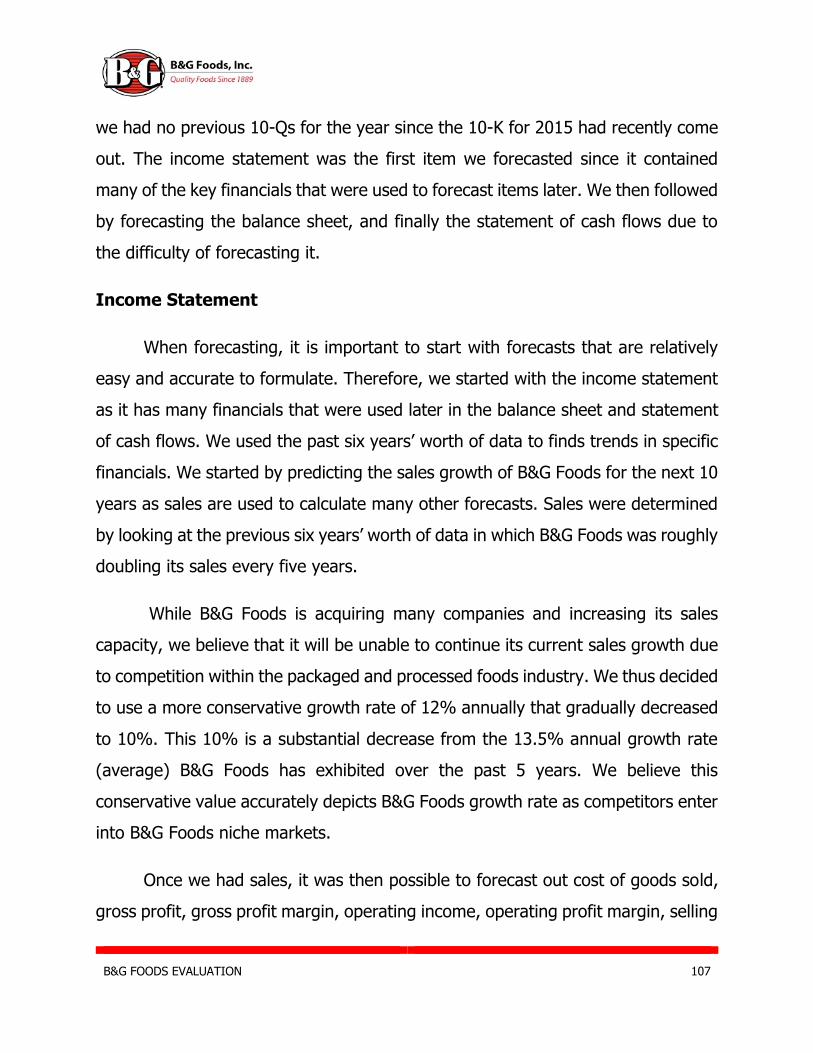
B&G FOODS EVALUATION 107
we had no previous 10-Qs for the year since the 10-K for 2015 had recently come
out. The income statement was the first item we forecasted since it contained
many of the key financials that were used to forecast items later. We then followed
by forecasting the balance sheet, and finally the statement of cash flows due to
the difficulty of forecasting it.
Income Statement
When forecasting, it is important to start with forecasts that are relatively
easy and accurate to formulate. Therefore, we started with the income statement
as it has many financials that were used later in the balance sheet and statement
of cash flows. We used the past six years’ worth of data to finds trends in specific
financials. We started by predicting the sales growth of B&G Foods for the next 10
years as sales are used to calculate many other forecasts. Sales were determined
by looking at the previous six years’ worth of data in which B&G Foods was roughly
doubling its sales every five years.
While B&G Foods is acquiring many companies and increasing its sales
capacity, we believe that it will be unable to continue its current sales growth due
to competition within the packaged and processed foods industry. We thus decided
to use a more conservative growth rate of 12% annually that gradually decreased
to 10%. This 10% is a substantial decrease from the 13.5% annual growth rate
(average) B&G Foods has exhibited over the past 5 years. We believe this
conservative value accurately depicts B&G Foods growth rate as competitors enter
into B&G Foods niche markets.
Once we had sales, it was then possible to forecast out cost of goods sold,
gross profit, gross profit margin, operating income, operating profit margin, selling
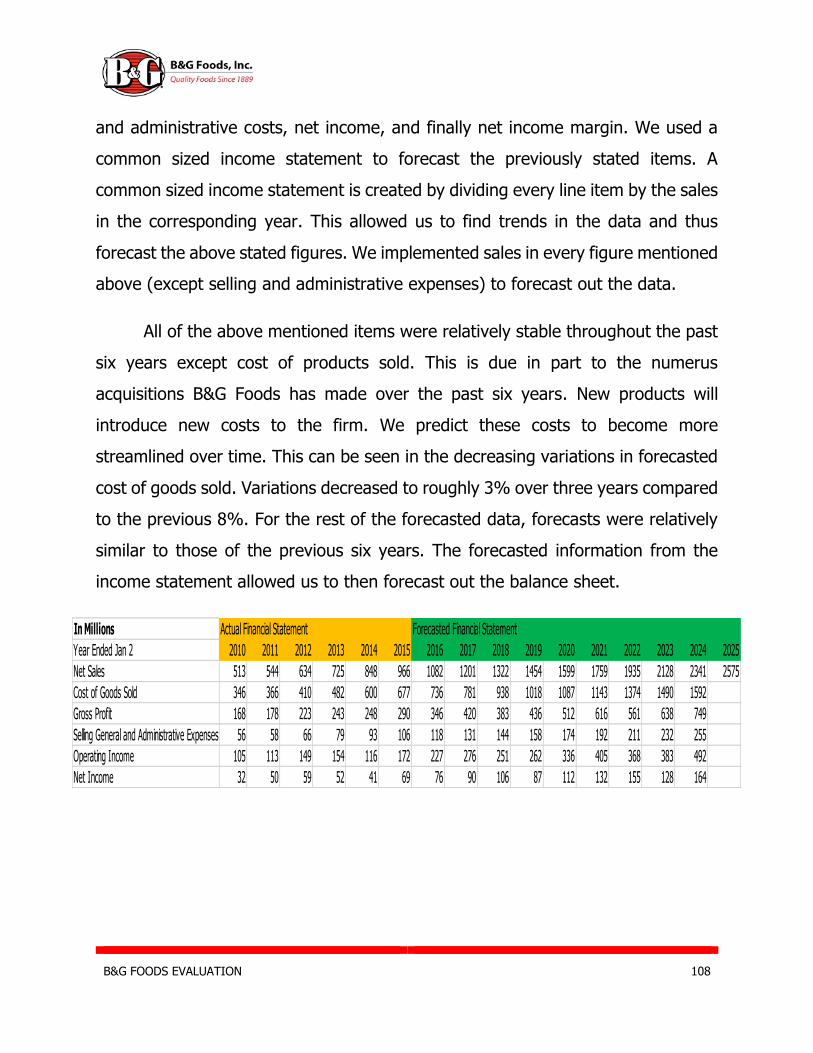
B&G FOODS EVALUATION 108
and administrative costs, net income, and finally net income margin. We used a
common sized income statement to forecast the previously stated items. A
common sized income statement is created by dividing every line item by the sales
in the corresponding year. This allowed us to find trends in the data and thus
forecast the above stated figures. We implemented sales in every figure mentioned
above (except selling and administrative expenses) to forecast out the data.
All of the above mentioned items were relatively stable throughout the past
six years except cost of products sold. This is due in part to the numerus
acquisitions B&G Foods has made over the past six years. New products will
introduce new costs to the firm. We predict these costs to become more
streamlined over time. This can be seen in the decreasing variations in forecasted
cost of goods sold. Variations decreased to roughly 3% over three years compared
to the previous 8%. For the rest of the forecasted data, forecasts were relatively
similar to those of the previous six years. The forecasted information from the
income statement allowed us to then forecast out the balance sheet.
In Millions Actual Financial Statement Forecasted Financial Statement
Year Ended Jan 2 2010 2011 2012 2013 2014 2015 2016 2017 2018 2019 2020 2021 2022 2023 2024 2025
Net Sales 513 544 634 725 848 966 1082 1201 1322 1454 1599 1759 1935 2128 2341 2575
Cost of Goods Sold 346 366 410 482 600 677 736 781 938 1018 1087 1143 1374 1490 1592
Gross Profit 168 178 223 243 248 290 346 420 383 436 512 616 561 638 749
Selling General and Administrative Expenses 56 58 66 79 93 106 118 131 144 158 174 192 211 232 255
Operating Income 105 113 149 154 116 172 227 276 251 262 336 405 368 383 492
Net Income 32 50 59 52 41 69 76 90 106 87 112 132 155 128 164
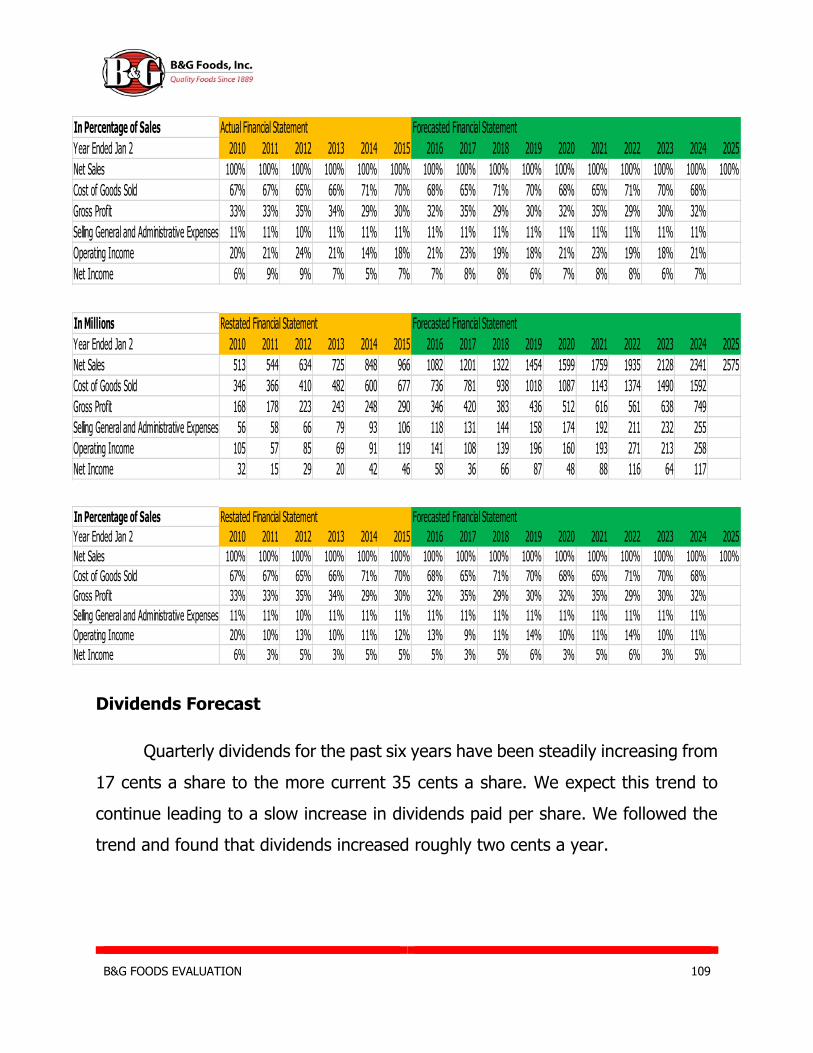
B&G FOODS EVALUATION 109
Dividends Forecast
Quarterly dividends for the past six years have been steadily increasing from
17 cents a share to the more current 35 cents a share. We expect this trend to
continue leading to a slow increase in dividends paid per share. We followed the
trend and found that dividends increased roughly two cents a year.
In Percentage of Sales Actual Financial Statement Forecasted Financial Statement
Year Ended Jan 2 2010 2011 2012 2013 2014 2015 2016 2017 2018 2019 2020 2021 2022 2023 2024 2025
Net Sales 100% 100% 100% 100% 100% 100% 100% 100% 100% 100% 100% 100% 100% 100% 100% 100%
Cost of Goods Sold 67% 67% 65% 66% 71% 70% 68% 65% 71% 70% 68% 65% 71% 70% 68%
Gross Profit 33% 33% 35% 34% 29% 30% 32% 35% 29% 30% 32% 35% 29% 30% 32%
Selling General and Administrative Expenses 11% 11% 10% 11% 11% 11% 11% 11% 11% 11% 11% 11% 11% 11% 11%
Operating Income 20% 21% 24% 21% 14% 18% 21% 23% 19% 18% 21% 23% 19% 18% 21%
Net Income 6% 9% 9% 7% 5% 7% 7% 8% 8% 6% 7% 8% 8% 6% 7%
In Millions Restated Financial Statement Forecasted Financial Statement
Year Ended Jan 2 2010 2011 2012 2013 2014 2015 2016 2017 2018 2019 2020 2021 2022 2023 2024 2025
Net Sales 513 544 634 725 848 966 1082 1201 1322 1454 1599 1759 1935 2128 2341 2575
Cost of Goods Sold 346 366 410 482 600 677 736 781 938 1018 1087 1143 1374 1490 1592
Gross Profit 168 178 223 243 248 290 346 420 383 436 512 616 561 638 749
Selling General and Administrative Expenses 56 58 66 79 93 106 118 131 144 158 174 192 211 232 255
Operating Income 105 57 85 69 91 119 141 108 139 196 160 193 271 213 258
Net Income 32 15 29 20 42 46 58 36 66 87 48 88 116 64 117
In Percentage of Sales Restated Financial Statement Forecasted Financial Statement
Year Ended Jan 2 2010 2011 2012 2013 2014 2015 2016 2017 2018 2019 2020 2021 2022 2023 2024 2025
Net Sales 100% 100% 100% 100% 100% 100% 100% 100% 100% 100% 100% 100% 100% 100% 100% 100%
Cost of Goods Sold 67% 67% 65% 66% 71% 70% 68% 65% 71% 70% 68% 65% 71% 70% 68%
Gross Profit 33% 33% 35% 34% 29% 30% 32% 35% 29% 30% 32% 35% 29% 30% 32%
Selling General and Administrative Expenses 11% 11% 10% 11% 11% 11% 11% 11% 11% 11% 11% 11% 11% 11% 11%
Operating Income 20% 10% 13% 10% 11% 12% 13% 9% 11% 14% 10% 11% 14% 10% 11%
Net Income 6% 3% 5% 3% 5% 5% 5% 3% 5% 6% 3% 5% 6% 3% 5%

B&G FOODS EVALUATION 110
Figure 3.1 – Dividends Paid per Share
We implemented a stair step function that increased quarterly dividends by
two cents (as seen in figure 3.6) leading to an increase of eight cents per share
per year. Since dividends paid per share were relatively stable throughout the past
six years, we did not anticipate any abnormal dividend payments. With dividends
and the income statement forecasted, we can now forecast out the balance sheet.
Balance Sheet
In order to begin forecasting out the balance sheet, it was necessary to
forecast out ratios such as the asset turnover ratio. We found that the asset
turnover ratio varied slightly from year to year, but stayed around .52 throughout
the last six years of data. Our forecasted asset turnover ratio stayed around this
number in the same manner as the previous six years.
Assets were then forecasted based off of the asset turnover ratio. After we
had total assets forecasted, we were then able to forecast out current assets by
using current assets/ total assets. We then looked for trends and found that
current assets/total assets averages around 14%. We thus forecasted out current
assets/total assets at 14% expecting this ratio to roughly stay the same. With the
current assets/ total assets ratio forecasted, we were then able to forecast current
assets.
We then forecasted inventory using the inventory turnover function and
days supply inventory function. We started with the days supply of inventory since
inventory turnover uses days supply of inventory in its calculations. Days supply
Forecasted Dividends 2016 2017 2018 2019 2020 2021 2022 2023 2024
Per Share 1.44 1.52 1.60 1.68 1.76 1.84 1.92 2.00 2.08
B&G FOODS EVALUATION 111
inventory was roughly around 100 days when we averaged out the previous six
years. With this being said, days supply inventory nearly tripled in 2015. We don’t
expect days supply of inventory to remain at such high numbers so we forecasted
out days supply of inventory to gradually reach 100 days again. Once we had days
supply of inventory, we then forecasted out inventory turnover by dividing 365 by
the days supply of inventory. We could then find inventory by taking the forecasted
cost of goods sold and divide it by the forecasted inventory turnover ratio.
Once we had the assets forecasted we could move on to liabilities and
shareholders’ equity. Since this project is mainly about forecasting equity, it was
more important to accurately forecast equity over liabilities concerning accuracy.
We forecasted retained earnings by taking the net income from the current year,
subtracting dividends paid and adding the result to the previous year’s retained
earnings. Total shareholder’s equity was then forecasted by taking net income for
the year and subtracting dividends paid for the year and adding the result to the
previous year’s shareholder’s equity.
Once shareholder’s equity and assets were forecasted, liabilities could be
forecasted by taking assets and subtracting total shareholder’s equity. The current
ratio was used to find current liabilities and non-current liabilities were found by
taking total liabilities minus the resulting current liabilities. Once the balance sheet
was forecasted, we could then move on to forecasting the statement of cash flows
using the forecasted dividends. Operating and investing line items were also used
to forecast the rest of the statement of cash flows.
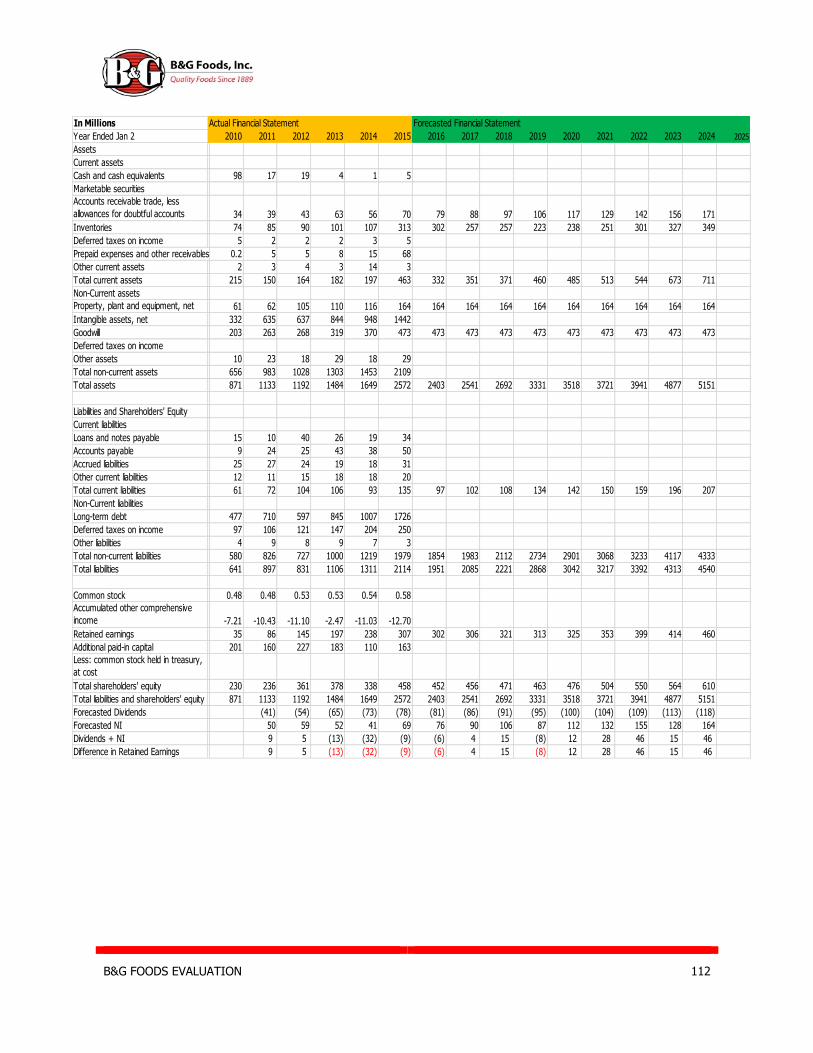
B&G FOODS EVALUATION 112
In Millions Actual Financial Statement Forecasted Financial Statement
Year Ended Jan 2 2010 2011 2012 2013 2014 2015 2016 2017 2018 2019 2020 2021 2022 2023 2024 2025
Assets
Current assets
Cash and cash equivalents 98 17 19 4 1 5
Marketable securities
Accounts receivable trade, less
allowances for doubtful accounts 34 39 43 63 56 70 79 88 97 106 117 129 142 156 171
Inventories 74 85 90 101 107 313 302 257 257 223 238 251 301 327 349
Deferred taxes on income 5 2 2 2 3 5
Prepaid expenses and other receivables 0.2 5 5 8 15 68
Other current assets 2 3 4 3 14 3
Total current assets 215 150 164 182 197 463 332 351 371 460 485 513 544 673 711
Non-Current assets
Property, plant and equipment, net 61 62 105 110 116 164 164 164 164 164 164 164 164 164 164
Intangible assets, net 332 635 637 844 948 1442
Goodwill 203 263 268 319 370 473 473 473 473 473 473 473 473 473 473
Deferred taxes on income
Other assets 10 23 18 29 18 29
Total non-current assets 656 983 1028 1303 1453 2109
Total assets 871 1133 1192 1484 1649 2572 2403 2541 2692 3331 3518 3721 3941 4877 5151
Liabilities and Shareholders' Equity
Current liabilities
Loans and notes payable 15 10 40 26 19 34
Accounts payable 9 24 25 43 38 50
Accrued liabilities 25 27 24 19 18 31
Other current liabilities 12 11 15 18 18 20
Total current liabilities 61 72 104 106 93 135 97 102 108 134 142 150 159 196 207
Non-Current liabilities
Long-term debt 477 710 597 845 1007 1726
Deferred taxes on income 97 106 121 147 204 250
Other liabilities 4 9 8 9 7 3
Total non-current liabilities 580 826 727 1000 1219 1979 1854 1983 2112 2734 2901 3068 3233 4117 4333
Total liabilities 641 897 831 1106 1311 2114 1951 2085 2221 2868 3042 3217 3392 4313 4540
Common stock 0.48 0.48 0.53 0.53 0.54 0.58
Accumulated other comprehensive
income -7.21 -10.43 -11.10 -2.47 -11.03 -12.70
Retained earnings 35 86 145 197 238 307 302 306 321 313 325 353 399 414 460
Additional paid-in capital 201 160 227 183 110 163
Less: common stock held in treasury,
at cost
Total shareholders' equity 230 236 361 378 338 458 452 456 471 463 476 504 550 564 610
Total liabilities and shareholders' equity 871 1133 1192 1484 1649 2572 2403 2541 2692 3331 3518 3721 3941 4877 5151
Forecasted Dividends (41) (54) (65) (73) (78) (81) (86) (91) (95) (100) (104) (109) (113) (118)
Forecasted NI 50 59 52 41 69 76 90 106 87 112 132 155 128 164
Dividends + NI 9 5 (13) (32) (9) (6) 4 15 (8) 12 28 46 15 46
Difference in Retained Earnings 9 5 (13) (32) (9) (6) 4 15 (8) 12 28 46 15 46
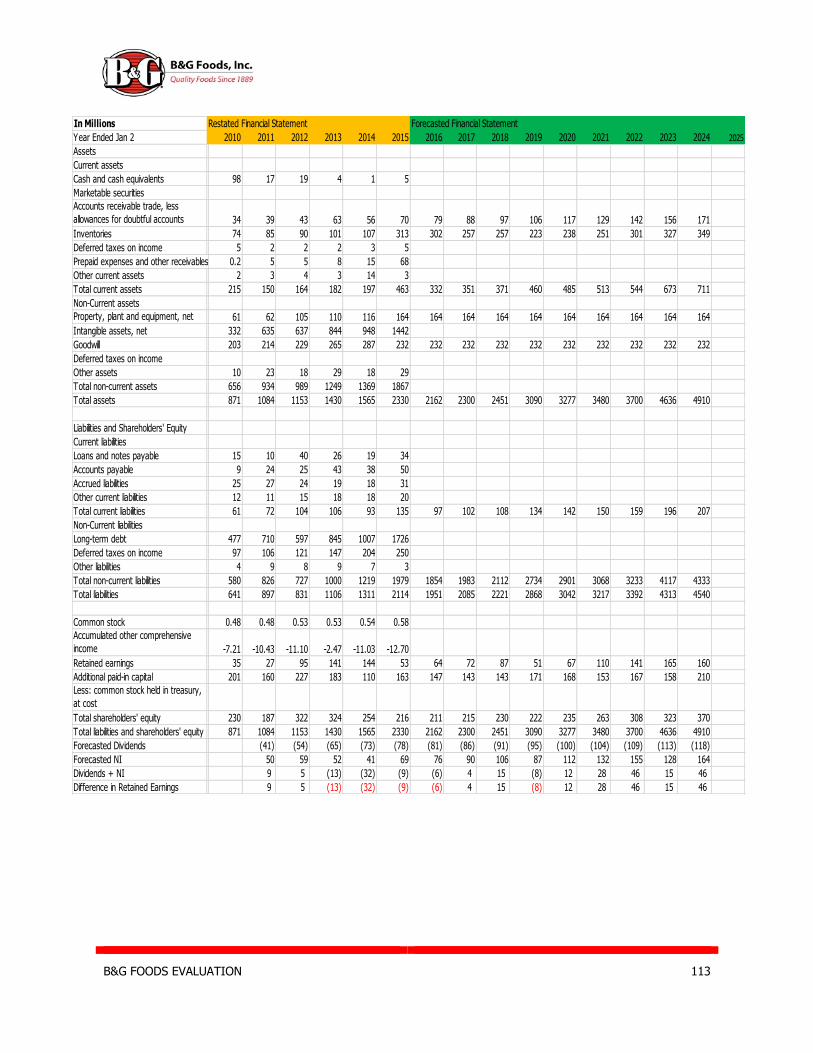
B&G FOODS EVALUATION 113
In Millions Restated Financial Statement Forecasted Financial Statement
Year Ended Jan 2 2010 2011 2012 2013 2014 2015 2016 2017 2018 2019 2020 2021 2022 2023 2024 2025
Assets
Current assets
Cash and cash equivalents 98 17 19 4 1 5
Marketable securities
Accounts receivable trade, less
allowances for doubtful accounts 34 39 43 63 56 70 79 88 97 106 117 129 142 156 171
Inventories 74 85 90 101 107 313 302 257 257 223 238 251 301 327 349
Deferred taxes on income 5 2 2 2 3 5
Prepaid expenses and other receivables 0.2 5 5 8 15 68
Other current assets 2 3 4 3 14 3
Total current assets 215 150 164 182 197 463 332 351 371 460 485 513 544 673 711
Non-Current assets
Property, plant and equipment, net 61 62 105 110 116 164 164 164 164 164 164 164 164 164 164
Intangible assets, net 332 635 637 844 948 1442
Goodwill 203 214 229 265 287 232 232 232 232 232 232 232 232 232 232
Deferred taxes on income
Other assets 10 23 18 29 18 29
Total non-current assets 656 934 989 1249 1369 1867
Total assets 871 1084 1153 1430 1565 2330 2162 2300 2451 3090 3277 3480 3700 4636 4910
Liabilities and Shareholders' Equity
Current liabilities
Loans and notes payable 15 10 40 26 19 34
Accounts payable 9 24 25 43 38 50
Accrued liabilities 25 27 24 19 18 31
Other current liabilities 12 11 15 18 18 20
Total current liabilities 61 72 104 106 93 135 97 102 108 134 142 150 159 196 207
Non-Current liabilities
Long-term debt 477 710 597 845 1007 1726
Deferred taxes on income 97 106 121 147 204 250
Other liabilities 4 9 8 9 7 3
Total non-current liabilities 580 826 727 1000 1219 1979 1854 1983 2112 2734 2901 3068 3233 4117 4333
Total liabilities 641 897 831 1106 1311 2114 1951 2085 2221 2868 3042 3217 3392 4313 4540
Common stock 0.48 0.48 0.53 0.53 0.54 0.58
Accumulated other comprehensive
income -7.21 -10.43 -11.10 -2.47 -11.03 -12.70
Retained earnings 35 27 95 141 144 53 64 72 87 51 67 110 141 165 160
Additional paid-in capital 201 160 227 183 110 163 147 143 143 171 168 153 167 158 210
Less: common stock held in treasury,
at cost
Total shareholders' equity 230 187 322 324 254 216 211 215 230 222 235 263 308 323 370
Total liabilities and shareholders' equity 871 1084 1153 1430 1565 2330 2162 2300 2451 3090 3277 3480 3700 4636 4910
Forecasted Dividends (41) (54) (65) (73) (78) (81) (86) (91) (95) (100) (104) (109) (113) (118)
Forecasted NI 50 59 52 41 69 76 90 106 87 112 132 155 128 164
Dividends + NI 9 5 (13) (32) (9) (6) 4 15 (8) 12 28 46 15 46
Difference in Retained Earnings 9 5 (13) (32) (9) (6) 4 15 (8) 12 28 46 15 46
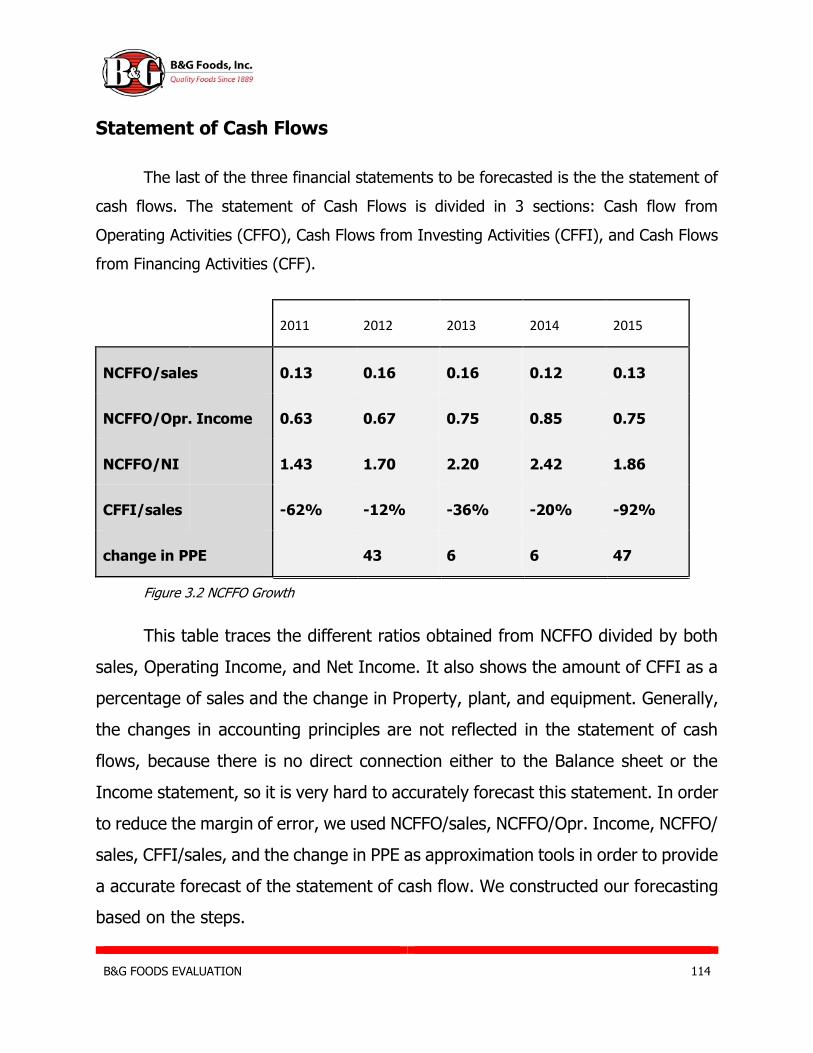
B&G FOODS EVALUATION 114
Statement of Cash Flows
The last of the three financial statements to be forecasted is the the statement of
cash flows. The statement of Cash Flows is divided in 3 sections: Cash flow from
Operating Activities (CFFO), Cash Flows from Investing Activities (CFFI), and Cash Flows
from Financing Activities (CFF).
Figure 3.2 NCFFO Growth
This table traces the different ratios obtained from NCFFO divided by both
sales, Operating Income, and Net Income. It also shows the amount of CFFI as a
percentage of sales and the change in Property, plant, and equipment. Generally,
the changes in accounting principles are not reflected in the statement of cash
flows, because there is no direct connection either to the Balance sheet or the
Income statement, so it is very hard to accurately forecast this statement. In order
to reduce the margin of error, we used NCFFO/sales, NCFFO/Opr. Income, NCFFO/
sales, CFFI/sales, and the change in PPE as approximation tools in order to provide
a accurate forecast of the statement of cash flow. We constructed our forecasting
based on the steps.
2011 2012 2013 2014 2015
NCFFO/sales 0.13 0.16 0.16 0.12 0.13
NCFFO/Opr. Income 0.63 0.67 0.75 0.85 0.75
NCFFO/NI 1.43 1.70 2.20 2.42 1.86
CFFI/sales -62% -12% -36% -20% -92%
change in PPE 43 6 6 47

B&G FOODS EVALUATION 115
Consolidated Statements of Cash Flows
(In millions)
2011 2012 2013 2014 2015 2016 2017 2018 2019 2020 2021 2022 2023 2024 2025
Cash flows from operating activities:
Net income $ 50 59 52 41 69 78 70 61 90 78 70 61 90 78 70
Adjustments to reconcile net income to net cash provided by operating activities:
Depreciation and amortization 16 19 24 27 29
Amortization of deferred debt financing costs and bond discount 2 5 4 4 4
Deferred income taxes 15 21 14 29
Interest accretion on contingent consideration 14 0 0
Gain on change in fair value of contingent consideration - 8
Impairment of intangible assets - 1 34
Amortization of acquisition-related inventory step-up - 6
Distribution restructuring fixed asset write-off 0
Loss on disposal of inventory 4 5
Loss on extinguishment of debt 4 10 31 6
Share-based compensation expense - 1 4 4 2 6
Excess tax benefits from share-based compensation 0 - 8 - 4 - 2 - 1
Provision for doubtful accounts 0 0 0 0
Changes in assets and liabilities, net of effects of businesses acquired: - 5
Trade accounts receivable - 1 - 1 - 14 7 - 17
Inventories - 5 - 3 - 4 - 8 40
Prepaid expenses and other current assets - 1 2 - 3 - 5 - 53
Income tax receivable 0 6 5 - 5 14
Other assets 9 0 - 3 - 1 0
Trade accounts payable 1 - 1 9 - 8 8
Accrued expenses - 11 - 5 - 8 - 4 8
Other liabilities - 3 - 3 - 1 0 - 1
Net cash provided by operating activities 72 101 115 99 128 146 167 190 217 247 282 321 366 418
Cash flows from investing activities:
Capital expenditures - 11 - 11 - 15 - 19 - 19
Payments for acquisition of businesses, net of cash acquired - 326 - 63 - 247 - 154 - 874
Net cash used in investing activities - 337 - 73 - 262 - 173 - 892 - 432 - 622 - 896 - 432 - 622 - 896 - 432 - 622 - 896
Cash flows from financing activities:
Repayments of long-term debt - 130 - 117 - 505 - 139 - 19
Proceeds from issuance of long-term debt 372 30 700 299 746
Repayments of borrowings under revolving credit facility - 25 - 5 - 90 - 259 - 164
Borrowings under revolving credit facility 25 105 253 170
Proceeds from issuance of common stock, net 120 126
Payments for repurchase of common stock - 4
Dividends paid - 38 - 50 - 63 - 72 - 78 0 86 91 95 100 104 109 113 118
Excess tax benefits from share-based compensation 1 8 4 2 1
Payments of tax withholding on behalf of employees for net share settlement of share-based compensation - 2 - 11 - 7 - 4 - 2
Debt financing costs - 16 - 1 - 13 - 8 - 15
Net cash provided by (used in) financing activities 183 - 25 132 72 767
Effect of exchange rate fluctuations on cash and cash equivalents 0 0 0 0 0
Net (decrease) increase in cash and cash equivalents - 82 2 - 15 - 3 4
Cash and cash equivalents at beginning of year 99 17 19 4 1
Cash and cash equivalents at end of year$ 17 19 4 1 5
Supplemental disclosures of cash flow information:
Cash interest payments $ 31 54 44 43 47
Cash income tax payments $ 14 10 3 14 9
Non-cash transactions:
Dividends declared and not yet paid $ 11 15 18 18 20
Actual Statements of Cash Flows Forecasted Statements of Cash Flows
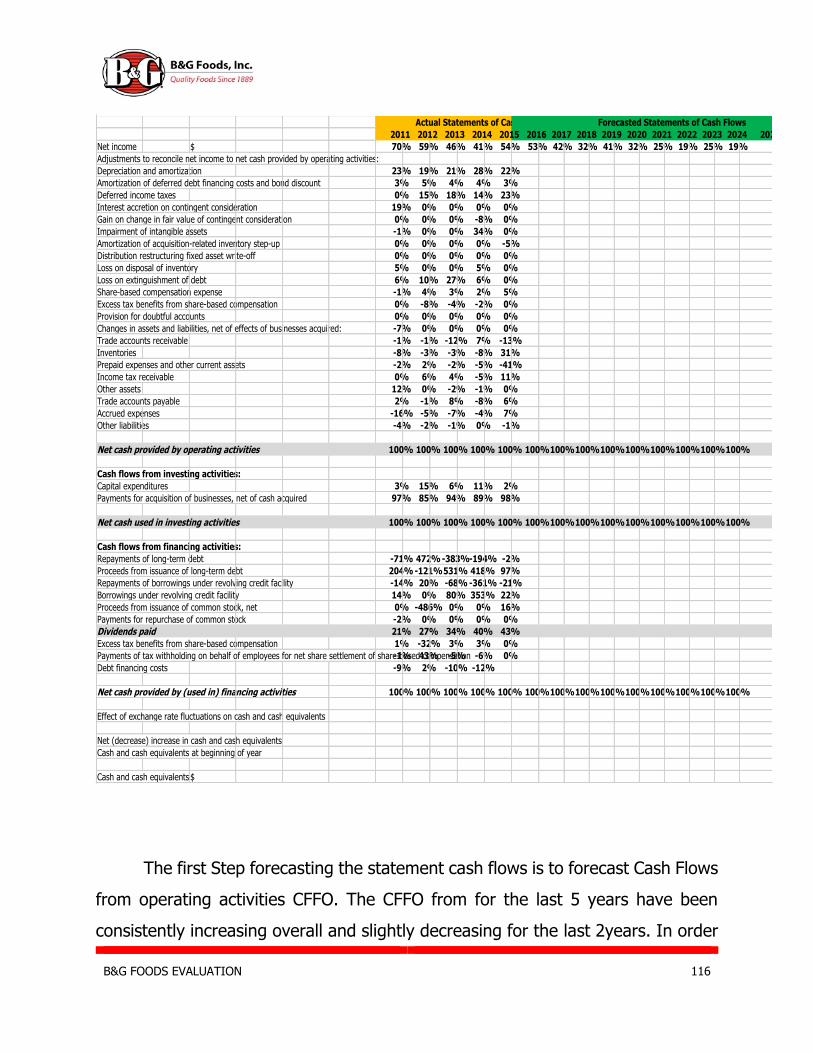
B&G FOODS EVALUATION 116
The first Step forecasting the statement cash flows is to forecast Cash Flows
from operating activities CFFO. The CFFO from for the last 5 years have been
consistently increasing overall and slightly decreasing for the last 2years. In order
2011 2012 2013 2014 2015 2016 2017 2018 2019 2020 2021 2022 2023 2024 2025
Net income $ 70% 59% 46% 41% 54% 53% 42% 32% 41% 32% 25% 19% 25% 19%
Adjustments to reconcile net income to net cash provided by operating activities:
Depreciation and amortization 23% 19% 21% 28% 22%
Amortization of deferred debt financing costs and bond discount 3% 5% 4% 4% 3%
Deferred income taxes 0% 15% 18% 14% 23%
Interest accretion on contingent consideration 19% 0% 0% 0% 0%
Gain on change in fair value of contingent consideration 0% 0% 0% -8% 0%
Impairment of intangible assets -1% 0% 0% 34% 0%
Amortization of acquisition-related inventory step-up 0% 0% 0% 0% -5%
Distribution restructuring fixed asset write-off 0% 0% 0% 0% 0%
Loss on disposal of inventory 5% 0% 0% 5% 0%
Loss on extinguishment of debt 6% 10% 27% 6% 0%
Share-based compensation expense -1% 4% 3% 2% 5%
Excess tax benefits from share-based compensation 0% -8% -4% -2% 0%
Provision for doubtful accounts 0% 0% 0% 0% 0%
Changes in assets and liabilities, net of effects of businesses acquired: -7% 0% 0% 0% 0%
Trade accounts receivable -1% -1% -12% 7% -13%
Inventories -8% -3% -3% -8% 31%
Prepaid expenses and other current assets -2% 2% -2% -5% -41%
Income tax receivable 0% 6% 4% -5% 11%
Other assets 12% 0% -2% -1% 0%
Trade accounts payable 2% -1% 8% -8% 6%
Accrued expenses -16% -5% -7% -4% 7%
Other liabilities -4% -2% -1% 0% -1%
Net cash provided by operating activities 100% 100% 100% 100% 100% 100%100%100%100%100%100%100%100%100%
Cash flows from investing activities:
Capital expenditures 3% 15% 6% 11% 2%
Payments for acquisition of businesses, net of cash acquired 97% 85% 94% 89% 98%
Net cash used in investing activities 100% 100% 100% 100% 100% 100%100%100%100%100%100%100%100%100%
Cash flows from financing activities:
Repayments of long-term debt -71% 472% -383%-194% -2%
Proceeds from issuance of long-term debt 204% -121%531% 418% 97%
Repayments of borrowings under revolving credit facility -14% 20% -68% -361% -21%
Borrowings under revolving credit facility 14% 0% 80% 353% 22%
Proceeds from issuance of common stock, net 0% -486% 0% 0% 16%
Payments for repurchase of common stock -2% 0% 0% 0% 0%
Dividends paid 21% 27% 34% 40% 43%
Excess tax benefits from share-based compensation 1% -32% 3% 3% 0%
Payments of tax withholding on behalf of employees for net share settlement of share-based compensation-1% 43% -5% -6% 0%
Debt financing costs -9% 2% -10% -12%
Net cash provided by (used in) financing activities 100% 100% 100% 100% 100% 100%100%100%100%100%100%100%100%100%
Effect of exchange rate fluctuations on cash and cash equivalents
Net (decrease) increase in cash and cash equivalents
Cash and cash equivalents at beginning of year
Cash and cash equivalents at end of year$
Forecasted Statements of Cash Flows Actual Statements of Cash Flows
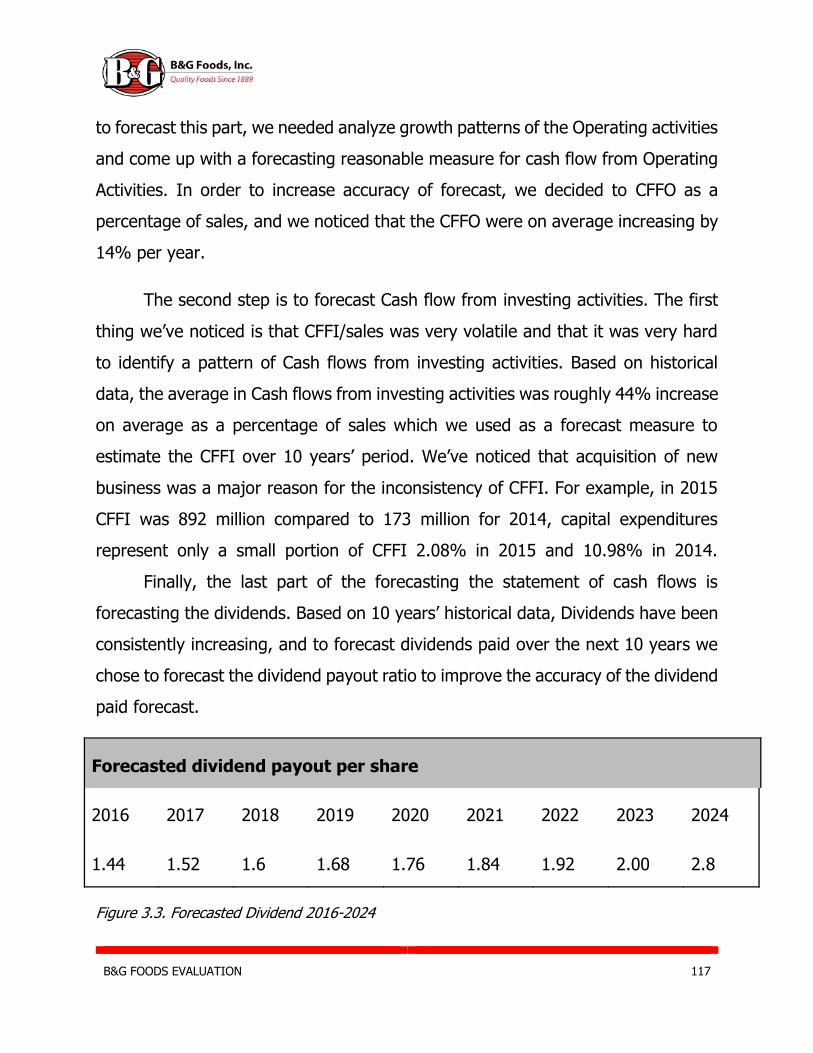
B&G FOODS EVALUATION 117
to forecast this part, we needed analyze growth patterns of the Operating activities
and come up with a forecasting reasonable measure for cash flow from Operating
Activities. In order to increase accuracy of forecast, we decided to CFFO as a
percentage of sales, and we noticed that the CFFO were on average increasing by
14% per year.
The second step is to forecast Cash flow from investing activities. The first
thing we’ve noticed is that CFFI/sales was very volatile and that it was very hard
to identify a pattern of Cash flows from investing activities. Based on historical
data, the average in Cash flows from investing activities was roughly 44% increase
on average as a percentage of sales which we used as a forecast measure to
estimate the CFFI over 10 years’ period. We’ve noticed that acquisition of new
business was a major reason for the inconsistency of CFFI. For example, in 2015
CFFI was 892 million compared to 173 million for 2014, capital expenditures
represent only a small portion of CFFI 2.08% in 2015 and 10.98% in 2014.
Finally, the last part of the forecasting the statement of cash flows is
forecasting the dividends. Based on 10 years’ historical data, Dividends have been
consistently increasing, and to forecast dividends paid over the next 10 years we
chose to forecast the dividend payout ratio to improve the accuracy of the dividend
paid forecast.
Forecasted dividend payout per share
2016 2017 2018 2019 2020 2021 2022 2023 2024
1.44 1.52 1.6 1.68 1.76 1.84 1.92 2.00 2.8
Figure 3.3. Forecasted Dividend 2016-2024

B&G FOODS EVALUATION 118
We just took the dividend payout forecast for each year that we multiplied
by the net income for each respective forecasted year in order to get the dividend
expense paid each year. Statement from financing is quite hard to forecast, we
had a conservative approach toward the issuance of new shares. Assumption was
that B&G Foods will keep the same number of shares for the forecasted period.
Looking at the Cash flows from financing (CFF), we can conclude that most
of the CFF are highly influenced by the Issuance of debt 203% debt as percentage
of CFF in 2011, 531% in 2013, 418% in 2014, and for equity mainly 486% of CFF
in 2012. We conclude that B&G Foods finance most of the projects with debt. It
would have not been inappropriate not to talk about the past financing approaches
of B&G foods, because Forecasting Cash Flow from financing is very subjective for
the simple reason that it is purely decision and judgments. It does not follow a
particular pattern, because the company adapt itself according to their needs and
future circumstances.
Cost of Capital Estimation
The estimation of the cost of capital is necessary to determine the valuation
of the company’s assets, the expected return on investments, and capital
structure. The cost of capital includes both company’s debt and equity. For an
investor’s perspective, the discounted rate is known as the Weighted Average Cost
of Capital (WACC).
WACC answers how much it costs for a company to obtain their financial
needs. The higher WACC is, the riskier firm’s operations are for an investor.
Therefore, investors would require additional return baring additional risk. On the
other hand, a company might have a very low WACC with a huge debt, leading to
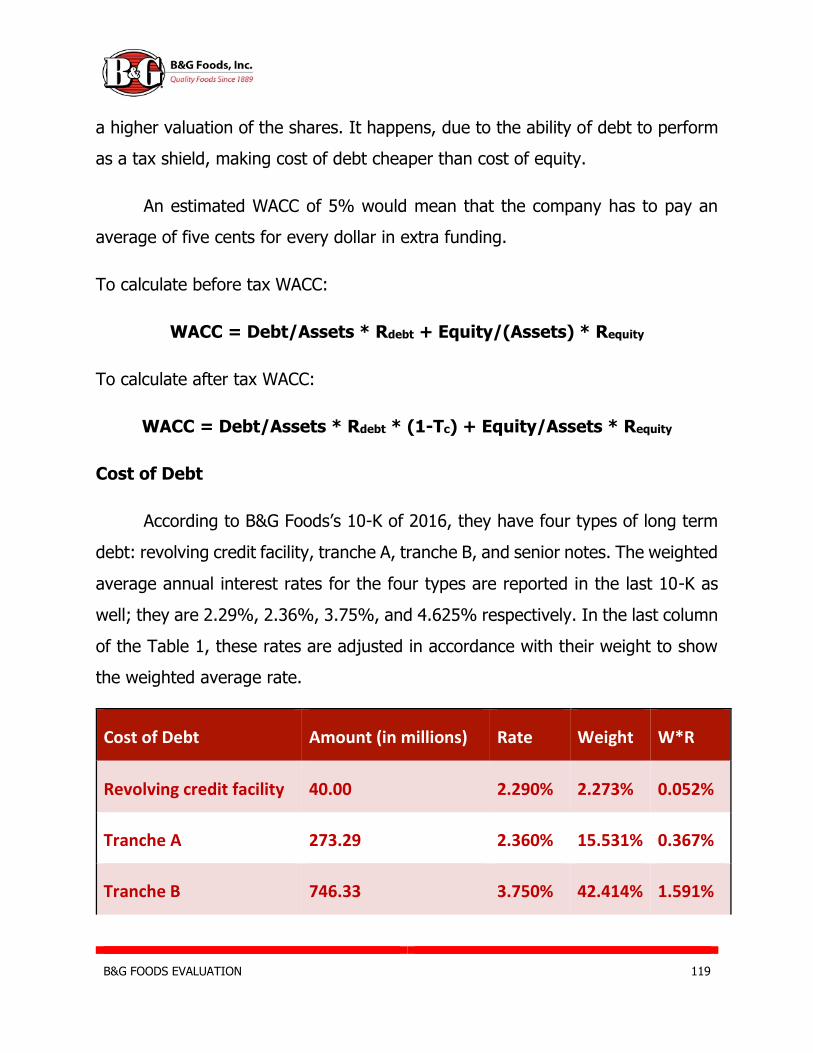
B&G FOODS EVALUATION 119
a higher valuation of the shares. It happens, due to the ability of debt to perform
as a tax shield, making cost of debt cheaper than cost of equity.
An estimated WACC of 5% would mean that the company has to pay an
average of five cents for every dollar in extra funding.
To calculate before tax WACC:
WACC = Debt/Assets * Rdebt + Equity/(Assets) * Requity
To calculate after tax WACC:
WACC = Debt/Assets * Rdebt * (1-Tc) + Equity/Assets * Requity
Cost of Debt
According to B&G Foods’s 10-K of 2016, they have four types of long term
debt: revolving credit facility, tranche A, tranche B, and senior notes. The weighted
average annual interest rates for the four types are reported in the last 10-K as
well; they are 2.29%, 2.36%, 3.75%, and 4.625% respectively. In the last column
of the Table 1, these rates are adjusted in accordance with their weight to show
the weighted average rate.
Cost of Debt Amount (in millions) Rate Weight W*R
Revolving credit facility 40.00 2.290% 2.273% 0.052%
Tranche A 273.29 2.360% 15.531% 0.367%
Tranche B 746.33 3.750% 42.414% 1.591%

B&G FOODS EVALUATION 120
Senior notes 700.00 4.625% 39.781% 1.840%
Total 1759.62
3.849%
Table 1
Cost of Equity
The Capital Asset Pricing Model (CAPM) is used to calculate the cost of
equity:
Ke = Rf + β * (MRP) + SP
The formula to find cost of equity (Ke) uses the risk free rate (Rf), systematic
risk (β), the market risk premium (MRP), and adds a size premium (SP).
The risk free rate represents the corresponding yields for 1-month, 2-year,
7-year, 10-year, and 20-year treasury bonds. The data is taken from the St. Louis
Federal Reserve website.
1-month regressions
Months Beta
Beta
LB
Beta
UB R^2 SP MRP Rf Ke Ke LB Ke UB
24 -0.06 -1.04 0.93 0.06% 1.80% 9.00% 0.00% 1.30% -7.59% 10.19%
36 -0.20 -1.00 0.60 0.77% 1.80% 9.00% 0.00% -0.02% -7.21% 7.18%
48 -0.05 -0.72 0.62 0.05% 1.80% 9.00% 0.00% 1.34% -4.67% 7.34%
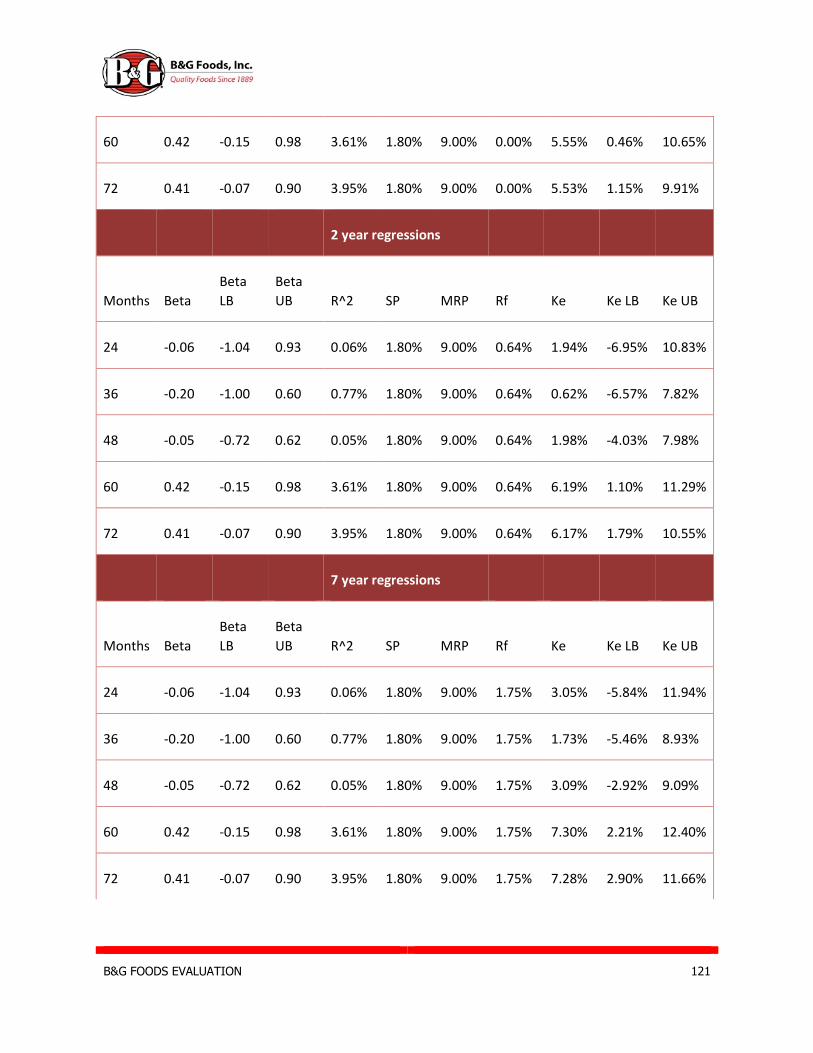
B&G FOODS EVALUATION 121
60 0.42 -0.15 0.98 3.61% 1.80% 9.00% 0.00% 5.55% 0.46% 10.65%
72 0.41 -0.07 0.90 3.95% 1.80% 9.00% 0.00% 5.53% 1.15% 9.91%
2 year regressions
Months Beta
Beta
LB
Beta
UB R^2 SP MRP Rf Ke Ke LB Ke UB
24 -0.06 -1.04 0.93 0.06% 1.80% 9.00% 0.64% 1.94% -6.95% 10.83%
36 -0.20 -1.00 0.60 0.77% 1.80% 9.00% 0.64% 0.62% -6.57% 7.82%
48 -0.05 -0.72 0.62 0.05% 1.80% 9.00% 0.64% 1.98% -4.03% 7.98%
60 0.42 -0.15 0.98 3.61% 1.80% 9.00% 0.64% 6.19% 1.10% 11.29%
72 0.41 -0.07 0.90 3.95% 1.80% 9.00% 0.64% 6.17% 1.79% 10.55%
7 year regressions
Months Beta
Beta
LB
Beta
UB R^2 SP MRP Rf Ke Ke LB Ke UB
24 -0.06 -1.04 0.93 0.06% 1.80% 9.00% 1.75% 3.05% -5.84% 11.94%
36 -0.20 -1.00 0.60 0.77% 1.80% 9.00% 1.75% 1.73% -5.46% 8.93%
48 -0.05 -0.72 0.62 0.05% 1.80% 9.00% 1.75% 3.09% -2.92% 9.09%
60 0.42 -0.15 0.98 3.61% 1.80% 9.00% 1.75% 7.30% 2.21% 12.40%
72 0.41 -0.07 0.90 3.95% 1.80% 9.00% 1.75% 7.28% 2.90% 11.66%

B&G FOODS EVALUATION 122
10 year regressions
Months Beta
Beta
LB
Beta
UB R^2 SP MRP Rf Ke Ke LB Ke UB
24 -0.06 -1.04 0.93 0.06% 1.65% 9.00% 2.06% 3.21% -5.68% 12.10%
36 -0.20 -1.00 0.60 0.77% 1.65% 9.00% 2.06% 1.89% -5.30% 9.09%
48 -0.05 -0.72 0.62 0.05% 1.65% 9.00% 2.06% 3.25% -2.76% 9.25%
60 0.42 -0.15 0.98 3.61% 1.65% 9.00% 2.06% 7.46% 2.37% 12.56%
72 0.41 -0.07 0.90 3.95% 1.65% 9.00% 2.06% 7.44% 3.06% 11.82%
20 year regressions
Months Beta
Beta
LB
Beta
UB R^2 SP MRP Rf Ke Ke LB Ke UB
24 -0.06 -1.04 0.93 0.06% 1.80% 9.00% 3.00% 4.30% -4.59% 13.19%
36 -0.20 -1.00 0.60 0.77% 1.80% 9.00% 3.00% 2.98% -4.21% 10.18%
48 -0.05 -0.72 0.62 0.05% 1.80% 9.00% 3.00% 4.34% -1.67% 10.34%
60 0.42 -0.15 0.98 3.61% 1.80% 9.00% 3.00% 8.55% 3.46% 13.65%
72 0.414 -0.072 0.901 3.95% 1.80% 9.00% 3.00% 8.53% 4.15% 12.91%
The published beta by Google is also 0.41. It makes us to believe, they are
using last 72 months of S&P 500 and B&G Foods returns to calculate the beta.
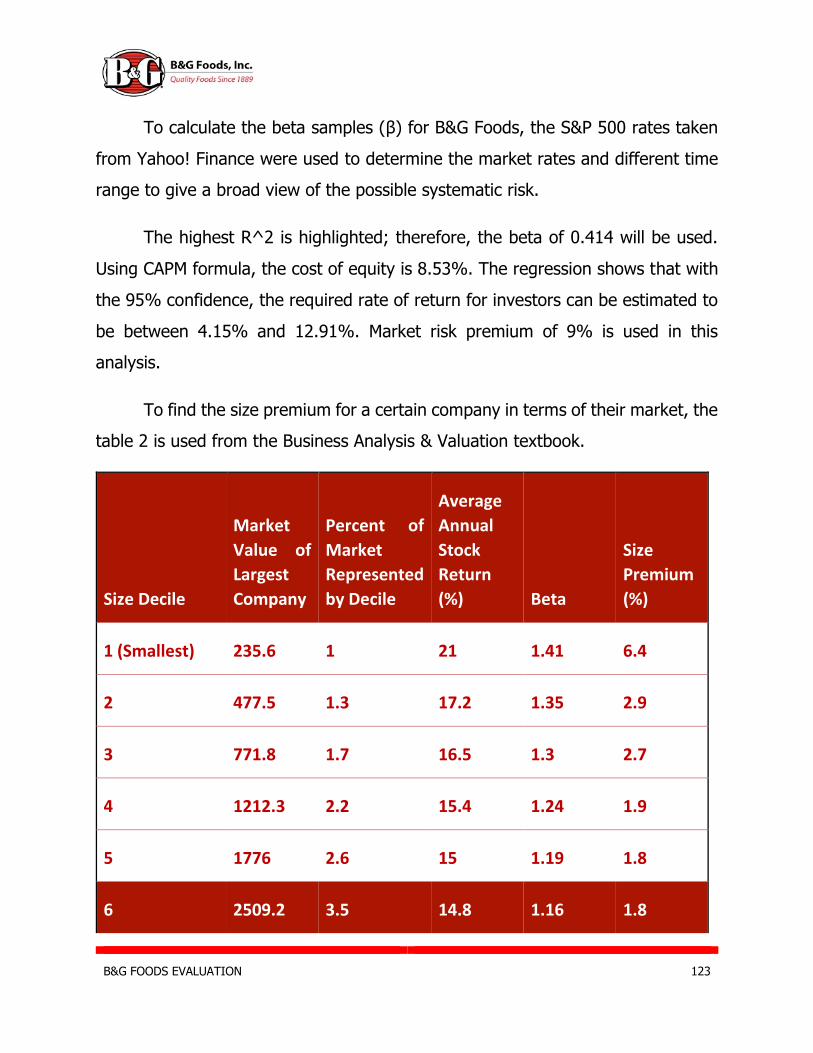
B&G FOODS EVALUATION 123
To calculate the beta samples (β) for B&G Foods, the S&P 500 rates taken
from Yahoo! Finance were used to determine the market rates and different time
range to give a broad view of the possible systematic risk.
The highest R^2 is highlighted; therefore, the beta of 0.414 will be used.
Using CAPM formula, the cost of equity is 8.53%. The regression shows that with
the 95% confidence, the required rate of return for investors can be estimated to
be between 4.15% and 12.91%. Market risk premium of 9% is used in this
analysis.
To find the size premium for a certain company in terms of their market, the
table 2 is used from the Business Analysis & Valuation textbook.
Size Decile
Market
Value of
Largest
Company
Percent of
Market
Represented
by Decile
Average
Annual
Stock
Return
(%) Beta
Size
Premium
(%)
1 (Smallest) 235.6 1 21 1.41 6.4
2 477.5 1.3 17.2 1.35 2.9
3 771.8 1.7 16.5 1.3 2.7
4 1212.3 2.2 15.4 1.24 1.9
5 1776 2.6 15 1.19 1.8
6 2509.2 3.5 14.8 1.16 1.8

B&G FOODS EVALUATION 124
7 3711 4.3 13.9 1.12 1.2
8 6793.9 7.4 13.6 1.1 1
9 15079.5 13.6 12.9 1.03 0.8
10 (largest) 314622.6 62.3 10.9 0.91 -0.4
According to the table, B&G Foods is in the 6th size decile due to their market
value, meaning that we need to use the size premium of 1.8%.
Weighted Average Cost of Capital (WACC)
Using the previously presented formulas for calculating WACC and the
market values of liabilities and equity, the following tables are formed:
Market Value
Amount (in
millions) Rate Weight W*R
Liabilities 1759.62 3.85% 79.359% 3.055%
Equity 457.69 8.53% 20.641% 1.760%
Firm Value 2217.31
WACC 4.815%
WACC after
tax 3.50%
Backdoor Cost of Equity
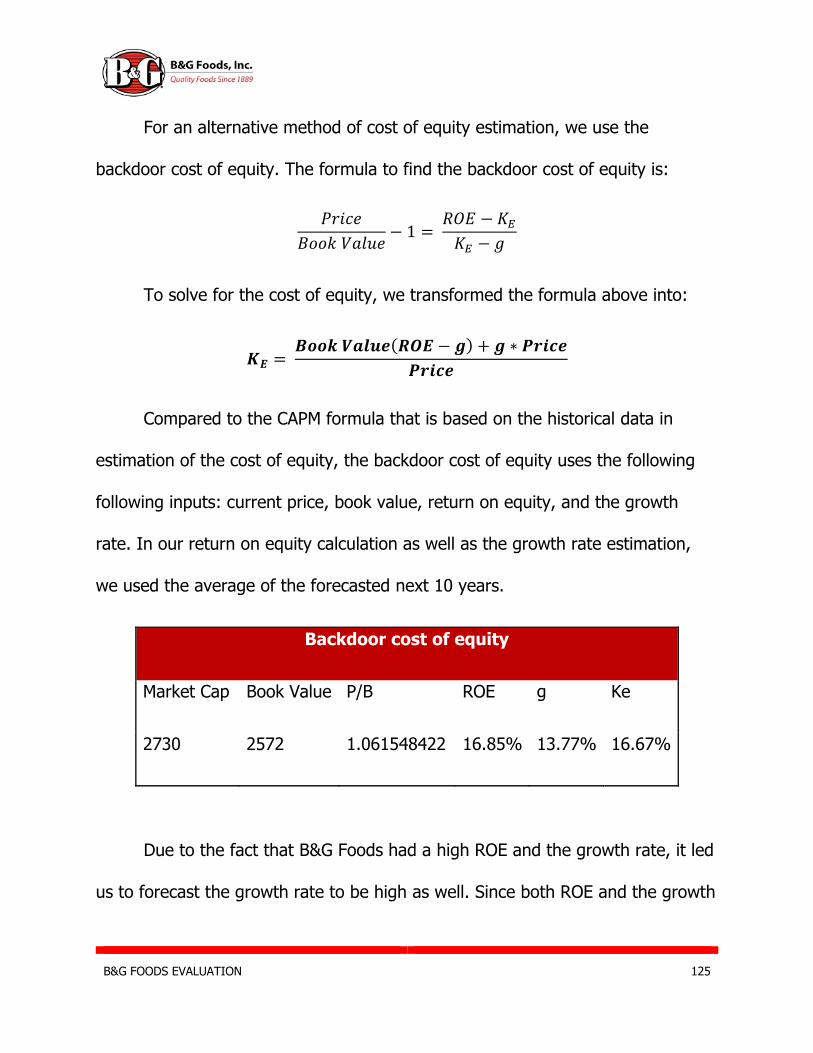
B&G FOODS EVALUATION 125
For an alternative method of cost of equity estimation, we use the
backdoor cost of equity. The formula to find the backdoor cost of equity is:
𝑃𝑟𝑖𝑐𝑒
𝐵𝑜𝑜𝑘 𝑉𝑎𝑙𝑢𝑒− 1 =
𝑅𝑂𝐸 − 𝐾𝐸
𝐾𝐸 − 𝑔
To solve for the cost of equity, we transformed the formula above into:
𝑲𝑬 = 𝑩𝒐𝒐𝒌 𝑽𝒂𝒍𝒖𝒆(𝑹𝑶𝑬 − 𝒈) + 𝒈 ∗ 𝑷𝒓𝒊𝒄𝒆
𝑷𝒓𝒊𝒄𝒆
Compared to the CAPM formula that is based on the historical data in
estimation of the cost of equity, the backdoor cost of equity uses the following
following inputs: current price, book value, return on equity, and the growth
rate. In our return on equity calculation as well as the growth rate estimation,
we used the average of the forecasted next 10 years.
Backdoor cost of equity
Market Cap Book Value P/B ROE g Ke
2730 2572 1.061548422 16.85% 13.77% 16.67%
Due to the fact that B&G Foods had a high ROE and the growth rate, it led
us to forecast the growth rate to be high as well. Since both ROE and the growth
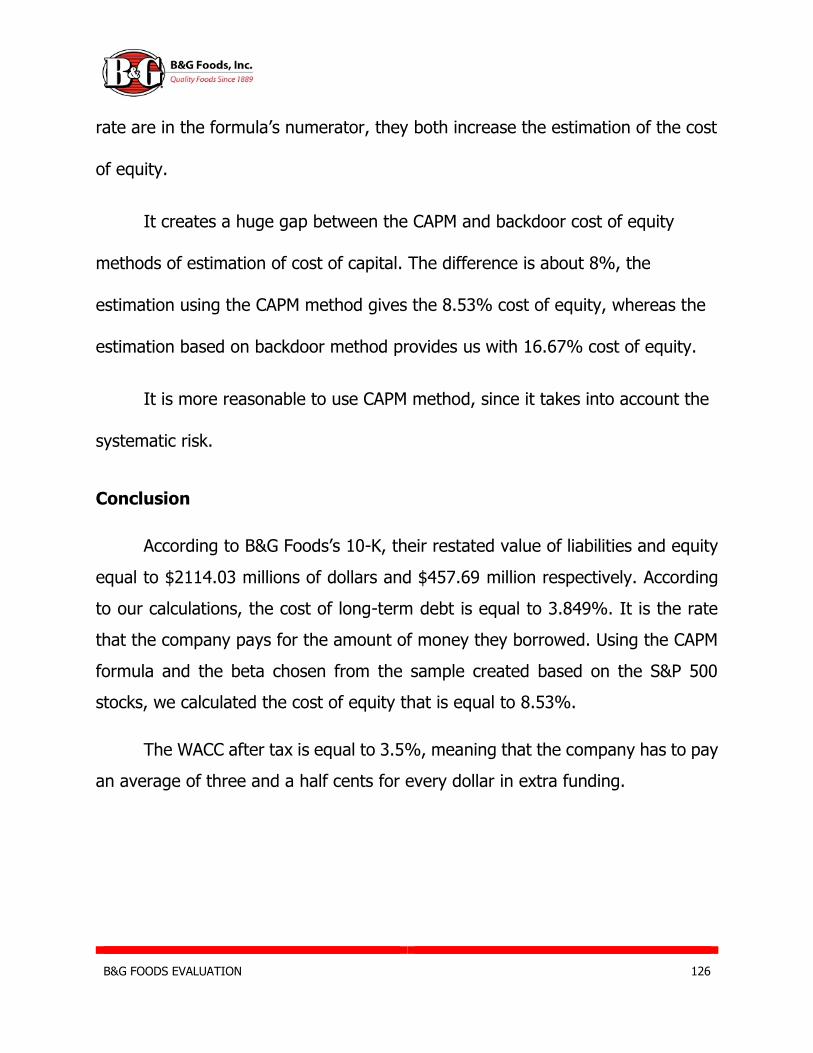
B&G FOODS EVALUATION 126
rate are in the formula’s numerator, they both increase the estimation of the cost
of equity.
It creates a huge gap between the CAPM and backdoor cost of equity
methods of estimation of cost of capital. The difference is about 8%, the
estimation using the CAPM method gives the 8.53% cost of equity, whereas the
estimation based on backdoor method provides us with 16.67% cost of equity.
It is more reasonable to use CAPM method, since it takes into account the
systematic risk.
Conclusion
According to B&G Foods’s 10-K, their restated value of liabilities and equity
equal to $2114.03 millions of dollars and $457.69 million respectively. According
to our calculations, the cost of long-term debt is equal to 3.849%. It is the rate
that the company pays for the amount of money they borrowed. Using the CAPM
formula and the beta chosen from the sample created based on the S&P 500
stocks, we calculated the cost of equity that is equal to 8.53%.
The WACC after tax is equal to 3.5%, meaning that the company has to pay
an average of three and a half cents for every dollar in extra funding.
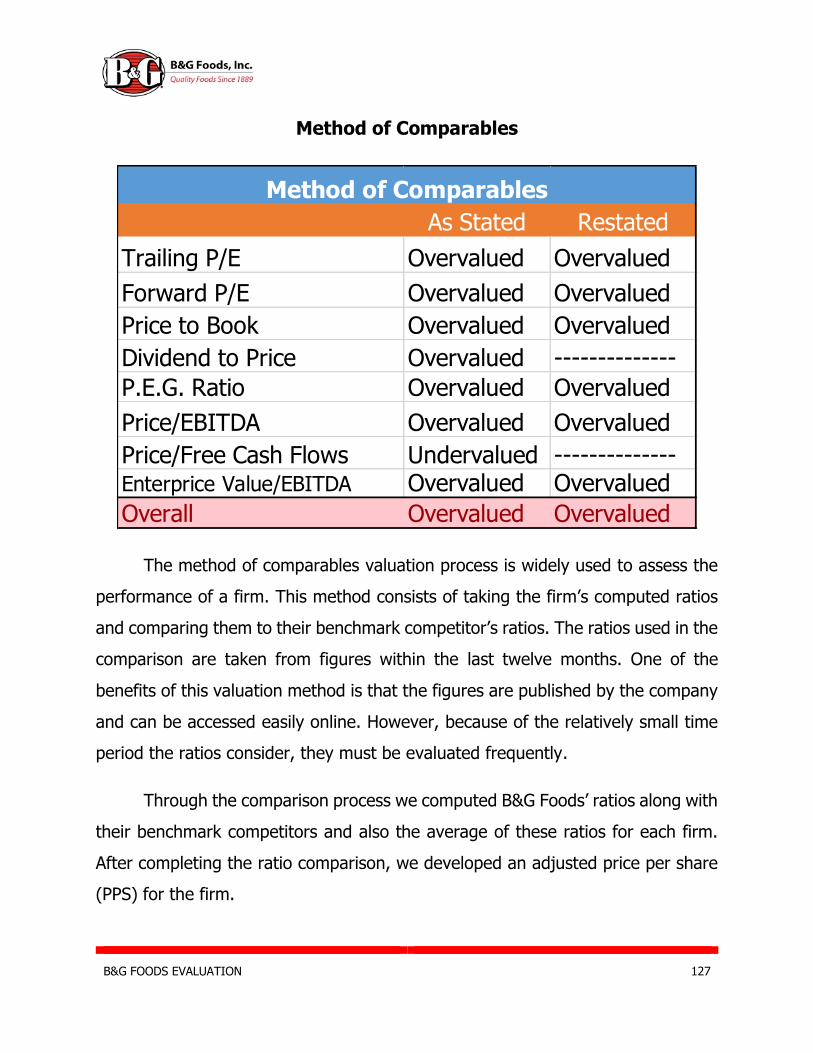
B&G FOODS EVALUATION 127
Method of Comparables
The method of comparables valuation process is widely used to assess the
performance of a firm. This method consists of taking the firm’s computed ratios
and comparing them to their benchmark competitor’s ratios. The ratios used in the
comparison are taken from figures within the last twelve months. One of the
benefits of this valuation method is that the figures are published by the company
and can be accessed easily online. However, because of the relatively small time
period the ratios consider, they must be evaluated frequently.
Through the comparison process we computed B&G Foods’ ratios along with
their benchmark competitors and also the average of these ratios for each firm.
After completing the ratio comparison, we developed an adjusted price per share
(PPS) for the firm.
As Stated Restated
Trailing P/E Overvalued Overvalued
Forward P/E Overvalued Overvalued
Price to Book Overvalued Overvalued
Dividend to Price Overvalued --------------
P.E.G. Ratio Overvalued Overvalued
Price/EBITDA Overvalued Overvalued
Price/Free Cash Flows Undervalued --------------Enterprice Value/EBITDA Overvalued Overvalued
Overall Overvalued Overvalued
Method of Comparables

B&G FOODS EVALUATION 128
We used 10% as our analyst position for our recommendation on pricing
based on the opening price of $34.51 on April 1, 2016. Any price above $37.96
indicates that the stock is undervalued and any price below $31.06 indicates that
the stock is overvalued. These are the upper and lower limits on the price range
for B&G Foods in the following sections.
Trailing P/E Ratio
The P/E ratio is an informative tool indicating how many years of profits are
being paid. The trailing P/E ratio is a similar ratio that uses the previous twelve
months of earnings in its computation. This is the primary strength of the trailing
P/E ratio because it considers historical prices instead of forecasted figures.
After computing the industry average P/E ratio of $35.70 and multiplying it
by the earnings for B&G Foods, we computed an adjusted price per share of
$43.56. This figure far exceeds the upper limit of $37.96 indicating that the stock
is undervalued. These computations may at times produce inaccurate results due
the the few inputs used however, they should be noted.
Company Price Per Share EPS P/E Trailing Adjusted PPSB&G Foods 34.51 1.22 28.29 43.56
B&G Foods Restated 34.51 1.43 24.13 51.06
Kellog 75.71 1.72 44.02
General Mills 62.9 2.42 25.99
J.M. Smucker Company 129.12 3.48 37.10
Industry Average 35.70
Trailing P/E
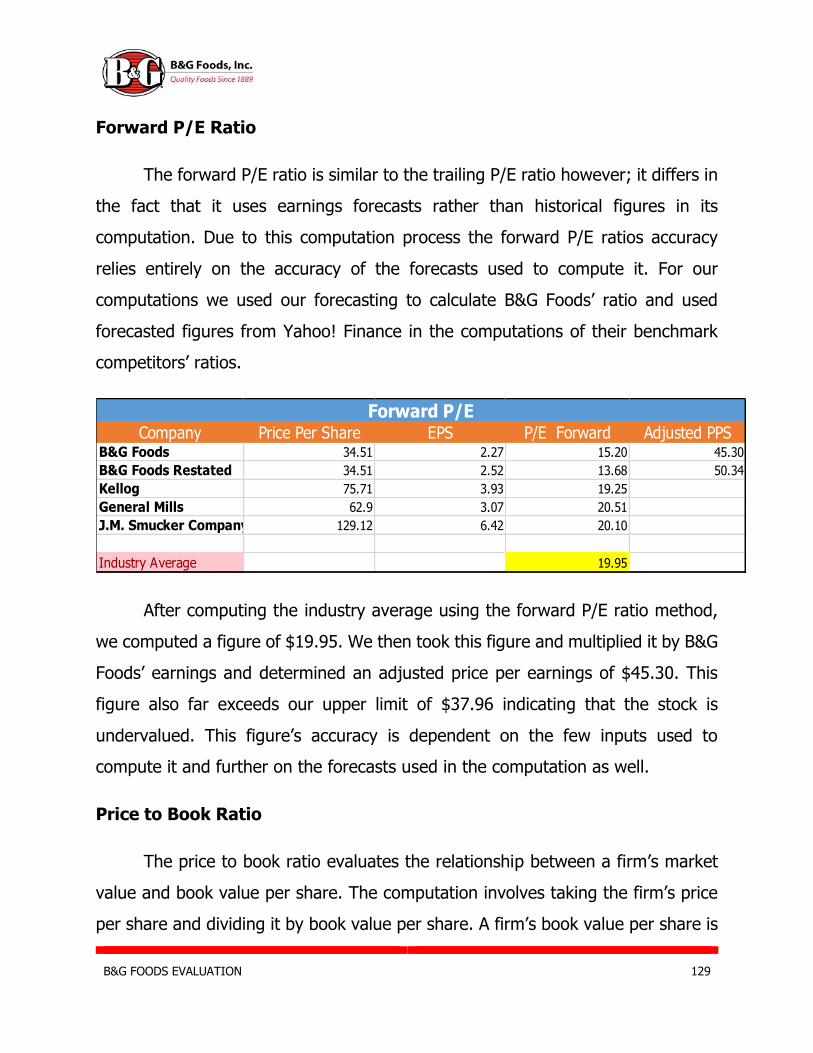
B&G FOODS EVALUATION 129
Forward P/E Ratio
The forward P/E ratio is similar to the trailing P/E ratio however; it differs in
the fact that it uses earnings forecasts rather than historical figures in its
computation. Due to this computation process the forward P/E ratios accuracy
relies entirely on the accuracy of the forecasts used to compute it. For our
computations we used our forecasting to calculate B&G Foods’ ratio and used
forecasted figures from Yahoo! Finance in the computations of their benchmark
competitors’ ratios.
After computing the industry average using the forward P/E ratio method,
we computed a figure of $19.95. We then took this figure and multiplied it by B&G
Foods’ earnings and determined an adjusted price per earnings of $45.30. This
figure also far exceeds our upper limit of $37.96 indicating that the stock is
undervalued. This figure’s accuracy is dependent on the few inputs used to
compute it and further on the forecasts used in the computation as well.
Price to Book Ratio
The price to book ratio evaluates the relationship between a firm’s market
value and book value per share. The computation involves taking the firm’s price
per share and dividing it by book value per share. A firm’s book value per share is
Company Price Per Share EPS P/E Forward Adjusted PPSB&G Foods 34.51 2.27 15.20 45.30
B&G Foods Restated 34.51 2.52 13.68 50.34
Kellog 75.71 3.93 19.25
General Mills 62.9 3.07 20.51
J.M. Smucker Company 129.12 6.42 20.10
Industry Average 19.95
Forward P/E

B&G FOODS EVALUATION 130
computed by taking the total book value of equity and dividing it by the total
number of shares outstanding. A low price to book ratio could be indicative of the
firm’s stock being undervalued.
Given the industry average of $4.92, the adjusted figure for B&G Foods is
$40.81. This price exceeds the upper limit of $37.96 meaning that the stock is
considered to be undervalued. Additionally, B&G Foods’ P/B ratio low and below
industry average, this is another indication of the firm’s stock being undervalued.
Dividends to Price Ratio
The dividends to price ratio is computed using the dividends per share
divided by the price per share. This computation indicates the firm’s dividend
payout per share relative to their firm’s stock price. B&G Food’s adjusted price per
share is computed by taking their dividends divided by the average D/P ratio for
the industry.
Company Price Per Share BPS P/B Adjusted PPSB&G Foods 34.51 8.30 4.16 40.81
B&G Foods Restated 34.51 9.56 5.18 47.04
Kellog 75.71 6.00 12.61
General Mills 62.9 8.12 7.75
J.M. Smucker Company 129.12 61.78 2.09
Industry Average 4.92
Price to Book
Company Dividends Price Per Share D/P Adjusted PPSB&G Foods 0.42 34.51 0.0122 65.95
Kellog 0.5 75.71 0.0066 78.51
General Mills 0.46 62.9 0.0073
J.M. Smucker Company 0.67 129.12 0.0052
Industry Average 0.0064
Dividend to Price
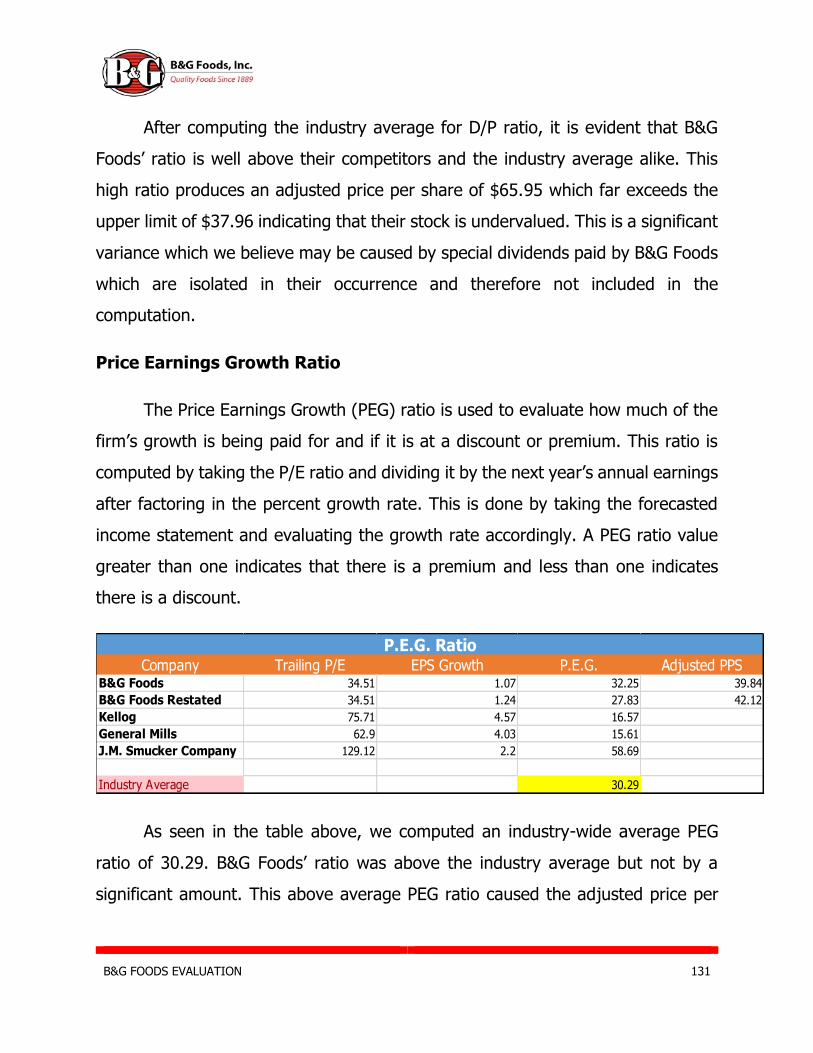
B&G FOODS EVALUATION 131
After computing the industry average for D/P ratio, it is evident that B&G
Foods’ ratio is well above their competitors and the industry average alike. This
high ratio produces an adjusted price per share of $65.95 which far exceeds the
upper limit of $37.96 indicating that their stock is undervalued. This is a significant
variance which we believe may be caused by special dividends paid by B&G Foods
which are isolated in their occurrence and therefore not included in the
computation.
Price Earnings Growth Ratio
The Price Earnings Growth (PEG) ratio is used to evaluate how much of the
firm’s growth is being paid for and if it is at a discount or premium. This ratio is
computed by taking the P/E ratio and dividing it by the next year’s annual earnings
after factoring in the percent growth rate. This is done by taking the forecasted
income statement and evaluating the growth rate accordingly. A PEG ratio value
greater than one indicates that there is a premium and less than one indicates
there is a discount.
As seen in the table above, we computed an industry-wide average PEG
ratio of 30.29. B&G Foods’ ratio was above the industry average but not by a
significant amount. This above average PEG ratio caused the adjusted price per
Company Trailing P/E EPS Growth P.E.G. Adjusted PPSB&G Foods 34.51 1.07 32.25 39.84
B&G Foods Restated 34.51 1.24 27.83 42.12
Kellog 75.71 4.57 16.57
General Mills 62.9 4.03 15.61
J.M. Smucker Company 129.12 2.2 58.69
Industry Average 30.29
P.E.G. Ratio

B&G FOODS EVALUATION 132
share to increase to a value of $53.31. This figure is well above the upper limit of
$37.96 indicating that the stock is undervalued.
Price to EBITDA Ratio
The price to EBITDA ratio is a comparable which considers the market
capitalization of a firm divided by the firm’s earnings before interest, taxes,
depreciation, and amortization. This ratio is taken relative to the firm’s market
value of equity which is computed by taking the market price per share and
multiplying by the number of total shares outstanding. This ratio excludes a large
portion of the firm’s expenses and must therefore be considered along with the
other comparables.
As seen above, B&G Foods price to EBITDA ratio falls below the industry
average with a value of 9.60. This causes the adjusted price per share value to be
well above our 10% analyst position upper limit of $37.96 indicating that the stock
is undervalued. This ratio provides a point of reference however; it must be noted
that this figure is computed with the exclusion of many of the firm’s operating
expenses.
Company PPS Market Cap EBITDA P/EBITDA Adjusted PPSB&G Foods 34.51 2,060,000,000.00$ 214,630,000.00$ 9.60$ 44.11$
B&G Foods Restated 34.51 2,060,000,000.00$ 248,970,800.00$ 8.27$ 42.78$
Kellog 75.71 27,010,000,000.00$ 2,020,000,000.00$ 13.37$
General Mills 62.9 25,930,000,000.00$ 3,470,000,000.00$ 7.47$
J.M. Smucker Company 129.12 36,840,000,000.00$ 1,570,000,000.00$ 23.46$
Industry Average 14.77$
Price/EBITDA

B&G FOODS EVALUATION 133
Price to Free Cash Flow Ratio
The price to free cash-flow ratio uses the market capitalization of a firm and
takes this figure relative to the firm’s free cash flows. Given the volatility of cash
flows and the difficult nature of forecasting the statement of cash flows, this ratio
must be considered accordingly. Free cash flows are computed by taking the firm’s
cash flows from operating activities (CFFO) plus or minus the firm’s cash flows
from investing activities (CFFI).
Enterprise Value to EBITDA Ratio
The enterprise value to EBITDA ratio takes the firm’s total enterprise value relative
to their earnings before interest, taxes, depreciation and amortization. The firm’s
enterprise value is computed by taking their market equity value plus book value of
liabilities less cash and investments. Similar to the price to EBITDA ratio, this ratio does
not account for many of the firm’s expenses or capital structure therefore it should be
interpreted with other comparables rather than alone.
Company PPS Market Cap F.C.F. P/FCFPS Adjusted PPSB&G Foods 34.51 2,060,000,000.00$ 111,128,479.00$ 18.54 18.54
Kellog 75.71 27,010,000,000.00$ 1,690,000,000.00$ 15.98 15.98
General Mills 62.9 25,930,000,000.00$ 2,840,000,000.00$ 9.13
J.M. Smucker Company 129.12 36,840,000,000.00$ 1,340,000,000.00$ 27.49
Industry Average 17.54
Price/Free Cash Flows
Company Market Cap EV EBITDA EV/EBITDA Adjusted PPSB&G Foods 2,060,000,000.00$ 3,620,000,000 214,630,000.00$ 16.87 31.18
B&G Foods Restated 2,060,000,000.00$ 3,620,000,000 240,385,600.00$ 15.06 29.37
Kellog 27,010,000,000.00$ 34,290,000,000 2,020,000,000.00$ 16.98
General Mills 25,930,000,000.00$ 45,030,000,000 3,470,000,000.00$ 12.98
J.M. Smucker Company 36,840,000,000.00$ 20,390,000,000 1,570,000,000.00$ 12.99
Industry Average 14.31
Enterprice Value/EBITDA
B&G FOODS EVALUATION 134
As seen above, the industry average for price to EBITDA ratio is 14.31. B&G
Foods’ ratio of 16.87 is slightly above the industry average however, it is not higher
by much. The slight variance from the industry average is within the 10% range
of our analyst position. This slight variance produces an adjusted price per share
of $31.18 indicating that the stock is fairly valued.
Discounted Dividend Model
The discounted dividend model takes estimated future dividends, discounts
them back to present value, and sums the results to value a stock. The discounted
dividend model does not account for returns on capital gains. Therefore, this model
works best for companies that distribute a significant amount of dividends
regularly. This is due to the fact that the discounted dividends model discounts
back the dividends per share. If this number is relatively low, the resulting stock
price will be unrealistically low. When discounting B&G Foods dividends, we found
that a relatively high amount of the stock price was supported by the model.
We implemented the next ten years of forecasted dividends into the model.
These dividends resulted from a stair-step function that utilized the average eight
cent dividend growth per year to grow the future dividends by (refer to figure 3.6).
After the ten year dividend forecast, we implemented a perpetuity to find the value
of the dividends from 11 years onward. We grew the perpetuity at 4% which was
based off of the forecasted long-run sales growth. We then found the implied
January 2016 price of the stock by adding the discounted dividends and perpetuity.
We did not have to move this stock price forward as B&G Foods’ fiscal year begins
on January 2nd.
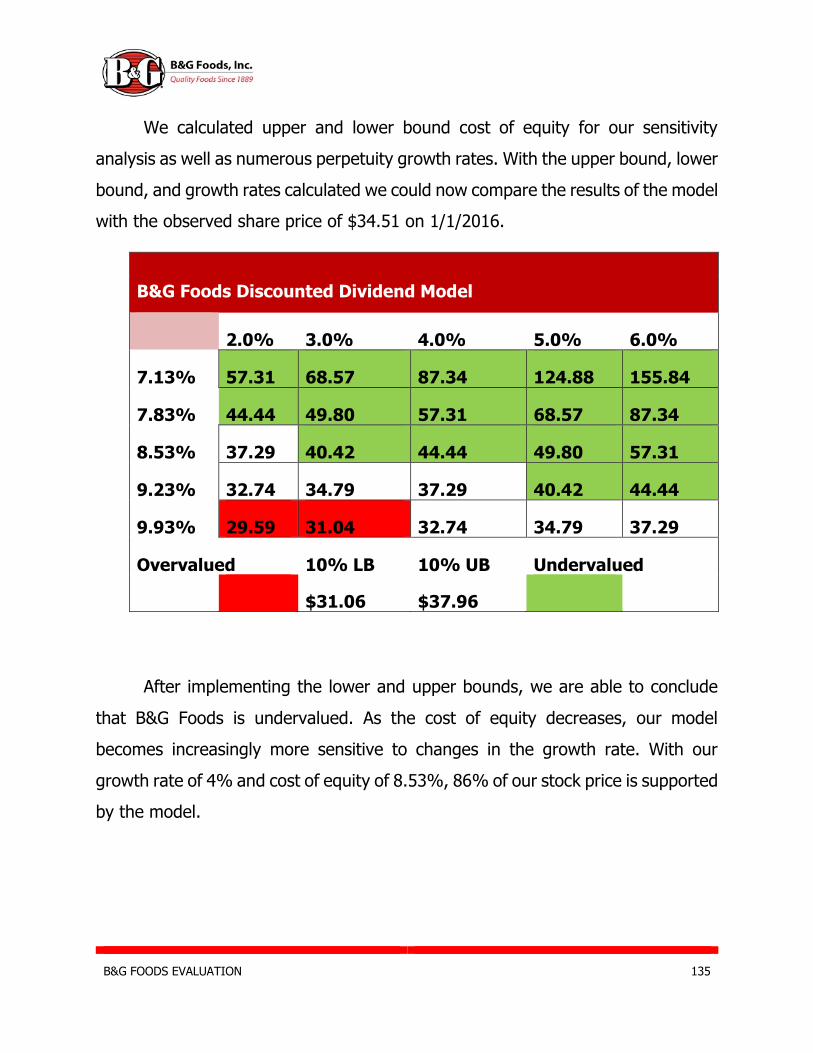
B&G FOODS EVALUATION 135
We calculated upper and lower bound cost of equity for our sensitivity
analysis as well as numerous perpetuity growth rates. With the upper bound, lower
bound, and growth rates calculated we could now compare the results of the model
with the observed share price of $34.51 on 1/1/2016.
B&G Foods Discounted Dividend Model
2.0% 3.0% 4.0% 5.0% 6.0%
7.13% 57.31 68.57 87.34 124.88 155.84
7.83% 44.44 49.80 57.31 68.57 87.34
8.53% 37.29 40.42 44.44 49.80 57.31
9.23% 32.74 34.79 37.29 40.42 44.44
9.93% 29.59 31.04 32.74 34.79 37.29
Overvalued 10% LB 10% UB Undervalued
red $31.06 $37.96 Green
After implementing the lower and upper bounds, we are able to conclude
that B&G Foods is undervalued. As the cost of equity decreases, our model
becomes increasingly more sensitive to changes in the growth rate. With our
growth rate of 4% and cost of equity of 8.53%, 86% of our stock price is supported
by the model.
B&G FOODS EVALUATION 136
Discounted Free Cash Flow Model
The next intrinsic model that we use to estimate the value of B&G Foods is
the discounted free cash flows model (DCF). This model has an assumption that
the market value of equity might be found using the following formula:
MVEquity = MVAssets - MVLiabilities
While this is a theoretical formula, it is not always correct in the reality.
Further, we assume the market value of liabilities to be equal to the book value
of a company. The market value of assets represents the present value of all
future free cash flows.
Similar to the discounted dividends model, the DCF is subject for the
forecasting errors due to the fact that there is a limited number of variations in
capital expenditures.
We used forecasted cash flows of the next 10 years from operating and
capital expenditures. Using the weighted average cost of capital, we get present
values of free cash flows. From year 11, we value a perpetuity using WACC and
the growth rate.
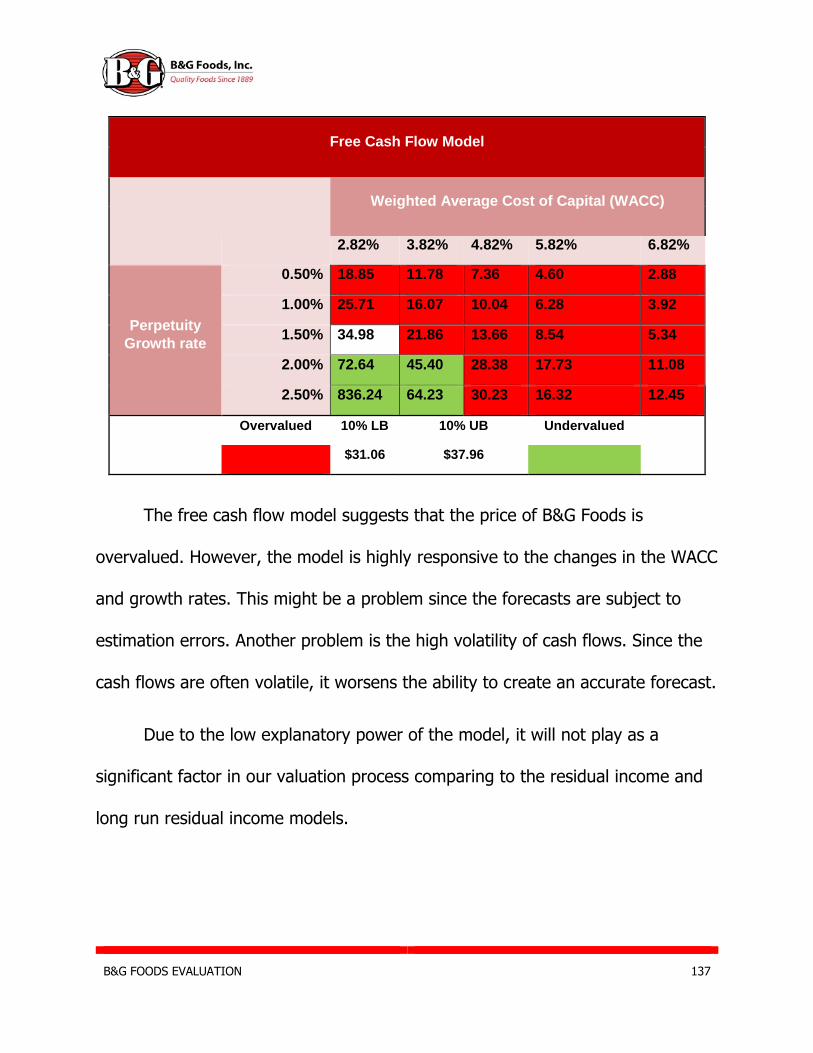
B&G FOODS EVALUATION 137
Free Cash Flow Model
Weighted Average Cost of Capital (WACC)
2.82% 3.82% 4.82% 5.82% 6.82%
Perpetuity
Growth rate
0.50% 18.85 11.78 7.36 4.60 2.88
1.00% 25.71 16.07 10.04 6.28 3.92
1.50% 34.98 21.86 13.66 8.54 5.34
2.00% 72.64 45.40 28.38 17.73 11.08
2.50% 836.24 64.23 30.23 16.32 12.45
Overvalued 10% LB 10% UB Undervalued
red $31.06 $37.96 green
The free cash flow model suggests that the price of B&G Foods is
overvalued. However, the model is highly responsive to the changes in the WACC
and growth rates. This might be a problem since the forecasts are subject to
estimation errors. Another problem is the high volatility of cash flows. Since the
cash flows are often volatile, it worsens the ability to create an accurate forecast.
Due to the low explanatory power of the model, it will not play as a
significant factor in our valuation process comparing to the residual income and
long run residual income models.
B&G FOODS EVALUATION 138
Residual Income Model
The residual Income model is one of the most effective valuation model
which provide a good descriptive power when valuating companies. This valuation
model is based on the analysis of revenues after dividends. This model focusses
significantly on the forecasted Earnings and dividend, and less on the influence of
the present value of the perpetuity. The reason for that being is that forecasting
is more accurate in the short rather than the long term, because simply the level
of risk and uncertainty is higher as the time span increases. Thus, this model shows
a good degree accuracy while used valuating a firm.
To start using the model, we need first to calculate residual income for each
year over the period we wish to valuate and forecast. We took net income (NI) of
B&G Foods that we subtracted the annual normal income benchmark (NI*). if NI-
NI*>0, then the residual income is positive. If NI-NI*<0, then residual income is
negative. A positive residual income shows that the company earned more than
his required rate of return, if not, they earned less and are not meeting the
expectations.
Using a cost of capital of 8.53%, we then bring value of the residual income
each year to time 0 dollars (Present value). We also calculated the present of the
terminal value of the perpetuity that we brought to time 0 dollars. Furthermore,
we summed B&G foods book value of equity with the year by year PV of the
residual income and the present value of the terminal value of the perpetuity,
which helped us obtain the market value of the firm’s equity. Then, we divided the
Market value of equity by the numbers of shares outstanding in order to get the
valuation price per share. In order to run the model under different scenarios, we
decided to set the perpetuity growth rate of 2%, 3%, 4%, 5%, and 6%. B&G

B&G FOODS EVALUATION 139
Foods cost of capital calculated was 8.53%, we chose another set of close values:
7.13%, 7.83%, 9.13%, and 9.93% to have a grasp of the prices’ distribution with
respect of the upper and Lower bounds.
Under those assumptions (cost of capital and growth rate), we notice that
14 observed prices were falling below the low bound of $31.06, 5 were falling
between the lower $31.06 and upper range $37.96, and finally 6 observed prices
falling over the upper bond. According to the model, we observed a maximum
price of $85.13 and a minimum price of $22.45. We can now conclude that
depending of the assumptions this model suggests that B&G Foods’ stock price is
mainly overvalued. We believe the overvaluation of their stock price could be due
to the fact that for the last three years (2013, 2014, 2015), the dividends they
paid were higher than their net income. Regardless of the fact that B&G Foods
doesn’t want to cut dividends to avoid sending negative signals to the market,
paying dividends higher than your net income is nevertheless not sustainable in
the long term. It could be a signal of a troublesome situation within the company.

B&G FOODS EVALUATION 140
Long Run Residual Income Model
Our last intrinsic valuation model is the long run residual income model.
This model calculates how B&G Foods will affect the shareholder’s wealth using
value creation by taking initial inputs. Compared to the residual income model,
the long run residual income model can operate without annual forecasts of the
net income in the process of calculating the annual residual income.
The inputs that we used are growth rate, cost of equity, average return on
equity, and the current book value of equity.
The formula of the long run residual income is:
MVE = BVE0 [1 + ((ROE – KE) / (KE – g))]
Long Run Residual Income Model
ROE (constant) Growth Rate (varies)
20.44%
-10% -20% -30% -40% -50%
Cost of
Equity
(varies)
7.13% 27.75 32.56 37.48 42.52 47.65
7.83% 26.63 30.88 35.24 39.72 44.29
8.53% 25.69 29.47 33.37 37.38 41.48
9.23% 24.9 28.28 31.78 35.39 39.1
9.93% 24.21 27.26 30.42 33.68 37.05
Overvalued 10% LB 10% UB Undervalued
red $31.06 $37.96 green

B&G FOODS EVALUATION 141
Long Run Residual Income Model
Growth rate (constant) Return on Equity (varies)
-30%
14.44% 17.44% 20.44% 23.44% 26.44%
Cost of
Equity
(varies)
7.13% 24.975 29.304 33.732 38.268 42.885
7.83% 23.967 27.792 31.716 35.748 39.861
8.53% 23.121 26.523 30.033 33.642 37.332
9.23% 22.41 25.452 28.602 31.851 35.19
9.93% 21.789 24.534 27.378 30.312 33.345
Overvalued 10% LB 10% UB Undervalued
red $31.06 $37.96 green
Long Run Residual Income Model
Cost of equity (constant)
= 8.53% Return on Equity (varies)
14.44% 17.44% 20.44% 23.44% 26.44%
Growth rate
(varies)
-10.00% 30.525 35.816 41.228 46.772 52.415
-20.00% 29.293 33.968 38.764 43.692 48.719
-30.00% 28.259 32.417 36.707 41.118 45.628
-40.00% 27.39 31.108 34.958 38.929 43.01
-50.00% 26.631 29.986 33.462 37.048 40.755
Overvalued 10% LB 10% UB Undervalued
red $31.06 $37.96 green
B&G FOODS EVALUATION 142
After analyzing the long run residual income model, we came to the
conclusion that B&G Foods is slightly overvalued, based on the dominant
presence of lower bound results.
Intrinsic Valuation Model Conclusion
Despite that the fact that the models rely on the forecasted data, each of
them gives a signal as to whether the price is over or undervalued. All of the
intrinsic valuation models result in an overvalued estimation of the B&G Foods’
share price except the discounted dividends model. The discounted dividends
model estimates the company as undervalued because the terminal value of the
perpetuity is high. The models suggest that people are overvaluing B&G Foods,
believing in the future growth opportunities.

B&G FOODS EVALUATION 143
Reference
B&G Foods. 2013 Annual Report with 10-K. B&G Foods. Investor Relations.
Web. 6 Feb. 2016.
McClure, B. (2005, May 18). ROA and ROE Give Clear Picture Of Corporate
Health | Investopedia. Retrieved February 6, 2016
Damodaran, A. (2016, January). Return on Equity by Sector (US). Retrieved
February 7, 2016
Damodaran, A. (2016, January). Margins by Sector (US). Retrieved February
6, 2016
Martinez, Stephen. "USDA ERS - Processing & Marketing: Manufacturing."
USDA ERS - Processing & Marketing: Manufacturing. 27 Oct. 2014. Web. 08
Feb. 2016.
"Food Processing's Top 100 in 2015." Food Processing. Web. 07 Feb. 2016.
"Food Processing's Top 100 in 2014." Food Processing. Web. 07 Feb. 2016.
"Food Processing's Top 100 in 2013." Food Processing. Web. 05 Feb. 2016.
"Food Processing's Top 100 in 2012." Food Processing. Web. 05 Feb. 2016.
"Industry Browser - Consumer Goods - Processed & Packaged Goods
Industry - Company List." Yahoo! Finance. Web. 08 Feb. 2016.
http://www.ers.usda.gov/media/307995/aer780d_1_.pdf
http://www.usapple.org/index.php?option=com_content&view=article&id=21&Itemid=2
1
RTS Resources: $4.4 trillion market. According to industry advisory RTS Resources, the
market will expand to $5.0 trillion by 2017
http://www.fool.com/investing/general/2014/08/12/the-packaged-foods-industry-
investing-essentials.aspx
B&G FOODS EVALUATION 144
https://www.mutualfundstore.com/small-large-mid-caps-market-capitalization
http://www.businessdictionary.com/definition/value-
creation.html#ixzz3yyYXSDVO
http://www.wisegeek.com/what-is-product-diversification.htm#
http://www.wisegeek.com/what-is-a-supply-contract.htm
http://www.investopedia.com/terms/o/operatinglease.asp#ixzz41nQ1CkBh
https://www.csrhub.com/CSR_and_sustainability_information/BandG-
Foods-Inc/
http://www.ncbi.nlm.nih.gov/books/NBK220409/
http://www.sec.gov/Archives/edgar/data/1278027/000104746915001636/
a2223296z10-k.htm
http://www.sec.gov/Archives/edgar/data/40704/000119312514260716/d7
49341d10k.htm
http://www.sec.gov/Archives/edgar/data/88948/000008894814000013/a1
0k033114.htm
http://www.forbes.com/sites/stevedenning/2014/09/10/whats-the-future-
of-the-food-industry/#49ee0f801fde
http://topics.bloomberg.com/food-industry/
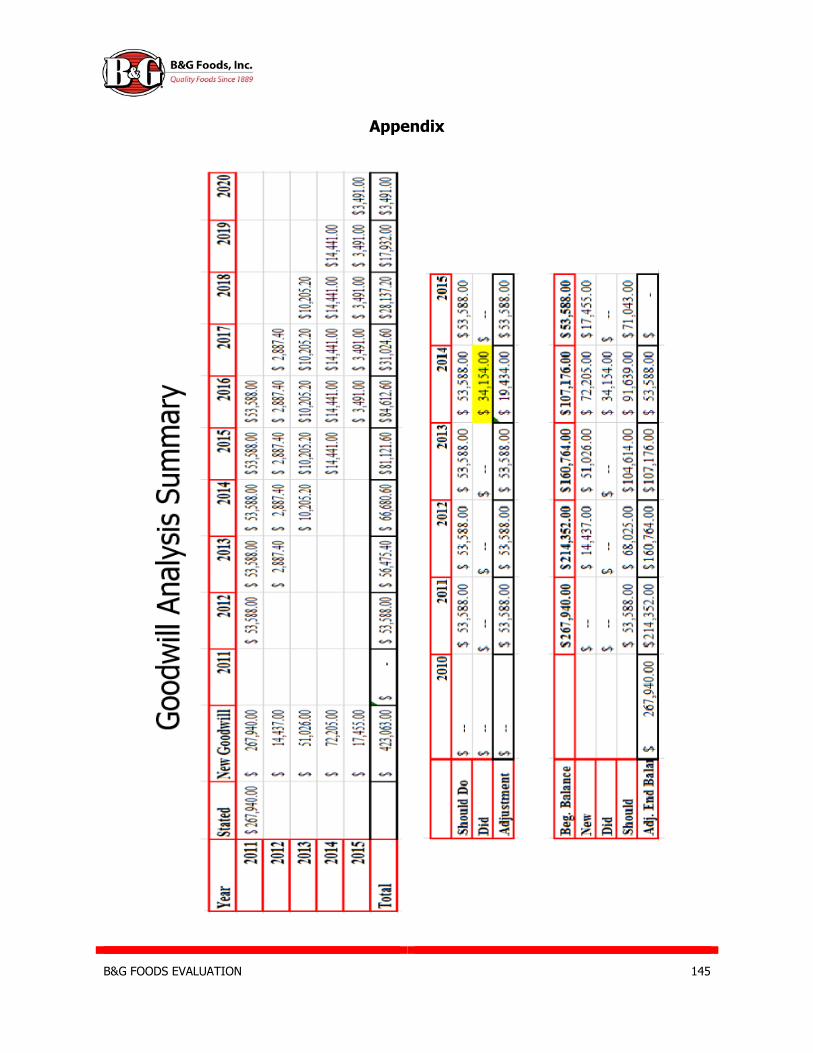
B&G FOODS EVALUATION 145
Appendix

B&G FOODS EVALUATION 146
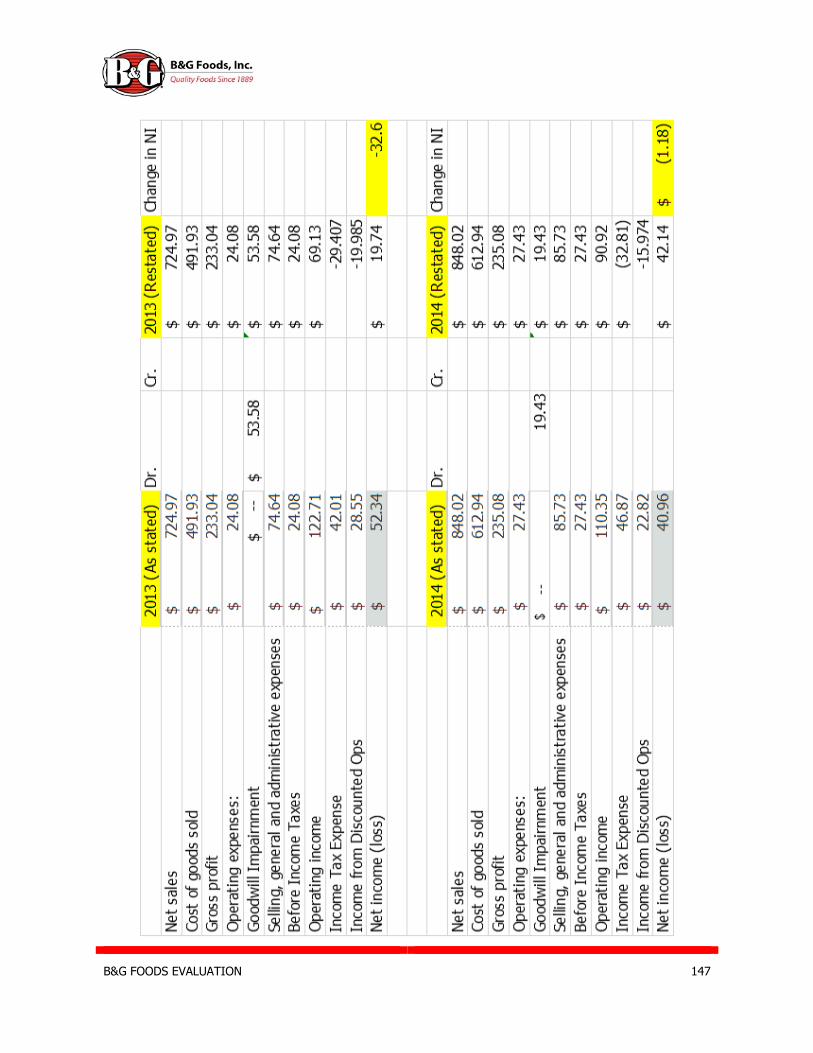
B&G FOODS EVALUATION 147
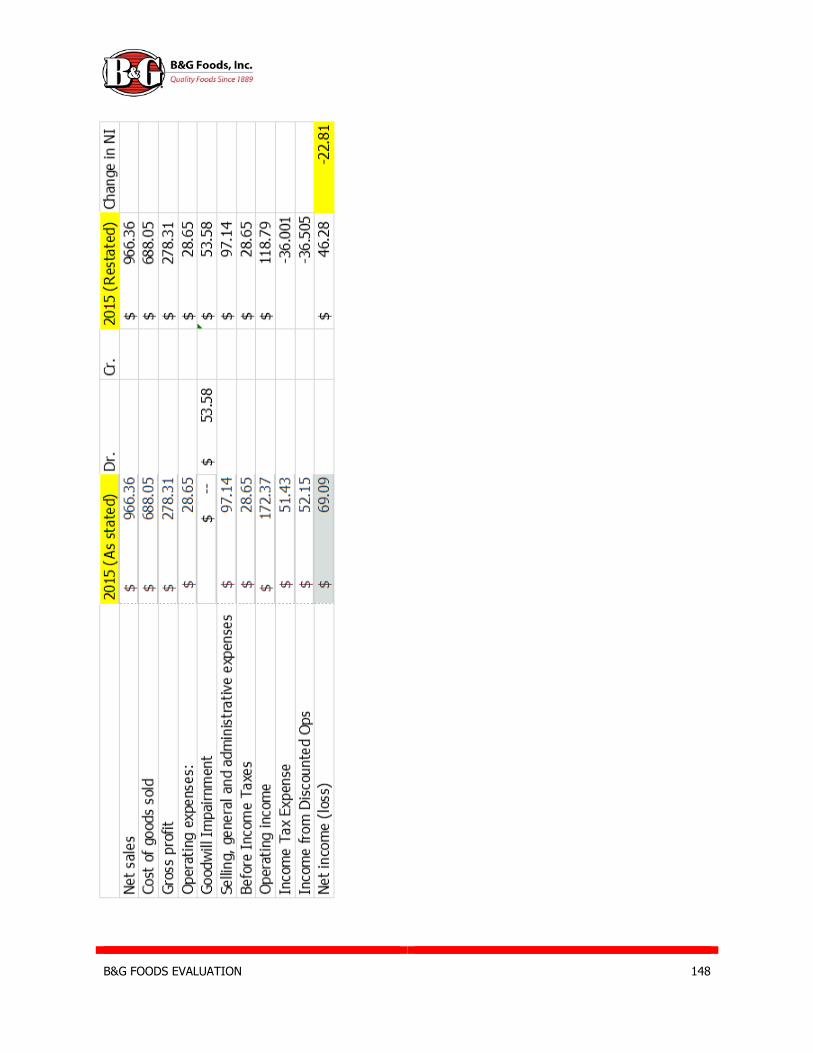
B&G FOODS EVALUATION 148
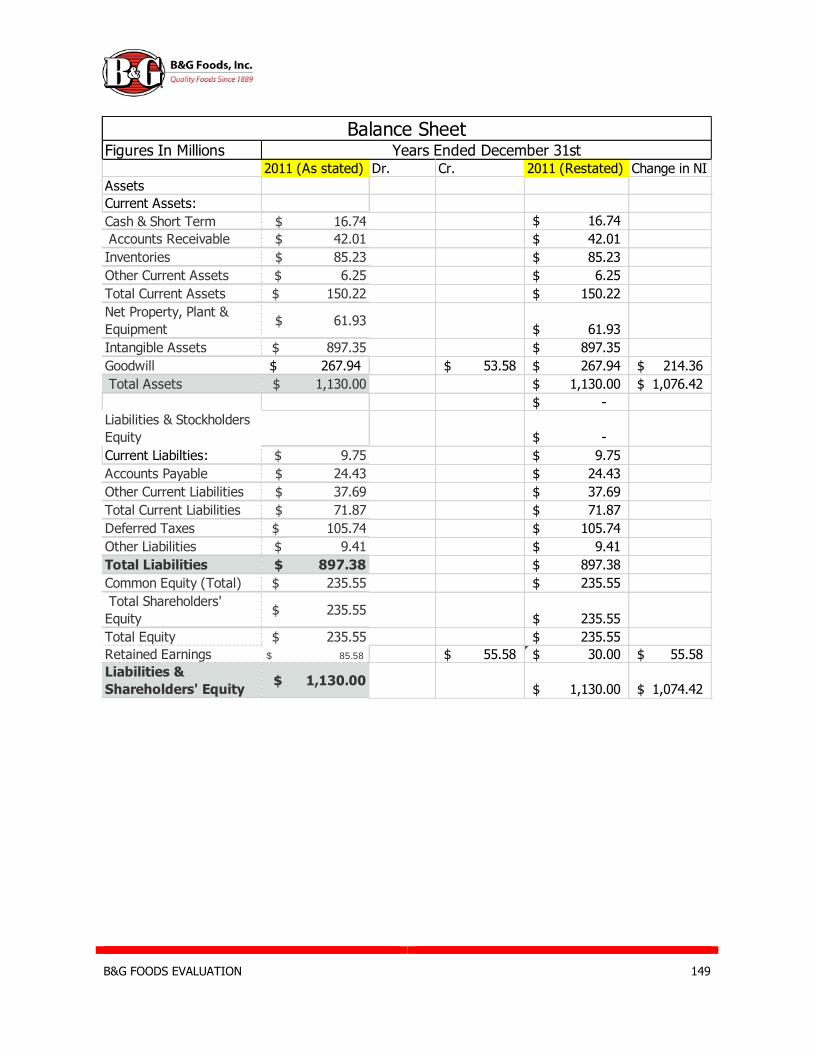
B&G FOODS EVALUATION 149
Figures In Millions2011 (As stated) Dr. Cr. 2011 (Restated) Change in NI
Assets
Current Assets:
Cash & Short Term $ 16.74 16.74$
Accounts Receivable $ 42.01 42.01$
Inventories $ 85.23 85.23$
Other Current Assets $ 6.25 6.25$
Total Current Assets $ 150.22 150.22$
Net Property, Plant &
Equipment $ 61.93
61.93$
Intangible Assets $ 897.35 897.35$
Goodwill 267.94$ 53.58$ 267.94$ 214.36$
Total Assets $ 1,130.00 1,130.00$ 1,076.42$
-$
Liabilities & Stockholders
Equity -$
Current Liabilties: $ 9.75 9.75$
Accounts Payable $ 24.43 24.43$
Other Current Liabilities $ 37.69 37.69$
Total Current Liabilities $ 71.87 71.87$
Deferred Taxes $ 105.74 105.74$
Other Liabilities $ 9.41 9.41$
Total Liabilities $ 897.38 897.38$
Common Equity (Total) $ 235.55 235.55$
Total Shareholders'
Equity $ 235.55
235.55$
Total Equity $ 235.55 235.55$
Retained Earnings 85.58$ 55.58$ 30.00$ 55.58$
Liabilities &
Shareholders' Equity $ 1,130.00
1,130.00$ 1,074.42$
Balance SheetYears Ended December 31st
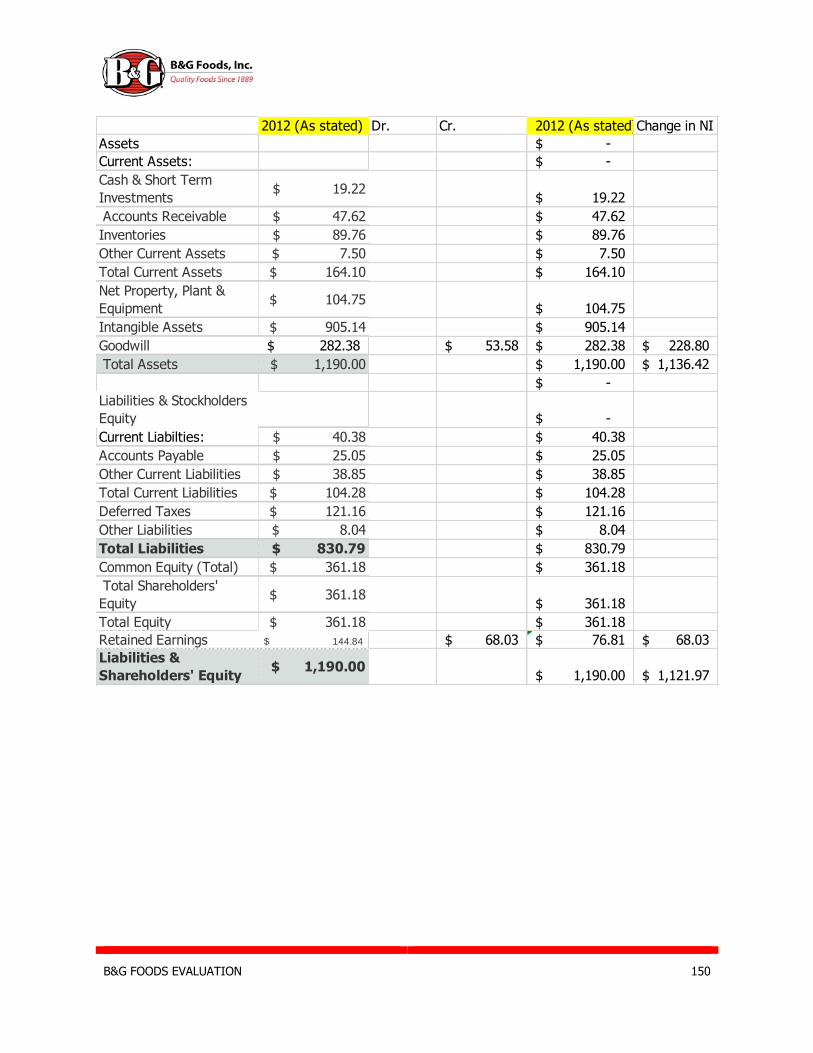
B&G FOODS EVALUATION 150
2012 (As stated) Dr. Cr. 2012 (As stated)Change in NI
Assets -$
Current Assets: -$
Cash & Short Term
Investments $ 19.22
19.22$
Accounts Receivable $ 47.62 47.62$
Inventories $ 89.76 89.76$
Other Current Assets $ 7.50 7.50$
Total Current Assets $ 164.10 164.10$
Net Property, Plant &
Equipment $ 104.75
104.75$
Intangible Assets $ 905.14 905.14$
Goodwill 282.38$ 53.58$ 282.38$ 228.80$
Total Assets $ 1,190.00 1,190.00$ 1,136.42$
-$
Liabilities & Stockholders
Equity -$
Current Liabilties: $ 40.38 40.38$
Accounts Payable $ 25.05 25.05$
Other Current Liabilities $ 38.85 38.85$
Total Current Liabilities $ 104.28 104.28$
Deferred Taxes $ 121.16 121.16$
Other Liabilities $ 8.04 8.04$
Total Liabilities $ 830.79 830.79$
Common Equity (Total) $ 361.18 361.18$
Total Shareholders'
Equity $ 361.18
361.18$
Total Equity $ 361.18 361.18$
Retained Earnings 144.84$ 68.03$ 76.81$ 68.03$
Liabilities &
Shareholders' Equity $ 1,190.00
1,190.00$ 1,121.97$

B&G FOODS EVALUATION 151
2013 (As stated) Dr. Cr. 2013 (As stated)Change in NI
Assets -$
Current Assets: -$
Cash & Short Term
Investments $ 4.11
4.11$
Accounts Receivable $ 66.19 66.19$
Inventories $ 101.25 101.25$
Other Current Assets $ 10.19 10.19$
Total Current Assets $ 181.74 181.74$
Net Property, Plant &
Equipment $ 110.37
110.37$
Intangible Assets $ 1,160.00 1,160.00$
Goodwill 318.97$ 53.58$ 318.97$ 265.39$
Total Assets $ 1,480.00 1,480.00$ 1,426.42$
-$
Liabilities & Stockholders
Equity -$
Current Liabilties: $ 26.25 26.25$
Accounts Payable $ 42.64 42.64$
Other Current Liabilities $ 36.83 36.83$
Total Current Liabilities $ 105.71 105.71$
Deferred Taxes $ 146.94 146.94$
Other Liabilities $ 8.69 8.69$
Total Liabilities $ 1,110.00 1,110.00$
Common Equity (Total) $ 378.36 378.36$
Total Shareholders'
Equity $ 378.36
378.36$
Total Equity $ 378.36 378.36$
Retained Earnings 197.19$ 104.61 92.58$ 104.61
Liabilities &
Shareholders' Equity $ 1,480.00
1,480.00$ 1,375.39$

B&G FOODS EVALUATION 152
2014 (As stated) Dr. Cr. 2014 (As stated)Change in NI
Assets -$
Current Assets: -$
Cash & Short Term
Investments $ 1.49
1.49$
Accounts Receivable $ 70.37 70.37$
Inventories $ 106.56 106.56$
Other Current Assets $ 18.11 18.11$
Total Current Assets $ 196.52 196.52$
Net Property, Plant &
Equipment $ 116.20
116.20$
Intangible Assets $ 1,320.00 1,320.00$
Goodwill 340.15$ 53.58$ 340.15$ 286.57$
Total Assets $ 1,650.00 1,650.00$ 1,596.42$
-$
Liabilities & Stockholders
Equity -$
Current Liabilties: $ 18.75 18.75$
Accounts Payable $ 38.05 38.05$
Other Current Liabilities $ 35.89 35.89$
Total Current Liabilities $ 92.69 92.69$
Deferred Taxes $ 204.21 204.21$
Other Liabilities $ 7.35 7.35$
Total Liabilities $ 1,310.00 1,310.00$
Common Equity (Total) $ 338.00 338.00$
Total Shareholders'
Equity $ 338.00
338.00$
Total Equity $ 338.00 338.00$
Retained Earnings 238.14$ 91.64 146.50$ 91.64
Liabilities &
Shareholders' Equity $ 1,650.00
1,650.00$ 1,558.36$

B&G FOODS EVALUATION 153
2015 (As stated) Dr. Cr. 2015 (As stated)Change in NI
Assets -$
Current Assets: -$
Cash & Short Term
Investments $ 5.25
5.25$
Accounts Receivable $ 124.83 124.83$
Inventories $ 312.88 312.88$
Other Current Assets $ 20.21 20.21$
Total Current Assets $ 463.16 463.16$
Net Property, Plant &
Equipment $ 163.64
163.64$
Intangible Assets $ 1,920.00 1,920.00$
Goodwill 285.40$ 53.58$ 285.40$ 231.82$
Total Assets $ 2,570.00 2,570.00$ 2,516.42$
-$
Liabilities & Stockholders
Equity -$
Current Liabilties: $ 33.75 33.75$
Accounts Payable $ 49.59 49.59$
Other Current Liabilities $ 51.53 51.53$
Total Current Liabilities $ 134.87 134.87$
Deferred Taxes $ 250.08 250.08$
Other Liabilities $ 3.21 3.21$
Total Liabilities $ 2,110.00 2,110.00$
Common Equity (Total) $ 457.69 457.69$
Total Shareholders'
Equity $ 457.69
457.69$
Total Equity $ 457.69 457.69$
Retained Earnings 307.23$ 71.04 236.19$ 71.04
Liabilities &
Shareholders' Equity $ 2,570.00
2,570.00$ 2,498.96$

B&G FOODS EVALUATION 154
Liquidity Ratios
Current Ratio
Quick Asset Ratio Current Ratio
2011 2012 2013 2014 2015
B&G Foods 2.09 1.57 1.72 2.12 3.43
Kellogg 0.91 0.75 0.85 0.77 0.56
The J.M. Smucker 3.39 2.66 2.67 1.73 2.01
General Mills Inc. 1.07 0.96 0.81 0.81 0.77
Industry 1.87 1.49 1.51 1.36 1.69
0.00
0.50
1.00
1.50
2.00
2.50
3.00
3.50
4.00
Current ratio
2011 2012 2013 2014 2015
B&G Foods 0.78 0.60 0.63 0.62 0.56
Kellogg 0.21 0.12 0.16 0.18 0.11
The J.M. Smucker 1.60 1.11 1.09 0.68 0.87
General Mills Inc. 0.63 0.58 0.52 0.52 0.46
Industry 0.81 0.60 0.60 0.50 0.50
0.00
0.20
0.40
0.60
0.80
1.00
1.20
1.40
1.60
1.80
Quick asset ratio
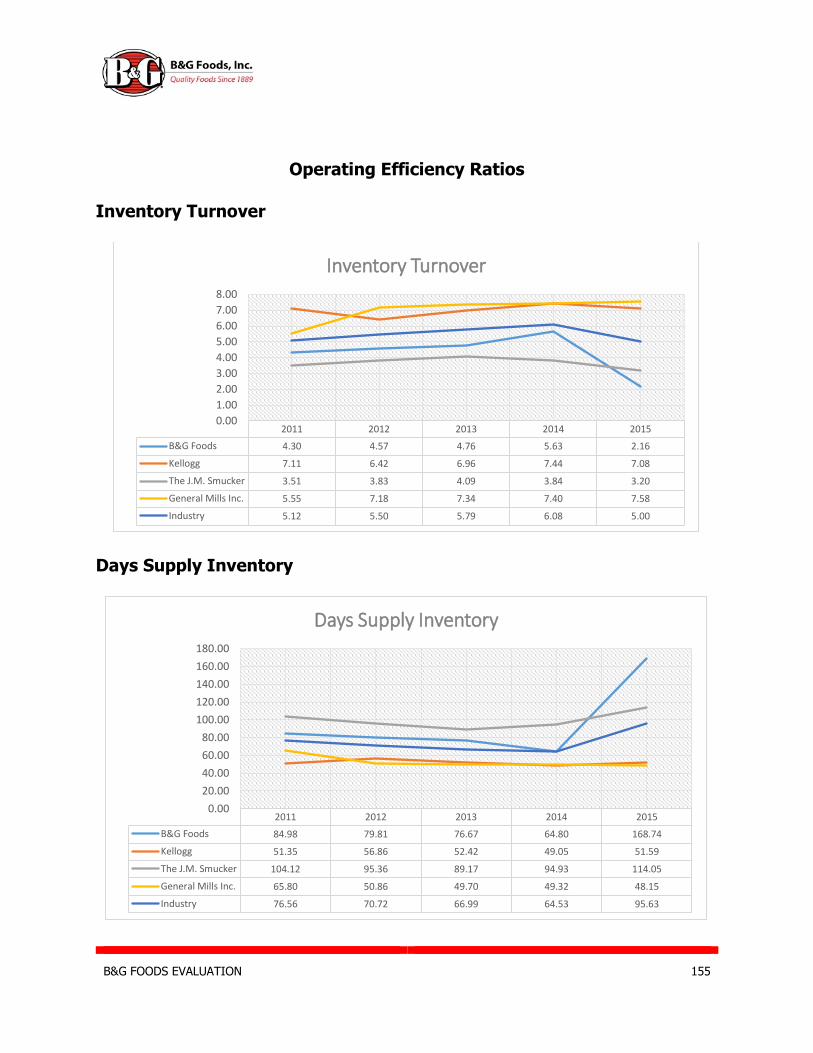
B&G FOODS EVALUATION 155
Operating Efficiency Ratios
Inventory Turnover
Days Supply Inventory
2011 2012 2013 2014 2015
B&G Foods 4.30 4.57 4.76 5.63 2.16
Kellogg 7.11 6.42 6.96 7.44 7.08
The J.M. Smucker 3.51 3.83 4.09 3.84 3.20
General Mills Inc. 5.55 7.18 7.34 7.40 7.58
Industry 5.12 5.50 5.79 6.08 5.00
0.00
1.00
2.00
3.00
4.00
5.00
6.00
7.00
8.00
Inventory Turnover
2011 2012 2013 2014 2015
B&G Foods 84.98 79.81 76.67 64.80 168.74
Kellogg 51.35 56.86 52.42 49.05 51.59
The J.M. Smucker 104.12 95.36 89.17 94.93 114.05
General Mills Inc. 65.80 50.86 49.70 49.32 48.15
Industry 76.56 70.72 66.99 64.53 95.63
0.00
20.00
40.00
60.00
80.00
100.00
120.00
140.00
160.00
180.00
Days Supply Inventory

B&G FOODS EVALUATION 156
Accounts Receivable Turnover
Days Sales Outstanding
2011 2012 2013 2014 2015
B&G Foods 13.78 14.62 11.55 15.16 13.86
Kellogg 11.11 9.76 10.39 11.43 10.06
The J.M. Smucker 14.01 15.90 18.80 18.13 13.24
General Mills Inc. 12.80 12.59 12.29 12.07 12.71
Industry 12.93 13.22 13.26 14.20 12.47
0.00
2.00
4.00
6.00
8.00
10.00
12.00
14.00
16.00
18.00
20.00
Accounts Receivable Turnover
2011 2012 2013 2014 2015
B&G Foods 26.49 24.97 31.60 24.07 26.33
Kellogg 32.85 37.38 35.14 31.94 36.27
The J.M. Smucker 26.05 22.95 19.41 20.13 27.58
General Mills Inc. 28.51 29.00 29.70 30.24 28.71
Industry 28.48 28.58 28.96 26.59 29.72
0.00
5.00
10.00
15.00
20.00
25.00
30.00
35.00
40.00
Days Sales Outstanding
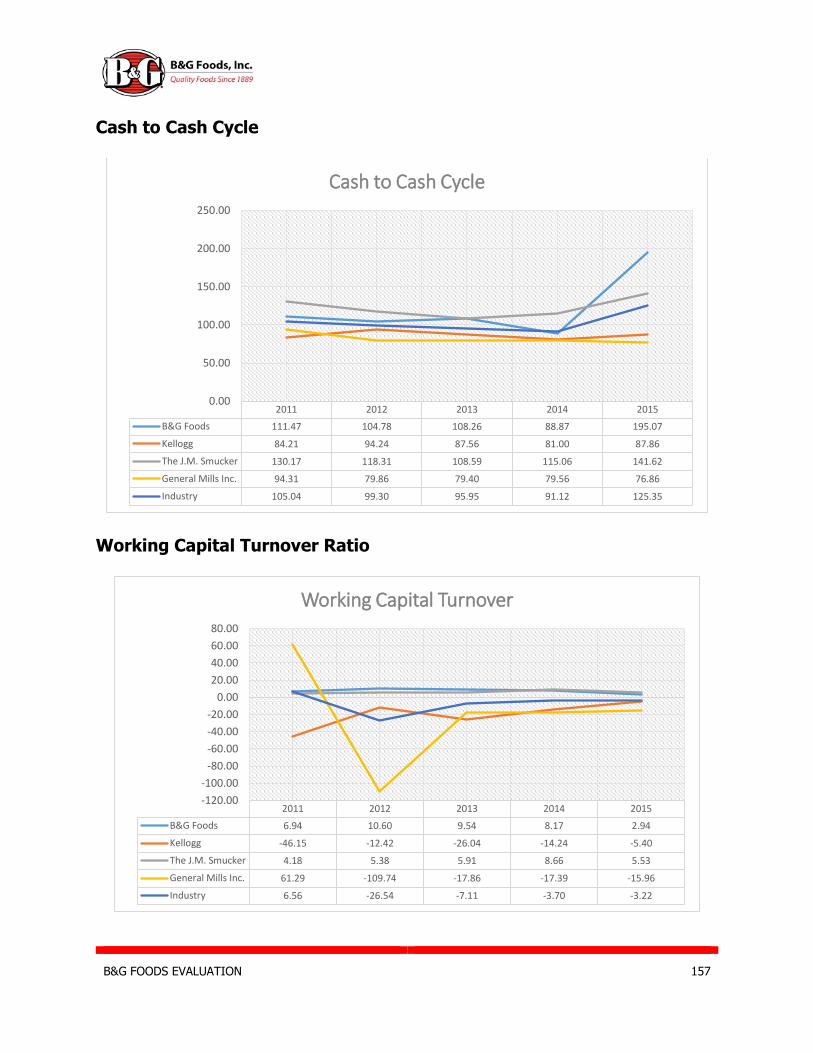
B&G FOODS EVALUATION 157
Cash to Cash Cycle
Working Capital Turnover Ratio
2011 2012 2013 2014 2015
B&G Foods 111.47 104.78 108.26 88.87 195.07
Kellogg 84.21 94.24 87.56 81.00 87.86
The J.M. Smucker 130.17 118.31 108.59 115.06 141.62
General Mills Inc. 94.31 79.86 79.40 79.56 76.86
Industry 105.04 99.30 95.95 91.12 125.35
0.00
50.00
100.00
150.00
200.00
250.00
Cash to Cash Cycle
2011 2012 2013 2014 2015
B&G Foods 6.94 10.60 9.54 8.17 2.94
Kellogg -46.15 -12.42 -26.04 -14.24 -5.40
The J.M. Smucker 4.18 5.38 5.91 8.66 5.53
General Mills Inc. 61.29 -109.74 -17.86 -17.39 -15.96
Industry 6.56 -26.54 -7.11 -3.70 -3.22
-120.00
-100.00
-80.00
-60.00
-40.00
-20.00
0.00
20.00
40.00
60.00
80.00
Working Capital Turnover

B&G FOODS EVALUATION 158
Profitability Ratios
Gross Profit Margin
Operating Profit Margin
2011 2012 2013 2014 2015
B&G Foods 33% 35% 34% 29% 30%
Kellogg 39% 38% 41% 35% 35%
The J.M. Smucker 37% 33% 34% 36% 35%
General Mills Inc. 40% 36% 36% 36% 34%
Industry 37% 36% 36% 34% 33%
0%
5%
10%
15%
20%
25%
30%
35%
40%
45%Gross Profit Margin
2011 2012 2013 2014 2015
B&G Foods 21% 24% 21% 14% 18%
Kellogg 11% 11% 19% 7% 8%
The J.M. Smucker 26% 21% 24% 26% 21%
General Mills Inc. 20% 18% 16% 17% 12%
Industry 19% 19% 20% 16% 15%
Restated 10% 13% 10% 11% 12%
0%
5%
10%
15%
20%
25%
30%
Operating Profit Margin

B&G FOODS EVALUATION 159
Net Profit Margin
Asset Turnover Ratio
2011 2012 2013 2014 2015
B&G Foods 9% 9% 7% 5% 7%
Kellogg 7% 7% 12% 4% 5%
The J.M. Smucker 10% 8% 9% 10% 6%
General Mills Inc. 12% 9% 10% 10% 7%
Industry 9% 8% 10% 7% 6%
Restated 3% 5% 3% 5% 5%
0%
2%
4%
6%
8%
10%
12%
14%
Net Profit Margin
2011 2012 2013 2014 2015
B&G Foods 0.53 0.55 0.54 0.54 0.46
Kellogg 1.04 0.98 0.93 0.97 0.96
The J.M. Smucker 0.58 0.61 0.65 0.62 0.34
General Mills Inc. 0.80 0.79 0.78 0.77 0.80
Industry 0.74 0.73 0.73 0.72 0.64
0.00
0.20
0.40
0.60
0.80
1.00
1.20
Asset Turnover

B&G FOODS EVALUATION 160
Return on Assets
Return on Equity
2011 2012 2013 2014 2015
B&G Foods 5% 5% 4% 3% 3%
Kellogg 7% 8% 12% 4% 4%
The J.M. Smucker 6% 5% 6% 6% 2%
General Mills Inc. 10% 7% 8% 8% 6%
Industry 7% 6% 8% 5% 4%
Return on Assets 2% 3% 3% 2% 2%
0%
2%
4%
6%
8%
10%
12%
14%
Return on Assets
2011 2012 2013 2014 2015
B&G Foods 27% 25% 14% 11% 20%
Kellogg 40% 55% 73% 18% 22%
The J.M. Smucker 9% 9% 11% 11% 5%
General Mills Inc. 27% 20% 23% 23% 20%
Industry 26% 27% 30% 16% 17%
Return on Equity 17% 18% 12% 5% 11%
0%
10%
20%
30%
40%
50%
60%
70%
80%
Return on Equity

B&G FOODS EVALUATION 161
Capital Structure Ratios
Debt to Equity
Times Interest Earned
2011 2012 2013 2014 2015
B&G Foods 3.81 2.30 2.92 3.88 4.62
Kellogg 5.75 5.15 3.29 4.31 6.17
The J.M. Smucker 0.57 0.77 0.75 0.80 1.38
General Mills Inc. 1.82 1.73 1.80 1.90 2.56
Industry 2.99 2.49 2.19 2.72 3.68
0.00
1.00
2.00
3.00
4.00
5.00
6.00
7.00
Debt to Equity Ratio (total liabilities)
2011 2012 2013 2014 2015
B&G Foods 2.89 2.87 2.83 2.79 2.32
Kellogg 6.12 5.98 12.07 4.90 4.81
The J.M. Smucker 10.30 8.62 8.75 10.70 6.55
General Mills Inc. 7.37 7.71 8.00 8.78 5.59
Industry 6.67 6.30 7.91 6.79 4.82
0.00
2.00
4.00
6.00
8.00
10.00
12.00
14.00
Times Interest Earned Ratio
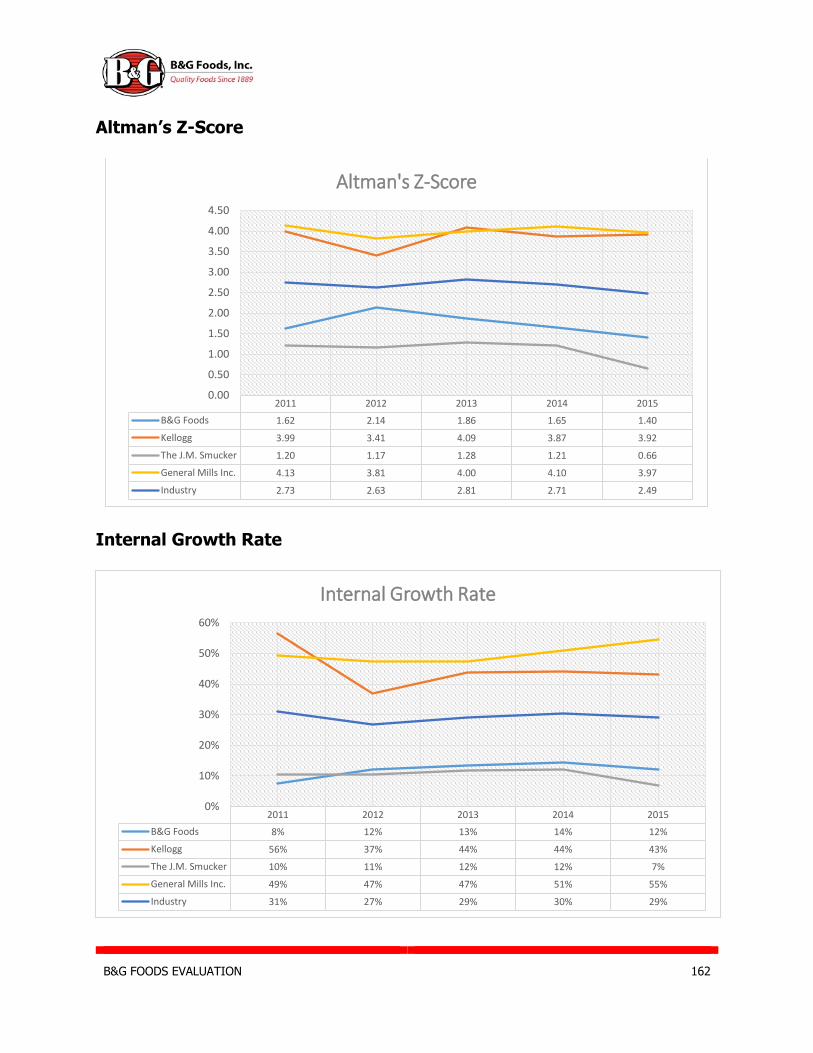
B&G FOODS EVALUATION 162
Altman’s Z-Score
Internal Growth Rate
2011 2012 2013 2014 2015
B&G Foods 1.62 2.14 1.86 1.65 1.40
Kellogg 3.99 3.41 4.09 3.87 3.92
The J.M. Smucker 1.20 1.17 1.28 1.21 0.66
General Mills Inc. 4.13 3.81 4.00 4.10 3.97
Industry 2.73 2.63 2.81 2.71 2.49
0.00
0.50
1.00
1.50
2.00
2.50
3.00
3.50
4.00
4.50
Altman's Z-Score
2011 2012 2013 2014 2015
B&G Foods 8% 12% 13% 14% 12%
Kellogg 56% 37% 44% 44% 43%
The J.M. Smucker 10% 11% 12% 12% 7%
General Mills Inc. 49% 47% 47% 51% 55%
Industry 31% 27% 29% 30% 29%
0%
10%
20%
30%
40%
50%
60%
Internal Growth Rate
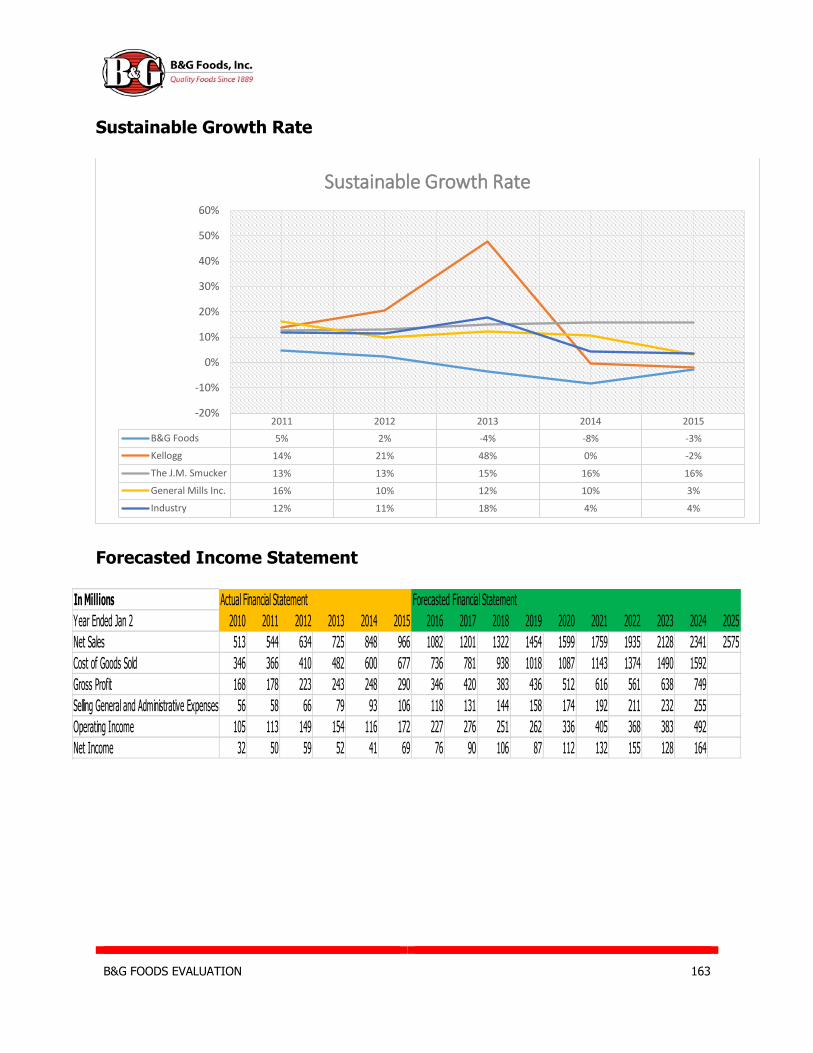
B&G FOODS EVALUATION 163
Sustainable Growth Rate
Forecasted Income Statement
2011 2012 2013 2014 2015
B&G Foods 5% 2% -4% -8% -3%
Kellogg 14% 21% 48% 0% -2%
The J.M. Smucker 13% 13% 15% 16% 16%
General Mills Inc. 16% 10% 12% 10% 3%
Industry 12% 11% 18% 4% 4%
-20%
-10%
0%
10%
20%
30%
40%
50%
60%
Sustainable Growth Rate
In Millions Actual Financial Statement Forecasted Financial Statement
Year Ended Jan 2 2010 2011 2012 2013 2014 2015 2016 2017 2018 2019 2020 2021 2022 2023 2024 2025
Net Sales 513 544 634 725 848 966 1082 1201 1322 1454 1599 1759 1935 2128 2341 2575
Cost of Goods Sold 346 366 410 482 600 677 736 781 938 1018 1087 1143 1374 1490 1592
Gross Profit 168 178 223 243 248 290 346 420 383 436 512 616 561 638 749
Selling General and Administrative Expenses 56 58 66 79 93 106 118 131 144 158 174 192 211 232 255
Operating Income 105 113 149 154 116 172 227 276 251 262 336 405 368 383 492
Net Income 32 50 59 52 41 69 76 90 106 87 112 132 155 128 164

B&G FOODS EVALUATION 164
Dividends Forecast
In Percentage of Sales Actual Financial Statement Forecasted Financial Statement
Year Ended Jan 2 2010 2011 2012 2013 2014 2015 2016 2017 2018 2019 2020 2021 2022 2023 2024 2025
Net Sales 100% 100% 100% 100% 100% 100% 100% 100% 100% 100% 100% 100% 100% 100% 100% 100%
Cost of Goods Sold 67% 67% 65% 66% 71% 70% 68% 65% 71% 70% 68% 65% 71% 70% 68%
Gross Profit 33% 33% 35% 34% 29% 30% 32% 35% 29% 30% 32% 35% 29% 30% 32%
Selling General and Administrative Expenses 11% 11% 10% 11% 11% 11% 11% 11% 11% 11% 11% 11% 11% 11% 11%
Operating Income 20% 21% 24% 21% 14% 18% 21% 23% 19% 18% 21% 23% 19% 18% 21%
Net Income 6% 9% 9% 7% 5% 7% 7% 8% 8% 6% 7% 8% 8% 6% 7%
In Millions Restated Financial Statement Forecasted Financial Statement
Year Ended Jan 2 2010 2011 2012 2013 2014 2015 2016 2017 2018 2019 2020 2021 2022 2023 2024 2025
Net Sales 513 544 634 725 848 966 1082 1201 1322 1454 1599 1759 1935 2128 2341 2575
Cost of Goods Sold 346 366 410 482 600 677 736 781 938 1018 1087 1143 1374 1490 1592
Gross Profit 168 178 223 243 248 290 346 420 383 436 512 616 561 638 749
Selling General and Administrative Expenses 56 58 66 79 93 106 118 131 144 158 174 192 211 232 255
Operating Income 105 57 85 69 91 119 141 108 139 196 160 193 271 213 258
Net Income 32 15 29 20 42 46 58 36 66 87 48 88 116 64 117
In Percentage of Sales Restated Financial Statement Forecasted Financial Statement
Year Ended Jan 2 2010 2011 2012 2013 2014 2015 2016 2017 2018 2019 2020 2021 2022 2023 2024 2025
Net Sales 100% 100% 100% 100% 100% 100% 100% 100% 100% 100% 100% 100% 100% 100% 100% 100%
Cost of Goods Sold 67% 67% 65% 66% 71% 70% 68% 65% 71% 70% 68% 65% 71% 70% 68%
Gross Profit 33% 33% 35% 34% 29% 30% 32% 35% 29% 30% 32% 35% 29% 30% 32%
Selling General and Administrative Expenses 11% 11% 10% 11% 11% 11% 11% 11% 11% 11% 11% 11% 11% 11% 11%
Operating Income 20% 10% 13% 10% 11% 12% 13% 9% 11% 14% 10% 11% 14% 10% 11%
Net Income 6% 3% 5% 3% 5% 5% 5% 3% 5% 6% 3% 5% 6% 3% 5%
Forecasted Dividends 2016 2017 2018 2019 2020 2021 2022 2023 2024
Per Share 1.44 1.52 1.60 1.68 1.76 1.84 1.92 2.00 2.08

B&G FOODS EVALUATION 165
Forecasted Balance Sheet
In Millions Actual Financial Statement Forecasted Financial Statement
Year Ended Jan 2 2010 2011 2012 2013 2014 2015 2016 2017 2018 2019 2020 2021 2022 2023 2024 2025
Assets
Current assets
Cash and cash equivalents 98 17 19 4 1 5
Marketable securities
Accounts receivable trade, less
allowances for doubtful accounts 34 39 43 63 56 70 79 88 97 106 117 129 142 156 171
Inventories 74 85 90 101 107 313 302 257 257 223 238 251 301 327 349
Deferred taxes on income 5 2 2 2 3 5
Prepaid expenses and other receivables 0.2 5 5 8 15 68
Other current assets 2 3 4 3 14 3
Total current assets 215 150 164 182 197 463 332 351 371 460 485 513 544 673 711
Non-Current assets
Property, plant and equipment, net 61 62 105 110 116 164 164 164 164 164 164 164 164 164 164
Intangible assets, net 332 635 637 844 948 1442
Goodwill 203 263 268 319 370 473 473 473 473 473 473 473 473 473 473
Deferred taxes on income
Other assets 10 23 18 29 18 29
Total non-current assets 656 983 1028 1303 1453 2109
Total assets 871 1133 1192 1484 1649 2572 2403 2541 2692 3331 3518 3721 3941 4877 5151
Liabilities and Shareholders' Equity
Current liabilities
Loans and notes payable 15 10 40 26 19 34
Accounts payable 9 24 25 43 38 50
Accrued liabilities 25 27 24 19 18 31
Other current liabilities 12 11 15 18 18 20
Total current liabilities 61 72 104 106 93 135 97 102 108 134 142 150 159 196 207
Non-Current liabilities
Long-term debt 477 710 597 845 1007 1726
Deferred taxes on income 97 106 121 147 204 250
Other liabilities 4 9 8 9 7 3
Total non-current liabilities 580 826 727 1000 1219 1979 1854 1983 2112 2734 2901 3068 3233 4117 4333
Total liabilities 641 897 831 1106 1311 2114 1951 2085 2221 2868 3042 3217 3392 4313 4540
Common stock 0.48 0.48 0.53 0.53 0.54 0.58
Accumulated other comprehensive
income -7.21 -10.43 -11.10 -2.47 -11.03 -12.70
Retained earnings 35 86 145 197 238 307 302 306 321 313 325 353 399 414 460
Additional paid-in capital 201 160 227 183 110 163
Less: common stock held in treasury,
at cost
Total shareholders' equity 230 236 361 378 338 458 452 456 471 463 476 504 550 564 610
Total liabilities and shareholders' equity 871 1133 1192 1484 1649 2572 2403 2541 2692 3331 3518 3721 3941 4877 5151
Forecasted Dividends (41) (54) (65) (73) (78) (81) (86) (91) (95) (100) (104) (109) (113) (118)
Forecasted NI 50 59 52 41 69 76 90 106 87 112 132 155 128 164
Dividends + NI 9 5 (13) (32) (9) (6) 4 15 (8) 12 28 46 15 46
Difference in Retained Earnings 9 5 (13) (32) (9) (6) 4 15 (8) 12 28 46 15 46
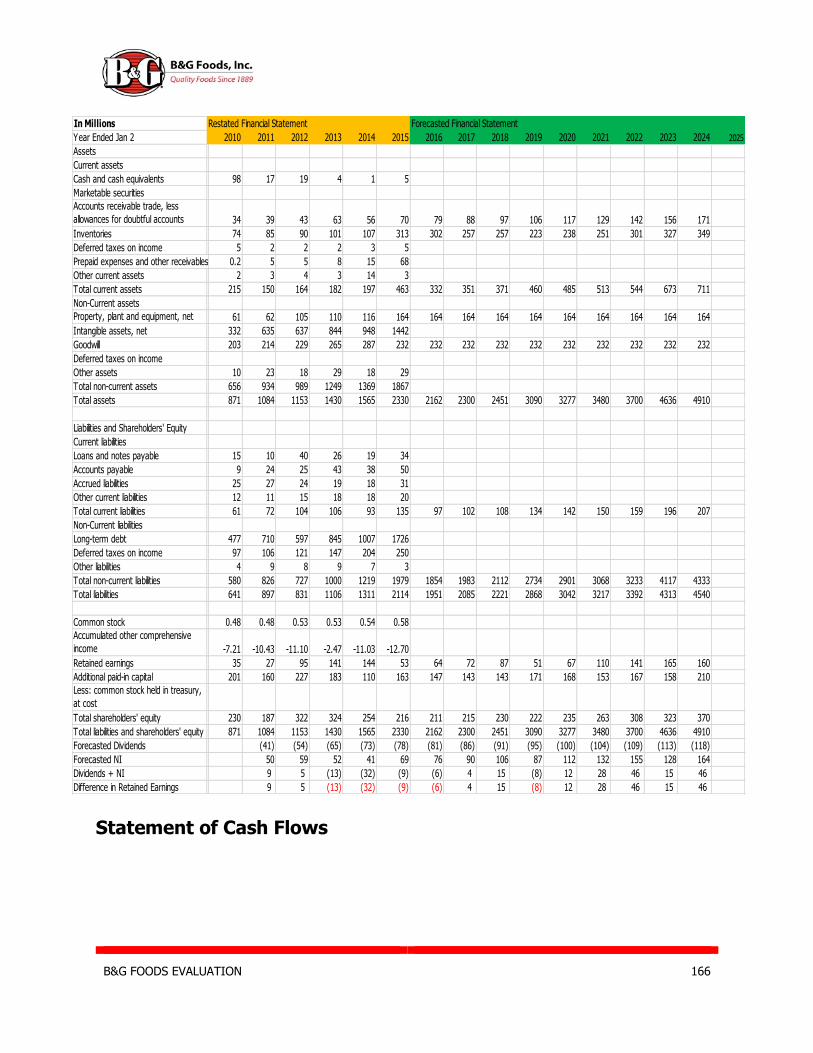
B&G FOODS EVALUATION 166
Statement of Cash Flows
In Millions Restated Financial Statement Forecasted Financial Statement
Year Ended Jan 2 2010 2011 2012 2013 2014 2015 2016 2017 2018 2019 2020 2021 2022 2023 2024 2025
Assets
Current assets
Cash and cash equivalents 98 17 19 4 1 5
Marketable securities
Accounts receivable trade, less
allowances for doubtful accounts 34 39 43 63 56 70 79 88 97 106 117 129 142 156 171
Inventories 74 85 90 101 107 313 302 257 257 223 238 251 301 327 349
Deferred taxes on income 5 2 2 2 3 5
Prepaid expenses and other receivables 0.2 5 5 8 15 68
Other current assets 2 3 4 3 14 3
Total current assets 215 150 164 182 197 463 332 351 371 460 485 513 544 673 711
Non-Current assets
Property, plant and equipment, net 61 62 105 110 116 164 164 164 164 164 164 164 164 164 164
Intangible assets, net 332 635 637 844 948 1442
Goodwill 203 214 229 265 287 232 232 232 232 232 232 232 232 232 232
Deferred taxes on income
Other assets 10 23 18 29 18 29
Total non-current assets 656 934 989 1249 1369 1867
Total assets 871 1084 1153 1430 1565 2330 2162 2300 2451 3090 3277 3480 3700 4636 4910
Liabilities and Shareholders' Equity
Current liabilities
Loans and notes payable 15 10 40 26 19 34
Accounts payable 9 24 25 43 38 50
Accrued liabilities 25 27 24 19 18 31
Other current liabilities 12 11 15 18 18 20
Total current liabilities 61 72 104 106 93 135 97 102 108 134 142 150 159 196 207
Non-Current liabilities
Long-term debt 477 710 597 845 1007 1726
Deferred taxes on income 97 106 121 147 204 250
Other liabilities 4 9 8 9 7 3
Total non-current liabilities 580 826 727 1000 1219 1979 1854 1983 2112 2734 2901 3068 3233 4117 4333
Total liabilities 641 897 831 1106 1311 2114 1951 2085 2221 2868 3042 3217 3392 4313 4540
Common stock 0.48 0.48 0.53 0.53 0.54 0.58
Accumulated other comprehensive
income -7.21 -10.43 -11.10 -2.47 -11.03 -12.70
Retained earnings 35 27 95 141 144 53 64 72 87 51 67 110 141 165 160
Additional paid-in capital 201 160 227 183 110 163 147 143 143 171 168 153 167 158 210
Less: common stock held in treasury,
at cost
Total shareholders' equity 230 187 322 324 254 216 211 215 230 222 235 263 308 323 370
Total liabilities and shareholders' equity 871 1084 1153 1430 1565 2330 2162 2300 2451 3090 3277 3480 3700 4636 4910
Forecasted Dividends (41) (54) (65) (73) (78) (81) (86) (91) (95) (100) (104) (109) (113) (118)
Forecasted NI 50 59 52 41 69 76 90 106 87 112 132 155 128 164
Dividends + NI 9 5 (13) (32) (9) (6) 4 15 (8) 12 28 46 15 46
Difference in Retained Earnings 9 5 (13) (32) (9) (6) 4 15 (8) 12 28 46 15 46

B&G FOODS EVALUATION 167
2011 2012 2013 2014 2015
NCFFO/sales 0.13 0.16 0.16 0.12 0.13
NCFFO/Opr. Income 0.63 0.67 0.75 0.85 0.75
NCFFO/NI 1.43 1.70 2.20 2.42 1.86
CFFI/sales -62% -12% -36% -20% -92%
change in PPE 43 6 6 47
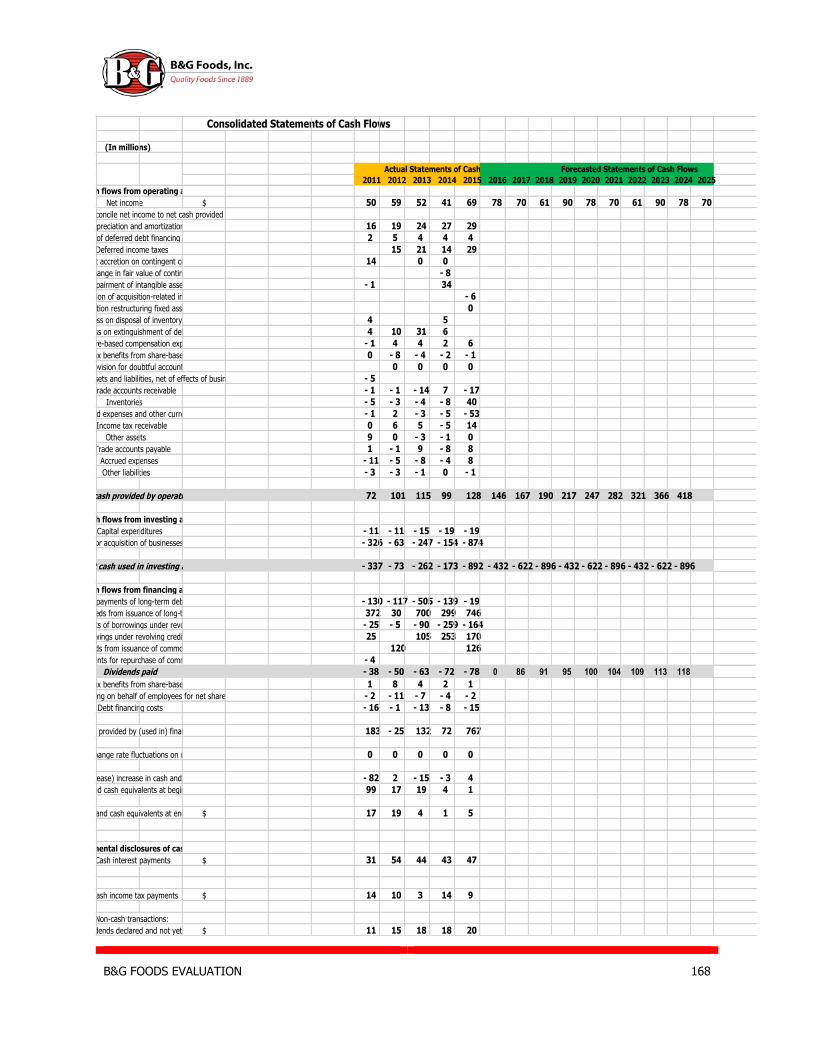
B&G FOODS EVALUATION 168
Consolidated Statements of Cash Flows
(In millions)
2011 2012 2013 2014 2015 2016 2017 2018 2019 2020 2021 2022 2023 2024 2025
Cash flows from operating activities:
Net income $ 50 59 52 41 69 78 70 61 90 78 70 61 90 78 70
Adjustments to reconcile net income to net cash provided by operating activities:
Depreciation and amortization 16 19 24 27 29
Amortization of deferred debt financing costs and bond discount 2 5 4 4 4
Deferred income taxes 15 21 14 29
Interest accretion on contingent consideration 14 0 0
Gain on change in fair value of contingent consideration - 8
Impairment of intangible assets - 1 34
Amortization of acquisition-related inventory step-up - 6
Distribution restructuring fixed asset write-off 0
Loss on disposal of inventory 4 5
Loss on extinguishment of debt 4 10 31 6
Share-based compensation expense - 1 4 4 2 6
Excess tax benefits from share-based compensation 0 - 8 - 4 - 2 - 1
Provision for doubtful accounts 0 0 0 0
Changes in assets and liabilities, net of effects of businesses acquired: - 5
Trade accounts receivable - 1 - 1 - 14 7 - 17
Inventories - 5 - 3 - 4 - 8 40
Prepaid expenses and other current assets - 1 2 - 3 - 5 - 53
Income tax receivable 0 6 5 - 5 14
Other assets 9 0 - 3 - 1 0
Trade accounts payable 1 - 1 9 - 8 8
Accrued expenses - 11 - 5 - 8 - 4 8
Other liabilities - 3 - 3 - 1 0 - 1
Net cash provided by operating activities 72 101 115 99 128 146 167 190 217 247 282 321 366 418
Cash flows from investing activities:
Capital expenditures - 11 - 11 - 15 - 19 - 19
Payments for acquisition of businesses, net of cash acquired - 326 - 63 - 247 - 154 - 874
Net cash used in investing activities - 337 - 73 - 262 - 173 - 892 - 432 - 622 - 896 - 432 - 622 - 896 - 432 - 622 - 896
Cash flows from financing activities:
Repayments of long-term debt - 130 - 117 - 505 - 139 - 19
Proceeds from issuance of long-term debt 372 30 700 299 746
Repayments of borrowings under revolving credit facility - 25 - 5 - 90 - 259 - 164
Borrowings under revolving credit facility 25 105 253 170
Proceeds from issuance of common stock, net 120 126
Payments for repurchase of common stock - 4
Dividends paid - 38 - 50 - 63 - 72 - 78 0 86 91 95 100 104 109 113 118
Excess tax benefits from share-based compensation 1 8 4 2 1
Payments of tax withholding on behalf of employees for net share settlement of share-based compensation - 2 - 11 - 7 - 4 - 2
Debt financing costs - 16 - 1 - 13 - 8 - 15
Net cash provided by (used in) financing activities 183 - 25 132 72 767
Effect of exchange rate fluctuations on cash and cash equivalents 0 0 0 0 0
Net (decrease) increase in cash and cash equivalents - 82 2 - 15 - 3 4
Cash and cash equivalents at beginning of year 99 17 19 4 1
Cash and cash equivalents at end of year$ 17 19 4 1 5
Supplemental disclosures of cash flow information:
Cash interest payments $ 31 54 44 43 47
Cash income tax payments $ 14 10 3 14 9
Non-cash transactions:
Dividends declared and not yet paid $ 11 15 18 18 20
Actual Statements of Cash Flows Forecasted Statements of Cash Flows
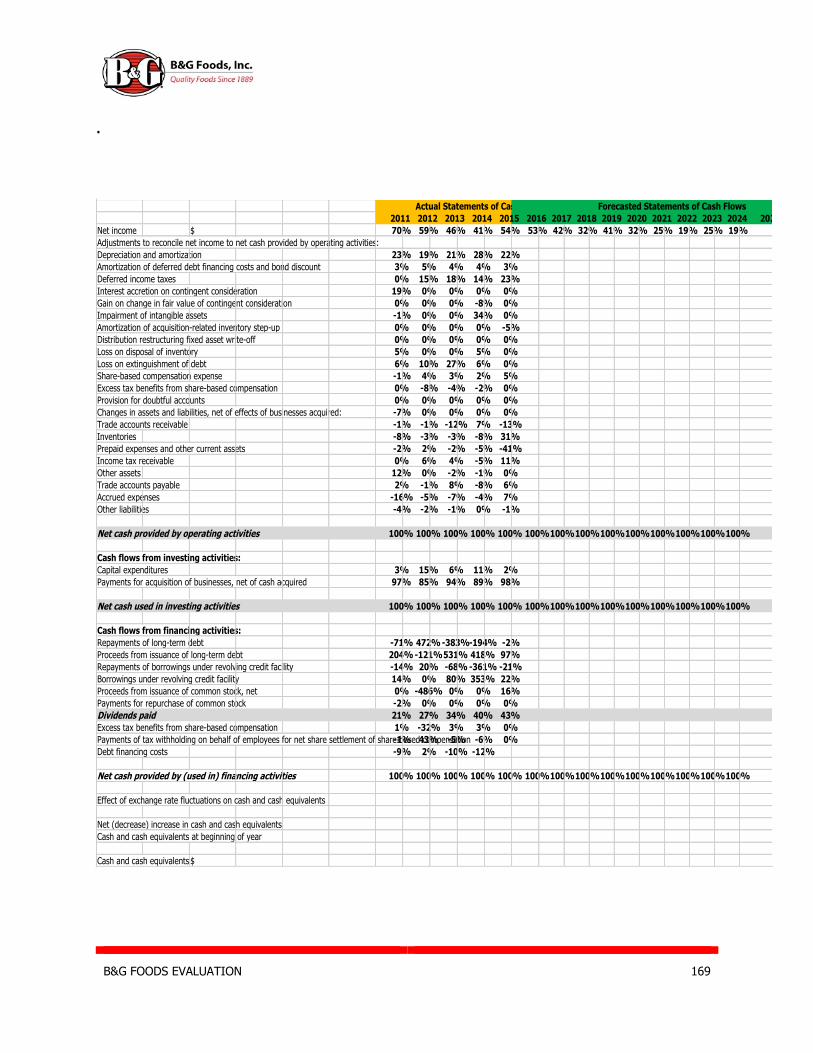
B&G FOODS EVALUATION 169
.
2011 2012 2013 2014 2015 2016 2017 2018 2019 2020 2021 2022 2023 2024 2025
Net income $ 70% 59% 46% 41% 54% 53% 42% 32% 41% 32% 25% 19% 25% 19%
Adjustments to reconcile net income to net cash provided by operating activities:
Depreciation and amortization 23% 19% 21% 28% 22%
Amortization of deferred debt financing costs and bond discount 3% 5% 4% 4% 3%
Deferred income taxes 0% 15% 18% 14% 23%
Interest accretion on contingent consideration 19% 0% 0% 0% 0%
Gain on change in fair value of contingent consideration 0% 0% 0% -8% 0%
Impairment of intangible assets -1% 0% 0% 34% 0%
Amortization of acquisition-related inventory step-up 0% 0% 0% 0% -5%
Distribution restructuring fixed asset write-off 0% 0% 0% 0% 0%
Loss on disposal of inventory 5% 0% 0% 5% 0%
Loss on extinguishment of debt 6% 10% 27% 6% 0%
Share-based compensation expense -1% 4% 3% 2% 5%
Excess tax benefits from share-based compensation 0% -8% -4% -2% 0%
Provision for doubtful accounts 0% 0% 0% 0% 0%
Changes in assets and liabilities, net of effects of businesses acquired: -7% 0% 0% 0% 0%
Trade accounts receivable -1% -1% -12% 7% -13%
Inventories -8% -3% -3% -8% 31%
Prepaid expenses and other current assets -2% 2% -2% -5% -41%
Income tax receivable 0% 6% 4% -5% 11%
Other assets 12% 0% -2% -1% 0%
Trade accounts payable 2% -1% 8% -8% 6%
Accrued expenses -16% -5% -7% -4% 7%
Other liabilities -4% -2% -1% 0% -1%
Net cash provided by operating activities 100% 100% 100% 100% 100% 100%100%100%100%100%100%100%100%100%
Cash flows from investing activities:
Capital expenditures 3% 15% 6% 11% 2%
Payments for acquisition of businesses, net of cash acquired 97% 85% 94% 89% 98%
Net cash used in investing activities 100% 100% 100% 100% 100% 100%100%100%100%100%100%100%100%100%
Cash flows from financing activities:
Repayments of long-term debt -71% 472% -383%-194% -2%
Proceeds from issuance of long-term debt 204% -121%531% 418% 97%
Repayments of borrowings under revolving credit facility -14% 20% -68% -361% -21%
Borrowings under revolving credit facility 14% 0% 80% 353% 22%
Proceeds from issuance of common stock, net 0% -486% 0% 0% 16%
Payments for repurchase of common stock -2% 0% 0% 0% 0%
Dividends paid 21% 27% 34% 40% 43%
Excess tax benefits from share-based compensation 1% -32% 3% 3% 0%
Payments of tax withholding on behalf of employees for net share settlement of share-based compensation-1% 43% -5% -6% 0%
Debt financing costs -9% 2% -10% -12%
Net cash provided by (used in) financing activities 100% 100% 100% 100% 100% 100%100%100%100%100%100%100%100%100%
Effect of exchange rate fluctuations on cash and cash equivalents
Net (decrease) increase in cash and cash equivalents
Cash and cash equivalents at beginning of year
Cash and cash equivalents at end of year$
Forecasted Statements of Cash Flows Actual Statements of Cash Flows
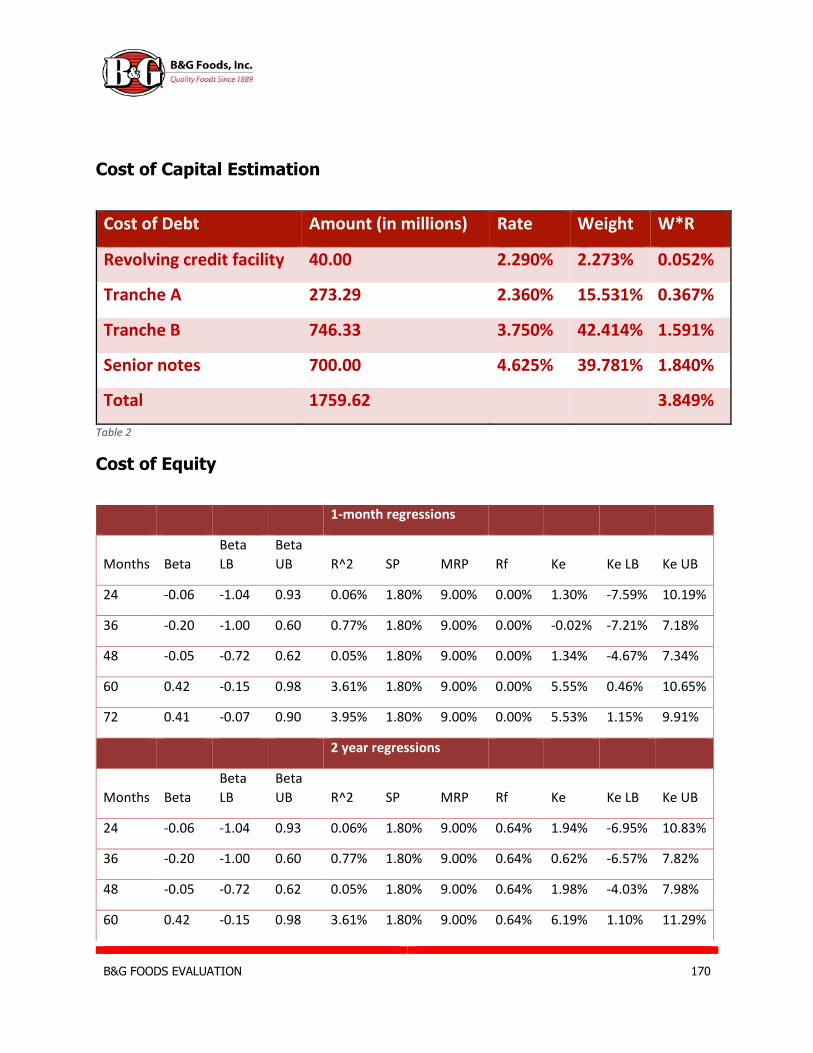
B&G FOODS EVALUATION 170
Cost of Capital Estimation
Cost of Debt Amount (in millions) Rate Weight W*R
Revolving credit facility 40.00 2.290% 2.273% 0.052%
Tranche A 273.29 2.360% 15.531% 0.367%
Tranche B 746.33 3.750% 42.414% 1.591%
Senior notes 700.00 4.625% 39.781% 1.840%
Total 1759.62
3.849%
Table 2
Cost of Equity
1-month regressions
Months Beta
Beta
LB
Beta
UB R^2 SP MRP Rf Ke Ke LB Ke UB
24 -0.06 -1.04 0.93 0.06% 1.80% 9.00% 0.00% 1.30% -7.59% 10.19%
36 -0.20 -1.00 0.60 0.77% 1.80% 9.00% 0.00% -0.02% -7.21% 7.18%
48 -0.05 -0.72 0.62 0.05% 1.80% 9.00% 0.00% 1.34% -4.67% 7.34%
60 0.42 -0.15 0.98 3.61% 1.80% 9.00% 0.00% 5.55% 0.46% 10.65%
72 0.41 -0.07 0.90 3.95% 1.80% 9.00% 0.00% 5.53% 1.15% 9.91%
2 year regressions
Months Beta
Beta
LB
Beta
UB R^2 SP MRP Rf Ke Ke LB Ke UB
24 -0.06 -1.04 0.93 0.06% 1.80% 9.00% 0.64% 1.94% -6.95% 10.83%
36 -0.20 -1.00 0.60 0.77% 1.80% 9.00% 0.64% 0.62% -6.57% 7.82%
48 -0.05 -0.72 0.62 0.05% 1.80% 9.00% 0.64% 1.98% -4.03% 7.98%
60 0.42 -0.15 0.98 3.61% 1.80% 9.00% 0.64% 6.19% 1.10% 11.29%
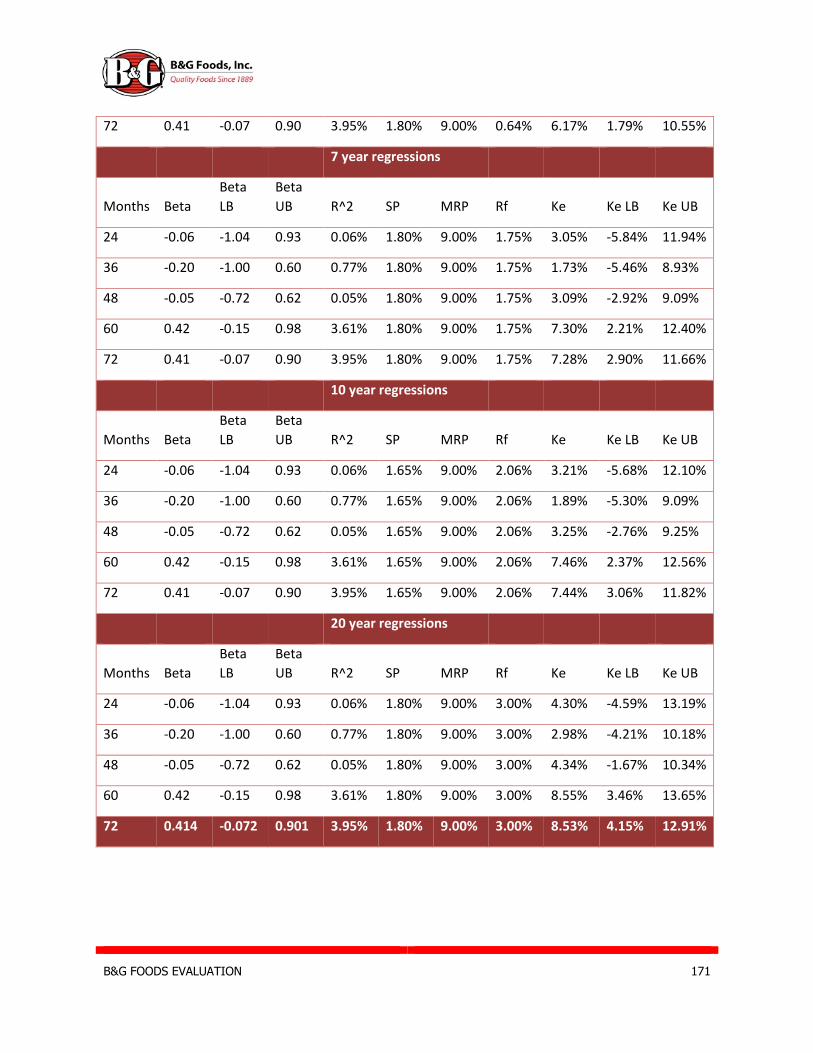
B&G FOODS EVALUATION 171
72 0.41 -0.07 0.90 3.95% 1.80% 9.00% 0.64% 6.17% 1.79% 10.55%
7 year regressions
Months Beta
Beta
LB
Beta
UB R^2 SP MRP Rf Ke Ke LB Ke UB
24 -0.06 -1.04 0.93 0.06% 1.80% 9.00% 1.75% 3.05% -5.84% 11.94%
36 -0.20 -1.00 0.60 0.77% 1.80% 9.00% 1.75% 1.73% -5.46% 8.93%
48 -0.05 -0.72 0.62 0.05% 1.80% 9.00% 1.75% 3.09% -2.92% 9.09%
60 0.42 -0.15 0.98 3.61% 1.80% 9.00% 1.75% 7.30% 2.21% 12.40%
72 0.41 -0.07 0.90 3.95% 1.80% 9.00% 1.75% 7.28% 2.90% 11.66%
10 year regressions
Months Beta
Beta
LB
Beta
UB R^2 SP MRP Rf Ke Ke LB Ke UB
24 -0.06 -1.04 0.93 0.06% 1.65% 9.00% 2.06% 3.21% -5.68% 12.10%
36 -0.20 -1.00 0.60 0.77% 1.65% 9.00% 2.06% 1.89% -5.30% 9.09%
48 -0.05 -0.72 0.62 0.05% 1.65% 9.00% 2.06% 3.25% -2.76% 9.25%
60 0.42 -0.15 0.98 3.61% 1.65% 9.00% 2.06% 7.46% 2.37% 12.56%
72 0.41 -0.07 0.90 3.95% 1.65% 9.00% 2.06% 7.44% 3.06% 11.82%
20 year regressions
Months Beta
Beta
LB
Beta
UB R^2 SP MRP Rf Ke Ke LB Ke UB
24 -0.06 -1.04 0.93 0.06% 1.80% 9.00% 3.00% 4.30% -4.59% 13.19%
36 -0.20 -1.00 0.60 0.77% 1.80% 9.00% 3.00% 2.98% -4.21% 10.18%
48 -0.05 -0.72 0.62 0.05% 1.80% 9.00% 3.00% 4.34% -1.67% 10.34%
60 0.42 -0.15 0.98 3.61% 1.80% 9.00% 3.00% 8.55% 3.46% 13.65%
72 0.414 -0.072 0.901 3.95% 1.80% 9.00% 3.00% 8.53% 4.15% 12.91%
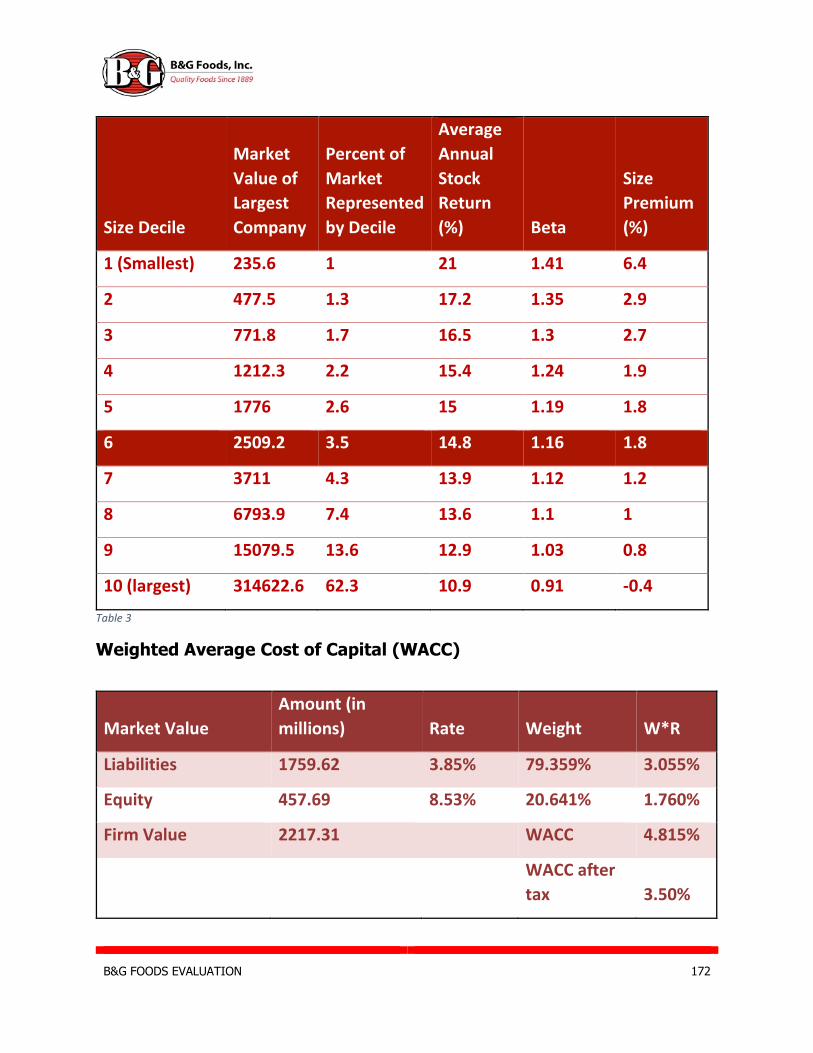
B&G FOODS EVALUATION 172
Size Decile
Market
Value of
Largest
Company
Percent of
Market
Represented
by Decile
Average
Annual
Stock
Return
(%) Beta
Size
Premium
(%)
1 (Smallest) 235.6 1 21 1.41 6.4
2 477.5 1.3 17.2 1.35 2.9
3 771.8 1.7 16.5 1.3 2.7
4 1212.3 2.2 15.4 1.24 1.9
5 1776 2.6 15 1.19 1.8
6 2509.2 3.5 14.8 1.16 1.8
7 3711 4.3 13.9 1.12 1.2
8 6793.9 7.4 13.6 1.1 1
9 15079.5 13.6 12.9 1.03 0.8
10 (largest) 314622.6 62.3 10.9 0.91 -0.4
Table 3
Weighted Average Cost of Capital (WACC)
Market Value
Amount (in
millions) Rate Weight W*R
Liabilities 1759.62 3.85% 79.359% 3.055%
Equity 457.69 8.53% 20.641% 1.760%
Firm Value 2217.31
WACC 4.815%
WACC after
tax 3.50%
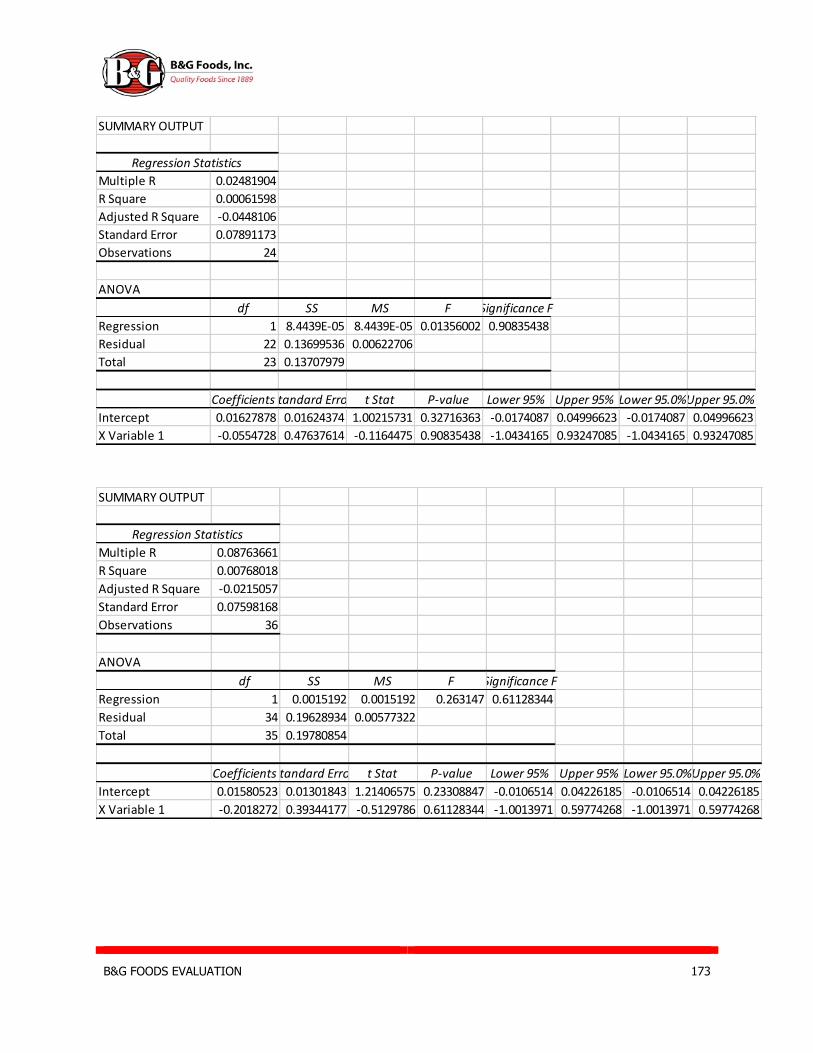
B&G FOODS EVALUATION 173
SUMMARY OUTPUT
Regression Statistics
Multiple R 0.02481904
R Square 0.00061598
Adjusted R Square -0.0448106
Standard Error 0.07891173
Observations 24
ANOVA
df SS MS F Significance F
Regression 1 8.4439E-05 8.4439E-05 0.01356002 0.90835438
Residual 22 0.13699536 0.00622706
Total 23 0.13707979
CoefficientsStandard Error t Stat P-value Lower 95% Upper 95% Lower 95.0%Upper 95.0%
Intercept 0.01627878 0.01624374 1.00215731 0.32716363 -0.0174087 0.04996623 -0.0174087 0.04996623
X Variable 1 -0.0554728 0.47637614 -0.1164475 0.90835438 -1.0434165 0.93247085 -1.0434165 0.93247085
SUMMARY OUTPUT
Regression Statistics
Multiple R 0.08763661
R Square 0.00768018
Adjusted R Square -0.0215057
Standard Error 0.07598168
Observations 36
ANOVA
df SS MS F Significance F
Regression 1 0.0015192 0.0015192 0.263147 0.61128344
Residual 34 0.19628934 0.00577322
Total 35 0.19780854
CoefficientsStandard Error t Stat P-value Lower 95% Upper 95% Lower 95.0%Upper 95.0%
Intercept 0.01580523 0.01301843 1.21406575 0.23308847 -0.0106514 0.04226185 -0.0106514 0.04226185
X Variable 1 -0.2018272 0.39344177 -0.5129786 0.61128344 -1.0013971 0.59774268 -1.0013971 0.59774268
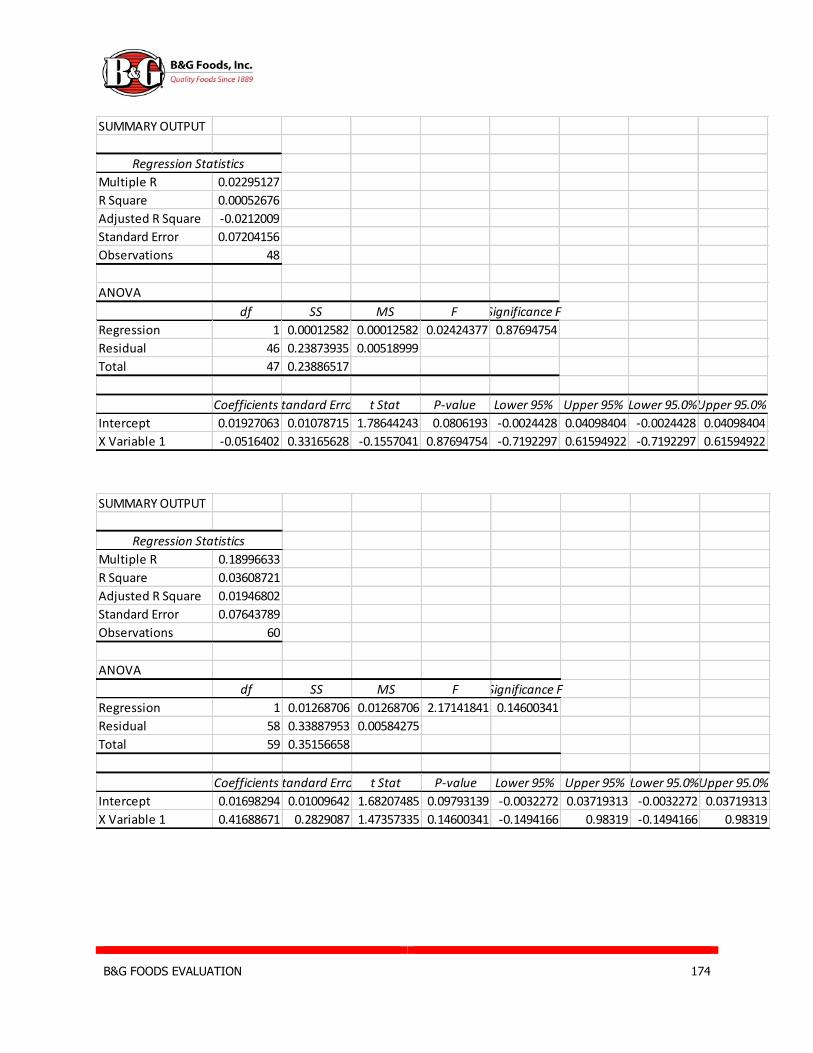
B&G FOODS EVALUATION 174
SUMMARY OUTPUT
Regression Statistics
Multiple R 0.02295127
R Square 0.00052676
Adjusted R Square -0.0212009
Standard Error 0.07204156
Observations 48
ANOVA
df SS MS F Significance F
Regression 1 0.00012582 0.00012582 0.02424377 0.87694754
Residual 46 0.23873935 0.00518999
Total 47 0.23886517
CoefficientsStandard Error t Stat P-value Lower 95% Upper 95% Lower 95.0%Upper 95.0%
Intercept 0.01927063 0.01078715 1.78644243 0.0806193 -0.0024428 0.04098404 -0.0024428 0.04098404
X Variable 1 -0.0516402 0.33165628 -0.1557041 0.87694754 -0.7192297 0.61594922 -0.7192297 0.61594922
SUMMARY OUTPUT
Regression Statistics
Multiple R 0.18996633
R Square 0.03608721
Adjusted R Square 0.01946802
Standard Error 0.07643789
Observations 60
ANOVA
df SS MS F Significance F
Regression 1 0.01268706 0.01268706 2.17141841 0.14600341
Residual 58 0.33887953 0.00584275
Total 59 0.35156658
CoefficientsStandard Error t Stat P-value Lower 95% Upper 95% Lower 95.0%Upper 95.0%
Intercept 0.01698294 0.01009642 1.68207485 0.09793139 -0.0032272 0.03719313 -0.0032272 0.03719313
X Variable 1 0.41688671 0.2829087 1.47357335 0.14600341 -0.1494166 0.98319 -0.1494166 0.98319

B&G FOODS EVALUATION 175
Method of Comparables
SUMMARY OUTPUT
Regression Statistics
Multiple R 0.19884698
R Square 0.03954012
Adjusted R Square 0.02581926
Standard Error 0.07851087
Observations 72
ANOVA
df SS MS F Significance F
Regression 1 0.017763 0.017763 2.88175329 0.09403042
Residual 70 0.431477 0.00616396
Total 71 0.44924
CoefficientsStandard Error t Stat P-value Lower 95% Upper 95% Lower 95.0%Upper 95.0%
Intercept 0.02255437 0.00947906 2.37939 0.02007114 0.00364899 0.04145976 0.00364899 0.04145976
X Variable 1 0.41420864 0.24400052 1.69757277 0.09403042 -0.0724351 0.90085234 -0.0724351 0.90085234
As Stated Restated
Trailing P/E Overvalued Overvalued
Forward P/E Overvalued Overvalued
Price to Book Overvalued Overvalued
Dividend to Price Overvalued --------------
P.E.G. Ratio Overvalued Overvalued
Price/EBITDA Overvalued Overvalued
Price/Free Cash Flows Undervalued --------------Enterprice Value/EBITDA Overvalued Overvalued
Overall Overvalued Overvalued
Method of Comparables
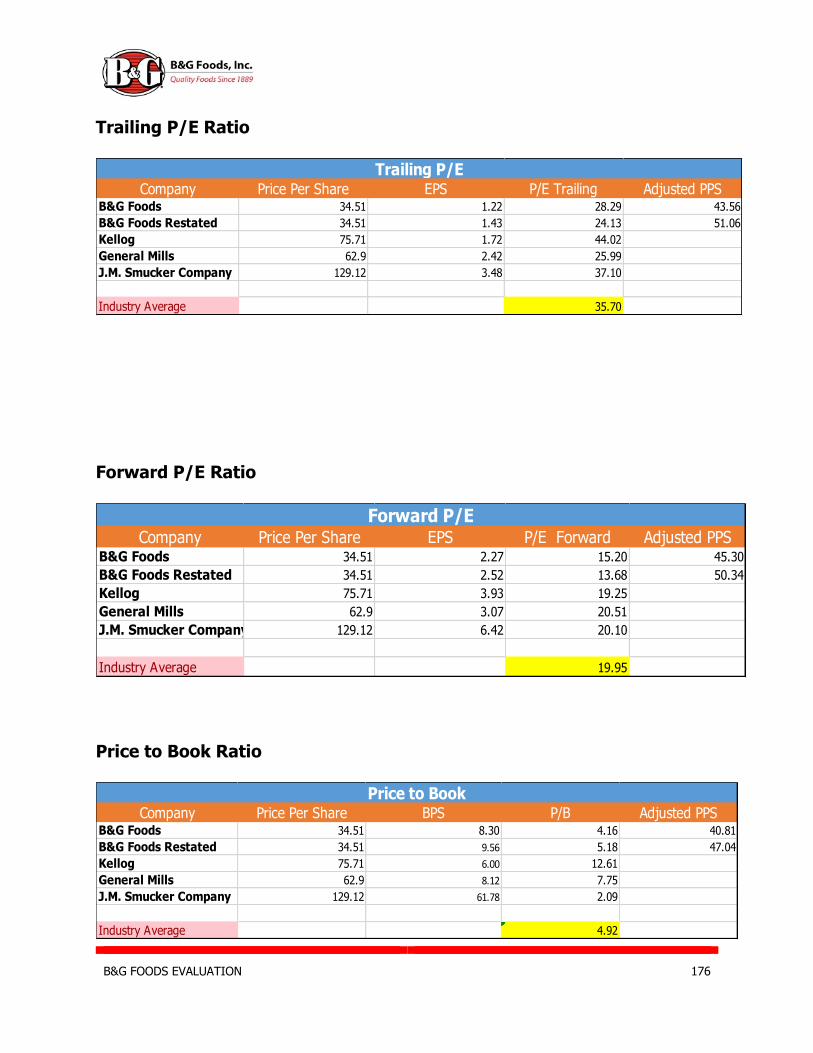
B&G FOODS EVALUATION 176
Trailing P/E Ratio
Forward P/E Ratio
Price to Book Ratio
Company Price Per Share EPS P/E Trailing Adjusted PPSB&G Foods 34.51 1.22 28.29 43.56
B&G Foods Restated 34.51 1.43 24.13 51.06
Kellog 75.71 1.72 44.02
General Mills 62.9 2.42 25.99
J.M. Smucker Company 129.12 3.48 37.10
Industry Average 35.70
Trailing P/E
Company Price Per Share EPS P/E Forward Adjusted PPSB&G Foods 34.51 2.27 15.20 45.30
B&G Foods Restated 34.51 2.52 13.68 50.34
Kellog 75.71 3.93 19.25
General Mills 62.9 3.07 20.51
J.M. Smucker Company 129.12 6.42 20.10
Industry Average 19.95
Forward P/E
Company Price Per Share BPS P/B Adjusted PPSB&G Foods 34.51 8.30 4.16 40.81
B&G Foods Restated 34.51 9.56 5.18 47.04
Kellog 75.71 6.00 12.61
General Mills 62.9 8.12 7.75
J.M. Smucker Company 129.12 61.78 2.09
Industry Average 4.92
Price to Book
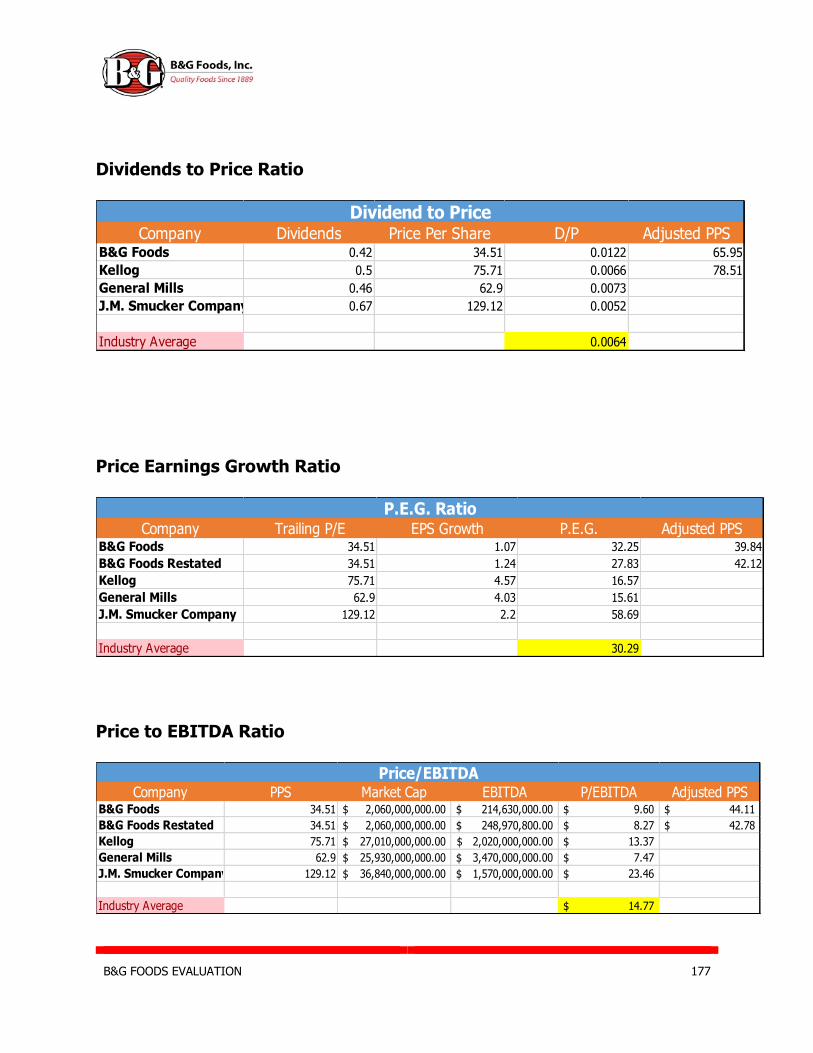
B&G FOODS EVALUATION 177
Dividends to Price Ratio
Price Earnings Growth Ratio
Price to EBITDA Ratio
Company Dividends Price Per Share D/P Adjusted PPSB&G Foods 0.42 34.51 0.0122 65.95
Kellog 0.5 75.71 0.0066 78.51
General Mills 0.46 62.9 0.0073
J.M. Smucker Company 0.67 129.12 0.0052
Industry Average 0.0064
Dividend to Price
Company Trailing P/E EPS Growth P.E.G. Adjusted PPSB&G Foods 34.51 1.07 32.25 39.84
B&G Foods Restated 34.51 1.24 27.83 42.12
Kellog 75.71 4.57 16.57
General Mills 62.9 4.03 15.61
J.M. Smucker Company 129.12 2.2 58.69
Industry Average 30.29
P.E.G. Ratio
Company PPS Market Cap EBITDA P/EBITDA Adjusted PPSB&G Foods 34.51 2,060,000,000.00$ 214,630,000.00$ 9.60$ 44.11$
B&G Foods Restated 34.51 2,060,000,000.00$ 248,970,800.00$ 8.27$ 42.78$
Kellog 75.71 27,010,000,000.00$ 2,020,000,000.00$ 13.37$
General Mills 62.9 25,930,000,000.00$ 3,470,000,000.00$ 7.47$
J.M. Smucker Company 129.12 36,840,000,000.00$ 1,570,000,000.00$ 23.46$
Industry Average 14.77$
Price/EBITDA

B&G FOODS EVALUATION 178
Price to Free Cash Flow Ratio
Enterprise Value to EBITDA Ratio
Discounted Dividend Model
B&G Foods Discounted Dividend Model
2.0% 3.0% 4.0% 5.0% 6.0%
7.13% 57.31 68.57 87.34 124.88 155.84
7.83% 44.44 49.80 57.31 68.57 87.34
8.53% 37.29 40.42 44.44 49.80 57.31
9.23% 32.74 34.79 37.29 40.42 44.44
9.93% 29.59 31.04 32.74 34.79 37.29
Overvalued 10% LB 10% UB Undervalued
Company PPS Market Cap F.C.F. P/FCFPS Adjusted PPSB&G Foods 34.51 2,060,000,000.00$ 111,128,479.00$ 18.54 18.54
Kellog 75.71 27,010,000,000.00$ 1,690,000,000.00$ 15.98 15.98
General Mills 62.9 25,930,000,000.00$ 2,840,000,000.00$ 9.13
J.M. Smucker Company 129.12 36,840,000,000.00$ 1,340,000,000.00$ 27.49
Industry Average 17.54
Price/Free Cash Flows
Company Market Cap EV EBITDA EV/EBITDA Adjusted PPSB&G Foods 2,060,000,000.00$ 3,620,000,000 214,630,000.00$ 16.87 31.18
B&G Foods Restated 2,060,000,000.00$ 3,620,000,000 240,385,600.00$ 15.06 29.37
Kellog 27,010,000,000.00$ 34,290,000,000 2,020,000,000.00$ 16.98
General Mills 25,930,000,000.00$ 45,030,000,000 3,470,000,000.00$ 12.98
J.M. Smucker Company 36,840,000,000.00$ 20,390,000,000 1,570,000,000.00$ 12.99
Industry Average 14.31
Enterprice Value/EBITDA
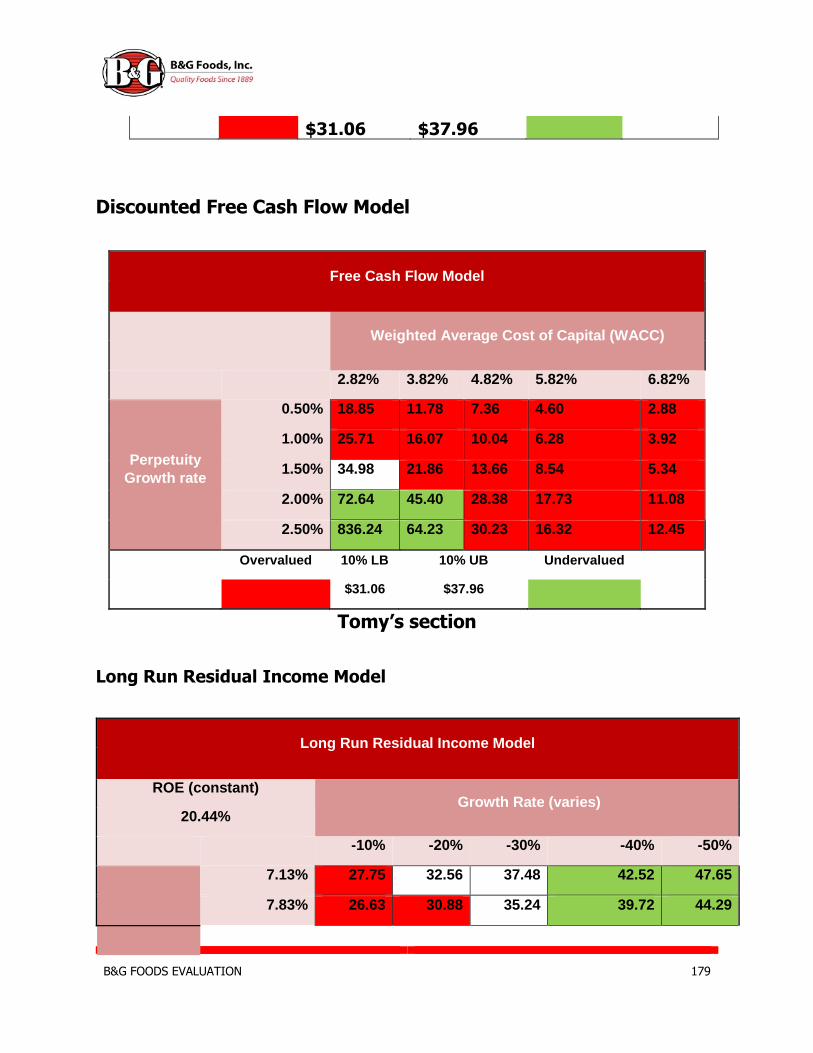
B&G FOODS EVALUATION 179
red $31.06 $37.96 Green
Discounted Free Cash Flow Model
Free Cash Flow Model
Weighted Average Cost of Capital (WACC)
2.82% 3.82% 4.82% 5.82% 6.82%
Perpetuity
Growth rate
0.50% 18.85 11.78 7.36 4.60 2.88
1.00% 25.71 16.07 10.04 6.28 3.92
1.50% 34.98 21.86 13.66 8.54 5.34
2.00% 72.64 45.40 28.38 17.73 11.08
2.50% 836.24 64.23 30.23 16.32 12.45
Overvalued 10% LB 10% UB Undervalued
red $31.06 $37.96 green
Tomy’s section
Long Run Residual Income Model
Long Run Residual Income Model
ROE (constant) Growth Rate (varies)
20.44%
-10% -20% -30% -40% -50%
7.13% 27.75 32.56 37.48 42.52 47.65
7.83% 26.63 30.88 35.24 39.72 44.29
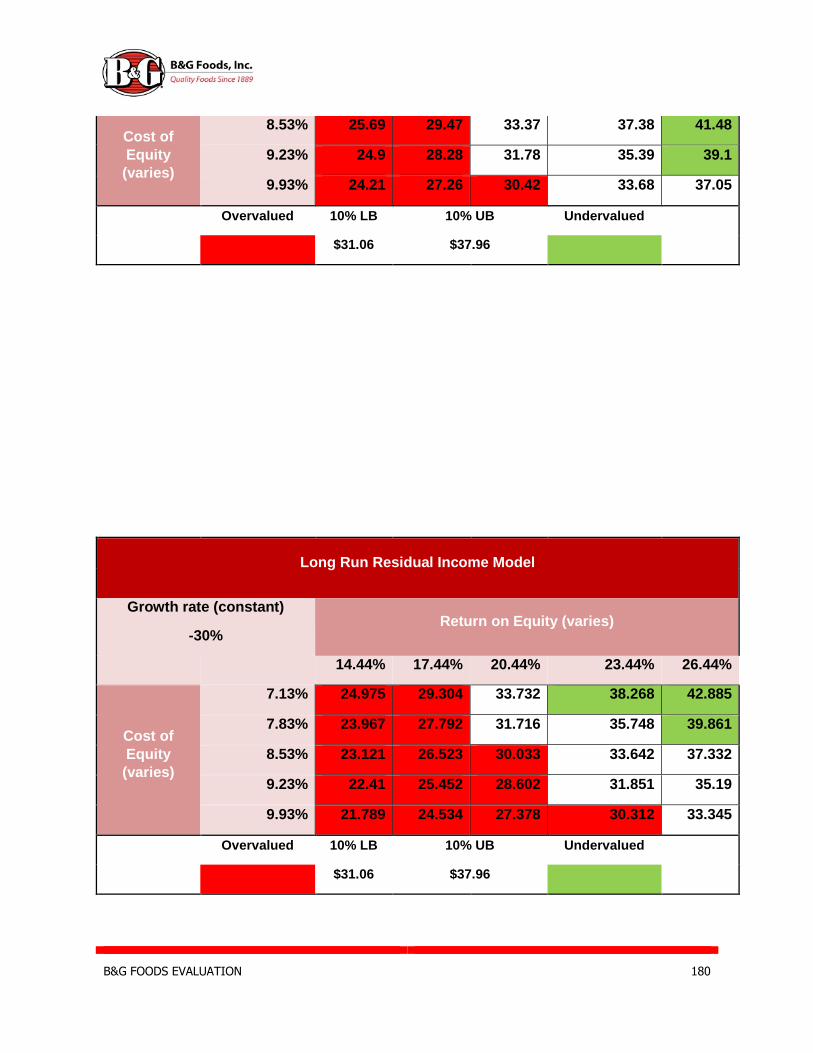
B&G FOODS EVALUATION 180
Cost of
Equity
(varies)
8.53% 25.69 29.47 33.37 37.38 41.48
9.23% 24.9 28.28 31.78 35.39 39.1
9.93% 24.21 27.26 30.42 33.68 37.05
Overvalued 10% LB 10% UB Undervalued
red $31.06 $37.96 green
Long Run Residual Income Model
Growth rate (constant) Return on Equity (varies)
-30%
14.44% 17.44% 20.44% 23.44% 26.44%
Cost of
Equity
(varies)
7.13% 24.975 29.304 33.732 38.268 42.885
7.83% 23.967 27.792 31.716 35.748 39.861
8.53% 23.121 26.523 30.033 33.642 37.332
9.23% 22.41 25.452 28.602 31.851 35.19
9.93% 21.789 24.534 27.378 30.312 33.345
Overvalued 10% LB 10% UB Undervalued
red $31.06 $37.96 green
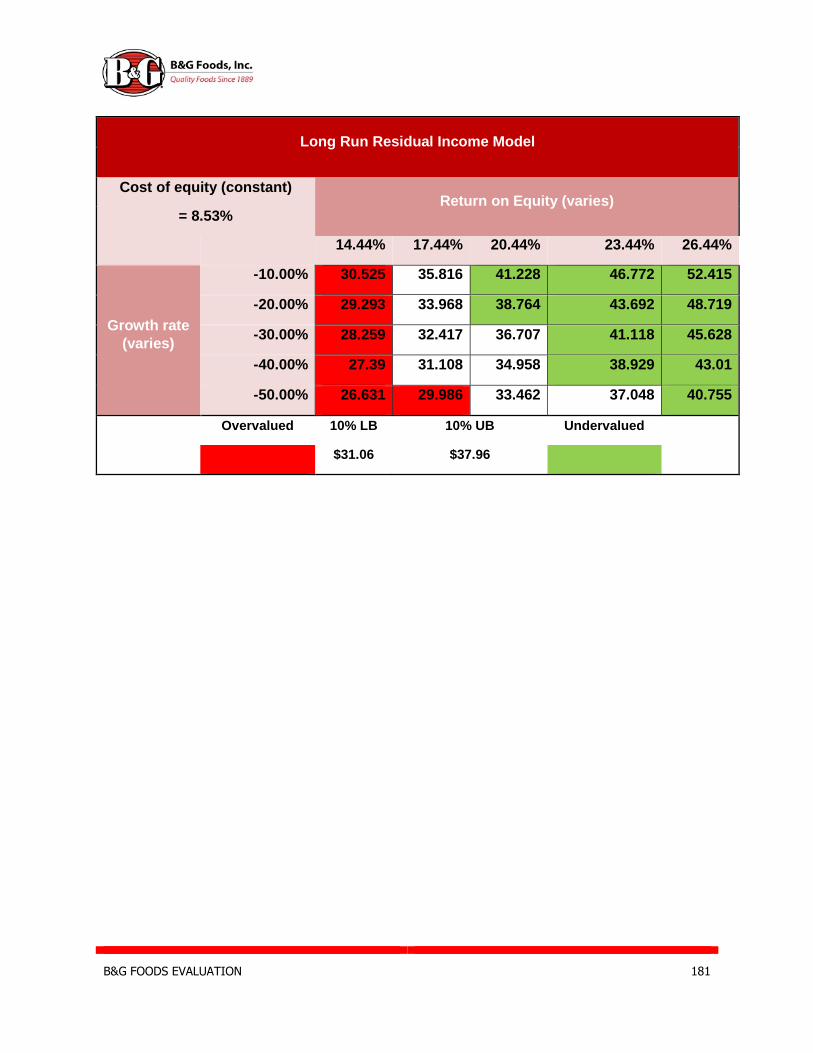
B&G FOODS EVALUATION 181
Long Run Residual Income Model
Cost of equity (constant)
= 8.53% Return on Equity (varies)
14.44% 17.44% 20.44% 23.44% 26.44%
Growth rate
(varies)
-10.00% 30.525 35.816 41.228 46.772 52.415
-20.00% 29.293 33.968 38.764 43.692 48.719
-30.00% 28.259 32.417 36.707 41.118 45.628
-40.00% 27.39 31.108 34.958 38.929 43.01
-50.00% 26.631 29.986 33.462 37.048 40.755
Overvalued 10% LB 10% UB Undervalued
red $31.06 $37.96 green


