Equitas Holdings Limited - Banking Services · Equitas Holdings Limited ... Business Evolution 8...
49
Equitas Holdings Limited Investor Presentation Q2FY18 Quarter ended Sept 2017 1
-
Upload
truonghuong -
Category
Documents
-
view
223 -
download
3
Transcript of Equitas Holdings Limited - Banking Services · Equitas Holdings Limited ... Business Evolution 8...
EquitasHoldings Limited
Investor Presentation Q2FY18
Quarter ended Sept 2017
1
MISSION
Empowering through Financial
Inclusion
2
VISION
To Serve 5% of Indian Households
by 2025
VALUES
Fair and Transparent
3
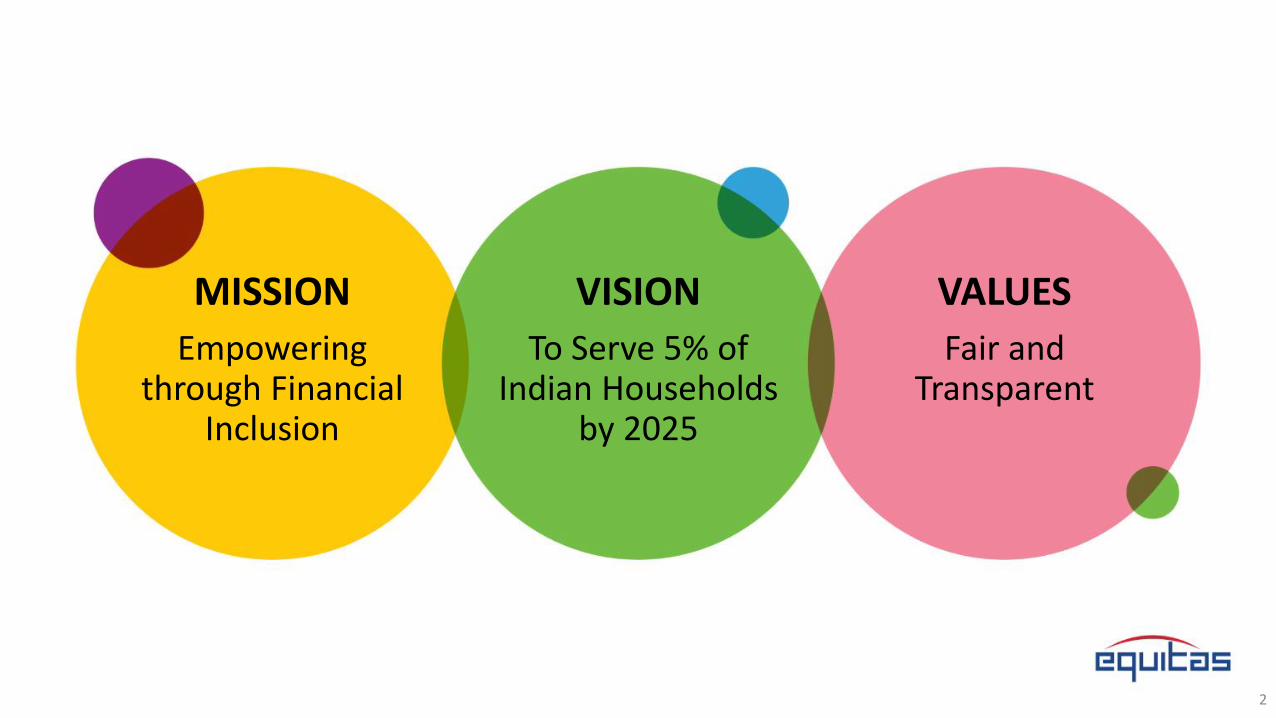
Contents
Contents Slide no.
Highlights 4
Banking and Business Strategy 5
Business Evolution 8
One year of Banking 12
Advances – Asset Remix and Diversifying Credit offering 15
Liabilities – Products and Franchise Roll-out 21
Asset Quality 27
Consolidated Financial Overview 29
Consolidated Financial Performance 32
Annexures 42
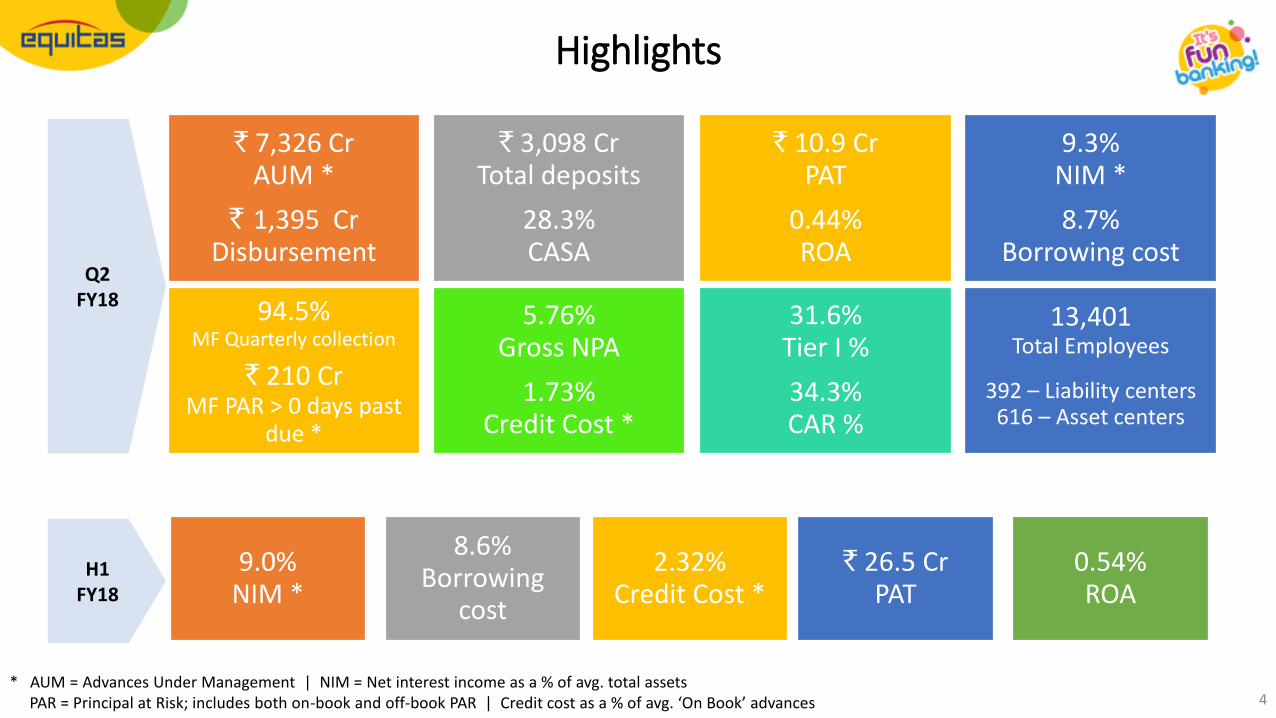
Highlights
4
` 7,326 CrAUM *
` 1,395 CrDisbursement
` 3,098 CrTotal deposits
28.3%CASA
` 10.9 CrPAT
0.44%ROA
9.3%NIM *
8.7%Borrowing cost
94.5%MF Quarterly collection
` 210 CrMF PAR > 0 days past
due *
5.76%Gross NPA
1.73%Credit Cost *
31.6%Tier I %
34.3%CAR %
13,401Total Employees
392 – Liability centers616 – Asset centers
* AUM = Advances Under Management | NIM = Net interest income as a % of avg. total assetsPAR = Principal at Risk; includes both on-book and off-book PAR | Credit cost as a % of avg. ‘On Book’ advances
Q2 FY18
9.0%NIM *
8.6%Borrowing
cost
2.32%Credit Cost *
` 26.5 CrPAT
0.54%ROA
H1FY18
5
Banking Business and Strategy
6
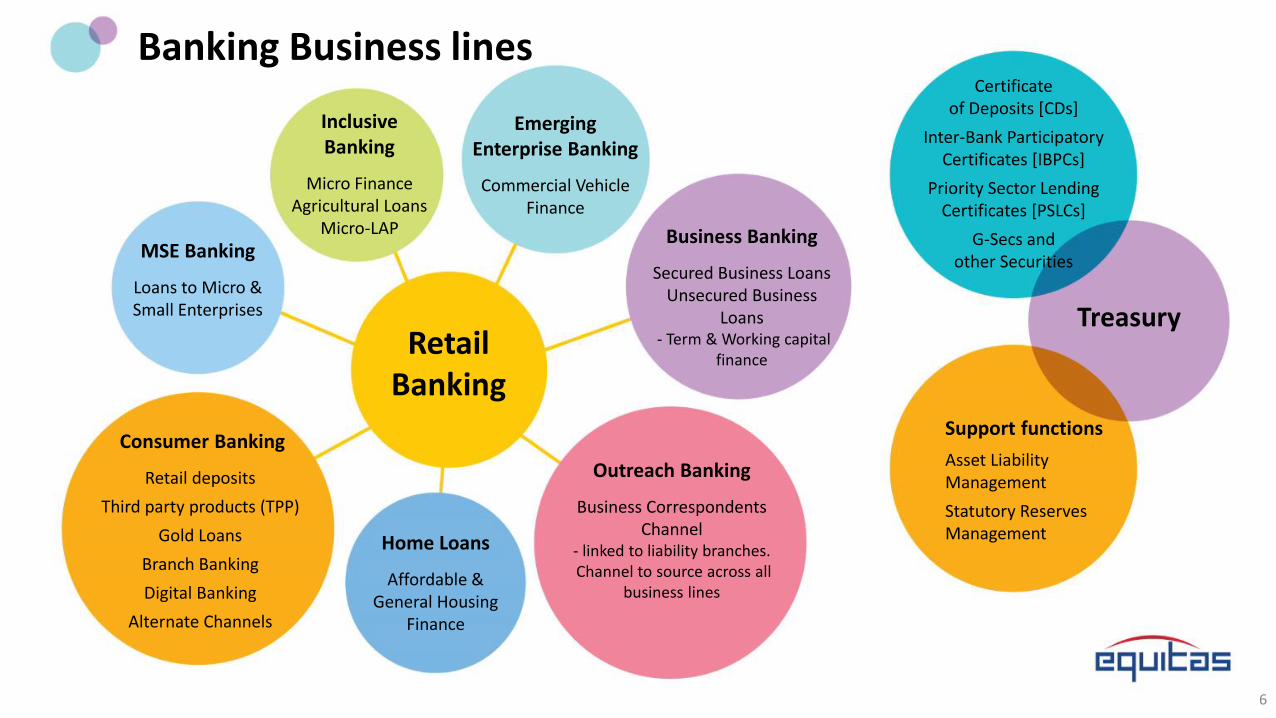
Banking Business lines
Retail Banking
Treasury
Inclusive Banking
Micro FinanceAgricultural Loans
Micro-LAP
Emerging Enterprise Banking
Commercial Vehicle Finance
MSE Banking
Loans to Micro & Small Enterprises
Home Loans
Affordable &General Housing
Finance
Consumer Banking
Retail deposits
Third party products (TPP)
Gold Loans
Branch Banking
Digital Banking
Alternate Channels
Outreach Banking
Business Correspondents Channel
- linked to liability branches.Channel to source across all
business lines
Business Banking
Secured Business LoansUnsecured Business
Loans- Term & Working capital
finance
Certificate of Deposits [CDs]
Inter-Bank Participatory Certificates [IBPCs]
Priority Sector Lending Certificates [PSLCs]
G-Secs and other Securities
Support functions
Asset Liability Management
Statutory Reserves Management

7
Diversifying Credit offering
• Primarily focusing growthfrom “Bottom of thePyramid”
• Grow the secured loanportfolio: VF, Agri loan,Gold loan, Micro-LAP,working capital loan etc.
• Leveraging MFI networkto handle relatedproducts like Agri andMicro-LAP
• Reducing cost of funds tofacilitate new productsacross credit profiles
Building up Liability Franchise
• Reach out to Mass &Affluent to garner deposits
• Market share to be drivenby
• Product innovation
• Bundling of CASAwith loan productslike Business Loans &Home loans
• Differential pricing
• Fun Banking promise
• New opportunities for FeeIncome opening up
National roll-out of Hub & Spoke
• Pan India roll-out of “liabilitybranches” in progress
• Hub & Spoke Model forservicing customers
• Hubs – physical upmarketbranches to extend branchbanking services
• Spokes – Each hub to havemultiple banking throughBusiness Correspondents (notcompany owned)
• Automated Service centres toenable Cash & Chequedeposits, self-serving kiosksetc.
High Performance model
• Market potential and underpenetration providesopportunity for sustainedcredit growth over the nextfew years
• Diversified asset portfolio
• Liability customer pool in longterm to be a strong valuecreator for the bank
• Returns landscape(5+ years)
• ROA: ~2.25%
• ROE: ~16% -20%
Banking Strategy
8
Business Evolution
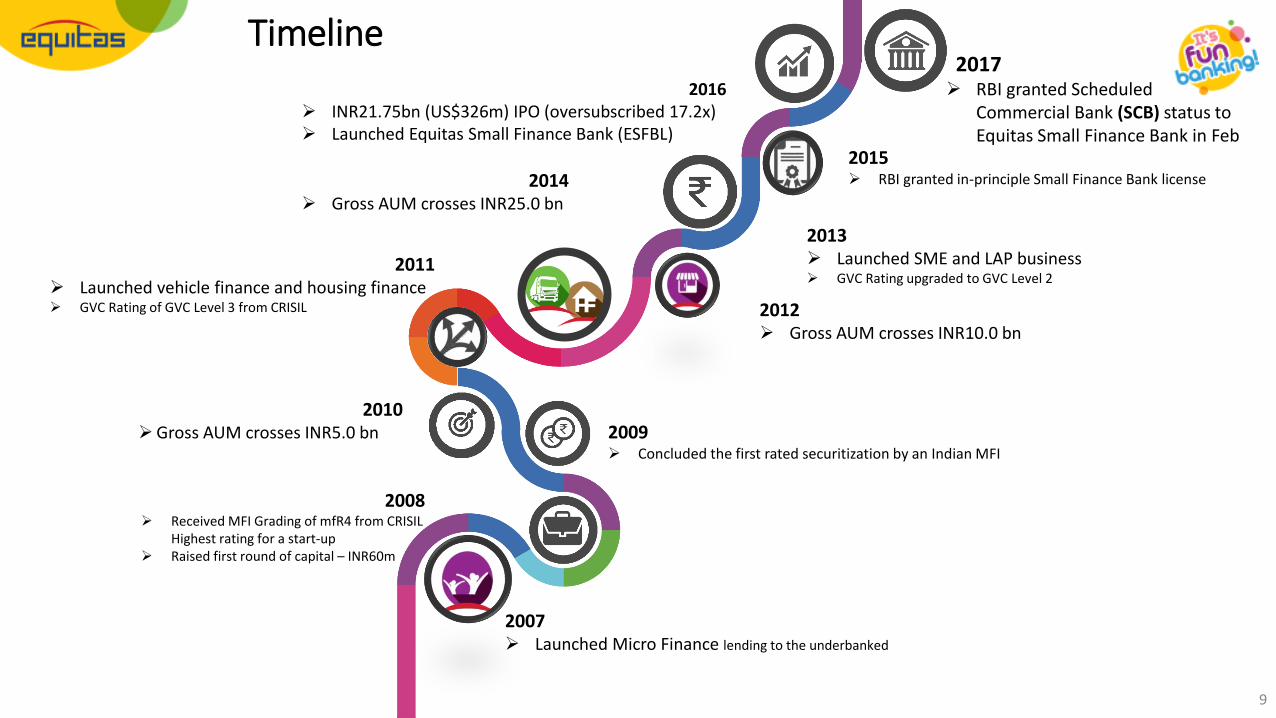
2007 Launched Micro Finance lending to the underbanked
2008 Received MFI Grading of mfR4 from CRISIL
Highest rating for a start-up Raised first round of capital – INR60m
2010Gross AUM crosses INR5.0 bn
2011 Launched vehicle finance and housing finance GVC Rating of GVC Level 3 from CRISIL
2013 Launched SME and LAP business GVC Rating upgraded to GVC Level 2
2009 Concluded the first rated securitization by an Indian MFI
2012 Gross AUM crosses INR10.0 bn
2014 Gross AUM crosses INR25.0 bn
2015 RBI granted in-principle Small Finance Bank license
2016 INR21.75bn (US$326m) IPO (oversubscribed 17.2x) Launched Equitas Small Finance Bank (ESFBL)
Timeline2017 RBI granted Scheduled
Commercial Bank (SCB) status to Equitas Small Finance Bank in Feb
9
10
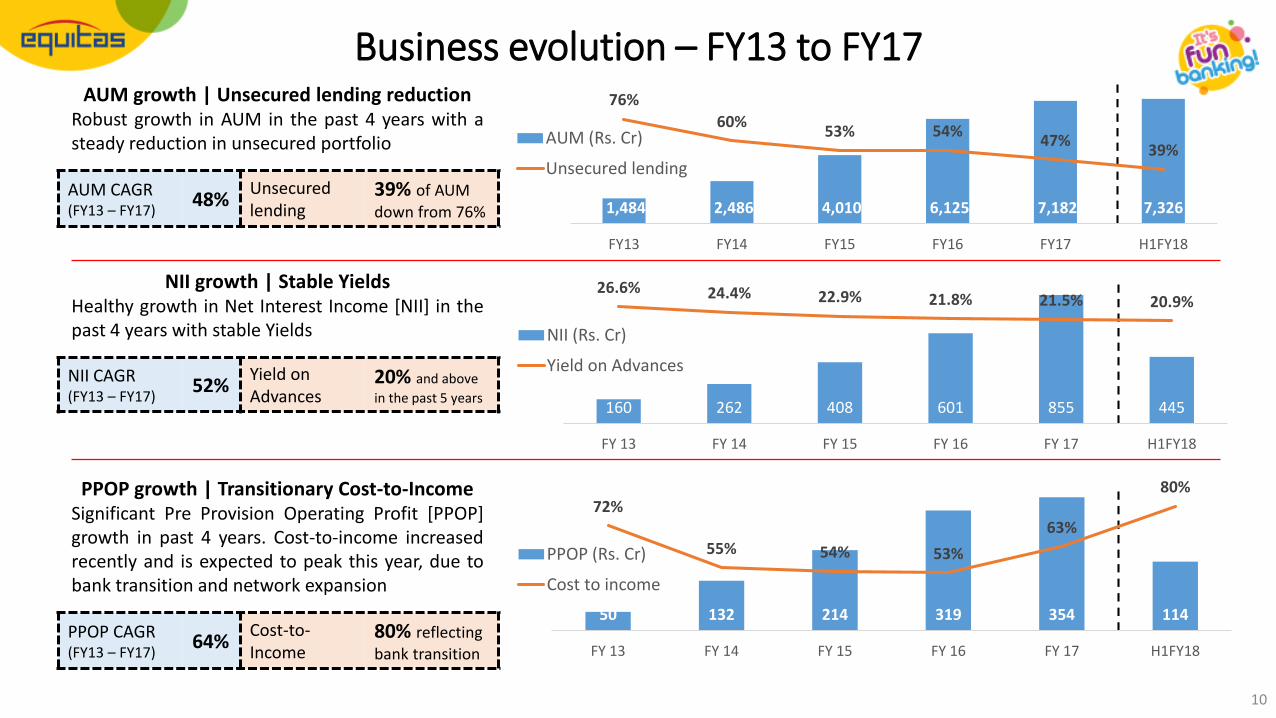
Business evolution – FY13 to FY17AUM growth | Unsecured lending reduction
Robust growth in AUM in the past 4 years with asteady reduction in unsecured portfolio
AUM CAGR (FY13 – FY17)
48%Unsecured lending
39% of AUM
down from 76%
NII growth | Stable YieldsHealthy growth in Net Interest Income [NII] in thepast 4 years with stable Yields
NII CAGR (FY13 – FY17)
52%Yield on Advances
20% and above
in the past 5 years
PPOP growth | Transitionary Cost-to-IncomeSignificant Pre Provision Operating Profit [PPOP]growth in past 4 years. Cost-to-income increasedrecently and is expected to peak this year, due tobank transition and network expansion
PPOP CAGR (FY13 – FY17)
64%Cost-to-Income
80% reflecting
bank transition
1,484 2,486 4,010 6,125 7,182 7,326
76%
60%53% 54%
47%39%
0%
20%
40%
60%
80%
100%
0
2,000
4,000
6,000
8,000
FY13 FY14 FY15 FY16 FY17 H1FY18
AUM (Rs. Cr)
Unsecured lending
50 132 214 319 354 114
72%
55% 54% 53%
63%
80%
30%
40%
50%
60%
70%
80%
90%
0
100
200
300
400
FY 13 FY 14 FY 15 FY 16 FY 17 H1FY18
PPOP (Rs. Cr)
Cost to income
160 262 408 601 855 445
26.6% 24.4% 22.9% 21.8% 21.5% 20.9%
-20%
0%
20%
40%
0
200
400
600
800
1,000
FY 13 FY 14 FY 15 FY 16 FY 17 H1FY18
NII (Rs. Cr)
Yield on Advances
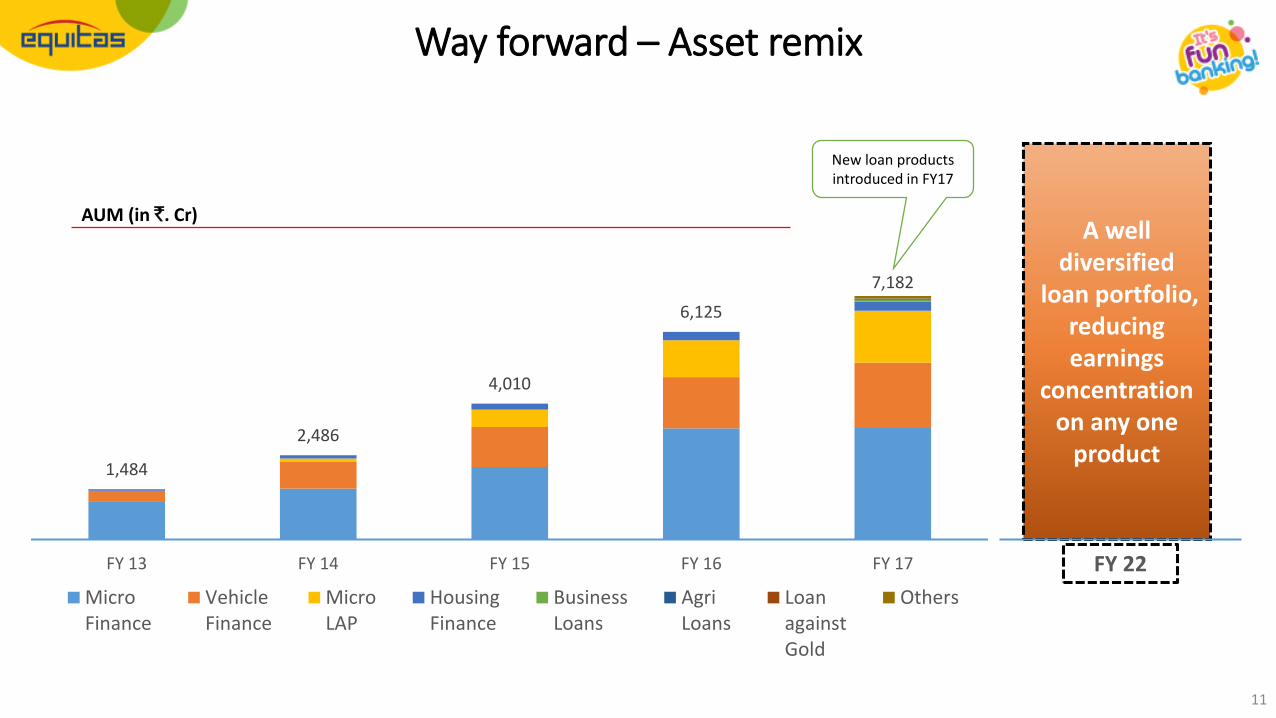
Way forward – Asset remix
A well diversified
loan portfolio, reducing earnings
concentration on any one
product
FY 22
AUM (in `. Cr)
New loan products introduced in FY17
1,484
2,486
4,010
6,125
7,182
FY 13 FY 14 FY 15 FY 16 FY 17
MicroFinance
VehicleFinance
MicroLAP
HousingFinance
BusinessLoans
AgriLoans
LoanagainstGold
Others
11
12
One year of banking
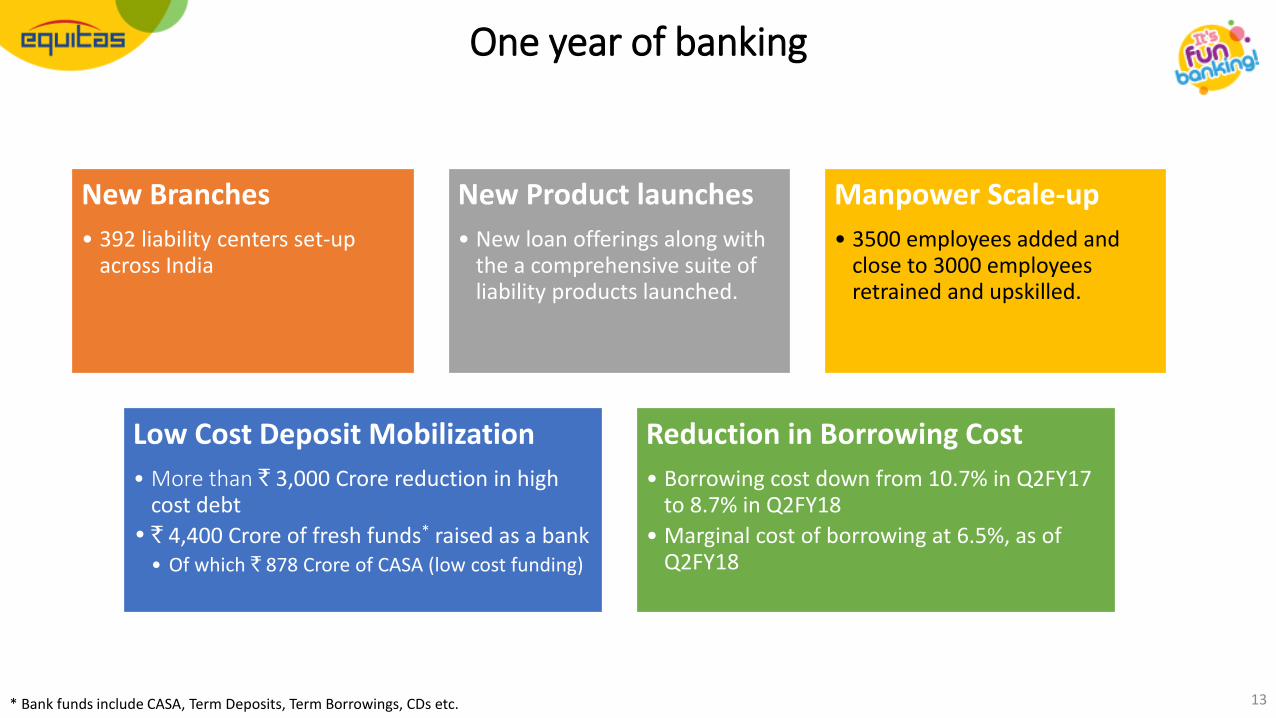
One year of banking
New Branches
• 392 liability centers set-up across India
New Product launches
• New loan offerings along with the a comprehensive suite of liability products launched.
Manpower Scale-up
• 3500 employees added and close to 3000 employees retrained and upskilled.
Low Cost Deposit Mobilization
• More than ` 3,000 Crore reduction in high cost debt
• ` 4,400 Crore of fresh funds* raised as a bank• Of which ` 878 Crore of CASA (low cost funding)
Reduction in Borrowing Cost
• Borrowing cost down from 10.7% in Q2FY17 to 8.7% in Q2FY18
• Marginal cost of borrowing at 6.5%, as of Q2FY18
* Bank funds include CASA, Term Deposits, Term Borrowings, CDs etc. 13
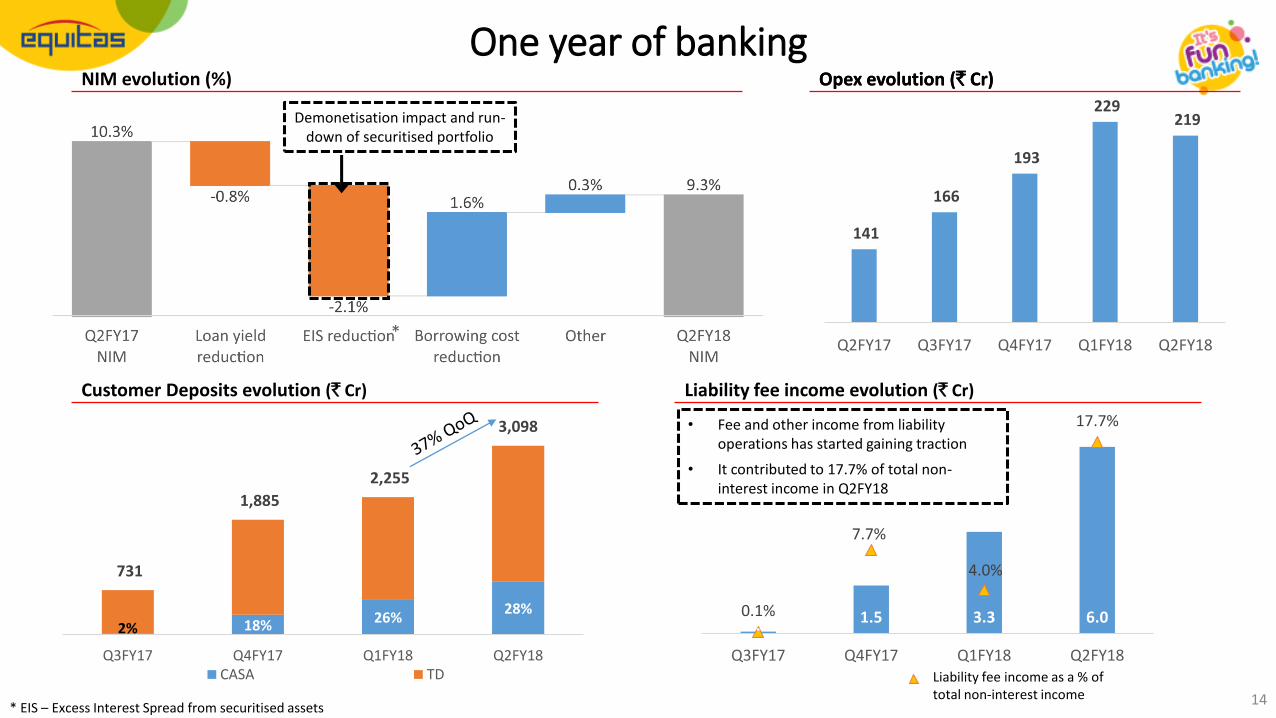
One year of bankingNIM evolution (%)
Liability fee income evolution (` Cr)
0.0 1.5 3.3 6.00.1%
7.7%
4.0%
17.7%
0%
5%
10%
15%
20%
0
1
2
3
4
5
6
7
Q3FY17 Q4FY17 Q1FY18 Q2FY18
Series2
Customer Deposits evolution (` Cr)
2% 18% 26%28%
731
1,885
2,255
3,098
Q3FY17 Q4FY17 Q1FY18 Q2FY18CASA TD
Opex evolution (` Cr)
• Fee and other income from liability operations has started gaining traction
• It contributed to 17.7% of total non-interest income in Q2FY18
Liability fee income as a % of total non-interest income
Demonetisation impact and run-down of securitised portfolio
*
* EIS – Excess Interest Spread from securitised assets14
Opex evolution (` Cr)
141
166
193
229 219
Q2FY17 Q3FY17 Q4FY17 Q1FY18 Q2FY18
15
Advances – Asset Remix and Diversifying Credit Offering
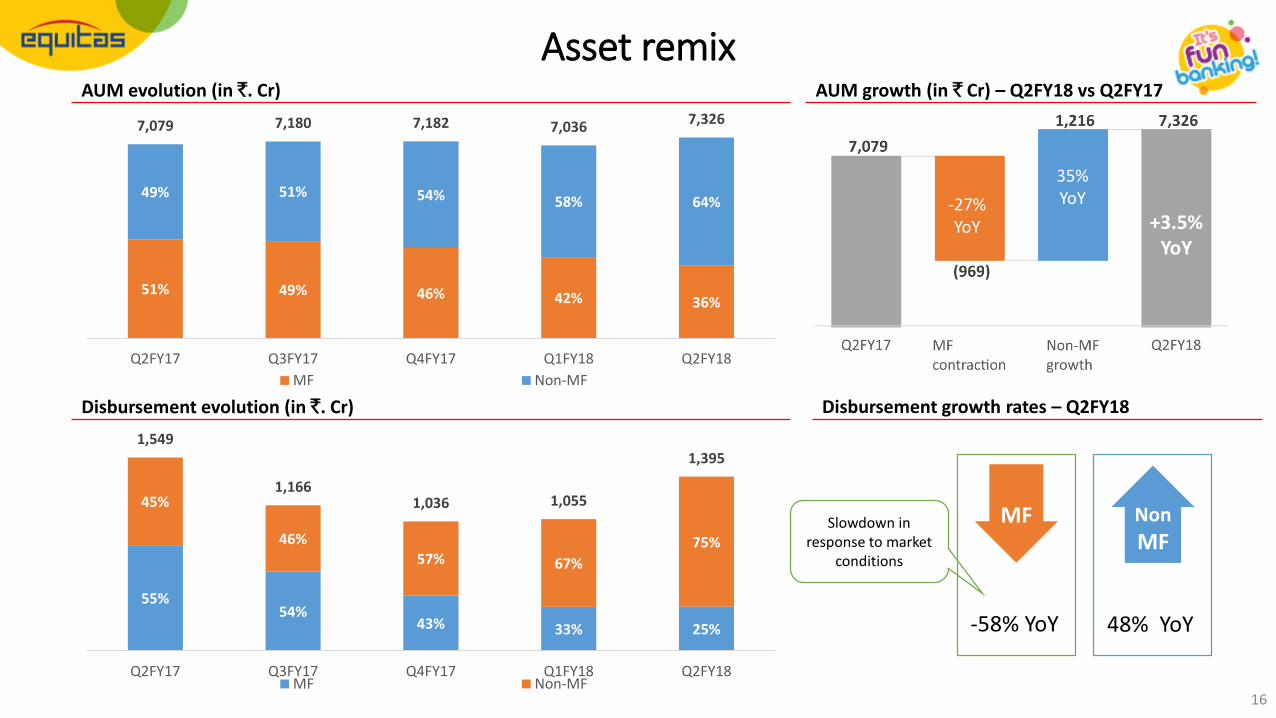
Slowdown in response to market
conditions
16
Asset remixAUM evolution (in `. Cr)
Disbursement evolution (in `. Cr)
AUM growth (in ` Cr) – Q2FY18 vs Q2FY17
Disbursement growth rates – Q2FY18
Non
MFMF
-58% YoY 48% YoY
+3.5% YoY
-27% YoY
35% YoY
51% 49% 46% 42% 36%
49% 51% 54% 58% 64%
7,079 7,180 7,182 7,036 7,326
Q2FY17 Q3FY17 Q4FY17 Q1FY18 Q2FY18
MF Non-MF
55%54%
43% 33% 25%
45%
46%
57% 67%
75%
1,549
1,1661,036 1,055
1,395
Q2FY17 Q3FY17 Q4FY17 Q1FY18 Q2FY18MF Non-MF
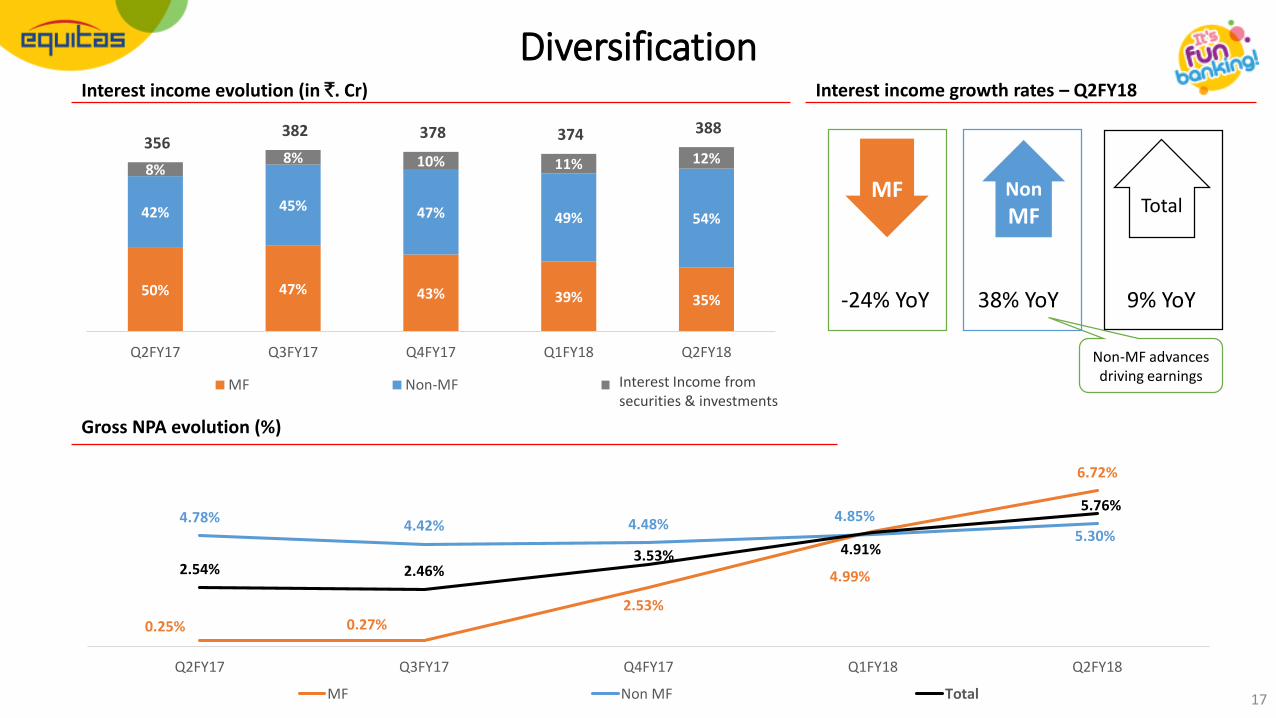
50% 47% 43% 39% 35%
42% 45% 47% 49% 54%
8%8% 10% 11% 12%
356 382 378 374 388
Q2FY17 Q3FY17 Q4FY17 Q1FY18 Q2FY18
MF Non-MF Other
Non-MF advances driving earnings
17
Interest income evolution (in `. Cr) Interest income growth rates – Q2FY18
Non
MFMF
Total
-24% YoY 38% YoY 9% YoY
Gross NPA evolution (%)
Diversification
Interest Income from securities & investments
0.25% 0.27%2.53%
4.99%
6.72%
4.78%4.42% 4.48%
4.85%5.30%
2.54% 2.46%3.53% 4.91%
5.76%
Q2FY17 Q3FY17 Q4FY17 Q1FY18 Q2FY18
MF Non MF Total
18
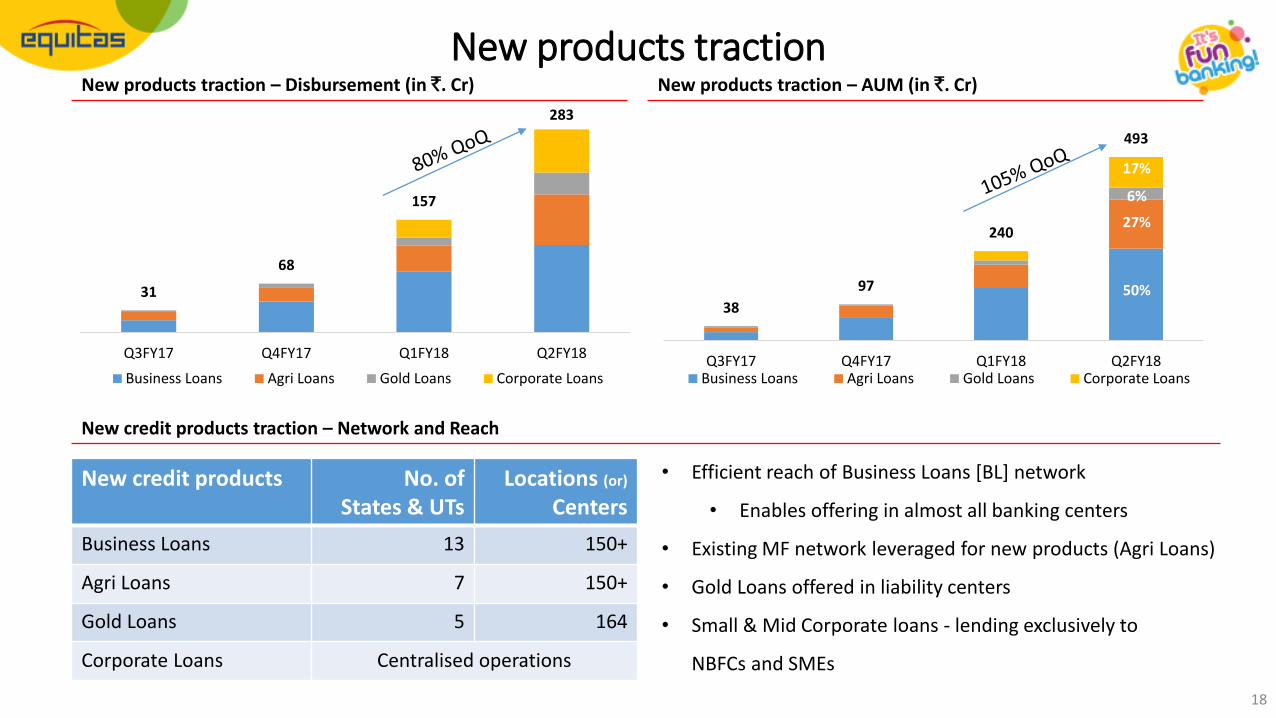
New credit products traction – Network and Reach
New products traction – Disbursement (in `. Cr)
New products traction
New credit products No. of States & UTs
Locations (or)
Centers
Business Loans 13 150+
Agri Loans 7 150+
Gold Loans 5 164
Corporate Loans Centralised operations
• Efficient reach of Business Loans [BL] network
• Enables offering in almost all banking centers
• Existing MF network leveraged for new products (Agri Loans)
• Gold Loans offered in liability centers
• Small & Mid Corporate loans - lending exclusively to
NBFCs and SMEs
31
68
157
283
Q3FY17 Q4FY17 Q1FY18 Q2FY18
Business Loans Agri Loans Gold Loans Corporate Loans
38
97
240
493
Q3FY17 Q4FY17 Q1FY18 Q2FY18Business Loans Agri Loans Gold Loans Corporate Loans
50%
27%
6%
17%
New products traction – AUM (in `. Cr)

Business update for Q2FY18
Micro Finance : 36%
Vehicle Finance : 28%
M-LAP : 25%
Housing Finance :4%
Business Loans : 3.4%
Agri loans :1.8%
Gold loans :0.4%
Corporate :1.1%
Portfolio Mix
Advances – Business update
• Micro Finance collection efficiency in the states of Maharashtra and
MP have shown signs of improvement
• Improvement in Center Meeting attendance
• Key locations have been identified to drive special focus on Agri loans
• New LCV financing, which was introduced in Q1FY18, is gaining
traction
• Current Account and Savings Account products rolled-out for
asset customers (Inclusive banking customers)
` 2,645 Cr
` 2,075 Cr
` 1,789 Cr
` 304 Cr
` 247 Cr
` 132 Cr
` 32 Cr
` 82 Cr
Other – 0.3% ` 20 Cr 19
20
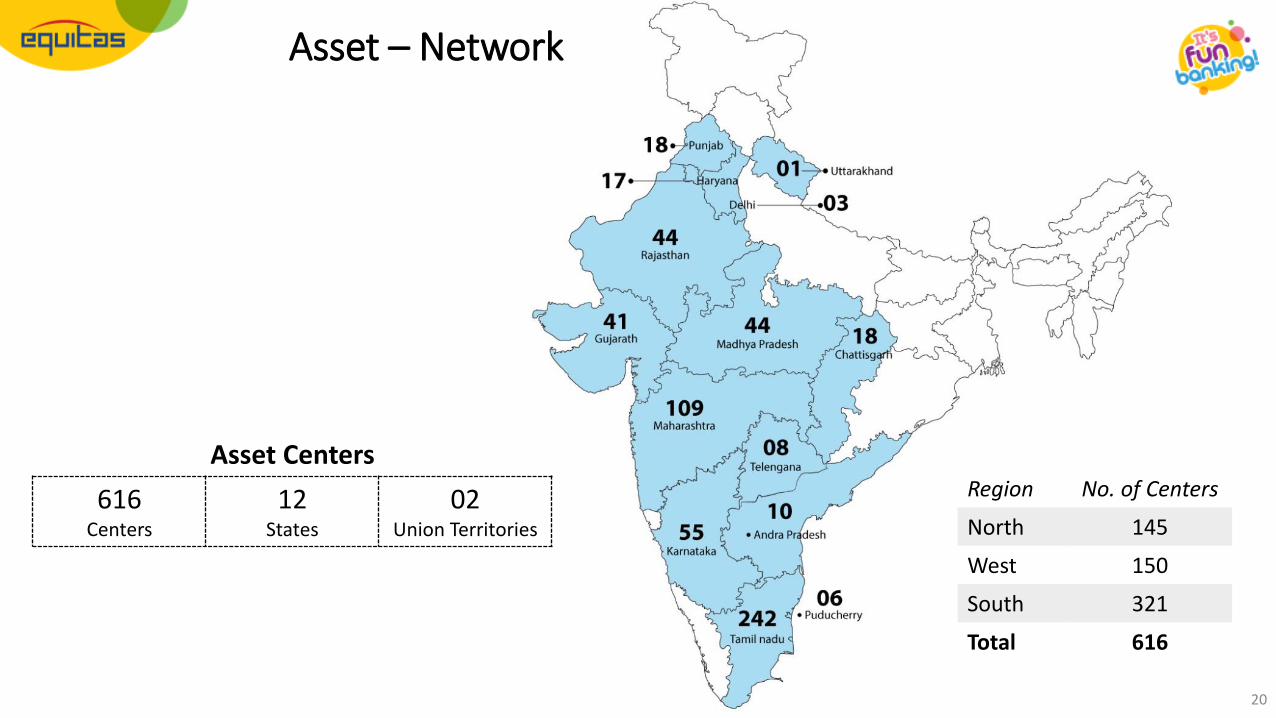
Asset – Network
Asset Centers
616Centers
12States
02Union Territories
Region No. of Centers
North 145
West 150
South 321
Total 616
21
Liability – Products and Franchise Roll-out
22
as of 30 Sept 2017CA
[Current Account]SA
[Savings Account]CASA
[Low cost deposits]TD
[Term Deposits]CASA+TD
Total Deposits
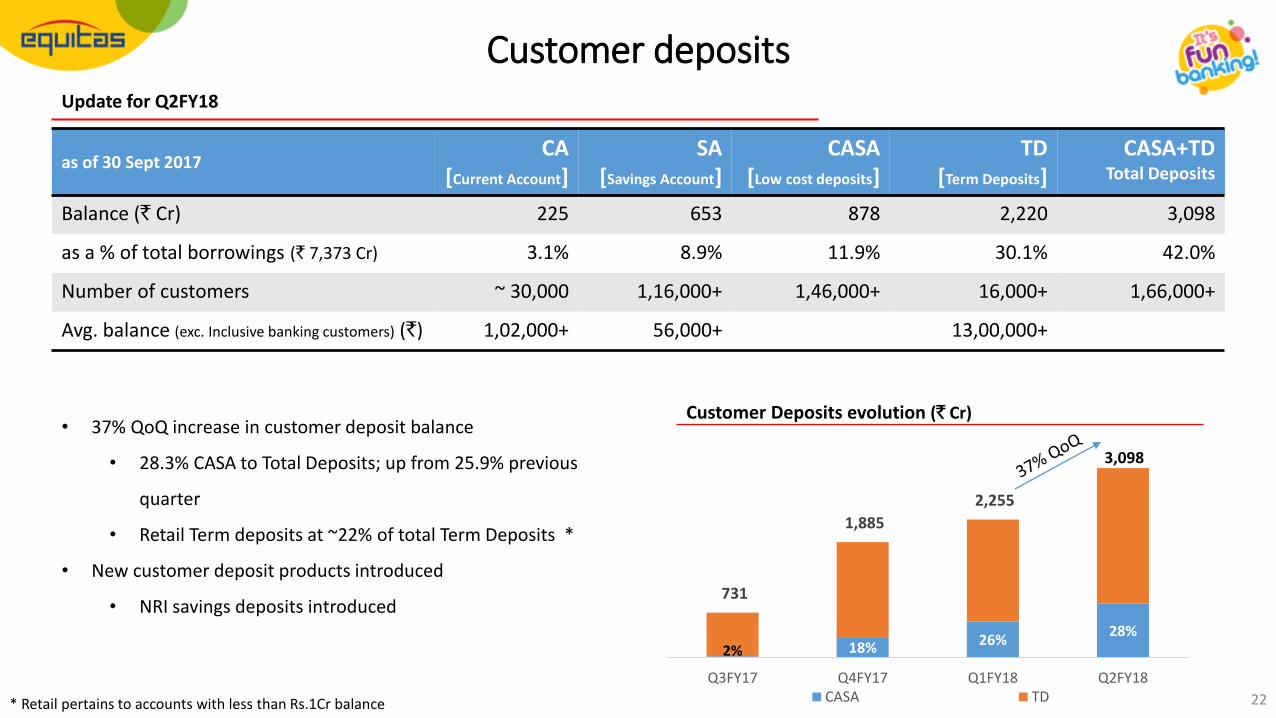
Balance (` Cr) 225 653 878 2,220 3,098
as a % of total borrowings (` 7,373 Cr) 3.1% 8.9% 11.9% 30.1% 42.0%
Number of customers ~ 30,000 1,16,000+ 1,46,000+ 16,000+ 1,66,000+
Avg. balance (exc. Inclusive banking customers) (`) 1,02,000+ 56,000+ 13,00,000+
* Retail pertains to accounts with less than Rs.1Cr balance
Customer depositsUpdate for Q2FY18
• 37% QoQ increase in customer deposit balance
• 28.3% CASA to Total Deposits; up from 25.9% previous
quarter
• Retail Term deposits at ~22% of total Term Deposits *
• New customer deposit products introduced
• NRI savings deposits introduced
Customer Deposits evolution (` Cr)
2% 18% 26%28%
731
1,885
2,255
Q3FY17 Q4FY17 Q1FY18 Q2FY18CASA TD
3,098
23
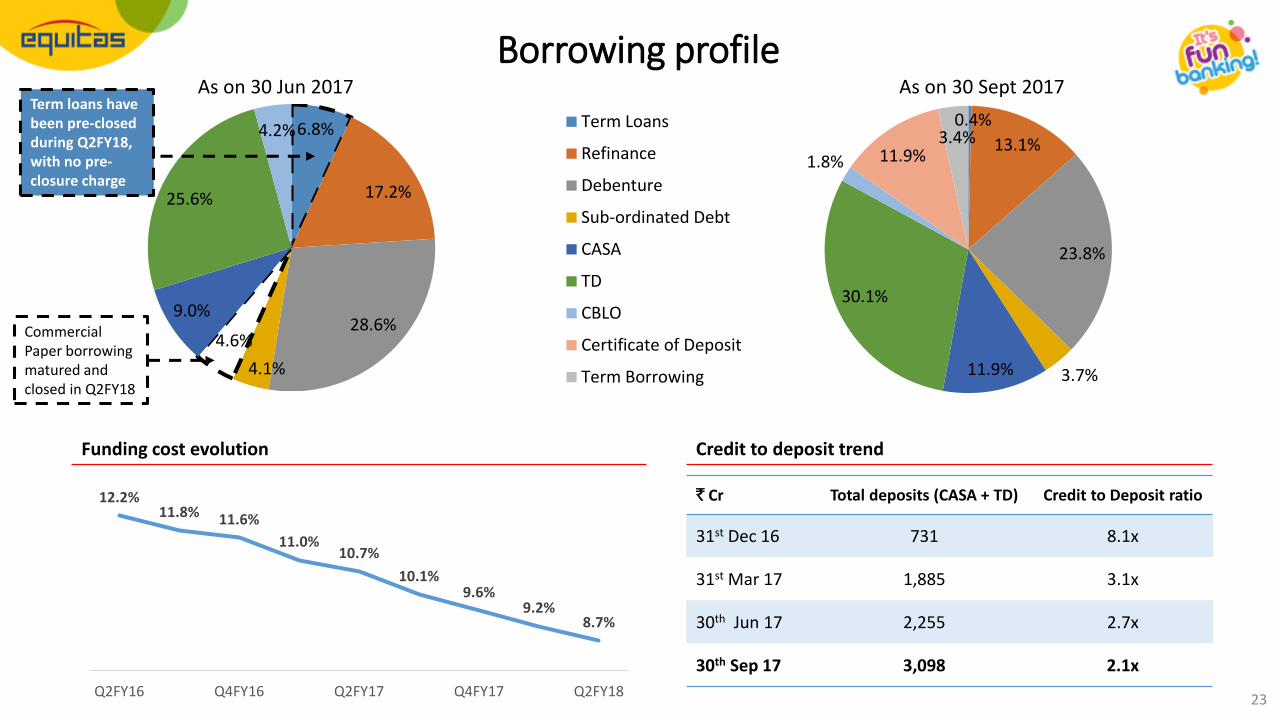
As on 30 Jun 2017 As on 30 Sept 2017
Funding cost evolution Credit to deposit trend
` Cr Total deposits (CASA + TD) Credit to Deposit ratio
31st Dec 16 731 8.1x
31st Mar 17 1,885 3.1x
30th Jun 17 2,255 2.7x
30th Sep 17 3,098 2.1x
6.8%
17.2%
28.6%
4.1%
4.6%
9.0%
25.6%
4.2%
Borrowing profile
0.4%
13.1%
23.8%
3.7%11.9%
30.1%
1.8% 11.9%3.4%
Term Loans
Refinance
Debenture
Sub-ordinated Debt
CASA
TD
CBLO
Certificate of Deposit
Term Borrowing
Commercial Paper borrowing matured and closed in Q2FY18
12.2%11.8% 11.6%
11.0%10.7%
10.1%9.6%
9.2%8.7%
Q2FY16 Q4FY16 Q2FY17 Q4FY17 Q2FY18
Term loans have been pre-closed during Q2FY18, with no pre-closure charge
24
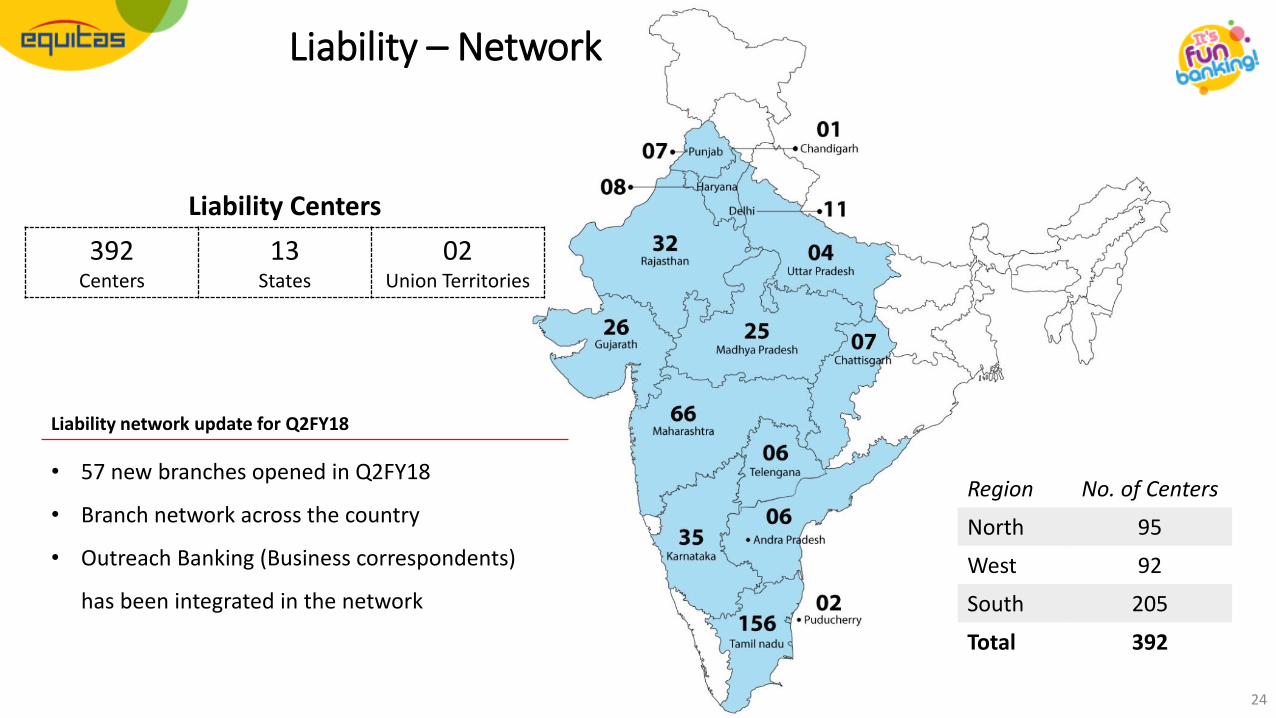
Liability – Network
Liability Centers
392Centers
13States
02Union Territories
Region No. of Centers
North 95
West 92
South 205
Total 392
• 57 new branches opened in Q2FY18
• Branch network across the country
• Outreach Banking (Business correspondents)
has been integrated in the network
Liability network update for Q2FY18
25
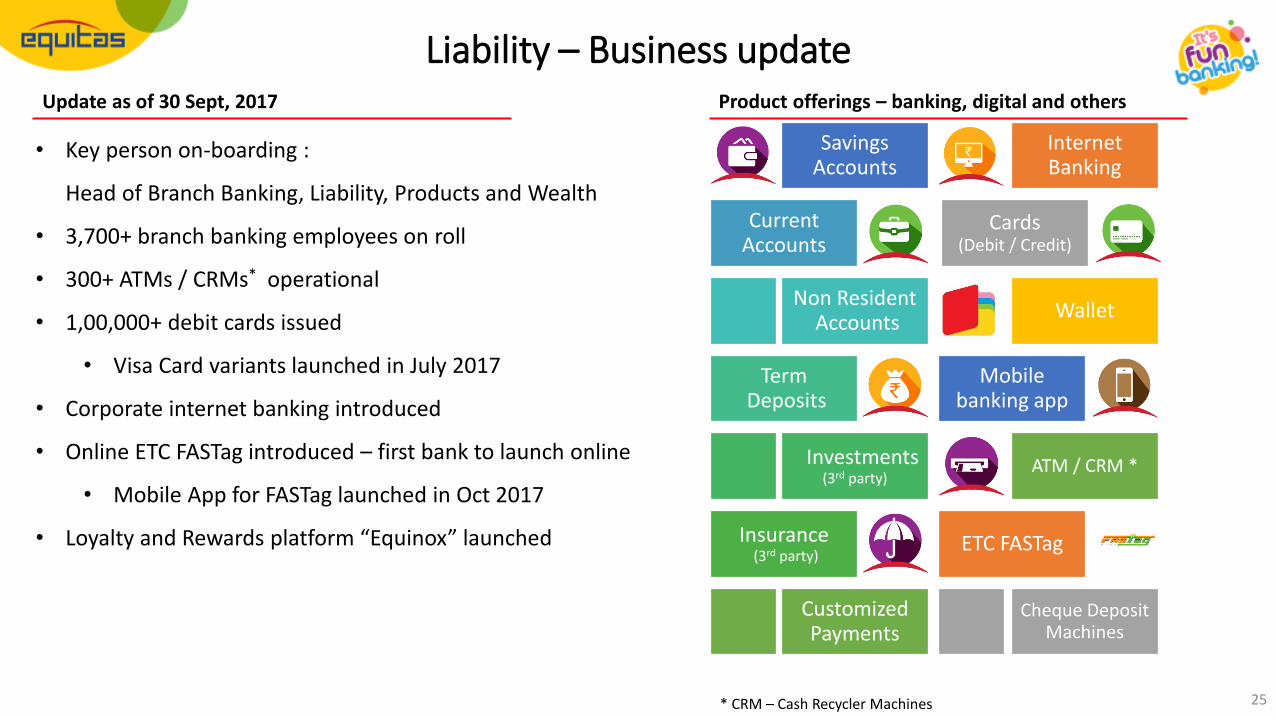
Update as of 30 Sept, 2017 Product offerings – banking, digital and others
Savings Accounts
Current Accounts
Non ResidentAccounts
TermDeposits
Investments (3rd party)
Insurance(3rd party)
Customized Payments
InternetBanking
Cards(Debit / Credit)
Wallet
Mobile banking app
ATM / CRM *
ETC FASTag
Cheque Deposit Machines
• Key person on-boarding :
Head of Branch Banking, Liability, Products and Wealth
• 3,700+ branch banking employees on roll
• 300+ ATMs / CRMs* operational
• 1,00,000+ debit cards issued
• Visa Card variants launched in July 2017
• Corporate internet banking introduced
• Online ETC FASTag introduced – first bank to launch online
• Mobile App for FASTag launched in Oct 2017
• Loyalty and Rewards platform “Equinox” launched
Liability – Business update
* CRM – Cash Recycler Machines
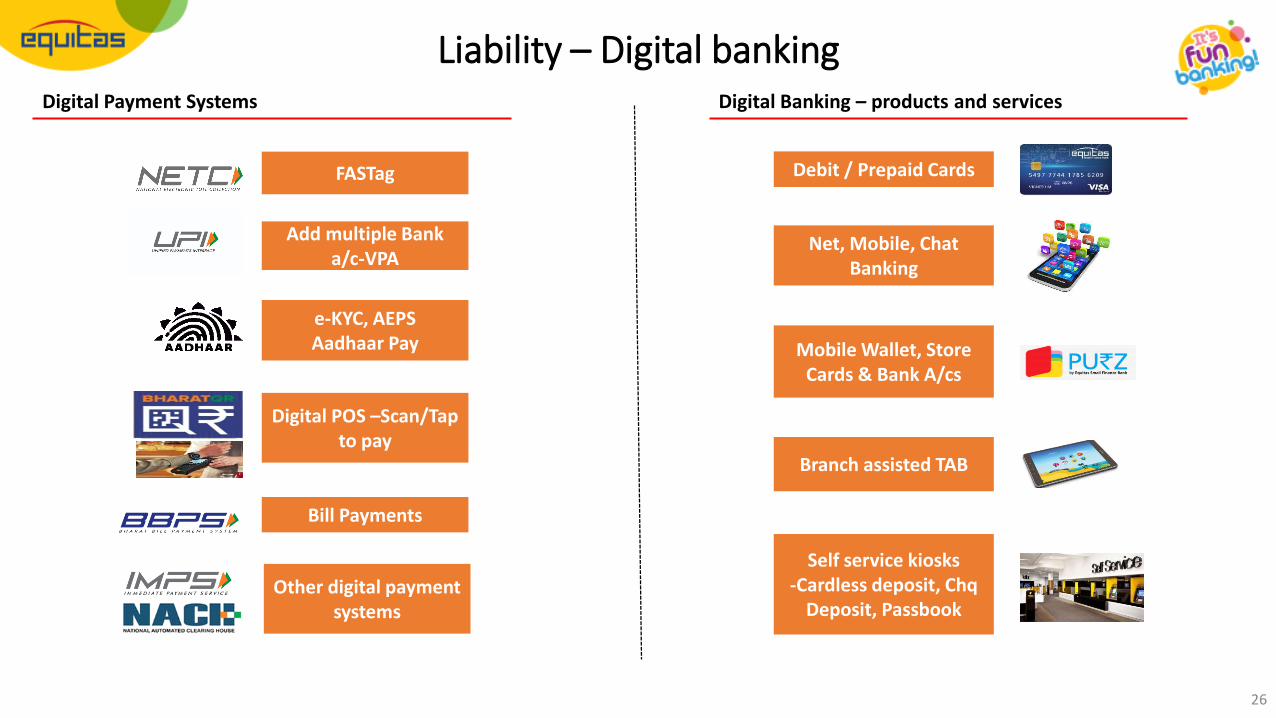
e-KYC, AEPSAadhaar Pay
Digital POS –Scan/Tap to pay
Mobile Wallet, Store Cards & Bank A/cs
Self service kiosks-Cardless deposit, Chq
Deposit, Passbook
FASTag
Add multiple Bank a/c-VPA
Debit / Prepaid Cards
Bill Payments
Other digital payment systems
Branch assisted TAB
Net, Mobile, Chat Banking
Liability – Digital bankingDigital Payment Systems Digital Banking – products and services
26
Asset quality
27
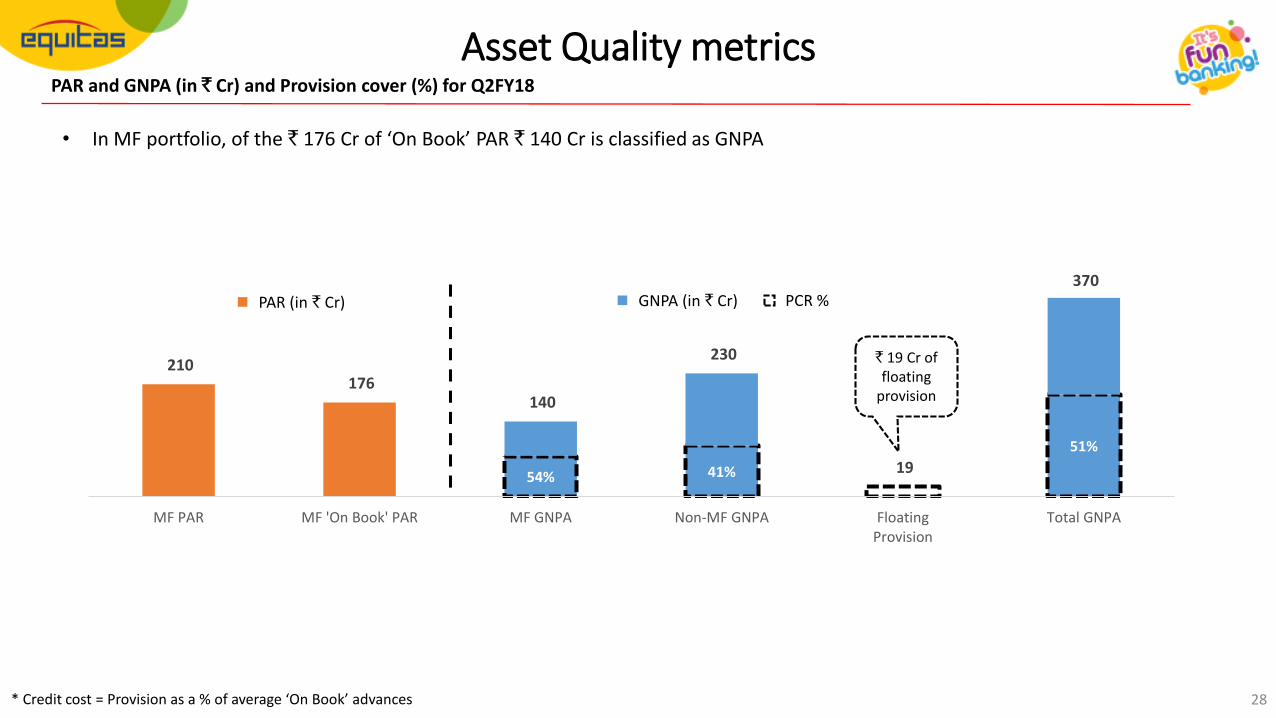
54% 41%
51%
210 176
140
230
19
370
MF PAR MF 'On Book' PAR MF GNPA Non-MF GNPA FloatingProvision
Total GNPA
28
PAR and GNPA (in ` Cr) and Provision cover (%) for Q2FY18
Asset Quality metrics
PAR (in ` Cr) GNPA (in ` Cr) PCR %
` 19 Cr of floating
provision
• In MF portfolio, of the ` 176 Cr of ‘On Book’ PAR ` 140 Cr is classified as GNPA
* Credit cost = Provision as a % of average ‘On Book’ advances

Consolidated Financial Overview
29
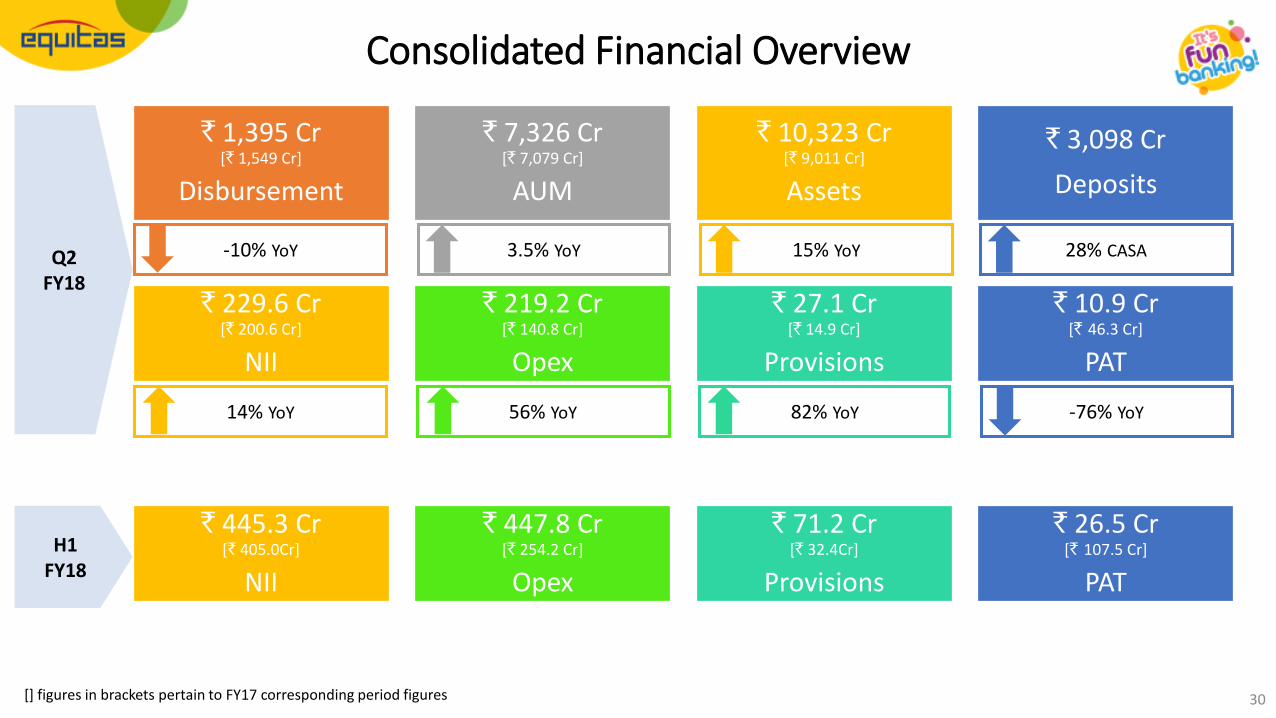
Consolidated Financial Overview
30
` 1,395 Cr [` 1,549 Cr]
Disbursement
` 7,326 Cr[` 7,079 Cr]
AUM
` 10,323 Cr[` 9,011 Cr]
Assets
` 3,098 Cr
Deposits
` 229.6 Cr[` 200.6 Cr]
NII
` 219.2 Cr[` 140.8 Cr]
Opex
` 27.1 Cr[` 14.9 Cr]
Provisions
` 10.9 Cr[` 46.3 Cr]
PAT
3.5% YoY 15% YoY 28% CASA
82% YoY -76% YoY
-10% YoY
14% YoY 56% YoY
Q2 FY18
[] figures in brackets pertain to FY17 corresponding period figures
` 445.3 Cr[` 405.0Cr]
NII
` 447.8 Cr[` 254.2 Cr]
Opex
` 71.2 Cr[` 32.4Cr]
Provisions
` 26.5 Cr[` 107.5 Cr]
PAT
H1 FY18
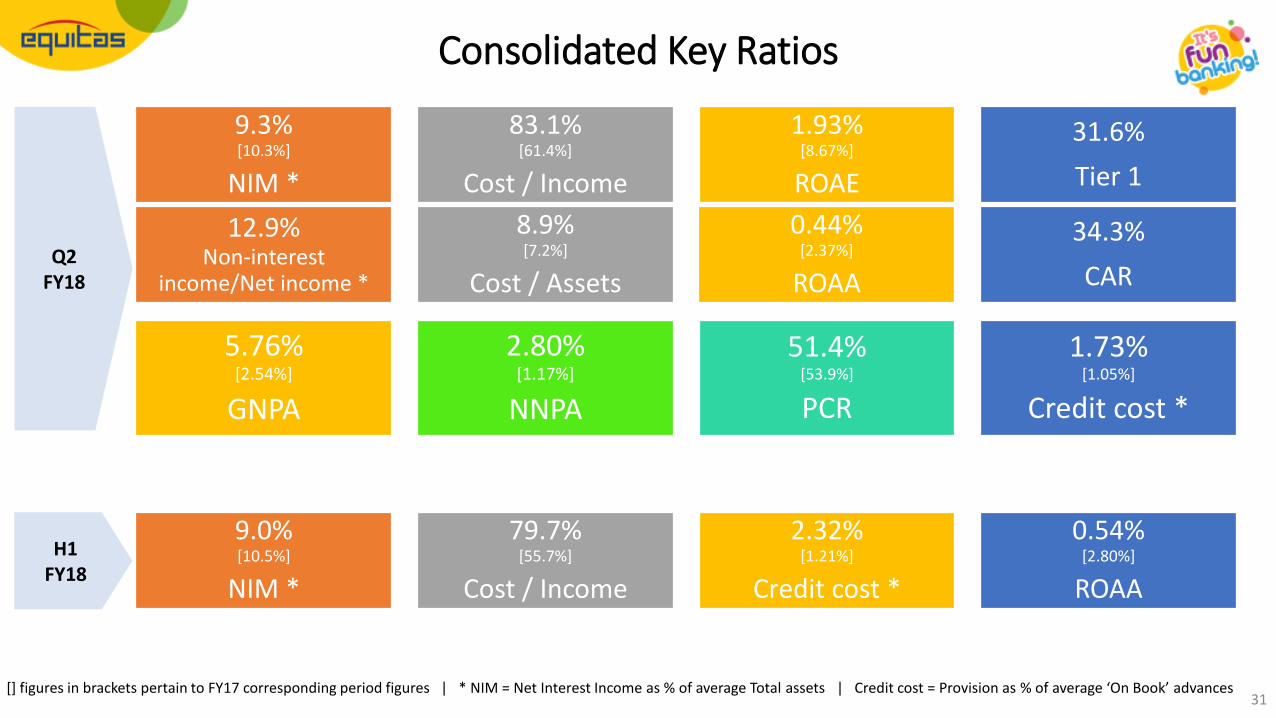
31
9.3% [10.3%]
NIM *
83.1%[61.4%]
Cost / Income
1.93%[8.67%]
ROAE
31.6%
Tier 1
5.76%[2.54%]
GNPA
2.80%[1.17%]
NNPA
51.4%[53.9%]
PCR
1.73%[1.05%]
Credit cost *
12.9%Non-interest
income/Net income *
8.9%[7.2%]
Cost / Assets
0.44%[2.37%]
ROAA
34.3%
CAR
Consolidated Key Ratios
Q2FY18
[] figures in brackets pertain to FY17 corresponding period figures | * NIM = Net Interest Income as % of average Total assets | Credit cost = Provision as % of average ‘On Book’ advances
9.0% [10.5%]
NIM *
79.7%[55.7%]
Cost / Income
2.32%[1.21%]
Credit cost *
0.54%[2.80%]
ROAA
H1FY18
32
Consolidated Financial Performance
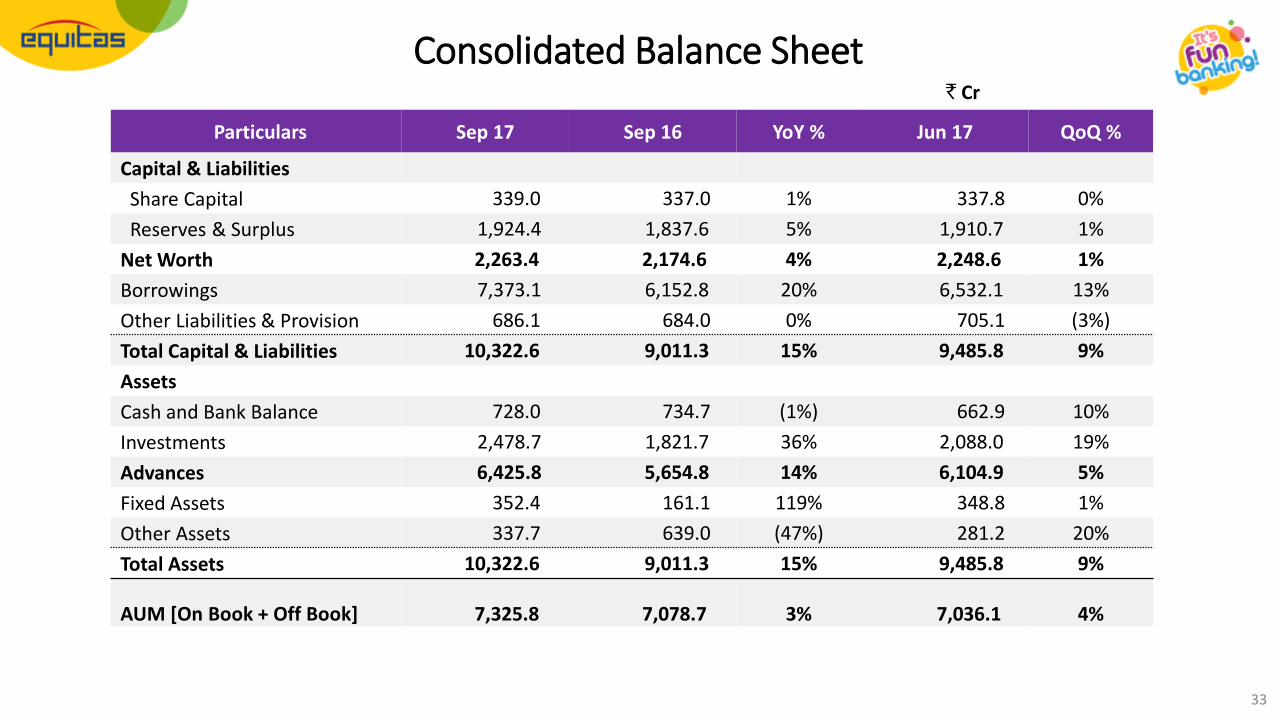
Particulars Sep 17 Sep 16 YoY % Jun 17 QoQ %
Capital & Liabilities
Share Capital 339.0 337.0 1% 337.8 0%
Reserves & Surplus 1,924.4 1,837.6 5% 1,910.7 1%
Net Worth 2,263.4 2,174.6 4% 2,248.6 1%
Borrowings 7,373.1 6,152.8 20% 6,532.1 13%
Other Liabilities & Provision 686.1 684.0 0% 705.1 (3%)
Total Capital & Liabilities 10,322.6 9,011.3 15% 9,485.8 9%
Assets
Cash and Bank Balance 728.0 734.7 (1%) 662.9 10%
Investments 2,478.7 1,821.7 36% 2,088.0 19%
Advances 6,425.8 5,654.8 14% 6,104.9 5%
Fixed Assets 352.4 161.1 119% 348.8 1%
Other Assets 337.7 639.0 (47%) 281.2 20%
Total Assets 10,322.6 9,011.3 15% 9,485.8 9%
AUM [On Book + Off Book] 7,325.8 7,078.7 3% 7,036.1 4%
33
Consolidated Balance Sheet` Cr
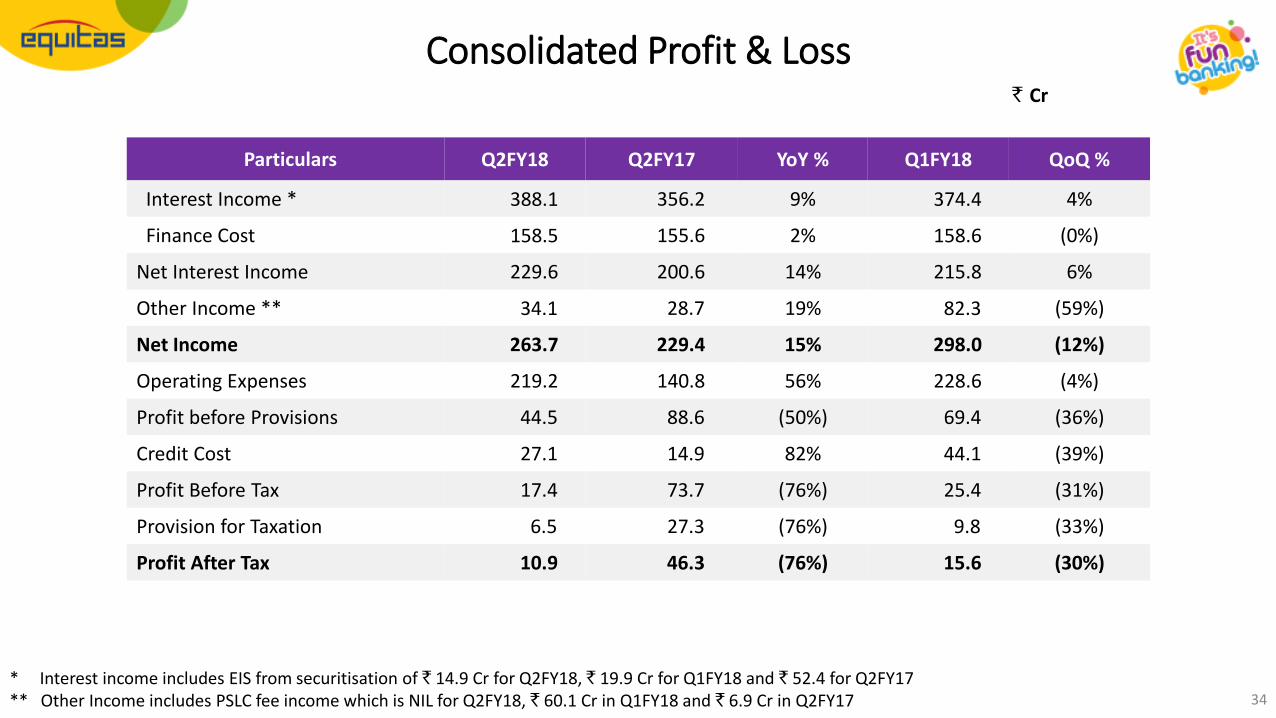
34
Particulars Q2FY18 Q2FY17 YoY % Q1FY18 QoQ %
Interest Income * 388.1 356.2 9% 374.4 4%
Finance Cost 158.5 155.6 2% 158.6 (0%)
Net Interest Income 229.6 200.6 14% 215.8 6%
Other Income ** 34.1 28.7 19% 82.3 (59%)
Net Income 263.7 229.4 15% 298.0 (12%)
Operating Expenses 219.2 140.8 56% 228.6 (4%)
Profit before Provisions 44.5 88.6 (50%) 69.4 (36%)
Credit Cost 27.1 14.9 82% 44.1 (39%)
Profit Before Tax 17.4 73.7 (76%) 25.4 (31%)
Provision for Taxation 6.5 27.3 (76%) 9.8 (33%)
Profit After Tax 10.9 46.3 (76%) 15.6 (30%)
Consolidated Profit & Loss` Cr
* Interest income includes EIS from securitisation of ` 14.9 Cr for Q2FY18, ` 19.9 Cr for Q1FY18 and ` 52.4 for Q2FY17** Other Income includes PSLC fee income which is NIL for Q2FY18, ` 60.1 Cr in Q1FY18 and ` 6.9 Cr in Q2FY17
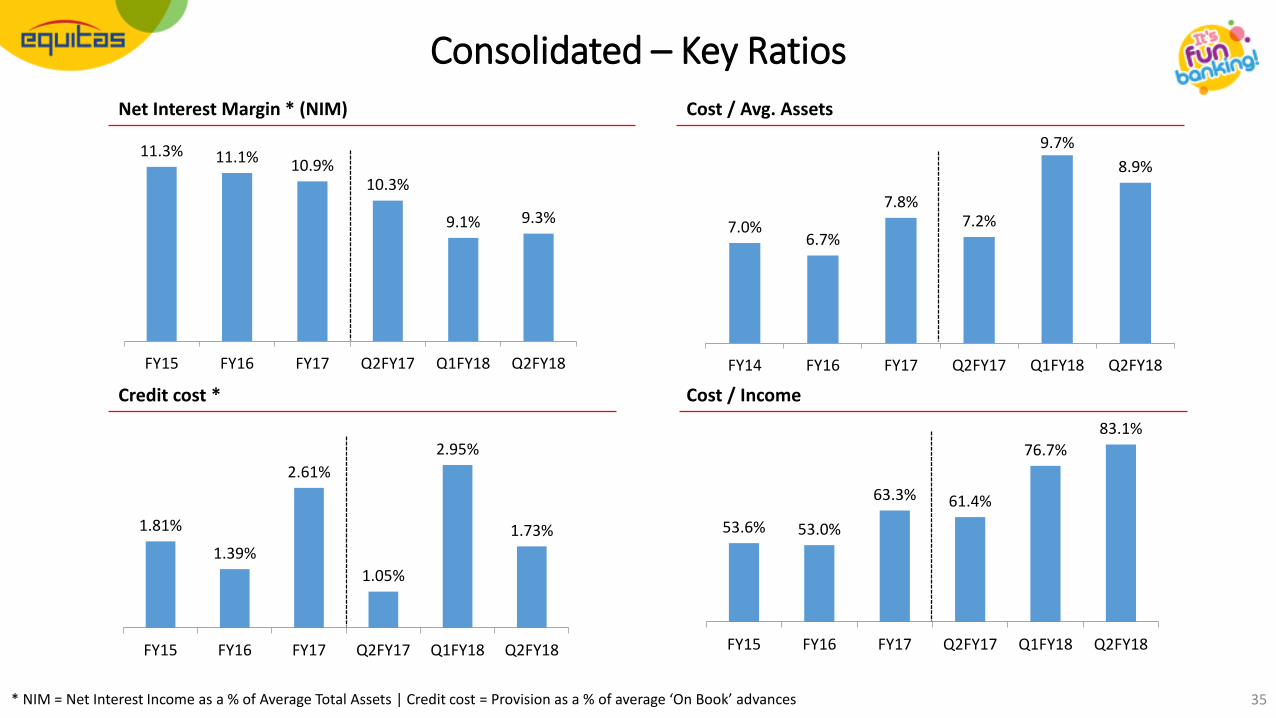
35
Cost / Income
Net Interest Margin * (NIM) Cost / Avg. Assets
Credit cost *
Consolidated – Key Ratios
* NIM = Net Interest Income as a % of Average Total Assets | Credit cost = Provision as a % of average ‘On Book’ advances
11.3% 11.1% 10.9%10.3%
9.1% 9.3%
FY15 FY16 FY17 Q2FY17 Q1FY18 Q2FY18
7.0%6.7%
7.8%7.2%
9.7%
8.9%
FY14 FY16 FY17 Q2FY17 Q1FY18 Q2FY18
1.81%
1.39%
2.61%
1.05%
2.95%
1.73%
FY15 FY16 FY17 Q2FY17 Q1FY18 Q2FY18
53.6% 53.0%
63.3% 61.4%
76.7%83.1%
FY15 FY16 FY17 Q2FY17 Q1FY18 Q2FY18
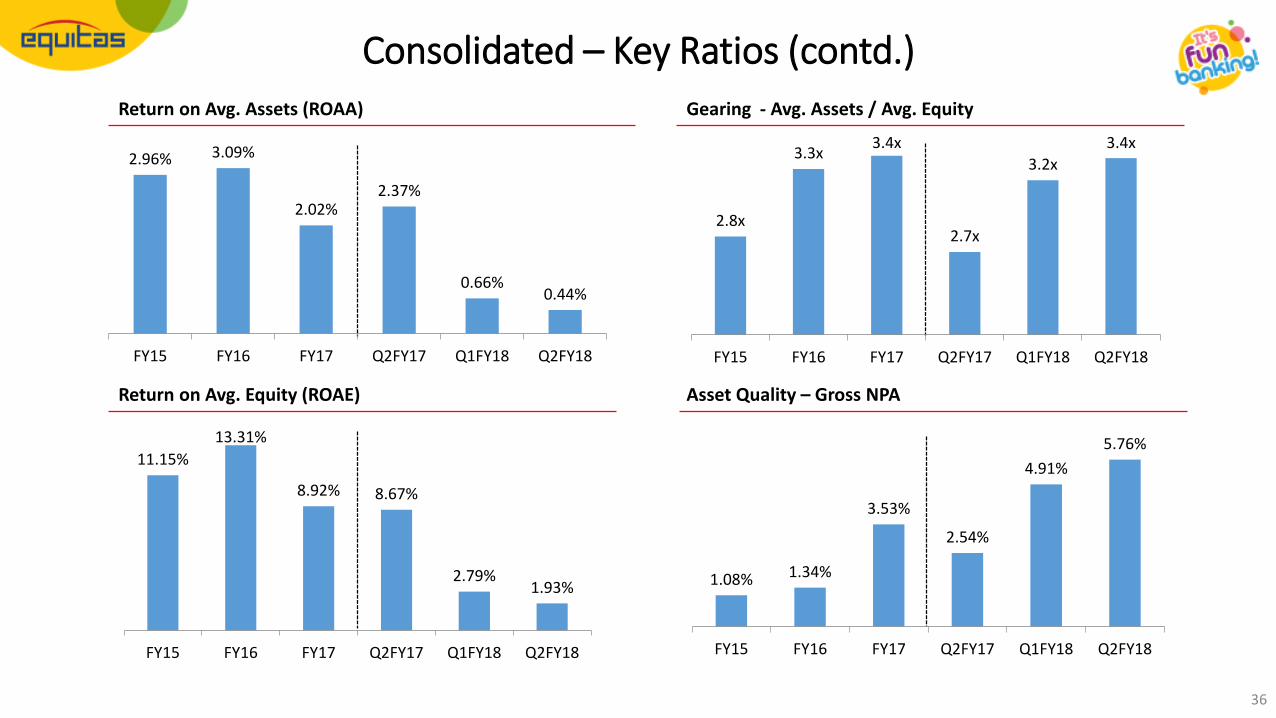
36
Asset Quality – Gross NPA
Return on Avg. Assets (ROAA) Gearing - Avg. Assets / Avg. Equity
Return on Avg. Equity (ROAE)
Consolidated – Key Ratios (contd.)
2.96% 3.09%
2.02%2.37%
0.66%0.44%
FY15 FY16 FY17 Q2FY17 Q1FY18 Q2FY18
2.8x
3.3x3.4x
2.7x
3.2x
3.4x
FY15 FY16 FY17 Q2FY17 Q1FY18 Q2FY18
11.15%
13.31%
8.92% 8.67%
2.79%1.93%
FY15 FY16 FY17 Q2FY17 Q1FY18 Q2FY18
1.08% 1.34%
3.53%
2.54%
4.91%
5.76%
FY15 FY16 FY17 Q2FY17 Q1FY18 Q2FY18
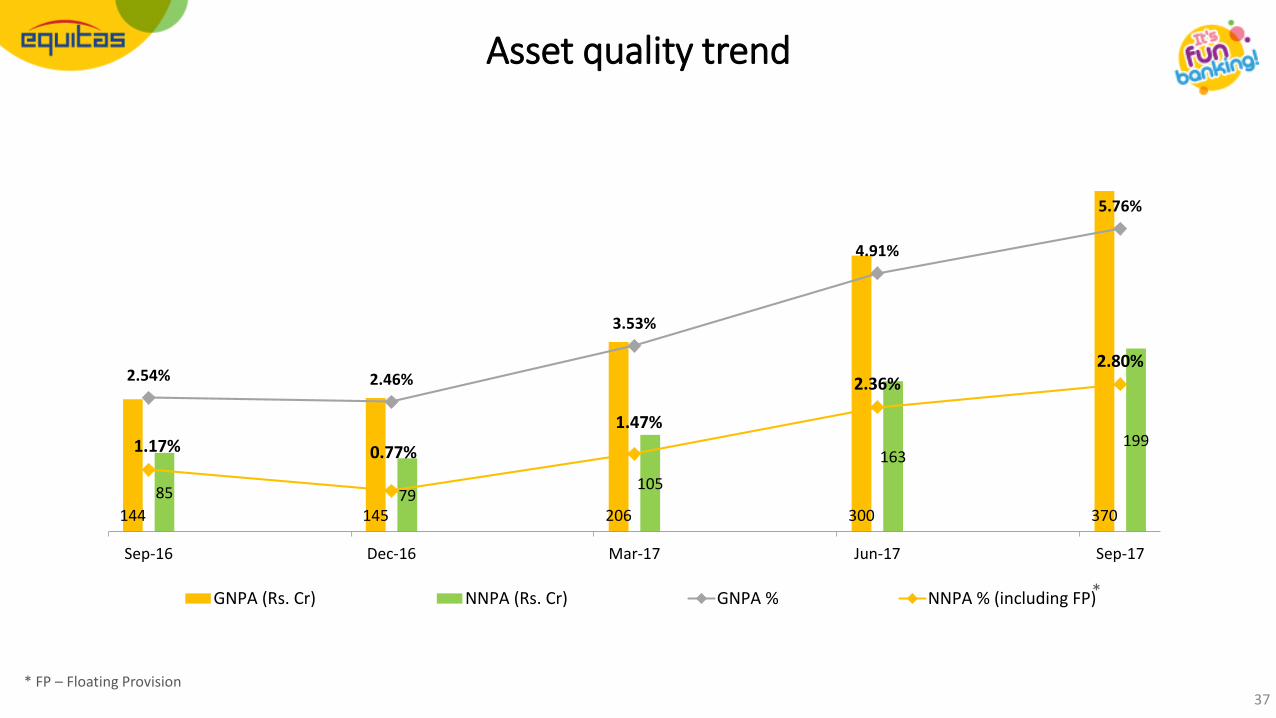
37
Asset quality trend
144 145 206 300 370
85 79105
163199
2.54% 2.46%
3.53%
4.91%
5.76%
1.17% 0.77%
1.47%
2.36%2.80%
0.0%
1.0%
2.0%
3.0%
4.0%
5.0%
6.0%
7.0%
0
50
100
150
200
250
300
350
400
Sep-16 Dec-16 Mar-17 Jun-17 Sep-17
GNPA (Rs. Cr) NNPA (Rs. Cr) GNPA % NNPA % (including FP)*
* FP – Floating Provision
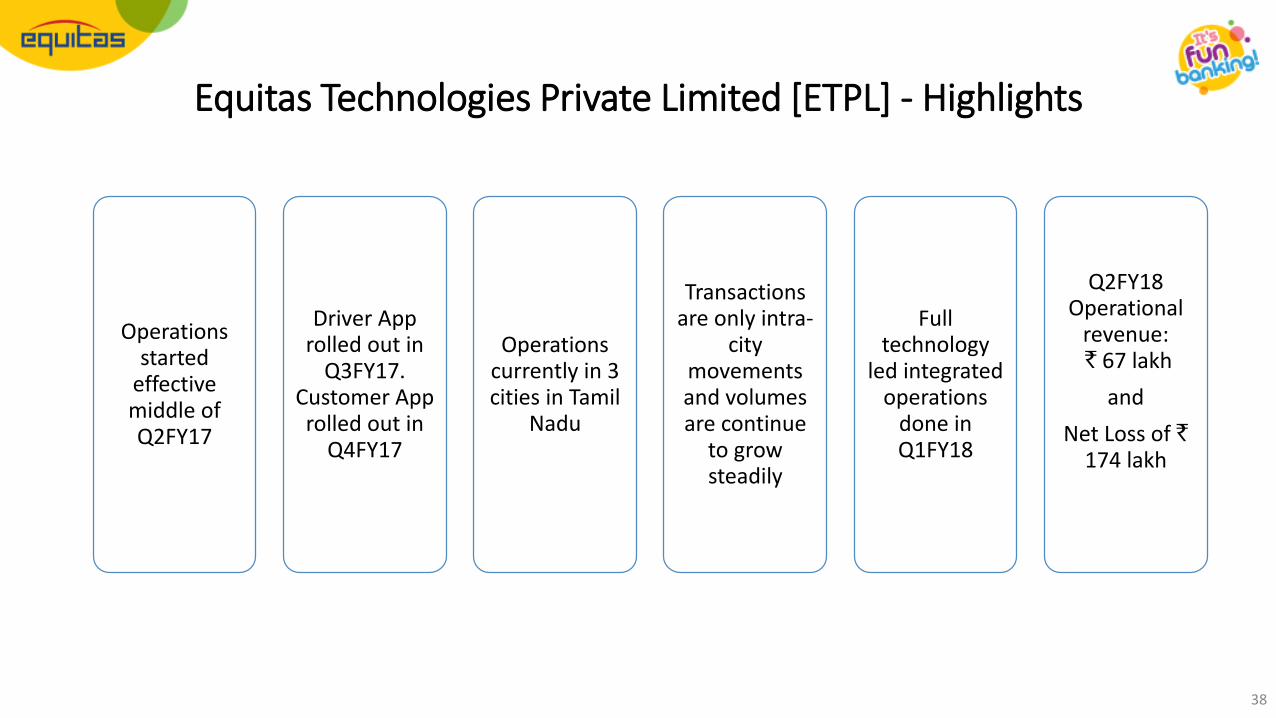
38
Equitas Technologies Private Limited [ETPL] - Highlights
Operations started
effective middle of Q2FY17
Driver App rolled out in
Q3FY17. Customer App rolled out in
Q4FY17
Operations currently in 3 cities in Tamil
Nadu
Transactions are only intra-
city movements and volumes are continue
to grow steadily
Full technology
led integrated operations
done in Q1FY18
Q2FY18 Operational
revenue:` 67 lakh
and
Net Loss of `174 lakh
39
CSR Initiatives – Social impact continues

40
Corporate Social Responsibilities
Medical awareness and preventive healthcare programs
5mn beneficiaries from health and eye care camps
Equitas Birds Nest – Pavement dwellers rehabilitation program
1,200+ families rehabilitated to organized housing
Job fairs for candidates form economically weaker sections
1,00,000+ candidates previously unemployed placed in jobs
7 English-medium board schools
5,600+ children from low-income households enrolled
EDIT – Equitas Development Initiatives Trust
Set up in 2008 and supervised by eminent trustees, Equitas believes social initiatives also enables it to engage better with underbanked communities that it works with
Group CSR PoliciesGroup has a policy to contribute up to 5% of PAT to CSR activities and ` 2,000 per branch per month may be allocated for primary health care and skill development of customers
Skills development program
4,60,000+ people trained on cottage livelihood skills
CSR contribution (` Cr)
1.4
2.83.4
5.5
10.2
FY13 FY14 FY15 FY16 FY17
41
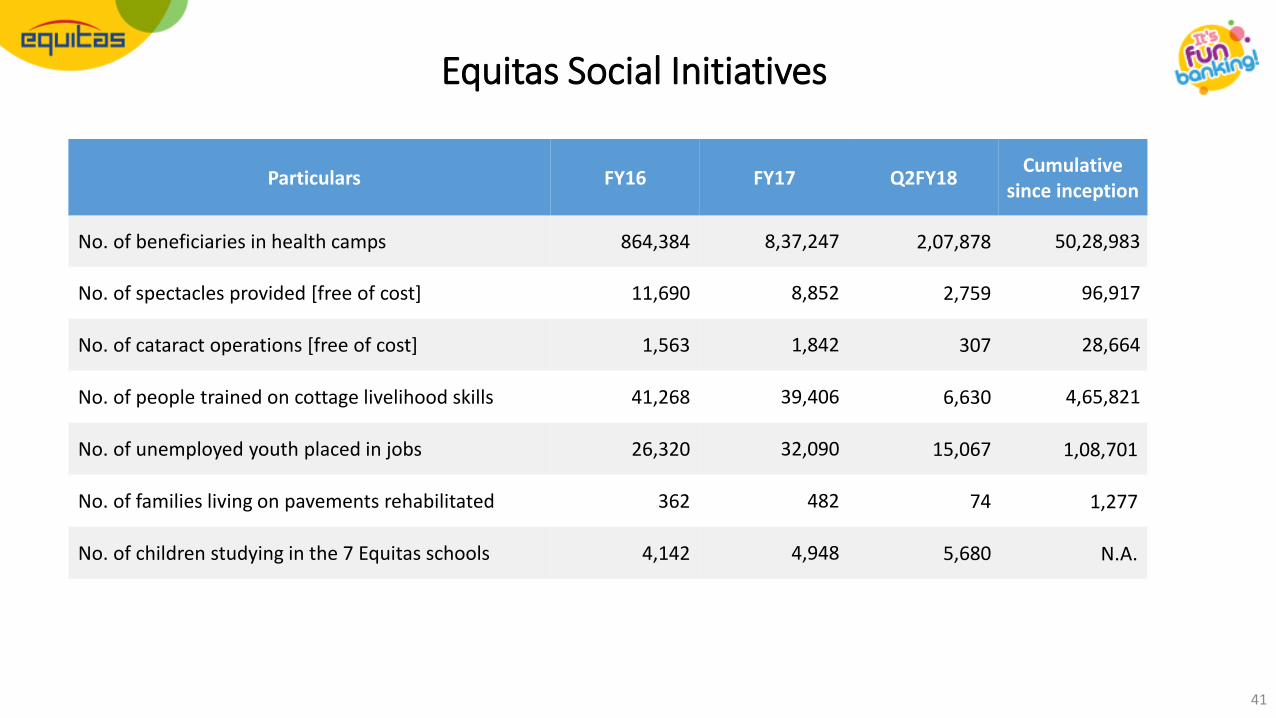
Particulars FY16 FY17 Q2FY18Cumulative
since inception
No. of beneficiaries in health camps 864,384 8,37,247 2,07,878 50,28,983
No. of spectacles provided [free of cost] 11,690 8,852 2,759 96,917
No. of cataract operations [free of cost] 1,563 1,842 307 28,664
No. of people trained on cottage livelihood skills 41,268 39,406 6,630 4,65,821
No. of unemployed youth placed in jobs 26,320 32,090 15,067 1,08,701
No. of families living on pavements rehabilitated 362 482 74 1,277
No. of children studying in the 7 Equitas schools 4,142 4,948 5,680 N.A.
Equitas Social Initiatives
Annexures &General Information
42
43
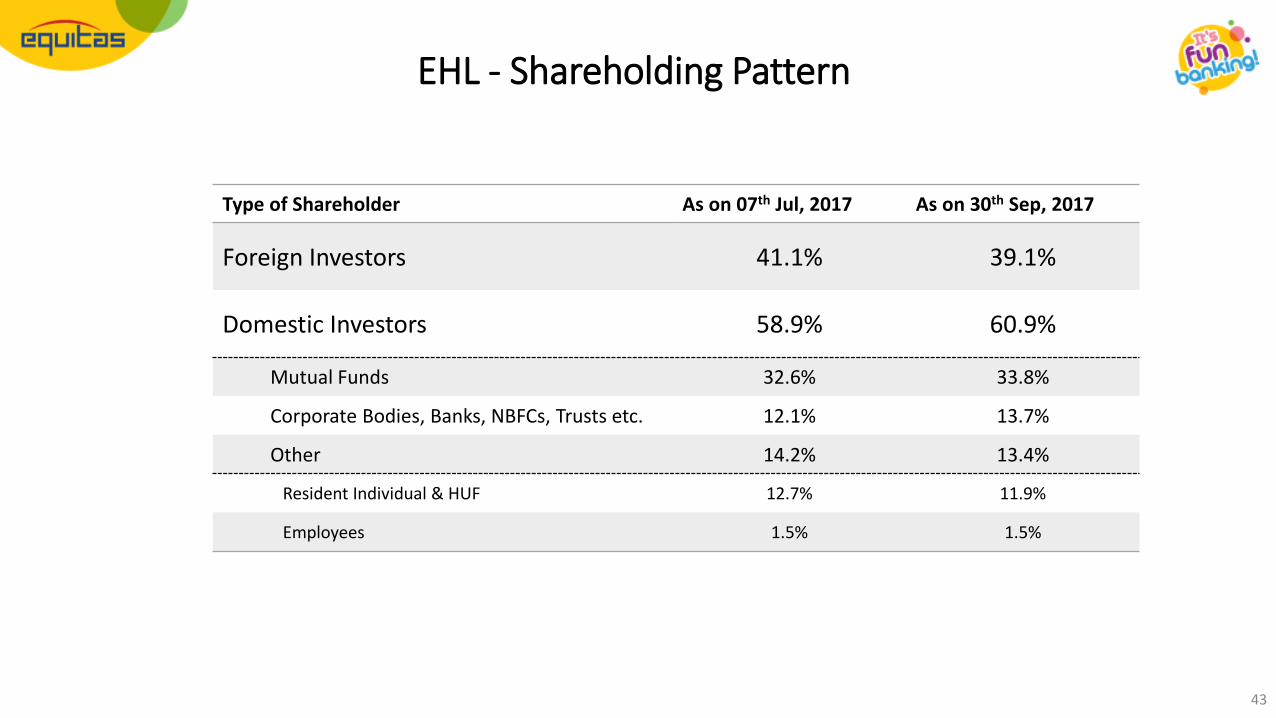
EHL - Shareholding Pattern
Type of Shareholder As on 07th Jul, 2017 As on 30th Sep, 2017
Foreign Investors 41.1% 39.1%
Domestic Investors 58.9% 60.9%
Mutual Funds 32.6% 33.8%
Corporate Bodies, Banks, NBFCs, Trusts etc. 12.1% 13.7%
Other 14.2% 13.4%
Resident Individual & HUF 12.7% 11.9%
Employees 1.5% 1.5%
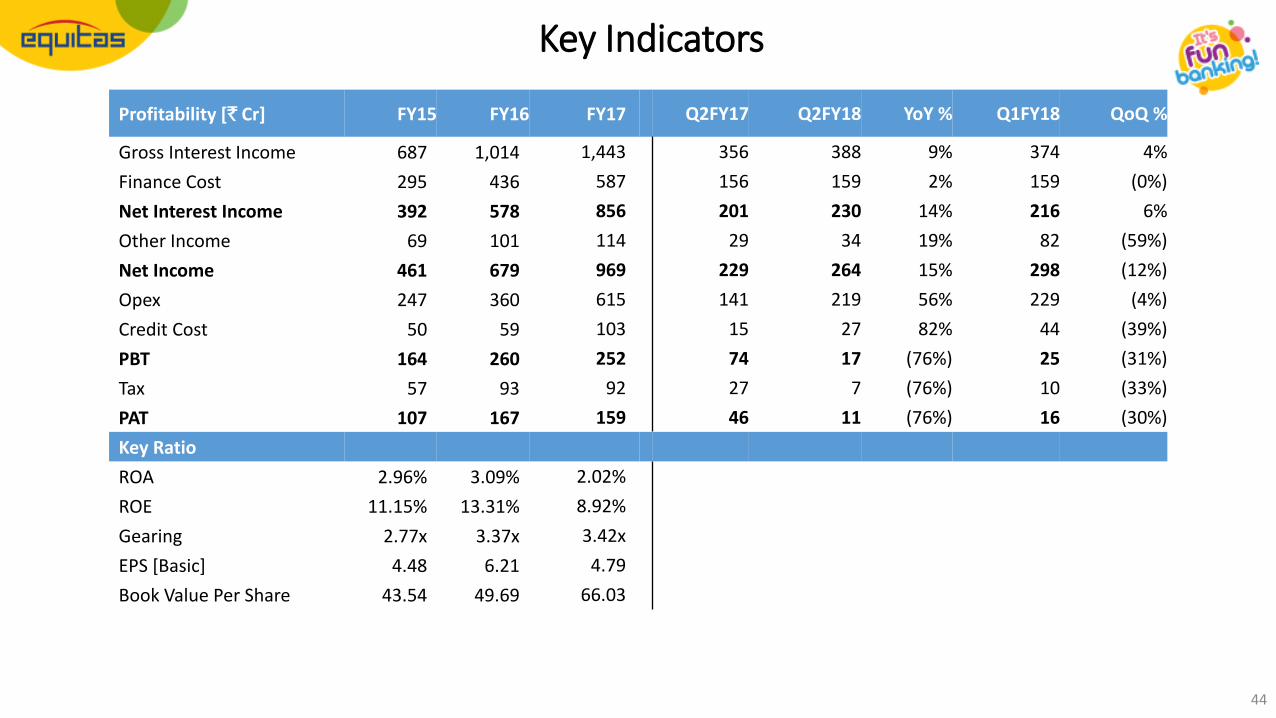
Profitability [` Cr] FY15 FY16 FY17 Q2FY17 Q2FY18 YoY % Q1FY18 QoQ %
Gross Interest Income 687 1,014 1,443 356 388 9% 374 4%
Finance Cost 295 436 587 156 159 2% 159 (0%)
Net Interest Income 392 578 856 201 230 14% 216 6%
Other Income 69 101 114 29 34 19% 82 (59%)
Net Income 461 679 969 229 264 15% 298 (12%)
Opex 247 360 615 141 219 56% 229 (4%)
Credit Cost 50 59 103 15 27 82% 44 (39%)
PBT 164 260 252 74 17 (76%) 25 (31%)
Tax 57 93 92 27 7 (76%) 10 (33%)
PAT 107 167 159 46 11 (76%) 16 (30%)
Key Ratio
ROA 2.96% 3.09% 2.02%
ROE 11.15% 13.31% 8.92%
Gearing 2.77x 3.37x 3.42x
EPS [Basic] 4.48 6.21 4.79
Book Value Per Share 43.54 49.69 66.03
44
Key Indicators
45
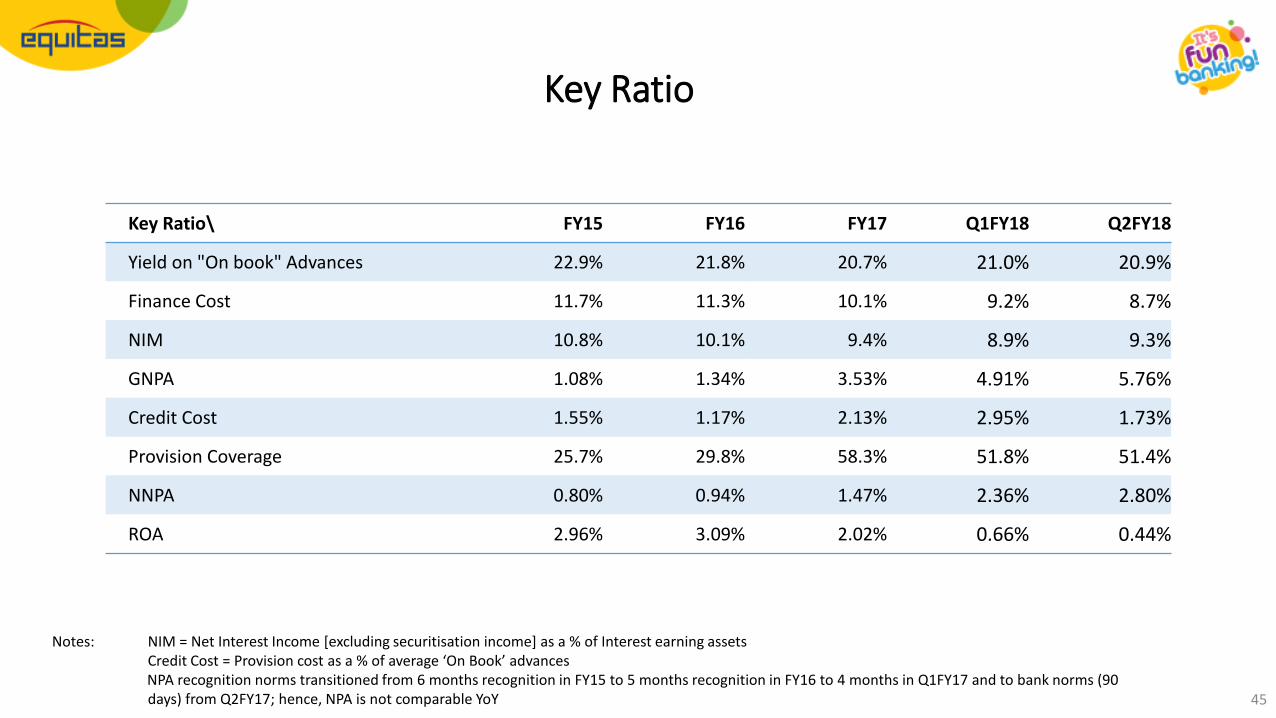
Key Ratio\ FY15 FY16 FY17 Q1FY18 Q2FY18
Yield on "On book" Advances 22.9% 21.8% 20.7% 21.0% 20.9%
Finance Cost 11.7% 11.3% 10.1% 9.2% 8.7%
NIM 10.8% 10.1% 9.4% 8.9% 9.3%
GNPA 1.08% 1.34% 3.53% 4.91% 5.76%
Credit Cost 1.55% 1.17% 2.13% 2.95% 1.73%
Provision Coverage 25.7% 29.8% 58.3% 51.8% 51.4%
NNPA 0.80% 0.94% 1.47% 2.36% 2.80%
ROA 2.96% 3.09% 2.02% 0.66% 0.44%
Notes: NIM = Net Interest Income [excluding securitisation income] as a % of Interest earning assetsCredit Cost = Provision cost as a % of average ‘On Book’ advancesNPA recognition norms transitioned from 6 months recognition in FY15 to 5 months recognition in FY16 to 4 months in Q1FY17 and to bank norms (90 days) from Q2FY17; hence, NPA is not comparable YoY
Key Ratio
46
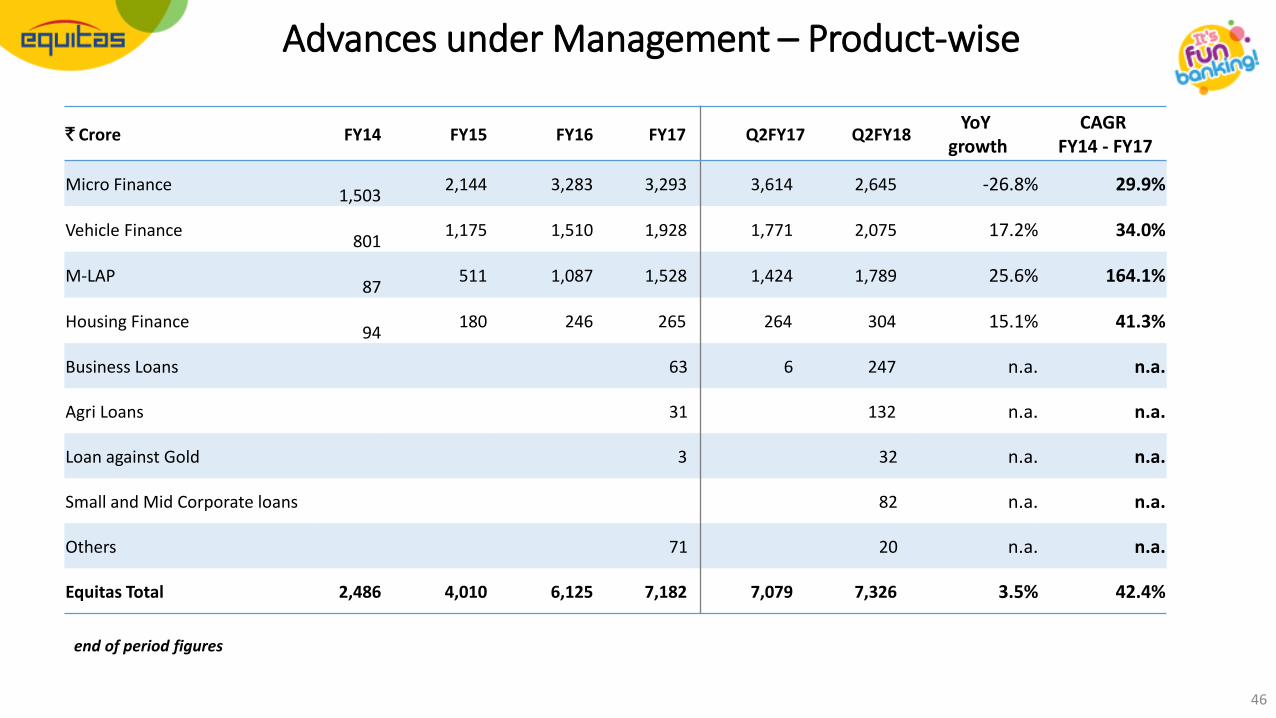
` Crore FY14 FY15 FY16 FY17… Q2FY17 Q2FY18YoY
growthCAGR
FY14 - FY17
Micro Finance1,503
2,144 3,283 3,293 3,614 2,645 -26.8% 29.9%
Vehicle Finance801
1,175 1,510 1,928 1,771 2,075 17.2% 34.0%
M-LAP87
511 1,087 1,528 1,424 1,789 25.6% 164.1%
Housing Finance94
180 246 265 264 304 15.1% 41.3%
Business Loans 63 6 247 n.a. n.a.
Agri Loans 31 132 n.a. n.a.
Loan against Gold 3 32 n.a. n.a.
Small and Mid Corporate loans 82 n.a. n.a.
Others 71 20 n.a. n.a.
Equitas Total 2,486 4,010 6,125 7,182 7,079 7,326 3.5% 42.4%
Advances under Management – Product-wise
end of period figures
Disclaimer
• The information in this document, including facts and figures, is being provided by the Company for informational purposes onlyand could be subject to change without notice. The information has also not been independently verified. No representation orwarranty, express / implied, is made as to the accuracy, completeness or fairness of the presentation and the information containedherein and no reliance should be placed on such information. The Company or any other parties whose name appears herein shallnot be liable for any statements made herein or any event or circumstances arising therefrom.
• This presentation or any part of it or the fact of its, form the basis of, or be relied on in connection with, any contract orcommitment therefor.
• This document has not been and will not be reviewed or approved by any statutory or regulatory authority in India or any otherjurisdiction or by any stock exchanges in India or elsewhere. This document and the contents hereof are restricted for only theintended recipient(s). This document and the contents hereof should not be (i) forwarded or delivered or transmitted in any mannerwhatsoever, to any other person, other than the intended recipients(s); or (ii) reproduced in any manner whatsoever. Anyforwarding, distribution or reproducing of this document in whole or in part is unauthorised.
47
Disclaimer [contd.]
Forward Looking Statements
Certain statements in this document with words or phrases such as “will”, “should” etc., and similar expressions or variation ofthese expressions or those concerning our future prospects are forward looking statements. Actual results may differmaterially from those suggested by the forward looking statements, due to a number of risks or uncertainties associated withthe expectations. These risks and uncertainties include, but not limited to, our ability to successfully implement our strategies,change in government policies etc. The Company may, from time to time, make additional written and oral forward lookingstatements, including statements contained in the Company’s filings with the stock exchanges and our reports to shareholders.
The Company does not undertake to update any forward looking statements that may be made from time to time by or onbehalf of the Company.
48
Investor RelationsEquitas Holdings LimitedSpencer Plaza, 4th Floor, Phase IINo. 769, Anna Salai, Chennai 600 [email protected]
49


![Equitas Finance Limited · Equitas Finance Limited [EFL], is a wholly owned subsidiary of M/s. Equitas Holdings Limited [EHL]. The Company has ... These are placed before the Audit](https://static.fdocuments.net/doc/165x107/5cd65c5488c993861f8d5259/equitas-finance-limited-equitas-finance-limited-efl-is-a-wholly-owned-subsidiary.jpg)