Application of Filament Winding to Cannon and Cannon Components

Page 1 of 14
Equine Cannon Angle System
How to interpret the results
December 2010

Page 2 of 14
Table of Contents
Introduction ................................................................................................................................................ 3 The Sagittal Plane .................................................................................................................................... 4 The Coronal Plane ................................................................................................................................... 5 Results Format ......................................................................................................................................... 6 How to Interpret the Results ................................................................................................................... 8
Example: 1a Sound Horse Walking in Hand .................................................................................. 9 Example: 1b Sound Horse Trotting in Hand ................................................................................. 12

Page 3 of 14
Introduction The ETB-Pegasus Cannon Angle software Poseidon enables users to measure the sagittal plane (protraction/retraction) and coronal plane (abduction/adduction) of the cannon over the time of a stride. This allows movement such as unequal flexion or dishing to be measured. Note: measurement accuracy depends to a degree on the correct alignment of the sensor on the leg. What you need to know about running a test The cannon angle system uses exactly the same hardware as the limb phasing system. Sensors set-up and mounting is the same, simply put the sensors into the brushing boot. When all sensors have been started the horse must stand stationary for 10 seconds. Then carry out the test as normal for walk and trot only. Points to Remember:
Sagittal plane refers to the plane that divides the right and left sections of the body. Any movement that occurs in this plane is in an anterior (ventral) to posterior (dorsal) direction.
Coronal plane refers to the plane that divides the body into front and back. It is understood that any ideal, basic, gait should show minimal coronal plane
movement.
Figure 1
Page 4 of 14
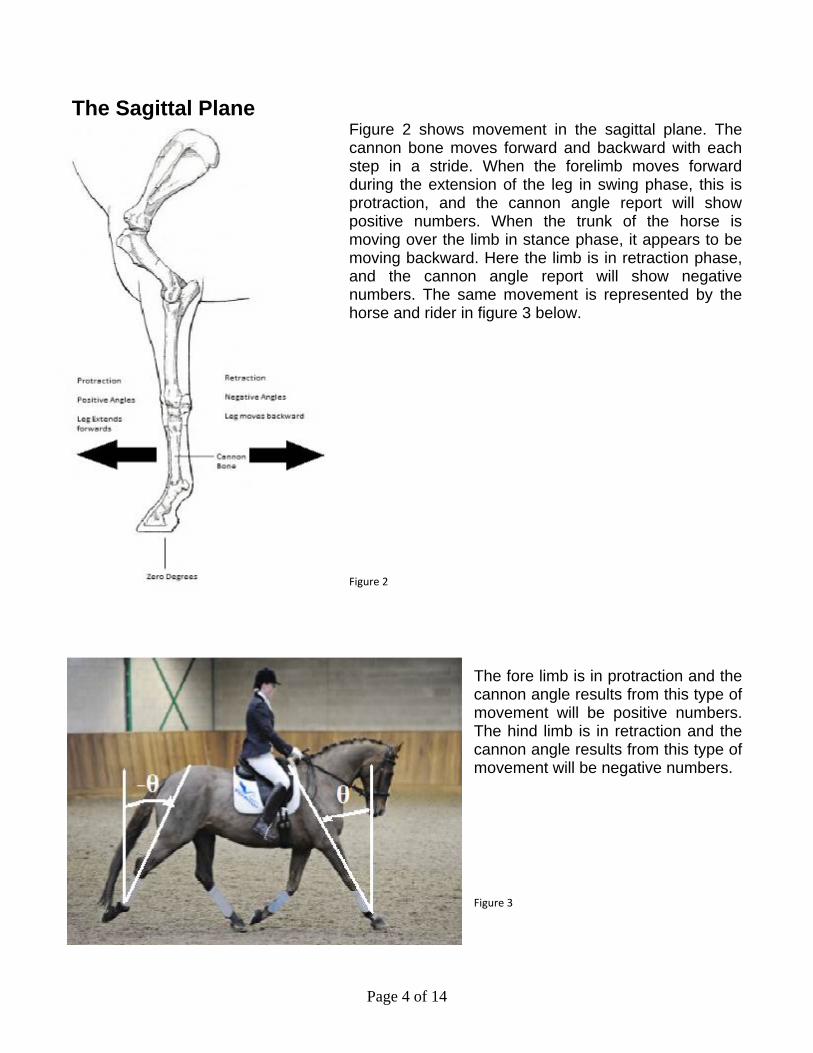
The Sagittal Plane Figure 2 shows movement in the sagittal plane. The cannon bone moves forward and backward with each step in a stride. When the forelimb moves forward during the extension of the leg in swing phase, this is protraction, and the cannon angle report will show positive numbers. When the trunk of the horse is moving over the limb in stance phase, it appears to be moving backward. Here the limb is in retraction phase, and the cannon angle report will show negative numbers. The same movement is represented by the horse and rider in figure 3 below. Figure 2
The fore limb is in protraction and the cannon angle results from this type of movement will be positive numbers. The hind limb is in retraction and the cannon angle results from this type of movement will be negative numbers. Figure 3

Page 5 of 14
The Coronal Plane Figures 4 and 5 below show movement in the coronal plane. If the limb moves inwards (adduction) toward the midsagittal plane, known practically as brushing, the report will show negative numbers. If the limb moves outward with a lateral motion (abduction), known practically as dishing, the report will show positive numbers.
θ -θ
Figure 4 Figure 5

Page 6 of 14
Results Format Results will initially be presented as a graph of the entire trial. By using the tools in Poseidon it can be manipulated to show zoomed in sections and to select strides for graphical representation and statistical summaries as seen in the examples below. See user guide for instruction regarding these functions.
1: A graph of an entire trial.
1a: Zoomed in section of the trial (in this case trot).
2: A summary graph for each limb. The graph below is an example of the left fore. Typical angles for each cannon are plotted individually (see images below), with the standard deviation (dashed line) and minimum/ maximum values (dotted line) the shaded region shows the variation between the maximum and minimum values. The sagittal and coronal angles are plotted for the left fore, right fore, left hind and right hind. Each limb has its own colour coding for sagittal and coronal traces which will be shown in Poseidon. For this left fore (LF) example
sagittal is the blue trace and coronal is the green trace. Note: The time phasing for each limb is retained in each plot. This means that the plots do not show the limbs at the same point in their movement – they are real time and as a result the plot of the LF may be while the limb is in retraction and expectedly the RF will then be in protraction.

Page 7 of 14
Points to remember about summary graphs: Zero is considered to be when limbs are vertical to the ground In the sagittal plane, retraction is negative and protraction is positive. Average sagittal RoM is above 50° In the coronal plane a swing inwards is negative and outwards is positive. Variations of up to 20 degrees in the coronal plane can be considered
acceptable. Coronal deviation typically increases with speed.
3: A summary statistical table. The statistical table will appear as below for walk. The typical peak to peak value (shaded green) represents the overall range of movement (RoM) of the limb and probably what will likely be most useful to consider in most analysis. The sagittal columns are shaded a darker green. Limb phasing is represented by the cells shaded blue. Remember that the LH will be serving as a reference limb. The number of strides considered within the selected region is shown (shaded purple) as well as average, maximum, and minimum stride duration for these strides (shaded turquoise). These charts are very useful for accurate comparison of L vs. R symmetry of RoM in the sagittal or coronal planes. NOTE: The shaded regions will not appear in the Poseidon report but were added for the purposes of this manual.
Region Walk
Strides 10
Average Duration (s)
1.10
Minimum Duration (s)
1.07
Maximum Duration (s)
1.11 LF RF LH RH
Average Phase %
34.58 83.16 0.00 48.66
Minimum Phase %
33.63 82.14 0.00 48.21
Maximum Phase %
35.71 83.93 0.00 49.11LF S Angle
LF C Angle
RF S Angle
RF C Angle
LH S Angle
LH C Angle
RH S Angle
RH C Angle
Typical Peak to Peak (deg)
54.31 13.39 50.63 10.00 61.31 8.35 61.71 11.39
Minimum Peak to Peak (deg)
53.19 12.19 48.80 8.42 60.22 6.92 59.95 9.39
Maximum Peak to Peak (deg)
55.10 14.70 51.87 11.80 63.07 9.80 63.24 13.58

Page 8 of 14
How to Interpret the Results The graph below represents the relationship between the cannon angle of the limb and the visual appearance of the actions of the limb as observed.

Page 9 of 14
Example: 1a Sound Horse Walking in Hand The graph below represents the complete trial of in hand walk and trot where the red line represents stride duration. The trot section, starting around 175 seconds is not being analysed. The sagittal movement of the other limbs are represented by the colour coding as follows:
Right Fore Left Fore Right Hind Left Hind These traces become much clearer when using the zoom function to isolate sections. See User guide for instruction on the zoom function.
The figure below is a zoomed in section of walk. A section with steady stride duration was then selected (highlighted in the yellow region) for further analysis. See user guide for how to do this. The system will automatically choose the typical stride (highlighted in dark yellow) within the selected region to produce graphs and histograms for each limb during that stride. These can be seen below. This horse walked a number of strides before changing direction around 118 seconds which explains the loss or rhythm in the mid-section of the graph.

Page 10 of 14
The following are the individual limb graphs for the selected typical walk stride with sagittal and coronal traces labelled below. NOTE: For the purposes of discussion angles will be rounded to the nearest whole number in these examples.
Walk Left Fore Typical (Sagittal, Coronal) Walk Right Fore Typical (Sagittal, Coronal) Results of the Fore limbs The saggital RoM of the forelimbs of this horse are 54° and 51° for left and right respectively. Therefore it can be said that there is no significant difference between the two and the sagittal RoM in the forelimbs is symmetrical and exhibits a typical RoM in the sagittal plane for a sound horse at walk. The coronal plane shows 13° and 10° RoM for the left and right forelimbs respectively. This is also well within normal limits of coronal deviation. The forelimb profiles of this horse are typical and exhibit the typical inward coronal deviation at the onset of protraction before straightening out. This type of coronal profile is very common and as it is within normal limits (less than 20°) it is no cause for concern.
Walk Left Hind Typical (Sagittal, Coronal) Walk Right Hind Typical (Sagittal, Coronal)
Page 11 of 14
Results of the Hind limbs
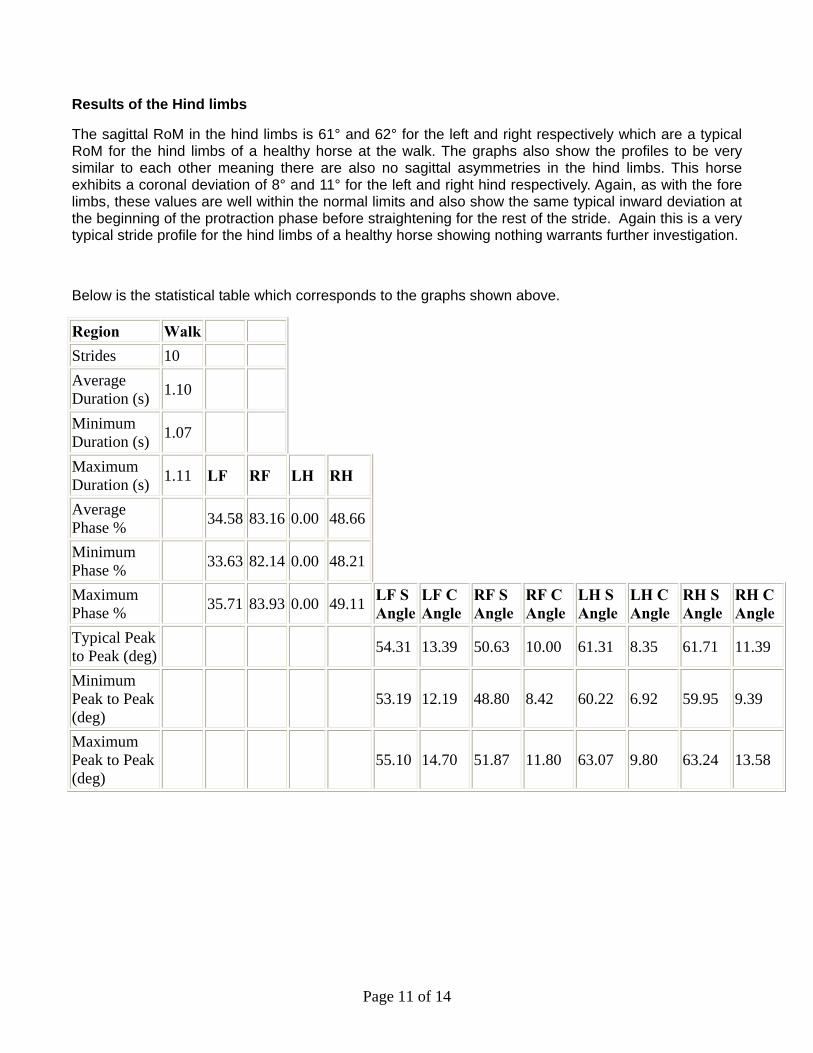
The sagittal RoM in the hind limbs is 61° and 62° for the left and right respectively which are a typical RoM for the hind limbs of a healthy horse at the walk. The graphs also show the profiles to be very similar to each other meaning there are also no sagittal asymmetries in the hind limbs. This horse exhibits a coronal deviation of 8° and 11° for the left and right hind respectively. Again, as with the fore limbs, these values are well within the normal limits and also show the same typical inward deviation at the beginning of the protraction phase before straightening for the rest of the stride. Again this is a very typical stride profile for the hind limbs of a healthy horse showing nothing warrants further investigation.
Below is the statistical table which corresponds to the graphs shown above.
Region Walk
Strides 10
Average Duration (s)
1.10
Minimum Duration (s)
1.07
Maximum Duration (s)
1.11 LF RF LH RH
Average Phase %
34.58 83.16 0.00 48.66
Minimum Phase %
33.63 82.14 0.00 48.21
Maximum Phase %
35.71 83.93 0.00 49.11LF S Angle
LF C Angle
RF S Angle
RF C Angle
LH S Angle
LH C Angle
RH S Angle
RH C Angle
Typical Peak to Peak (deg)
54.31 13.39 50.63 10.00 61.31 8.35 61.71 11.39
Minimum Peak to Peak (deg)
53.19 12.19 48.80 8.42 60.22 6.92 59.95 9.39
Maximum Peak to Peak (deg)
55.10 14.70 51.87 11.80 63.07 9.80 63.24 13.58

Page 12 of 14
Example: 1b Sound Horse Trotting in Hand The figure below is a zoomed in section of trot. A section with steady stride duration was then selected (highlighted in the yellow region) for further analysis. See user guide for how to do this. The system will automatically choose the typical stride (highlighted in dark yellow) within the selected region to produce graphs and histograms for each limb during that stride. These can be seen below. This horse trotted a number of strides before changing direction around 200 seconds and repeating the trot up which explains the disruption in the mid-section of strides.
The following are the individual limb graphs for the selected typical trot stride with sagittal and coronal traces labelled below.
Trot Left Fore Typical (Sagittal, Coronal) Trot Right Fore Typical (Sagittal, Coronal)
Results of the Fore limbs The saggital RoM of the forelimbs of this horse are 62° and 61° for left and right respectively. Therefore it can be said that there is no significant difference between the two and the sagittal RoM in the

Page 13 of 14
forelimbs is symmetrical and exhibits a typical RoM in the sagittal plane for a sound horse at trot The coronal plane shows 17° and 13° RoM for the left and right forelimbs respectively, which also within normal limits of coronal deviation. The forelimb profiles of this horse are typical and exhibit the typical inward coronal deviation at the onset of protraction before straightening out. This type of coronal profile is very common and as it is within normal limits (less than 20°) it is no cause for concern. However, the left fore is approaching the limits of normal deviation and exhibits a 4° difference from the right forelimb indicating a slight asymmetry on the coronal plane. As this is only an in hand example over minimal strides, in this case it would be worth further ridden analysis over a longer time period to assess the asymmetry.
Trot Left Hind Typical (Sagittal, Coronal) Trot Right Hind Typical (Sagittal, Coronal)
Results of the Hind limbs
The sagittal RoM in the hind limbs is 51° and 55° for the left and right respectively which are a typical RoM for the hind limbs of a healthy horse at the trot. The graphs also show the profiles to be very similar to each other meaning there are also no sagittal asymmetries in the hind limbs. This horse exhibits a coronal deviation of 17° and 19° for the left and right hind respectively. Again as with the fore limbs, these values are well within the normal limits and also show the same typical inward deviation at the beginning of the protraction phase before straightening for the rest of the stride. Again this is a very typical stride profile for the hind limbs of a healthy horse however as with the fore limbs, coronal deviation is approaching normal limits and would be worth a more extensive analysis. There are no asymmetries shown between the left and right hind.

Page 14 of 14
Below is the statistical table which corresponds to the graphs shown above.
Region Trot
Strides 19
Average Duration (s)
0.63
Minimum Duration (s)
0.62
Maximum Duration (s)
0.66 LF RF LH RH
Average Phase %
66.84 14.53 0.00 49.07
Minimum Phase %
65.15 12.12 0.00 48.44
Maximum Phase %
68.75 15.87 0.00 50.00 LF S Angle
LF C Angle
RF S Angle
RF C Angle
LH S Angle
LH C Angle
RH S Angle
RH C Angle
Typical Peak to Peak (deg)
61.68 17.45 60.91 12.83 51.35 17.33 55.03 19.08
Minimum Peak to Peak (deg)
56.67 12.10 55.69 7.72 48.71 14.15 53.19 12.19
Maximum Peak to Peak (deg)
67.28 23.70 68.15 16.06 55.39 20.39 58.11 23.56
Summary of Cannon Analysis This horse exhibits symmetrical sagittal RoM in both the fore and hind limbs at walk and trot in hand. There is a slight asymmetry in the coronal plane with greater coronal deviation in the left fore limb which may be worth further ridden analysis. Profiles for all limbs are normal with a typical RoM.