Equatorial Guinea Education Sector Diagnostic - World...
88
Equatorial Guinea Education Sector Diagnostic June 22, 2017 Public Disclosure Authorized Public Disclosure Authorized Public Disclosure Authorized Public Disclosure Authorized
Transcript of Equatorial Guinea Education Sector Diagnostic - World...

Equatorial Guinea Education Sector Diagnostic
June 22, 2017
Pub
lic D
iscl
osur
e A
utho
rized
Pub
lic D
iscl
osur
e A
utho
rized
Pub
lic D
iscl
osur
e A
utho
rized
Pub
lic D
iscl
osur
e A
utho
rized

Acknowledgements
This report is a result of contributions from Lucy Bassett (Education Specialist, World Bank),
Emanuela Di Gropello (Program Leader, World Bank), Jeffery H. Marshall (Consultant), and
Julio Alejandro Abril Tabares (Senior Economist, World Bank).

Table of Contents 1. Executive Summary................................................................................................................. 1
2. Introduction ........................................................................................................................... 12
3. Part A. Context, Background and Education Sector Overview............................................. 13
Country Context ............................................................................................................. 13 3.1.
3.1.1. Brief Country History ............................................................................................. 13
3.1.2. Economic Situation ................................................................................................. 14 3.1.3. Poverty and Shared Prosperity ................................................................................ 15
Overview of Education Sector in Equatorial Guinea ..................................................... 16 3.2.
3.2.1. Recent History ........................................................................................................ 16 3.2.2. Education Sector Goals and Priorities .................................................................... 17 3.2.3. Education System Structure and Governance ......................................................... 19
Education Sector Indicators, Trends and Comparisons ................................................. 26 3.3.
3.3.1. Education Indicators and Trends ............................................................................ 26 3.3.2. Equity Comparisons: Gender, Socioeconomic Status (SES), and Location ........... 42
4. Part B. Education Diagnostic by Topic ................................................................................. 48
Education Finance .......................................................................................................... 48 4.1.
4.1.1. Education Expenditure Estimates ........................................................................... 49 4.1.2. Is Equatorial Guinea Spending Enough and Well on Education? And Why? ........ 53
School Infrastructure ...................................................................................................... 56 4.2.
4.2.1. Schools, Classrooms, and Enrollment .................................................................... 56
4.2.2. Public Versus Private School Provision ................................................................. 58 4.2.3. School Conditions ................................................................................................... 61
School Quality ................................................................................................................ 62 4.3.
4.3.1. School Inputs .......................................................................................................... 63 4.3.2. Teachers .................................................................................................................. 64
4.3.3. Student Outcomes ................................................................................................... 69 4.3.4. Community Participation ........................................................................................ 72
Data and Research .......................................................................................................... 73 4.4.
4.4.1. PRODEGE/MEC Anuario ...................................................................................... 73 4.4.2. Education Research ................................................................................................. 74
Spotlight on Higher Education and TVET ..................................................................... 74 4.5.
4.5.1. Higher Education .................................................................................................... 74
4.5.2. Technical Education (Professional and Vocational Training) ................................ 75 5. Part C: Policy Options ........................................................................................................... 76
6. References ............................................................................................................................. 81
Abbreviations and Acronyms
ACCEG Association of Catholic Education Center of EQG
ANGE
DHS
Agencia Nacional Guinea Ecuatorial
Demographic and Health Survey
EDSGE Encuesta Demográfica y de Salud
EFA Education for All
EGMA Early Grade Math Assessment
EGRA Early Grade Reading Assessment
EMIS Education Management Information System
EQG Equatorial Guinea
ESBA Educación Secundaria Básica
GDP Gross Domestic Product
GER Gross Enrollment Ratio
GNI Gross National Income
GoEG Government of Equatorial Guinea
INEGE Instituto Nacional de Estatistica Guinea Ecuatorial (National Statistics Office)
LMD Licenciado, Master y Doctorado (Bachelors, Masters, and PhD)
MEC Ministry of Education and Science (Ministerio de Educación y Ciencia)
MDG Millennium Development Goal
NER Net Enrollment Ratio
NGO Nongovernmental Organization
ODA Official Development Aid
PNDES
PER
Plan Nacional de Desarrollo Económico y Social
Public Expenditure Review
PIMM Public Investment Management and Monitoring
PRODEGE Programa de Desarrollo Educativo de Guinea Ecuatorial
RAS
SABER
Reimbursable Advisory Services
Systems Approach for Better Education Results
SDI Service Delivery Indicator
SES Socioeconomic Status
SSA Sub-Saharan Africa
TVET Technical and Vocational Education and Training
UIS UNESCO Institute of Statistics
UNDP United Nations Development Programme
UNGE Universidad Nacional de Guinea Ecuatorial
USAID U.S. Agency for International Development

1
1. Executive Summary
The Government of Equatorial Guinea (GoEG) requested financial, analytical, and technical
support from the World Bank during the country’s protracted economic recession. Given the
prioritization of education in the country’s National Development Plan, the World Bank agreed
to undertake an education sector diagnostic study to (a) help the World Bank better understand
the education sector, including the main challenges and policy priorities of the government; (b)
facilitate dialogue between the World Bank and GoEG in the education sector and suggest
options to move forward in the current economic downturn; (c) provide supporting background
for a parallel activity that is focusing on public expenditures in the social sector (Public
Expenditure Review, PER); (d) support the activities that are planned as part of the National
Development Plan’s Programa Mayor Educación Para Todos; and (e) provide education sector
stakeholders with an updated summary of the sector including a review of recent indicator trends
and program activities.
This diagnostic focuses primarily on primary and secondary education, while also providing
some information on TVET and higher education, especially where relevant to the other sub-
sectors. It is also intended to update an earlier (2006) World Bank-supported education sector
diagnostic.
Data and Methodology
In addition to the findings from the previous diagnostic, this report relies on a variety of sources
of data, including:
1. Interviews conducted with the Ministry of Education and Science (Ministerio de
Educación y Ciencia, MEC) officials, international education partners, and other
stakeholders about the main challenges and priorities in the sector, as well as detailed
data on specific programs and activities
2. Data from statistical annuals (Anuarios), the 2011 Demographic and Health Survey
(DHS, Encuesta Demográfica y de Salud, EDSGE-I), and the United Nations
Educational, Scientific, and Cultural Organization (UNESCO) Institute of Statistics (UIS)
3. Existing education research1
4. Additional qualitative data obtained during field visits to schools and district education
offices. Appendix A includes a summary of the field work and interviews that were
completed as part of the World Bank mission in June 2016.
5. The most recent (2015) budget execution summary in the Ministry of Finance Budget
Law 2016 for education finance information.
All analyses of recent statistics and trends in education (for example, enrollment, repetition,
drop-out rates, financing, etc.) are conducted based on this available data. No new data collection
1 For example, Bivini Mangue’s (2015) summary of Education For All (EFA) and various studies carried out by the
Programa de Desarrollo Educativo de Guinea Ecuatorial (for example, PRODEGE 2009, 2011).

2
was conducted for this study. Given data limitations, the diagnostic is not able to provide
additional information on the determinants of learning and characteristics of the quality
assurance framework and all the required details on the private schooling sector, or undertake
cost-effectiveness comparisons across public and private school systems. Additional information
and analysis on education financing will be possible under an upcoming Public Expenditure
Review (PER).
Organization of the Report
The diagnostic first provides country context and an overview of the education sector. It then
describes recent trends in education (for example, enrollment, repetition), both within the
country and compared to other countries in the region and GDP peers,2 and highlights key
challenges in areas such as education finance, quality, and learning outcomes. The report
concludes with possible policy actions to support the government’s education goals, framed
within the current economic crisis that the country is facing.
Country Context and Education Sector Overview
Country Context
Equatorial Guinea (EQG), a small country on the west coast of Sub-Saharan Africa (SSA), is
considered to be one of the least free countries in the world. It benefitted from significant
economic growth owing to the discovery of oil in the mid-1990s; however, since late 2012, fiscal
constraints, investment cuts, and reduced revenue from oil sales resulted in a contraction of the
gross domestic product (GDP). With little prospect of an upturn in growth, this economic crisis
in EQG poses significant risks to the country, but could also offer an opportunity for needed
reforms.
Data on poverty are limited and do not provide a sense of trends over time; however, there are
sharp differences in basic welfare indicators between the mainland relative to the islands and
among individuals with lower levels of education and wealth.
Education Sector Overview
The education system is made up of four main levels: preschool, primary, secondary, and higher
education (see Table 1.1), with preschool and primary considered mandatory. Complementary
education modalities include Permanent Training and Adult Literacy Education, Long Distance
Education, and Special Needs Education. The general management of the entire education
system is assigned to the Ministry of Education and Science (MEC). Its principal functions
include proposing education policies and programs; approving curricular programs; creating and
managing public education centers and approving and regulating private centers; coordinating
and stimulating different social and economic stakeholder efforts; and issuing and accrediting
diplomas and certifications.
2 GDP peers were selected as those with GDP per capita within US$1,000 below or above EQG’s GDP per capita
(or within 10 percent of EQG’s per capita GDP), using 2015 figures from the World Development Indicators (WDI)
http://data.worldbank.org/indicator/NY.GDP.PCAP.CD

3
Table 1.1. Education Levels, Modalities, and Enrollment Figures (2014–15)
Level Enrollment Modality Age
Higher Education
n/a PhD (3 years) n/a
n/a Master’s (2 years) n/a
7,971 Licenciado (4 years) n/a
Secondary Education
n/a University orientation
course (1 year)
Advanced technical and
professional training (2 years) 18–19
7,941
(Bachillerato) Bachillerato (2 years)
Basic technical and professional
training (2 years) 17–18
27,027 Basic secondary education (4 years) 13–16
Primary Education 36,481 2nd cycle: grades 4–6 (3 years) 10–12
56,915 1st cycle: grades 1–3 (3 years) 7–9
Preschool Education 39,596 Preschool (3 years) 4–6
2,512 Childcare (3 years) 1–3
Source: Programa de Desarrollo Educativo de Guinea Ecuatorial (PRODEGE)/MEC Anuario (2015–16); Ley
General de Educación No. 5/2007.
Education centers can be public or private and despite having more public than private centers,
the actual number of students enrolled in preschool, primary, and secondary education shows
that education in EGQ is mainly privately delivered.
Key Issues and Challenges
Poor Educational Outcomes
EQG trails in education development given its substantial GDP per capita and could do more to
convert its oil wealth into human wealth.
According to available data, both learning outcomes and quality of schooling are poor. In
2011, more than 70 percent of grade 1 students were classified as Low Achievement (based on
the test scoring categorization) in non-reading test components and at the end of grade 1: few
students were able to write more than five words. The results in mathematics were also low, as
fewer than 10 percent of grade 1 students achieved a High Achievement level. There are no
national assessments, making it difficult to track learning outcomes and know how to improve
them.
Several factors contribute to poor education quality, including low teacher qualifications,
lack of learning materials, and poor physical conditions. While teacher training is improving,
there are still low rates of qualified teachers (5 percent in preschool, 54 percent in primary
school, and 69 percent in secondary school) and no mechanisms to hire or promote teachers
based on performance. Moreover, classes tend to be teacher-dominated, with a heavy reliance on
dictation and copying, and limited use of problem solving and student-initiated dialogue.
Learning materials, such as textbooks, are often lacking. For example, in most primary grades,
the ratio of students to textbooks is above 3, and in some cases this ratio is much higher.
Evidence shows little improvement in school infrastructure, both physical conditions and

4
maintenance, between 2008 and 2015. Community and parent participation seems to be low,
suggesting weak linkages between parents and schools.
High quality support and monitoring is lacking. One of the greatest challenges facing the
education system in EQG is to create an effective monitoring system that guarantees high-quality
education in all schools. While inspectors or supervisors are in place, there is no system capable
of addressing school needs on an individual basis, across very different contexts and realities.
Information is a critical input in this process, but these systems also require a very strong
institutional commitment to monitoring, and a strengthening of local education offices and the
role they play in the system.
Repetition and dropout rates are very high in EQG, resulting in low learning outcomes. Large numbers of students are repeating the earliest grades, often multiple times, before
eventually dropping out. As of 2015, grade 1 students outnumbered grade 6 students by more
than two to one. Although repetition rates for grade 1 have decreased over the past decade, still a
quarter (25 percent) of all first-graders repeat the grade (in 2014-15) and repetition rates for
grades 2-5 remain at 10-20 percent. These figures are high compared to other African countries
as well as countries with similar GDP per capita (see Figure 1.1 and Figure 1.2).
Figure 1.1. Repetition Rate in Primary Compared to Selected African Countries
Source: United Nations Educational, Scientific, and Cultural Organization (UNESCO) Institute for
Statistics (UIS), latest available data.
1 3 3 3 3
4 5
6 6 8
11 13
14 16
17 19
20 20 22
23
0
5
10
15
20
25

5
Figure 1.2. Repetition Rate in Primary Compared to GDP Peers
Source: UIS (for repetition rates); WDI (for GDP per capita 2015).
Research shows negative consequences to high repetition rates, including faster dropout and less
learning. Several options exist to address the problem of high repetition rates. One option is
ensuring access to quality preschool, which prepares young people for primary school, and
should, in turn, reduce repetition and dropout rates. Options for children already in the primary
system include remedial education and automatic grade progression. However, automatic grade
progression comes with a risk that children will not learn in the next grade unless teacher training
is based on differentiated teaching.
Inequitable Access
Preschool net enrollment in 2015 was 42 percent, but this is concentrated largely in urban
areas (with 75 percent of preschool enrollment), suggesting that rates are very low in rural
areas. Preschool enrollment is similar amongst girls and boys.
Access to primary education is relatively high in EQG, with net enrollment ratios between 60-
86 percent, depending on the data source used. However, when compared to other African
countries and considering its income level, both primary gross and net enrollment rates are
relatively low. Given that the country is facing an economic crisis, enrollment is likely to fall
because families have less money available to pay for school or related expenses (school
supplies, transportation, clothes, and so on). High gross enrollment ratios indicate significant
overage enrollment in EQG, at a rate higher than GDP peers. School enrollment rates in primary
school are roughly equal across income quintiles (89 percent for the riches quintile vs. 83 percent
for the poorest quintile) and amongst boys and girls.
[CELLRANGE]
[CELLRANGE]
[CELLRANGE] [CELLRANGE] [CELLRANGE]
[CELLRANGE]
[CELLRANGE]
0
2
4
6
8
10
12
14
16
18
20
13,000 13,500 14,000 14,500 15,000 15,500 16,000
% r
epet
itio
n
GDP per capita

6
Access to secondary education is much lower and inequalities based on gender, income, and
geographical area are clear at this level. The latest available net enrollment ratio3 is 43.6
percent in secondary school. Enrollment is nearly 4 times higher in the richest quintile (63
percent) compared to the poorest quintile (15 percent). Disparities in enrollment are stark
between urban and rural areas, with enrollment nearly double in urban areas. Although girls’
enrollment is higher overall in secondary school than boys (46 vs. 41 percent, respectively), at
age 16 boys’ enrollment surpasses that of girls. For the 17-21 age range the average male
advantage in attendance is slightly more than 10 percent.
Higher education is limited. The higher education system in EQG is still relatively new, and
mainly consists of the offerings at the Universidad Nacional de Guinea Ecuatorial (UNGE).
Between 2006 and 2015 there was a steep decline of the enrollment in the education school,
which affects the pool of potential trained teachers. In EQG there is very little original research
in education conducted in EQG to draw on, but more is needed to learn more about the education
system, especially qualitative data that focuses on schooling processes.
Professional and technical education is concentrated in the capital and vocational training programs do not seem to be well matched with economic opportunities. Very few programs
aim to develop skills for agriculture and fishery, two of the sectors the government has identified
as potential engines of the economy to help balance with the oil sector. Also, skills are not
abundant in the construction sector, which makes it difficult to meet the demands of the second-
largest source of GDP growth during the past years.
Insufficient Financing
Compared to other Africa countries and countries with similar GDP, EQG spends
significantly less on education. As a reference, African countries devoted 4.8 percent of their
GDP and 17.2 percent of their total government expenditure to education in 2015,4 while OECD
countries spend an average of 5.2 percent of their GDP on education and 11.3 percent of their
total public spending.5 Spending only 2.3 percent of their GDP (see Figure 1.3) and 5.2 percent
of their total government expenditure on education, EQG lags behind.
3 DHS 2011.
4 UNESCO Institute for Statistics, most recent year available.
5 OECD 2016.

7
Figure 1.3. Public Spending on Education as a Percentage of GDP (selected African countries)
Source: UIS database.
Furthermore, spending on education is not well prioritized and budgets are poorly
managed. Financial resources for education have increased over the last 15 years and in 2015
the MEC had the fourth-highest expenditures of all 26 ministries. Nevertheless, the share of total
government spending devoted to education appears to be low, and, financing has often been
concentrated in areas that are not the most cost-effective and/or equitable, such as infrastructure
and higher education, with limited emphasis on quality inputs. There are also signs of upcoming
vulnerability of education (and other social sectors) spending to variations in oil prices with risks
to pro-poor spending. The education sector is also characterized by a lack of detailed action plans
that clearly spell out budget needs by activity, as well as links with outcome indicators for
monitoring progress. There are substantial risks associated with poor budget management,
including ineffective spending, corruption, and falling short of government spending targets (that
is, unused money).
Given that both primary and secondary education are becoming more urban and more
private, it would be important to gather more information on private education and
monitor and evaluate the subsidies provided to private schools. These subsidies may be able
to have a greater impact if the funding is tied to better measurement of outcomes and
requirements/incentives of the private schools.
Policy Options
The GoEG has articulated clear goals for education. These include (a) ensuring universal
coverage in preschool and primary education, and a 98 percent gross enrollment rate in
secondary education; (b) improving the quality of education, including adequate teacher
preparation; (c) eliminating gender discrepancies at all levels; and (d) improved and expanded
2.3
0
2
4
6
8
10
12
14
Per
cen
tage

8
professional, technical, and higher education adapted to the necessities of the labor market.
These goals are well focused on the key target groups and strategic areas in the country.
The following policy recommendations provide options to reach the government’s four
goals as well as an additional goal of improved education financing, taking into
consideration the current economic crisis in the country. The recommendations attempt to
reflect promising solutions to maintain access to education and basic school functioning,
especially for poor children, while improving school quality and systems data.
Increasing enrollment in preschool, primary, and secondary education
Demand-side interventions to prevent dropout and keep poor children in school
The main reasons for dropout during the school year were identified as child sickness, lack of a
teacher, and lack of money to pay for studies. In a situation of economic crisis, where enrollment
may already be decreasing, the ability to pay for school or related expenses (school supplies,
transportation, clothes, etc.) is likely to diminish. Some options to reduce dropout and keep poor
children in school include cash transfers (either unconditional or conditioned on school
attendance), school feeding, and transportation subsidies. According to the information in this
diagnostic there is no such program in EQG so it could be difficult to begin to implement such an
intervention, unless started on a small scale with a focus on children most at risk. Adolescent
girls could be a target of these transfers to maintain their attendance in secondary school.
Comprehensive approach to reduce grade repetition
Addressing the problem of high repetition rates in primary school requires a comprehensive
approach. This would consist of several aspects: (i) expansion of pre-primary, (ii) enforcement of
age requirements in primary; and (iii) a clear threshold for repetition rates coupled with
personalized attention to the weakest students.
Ensuring access to quality preschool is the best way to prepare young people for primary school,
which in turn can reduce repetition and dropout rates. There is a significant geographic disparity
in preschool access in EQG with 75 percent of preschool enrollment in urban areas. Access in
rural areas could be expanded through the creation of community-based preschools, expansion of
public provision, or the addition of private preschools, provided there is sufficient monitoring
and oversight by the MEC.
Early entry into primary, before the official entry age of seven, is fairly common. According to
the 2014-15 Anuarios, nearly one-third of grade 1 entrants in 2014-15 were below seven years of
age at the national level and 42 percent in the Insular zone. Enforcement of entry age
requirements in primary would prevent younger children from joining too early, thereby
allowing teachers to focus on ensuring learning and grade progression for the age-appropriate
students in the class.
A clear threshold for repetition rates, coupled with personalized attention to the weakest students
could allow the MEC to better limit repetition rates. For example, a threshold of 10 percent
repetition could be held, with the rest of the children automatically progressing with additional
attention for the weakest students to ensure they can learn and perform in the subsequent grade.

9
Improving the quality of education
School grants to improve basic school conditions
Learning materials (such as textbooks) and infrastructure deficiencies, including poorly
resourced and dilapidated schools and classrooms, have been identified as key constraints
limiting the country’s ability to achieve a basic set of quality conditions for students to learn in
EQG. One solution to these problems is the provision of school grants, that is, cash grants that
are disbursed to schools to address priorities as defined by the school and local community.
Activities like purchasing textbooks and other learning materials as well as improving physical
conditions (and school maintenance) are commonly supported by school grants. The overarching
goals of school grant programs are to improve school conditions for learning while also using the
planning and execution process to improve school management capacity as well as strengthen
the interface with parents and the community. School grants therefore have a lot of potential to
address a range of needs in EQG schools, with the added advantage that the grant does not have
to be a ‘one size fits all’ intervention. Grants can also be targeted to the regions and schools with
greatest need and be made conditional on the achievement of simple education outcome/output
indicators to increase school accountability for results.
Teacher sector reform
In the context of economic crisis in EQG, there is a risk of increased teacher absenteeism (for
example, if teachers do not receive regular payment from the Government or seek other work to
earn enough money) and diminished investment in teacher training due to limited financial
resources. In such a situation, it is critical to ensure first, that teachers continue to show up at
schools to teach children and, second, that the quality of teaching is as high as possible.
According to a series of workshops conducted by PRODEGE in 2016, it was identified that
neither school principals nor academic department coordinators are supervising the issue of
absenteeism. It would be important, then, to ensure that such monitoring takes place. that public
school teachers receive consistent payment, especially those working in areas most affected by
the crisis, and that mechanisms are in place to replace teachers that are not showing up.
To ensure high quality teacher training, there is a need to ensure sufficient Government resources
are allocated to pre- and in-service training. Indeed, training must be strengthened to better orient
teachers to effective pedagogies (for example, child-centered rather than teacher-dominated) and
classroom techniques. There is a particular need to ensure improved training of preschool
teachers, who are currently the least trained, since research shows that quality preschool
education can contribute to reducing grade 1 repetition, a significant problem in the country. An
alternative teacher training program, such as a shorter condensed program, particularly for
teachers in rural areas, could be developed to expand the number of teachers in the short term,
with a path to certification planned over time.
Improving data collection, data quality, and analysis to improve the evidence-based policy
planning process

10
Improving data collection, data quality, and analysis can be supported by three specific policy
actions. First, a Service Delivery Indicator (SDI) study would be useful as a way to obtain more
data on service delivery in EQG, especially given the lack of data and the potential effect of the
economic crisis. A Service Delivery Indicator (SDI) study uses a set of education indicators to
examine the effort and ability of staff and the availability of key inputs and resources that
contribute to a functioning school. The surveys measure the performance and quality of
education services using cutting-edge methodologies and a high degree of quality assurance and
generate nationally representative indicators, disaggregated by rural and urban location, and
public and private provider type. The survey instrument is nimble allowing for relatively rapid
fieldwork and data analysis, making it more useful for decision making and policy discussions.
This would provide data to shape policy decisions regarding teachers, learning materials, and
other inputs needed to ensure school quality. Ideally, some of the key questions could eventually
be integrated into the EMIS.
Second, learning assessment can provide up-to-date information on student achievement levels in
different grades (and subjects), and also help create a ‘culture of assessment’ in the country,
which can in turn facilitate more expansive quality monitoring and support activities later on. To
fill the gap in learning assessment data in EQG, it is recommended that sample-based
assessments take place at different grade levels to determine how well students in specific grades
are able to answer questions taken from the official curriculum. For example, the Early Grade
Reading Assessment (EGRA) and Early Grade Math Assessment (EGMA) could provide insight
into how well the youngest children are learning while there is still time to adjust teaching
methods and ensure they learn in subsequent years. Results can be used to inform and adapt the
teacher training system improvements noted earlier.
Third, high quality support and monitoring is needed. Having a strong Education Management
Information System (EMIS) in place provides a foundation for an effective overall monitoring
system, with the added advantage of making schools comfortable with a system where data is
collected on an annual basis. The Anuario process that was implemented as part of PRODEGE
has served a critical function in a data-constrained environment and should be strengthened to
guarantee that it continues to provide at least a minimum amount of annual information on all
schools. The ultimate goal is a strong, two-way flow of information where schools are being
constantly monitored to define their needs, this information is then processed at different levels,
and then information flows back to the schools in the form of support intended to address their
specific needs.
Eliminating gender discrepancies in enrollment
Support for adolescent girls and early childhood development
The critical period for girls’ enrollment is in late adolescence. The main reasons for girls leaving
school at this time are likely related to pregnancy and starting their own families, work demands
at home to take care of other family members, or a household aversion to continuing the
educational investment for girls, especially as the direct and indirect costs increase by
educational level. To address this increase in girls’ dropout rates in late adolescence in EQG, the
most at-risk adolescent girls should be targeted with comprehensive programs including

11
mentorship, financial assistance, childcare support, and sexual and reproductive health services.
This would require collaboration across ministries of health, education, and so on. It would also
be beneficial to remove the ban on pregnant teenage girls staying in school, if it is still in place.
Children of teenage mothers are at higher risk of illness, poor nutrition, and mortality than
children of older mothers. At the same time, adolescent mothers are less likely to take preventive
measures to ensure their children’s health and nutrition, which can adversely affect cognitive and
socioemotional development and learning and put children of teenage mothers at higher risk of
poor development outcomes. Therefore, early childhood development support for these children
is critical. This could be parenting counseling for adolescent mothers and other caregivers
(perhaps delivered through the health system), subsidized access to childcare (ideally near the
adolescent mother’s school), and financial support.
Education financing
Identification of priority spending needs and plans for execution
To guarantee the necessary inputs for a quality education system, education financing must be of
sufficient size and prioritized according to the greatest needs—rather than the current bias
toward infrastructure and higher education. For example, there is the consistently low spending
on preschool in EQG and yet preschool is critical for building the foundation of children’s
learning and preparing them to be successful in primary school. Given the conditions of
economic crisis in EQG, it is essential to identify the most important budget lines to maintain
basic education functioning and then ensure that the available money is actually disbursed. This
requires identifying spending needs and laying out detailed plans for how these will be executed,
with specific goals and targets.
Improved monitoring and evaluation of private schools and support for Strengthening Public
Private Partnerships (PPPs)
Given that both primary and secondary education is becoming more private in EQG, it would be
important to better monitor and evaluate the supply, quality, and cost of private education. Based
on this information, there could be opportunities to strengthen Public Private Partnerships
(PPPs), including, for example, better design of the subsidies provided by Government to private
schools, such as tying the funding to specific process and performance results for private schools.

12
2. Introduction
The World Bank seeks to support the Government of Equatorial Guinea (GoEG)’s objectives to
shield the poorest from the worst effects of the economic downturn and invest in building the
country’s human capital. Since 2013, the World Bank Group has supported the GoEG through a
limited program of Reimbursable Advisory Services (RAS), which has enabled small, but
important improvements in economic management. The government has since requested
financial, analytical, and technical support to help during the country’s protracted economic
recession. Given the prioritization of education in the country’s National Development Plan, the
World Bank agreed to undertake an education sector diagnostic study to (a) help the World Bank
better understand the education sector, including the main challenges and policy priorities of the
government; (b) facilitate dialogue between the World Bank and GoEG in the education sector
and suggest options to protect children, especially the poor and vulnerable, during the current
economic downturn; (c) provide supporting background for a parallel activity that is focusing on
public expenditures in the social sector (Public Expenditure Review, PER); (d) support the
activities that are planned as part of the National Development Plan’s Programa Mayor
Educación Para Todos; and (e) provide education sector stakeholders with an updated summary
of the sector including a review of recent indicator trends and program activities.
This diagnostic focuses primarily on primary and secondary education, while also providing
some information TVET and higher education, especially where relevant to the other sub-sectors.
It is also intended to update a 2006 World Bank-supported education sector diagnostic. When
possible, comparisons are made between current and previous education indicators to provide an
extended trend summary that goes beyond what is available in the statistical annuals (called
Anuarios, available since 2007-08).
In addition to the findings from the previous diagnostic, this report relies on a variety of sources
of data, including:
6. Interviews conducted with the Ministry of Education and Science (Ministerio de
Educación y Ciencia, MEC) officials, international education partners, and other
stakeholders about the main challenges and priorities in the sector, as well as detailed
data on specific programs and activities
7. Data from statistical annuals (Anuarios), the 2011 Demographic and Health Survey
(DHS, Encuesta Demográfica y de Salud, EDSGE-I), and the United Nations
Educational, Scientific, and Cultural Organization (UNESCO) Institute of Statistics (UIS)
8. Existing education research6
6 For example, Bivini Mangue’s (2015) summary of Education For All (EFA) and various studies carried out by the
Programa de Desarrollo Educativo de Guinea Ecuatorial (for example, PRODEGE 2009, 2011).

13
9. Additional qualitative data obtained during field visits to schools and district education
offices. Appendix A includes a summary of the field work and interviews that were
completed as part of the World Bank mission in June 2016.
10. The most recent (2015) budget execution summary in the Ministry of Finance Budget
Law 2016 for education finance information.
All analyses of recent statistics and trends in education (for example, enrollment, repetition,
drop-out rates, financing, etc.) are conducted based on this available data. No new data collection
was conducted for this study. Given data limitations, the diagnostic is not able to provide
additional information on the determinants of learning and characteristics of the quality
assurance framework and all the required details on the private schooling sector, or undertake
cost-effectiveness comparisons across public and private school systems. Additional information
and analysis on education financing will be possible under an upcoming Public Expenditure
Review (PER).
The diagnostic is divided into three main parts. Part A focuses on country context, background
on the education sector, and recent trends in education (for example, enrollment, and repetition).
Part B then moves into the education sector diagnostic by topic, focusing on the main challenges
in areas such as education finance, quality, and learning outcomes. Part C introduces possible
policy actions, framed with the current crisis context, that address some of the main issues
identified in Part B.
3. Part A. Context, Background and Education Sector Overview
3.1.1. Brief Country History
Equatorial Guinea (EQG) is a small country located in the Gulf of Guinea on the west coast of
Sub-Saharan Africa (SSA), bordering Gabon and Cameroon and several islands. The country
consists of a mainland area, comprising 90 percent of the total land area and housing 75 percent
of the total population, and five inhabited islands. The population is approximately 1.2 million.7
There was a dramatic population decline during the chaotic period of the 1970s, followed by a
large increase in population in the 1980s. In the last 25 years the population growth rate has
steadied at just under three percent per year, which is consistent with the sub-Saharan Africa
average. However, it is important to note that there is no consistent agreement on growth
projections going forward. (See Appendix B for more on population dynamics.)
Formerly a Spanish colony, EQG gained its full independence in 1968. Prior to its independence,
EQG was ranked as one of the countries with highest per capita income in Africa.8 The years
7 This data is from the 2015 census. The 1.22 million estimate for 2015 represents an increase of approximately 50
percent relative to previous estimates. 8 U.S. Department of State. Bureau of African Affairs, 2005.

14
following independence were characterized by a worsening economy, high levels of social
and political conflict, and significant human rights abuses. President Francisco Macias
Nguema’s ‘reign of terror’ involved a violent crackdown on the opposition, resulting in
thousands of prisoners, murders, injuries, and 160,000 exiles.9 Many of the plantations controlled
by foreigners were closed and foreign investment declined. The country's infrastructure
(electricity, water, roads, transportation, and health) fell into ruin and the agricultural sector
could not recover from the economic crisis that followed independence. Schools were also closed
during this period.
In 1979, Teodoro Obiang Nguema, a senior military officer, overthrew his uncle—and he
remains president today. He lifted some of the restrictions of the previous regime (for example,
reestablishing diplomatic ties with Spain, returning exiles), but also maintained many of the
repressive policies and corruption. The present situation has been characterized as ‘restricted
democracy’, since despite the democratic structure, real opportunities for the development of an
opposition are limited or nonexistent.10
According to Freedom House’s 2017 annual global
survey,11
on a scale from 1 (most free country) to 7 (least free country), EQG received a score of
7 for both political rights and civil liberties. While a new constitution was introduced in 1982,
President Obiang and his clan continued in power.
3.1.2. Economic Situation
Prior to the discovery of oil in the mid-1990s, the economy was dominated by the
agriculture (cocoa) and forest (wood) sectors. Agriculture experienced an extended period of
decline in the post-colonial period, driven in part by the expulsion of foreign settlers and the
withdrawal of Nigerian labor.12
The forestry sector has also encountered difficulties, due to a
depletion of timber in forests for production, and the country has been forced to resort to import
timber to meet local market needs.13
The most significant recent development in the economy is the growth of the hydrocarbon
extraction industry beginning in the mid-1990s, which led to an extended period of
economic growth and recovery of macroeconomic indicators. The oil industry has
transformed the economy in terms of composition, overall size, and growth rates. For example,
in 2002 EQG ranked first in the world in terms of the growth rate of gross domestic product
(GDP) per capita.14
Figure 3.1 highlights the transformative effect of the extraction industry on the economy. In
1995 the non-oil sector was responsible for nearly the entire production of a much smaller
overall economy. In contrast, by the early 2000s the economy had grown by a multiple of ten,
and the oil sector made up more than 80 percent of total production. In 2011, less than ten
percent of the male workforce was in agriculture and the largest work categories were skilled and
9 Razquin 2006.
10 Razquin 2006
11 Freedom House 2017
12 Bolobo Ekobo 2001
13 Razquin 2006
14 World Bank 2004

15
un-skilled manual labor, followed by professional-technical. About half of women reported
current employment, compared with over 70 percent of men; for younger men (and women) the
rates of unemployment were much higher. (Appendix C provides more information on the labor
market.)
Figure 3.1. Evolution of GDP by Sector, 1994–2004
Source: Razquin 2006.
Note: Shaded section is the petroleum sector; non-shaded area is non-petroleum sector.
However, since late 2012, fiscal constraints, investment cuts, and continued falls in revenue
from sales of hydrocarbons resulted in a 30 percent contraction in per capita GDP. EQG’s
economic contraction has accelerated since 2014: overall GDP declined by 7.4 percent during
2015 and the estimated growth rate for 2016 is −10 percent. With little prospect of an upturn in
growth, this economic crisis in EQG makes the near-term outlook in EQG very challenging.
3.1.3. Poverty and Shared Prosperity
Data on poverty are limited and do not provide a sense of trends over time. The 2011 DHS
(EDSGE-I) does not include any estimations of poverty based on a poverty line, but instead
relies on quintile-based comparisons of households. The only reference to poverty levels is from
World Bank indicators, that refer to a poverty headcount ratio (that is, percentage living below
poverty line) of 76.8 percent in 2006.
Average income levels have certainly increased in the last 20 years as a result of the growth
of the extraction sector, but it is not clear to what degree the new economic reality has
benefited the larger population. In fact, per-capita income measures can be quite misleading
16
about the real economy, especially when they have increased dramatically in a short period of
time (as is often the case with the discovery of oil). This question can only be answered with
detailed comparisons of poverty and income levels at different points in time, which is
handicapped by the lack of survey (and other) data.
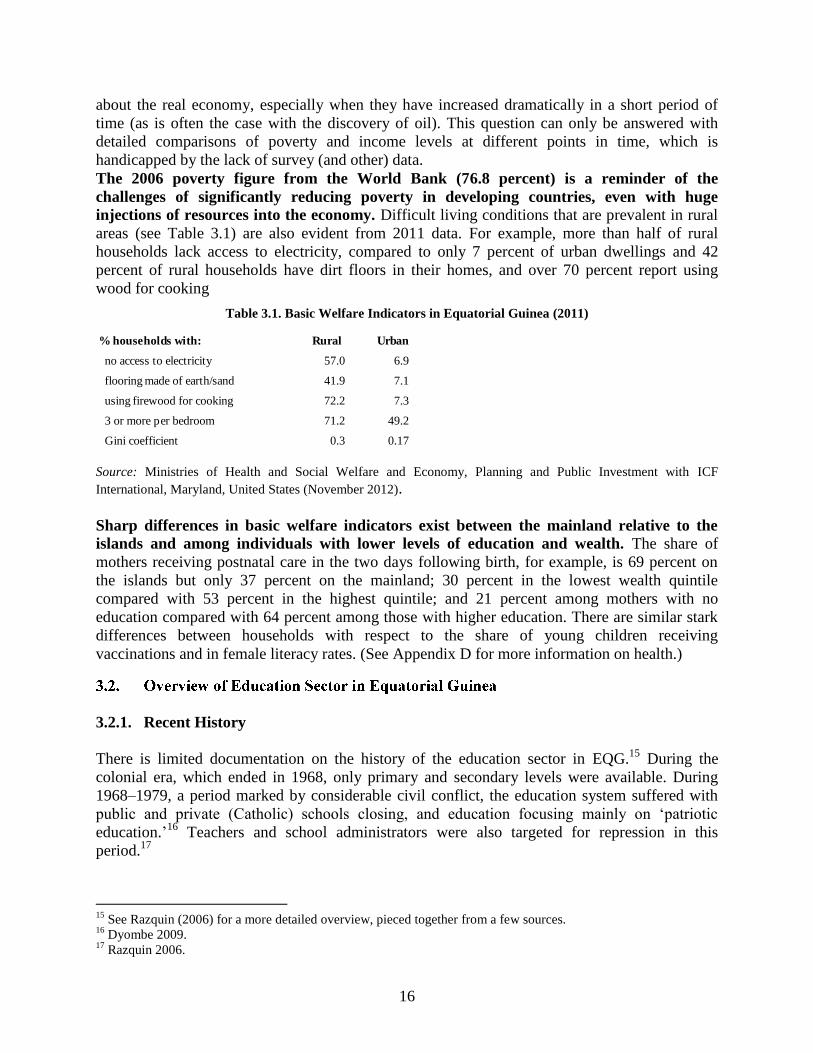
The 2006 poverty figure from the World Bank (76.8 percent) is a reminder of the
challenges of significantly reducing poverty in developing countries, even with huge
injections of resources into the economy. Difficult living conditions that are prevalent in rural
areas (see Table 3.1) are also evident from 2011 data. For example, more than half of rural
households lack access to electricity, compared to only 7 percent of urban dwellings and 42
percent of rural households have dirt floors in their homes, and over 70 percent report using
wood for cooking
Table 3.1. Basic Welfare Indicators in Equatorial Guinea (2011)
Source: Ministries of Health and Social Welfare and Economy, Planning and Public Investment with ICF
International, Maryland, United States (November 2012).
Sharp differences in basic welfare indicators exist between the mainland relative to the
islands and among individuals with lower levels of education and wealth. The share of
mothers receiving postnatal care in the two days following birth, for example, is 69 percent on
the islands but only 37 percent on the mainland; 30 percent in the lowest wealth quintile
compared with 53 percent in the highest quintile; and 21 percent among mothers with no
education compared with 64 percent among those with higher education. There are similar stark
differences between households with respect to the share of young children receiving
vaccinations and in female literacy rates. (See Appendix D for more information on health.)
3.2.1. Recent History
There is limited documentation on the history of the education sector in EQG.15
During the
colonial era, which ended in 1968, only primary and secondary levels were available. During
1968–1979, a period marked by considerable civil conflict, the education system suffered with
public and private (Catholic) schools closing, and education focusing mainly on ‘patriotic
education.’16
Teachers and school administrators were also targeted for repression in this
period.17
15
See Razquin (2006) for a more detailed overview, pieced together from a few sources. 16
Dyombe 2009. 17
Razquin 2006.
% households with: Rural Urban
no access to electricity 57.0 6.9
flooring made of earth/sand 41.9 7.1
using firewood for cooking 72.2 7.3
3 or more per bedroom 71.2 49.2
Gini coefficient 0.3 0.17

17
The situation stabilized substantially with the installation of the current president, Teodoro
Obiang Nguema Mbasogo, in 1979. The education system was a point of emphasis in his new
regime, as teachers were brought back into the system, new staff was hired, older schools were
rehabilitated, and new ones were built. A significant step was realized in 1981 with the passing
of the country’s first education law (Decreto Ley Nº 11 de Aprobación de la Ley General de
Educación).
In the period from 1979 through the mid-1990s there was considerable donor support in
the social sectors. By the late 1980s, official development aid (ODA) reached more than 50
percent of gross national income (GNI).18
In education, bilateral (Spanish, French) and
multilateral (United Nations Development Programme - UNDP, UNESCO) partnerships helped
create learning materials, provide school furniture, and train teachers. A new curriculum was also
approved in 1985, which served as a base curriculum for future additions.
With the discovery of oil and subsequent increase in national income from petroleum
exports, the donor presence (as a percentage of the overall economy) declined precipitously
in the 1990s. During this period, another significant milestone in the development of the
education system was the new education law passed in 1995 (La Ley de Educación no. 14/1995).
This created a five-level system, including: preschool (3 years and older), primary grades 1–5,
secondary school consisting of seven grades (‘cursos’) and exams at different stages (including
an entrance exam for higher education), a two-grade professional education program, and higher
education. The national university (Universidad Nacional de Guinea Ecuatorial - UNGE) was
created in 1995 as a result of the new law.
The current system is governed by the 2007 Education Law (Ley General de Educación no.
5/2007), which introduced two fundamental changes in the education system. First, the 2007
law codified education as a fundamental right for all citizens. And second, the law created a
new system modeled on international standards. The present system has four levels:
preschool, primary, secondary, and higher education. The main innovations and reforms
introduced by the new law include: a mandate for free preschool education in public education
centers, the extension of primary education from five to six grades; the introduction of the four-
grade basic secondary education and the two-grade Bachillerato (high school) with four different
branches of specialization; and the introduction of technical and professional training to address
higher standards of job training.
The education system in EQG is quite young. There have been fewer than 10 years to
institutionalize the updated features and accompanying goals of the 2007 law (summarized
below).
3.2.2. Education Sector Goals and Priorities
Discussions of goals and priorities in the education system begin with EFA, which is part of the
larger Millennium Development Goals (MDG). As described in Bivini Mangue’s (2015)
summary of the education component of the MDGs, EQG was the first country in Central
Africa to develop a National Plan for Education for All, which was approved by
18
Maroto Blanco 2014.

18
presidential decree in 2003. The overarching goal of EFA is to have universal primary
education completion by 2015.
To meet the EFA universal primary goal, the government has implemented a number of reforms.
These include guaranteeing that every community (and Consejo de Poblado) in the country has
access to a primary school, and creating a department within the MEC that focuses on special
education (Dirección General de la Educación Especial).
Education also occupies an important place in the National Agenda for Diversified Sources of
Economic Growth (Agenda Nacional para la Diversificación de las Fuentes de Crecimiento),
commonly referred to as Guinea Ecuatorial Horizonte 2020. The Horizonte 2020 Programa
Mayor Educación Para Todos provides a good overview of system-wide priorities and needs in
education, in addition to defining areas that are to be addressed through government actions and
partnerships.19
These goals include:
Universal coverage in preschool and primary education, and a 98 percent gross
enrollment rate in secondary education;
Improve the quality of education by insuring adequate teacher preparation, with a focus
on the primary level;
Eliminate gender discrepancies by reducing dropout rates among girls in primary and
secondary education, and improving higher education completion rates for young
women;
Adapt professional, technical, and higher education to the necessities of the labor market,
expand professional training to seven provincial capitals, and increase literacy rates to
above 75 percent among adults.
Efforts to attain EFA and Horizonte 2020 goals have been aided by a number of
partnerships with international organizations (United Nations), bilateral donors (U.S. Agency
for International Development - USAID, Spanish Government) and the private sector. These
activities have helped the government organize and coordinate different interventions, as well as
monitor changes, and have also addressed specific areas of need, such as preschool education
and teacher training.
One of the largest initiatives has been funded by the Hess Corporation, the Programa de
Desarrollo Educativo de Guinea Ecuatorial (PRODEGE) has operated in the country since
2006 (and will continue through 2019). PRODEGE is summarized in more detail later in the
diagnostic, but it is important to note that one of the priorities of PRODEGE was to improve the
measurement and monitoring of education indicators in the country. This is particularly relevant
in relation to sector goals, since these can only be assessed on the basis of specific indicators.
The annual reports (Anuarios) produced by a PRODEGE-government partnership have helped
address this need, although more information is needed.
19
Equatorial Guinea National Agency - ANGE, 2016.

19
In addition to EFA and Horizonte 2020 documents that detail specific system goals, information
on priorities was also gathered as part of the diagnostic in interviews with the MEC and other
government officials. Two priorities stand out. The first is cross-sectoral, and refers to the
importance of improving public administration of budgets. Achieving goals in sectors like
education is complicated by the lack of detailed action plans that clearly spell out budget needs
by activity, and are linked with outcome indicators for monitoring progress. There are substantial
risks associated with poor budget management, including ineffective spending, corruption, and
falling short of government spending targets (that is, unused money).
The second priority is related to education quality. There is a general recognition on the part
of education officials that much work remains to improve quality in the country. As
discussed in more detail in later sections, references to quality tend to focus on teacher
credentials and infrastructure indicators, as opposed to processes and student achievement
outcomes. Nevertheless, the better quality ‘message’ was clearly present in almost all discussions
with government officials, in central and district offices.
Overall, the GoEG goals and priorities in education are similar to those in many countries,
and revolve mainly around the joint challenges of expanding access (to attain goals like EFA
and higher enrollment rates in secondary) while also improving quality. It is easy to view these
as competing priorities that are vying for the same budget resources. But they are better viewed
as complementary actions, since research from around the globe has demonstrated that one way
to improve participation—and decrease things like school dropout rates—is to improve quality.
This in turn highlights the importance of budget management and the effective articulation of
system goals, and accompanying action plans, to maximize the utility of the resources that are
available. GoEG recognition of the importance of quality and coverage, and budget management
capacity, is therefore a critical step for moving forward.
These aspects are all the more important in the current context of economic crisis, which is likely
already having some impact on education outcomes while also putting downward pressure on
public resources for education and therefore running the risk of further exacerbating education
outcomes. In this context, it will be critical to protect and better prioritize scarce public resources
to maintain and improve education outcomes. This will also require an effective formulation of
education sector goals and reforms moving forward.
3.2.3. Education System Structure and Governance
Education Levels
There are four basic levels of the education in the system.
Preschool education is considered mandatory and free of charge in public centers, has its
own basic curricular structure and ranges from one to six years old divided into two
phases: infant education from one to three years old, and preschool education ranging from four
to six years.

20
Primary education, also considered mandatory and, under the new law, delivered free of
charge in public centers, has its own basic curricular structure and ranges from six to
twelve years old divided into two cycles: from six to nine years old entails grades 1, 2, and 3;
and from ten to twelve years old entails grades 4, 5, and 6. After completion of the primary
education a test is conducted to grant a Certification of Primary Studies upon approval, also
allowing the student to pursue secondary education. Alternatively, students not passing this test
can opt for technical and professional training.
Secondary education is considered voluntary and covers six years in total. It is divided into
two modalities, beginning with general secondary education that in turn contains two
cycles:
Basic Secondary Education known as ESBA (Educación Secundaria Básica) is four
years in duration and intended to be delivered from 13 to 16 years old. After
successful completion of ESBA, students will obtain a graduate certificate to continue
on to either Bachillerato (Bach) or to technical and professional training.
Bachillerato (Bach), has a two-year duration and is intended for 16–18-year-olds
comprising four different branches of specialization that students can opt for Science,
Humanities, Technology, and Arts. Upon successful completion of Bach, a certificate
is granted for graduates of general secondary education allowing them to continue on
to higher education in the National University, or access the advanced cycle of
technical and professional training.
To certify conditions to access the National University, students must also have orientation
courses and take a selectivity test (formerly called maturity test) that, if approved, enables them
to enroll in a university program.
The second modality is technical and professional training, which is intended to deliver job
training to students of up to 19 years of age. Programs for these modalities will be designed by
the MEC in collaboration with other sectorial ministries and specialized private institutions. In
practical terms this inter-ministerial collaboration and coordination is relatively low. It contains
two cycles:
A basic two-year cycle for obtaining the diploma on Auxiliary Technician, intended for
students who completed ESBA.
An advanced two-year cycle offering a diploma in Officer Technician, offered to students
who either completed the first basic two-year cycle or Bachillerato, but not the selectivity
test. This modality of secondary education is intended to be delivered for students up to
19 years of age and is offered in National Institutes of Professional Education.
Currently there are two professional training centers delivering programs in Malabo and Bata
under the scope of the Ministry of Labor and Social Security, with an estimated 2,400 persons
graduated in 2015. There are plans underway to enlarge this offer creating one National Institute
in all province capitals.

21
Higher education is currently delivered exclusively in the National University of Equatorial
Guinea (UNGE) to students who passed the selectivity test, and students who passed the
advanced two-year cycle of technical and professional training. The higher education system
introduced in the 2007 law considers a pedagogic architecture of three levels: Bachelor’s,
Master’s, and PhD known locally as the LMD system for its initials in Spanish (Licenciado,
Master y Doctorado).
Following this LMD structure, higher education contains three cycles: an initial four-year cycle
aiming at obtaining a Bachelor’s degree (known locally as Licenciatura; faculty of medicine
entails a five-year program); a second cycle of two additional years aiming at specializing
professionals obtaining Master’s degrees; and a third cycle of three more years, intended to
prepare a body of professors and advanced researchers, obtaining PhD degrees. Currently, there
is no offering of Master’s and PhD programs.20
Table 3.2 summarizes the education levels and modalities and includes current enrollment
figures for each level, based on the statistical yearbook for the 2014–15 school year.
Table 3.2. Education Levels, Modalities, and Enrollment Figures (2014–15)
Level Enrollment Modality Age
Higher Education
n/a PhD (3 years) n/a
n/a Masters (2 years) n/a
7,971 Licenciado (4 years) n/a
Secondary
Education
n/a University orientation
course (1 year)
Advanced technical and
professional training (2 years) 18–19
7,941
(Bachillerato) Bachillerato (2 years)
Basic technical and
professional training (2 years) 17–18
27,027 Basic secondary education (4 years) 13–16
Primary Education 36,481 2nd cycle: grades 4–6 (3 years) 10–12
56,915 1st cycle: grades 1–3 (3 years) 7–9
Preschool Education 39,596 Preschool (3 years) 4–6
2,512 Childcare (3 years) 1–3
Source: Programa de Desarrollo Educativo de Guinea Ecuatorial (PRODEGE)/MEC Anuario (2015–16); Ley
General de Educación No. 5/2007.
Complementary Education Modalities
In addition to preschool, primary, secondary, and higher education, other modalities are
considered in the Education Law, including: Permanent Training and Adult Literacy Education,
Long Distance Education, and Special Needs Education. In practical terms these programs are
not systematically coordinated and conducted, are delivered by a multiplicity of public and
private institutions, and are not regulated by a central authority (although there is limited
information available to provide a more detailed assessment).
20
Title two of the new law establishes the requirements and procedures to register and accredit (homologar) foreign
diplomas assigning to students the initiative in presenting the request to the MEC. A special commission has been
created to study each case and validate it accordingly.

22
Permanent Training and Adult Literacy includes job training oriented toward the
improvement of job skills and studies equivalent to primary and secondary education for
adults. The MEC is responsible for the approval and supervision of all programs related with
this modality, however its implementation can be considered as decentralized in the sense that
the 2007 law empowers a variety of institutions—public, private, nongovernmental organizations
(NGOs), and non-profit organizations—to implement these programs. Currently, adult literacy
programs are entirely undertaken by the Ministry of Social Affairs and Gender Equality (MASIG
for its initials in Spanish) and framed under the Education for All (EFA) policy framework.
Recipients of permanent training and education for adults programs are mainly young people left
behind by the formal system; teachers of preschool, primary, and secondary levels specifically
trained for these purpose; unemployed adults; and specific industries’ and institutions’
employees.
The Long Distance Education modality follows every aspect of the four basic levels of
regular education, but is specifically designed for people unable to participate in a regular
education center in regular conditions. This type of education is targeted mainly in dispersed
and rural communities.21
Finally, Special Needs Education is intended for students that are not able to attend a
regular education center or follow the regular schedules because of a physical or cognitive
disability, and as a result are unable to achieve the common objectives of each of the basic
education levels. Currently the approach for developing this type of education is to train a
specific body of teachers to reach out to students with special needs once they are identified and
targeted by a given education center. A 2015 UNESCO study found that 0.4, 0.5, and 0.1 percent
of the primary enrollment reported visual, auditory, and motor difficulties, respectively.
System Governance
The general management of the entire education system is assigned to the MEC. Its
principal functions include: propose education policies and programs; approve curricular
programs; create and manage public education centers and approve and regulate private centers;
coordinate and stimulate different social and economic stakeholder efforts; and issue and accredit
diplomas and certifications. The organization chart of the ministry features a highly centralized
system:22
Government Members: Minister, Deputy Minister, Secretary of State
Technical Bodies: Office of the General Secretary; General Directorate of Preschool and
Primary Education, General Directorate of Secondary Education, General Directorate of
Higher Education, General Directorate of Technical and Professional Education; General
Directorate of Planning and Education Development; General Directorate of Education
for All; Office of the General Inspector
21
Razquin 2006. 22
World Bank 2010.

23
Consultative Body: Administrative Council
Autonomous Entities: National Commission for Cooperation (UNESCO), National
Commission for Diplomas and Certification Authentication, National University of
Equatorial Guinea - UNGE
Education centers can be public or private. According to the most recent statistical yearbook
(2014–15), there are 761 preschool centers, 802 primary education centers, and 137 secondary
education centers. Despite having more public than private centers, the actual number of students
enrolled in preschool, primary and secondary education shows that education in EQG is mainly
privately delivered (Table 3.3).
Table 3.3. Education Centers and Students - School Year 2014–15
Source: PRODEGE/MEC Anuario 2014-15.
Education center management involves both individual and collegiate bodies (see Figure 3.2).
School councils, made up of students, teachers, parents, administrative staff, and representatives
from the local political authority, guarantee the participation of the communities served by the
centers. Steering councils are composed of the managerial staff plus a teacher representative.
Discipline councils, made up of managerial staff in charge of discipline matters, plus students
and teachers, are keepers of the school environment and are responsible for stakeholder relations.
Finally, education departments are technical organs aimed at unifying and coordinating criteria
and action of given teaching areas.
CENTERS Students CENTERS Students
SECONDARY EDUCATION 37 12,459 100 22,509 137 34,968
PRIMARY EDUCATION 556 38,604 246 54,792 802 93,396
PREESCHOOL EDUCATION 547 17,588 214 24,520 761 42,108
TOTAL
CENTERS
PrivatePublic TOTAL
STUDENTS

24
Figure 3.2. General Structure of Management Bodies of Education Centers
Source: Ley General de Educación No. 5/2007.
At the primary level, public centers are entirely under the jurisdiction of the MEC, with
supervision conducted through the body of inspectors. Public centers cover the four basic
levels of education in all its modalities. Centers delivering primary education are in three
categories depending on size: unitary schools, currently 134 centers, delivering grades 1 and 2;
graduated schools, currently 225 centers, delivering grades 1, 2, and 3; and national schools,
currently 443 centers, delivering the six grades.
Public secondary centers are divided into three categories depending on the modality of
education they deliver: National Institutes of secondary education are responsible for ESBA
and Bach; National Institutes of Technical and Professional Training are responsible for
delivering job training to students not pursuing a university program; and special education
centers.
The only public higher education center is the National University of Equatorial Guinea
UNGE. The law gives UNGE higher levels of autonomy to define its own methods, evaluation
mechanisms, and management arrangements, adopted on a singular and particular body of
statues that must be formulated and approved with the concurrence of the MEC. As for the
higher education centers, the Dean and Deputy Dean are the highest authorities appointed
directly by the President of EQG, accompanied by an administrative manager appointed by the
Minister of Education and Science. Also the university can create a social council to enable and
channel the participation of society.
Private centers are more independent from MEC in the sense that they have pedagogic
autonomy to adopt and implement programs, methodologies, and management systems;
Education Centers
Individual
Director
Deputy Director
Secretary
Programmatic Director
Discipline Director
Collegiate
School Council Steering Council
Discipline CouncilEducation
Departments

25
however, private education institutions must comply with approval, supervision, and
control from the MEC. The law authorizes transfers from the public budget to private
institutions by request. In practical terms there are several annual transfers and investment
projects to private centers. As an example, almost all Catholic private centers are integrated in
the Association of Catholic Education Center of EQG (ACCEG as known in Spanish), which is a
clerical organism with a long-standing tradition in the country. These centers are partially funded
with a regular transfer from the public budget and cooperate with the ministry and other donors.
The transfer approved in the 2016 budget law to ACCEG is of CFAF 2,000 million.
Teaching Staff
Minimum standards for teaching staff are based on the following criteria:
Preschool and primary school teachers: Certificate of a diploma degree course in
preschool or primary education from UNGE (or equivalent)
ESBA teachers: Certificate of a diploma degree course from UNGE
Bach teachers: Certificate of a university program degree in the level of Licenciatura
Higher education teachers: Certificate of a university program degree in the level of
Licenciatura, Master’s, or PhD
Historically, the total number of teachers at each level has been insufficient to cover the
demand, especially considering the construction of new infrastructure, and the implementation
of free (and mandatory) education since 1985. As a countermeasure, the government has
recruited young volunteers without any standardized or minimum training, which in turn requires
new in-service training programs. In part to attend to this new group, UNGE created two
different modalities of specialization, primary and preschool diploma programs, in the Faculty of
Education.
Teacher qualification levels are low, especially in preschool and primary. According to the
latest statistical yearbook (2014-15), there are 2,140 preschool teachers, of which 5.8 percent
have the minimum or above the required standard; 4,021 primary teachers, of which 54 percent
reach the minimum or above the required standard; and 2,119 secondary teachers, of which 69
percent acquired a university program degree and 16 percent a certificate of diploma degree. Of
the high education 731 teachers, 19 percent have Master’s degrees level or above (see Table 3.4).

26
Table 3.4. Total Number of Teachers by Level and Education Level, (2014–15)
Source: PRODEGE/MEC Anuario 2014–15; Ley General de Educación No. 5/2007, and
http://unge.education/main/.
The teaching staff include a mix of public official and external contractors. The latter group
is widely used by education centers; however, there is a notable lack of details about this sector.
According to information from structured interviews (July 2016), it is a common practice that
both staff and contractors are appointed at the same time to technical positions in a given
ministry or autonomous entity, which can complicate the delivery of timely and complete
educational programs. It is also common practice to have substitute teachers back up formally
hired (‘official’) teachers based on less formal arrangements with the MEC, its regulations and
supervising institutions.
The MEC is responsible for hiring, evaluating, and promoting the teaching staff according
to the systems established. The system lacks a systematic assessment instrument (other than the
inspectorate) and directors of public education centers have no mechanisms to hire, evaluate, and
promote the teaching staff based on performance. This institutional architecture leaves a quality
‘vacuum’ and the lack of autonomy and accountability regarding teacher management is part of a
more general set of concerns about quality in the country.
Auditing System
Technical inspectors housed in the MEC are responsible for assessing standards and
performance of the public school centers. The bureaucracy of this technical inspection allows
it to reach virtually every education center in the country.
One of the purposes of this diagnostic is to provide an update of available education data, which
includes the 2014–15 Anuario and the 2011 Equatorial Guinea DHS (EDSGE-I). The most
recent indicators are useful for assessing the current state of education in the country, including
any effects of the crisis, while the updated trends analysis makes it possible to track progress
going back to the beginning of the Anuarios (2007–08), and in some cases farther back.
Comparisons with countries in the region and/or with similar GDP provide additional
information.
3.3.1. Education Indicators and Trends
Preeschool % Primary % Secondary % Higher %
PhD 44 6%
Master 95 13%
Graduate 29 1.4% 456 11% 1,454 69% 546 75%
Diploma 96 4.5% 1,703 42% 335 16% 46 6%
Other 2,015 94.2% 1,862 46% 330 16%
Total 2,140 4,021 2,119 731

27
One key positive feature of the basic education system is that very few young people in
EQG have never entered school23
and most are remaining in the school system for 10 years
or more. This is not always the case in the developing world, as many systems struggle with
problems such as children who never enter school or begin leaving school at age 12 (or earlier).24
What this means is that Equatorial Guinean children are able to devote a significant amount of
time to their educational development.
However, high repetition rates contribute to severe imbalances in enrollment across grade
levels. As of 2015, grade 1 students outnumbered grade 6 students by more than two to one.
Although repetition rates for grade 1 have decreased over the past decade, still a full quarter (25
percent) of all first graders repeat the grade (in 2014-15) and repetition rates for grades 2–5
remain at 10-20 percent. The total enrollment in grades 1-3 of the primary cycle is nearly equal
to the total enrollment of the entire basic education system after grade 3. When dropout rates are
fairly low, this kind of imbalance is only possible if large numbers of students are repeating
multiple times, but remaining in school.
The underlying problem with basic education is therefore easily summarized: an extremely
low efficiency rate in primary education. This is hardly a new finding, as PRODEGE focused
on reducing high repetition rates as part of its original (PRODEGE I) plan of action. The
consequences of low efficiency are multiple: high gross enrollment rates in primary grades, low
net enrollment rates in secondary, and severe imbalances in enrollment across grade levels,
which potentially complicates teacher staffing and development. And unfortunately, the high net
enrollment rate in primary is somewhat misleading, since relatively few of these children are in
the correct grade for their age.
Gross and Net Enrollment Ratios (GER, NER)
Gross and net enrollment ratios are critical data
points for evaluating systemic performance,
defining priorities, and preparing plans for the
future. The annual statistical summaries in EQG
provide, in theory, up-to-date information on
enrollment by school level, in addition to age-
specific breakdowns. These are necessary pieces
to construct GERs and NERs by level.
However, the Anuarios have no way of
estimating total populations of school-age
persons, which can only be obtained definitively
through a census.
Preschool net enrollment in 2015 was 42 percent,25
but this is concentrated largely in urban
areas, suggesting that rates are very low in rural areas.
23
At the time of the 2011 DHS. 24
See recent research on Out-of-School Children; UNICEF and UNESCO 2015. 25
UIS, 2015.
Gross enrollment ratio (GER)
The number of children enrolled in a level (primary
or secondary), regardless of age, divided by the
population of the age group that officially
corresponds to the same level.
Net enrollment ratio (NER)
The number of children enrolled in a specific level of
school who belong to the age group that officially
corresponds to that level, divided by the total
population of the same age group.

28
Primary GERs and NERs declined after 2002, with little change between 2008 and 2015,26 but
the figures differ by data source (Box 3.1 addresses the discrepancies in GER and NER
estimations in Figure 3.3). According to the 2011 DHS, GER and NER (see box within Figure
3.3) are much higher: the primary GER in 2011-12 was nearly 140, while the NER was 86.8.
Figure 3.3. Summary of Primary NER and GER, 2000–2015
Source: UIS, various years; EDSGE-I (DHS), 2011.
EQG has some of the lowest gross and net enrollment ratios compared to other countries in SSA
(see Figure 3.4 and Figure 3.5).
26
The figures for primary gross and net enrollment rates are obtained from the s UIS webpage, with one exception:
for the 2011-12 school year the GER and NER based on the DHS data are also shown.
Box 3.1 NER, GER and Data Accuracy
What explains the discrepancies in GER and NER estimations in Figure 3.3? The problem is the population
numbers for 7–12-year-olds that are used to construct these measures. The UNESCO (UIS) website includes
population figures for primary- and secondary-age children by year, which were last available as part of the
2001 census. Assuming that the education enrollment figures are correct in 2000 and 2002, the GER and NER
for those years will be very reliable. But in the years after 2002 the enrollment ratios can only be calculated on
the basis of population projections forward from the 2001 census, and given the decline in GER and NER
rates after 2002, it seems likely that there are some problems with the population denominators used in the
calculations. As a result, the GER and NER numbers based on ‘official’ data sources (that is, Anuario
enrollments compared against projected populations) appear to significantly understate education
coverage, especially since 2002.
How accurate are GER and NERs based on the 2011 DHS (EDSGE-I)? In general, household survey data
sources are considered to be reliable for measuring GERs and NERs. In the case of the 2011 DHS, the sample
was based on clusters of households (5,000 in total) drawn from 200 of the roughly 1,000 communities in the
country; this is a very large sample in relation to the entire population. Therefore, the 2011 DHS estimations
are the best, most recent estimations available for GER and NER. What is less clear is how these ‘current’
(as of 2011) rates compare with earlier periods, since the data sources are not consistent.

29
Figure 3.4. Comparison of Primary School GER
Source: UIS.
Figure 3.5. Comparison of Primary School NER
Source: UIS.
EQG also shows a low NER given its GDP per capita. Its NER is significantly lower than
countries with similar GDP per capita and some others with lower GDP per capita (see Figure
3.6).
0
20
40
60
80
100
120
140
160A
ngo
la
Sou
th S
ud
an
Sud
an
Nig
er
Mal
i
Equ
ato
rial
Gu
inea
Sen
ega
l
Tan
zan
ia
Bu
rkin
a Fa
so
Gu
ine
a
Gam
bia
Cô
te d
'Ivo
ire
Lib
eri
a
Nig
eria
Eth
iop
ia
Sou
th A
fric
a
Zim
bab
we
Ch
ad
Uga
nd
a
Mau
rita
nia
Mau
riti
us
Zam
bia
Leso
tho
Mo
zam
biq
ue
Bo
tsw
ana
Ken
ya
Gh
ana
Nam
ibia
Swaz
ilan
d
Cam
ero
on
Togo
Bu
run
di
Sier
ra L
eon
e
Ben
in
Rw
and
a
Mal
awi
Mad
agas
car
0
20
40
60
80
100
120
An
gola
Sou
th S
ud
an
Lib
eri
a
Equ
ato
rial
Gu
inea
Mal
i
Nig
er
Bu
rkin
a Fa
so
Sen
ega
l
Gam
bia
Gu
ine
a
Tan
zan
ia
Ch
ad
Cô
te d
'Ivo
ire
Mau
rita
nia
Leso
tho
Swaz
ilan
d
Uga
nd
a
Eth
iop
ia
Zim
bab
we
Zam
bia
Nam
ibia
Mo
zam
biq
ue
Bo
tsw
ana
Gh
ana
Cam
ero
on
Bu
run
di
Togo
Ben
in
Mau
riti
us
Rw
and
a
Sier
ra L
eon
e

30
Figure 3.6. NER by GDP Per Capita
Source: UIS (for NER); World Development Indicators (for GDP per capita).
At the preschool level, all 18 districts in the country report preschool enrollment, with a large
proportion (35 percent) in Malabo, followed by Bata district (20 percent). Seventy-five percent
of preschool enrollment is urban, although this is again affected especially by Bata district,
which is entirely urban.
At the primary level there are high GERs across all four strata. The highest GER (in 2011) is
found in the rural zones of the Insular region (nearly 150 percent). Primary NERs are between 60
and 86 percent, depending on the data source used, with a relatively low NER in rural areas of
the continent. In secondary school (ESBA), GERs and NERs diverge considerably: the average
GER is about 88 percent, compared with only 35 percent NER. Unlike in primary, there is also a
lot of variation between strata at this level, which likely reflects the limited access to ESBA in
rural areas (see Figure 3.7).
[CELLRANGE]
[CELLRANGE]
[CELLRANGE]
[CELLRANGE]
[CELLRANGE]
[CELLRANGE]
[CELLRANGE]
[CELLRANGE]
[CELLRANGE]
[CELLRANGE]
[CELLRANGE]
[CELLRANGE]
[CELLRANGE]
[CELLRANGE]
[CELLRANGE]
[CELLRANGE]
[CELLRANGE]
[CELLRANGE]
[CELLRANGE]
[CELLRANGE]
[CELLRANGE]
[CELLRANGE]
[CELLRANGE]
[CELLRANGE]
0
20
40
60
80
100
120
0 2000 4000 6000 8000 10000 12000 14000 16000 18000
NER
GDP per capita

31
Figure 3.7. NERs and GERs by School Level and Strata, DHS 2011
Source: EDSGE-I (DHS), 2011.
Main findings:
1. The very high GERs in primary and urban ESBA strata likely mean that a large number
of overage children are enrolled in these levels. There are two main sources of overage
children: late entry into primary school, and grade repetition.
2. The relatively high net enrollment rate in primary school is encouraging, and is likely a
result of new infrastructure investments, and sector-wide education improvement
programs such as PRODEGE. However, it is likely that many of these children in
primary are not in the correct grade for their age.
3. There is work that remains to improve participation in preschool and secondary levels, as
well as reduce the gaps between urban and rural areas in post-primary schooling. These
are common challenges in basic education throughout the developing world, and the
government and education partners are well aware of them.
The results in this section highlight two pressing needs going forward. First, the national
census data from 2015 are needed to update the gross and net enrollment calculations using
the most recent Anuarios from 2014-15 and 2015-16 (when complete). Also, it may be
possible to interpolate between the 2001 and 2015 census numbers to obtain new projections by
age group that could then be used with previous Anuario summaries to update the GER and NER
estimations across the entire 2008-2015 period. However, as of this date, these population
estimates have not been released.

32
The second critical input is accurate data via the Anuario data generation process.27
As is
generally the case with administrative data (often referred to as Education Management
Information System, or EMIS), there are some potential issues with quality. PRODEGE-MEC
staff working on the Anuarios indicated in interviews that their main problem is obtaining
complete information from all schools. They are confident that virtually all of the schools in the
country are returning the information sheets, but not all of the information fields are complete.
This then requires following up with the schools, which can be difficult. This issue is returned to
later on in the review of the Anuario data collection system.28
Enrollment Trends
Trends in enrollment over time provide another way of assessing overall system performance.
Figure 3.8 shows a summary of preprimary, primary, and secondary enrollment totals between
1999 and 2015. For 2008–15, the data are taken from the corresponding statistical Anuarios,
while the pre-2005 data are obtained from the UIS webpage. Also, the Anuarios only report
secondary-level data in the 2011 and 2015 reports, so the trend analysis at this level is fairly
limited.
Figure 3.8. Preprimary, Primary, and Secondary Enrollment Totals, 1999-2015
Source: UIS; PRODEGE/MEC Anuarios, various years.
27
The best way to assess administrative data accuracy is to compare official numbers of enrolled children against
other data sources, including household survey data. Unfortunately, no such comparisons are currently possible. The
2011 DHS (EDSGE-I) uses normalized weights, which means that it is not possible (with existing data files) to
obtain raw numbers of children who are reported as being enrolled in school, which in turn rules out comparing raw
numbers in DHS versus enrollment numbers in the Anuario for the 2011-12 school year. Furthermore, even if it
were possible to obtain raw numbers of children by age from the DHS 2011, these numbers would presumably be
based on much earlier population projections, which may no longer be accurate. These issues with normalized
weights and uncertain underlying population projections are not unusual in DHS (and other household survey)
analyses in developing countries. 28
Rodriguez 2012.

33
Primary and preprimary enrollments have been steadily growing since 2003; for secondary
the trend is not as complete, but there has clearly been some expansion since 1999. Preprimary enrollments experienced a particularly rapid period of growth between 2005 and
2008, which corresponds to the PRODEGE I period, although in recent years they have leveled
off. Secondary enrollment data are only available since the 2010-11 school year Anuario, and at
the time of the 2014–15 Anuario the total secondary enrollment (ESBA and Bachillerato) was
about 34,000 students.
The generally upward enrollment trends are encouraging in the sense that they suggest that the
system is growing, notwithstanding the recent crisis, which is important since the population of
young people is growing as well. However, enrollment in primary school does not appear to have
steadily increased over the last 25+ years. In fact, there was a small decrease between 2012 and
2015 (see Figure 3.3), which, given the increase in population of children, may indicate that the
crisis is having some impact on school enrollment.
Primary enrollment is concentrated in the two largest provinces (Litoral and Bioko Norte), home
to the largest cities in EQG. Figure 3.9 summarizes primary enrollment totals by province
according to the 2008-09 and 2013-15 Anuarios. Enrollment in these two provinces at the
time of the 2014-15 Anuario represented nearly 75 percent of the entire primary system.
Also, these are the only two provinces where substantial increases in primary enrollment took
place between the 2008-09 and 2014-15 school years. Wele-Nzas also recorded a somewhat
small increase, but in the other four provinces the total enrollment actually declined. We cannot
rule out that the crisis had stronger effects outside of Litoral and Bioko Norte leading to lower
enrollment.
Figure 3.9. Primary Enrollment by Province, 2009-15
Source: PRODEGE/MEC Anuarios, various years.
Since 2000, there has been a large decline in enrollment between grades 1 and 6; as of 2015,
grade 1 students outnumbered grade 5 students by more than two to one. However, this gap has

34
been shrinking as the number of grade 1 students remains steady, while enrollments are
increasing in all other grades (see Figure 3.10). There is still the problem of ‘bunching up’ in
grade 1, which appears to be mainly a result of grade repetition. Furthermore, in comparison with
the pre-PRODEGE period data from 2000, the primary enrollment profile has improved
considerably (that is, it has become more equal across grades). For example, in 2000 the grade 1
enrollment accounted for roughly 50 percent of the entire primary enrollment, whereas by 2015
this proportion had fallen to about 25 percent.
Figure 3.10. Primary Enrollment by Grade 2000-15
Source: PRODEGE/MEC Anuarios, various years; UIS.
These enrollment distributions indicate the challenges facing the system. Despite steady
improvement, the imbalance in enrollment between the earliest primary grades and later primary
and secondary grades is notable. Ideally, the goal of the system should be enrollment summaries
that are relatively flat from the earliest grades through the highest and across boys and girls.
The steady growth in preschool participation is a positive development for the entire sector,
however it is critical that this level of schooling provides quality preparation for young
people. Quality preschool is the best way to prepare young people for primary school, which in
turn should reduce repetition and dropout rates. However, based on the education profiles of the
preschool teachers, there are reasons to be concerned about quality. This has also been addressed
as part of PRODEGE, and is a point of emphasis for the MEC.
Age Profiles and Age at Entry
Very few young people in EQG—at the time of the 2011 DHS—had never entered school. For example, among 10-year-olds, less than 3 percent had never attended school, and this figure
was even lower among 9-year-olds (see Figure 3.11). This shows that the education system has
achieved a near-universal opportunity to learn, as measured by having a primary school to enroll
in, a critical first step in achieving EFA goals.

35
Figure 3.11. School Attendance Status by Age (6-10), 2011 DHS
Source: EDSGE-I (DHS), 2011.
Note: The status variable includes five categories: 1) never attended school; 2) attended school but
has dropped out; 3) currently in preschool; 4) currently in primary grade 1; and 5) current in
primary grade 2 or higher. Never attending school is not directly measured in the 2011 DHS with
a question such as “Has the person ever attended school?” Instead, never attended school is
derived by combining the variables that measure grade attainment and current attendance. When
the person has “No education”, and is not currently attending school, they are classified as “Never
attended.” For young people this is likely to be accurate, but for older individuals it may miss
people who have entered school but never completed first grade.
Most children begin their primary education on time (or earlier). There is little overage
enrollment in preschool; only 13 percent of seven-year-olds and 5.3 percent of eight-year-olds
reported being in preschool at the time of the 2011 DHS. Furthermore, early entry into primary is
quite common. One-third (32.5 percent) of grade 1 entrants in 2014-15 were below seven years
of age, while only about 15 percent were older than eight years (see Figure 3.12). Early entry is
even more common in the Insular zone: 41.8 percent of grade 1 entrants in 2014-15 were under
seven.

36
Figure 3.12. Age of Primary Grade 1 New Entrants by Zone, 2014-15
Source: PRODEGE/MEC Anuario, 2014-15.
This helps explain the high GER in primary at the time of the 2011 DHS: a large number of
children who are below the official primary school age were enrolled in primary school, which
increases the gross enrollment figure. EQG’s official grade 1 entrance age of seven years (rather
than 6) means this is more likely. Under-age enrollment could contribute to repetition in grade 1
because children are not ready for school, contributing to inefficiency in the system and higher
fiscal costs.
There are many overage children in primary school. At the time of the 2014-15 annual report,
a majority of children in grades 3 and 6 were overage, including nearly 75 percent in grade 6 (see
Figure 3.13). For example, in 2008 only 39 percent of grade 1 students were at or below the
correct age (7). In 2014-15 this proportion had increased to nearly 60 percent. This, too, causes
inefficiency.

37
Figure 3.13. Student Age Categories in Primary Grades 1, 3, and 6, 2008-15
Source: PRODEGE/MEC Anuario, 2014-15.
Note: The overage enrollment rates are high compared to countries with similar per capita GDP (see Figure
3.14 and Figure 3.15) and other countries in SSA. This is particularly notable when looking at the
percentage of children who are at least two years overage for their current grade (see Figure 3.16 and
Figure 3.17).
Figure 3.14. Overage Enrollment in Primary Compared to GDP Peers
Source: UIS, latest available data.
1.1
3.2 3.2
7.3
9.3
13.2
22.6
0
5
10
15
20
25
Lithuania Latvia Oman Chile Argentina Uruguay EquatorialGuinea
Per
cen
tage
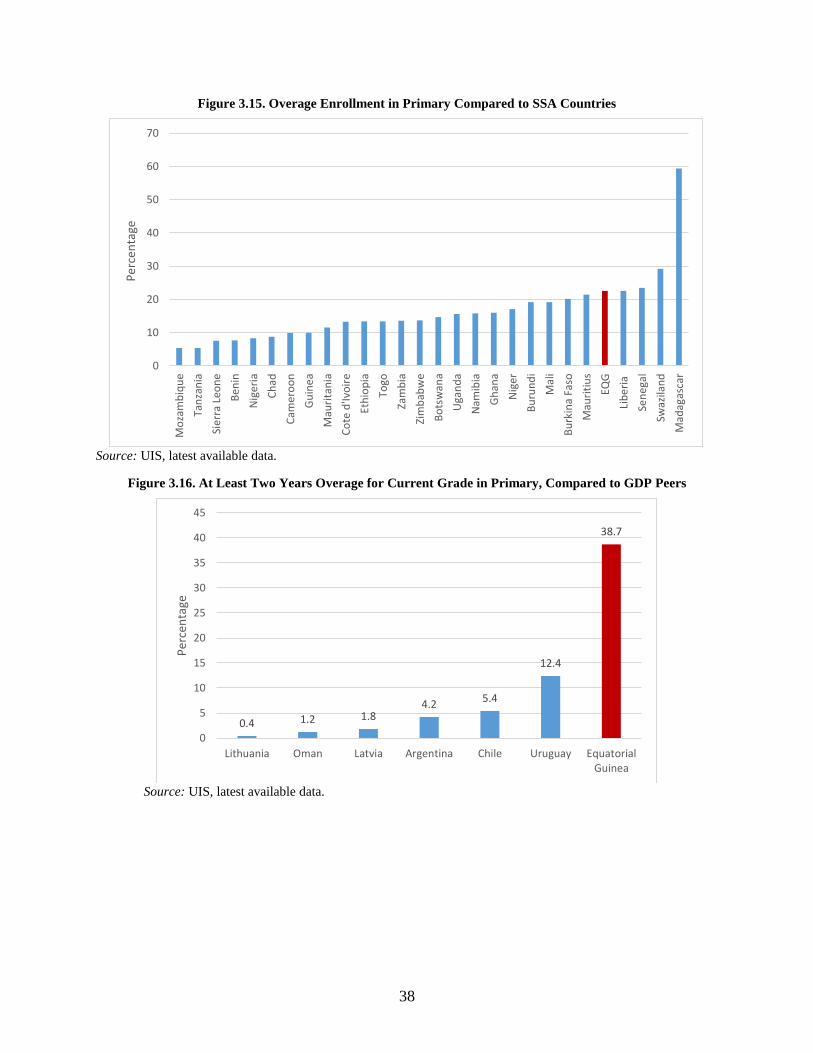
38
Figure 3.15. Overage Enrollment in Primary Compared to SSA Countries
Source: UIS, latest available data.
Figure 3.16. At Least Two Years Overage for Current Grade in Primary, Compared to GDP Peers
Source: UIS, latest available data.
0
10
20
30
40
50
60
70
Mo
zam
biq
ue
Tan
zan
ia
Sier
ra L
eon
e
Ben
in
Nig
eria
Ch
ad
Cam
ero
on
Gu
ine
a
Mau
rita
nia
Co
te d
'Ivo
ire
Eth
iop
ia
Togo
Zam
bia
Zim
bab
we
Bo
tsw
ana
Uga
nd
a
Nam
ibia
Gh
ana
Nig
er
Bu
run
di
Mal
i
Bu
rkin
a Fa
so
Mau
riti
us
EQG
Lib
eri
a
Sen
ega
l
Swaz
ilan
d
Mad
agas
car
Per
cen
tage
0.4 1.2 1.8 4.2
5.4
12.4
38.7
0
5
10
15
20
25
30
35
40
45
Lithuania Oman Latvia Argentina Chile Uruguay EquatorialGuinea
Per
cen
tage

39
Figure 3.17. At Least Two Years Overage for Current Grade in Primary, Compared to SSA Countries
Source: UIS, latest available data.
Grade Repetition and Dropout
High repetition rates are a well-known problem in EQG, as demonstrated in the statistical
Anuarios and in the goals of educational programs like PRODEGE. The very high averages in
grade 1 stand out, although it is important to note that they have come down from 35 percent in
2002 to just under 25 percent in 2014-15 (see Figure 3.18). PRODEGE focused on reducing
grade 1 repetition, primarily through improved training of grade 1 teachers, focusing on
appropriate pedagogy to teach reading, writing, and math and support mechanisms to teachers to
help them implement new strategies. It is encouraging to see the decline in grade 1 repetition
between 2008 and 2011; nevertheless, roughly one-quarter of grade 1 students were still
repeating the grade in 2014-15. And the repetition problem is not only a problem in grade 1, as
the averages are in the 10-20 percent range in grades 2-5 of primary, with only some
improvement in recent years. The repetition rate in EQG is also high compared to countries with
similar GDP and other African countries (see Figure 3.19 and Figure 3.20).
0
10
20
30
40
50
60
Mau
riti
us
Nig
er
Un
ited
Re
pu
blic
of
Tan
zan
ia
Sen
ega
l
Ben
in
Gu
ine
a
Cam
ero
on
Mal
i
Togo
Bo
tsw
ana
Sier
ra L
eon
e
Zim
bab
we
Co
ngo
Cô
te d
'Ivo
ire
Eth
iop
ia
Nam
ibia
Gam
bia
Zam
bia
Sud
an
Bu
run
di
Leso
tho
Uga
nd
a
Mal
awi
Rw
and
a
Bu
rkin
a Fa
so
Equ
ato
rial
Gu
inea
Mo
zam
biq
ue
Mau
rita
nia
Swaz
ilan
d
Per
cen
tage

40
Figure 3.18. Primary Repetition Rates by Grade, 2002-15
Source: PRODEGE/MEC Anuarios, various years; UIS.
Figure 3.19. Repetition Rate in Primary Compared to GDP Peers
Source: UIS, latest available data.
[CELLRANGE]
[CELLRANGE]
[CELLRANGE] [CELLRANGE] [CELLRANGE]
[CELLRANGE]
[CELLRANGE]
0
2
4
6
8
10
12
14
16
18
20
13,000 13,500 14,000 14,500 15,000 15,500 16,000
% r
epet
itio
n
GDP per capita

41
Figure 3.20. Repetition Rate in Primary Compared to Selected African Countries
Source: UIS, latest available data.
The most commonly cited reason for failing a grade is that the child has not demonstrated
a sufficient knowledge of the intended curriculum for that grade. This highlights the
importance of measuring and monitoring student achievement levels, both in the classroom as
part of the teacher’s formative assessments, and at the systemic level through standardized
testing. Little information is available about both of these dimensions of assessment. It is also
important to recognize that grade repetition has a structural component, and acts as a filter for a
system where access to higher levels of schooling may be restricted. This is not to say that
children are being unfairly held back, but one potential way to improve student flows in lower
levels is to continue to improve the supply of schooling in higher levels.
The high repetition rate in grade 1 helps explain the bunching up of students in this grade
level. In most countries, a decline by grade across the basic education system (demonstrated
earlier in Figure 3.6) would be a result of school dropout. Unfortunately, school dropout rates in
EQG are difficult to estimate on the basis of administrative data (like the Anuarios),29
and in
household surveys like DHS.30
Dropout rates in EQG are highest at the beginning of each school level (see Figure 3.21). For
example, roughly 8-10 percent of students enrolled in primary grade 1, ESBA 1 and Bachillerato
1 in 2010-11 did not continue their schooling in 2011–12, based on the Anuario estimation. This
is not an unusual result. In grade 1, children with physical or other problems may struggle to 29
There is an inherent difficulty of measuring dropout rates on the basis of administrative data. In some grades the
dropout rates are actually negative, which means that more children entered the following grade in 2011–12 than
were enrolled in the previous grade in the previous year. When dropout is more likely to take place between school
years, rather than during the school year, it can only be estimated rather than measured directly. This is a common
problem faced by data collection staff such as MEC/PRODEGE. 30
The 2011 ESDGE-I (DHS) is missing two variables that are useful for measuring dropout accurately, and are
often available in DHS data collections. One is a summary variable that includes a category for dropout, as well as
when the dropout took place (last year, two or more years ago, and so on). Another is a summary of the child’s
educational status in the previous year, which can be useful to measure year-on-year dropout.
0
5
10
15
20
25

42
learn, and eventually drop out before completing the grade. In higher levels the transition to a
more demanding curriculum—and in many cases a very different school environment (that is,
much larger, multiple teachers, and so on)—can be difficult for some children. The usual
sequence is to repeat the grade, perhaps several times, before eventually leaving. Students are
also dropping out after other grades in the primary and (especially) secondary sequence, but
these rates appear to be generally lower than those in the first year of each cycle.
Figure 3.21. Dropout Rates by Grade, 2010-11/2011-12
Source: PRODEGE/MEC, 2010-12 Anuarios.
The main reasons for dropout during the school year were sickness, lack of a teacher, and lack of
money to pay for studies (see Table 3.5). In about 40 percent of the cases the dropout is not
actually dropout, but is transferring to another school.
Table 3.5. Summary of Reasons for Leaving School during the 2003-04 School Year
Grade
1st 2nd 3rd 4th 5th Total
Illness 622 536 505 432 753 2848
Lack of mentoring 384 219 142 154 68 967
Lack of resources 103 55 73 59 67 357
Work 34 35 10 60 144 283
Transfer to other center 1233 684 402 647 284 3250
Distance to closest
school 69 35 65 7 11 187
Death 46 54 13 25 8 146
School conditions 29 11 31 0 0 71
Teacher conditions 21 43 3 90 17 174
Other 42 29 49 20 52 192
Total dropouts 2583 1701 1293 1494 1404 8475
Source: MEC, Office of Education Planning.

43
In sum, large numbers of students are repeating the earliest grades, often multiple times,
before eventually dropping out, and as a result enrollment is heavily tilted towards the
earlier grades in primary. There is clearly dropout taking place throughout the primary and
secondary system, both during and in between school years. Also, there is some evidence about
when this is happening (that is, grade 1, ESBA 1, and so on). Current (2011-12) enrollment rates
are near or above 95 percent for most of the basic school age sequence, and only fall below 90
percent (on average) at age 16 (see Figure 3.22). In other words, very few children are leaving
the system before the age of 16. The fairly steep decline between ages 15-18 is not an unusual
finding, as children of this age have more opportunities to work and begin families. These
pressures are especially pronounced for girls, who are significantly more likely to terminate their
schooling at this stage than boys (details provided below) and for students from poor and rural
backgrounds. However, it should be observed that about 75 percent of all 18-year-olds are still in
school at the time of the 2011 DHS, so there is no evidence of a massive desertion from the
system in late adolescence.
Figure 3.22. Current School Enrollment Rates by Age, 2011 DHS
Source: EDSGE-I (DHS), 2011.
3.3.2. Equity Comparisons: Gender, Socioeconomic Status (SES), and Location
This section provides comparisons by gender, SES, and location to identify significant
differences—often referred to as gaps—in key outcomes. The equity review is a necessary piece
of any sector diagnostic, primarily because it helps identify areas of emphasis from a policy and
planning standpoint.
Gender
Gender equity is a focus in EQG policy discussions, and in goals related to EFA and Educación
Para Todos. Preschool enrollment is evenly divided by gender, with roughly equal numbers of
boys and girls enrolled in each level. There is little difference in enrollment by gender from age 7
to 16; however, at age 16 boys’ enrollment surpasses that of girls (see Figure 3.23). For the 17-
21 age range the average male advantage in attendance is just over 10 percentage points.

44
Figure 3.23. Current Enrollment Rates by Gender, 2011 DHS
Source: EDSGE-I (DHS), 2011.
However, the time girls spend in school is marginally more efficient as they are less likely
than boys to repeat grades (see Figure 3.24). Boys are more likely to repeat in all grades of the
basic (primary plus ESBA) sequence, except for the last grade of ESBA (4). The differences are
generally significant, but not enormous: in most grades girls are 2-3 percent less likely to repeat.
These differences can add up over time, and predict girls completing more grades of education
for the same amount of time spent in the system.
Figure 3.24. Grade Repetition Rates by Gender and Grade, 2014-15
Source: PRODEGE/MEC, 2014-15 Anuario.
Between the ages of 7 and 18, girls complete more years of education than boys: for 7-12-
year-olds the difference is only 0.08 of one year, but for the 13-18-year-old cohort the female
advantage is nearly one-half of a year of education (Figure 3.25). However, for the 19-25-year-
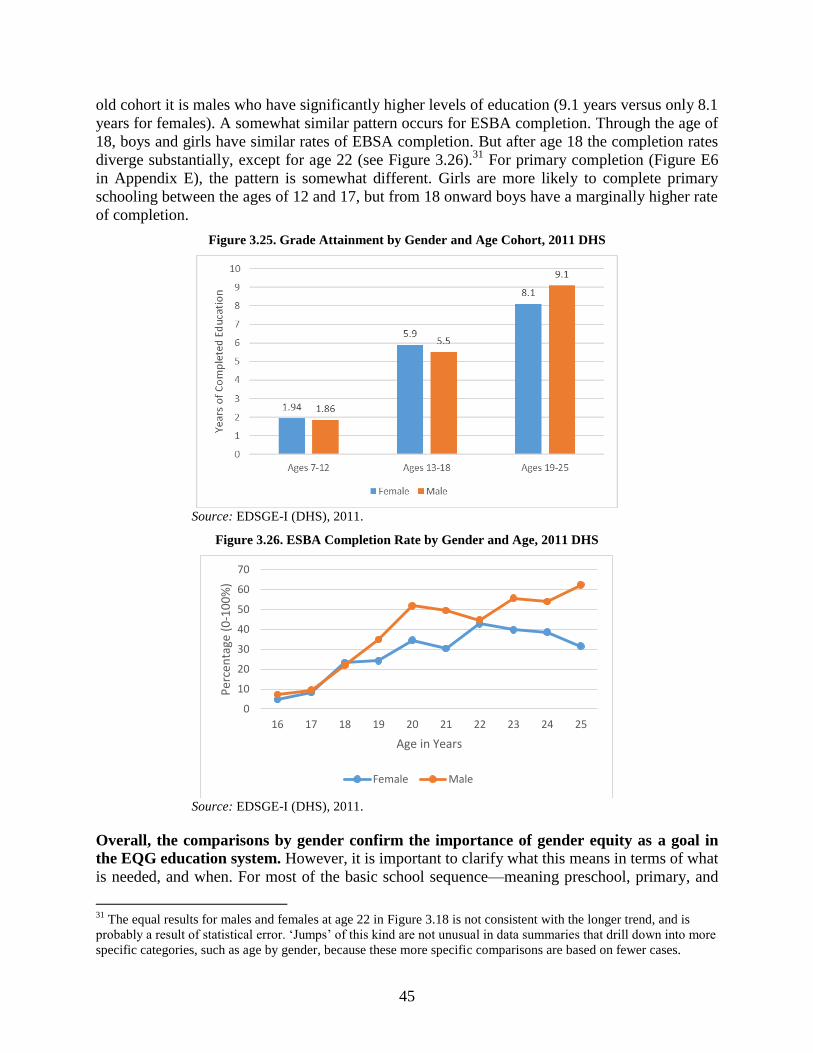
45
old cohort it is males who have significantly higher levels of education (9.1 years versus only 8.1
years for females). A somewhat similar pattern occurs for ESBA completion. Through the age of
18, boys and girls have similar rates of EBSA completion. But after age 18 the completion rates
diverge substantially, except for age 22 (see Figure 3.26).31
For primary completion (Figure E6
in Appendix E), the pattern is somewhat different. Girls are more likely to complete primary
schooling between the ages of 12 and 17, but from 18 onward boys have a marginally higher rate
of completion.
Figure 3.25. Grade Attainment by Gender and Age Cohort, 2011 DHS
Source: EDSGE-I (DHS), 2011.
Figure 3.26. ESBA Completion Rate by Gender and Age, 2011 DHS
Source: EDSGE-I (DHS), 2011.
Overall, the comparisons by gender confirm the importance of gender equity as a goal in
the EQG education system. However, it is important to clarify what this means in terms of what
is needed, and when. For most of the basic school sequence—meaning preschool, primary, and
31
The equal results for males and females at age 22 in Figure 3.18 is not consistent with the longer trend, and is
probably a result of statistical error. ‘Jumps’ of this kind are not unusual in data summaries that drill down into more
specific categories, such as age by gender, because these more specific comparisons are based on fewer cases.
0
10
20
30
40
50
60
70
16 17 18 19 20 21 22 23 24 25
Per
cen
tage
(0
-10
0%
)
Age in Years
Female Male

46
ESBA—girls are equally likely to be in school as boys, and they actually perform marginally
better than boys (based on repetition rates and attainment). However, significant gender gaps
favoring boys begin to appear at around the age of 17, driven by females exiting the system. In
other words, the critical period for girls is in late adolescence. The main reasons for girls leaving
school at this time are likely related to pregnancy and starting their own families, work demands
at home to take care of other family members, or a household aversion to continuing the
educational investment for girls, especially as the direct and indirect costs increase by
educational level. These are not easy situations to address, but they do serve as a reminder of the
inter-sectoral nature of addressing problems like dropout among older children.
Socioeconomic Status (SES) Comparisons
In the age of EFA, education systems around the world have made a priority of reaching the
hardest-to-reach children (and communities), and as a result there is steady progress being made
in enrolling all children in school. Nevertheless, in most countries there are still gaps between the
wealthiest and poorest children, especially in the post-primary cycle. Furthermore, even when
most children are in school, outcomes like attainment efficiency and achievement are likely to
vary significantly by social class.
School enrollment rates at the time of the 2011 DHS were fairly equal between the poorest
(Q1), average (Q3), and wealthiest (Q5) children between the ages of 7 and 14, although Q5
children are significantly more likely to be in school. However, at ages 15-16 enrollment
across quintiles begins to diverge substantially (see Figure 3.27). For example, 90 percent of 18-
year-olds from Quintile 5 are in school in 2011, compared with only about 50 percent of 18-year-
olds from Quintile 1 families.
Figure 3.27. Current Enrollment by SES Quintile, 2011 DHS32
Source: EDSGE-I (DHS), 2011.
32
Unfortunately, comparisons by social class are only possible with survey data, since administrative sources (like
the Anuarios) do not have this kind of information.

47
Similarly, children from wealthier households have higher grade attainment than poorer
children. Among 7-12-year-olds, Quintile 5 children have completed 2.6 years of school, on
average, versus only 1.5 years for Quintile 1 children (and 1.7 for Quintile 2) (see Figure 3.28).
This advantage is likely attributable to beginning primary school at an earlier age, and repeating
fewer times.
Figure 3.28. Grade Attainment by SES Quintile and Age Group, 2011 DHS
Source: EDSGE-I (DHS), 2011.
Owing to the cumulative impact of starting school earlier, repeating less often, and staying
longer, Quintile 5 persons aged 19-25 have over 10 years of completed education, compared
with less than 7 years for Quintile 1. Among 13-18-year-olds, the difference is also quite large
(7.1 years for Q5 versus 4.5 years in Q1) (see Figure 3.29). These are very significant differences
that potentially have long-lasting consequences in labor market and other outcomes.
Figure 3.29. ESBA Completion Rates by Age and SES Quintile, 2011 DHS
Source: EDSGE-I (DHS), 2011.

48
Location and Province Comparisons
Grade attainment varies significantly across four location types, although the gaps are not
as large as for SES. The highest grade attainment levels are found in urban areas of the Insular
region, followed closely by urban areas on the continent. Not surprisingly, rural locations have
lower educational attainment, especially on the continent. The differences are largest among the
older (19-25) cohort: for example, urban Insular grade attainment is nearly three years higher
than the rural continent average (9.8 years versus 7.1). However, among 13-18-year-olds the
differences are about half as large, which suggests that some progress had been made (at the time
of the 2011 DHS) in reducing the gaps by location strata (see Figure 3.30).
Figure 3.30. Grade Attainment by Community Type and Age, 2011 DHS
Source: EDSGE-I (DHS), 2011.
The results for the regional comparisons highlight two, somewhat distinct education
systems in the country, divided mainly by rural and urban locations. The Litoral and Bioko
Norte provinces not only are dominant in terms of total primary enrollments (nearly 75 percent
of the total,), but they are more efficient (that is, less repetition and higher grade attainment) and
there are more opportunities for post-primary study. The remaining provinces, mainly in the
continental region, are smaller with relatively low efficiency and fewer opportunities to continue
studies into late adolescence. These differences between predominantly urban and rural zones are
not unusual, but they do need to be taken into account when discussing sectoral challenges.
Multivariate analysis provides some insight into the kinds of factors that are correlated with
education outcomes in EQG. Below are the main findings (see Appendix F for details).
Controlling for other variables, girls are more likely to be enrolled in secondary school
(ages 13-20), and more likely to complete primary school (ages 13-18) than boys of the
same age. However, there are no differences by gender for school attendance (across all
levels), secondary completion, or grade attainment.

49
Girls’ schooling is more negatively affected by marriage and child rearing, which helps
explain why their attendance declines more than boys’ in late adolescence. There is also
an intersection between poverty and gender, as the poorest girls are much less likely to
continue their schooling than the poorest boys.
Overall, the results for SES confirm that wealthier households have better education
outcomes. The disparities by social class are, in some cases, quite large: Quintile 5 girls
are 40 percent more likely to be enrolled in secondary than Quintile 1 girls, while
Quintile 5 boys have 3.5 more years of completed education than Quintile 1.
There is little evidence of a tradeoff between the number of children in the household
and education outcomes (often referred to as ‘quantity versus quality’).
Individuals who are not children of the household head tend to fare worse in education.
This is especially true for household members who are not related to the head, or are
siblings of the household head.
Household head and mother education are strong and significant predictors of education
outcomes. For example, individuals in households where the head has completed
university are 17 percent more likely to be enrolled in secondary compared with
household heads with primary education only.
There are fairly modest differences between urban and rural locations when controlling
for variables like SES and household head education levels. This is a reminder of the
importance of controlling for multiple factors to determine the ‘direct’ or specific effect
of individual variables.
4. Part B. Education Diagnostic by Topic
Part B is divided into several sections that provide a more detailed overview of education
finance, school infrastructure, school quality, and data and research, plus an additional section
providing a spotlight on higher education and technical and vocational training.
Within each section the focus is on recent data from the Anuarios, supplemented with additional
qualitative information obtained during interviews and site visits. When necessary, trends and
comparisons based on Anuario data from different years are incorporated.
A key determinant of education sector performance is the availability of resources. This
relationship is not necessarily automatic: some countries are able to get better results with fewer
resources than other countries, which highlights the importance of priorities and execution.
Nevertheless, there is little question that education outcomes are affected by how much money is
available to spend on school buildings, materials, and teacher salaries, among many other things.
Unfortunately, there is very little actual data on education finance in EQG, at least in the recent
period (that is, last 10 years). The data that are available are combined with more general

50
observations about public sector finance challenges. These initial findings will feed into a more
complete summary as part of the PER that the World Bank is developing.
4.1.1. Education Expenditure Estimates
The best estimates of current education expenditures come from the most recent (2015) budget
execution summary, which was compiled as part of the 2016 Budget Law. These figures show an
amount of CFAF 37.6 billion for the Ministry of Education and Science, equal to 5.2 percent of
the total current public expenditure in 2015, including other constitutional branches such as the
senate, the house of deputies and the judiciary branch. Focusing solely on the total expenditure
of the 26 ministries existing in 2015, the education budget equaled 9.7 percent of the total,
scoring fourth in size after the budget allocated to the ministries of defense, finance, and
health (see Table 4.1).
Table 4.1. Equatorial Guinea Current Expenditure (2015)
Source: Ministry of Finance. Budget Law 2016.
TOTAL GASTOS CORRIENTES MINISTERIOS FCA% del gasto
MINISTERIOS
DEFENSA NACIONAL 81,183,666,000 21.02%
HACIENDA Y PRESUPUESTOS 52,844,046,000 13.68%
SANIDAD Y BIENESTAR SOCIAL 47,331,392,000 12.25%
EDUCACION 37,634,148,000 9.74%
JEFATURA DE ESTADO 26,604,231,000 6.89%
ASUNTOS EXTERIORES Y COOP. 21,777,385,000 5.64%
MINAS INDUSTRIA Y ENERGIA 19,097,703,000 4.94%
JUVENTUD Y DEPORTES 17,144,045,000 4.44%
PRESIDENCIA DE GOBIERNO 16,661,898,000 4.31%
INTERIOR Y CORPORACIONES 12,783,385,000 3.31%
AGRICULTURA Y BOSQUES 10,768,080,000 2.79%
SEGURIDAD NACIONAL 5,983,836,000 1.55%
ECONOMIA Y PLANIFICACION 4,416,905,000 1.14%
INFORMACION, PRENSA Y RADIO 4,214,247,000 1.09%
OBRAS PUBLICAS E INF 3,568,396,000 0.92%
JUSTICIA, CULTO E INSTITUC. 3,465,518,000 0.90%
COMERCIO Y PROMOCION EMP 3,094,834,000 0.80%
PESCA Y MEDIO AMBIENTE 2,931,937,000 0.76%
CULTURA Y TURISMO 2,703,999,000 0.70%
FUNCION PUBLICA Y REFORMA 2,702,893,000 0.70%
ASUNTOS SOCIALES Y GENERO 2,525,231,000 0.65%
TRABAJO Y SEGURIDAD SOCIAL 2,353,524,000 0.61%
TRANSPORTE Y TECNOLOGIA 2,288,213,000 0.59%
AVIACION CIVIL 2,179,717,000 0.56%
TOTAL GASTOS MINISTERIOS 386,259,229,000
SENADO 6,619,620,000
CAMARA DE LOS DIPUTADOS 5,689,032,000
PODER JUDICIAL Y FISCALIA 2,573,267,000
TRIBUNAL CONSTITUCIONAL 490,632,000
TOTAL ORGANOS CONSTITUCIONALES 15,372,551,000
OBLIGACIONES DIVERSAS (sin inv.) 313,881,000,000
TOTAL DE GASTOS CORRIENTES 715,512,780,000

51
Since 2014, another category, institutional projects,33
was added to the current expenditure
framework. This makes it possible to observe the preferences in the internal distribution of MEC
resources as a proxy for the allocation of priorities. The total amount of this category is small
compared to total spending. For 2014, the MEC resources primarily supported secondary and
primary education, as well as goals from the Plan Nacional de Desarrollo Económico y Social
(PNDES) Horizonte 2020. For 2015, technical and professional education and the support for
goals of the PNDES increased in relevance and participation to the detriment of primary and
secondary education. These institutional projects are complementary resources to other ongoing
operations,34
but the figures do provide some insight into how the MEC defines priorities. It is
noticeable that the total number of institutional projects has declined after the crisis.
Table 4.2. Institutional Projects MEC 2014–2015 and 2016 Projection
Source: Ministry of Finance. Budget Law 2016.
Another tool that can provide insights and estimates of the size and composition of public
expenditure is called BOOST, which makes it possible to track total government current and
investment expenditures from 2007 to 2015. Despite the fact that it is impossible to isolate the
sole education expenditure from the rest of the institutions and categories, it is possible to
estimate some of the transfers and subventions expenditure that are directly governed by the
MEC, such as its institutional projects, scholarships and school incentives, support for catholic
schools, and transfers to UNGE. The two largest spending categories are for UNGE and
scholarships, followed by relatively smaller amounts for support for religious schools and
institutional projects and programs (see Figure 4.1). The totals are fairly flat until 2014, when
there was a marked increase in spending, followed by a deceleration (or even some decline) in
2015.
33
The institutional projects are conceptually a category of investments, but for the convenience of the institutional
resource allocation and disbursement processes, they are presented in a way that is more associated with current
expenditures since public investment normally goes through GE Proyectos with which not many public entities have
a fluid collaboration. The figures presented before for the 2015 current expenditure already included these
institutional projects. 34
Examples include the support of the African Development Bank for strengthening of the institutional capacity in
the Technical Education Directorate of the MEC for designing the curriculum of each of the technical and
professional education families, the reinforcement of infrastructure in public technical education centers and other
secondary centers, support for the Cuban mission, support for public transport pilot program in Bata and Malabo,
and the printing and distribution of school textbooks.
Total % de total Total % de total Total % de total
Total 8,930 100% 8,000 100% 8,000 100%
Subsector Educación Primaria 1,786 20% 1,200 15% 1,200 15%
Subsector Educación Secundaria cientifica 1,965 22% 1,300 16% 1,300 16%
Subsector educacion tecnica profesional 1,607 18% 2,560 32% 2,560 32%
Subsector educacion superior 804 9% 640 8% 640 8%
Fondo para el desarrollo Social - sector educacion 982 11% 300 4% 300 4%
Plan Nacional Horizonte 2020 - sector educativo 1,786 20% 2,000 25% 2,000 25%
PROYECTOS INSTITUCIONALES2014 2015 2016 proyc.

52
Figure 4.1. MEC Institutional Projects, Transfers, and Subsidies 2007-2015
Source: BOOST Tool World Bank, 2016.
Note: blue line: institutional programs and projects; gray line: scholarships and incentives; orange line: support for
religious schools; yellow: subsidy to UNGE.
BOOST also makes it possible to monitor transfers and subsidies that are not governed by
the MEC but are clearly related to the education sector. These refer to public education
centers governed by the ministries of agriculture, finance, foreign affairs, mines, justice,
economy, health, and public works; the national library and cultural centers under the ministry of
culture management; international scholarships under the ministry of foreign affairs
management; and nursery schools and the national committee for children under management of
the ministry of social affairs and gender equality. There is consistently low spending on
preschool and the National Committee for Children’s Rights, while vocational education
centers have received large increases in funding in recent years (see Figure 4.2). These are
under the control of line ministries of the given topic but not governed under the MEC standards.
0
5000
10000
15000
20000
25000
30000
2007 2008 2009 2010 2011 2012 2013 2014 2015
Programas y Proyectos Institucionales Apoyo Centros Escolares Regentados por Religiosos
Becas e Incentivos de Estudios Subvención a la UNGE

53
Figure 4.2. Education-related Transfers and Subventions to Other Line Ministries 2007-2015
Source: BOOST Tool World Bank, 2016.
The final source of information on government education expenditures—and government
priorities in the education sector and efficiency—is the public investment program database
elaborated with support of the Public Investment Management and Monitoring (PIMM) RAS
team. The RAS team analysis from 2016 covers the bulk of public investment projects and/or
contracts recorded in official records from 2008 to 2015. They show that the total share of the
capital budget dedicated to the major education program of the PNDES sums to CFAF
735.7 billion, representing 3.7 percent of the total public investment obligations. It also
shows a level of financial disbursement of 49 percent, far behind the overall 67 percent (see
Table 4.3).
0.000
1,000.000
2,000.000
3,000.000
4,000.000
5,000.000
6,000.000
2007 2008 2009 2010 2011 2012 2013 2014 2015
Subvención Guarderías Infantiles Subvención Comité Nacional Derechos del Niño
Becas de Cooperación Internacional Subvención Escuelas de Capacitacion Agraria (ECA)
Subvención al Centro de Formación - Escuela Taller Subvención a la Biblioteca Nacional
Subvencion Escuela Universitaria de Finanzas Publicas Subvencion Centros Culturales GE
Subvencion al Colegio Nacional de Abogados Sunvención al Colegio Nacional de Economistas
Subvención Colegio Nacional Ingenieros y Arquitectos Subvención al Colegio Nacional de Médicos

54
Table 4.3. Public Investment Program Associated with PNDES Programs, 2008-2015
Source: Ministry of Economy, Planning and Public Investments; Ministry of Finance; GE Proyectos. 2016.
Of the total capital amount for education, 64 percent is devoted to new infrastructure in
higher education, concentrated in three large projects: the construction of new campuses for
UNGE in Malabo and Bata and the inception of the new American University of Djibloho (the
new city in the continental region under construction, expected to be, in the future, the political
capital of EQG). It was estimated by the PIMM RAS team that another 21 percent was directed
toward the expansion and improvement of facilities in preschool. For primary and secondary
education, it is virtually impossible to identify which share goes to each level with the
information available.
4.1.2. Is Equatorial Guinea Spending Enough and Well on Education? And Why?
Compared to other Africa countries and countries with similar GDP per capita, EQG spends
significantly less on education. As a reference, African countries devoted 4.8 percent of their
GDP and 17.2 percent of their total government expenditure to education in 2015,35
while
Organization for Economic Co-operation and Development (OECD) countries spend an average
of 5.2 percent of their GDP on education and 11.3 percent of their total public spending on
education.36
Spending only 2.3 percent of their GDP and 5.2 percent of their total government
expenditure on education, EQG lags behind (see Figure 4.3 and Figure 4.4).
35
UNESCO Institute for Statistics, most recent year available. 36
OECD 2016.
PROGRAMAS PENDES Costo Total% de costo
totalTotal pagos
% de
ejecucion
financiera
Infraestructuras para Guinea Ecuatorial 10,647,351 53.49% 7,554,833 71%
Administración Moderna 2,840,790 14.27% 1,803,502 63%
Electricidad para Todos 1,214,464 6.10% 612,212 50%
Agua para Todos 1,138,007 5.72% 839,042 74%
Guinea Ecuatorial Modelo Ecológico 865,582 4.35% 580,049 67%
Guinea Ecuatorial Potencia Energética 801,478 4.03% 451,867 56%
Educación para Todos 735,702 3.70% 357,454 49%
Salud para todos 719,522 3.61% 497,447 69%
Un techo para todos 637,249 3.20% 447,405 70%
Guinea Ecuatorial Centro de Negocios de Referencia 178,778 0.90% 145,631 81%
Guinea Ecuatorial País Numérico 74,836 0.38% 54,204 72%
Empleo para todos 29,086 0.15% 18,458 63%
Seguridad Alimentaria 19,497 0.10% 14,317 73%
Un plan de desarrollo para todos 3,075 0.02% 1,000 33%
Grand Total 19,905,417 100% 13,377,421 67%

55
Figure 4.3. Public Spending on Education as a Percentage of GDP (selected African countries)
Source: UIS.
Figure 4.4. Share of Education of Total Public Spending (selected African countries)
Source: UIS.
EQG appears to be similar to other African natural resource-rich countries that have poor
education, health, and poverty outcomes despite their wealth (see Box 4.1).
0
2
4
6
8
10
12
14
Zam
bia
CA
RU
gan
da
Mad
agas
car
Sud
anD
RC
EQG
Gab
on
Sier
ra L
eon
eLi
be
ria
Ch
adM
auri
tan
iaC
amer
oo
nG
uin
ea
An
gola
Tan
zan
iaM
ali
Bu
rkin
a Fa
soB
enin
Alg
eria
Eth
iop
iaC
ote
d'Iv
oir
eM
auri
tiu
sR
wan
da
Mo
rocc
oK
enya
Togo
Bu
run
di
Mal
awi
Sou
th A
fric
aM
oza
mb
iqu
eG
han
aC
on
goN
iger
Swaz
ilan
dSe
ne
gal
Nam
ibia
Zim
bab
we
Bo
tsw
ana
Leso
tho
Per
cen
tage
0
5
10
15
20
25
30
35
EQG
Zam
bia
CA
R
Lib
eri
a
An
gola
Uga
nd
a
Sud
an
Gab
on
Mau
rita
nia
Gu
ine
a
Ch
ad
Cam
ero
on
Mad
agas
car
Sier
ra L
eon
e
Ken
ya
Rw
and
a
DR
C
Bu
run
di
Tan
zan
ia
Ben
in
Bu
rkin
a Fa
so
Mal
i
Mau
riti
us
Sou
th A
fric
a
Mo
zam
biq
ue
Bo
tsw
ana
Gh
ana
Mal
awi
Nig
er
Co
te d
'Ivo
ire
Leso
tho
Sen
ega
l
Swaz
ilan
d
Nam
ibia
Eth
iop
ia
Co
ngo
Zim
bab
we

56
Beyond country comparisons, it is important to have a detailed assessment of what is needed in
education in the country, what is available in terms of resources, and what is actually executed
and spent. This diagnostic does not have enough information to address these issues
systematically, which means that a definitive review of the adequacy of social sector spending in
EQG will have to wait on a more complete analysis, such as that contemplated as part of the
World Bank’s PER.
What we do know about education finance does raise some concerns. First, there is the
quantitative summary based on what data are available. Importantly, the amount of resources for
education (and other sectors) in EQG has increased enormously in the last 15 years, and as a
result, spending levels are much higher than in previous decades. Nevertheless, the share of total
government spending and GDP devoted to education appears to be low and at times highly
concentrated in infrastructure. There are also reasons to be concerned about the priorities in
spending, such as the share devoted to higher education (both in terms of current and capital
spending).
Second, given the problems that have been referenced in this section (and others) it is easy to
conclude that EQG is not spending enough on education,37
but it is still necessary to understand
the underlying reason(s) for underinvestment. One possible reason for underinvestment in
education is related to competing government priorities. The PNDES review also shows that
the country has undertaken massive investments in infrastructure (roads, ports, and so on). These
are expensive undertakings, and other sectors may suffer as a result. This requires a rebalancing
of priorities or a sequential strategy where spending is shifted to other sectors as advances are
made in others. These are questions that cannot be addressed in this short review, in part because
they require an understanding of the government’s global spending strategy.
37
This conclusion is clearly shared by others, as evidenced by Recommendation Number 3 (of six) in the PNDES
review (2014) of the Plan Nacional implementation: Invertir masivamente en educación y sanidad and by the World
Bank PER conducted in 2010: “public education financing is insufficient and far below the regional desired levels”.
Box 4.1. Poor Human Capital Outcomes in Resource-rich Sub-Saharan African Countries
While natural resources can support economic growth and boost well-being in a country, SSA resource-rich
countries tend to overlook human capital development, rather than channeling their resources productively to
eradicate poverty and enhance shared prosperity.
Natural resource wealth leads to higher national incomes but does little to reduce poverty levels.
Compared to other countries at the same level of income, resource-rich countries have done less to reduce
poverty. After adjusting for GNI per capita, poverty rates are higher in the resource-rich countries.
Resource-rich countries underspend on education relative to their wealth. The percentage of GDP
devoted to education and health in oil-rich SSA countries is less than half the amount allocated by non-
resource-rich countries in the region.
Natural resource wealth in SSA is associated with poor education and health outcomes. Oil-rich SSA
countries score lower on the United Nation’s Human Development Index (HDI), which combines national
income, life expectancy, education attainment, and school participation, than other countries. Controlling for
national income, education outcomes are systematically worse in oil-rich SSA countries compared to non-
resource-rich SSA African countries, and outcomes are worse for the poorest in resource-rich SSA countries.
Source: World Bank 2015.
57
There is also some evidence that the education sector is underperforming in terms of
spending execution. This issue was referenced on several occasions during interviews with
social sector stakeholders, both inside and outside the government. For example, one high-
ranking official emphasized the need for capacity building in public sector management. He
noted that ministry line officials are not preparing adequate spending plans. The plans lack
details related to spending targets, expected outcomes, and other specifics. As a result, they
“cannot defend their numbers,” which in turn leads to actual disbursements that fall short of what
is requested. An international technical advisor also made reference to the problem of line
ministries receiving less than what is potentially available, but for a somewhat different reason:
there is a tendency among ministry staff to view the returning of money (that is, not using all that
is allocated) as a form of efficiency that, in turn, is looked on favorably by senior leadership.
Failing to take advantage of the full complement of potential financing is a serious problem
from a public management standpoint and highlights the need for technical capacity
building in this area. This is not a new concern; indeed, the first two recommendations of the
PNDES review are related to public management capacity.38
This is an area where there is
clearly potential for World Bank assistance and again highlights the importance of completing a
detailed PER to better understand the current situation with public administration and resource
use and devise strategies to improve capacity.
Further qualitative evidence is also troubling. One issue is the vulnerability of social sector
spending to variations in the price of oil, including both the amount and composition of
education spending. One MEC official referred to the recent downturn in oil prices as a ‘threat’
to the education sector, meaning that budgets may be reduced. This has apparently not happened
overall so far, but nonetheless is a concern, in particular when we consider that funds for the
institutional projects have already been declining. It is also fairly noticeable and worrisome that
scholarships and transfers to UNGE, very likely regressive, were relatively protected during the
recent downturn in contrast to other spending (as shown in Figure 4.1), revealing lack of focus
on protecting the poor. The withdrawal of Hess Corporation financing for education after 2019 is
another reminder of the potential fragility of spending in the country given the economy’s close
association with the oil industry.
Finally, in relation to the composition and quality of public spending, there are concerns
that the education system is not able to provide the kind of basic conditions that are needed
to build a quality system. Too little may be spent on infrastructure for primary and secondary
education, particularly maintenance of this infrastructure, as well as on teachers and quality
inputs. This will be further analyzed in the following sections.
This section provides an abbreviated summary of school infrastructure, focusing on three general
areas: the evolution of schools, classrooms, and enrollments; the shares of public and private
38
These recommendations are: organize a transformational agenda 2015-2020 and strengthen the capacity of the
Agencia Nacional Guinea Ecuatorial (ANGE) 2020 and reform and strengthen the capacities of the Administration
of public management.

58
schooling supply; and physical conditions of schools. All of the data come from existing
Anuarios, as there is no other source of data on school infrastructure.
The main findings in this section include the following:
During the 2008-2015 (Anuario) period, the number of primary schools has remained
fairly stable, while secondary school supply has increased significantly. Primary and
secondary classrooms have also increased, mainly because of the growth of private
schooling.
Private school enrollment is larger than public school enrollment at both the primary and
secondary level. There is a need for additional information to be able to compare the
relative cost-effectiveness of these different schooling modalities and also the need for a
strong quality assurance framework in private schools.
In terms of physical conditions, there is not much evidence of improvement during 2008-
2015. Concerns about physical conditions are widespread, with references to deficiencies
both in the physical infrastructure as well as maintenance.
4.2.1. Schools, Classrooms, and Enrollment
The total number of primary schools has stayed relatively stable across 2008-2015. This
most likely reflects the fact that almost all communities in the country now have access to a
primary school. By contrast, the number of secondary schools has increased significantly
between 2010 and 2015, from 110 to 140 schools (see Figure 4.5 and Figure 4.6).
Figure 4.5. Number of Primary Schools by Sector, 2008-2015
Source: PRODEGE/MEC, 2007-08 through 2014-15 Anuarios.

59
Figure 4.6. Number of Secondary Schools by Sector, 2008-2015a
Source: PRODEGE/MEC, 2007–08 through 2014–15 Anuarios.
Note: Data on primary schools, classrooms, and conditions are available going back to the first Anuario
(2007-08), but for secondary schools, this information is only available since 2010-11.
The stability in total numbers of primary schools is somewhat misleading, however, since
there are significant changes taking place within the system. Primary schooling is becoming
increasingly urban, which likely reflects the more general urbanization trend in the country (see
Error! Reference source not found. and Figure E8 in Appendix E.
Figure 4.7. Number of Primary Schools by Urban/Rural, 2008-2015
Source: PRODEGE/MEC, 2007-08 through 2014-15 Anuarios.
4.2.2. Public Versus Private School Provision
Education in EQG is also more and more private, as evidenced by the growing number of private
primary and secondary schools over the past several years (Figures 4.5 and 4.6). Primary school

60
enrollment has increased dramatically in private schools39
compared to public schools (Figure
4.8), and the number of private secondary school classrooms nearly doubled between 2010 and
2015, compared with minimal growth in public school classrooms at this level (Figure 4.9). In
2015 private education accounted for 56 percent of preschool enrollment, 59 percent of primary
enrollment, and 64 percent of secondary enrollment.40
Figure 4.8. Total Primary Enrollment by Sector, 2008-2015
Source: PRODEGE/MEC, 2007-08 through 2014-15 Anuarios.
Figure 4.9. Number of Secondary Classrooms by Sector, 2011-2015
Source: PRODEGE/MEC, 2011-15 Anuarios.
A large presence of private schools at the secondary level is not unusual in developing countries.
However, a large—and growing—private school sector in primary schooling is somewhat
unusual. Some caution is required in interpreting this trend. First, there are very few ‘pure’
39
These can be fully private, subsidized private, faith-based, or other.
40 UNESCO UIS.

61
private schools in EQG, that is, schools that do not receive any support from the government. At
the time of the 2010-11 Anuario, only about 8 percent of primary schools and 4 percent of
secondary schools were classified as private receiving no public support. By contrast, about 45
percent of primary schools and 51 percent of secondary were classified as private receiving
public support. This means that relatively few students are attending purely private schools
(probably religious schools), and a fairly large share are enrolled in private schools that have
teachers on the public payroll. It also means that the government is increasing the supply of
schooling by contracting more teachers.
The growing trend toward private schooling is likely part of the urbanization trend already
demonstrated and may also be related to rising incomes and an ability of more families to pay for
an alternative schooling option—perhaps something that is closer to their homes or that they
perceive to be higher quality. While this diagnostic does not have any information on the quality
of private schools, qualitative evidence suggests that the cost of private school is significantly
higher than public school. Anecdotal evidence shows costs of private schools between 380,000-
1,000,000 CFA (USD 645-1700) compared to public schools which are considered free, but do
imply expenses for families up to approximately 8,000-15,000 CFA (USD 14-25).
The large and growing share of private schooling—especially at the primary level—could
be seen as a way to increase supply (and possibly quality), but could also be seen as a
symptom of problems in the public school sector. Box 4.2 provides more information on how
private schools can contribute to enhanced quality and access and some key elements of effective
regulation of private schools. However, it is important to recognize that private schools are not
necessarily of better quality, even if they cost more for families, and this is also why an effective
quality assurance and incentive framework is needed. Also, the fact that public school spaces are
not expanding—or are actually declining in primary (Figure 4.5)—does raise some questions
about the government’s commitment to public education, particularly since the crisis. Again, this
discussion is complicated by the fact that most private schools are supported by the public sector,
and they appear to be part of the same support structure (that is, inspectors and so on). But this is
a somewhat unique arrangement that needs to be carefully considered and research is needed to
compare the relative cost-effectiveness of these different schooling modalities.

62
Box 4.2 The potential of private schools and requirements for effective regulation
Private schools—schools that are not operated, owned, and financed by the government—have grown significantly
in recent years. In Sub-Saharan Africa, over 14 percent of primary and 19 percent of secondary students are
enrolled in private schools, whether for profit, non-profit, or faith-based. Between 1991 and 2003, enrollment in
private primary school in Sub-Saharan Africa grew by 113 percent, compared with a 52 percent increase in
enrollment in public primary schools.
How private schools can contribute to enhanced quality and access
Reaching education goals in the coming years will require increased supply and quality of schooling and private
schools have the potential to play an important role. However, to do so, private schools must be able to reach
traditionally underserved children to expand access and implement effective monitoring and support measures to
ensure quality. Evidence suggests that the growth of private education markets has enabled access to education for
millions more children around the world and that many governments have successfully improved both access and
quality by increasing oversight and cooperation with private education providers.
Key elements of effective regulation of private schools
Government must provide oversight for the whole education system to ensure that the country’s objectives for
school access, quality, and equity are met, irrespective of type of service provider. The combination of increased
levels of school autonomy and accountability has been found to positively impact student performance. Raising
school accountability requires strengthening the quality assurance mechanisms that are in place between the
government and school providers. This can involve:
Government sets standards regarding what students need to learn, including deadlines.
For meeting these standards students are required to take standardized examinations; results are
disaggregated by school, socioeconomic status, gender, etc.
Schools are required to report on the use of public funds as a condition for continued funding.
Government or external agency perform inspection of schools as determined by school need.
Schools produce school improvement plans.
School performance leads to rewards and escalating sanctions.
Accountability is also important between the parents and school providers. This can involve:
Ensuring that information on school performance is made available and letting families respond to that
information through open enrollment policies
Giving parents more direct influence over what takes place in the school. For example, parents and students
can be involved in the school inspection and school improvement planning processes.
Source: Author’s elaboration based on The World Bank (2014): “Framework Paper on what matters most for
engaging the private sector in education” – Systems Approach for Better Education Results (SABER) Working
Paper Series.

63
4.2.3. School Conditions
The average number of students per classroom has declined during 2008-2015, especially in
the Insular region (see Figure 4.10). This is an indirect measure of classroom crowding that is
also declining at the secondary level (not shown).
Figure 4.10. Average Primary Students per Classroom by Region, 2008-2015
Source: PRODEGE/MEC, 2007-08 through 2014-15 Anuarios.
Data from the Anuarios suggest that primary classroom and school conditions have not
improved much during 2008-2015, although these are a fairly limited set of variables.41
The
percentage of primary schools with water and electricity has not changed much during 2008-
2015. Primary schools in the Insular region were much more likely to have electricity in 2015
than in 2008 (about 75 percent versus 55 percent—gray line in Figure 4.11). But the other
averages are fairly flat or, in the case of electricity in continental primary schools, the percentage
has even declined (Figure 4.11).
41
This topic was referenced repeatedly during interviews in Malabo and field visits to schools. A number of
interview subjects made reference to infrastructure deficiencies, especially in terms of the conditions of bathrooms,
water, student desks and chairs, and so on. Only a few schools were visited as part of the field visits, but in several
cases, it was found that the schools were seriously lacking proper physical infrastructure. One secondary school—
with hundreds of students in attendance—did not have functioning toilets. Serious problems were also evident with
basic physical conditions of classrooms (roofs, walls) and school grounds.

64
Figure 4.11. Primary School Conditions by Region, 2008-2015
Source: PRODEGE/MEC, 2007-08 and 2014-15 Anuarios.
Finally, there are also weaknesses in school maintenance. School cleaning and other basic
maintenance services, which are provided (in cities) on a contractual basis to cleaning services,
appear to be unresponsive to schools’ needs, and the quality of services is often poor. Some
school directors also noted a lack of parental involvement in the school, which potentially affects
school maintenance.
Overall, the results for infrastructure are somewhat mixed. It is not possible to gauge the full
extent of the government’s commitment to increasing facilities in the ‘oil boom’ years (before
the Anuarios began), although at this point it appears that relatively few communities are lacking
a primary school. Secondary school supply is clearly increasing, which is a necessary step in
improving overall sector performance. It is important to hear more from the government about
how it views the growing share of private schooling and how committed it remains to ensuring
access to public primary schooling during this crisis. Finally, there are widespread concerns
about the physical conditions in schools, which in at least some cases require urgent attention.
School quality is important enough to warrant its own separate diagnostic, but this section
provides a condensed review based on existing data and interviews. A good place to begin is
with the government’s recognition of the importance of this topic. References to school quality
deficiencies were common throughout the interview portion of the diagnostic, as well as in
site visits and meetings with school directors and inspectors. This not only confirms this topic
is an important one, but also, more significantly, it signals a government openness to addressing
school quality.
One of the challenges of reviewing school quality is deciding what constitutes the best measures
of quality. Discussions with MEC officials about school quality tend to focus on basic inputs,
teacher training levels, and outcomes like grade repetition and the results from the Selectividad

65
test at the end of Bachillerato Year 2. All of these measures are certainly relevant to quality, and
part of the reason they are commonly referenced is that most are available through the Anuario
summaries. Nevertheless, these are a somewhat limited set of measures when it comes to
understanding the quality of the teaching and learning environment in EQG, which is critical for
identifying systemic strengths and weaknesses. So the summary in this section will focus on the
data that are available but make reference to the kinds of quality indicators that are needed to
delve deeper.
The main points in this section for quality include the following:
Schools in EQG lack the kinds of basic inputs that are necessary to guarantee quality,
such as textbooks for every student.
There is a general consensus, or at least perception, that teacher salaries are low, and this
has a range of negative consequences related to teacher recruitment, absenteeism,
charging of extra fees, and teacher migration to the private sector.
There is certainly evidence that teacher preparation levels are improving, due, in large
part, to training programs put in place by PRODEGE.
Assessing the state of school quality on the basis of outcomes is challenging, and most
discussions refer to grade repetition and dropout rates or results of the Selectividad end-
of-cycle test in secondary. Evidence based on classroom observations, research, and
student testing is not widely available and is mainly concentrated in the PRODEGE I
period. What evidence is available, however, does suggest deficiencies in the teaching
and learning environment and student achievement that is below the expected minimum
level.
The evidence on community participation in EQG suggests that the links between schools
and parents are quite weak. During the school visits, school directors and teachers
complained about what they perceived as a lack of interest on the part of parents.
4.3.1. School Inputs
Deficiencies in teacher salaries, learning materials, and physical conditions suggest that the
system is not guaranteeing a basic level of quality. There is a general consensus that teacher
salaries are low, which in turn has implications for pre-service training levels and the quality of
teacher work. Learning materials are not available to all students. For example, textbooks are
sold to students rather than provided free of charge, and as a result, not all students have their
own textbooks. In most primary grades, the ratio of students to textbooks is above 3.0 and in
some cases much higher (see Table 4.4). The textbook purchases are organized through the
school, which takes a count of the number of students who are able to purchase the textbooks and
then requests this number. The price is lower than it would be if textbooks were purchased
privately, and the cost-recovery mechanism is clearly designed to aid sustainability of the text
provision system. Nevertheless, large numbers of students do not have their own textbooks,
which likely means sharing, borrowing, or going without this important input.

66
Table 4.4. Student to Textbook Ratio by Grade and Subject, 2014-15
Subject Average 1st grade 2nd grade 3rd grade 4th grade 5th grade 6th grade
A Globalized World I 1.8 2.9 4.0 4.0 0.0 0.0 0.0
A Globalized World II 5.8 21.0 2.0 12.0 0.0 0.0 0.0
A Globalized World III (I & II) 4.3 1.0 14.0 1.8 5.0 1.0 3.0
Math 5.6 0.0 2.0 20.0 3.4 4.1 4.2
Language and literature 2.0 0.0 0.0 0.0 3.5 4.0 4.6
Social Science 2.3 0.0 0.0 0.0 3.7 4.5 5.5
Natural Sciences 2.2 0.0 0.0 0.0 3.6 4.4 5.0
Religion 96.4 190.0 182.0 196.0 5.0 5.9 5.3
Source: PRODEGE/MEC, Anuario 2014-15, Table 6.4.2. (shading in original table).
4.3.2. Teachers
Teachers are a key driver of quality and a critical resource that must be developed and supported.
There are a number of teacher training initiatives in place that are intended to upgrade teacher
capacity levels. PRODEGE has been especially active in this area.
There has been significant improvement in the education profile of the average primary
school teacher. In 2007-08, about 30 percent of primary teachers had diplomados, while 34
percent had only completed elemental secondary education. In 2014-15, the diplomado share had
increased to 42 percent, while the elemental secondary share had declined to just 15 percent (see
Figure 4.12). This is consistent with ongoing efforts to upgrade teacher education levels.
Figure 4.12. Teacher Training Summary by Level, 2008-2015
Source: PRODEGE/MEC Anuarios, 2007-08, 2014-15.
Before-and-after comparisons of teacher education in preprimary and secondary are not possible
because of the focus of the Anuarios on primary education (until 2010-11). As of 2014-15,
almost half of preprimary teachers have elemental secondary education, and 31 percent only
have primary education. At the secondary level, the results are very different and show that
roughly two-thirds (68.6 percent) are maestros titulados (university graduates), with relatively

67
smaller shares of diplomado and secondary education. There has also been improvement in
teacher education levels at the secondary level, since the share of non-titulados/diplomados in
2010-11 was about 40 percent compared with about 17 percent.
Education profiles in primary and secondary are improving, although at the primary level
this appears to be mainly a result of in-service upgrades in education rather than better-
educated individuals entering the profession. However, relatively few teachers in primary
have university education, and even at the secondary level, this proportion—while improving—
is less than 70 percent. Also, a lot of work is required to significantly upgrade teacher education
levels in preprimary education, which is dominated by individuals with lower secondary and
primary education.
Current actions to improve the quality of teachers are framed under the ProFad initiative
(Programa de Formación, Actualización, y Acreditación Docente en Servicio) with the support
of PRODEGE. This training program is expected to be in place for more than two years and
implemented at the district level with the support of the inspectorate.42
Given teachers’ low
performance, the program will create a leveling course before starting the accreditation program
itself.43
Teacher gender balance is getting closer to 50-50 parity in primary school, but preschool
and secondary are far from even. Male teachers are more common at the primary level, but the
ratio of men to women has declined somewhat between 2007-08 and 2014-15. This is definitely
not the case in the other schooling levels. More than 90 percent of preprimary teachers are
female, while almost the same percentage are males in secondary education (see Figure 4.13).
This kind of gender specialization by level is not unusual for preprimary, but the lack of female
teachers in secondary education is a significant limitation.
42
The strategy started with a general assessment test during the first semester of 2016 for in-service preschool and
primary teachers who had not completed more than ESBA education level. Out of the 2,274 teachers who
participated in the test elaborated over the areas of linguistics, mathematics, natural science, and social science, only
10 teachers scored 70 percent or higher, largely confirming concerns about teacher capacity and knowledge of the
basic secondary education curriculum. The majority of teachers (65 percent) scored between 22 and 49 percent
correct (PRODEGE, quarterly reports, June 2016). 43
Specifically, the next phase of ProFad will include a leveling course for about 800 to 1,000 teachers based on the
secondary education curriculum. The objective of this leveling course is to reach the minimum standard needed to
formally enroll in ProFad’s accreditation course. In parallel, during the second semester of 2016, PRODEGE has
been hiring and training an estimated 40 tutors who in turn will be trained by PRODEGE specialists to undertake the
forthcoming accreditation courses in 2017. It is not clear yet what would be the extent of these courses in terms of
how many teachers can be trained and what would drive the targeting and prioritization of them.

68
Figure 4.13. Teacher Gender by Level, 2008-2015
Source: PRODEGE/MEC Anuarios, 2007-08, 2014-15.
There are relatively similar age groups by schooling level. The most common age bracket is 26–
40 years, followed by 41-60 years. Relatively few teachers are 25 years or younger, and the same
is true for over 60 years (Figure 4.14).
Figure 4.14. Teacher Age by Level, 2010-2015
Source: PRODEGE/MEC Anuarios, 2010-11, 2014-15.
Teachers can be hired under four contract types. The three most common categories are
‘Nombrado’, followed by contract teachers hired by the government and school, respectively. In
preprimary, the most common form is state-contracted teachers, while in primary it is Nombrado
and secondary it is school-contracted. The proportion of school-contracted in secondary is
probably due to the high proportion of private schools at this level. The last category includes

69
volunteers (see Figure 4.15). During the fieldwork this category was referred to with some
suspicion, since teachers who are reported as volunteers may actually be earning money by
charging students.
Figure 4.15. Teacher Contract Status by Level, 2014-15
Source: PRODEGE/MEC Anuario, 2014-15.
There are serious concerns about the quality of teachers, based on discussions with MEC leaders
and other education stakeholders. One of the main concerns is low teacher salaries. As noted
earlier, there is a general consensus in the education sector (government, international partners,
and so on) that teacher salaries are low. Unfortunately, for this diagnostic, it is not possible to
update Razquin’s (2006) earlier summary of teacher salaries or extend this to include
comparisons of teacher salaries against other public and private professions. There is also no
information on teacher salaries by level to compare primary with secondary and so on. An
updated, detailed salary analysis is an important pending activity that will hopefully be included
as part of the PER.
In the absence of a definitive summary of teacher salaries, some basic examples and comparisons
can be provided to give some context on this critical issue. Based on interviews with the MEC
and ANGE officials, it was estimated that a teacher appointed in the state payroll with an
education level of primary school enters the profession with a remuneration of around CFAF
150,000 (or approximately US$240), a teacher with a Diplomado receives CFAF 220,000
(US$350), and a teacher with a Licenciado degree receives CFAF 250,000 (or US$400). By
contrast, non-managerial public officials appointed in the state payroll have basic salaries
starting at around CFAF 100,000 for auxiliary personnel, about CFAF 155,000 for technical
degrees, and CFAF 200,000 for Licenciado degree public officials.
In comparison with other developing countries, these examples of teacher salary figures do
not appear to be very low. But some details are still missing, such as the evolution of the pay
scale, the degree to which salaries are improving in recent years, and how these figures compare
with changes in the cost of living or with private sector positions for similar levels of education.

70
The comparison with other public officials is certainly useful and suggests that the teacher
profession is not undervalued compared to other (non-managerial) public postings, but it
may simply be that teachers are ‘less underpaid’.
The number of references to low teacher salaries during the interview phase of this diagnostic
strongly suggests there is at least a perception of a problem; a more detailed review is required to
have the final word. Assuming this is an issue, the problems associated with low teacher
salaries are manifested in two ways.
First, there is little demand to enter the profession. Education is not a popular field at the
university level, although this is not unusual. But compared with many countries where there is a
surplus of teachers who have been trained, there does not appear to be a high demand for
entering the profession in EQG. Only 12 percent of the total university enrollment in 2015 was
for the education faculty, compared to more than 30 percent registered in 2006.
Second, low salaries have a range of consequences at the school and classroom level. These
kinds of problems—which are based on interviews and anecdotes rather than systematic data—
are the most troubling from a quality standpoint. They include the following:
Substitutes. A number of teachers obtain full-time ‘substitutes’ who replace them as
teachers at the school but allow them to remain in the system, perhaps even in other
(private) schools. These substitutes, in theory, are supposed to have the necessary
qualifications, but in reality they may not always be suitable for the post.
Absenteeism. Teacher absenteeism and a lack of interest in their work are other
commonly cited problems. In a recent study on child labor,44
a large sample of young
people expressed a number of concerns about the quality of education in the country,
including about teachers who have limited patience to explain the material and are
frequently absent. However, these same students observed that teacher salaries are very
low, which helps explain the low quality and a reluctance to enter the field of teaching.
More recently, in a series of workshops conducted by PRODEGE, it was identified that
neither school principals nor academic department coordinators are supervising this issue
of absenteeism (quarterly report June 2016 - PRODEGE).
Extra charges. There were a number of references in the interviews to teachers
demanding extra payments from students for various things. This may help explain the
expansion of the private sector, as teachers are able to obtain more payments from
students and their families. Also, the previously cited child labor study noted that some
young people from the interior regions of the country complained about surcharges for
textbooks.
There is little information about actual teaching quality in the country. Bivini Mangue’s
(2015) review notes the problematic school administration process of placing new and
inexperienced teachers in the earliest grades (primer ciclo) and reserving the more ‘prestigious’
higher grades for teachers with more experience. PRODEGE conducted a number of research
44
Corbo 2014.

71
studies on teaching,45
which provide a wealth of information about teachers, including their
opinions, challenges facing the sector, and activities in the classroom. However, this appears to
be virtually the only source of information of this kind.
Overall, the PRODEGE studies found that classes in EQG tend to be teacher dominated, with
a heavy reliance on dictation and copying and less use of problem solving and student-
initiated dialog. This emphasis on ‘traditional teaching’ served as a motivator for PRODEGE’s
focus on active and participative teaching methods as part of their training, which is ongoing.
In sum, the recent focus on teacher training—especially within PRODEGE—is a reflection
of well-grounded concerns about teacher training levels, capacity, and their work in the
classroom. However, there are likely to be limitations to training efforts that focus on in-service
teachers, which is returned to later on in the discussion of the PRODEGE experience. Making
the teaching profession more attractive is another key issue, which likely means raising salaries.
Improving the teaching and learning environment is also necessary, which includes addressing
basic deficiencies related to materials (textbooks and other materials) and infrastructure, as well
as community involvement (see section 4.3.4 below).
4.3.3. Student Outcomes
Discussions of school quality in EQG on the basis of actual outcomes tend to focus on two sets
of results. First, there are the grade repetition and dropout rates, which are very high across the
basic education sequence, especially in the earliest grades. Second, the results on the Prueba de
Selectividad, applied at the end of the Bachillerato sequence, are also referenced as a measure
for how the system is performing.
Both sets of results have some utility for measuring quality and monitoring progress, but they
also have some limitations. Measures of student flow (repetition, dropout, and so on) are
certainly relevant, but they are only indirect measures of what students are actually
learning and what kinds of skills they are obtaining. Repetition and dropout are often
attributed to low achievement, but as discussed in earlier sections, there are other, systemic
factors that can affect student flow measures.
The Selectividad provides information on actual student competencies at the end of the
basic education sequence (high school), but the problem is that this information is only
applicable to a reduced set of students. A series of filters are in place, beginning with the
‘natural’ filtering—dropout and repetition—that takes place between grades 1 and 12. And even
among grade 12 students, not all are allowed to take the Selectividad exam. An additional filter is
implemented that restricts the eligible Grade 12 population.
The Selectividad acts as a form of entrance exam for the national university, which is
consistent with the low pass rates. In 2015, only 18.8 percent (or 501) of the 2,683 students
who took the exam received a passing score. The pass rate was higher in the Continental region
45
These took place mainly during 2008–2011 (PRODEGE I) and include a diagnostic study of teaching in the
country (PRODEGE 2009) and other studies on the impact of PRODEGE-led training related to active and
participative teaching methods (PRODEGE 2011), among other studies.
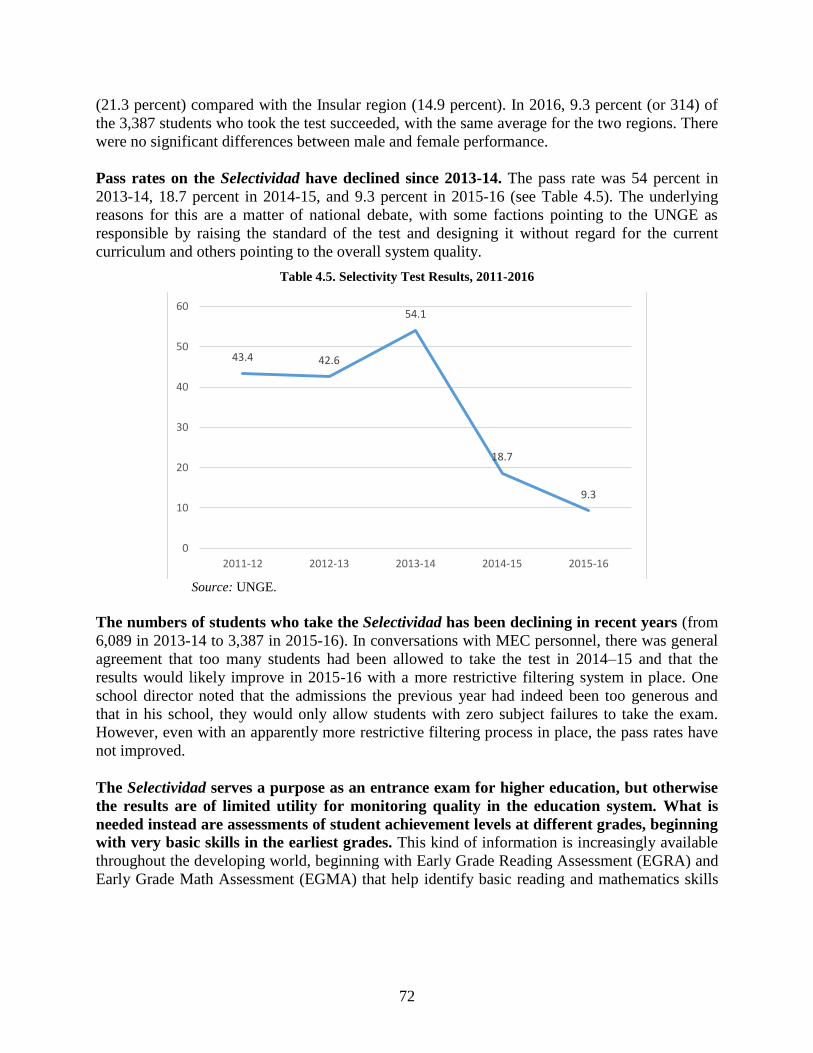
72
(21.3 percent) compared with the Insular region (14.9 percent). In 2016, 9.3 percent (or 314) of
the 3,387 students who took the test succeeded, with the same average for the two regions. There
were no significant differences between male and female performance.
Pass rates on the Selectividad have declined since 2013-14. The pass rate was 54 percent in
2013-14, 18.7 percent in 2014-15, and 9.3 percent in 2015-16 (see Table 4.5). The underlying
reasons for this are a matter of national debate, with some factions pointing to the UNGE as
responsible by raising the standard of the test and designing it without regard for the current
curriculum and others pointing to the overall system quality.
Table 4.5. Selectivity Test Results, 2011-2016
Source: UNGE.
The numbers of students who take the Selectividad has been declining in recent years (from
6,089 in 2013-14 to 3,387 in 2015-16). In conversations with MEC personnel, there was general
agreement that too many students had been allowed to take the test in 2014–15 and that the
results would likely improve in 2015-16 with a more restrictive filtering system in place. One
school director noted that the admissions the previous year had indeed been too generous and
that in his school, they would only allow students with zero subject failures to take the exam.
However, even with an apparently more restrictive filtering process in place, the pass rates have
not improved.
The Selectividad serves a purpose as an entrance exam for higher education, but otherwise
the results are of limited utility for monitoring quality in the education system. What is
needed instead are assessments of student achievement levels at different grades, beginning
with very basic skills in the earliest grades. This kind of information is increasingly available
throughout the developing world, beginning with Early Grade Reading Assessment (EGRA) and
Early Grade Math Assessment (EGMA) that help identify basic reading and mathematics skills
43.4 42.6
54.1
18.7
9.3
0
10
20
30
40
50
60
2011-12 2012-13 2013-14 2014-15 2015-16

73
among young students, complemented by end-of-cycle standardized tests in grades 3, 6, 9, and so
on that are used to monitor systemic progress on the basis of student achievement levels.46
Collecting data on student achievement outcomes is not the only ‘outcomes-based’ approach to
monitoring system performance. Data can also be collected on teaching outcomes to give a
better idea of the teaching and learning environment itself. In many countries (including EQG),
this type of monitoring is carried out, in theory, by the inspection system. But it is also important
to have information on what students can actually do, which is where test-based outcome
monitoring comes in.
The literature review for this diagnostic only identified a couple of data collections where
information on student achievement levels in EQG was measured using standardized tests. This information again comes from the PRODEGE I period, when program staff applied
standardized tests to monitor the impact of teacher training activities and the implementation of
the Escuela Activa model. The samples were created as program evaluation samples rather than
being nationally representative, but the results still provide useful information about student
achievement levels in early grades.
The results from the PRODEGE studies (2008-2011) largely confirm the kinds of concerns
about school quality that have been detailed throughout this diagnostic. Standardized tests
(applied individually or ‘one on one’, like an interview) were used to measure student skills in
language and mathematics across a cohort of students who were in grade 1 in 2008, followed up
in 2009 and 2010, and then in a separate group of grade 1 students in 2011. The results show that
reading and writing skills were very low. For example,
At the time of the 2011 test application in grade 1, 60 percent of the students were
classified as Low Achievement (Dominio Bajo) in the Common Words reading section,
meaning that they were unable to read any words or could only read part of a single
word;
In 2011, more than 70 percent of grade 1 students were classified as Low Achievement in
the other (non-reading) test components;
At the end of grade 1, relatively few students were able to write more than five words.
This average was somewhat higher among older children (sobre-edad) compared with
children of the correct age for their grade;
The results in mathematics were also low, as less than 10 percent of grade 1 students
achieved a ‘High Achievement’ level; and
Students who had been exposed to Escuela Activa generally had better results in
language, but the results in mathematics were similar. The apparent effect in language is
an important result given the emphasis of the teacher training in recent years on this
methodology. But it is important to note that the positive impacts were relatively small
and that overall achievement levels in early grades were still quite low.
46
See Clarke (2011) for a review of different kinds of assessment activities.
74
High repetition and dropout rates, low pass rates on the Selectividad exam, and low scores
on standardized tests applied during PRODEGE testing all point to the same conclusion:
students are not reaching the expected, or minimum, learning levels on the official
curriculum. This is not an unusual result—even in industrialized countries—and it is important
to put these kinds of findings into the proper perspective. Simply stated, what they suggest is that
the system is not performing as well as it should be. This does not mean that teachers or students
or parents “are to blame.” It simply means that more work is needed to improve quality, and
based on some initial results from PRODEGE, there already has been some improvement.
4.3.4. Community Participation
Community participation is a potentially important aspect of the schooling environment. Parents
and community members can help schools with basic repairs and maintenance, as well as
participate in school activities, help their children with homework, and even work alongside
teachers and school directors to make decisions about school management. Making parents and
community members genuine partners in the schooling process is a considerable challenge, even
as part of interventions (like school grants) that explicitly require parents to take on management
and advisory roles. Nevertheless, some amount of parental and community engagement in the
school is necessary.
The evidence on community participation in EQG suggests that the links between schools
and parents are quite weak. During the school visits, school directors and teachers complained
about what they perceived as a lack of interest on the part of parents. Most schools have parental
associations in place (Asociación de Padres), but they appear to have limited involvement in the
school after the initial enrollment phase when textbooks are purchased, fees are paid, and
children are formally entered into school.
There is some data to support the qualitative evidence on weak community engagement
obtained during the field visits. PRODEGE’s (2011) study on teacher quality cites data from the
first Anuario data collection (not presented in Anuario report). They show that most teachers
(about 80 percent) report that parents participate in the initial enrollment of their children and
come to the school when asked. But the other indicators show far less involvement: parents
participate in activities related to security, maintenance, and school management in only about
30 percent of schools (according to teachers). In a separate PRODEGE study on the impact of
the teacher training, a survey of teachers in 2010 found that only about 20 percent reported that
parents regularly helped clean the school or contribute resources.47
One of the goals of the teacher training efforts organized by PRODEGE is to stimulate more
involvement of the community in the school, as well as more involvement of teachers in the
community itself. The results from the initial PRODEGE surveys show some limited impact
along these lines, although the authors note that in comparison with classroom aspects, the
community participation indicators did not change much as a result of the trainings.
These kinds of results are, again, not unusual in the developing world. Poor parents, or parents
with low levels of education, may not feel comfortable engaging with the school. They may have
47
PRODEGE 2011.

75
limited time to do so or not have much to contribute. Also, school personnel often see parents as
simply a supply of labor for school cleaning or maintenance but are not interested in their
participation in other aspects of school. These are not easy attitudes to change (on both sides),
but it does seem clear that more can be done in EQG to stimulate community involvement in the
school, which in turn has the potential to help improve quality. Once again, the initial steps taken
as part of PRODEGE provide some useful experiences to build on. (Appendix G outlines lessons
learned from the PRODEGE project.)
This section focuses on data availability, capacity, and future data and research needs. Data and
research capacity are critical to help inform stronger education systems for evidence-based
decision making in education. For instance, without data it is impossible to accurately assess
infrastructure needs and deploy teachers where they are needed.
4.4.1. PRODEGE/MEC Anuario
The PRODEGE-MEC statistical summary (Anuario) has provided an increasingly
sophisticated system that now covers preprimary, primary, and secondary (plus Technical
and Vocational Education and Training [TVET] recently added in 2014–2015) education
levels. However, based on interviews with the MEC and PRODEGE personnel, there are a
number of challenges facing this system, especially since PRODEGE is scheduled to end in
2019. In terms of capacity building, despite increased capacity since the beginning of this
process, there is still some technical assistance provided via PRODEGE in the form of
international consultants. The goal is to slowly remove the assistance and ensure that the MEC
team that is responsible for the Anuarios can independently complete the process, including data
management functions and high-quality data collection. PRODEGE is in the process of
developing a sustainability plan for the Anuario process that guarantees that the function
continues into the post-PRODEGE period.
The largest problem is incomplete information from schools. The MEC staff observed that
almost all schools are reporting information to the MEC, but that the information is not always
complete (that is, missing entire sections), or it does not appear to be accurate.48
Moving
forward, this issue of incomplete information is critical, since high levels of capacity in data
management and analysis will not guarantee a quality product unless the data itself are accurate
and complete.
In the future, other actors may play a role in the Anuario. The national statistics office (Instituto
Nacional de Estatistica Guinea Ecuatorial, INEGE) has expressed an interest in being more
involved in the work of the MEC Anuario, and INEGE is currently receiving technical assistance
from the World Bank. In the past there have been some problems in relations between INEGE
48
One reason why schools may not be fully engaged in the Anuario reporting process is because of the temporary
discontinuation of this function between 2012 and 2014, when PRODEGE scaled back support and the MEC did not
continue the data collection process. The complications caused by the interruption of the data collection for two
years are a reminder of how crucial it is to provide sustained support for initiatives to guarantee their
institutionalization over the long term.

76
and other entities working in the area of data and information, but it is important to note that
INEGE is the entity responsible for statistics-related research and reporting across all ministry
departments. Better coordination between INEGE and PRODEGE-MEC could therefore
potentially be useful for both entities. Appendix H has more information on the
PRODEGE/MEC Anuario.
Beyond the Anuarios, there is very limited information on education. The 2011 DHS
(EDSGE-I) is the only household survey data source that is available, and the most recent census
data are from 2001. It is not clear when the next sample-based survey is planned, but repeated
references have already been made to the importance of obtaining updated population data when
the latest census data are made public. Just having the data is one thing, but it is also necessary
that census and other information be provided to entities like PRODEGE-MEC in a timely and
effective manner (that is, providing the kinds of specific population data that are needed and not
just the standard age category summaries).
4.4.2. Education Research
In EQG, there is very little original research in education to draw on. The main source is
from the PRODEGE I period (2005–2011), which generated a large number of research studies,
bulletins, and discussion papers.49
In recent years, there has been no additional research on
education in the country, and it is not clear if PRODEGE II has new research undertakings
planned. As a result, almost all of the information available comes from the Anuarios. These are
certainly useful, but more is needed.
There are two main sources for original research in the country. The first is from education
partners such as PRODEGE, United Nations Children’s Fund (UNICEF), and other UN entities,
which historically have provided the most data and information on education in the country.
These partners must be encouraged to continue to serve this function, ideally in close
coordination with the government to ensure that the research topics are timely and relevant and
that government capacity can be developed by participating in the activities. This is a potentially
expensive undertaking, but the country cannot continue to rely solely on the Anuario for
education data. This is especially true for outcomes like student achievement, which require a
separate data collection modality (that is, an assessment project).
The second potential source of original research is the university system. UNGE staff
complained about a lack of resources for research. It is not clear what the capacity level is for
undertaking research, even if resources are available. Nevertheless, this is another modality that
should be considered as a means of generating new research on the education sector, especially
qualitative data that focus on schooling processes.
4.5.1. Higher Education
49
This research is available on the PRODEGE website (http://www.prodegeguineaecuatorial.com/wp/es/), although
the PRODEGE office also makes a CD-ROM available with a more complete summary of documents.

77
The higher education system in EQG is still relatively new and mainly consists of the
offerings at UNGE. Higher education is a stated priority of the national government and the
MEC. In terms of financing, the 2006 diagnostic showed that higher education received a
relatively large share of total education spending and more recent analysis in 2016 from the
PIMM RAS showed the concentration of public investment in higher education infrastructure
expansion (see Figure 4.1).
UNGES’ academic structure has had historically two branches: faculties offering Bachelor’s
degrees in four years (licenciatura) and university schools offering technical education diplomas
in three years. In 2015, UNGE had 4 faculties and 2 university schools in Malabo and 2 faculties
and 2 university schools in Bata. According to the total enrollment in 2015, the most popular
faculties and schools among the students were the faculty of Social Science (27 percent of
the enrollment); the school of administration (17 percent); the school of agriculture,
fishery, and forestry (13 percent); and the schools of education of Malabo and Bata,
accounting for another 12 percent of the enrollment. (Appendix J includes more information
on the university programs, students, and staffing.)
It is not possible to plot the evolution of enrollments for 2006-2015; however, a relatively simple
comparison of snapshots of the two years (2006 and 2015) provides some interesting insights on
the sense of the academic structure evolution. Compared to the 2006 figures, total enrollment has
increased more than fivefold, going from 1,466 students in 2006 to 7,971 students enrolled in
2015. Between 2006 and 2015, there was a steep decline of enrollment in the education
school. However, in 2006, the education school accounted for 37 percent of enrollment; in 2015
it accounted for only 12 percent.50
Based on interviews at UNGE, a number of challenges and issues were identified. The main
concerns are related to budgets and resources. One person noted the gap between national
priorities and goals in higher education and actual resources for implementing these goals. The
university system lacks teaching materials and adequate infrastructure, including quality Internet.
There are also limited resources available for scholarships, although it is not clear to what extent
these scholarships target poor students or are based on ability. They are likely favoring wealthier
students. There are also very few resources for research, and as a result, there are not many
research projects taking place.
Another problem is the absence of a program for training teachers at the university level. As
mentioned repeatedly, the low salaries in education provide a strong disincentive for entering this
field, which is notable, at the university level, by a lack of interest in this career.
4.5.2. Technical Education (Professional and Vocational Training)
Technical education and vocational training is divided into two categories by the MEC:
programs that are controlled and supervised by the MEC and that comply with its legal standards
and programs that, despite being formally established in the country, are not ruled by the MEC’s
rules and regulations or supervision and are not complying with the MEC standards and
50
All the other programs’ shares remained relatively stable, with the exception of the faculty of letters and social
science that has increased its participation from 12 percent in 2006 to 27 percent in 2015.

78
regulations. The MEC has 27 families of programs with around 130 titles and grades governed
by the actual norms and regulations. There are two levels of technical education: a basic two-
year cycle and a more advanced two-year cycle. Appendix I includes more information on the
professional and vocational training.
As is the case with university education, professional and technical education is
concentrated in Malabo, with 60 percent of the enrollment in 2015 and 55 percent in 2014.
Unlike university education, technical and professional education is dominated by female
students. This female dominance is more evident in some specific programs such as
administrative studies and support for business administration, nursery, and secretarial studies
for the basic cycle. For the advanced cycle administrative duties, human resources and finance
and banking are the most representative.
In another contrast with the higher education offered by UNGE, technical and professional
education is driven mainly by the private sector. In the basic cycle, 22 percent and 33 percent
of the total enrollment is represented by private offer for the basic cycle in 2014–15 and 2013–
14, respectively. The advanced cycle is driven almost entirely by private institutions, including
95 percent of students.
Vocational training aims at developing skills oriented toward the labor market and in close
coordination with specific private sector needs and performances. As is the pattern for
technical education, vocational training presents an even more markedly female enrollment of 72
and 81 percent for 2014-15 and 2013-14, respectively.
However, the programs do not seem to be well matched with economic opportunities. Very
few programs aim to develop skills for agriculture and fishery, two of the sectors the government
has identified as potential engines of the economy to help balance with the oil sector. Also, skills
are not abundant in the construction sector, which is not coping with the needs of the second-
largest source of GDP growth during the past years.
5. Part C: Policy Options
The GoEG has articulated clear goals for education. These include (a) ensuring universal
coverage in preschool and primary education, and a 98 percent gross enrollment rate in
secondary education; (b) improving the quality of education, including adequate teacher
preparation; (c) eliminating gender discrepancies at all levels; and (d) improved and expanded
professional, technical, and higher education adapted to the necessities of the labor market.
These goals are well focused on the key target groups and strategic areas in the country.
The following policy recommendations provide options to reach the government’s four
goals as well as an additional goal of improved education financing, taking into
consideration the current economic crisis in the country. The recommendations attempt to
reflect promising solutions to maintain access to education and basic school functioning,
especially for poor children, while improving school quality and systems data.
Increasing enrollment in preschool, primary, and secondary education

79
Demand-side interventions to prevent dropout and keep poor children in school
The main reasons for dropout during the school year were identified as child sickness, lack of a
teacher, and lack of money to pay for studies. In a situation of economic crisis, where enrollment
may already be decreasing, the ability to pay for school or related expenses (school supplies,
transportation, clothes, etc.) is likely to diminish. Some options to reduce dropout and keep poor
children in school include cash transfers (either unconditional or conditioned on school
attendance), school feeding, and transportation subsidies. According to the information in this
diagnostic there is no such program in EQG so it could be difficult to begin to implement such an
intervention, unless started on a small scale with a focus on children most at risk. Adolescent
girls could be a target of these transfers to maintain their attendance in secondary school.
Comprehensive approach to reduce grade repetition
Addressing the problem of high repetition rates in primary school requires a comprehensive
approach. This would consist of several aspects: (i) expansion of pre-primary, (ii) enforcement of
age requirements in primary; and (iii) a clear threshold for repetition rates coupled with
personalized attention to the weakest students.
Ensuring access to quality preschool is the best way to prepare young people for primary school,
which in turn can reduce repetition and dropout rates. There is a significant geographic disparity
in preschool access in EQG with 75 percent of preschool enrollment in urban areas. Access in
rural areas could be expanded through the creation of community-based preschools, expansion of
public provision, or the addition of private preschools, provided there is sufficient monitoring
and oversight by the MEC.
Early entry into primary, before the official entry age of seven, is fairly common. According to
the 2014-15 Anuarios, nearly one-third of grade 1 entrants in 2014-15 were below seven years of
age at the national level and 42 percent in the Insular zone. Enforcement of entry age
requirements in primary would prevent younger children from joining too early, thereby
allowing teachers to focus on ensuring learning and grade progression for the age-appropriate
students in the class.
A clear threshold for repetition rates, coupled with personalized attention to the weakest students
could allow the MEC to better limit repetition rates. For example, a threshold of 10 percent
repetition could be held, with the rest of the children automatically progressing with additional
attention for the weakest students to ensure they can learn and perform in the subsequent grade.
Improving the quality of education
School grants to improve basic school conditions
Learning materials (such as textbooks) and infrastructure deficiencies, including poorly
resourced and dilapidated schools and classrooms, have been identified as key constraints
limiting the country’s ability to achieve a basic set of quality conditions for students to learn in
EQG. One solution to these problems is the provision of school grants, that is, cash grants that

80
are disbursed to schools to address priorities as defined by the school and local community.
Activities like purchasing textbooks and other learning materials as well as improving physical
conditions (and school maintenance) are commonly supported by school grants. The overarching
goals of school grant programs are to improve school conditions for learning while also using the
planning and execution process to improve school management capacity as well as strengthen
the interface with parents and the community. School grants therefore have a lot of potential to
address a range of needs in EQG schools, with the added advantage that the grant does not have
to be a ‘one size fits all’ intervention. Grants can also be targeted to the regions and schools with
greatest need and be made conditional on the achievement of simple education outcome/output
indicators to increase school accountability for results.
Teacher sector reform
In the context of economic crisis in EQG, there is a risk of increased teacher absenteeism (for
example, if teachers do not receive regular payment from the Government or seek other work to
earn enough money) and diminished investment in teacher training due to limited financial
resources. In such a situation, it is critical to ensure first, that teachers continue to show up at
schools to teach children and, second, that the quality of teaching is as high as possible.
According to a series of workshops conducted by PRODEGE in 2016, it was identified that
neither school principals nor academic department coordinators are supervising the issue of
absenteeism. It would be important, then, to ensure that such monitoring takes place. that public
school teachers receive consistent payment, especially those working in areas most affected by
the crisis, and that mechanisms are in place to replace teachers that are not showing up.
To ensure high quality teacher training, there is a need to ensure sufficient Government resources
are allocated to pre- and in-service training. Indeed, training must be strengthened to better orient
teachers to effective pedagogies (for example, child-centered rather than teacher-dominated) and
classroom techniques. There is a particular need to ensure improved training of preschool
teachers, who are currently the least trained, since research shows that quality preschool
education can contribute to reducing grade 1 repetition, a significant problem in the country. An
alternative teacher training program, such as a shorter condensed program, particularly for
teachers in rural areas, could be developed to expand the number of teachers in the short term,
with a path to certification planned over time.
Improving data collection, data quality, and analysis to improve the evidence-based policy
planning process
Improving data collection, data quality, and analysis can be supported by three specific policy
actions. First, a Service Delivery Indicator (SDI) study would be useful as a way to obtain more
data on service delivery in EQG, especially given the lack of data and the potential effect of the
economic crisis. A Service Delivery Indicator (SDI) study uses a set of education indicators to
examine the effort and ability of staff and the availability of key inputs and resources that
contribute to a functioning school. The surveys measure the performance and quality of
education services using cutting-edge methodologies and a high degree of quality assurance and
generate nationally representative indicators, disaggregated by rural and urban location, and
public and private provider type. The survey instrument is nimble allowing for relatively rapid
fieldwork and data analysis, making it more useful for decision making and policy discussions.

81
This would provide data to shape policy decisions regarding teachers, learning materials, and
other inputs needed to ensure school quality. Ideally, some of the key questions could eventually
be integrated into the EMIS.
Second, learning assessment can provide up-to-date information on student achievement levels in
different grades (and subjects), and also help create a ‘culture of assessment’ in the country,
which can in turn facilitate more expansive quality monitoring and support activities later on. To
fill the gap in learning assessment data in EQG, it is recommended that sample-based
assessments take place at different grade levels to determine how well students in specific grades
are able to answer questions taken from the official curriculum. For example, the Early Grade
Reading Assessment (EGRA) and Early Grade Math Assessment (EGMA) could provide insight
into how well the youngest children are learning while there is still time to adjust teaching
methods and ensure they learn in subsequent years. Results can be used to inform and adapt the
teacher training system improvements noted earlier.
Third, high quality support and monitoring is needed. Having a strong Education Management
Information System (EMIS) in place provides a foundation for an effective overall monitoring
system, with the added advantage of making schools comfortable with a system where data is
collected on an annual basis. The Anuario process that was implemented as part of PRODEGE
has served a critical function in a data-constrained environment and should be strengthened to
guarantee that it continues to provide at least a minimum amount of annual information on all
schools. The ultimate goal is a strong, two-way flow of information where schools are being
constantly monitored to define their needs, this information is then processed at different levels,
and then information flows back to the schools in the form of support intended to address their
specific needs.
Eliminating gender discrepancies in enrollment
Support for adolescent girls and early childhood development
The critical period for girls’ enrollment is in late adolescence. The main reasons for girls leaving
school at this time are likely related to pregnancy and starting their own families, work demands
at home to take care of other family members, or a household aversion to continuing the
educational investment for girls, especially as the direct and indirect costs increase by
educational level. To address this increase in girls’ dropout rates in late adolescence in EQG, the
most at-risk adolescent girls should be targeted with comprehensive programs including
mentorship, financial assistance, childcare support, and sexual and reproductive health services.
This would require collaboration across ministries of health, education, and so on. It would also
be beneficial to remove the ban on pregnant teenage girls staying in school, if it is still in place.
Children of teenage mothers are at higher risk of illness, poor nutrition, and mortality than
children of older mothers. At the same time, adolescent mothers are less likely to take preventive
measures to ensure their children’s health and nutrition, which can adversely affect cognitive and
socioemotional development and learning and put children of teenage mothers at higher risk of
poor development outcomes. Therefore, early childhood development support for these children
is critical. This could be parenting counseling for adolescent mothers and other caregivers

82
(perhaps delivered through the health system), subsidized access to childcare (ideally near the
adolescent mother’s school), and financial support.
Education financing
Identification of priority spending needs and plans for execution
To guarantee the necessary inputs for a quality education system, education financing must be of
sufficient size and prioritized according to the greatest needs—rather than the current bias
toward infrastructure and higher education. For example, there is the consistently low spending
on preschool in EQG and yet preschool is critical for building the foundation of children’s
learning and preparing them to be successful in primary school. Given the conditions of
economic crisis in EQG, it is essential to identify the most important budget lines to maintain
basic education functioning and then ensure that the available money is actually disbursed. This
requires identifying spending needs and laying out detailed plans for how these will be executed,
with specific goals and targets.
Improved monitoring and evaluation of private schools and support for Strengthening Public Private Partnerships (PPPs)
Given that both primary and secondary education is becoming more private in EQG, it would be
important to better monitor and evaluate the supply, quality, and cost of private education. Based
on this information, there could be opportunities to strengthen Public Private Partnerships
(PPPs), including, for example, better design of the subsidies provided by Government to private
schools, such as tying the funding to specific process and performance results for private schools.

83
6. References
Bivini Mangue, Santiago. 2015. “Informe Temático Sobre el Objetivo de Desarrollo del Milenio
#2: Lograr la Enseñanza Primaria Universal.” Malabo, EQG: UNICEF y PNUD.
Bolobo Ekobo, P. 2001. El estudio de perspectivas del sector forestal en Africa: La República de
Guinea Ecuatorial: FOSA.
Clarke, Marguerite. 2011. “Framework for Building an Effective Student Assessment System.”
READ/SABER Working Paper, World Bank, Washington, DC.
Corbo, Gabriel. 2014. “Empleo Juvenil en Guinea Ecuatorial: la dinámica del mercado laboral y
la educación.” Malabo, EQG: PNUD.
DHS (Demographic and Health Survey) 2011. Ministerio de Sanidad y Bienestar Social,
Ministerio de Economía, Planificación e Inversiones Públicas, e ICF International. 2012.
“Encuesta Demográfica y de Salud (EDSGE-I) 2011.” Calverton, Maryland, USA.
Dyombe, Marlène Evita. 2009. El sistema educativo en Guinea Ecuatorial, Educación y Futuro
Digital.
http://www.cmeyanchama.com/Documents/Guinee/marlene_Educacion_en_Guinea.pdf
[downloaded June 24, 2016].
Freedom House. 2017. “Freedom in the World 2017.” www.freedomhouse.org.
Maroto Blanco, Jose Manuel. 2014. “La Ayuda Oficial al Desarrollo española en Guinea
Ecuatorial: un análisis crítico.” Cuadernos Geográficos 53 (1): 1–27.
OECD (Organisation for Economic Co-operation and Development). 2016. “Education at a
Glance.” OECD Indicators.
PNDES review (2014) of the Plan Nacional implementation: “Invertir masivamente en
educación y sanidad.” *This is cited above in spanish as a Ministry of Economia
document
PRODEGE (Programa de Desarrollo Educativo de Guinea Ecuatorial). 2009. Docentes de la
Educación Primaria en Guinea Ecuatorial: Características y Desafíos.
———. 2011. Cambios en el Desempeño Docente en Educación Primaria.
Razquin, Paula. 2006. “Informe de Situación del Sector Educación y Lineamientos para
Fortalacer la Política Educativa.” Malabo, EG: Banco Mundial.
Rodriguez, Juan Carlos. 2012. Evaluación del EMIS en Guinea Ecuatorial. UNESCO-IIEP.

84
UNICEF (United Nations Children’s Fund), and UNESCO (United Nations Educational,
Scientific, and Cultural Organization). 2015. “Global Out of School Children Initiative
Operational Manual.” New York: UNICEF.
UNESCO (United Nations Educational, Scientific, and Cultural Organization) Institute for
Statistics. http://uis.unesco.org/en/home.
World Bank. 2004. World Development Indicators 2004.
———. 2010. Equatorial Guinea: Public Expenditure Review. World
Bank.https://openknowledge.worldbank.org/handle/10986/3011 License: CC BY 3.0 IGO.
———. 2014. What matters most for engaging the private sector in education: A Framework
Paper. World Bank Systems Approach for Better Education Results (SABER) Working
Paper Series.
———. 2015. From Mines to Minds: Turning Sub-Saharan Africa’s Mineral Wealth into Human
Capital.


![[ESTATISTICA] Mauri Guerra Estatistica Indutiva](https://static.fdocuments.net/doc/165x107/544d7a9fb1af9f674d8b45cb/estatistica-mauri-guerra-estatistica-indutiva.jpg)