EQUAL PAY AND COLLECTIVE BARGAINING - Gender …€¦ · · 2016-05-20the project ‘A future...
84
EQUAL PAY AND COLLECTIVE BARGAINING Study of national, sector-wide collective agreements
Transcript of EQUAL PAY AND COLLECTIVE BARGAINING - Gender …€¦ · · 2016-05-20the project ‘A future...

EQUALPAY AND COLLECTIVEBARGAININGStudy of national, sector-wide collective agreements

EQUALPAY AND COLLECTIVEBARGAININGStudy of national, sector-wide collective agreements

EEA GRANTS
GENDER EQUALITY
‘A future without a gender pay gap’ project
Published by:
UGT of Catalonia; Maria Aurèlia Capmany Foundation, 2015
Content development:
Aida Ruiz Franco
Pilar Castellà Orradre
Bosch i Gimpera Foundation
– Núria Pumar Beltran
– Eva Pons Parera
Design and layout:
L’Apòstrof
Legal deposit:
B 25705-2015
Acknowledgments:
Ainhoa Ayastuy Bermejo
Elisabeth Lleberia Broca
Esther Garcia Fernández
Loredana Ungurusan
M.del Mar Anaya Pareja
Paula Lama Jiménez
Paula Rodríguez Escribà

/ 3
CONTENTS
1. INTRODUCTION ................................................................................................................................. .4
2. MAP OF THE GENDER PAY GAP...................................................................................... .82.1. The Wage Structure Survey 2013 and its limitations .................................................. 102.2. Factors determining pay differentials between men and women ........................ 102.3. Wage differentials by sector ...................................................................................................... 112.4. Wage differentials by occupation ........................................................................................... 132.5. Wage differentials by working conditions: type of contract and working day ............................................................................................................................... 142.6. Wage differentials by age ........................................................................................................... 152.7. Wage distribution ............................................................................................................................ 162.8. Pay gaps in basic salaries and supplements ..................................................................... 17
3. COLLECTIVE BARGAINING AS AN INTERVENTION MECHANISM ............................................................................................ .22
3.1. The potential of collective bargaining as an instrument for change and a guarantee of equal pay ....................................................................................................243.2. Job classification: professional groups and categories..............................................263.3. Pay structures .....................................................................................................................................29
4. METHODOLOGY OF THE STUDY .................................................................................... .32
5. RESULTS AND ANALYSIS ........................................................................................................ .365.1. Data from agreements ...................................................................................................................385.2. Study of agreements ......................................................................................................................405.3. Language ..............................................................................................................................................425.4. Reference to gender equality in wages ...............................................................................435.5. Job classification structure .........................................................................................................455.6. Salary scales ........................................................................................................................................475.7. Existence of an SMG [guaranteed minimum wage] ......................................................505.8. Basic salary ..........................................................................................................................................515.9. Level of coverage of the lowest salary in the agreements in relation to the minimum wage ....................................................................................................................535.10. Wage supplements ..........................................................................................................................54
6. SUMMARY AND CONCLUSIONS...................................................................................... .666.1. Summary ...............................................................................................................................................686.2. Conclusions ..........................................................................................................................................70
7. BIBLIOGRAPHY .................................................................................................................................. .74
8. ANNEX .......................................................................................................................................................... .78

4
1

5
INTRODUCTION

6 / EQUAL PAY AND COLLECTIVE BARGAINING
Gender equality and the prohi-bition of discrimination are fun-damental rights recognized on an international, European and national level. The principle of equal pay for equal work is an important aspect of the funda-mental right to equal treatment for men and women. The stand-ards applicable in this area have a goal: achieving effec-tive equality between men and women in the workplace.
Women’s average salary con-tinues to be lower than that of men, both in the EU and in Spain. Although direct gender
discrimination no longer has a place in existing legislation, there are still several examples of indirect discrimination that give rise to a lower value being placed on certain jobs, with the consequence of lower pay for the female workforce.
In this sense, the UGT [Gener-al Workers’ Union] of Catalonia and the Maria Aurèlia Capma-ny Foundation have carried out the project ‘A future without a gender pay gap’, which aims to contribute to the fight against the pay gap by identifying fac-tors in wage structures that in-

Introduction / 7
fluence the gap. The project is funded by the financial mecha-nism of the European Econom-ic Area or EEA Grants – which are the contribution of three countries (Norway, Iceland and Liechtenstein) to reducing eco-nomic and social inequality and strengthening cooperation with beneficiary countries.
Among other actions, this re-port has been written on the causes and factors of the wage gap in the field of collective bargaining. It was based on a study of spanish national, sec-tor-wide collective agreements,
with the aim of highlighting all those factors that still exist in collective agreements and play a major role in wage differen-tials between men and women.
The report has certain limita-tions for a correct analysis of its results, while the number of ob-servations is not high enough to be able to draw conclusions and correlations between the content of agreements and their direct effects on wage condi-tions in each sector. Even so, it is a major step in the study of these relationships and opens the door to further research.

8
2

9
MAP OFTHE GENDER
PAY GAP

10 / EQUAL PAY AND COLLECTIVE BARGAINING
2.1. The Wage Structure Survey 2013 and its limitations
On 24th June, the INE [National Institute of Statistics] published the latest Wage Structure Survey (EES in its Spanish ini-tials) for 2013. This document is the main source of data for the study of wage distribution, and thus the wage gap be-tween men and women, in Spain, as it of-fers a comprehensive compilation of data on wages and wage supplements broken down by sex and sector, occupation, ori-gin, contract type and wage level, among other things, which are also comparable, since the same methodology is used for the EES throughout the European Union with the aim of learning about wage dis-tribution.
Although the information as a whole is very valuable, it should be noted that the methodology1 used to obtain the data lim-its the reading of the results, even more so in the study of wage differentials be-tween the sexes, since several categories of paid employment, specifically precar-ious and temporary employment, which are particularly common in the case of Spain, are not included,
The EES is based on a sample that ex-cludes several categories of low-paid workers, artificially increases the average wage and probably reduces the signifi-cance of wage inequality between men and women. The methodological meth-ods to which we refer are basically as fol-lows:
• They do not include paid employees in agriculture, livestock and fishing or do-mestic workers. Both sectors have very low wages and the second is very fem-inine.2
1 See the document Wage Structure Survey (EES). Methodology, INE
2 The industry ‘Household activities as employers of domestic staff; house-hold activities as producers of goods’ employed 669.800 people in 2013, 88.3% of whom were women (EPA 2013)
• It also excludes those who do not re-ceive wages in October, since another prerequisite for inclusion in the sample is to have worked for at least one other month in the same year (as well as Oc-tober). In this way, a large number of people who experience periods of em-ployment and unemployment through-out the year are excluded. Further-more, people who have not worked for a full year are awarded a wage equi-va-lent to that for continuous employ-ment. For example, a person who has only worked for two months (one of which was October) and who earned one thousand euros per month would be reflected in the EES as earning 12,000 euros, not 2,000.3
For these reasons, we can assume that the data on pay differentials between men and women that we will describe below as a result of the analysis of the in-formation offered through the EES 2013 may be understated and reflect lower wage differentials than the reality.
2.2. Decisive factors inpay differentials between men and women
Firstly, not all pay differentials between men and women entail discrimination. The ILO se-ts out a number of factors that in-fluence the observable wage differentials between men and women, which include:
• Type of work, due to occupational seg-regation based on gender (masculine occupations have higher pay than typ-ically feminine occupations) and seg-regation of employment opportunities (employment difficulties for women in certain sectors).
3 http://barometrosocial.es

Map of the gender pay gap / 11
• Type of working day, due to the unequal distribution of men and women in full and part-time employment.
• Differences in education and training, as a result of the different courses studied and access to higher education.
• Differences in labor market experience, in terms of seniority and the tasks main-ly undertaken.
• Size of the company and level of unio-ni-zation, since wage levels are often lower in small companies with lower lev-els of unionization.
• Wage discrimination, which can take many forms.
Hence, not all elements or factors that play a major role in pay inequalities between men and women (pay gap) meet the strict definition of discrimination. However, it is possible that the aforementioned factors which are not considered discriminatory are a manifestation, at least in part, of cer-
tain structural inequalities between men and women (gender gap), which may re-quire additional intervention measures.
2.3. Wage differentials by activity sector
The latest data published in the Annual Wage Structure Survey for 2013 in Spain again puts the average wage of women 24% lower than that of men. Women earn an average of 29,485 euros, compared to 31,389 euros for men.
The data collected in Table 1 shows the av-erage annual earnings of men and women in 2013 in all economic sectors and for each sector and the gap, i.e. the wage differential between men and women, expressed as the percentage difference between male and female earnings. Final-ly, we look at the level of feminization of
Table 1. Average annual earnings per employee (euros), pay gap and level of feminization of the sector
2013 Both sexes Women Men % gap % women
ALL SECTORS 22,697.86 19,514.58 25,675.17 24.0% 45.6%
B: Extractive industries 31,389.50 29,485.44 31,714.85 7.0% 13.0%
C: Manufacturing industry 26,042.43 21,464.92 27,657.92 22.4% 25.3%
D: Supply of electricity, gas, steam and air conditioning 52,827.56 44,341.93 55,348.54 19.9% 21.7%
E: Supply of water, sanitation, waste management and decontamination
25,291.38 21,693.70 26,208.70 17.2% 16.8%
F: Construction 22,720.53 20,636.21 23,067.15 10.5% 8.5%
G: Retail and wholesale, repair of motor vehicles and motorcycles 19,069.16 16,297.15 22,043.76 26.1% 49.5%
H: Transportation and storage 23,525.42 21,844.42 24,022.66 9.1% 18.0%
I: Hospitality 13,851.08 12,536.29 15,552.49 19.4% 52.5%
J: Information and communications 33,137.17 28,651.29 35,756.26 19.9% 33.9%
K: Financial services and insurance 39,607.49 33,941.56 45,963.58 26.2% 48.8%
L: Real estate 19,156.00 16,700.49 22,821.10 26.8% 58.4%
M: Professional, scientific and technical activities 25,472.07 21,226.60 30,643.51 30.7% 47.3%
N: Administrative and support services 15,809.74 13,028.72 19,466.10 33.1% 56.3%
O: Public administration and defense, compulsory social security 27,707.13 25,583.73 29,827.25 14.2% 41.0%
P: Education 21,946.95 20,974.85 23,890.76 12.2% 67.3%
Q: Health and social services 24,804.42 22,691.89 32,175.94 29.5% 77.6%
R: Arts, recreational activities and entertainment 18,101.83 15,960.79 19,938.50 19.9% 43.5%
S: Other services 16,734.95 14,190.29 21,893.63 35.2% 66.0%
Source: Compiled using data from the Annual Wage Structure Survey (2013) and Active Population Survey (2013)

12 / EQUAL PAY AND COLLECTIVE BARGAINING
each sector, i.e.the percentage of women employed in the sector in relation to the total number of employees.
If we look at each activity sector, the gen-der pay gap widens or narrows depend-ing on the sector: the figure varies from a 35.2% diffe-rential between male and female employees in ‘other services’ to as low as 7% in the extractive industries. De-spite this wide range, the fact that wom-en’s pay is lower than men’s is common to all sectors.
By studying the correlation between the level of feminization of the sector and the pay gap between men and women, we
can see that there is a certain relation-ship between the two: the higher the level of feminization of the sector, the greater the inequality in earnings between men and women. Graph 2 helps us to visualize what is described above: the most femi-nized sectors, such as ‘other services’, ‘ad-ministrative and support services’, ‘health and social services’, ‘real estate’, ‘financial services and insurance’ and ‘retail and wholesale’, have a greater pay differen-tial between men and women. The highly feminized sectors of ‘hospitality’ and ‘edu-cation’ are an exception; by contrast, they have lower levels of wage inequality. Even so, there is a correlation between the level
Graph 1. Level of wage gap and feminization, overall and by economic sector (2013)
Source: Compiled using data from the Annual Wage Structure Survey (2013) and Active Population Survey (2013)
ALL SECTORS
S: Other services
N: Administrative and support services
M: Professional, scientific and technical activities
Q: Health and social services
L: Real estate
K: Financial services and insurance
G: Retail and wholesale, repair of motor vehicles and motorcycles
C: Manufacturing industry
R: Arts, recreational activities and entertainment
D: Supply of electricity, gas, steam and air conditioning
J: Information and communications
I: Hospitality
E: Supply of water, sanitation, waste management and decontamination
O: Public administration and defense, compulsory social security
P: Education
F: Construction
H: Transportation and storage
B: Extractive industries
24%
35.2%
33.1%
30.7%
29.5%
26.8%
26.2%
26.1%
22.4%
19.9%
19.9%
19.9%
19.4%
17.2%
14.2%
12.2%
10.5%
9.1%
7%
45.6%
66%
56.3%
47.3%
77.6%
58.4%
48.8%
49.5%
25.3%
43.5%
21.7%
33.9%
52.5%
16.8%
41%
67.3%
8.5%
18%
13%
gap
feminization
Map of the gender pay gap / 13
of feminization of a sector and its level of wage inequality.
The high level of feminization of some sectors reflects the horizontal segrega-tion suffered by women in the labor mar-ket: they are employed in particular oc-cupations in the service and care sectors. We see that, in turn, it is these sectors where the pay differential between the sexes is greatest, since they are probably the worst paid and placed on lower levels of the job classification system (vertical segregation).
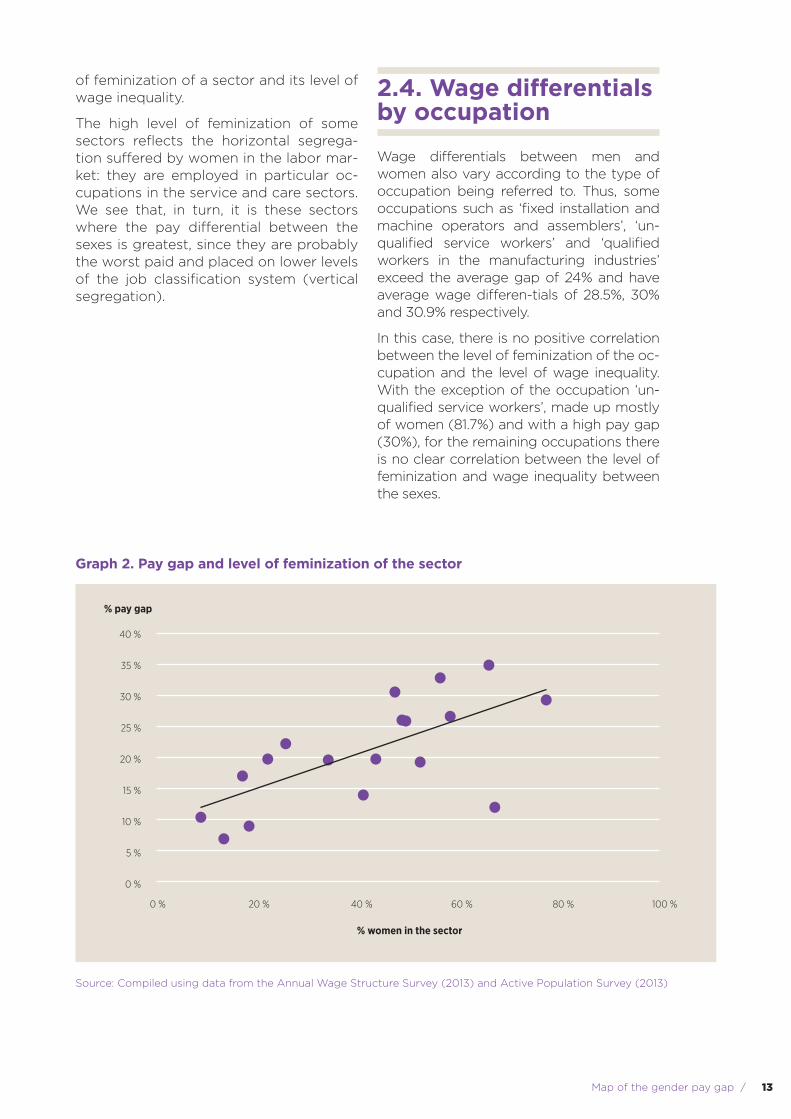
2.4. Wage differentials by occupation
Wage differentials between men and women also vary according to the type of occupation being referred to. Thus, some occupations such as ‘fixed installation and machine operators and assemblers’, ‘un-qualified service workers’ and ‘qualified workers in the manufacturing industries’ exceed the average gap of 24% and have average wage differen-tials of 28.5%, 30% and 30.9% respectively.
In this case, there is no positive correlation between the level of feminization of the oc-cupation and the level of wage inequality. With the exception of the occupation ‘un-qualified service workers’, made up mostly of women (81.7%) and with a high pay gap (30%), for the remaining occupations there is no clear correlation between the level of feminization and wage inequality between the sexes.
Graph 2. Pay gap and level of feminization of the sector
Source: Compiled using data from the Annual Wage Structure Survey (2013) and Active Population Survey (2013)
40 %
35 %
30 %
25 %
20 %
15 %
10 %
5 %
0 %
0 % 20 % 40 % 60 % 80 % 100 %
% pay gap
% women in the sector
14 / EQUAL PAY AND COLLECTIVE BARGAINING
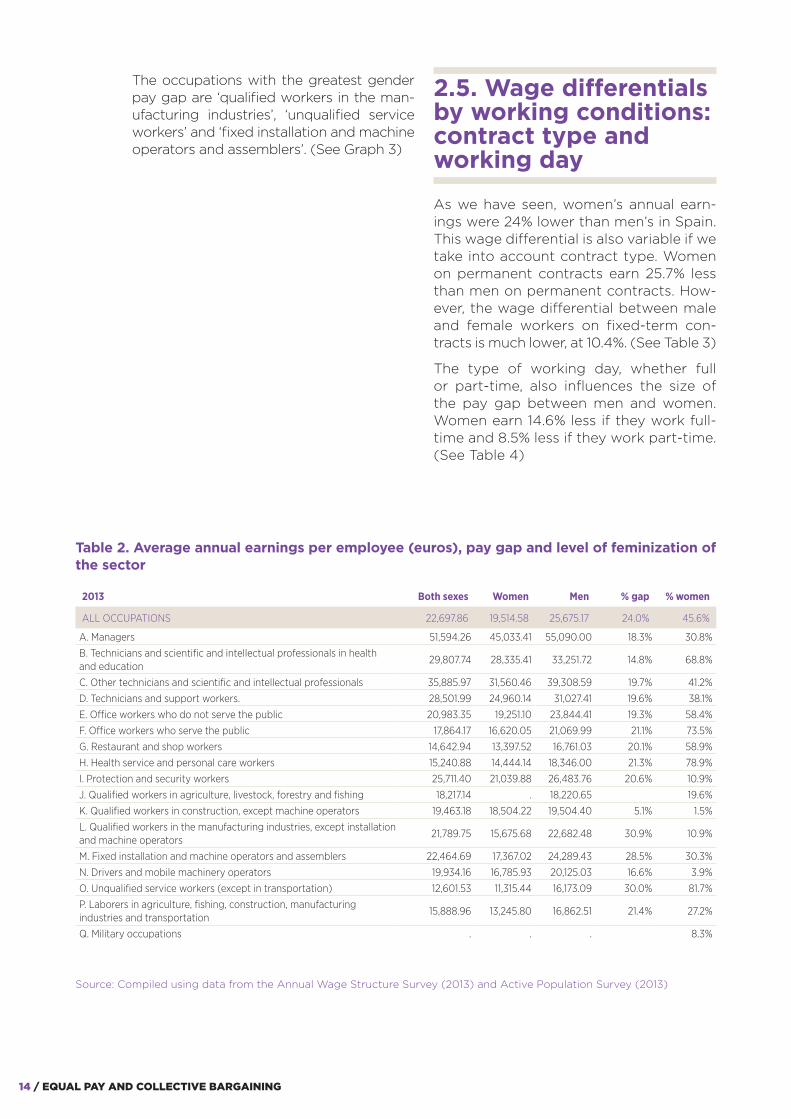
The occupations with the greatest gender pay gap are ‘qualified workers in the man-ufacturing industries’, ‘unqualified service workers’ and ‘fixed installation and machine operators and assemblers’. (See Graph 3)
2.5. Wage differentials by working conditions: contract type and working day
As we have seen, women’s annual earn-ings were 24% lower than men’s in Spain. This wage differential is also variable if we take into account contract type. Women on permanent contracts earn 25.7% less than men on permanent contracts. How-ever, the wage differential between male and female workers on fixed-term con-tracts is much lower, at 10.4%. (See Table 3)
The type of working day, whether full or part-time, also influences the size of the pay gap between men and women. Women earn 14.6% less if they work full-time and 8.5% less if they work part-time. (See Table 4)
Table 2. Average annual earnings per employee (euros), pay gap and level of feminization of the sector
Source: Compiled using data from the Annual Wage Structure Survey (2013) and Active Population Survey (2013)
2013 Both sexes Women Men % gap % women
ALL OCCUPATIONS 22,697.86 19,514.58 25,675.17 24.0% 45.6%
A. Managers 51,594.26 45,033.41 55,090.00 18.3% 30.8%
B. Technicians and scientific and intellectual professionals in health and education
29,807.74 28,335.41 33,251.72 14.8% 68.8%
C. Other technicians and scientific and intellectual professionals 35,885.97 31,560.46 39,308.59 19.7% 41.2%
D. Technicians and support workers. 28,501.99 24,960.14 31,027.41 19.6% 38.1%
E. Office workers who do not serve the public 20,983.35 19,251.10 23,844.41 19.3% 58.4%
F. Office workers who serve the public 17,864.17 16,620.05 21,069.99 21.1% 73.5%
G. Restaurant and shop workers 14,642.94 13,397.52 16,761.03 20.1% 58.9%
H. Health service and personal care workers 15,240.88 14,444.14 18,346.00 21.3% 78.9%
I. Protection and security workers 25,711.40 21,039.88 26,483.76 20.6% 10.9%
J. Qualified workers in agriculture, livestock, forestry and fishing 18,217.14 . 18,220.65 19.6%
K. Qualified workers in construction, except machine operators 19,463.18 18,504.22 19,504.40 5.1% 1.5%
L. Qualified workers in the manufacturing industries, except installation and machine operators
21,789.75 15,675.68 22,682.48 30.9% 10.9%
M. Fixed installation and machine operators and assemblers 22,464.69 17,367.02 24,289.43 28.5% 30.3%
N. Drivers and mobile machinery operators 19,934.16 16,785.93 20,125.03 16.6% 3.9%
O. Unqualified service workers (except in transportation) 12,601.53 11,315.44 16,173.09 30.0% 81.7%
P. Laborers in agriculture, fishing, construction, manufacturing industries and transportation
15,888.96 13,245.80 16,862.51 21.4% 27.2%
Q. Military occupations . . . 8.3%

Map of the gender pay gap / 15
The higher pay gap between men and women with better working conditions –on permanent, full-time contracts– may be due to a more complicated pay struc-ture for these conditions, with wage sup-plements and other economic benefits linked to stability.
2.6. Wage differentials by age
The gender pay gap also varies accord-ing to age range. As shown in Table 5 and Graph 4, there seems to be a certain correlation between this variable and the level of wage inequality since, in general, the gap increases as the age of workers increases.
Graph 3. Pay gap overall and by major occupational group (2013)
Source: Compiled using data from the Annual Wage Structure Survey (2013). *No information
ALL OCCUPATIONS
L. Qualified workers in the manufacturing industries, except installation and machine operators.
O. Unqualified service workers (except in transportation)
M. Fixed installation and machine operators and assemblers
P. Laborers in agriculture, fishing, construction, manufacturing industries and transportation
H. Health service and personal care workers
F. Office workers who serve the public
I. Protection and security service workers
G. Restaurant and shop workers
C. Other technicians and scientific and intellectual professionals
D. Technicians and support workers
E. Office workers who do not serve the public
A. Managers
N. Drivers and mobile machinery operators
B. Technicians and scientific and intellectual professionalsin health and education
K. Qualified workers in construction, except machine operators
J. Qualified workers in agriculture, livestock, forestry and fishing*
Q. Military occupations*
24.0%
30.9%
30.0%
8.5%
21.4%
21.3%
21.1%
20.6%
20.1%
19.7%
19.6%
19.3%
18.3%
16.6%
14.8%
5.1%

16 / EQUAL PAY AND COLLECTIVE BARGAINING
Again, older women suffer limitations in their professional and wage develop-ment because of the so-called ‘glass ceil-ing’ and the need to balance work and family life, which falls mainly on older women.
We can see the difference in income be-tween men and women over 65 (retire-ment age), which increases to 41.2%. As described by Nuria Pumar, ‘social pro-tection policies are not neutral in rela-tion to the social roles assumed by men and women with regard to the family and labor relations. The social and eco-nomic subordination of women and the traditional division of social roles condi-tion this neutrality, and social protection systems themselves may perpetuate or even reinforce women’s social disadvan-tage’.4
The contributory social security system in Spain financially penalizes the poorer career paths of women in receipt of con-tributory pensions, paths influenced by working in lower-paid sectors, working in inferior occupations and job categories, working part-time, working fewer hours
4 Pumar Beltrán, n. Reforma de pensiones en España, carreras profesionales irregulares e impacto de género.
and intermittent careers with entries and exits from the labor market that reduce the contribution base.
2.7. Wage distribution
The data on annual income by sex, distrib-uted according to wage level, shows that the pay gap between men and women is greater at lower wage ranges. Thus, women whose earnings are among the lowest 10% of wages (up to 7,692 euros) earn 35.6% less than their male coun-terparts. If we widen the income brack-et, wage inequality between men and women with a wage in the bottom 25% (up to 13,039 euros) decreases to 30.6%. The average inequality for the half of the population who earn up to 19,030 euros is 23%; for the top 25% of earners (up to 28,564 euros), it is 23.5%; and for the 10% of the po-pulation with the highest wages (up to 41,108 euros), it falls to 20.8%.
There is a negative correlation between the wage level and the pay gap; the high-er the wage, the lower the income ine-quality between the sexes.
Table 3. Average annual income per employee (euros), by contract type
Source: Compiled using data from the Annual Wage Structure Survey (2013).
2013 Income Both sexes Women Men % gap
TOTAL 22,697.9 19,514.6 25,675.2 24.0%
Permanent 24,333.4 20,643.2 27,768.0 25.7%
Fixed-term 15,433.1 14,570.1 16,258.1 10.4%
Table 4. Average annual income per employee (euros), by type of working day
Source: Compiled using data from the Annual Wage Structure Survey (2013).
2013 Income Both sexes Women Men % gap
TOTAL 22,697.9 19,514.6 25,675.2 24.0%
Full-time 26,345.7 23,994.3 28,095.6 14.6%
Part-time 10,056.1 9,766.2 10,670.7 8.5%

Map of the gender pay gap / 17
It should also be noted that relative in-come inequality (measured in percentag-es) is measured calculating the wage gap and not absolute in-equality (measured in euros).
2.8. Pay gap in basic salaries and supplements
The following data is taken from the INE’s four-yearly Wage Structure Survey, so it corresponds to the year 2010. It is of great interest given the information it provides on the impact of wage sup-
Table 5. Average annual income per employee (euros), by age
Source: Compiled using data from the Annual Wage Structure Survey (2013)
2013 Income Both sexes Women Men % gap
ALL AGES 22,697.9 19,514.6 25,675.2 24.0%
Under 20 7,456.6 , , ,
20-24 10,668.3 9,411.0 11,856.8 20.6%
25-29 15,587.2 14,462.3 16,853.5 14.2%
30-34 19,452.1 17,443.9 21,468.6 18.7%
35-39 22,522.1 19,659.3 25,217.7 22.0%
40-44 23,973.5 20,713.2 26,968.8 23.2%
45-49 24,781.3 20,988.0 28,371.4 26.0%
50-54 25,748.8 21,483.9 29,561.3 27.3%
55-59 27,406.1 22,563.9 31,691.4 28.8%
60-64 22,626.6 20,520.1 24,188.2 15.2%
65. 24,538.1 17,821.3 30,323.8 41.2%
Graph 4. Wage gap overall and by age group (2013)
Source: Compiled using data from the Annual Wage Structure Survey (2013)
ALL AGES
20-24
25-29
30-34
35-39
40-44
45-49
50-54
55-59
60-64
65+
24%
20.6%
14.2%
18.7%
22%
23.2%
26%
27.3%
28.8%
15.2%
41.2%

18 / EQUAL PAY AND COLLECTIVE BARGAINING
plements, overtime pay and bonuses on wage inequality.
When it talks about wage inequality or the gender pay gap, it is referring to the difference in total pay between men and women. Therefore, it is necessary to take into consideration all items of remuner-ation that make up the employee’s total pay.
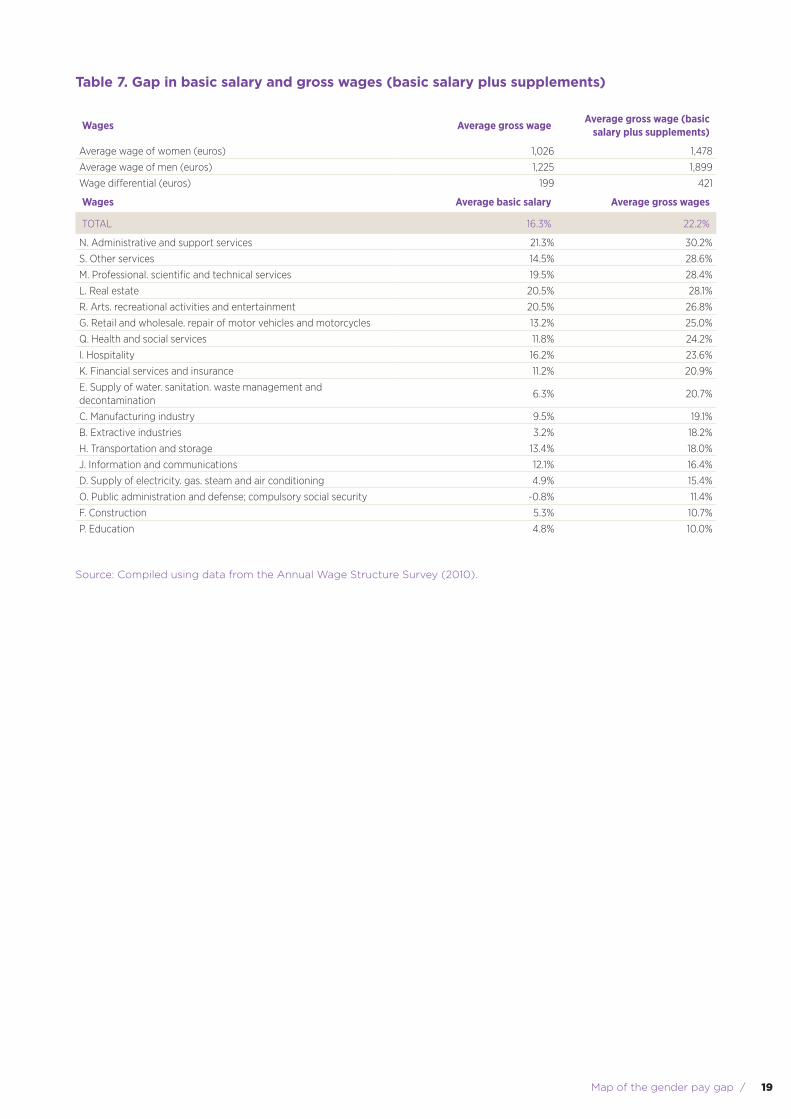
On average, the wage differential be-tween m-en and women in basic salaries is 199 euros, which is a 16.3% differential. In contrast, if we take into account sup-plements, overtime pay and bonuses, this increases to 421 euros a month, which represents a pay gap of 22.2% in gross wages. (See Table 7)
The most detailed information for each economic activity sector enables us to see how supplements and other items of remun-eration influence the gap and shows that in all sectors, supplements act as aggravating factors in inequality.
The increase in the gap caused by sup-plements and other items of remuner-ation varies from 30% to 470% in rela-tion to the gap in basic salary. It is worth noting the significant increase in the pay gap between men and women in activity sectors such as the extractive industries; supply of electricity, gas, stem and air conditioning; supply of water, sanitation and waste management; construction; health and social services; and education. (See Graph 6)
Table 6. Average annual income per employee (euros), by wage level
Source: Compiled using data from the Annual Wage Structure Survey (2013)
2013 Income Both sexes Women Men % gap
GAP IN AVERAGE WAGES 22,697.9 19,514.6 25,675.2 24.0%
Gap in the bottom 10% of wages 7,692.3 6,457.8 10,020.0 35.6%
Gap in the bottom 25% of wages 13,039.4 10,801.9 15,555.0 30.6%
Gap in the middle 50% of wages 19,029.7 16,452.4 21,371.1 23.0%
Gap in the top 25% of wages 28,563.7 24,568.8 32,114.8 23.5%
Gap in the top 10% of wages 41,108.4 36,068.8 45,516.2 20.8%
Graph 5. Wage gap overall and by wage level (2013)
Source: Compiled using data from the Annual Wage Structure Survey (2013)
GAP IN AVERAGE WAGES
Gap in the bottom 10% of wages
Gap in the bottom 25% of wages
Gap in the middle 50% of wages
Gap in the top 25% of wages
Gap in the top 10% of wages
24%
35.6%
30.6%
23%
23.5%
20.8%
Map of the gender pay gap / 19
Table 7. Gap in basic salary and gross wages (basic salary plus supplements)
Source: Compiled using data from the Annual Wage Structure Survey (2010).
Wages Average gross wage Average gross wage (basic salary plus supplements)
Average wage of women (euros) 1,026 1,478
Average wage of men (euros) 1,225 1,899
Wage differential (euros) 199 421
Wages Average basic salary Average gross wages
TOTAL 16.3% 22.2%
N. Administrative and support services 21.3% 30.2%
S. Other services 14.5% 28.6%
M. Professional. scientific and technical services 19.5% 28.4%
L. Real estate 20.5% 28.1%
R. Arts. recreational activities and entertainment 20.5% 26.8%
G. Retail and wholesale. repair of motor vehicles and motorcycles 13.2% 25.0%
Q. Health and social services 11.8% 24.2%
I. Hospitality 16.2% 23.6%
K. Financial services and insurance 11.2% 20.9%
E. Supply of water. sanitation. waste management and decontamination
6.3% 20.7%
C. Manufacturing industry 9.5% 19.1%
B. Extractive industries 3.2% 18.2%
H. Transportation and storage 13.4% 18.0%
J. Information and communications 12.1% 16.4%
D. Supply of electricity. gas. steam and air conditioning 4.9% 15.4%
O. Public administration and defense; compulsory social security -0.8% 11.4%
F. Construction 5.3% 10.7%
P. Education 4.8% 10.0%

20 / EQUAL PAY AND COLLECTIVE BARGAINING
Graph 6. Gap in basic salary and gross wages (basic salary plus supplements)
Source: Compiled using data from the Annual Wage Structure Survey (2010).
TOTAL
N. Administrative and support services
S. Other services
M. Professional, scientific and technical services
L. Real estate
R. Arts, recreational activities and entertainment
G. Retail and wholesale, repair of motor vehicles and motorcycles
Q. Health and social services
I. Hospitality
K. Financial services and insurance
E. Supply of water, sanitation, waste management and decontamination
C. Manufacturing industry
B. Extractive industries
H. Transportation and storage
J. Information and communications
D. Supply of electricity, gas, steam and air conditioning
O. Public administration and defense; compulsory social security
F. Construction
P. Education
Gap in basic salary
Gap in gross wages (plus supplements)
16.3%
21.3%
14.5%
19.5%
20.5%
20.5%
13.2%
11.8%
16.2%
11.2%
6.3%
9.5%
3.2%
13.4%
12.1%
4.9%
-0.8%
5.3%
4.8%
22.2%
30.2%
28.6%
28.4%
28.1%
26.8%
25%
24.2%
23.6%
20.9%
20.7%
19.1%
18.2%
18%
16.4%
15.4%
11.4%
10.7%
10%

Gap in basic salary
Gap in gross wages (plus supplements)

22
3

23
COLLECTIVE BARGANING
AS AN INTERVENTION
MECHANISM

24 / EQUAL PAY AND COLLECTIVE BARGAINING
3.1. The potential of collective bargaining as an instrument for change and a guarantee of equal pay
International and European organizations emphasize the complementary role of collective bargaining in achieving wage equality between men and women. As a result of this complementarity, respon-sibility for achieving wage equality is shared between:
• legislation, in accordance with the im-por-tance of a clear legal framework that establishes transparent parame-ters for collective bargaining and mini-mum wage fixing, and
• collective bargaining between employ-ees and employers, since processes for wage fixing and collective bargaining mechanisms can make an important contribution to eliminating the gender pay gap and discrimination and pro-moting equal pay.
European and national legislation sets out the need and obligation to encourage social dialog and collective bargaining in order to promote equality between men and women in the workplace.
• Pursuant to Directive 2006/54 of the European Parliament and Council (ar-ticle 21), states must encourage social partners, without prejudice to their au-tonomy, to promote equality between men and women and to conclude, at the appropriate level, agreements that establish anti-discrimination regula-tions relating to pay.
• National legislation recognizes the duty to negotiate and places it within the framework of collective bargaining. It establishes the adoption of concrete measures aimed at promoting equal treatment and opportunities in the workplace, so it is the parties, freely and responsibly, who agree the content
of agreements (article 45, LOIEMH5 [Organic Law on Effective Equality be-tween Men and Women], and article 85.1, LET6 [Law on the Statute of Work-ers’ Rights]).
Collective bargaining, understood as a tool to protect and promote the principle of gender equality, is one of the central principles of the ILO.7 Throughout its his-tory, the ILO has demonstrated the close relationship between the right to collec-tive bargaining, gender equality and the fight against gender discrimination. De-spite this partnership, the fight against gender discrimination has generally taken a separate path, without achieving a strong and indissoluble union in the im-plementation of employment systems.8
Los diferentes textos legales han estable-Various legal texts have set out the need and obligation to encourage social dialog and collective bargaining in order to pro-mote equality between men and women in the workplace.9 Thus, Directive 2006/54, on the application of the principle of equal opportunities and treatment for men and women in em-ployment, ex-pects member states, in accordance with their respective national traditions and practices, to take appropriate measures to encourage social dialog between so-cial partners, in order to promote equal
5 Organic Law for Effective Equality between Men and Women
6 Statute of Workers’ Rights
7 Declaration on Principles and Fundamental Rights at Work (1998) http://www.ilo. org/declaration/lang--es/index.htm. It advocates for the elimina-tion of discrimination in employment, insisting on the use of two fundamental tools, the application of agreement number 100 on equal pay, 1951, and agreement number 111 on discrimination in employ-ment, 1958.
8 See Igualdad de género en la negociación colecti-va. Análisis desde la perspectiva de género de los convenios colectivos vigentes en Centroamérica y República Dominicana. San José, International Labor Organization, 2013
9 See Pérez Del río, t. “El principio de igualdad de trato y no discriminación por razón de sexo en el Derecho comunitario”, in AA.VV., coordinated by Pérez Del Río, T. y Cruz Villalón, J. Una aproximación al Derecho social comunitario, Tecnos, 2000.

Collective bargaining as an intervention mechanism / 25
treatment. It must also be remembered that ILO agreements no. 100 and 111 rec-ognize the fundamental role that employ-ers’ and workers’ organizations must play in the implementation of these measures in order to guarantee their effectiveness. Without real social dialog, implementa-tion of these agreements will be seriously hampered.
In general, a basic presumption of the duty of negotiation is the employer’s ob-ligation to inform employees’ represent-atives about the implementation of the principle of equal treatment. This obliga-tion is contained in the LOIEMH and, once it had been passed, was transferred to the LET. The obligation set out in the LET reproduces the provisions of Directive 2002/73/EC,10 of 23rd September 2002, which modifies Directive 76/207/EEC on the Council on the implementation of the principle of equal treatment for men and women in terms of access to employment, training and professional development, and working conditions. In this sense, the latest AINC11 [Interconfederal Collective Bargaining Agreement] has recognized this obligation.
National legislation recognizes this duty to negotiate and places the adoption of
10 Article 8.4. To this end, employers should be en-couraged to provide adequate information at ap-propriate regular intervals to employees and/or their representatives on the equal treatment of men and women in the workplace. This information may include statistics on the proportion of men and women at different levels in the organization as well as possible measures to improve the situation, agreed in conjunction with employees’ representa-tives’.
11 See III Interconfederal Collective Bargaining Agree-ment 2015, 2015, 2017. ‘CHAPTER II. 5. Information and consultation rights. Respect, develop and facili-tate (establishing procedures) the rights recognized by law (national, European and international) on in-formation and consultation in every company, for which collective bar-gaining shall take into account the following aspects: In every company: Informa-tion on the company’s financial situation and an assessment of its activities; estimates on the type and volume of contracts; statistics on the absence rate and its causes; implementation of the right to equal opportunities and treatment; and other issues under the terms provided for in Article 64 of the LET’.
concrete measures aimed at promoting equal treatment and opportunities in the workplace within the framework of col-lective bargaining so it is the parties, free-ly and responsibly, who agree the content of agreements (article 45, LOIEMH, and article 85.1, LET).
This obligation has given social partners the role of contributors who are jointly responsible for promoting gender equali-ty –equality participants– in the words of López López.12
Recently, through the Recommenda-tion of 7th March 2014, with the aim of strengthening the principle of equal pay for men and women, the European Com-mission again drew attention to collective bargaining as an ideal space to ‘address the issue of equal pay’.
This issue, in relation to the link between collective bargaining and gender, has been reflected for years in various inter-confederal collective bargaining agree-ments, as a result of the process of coop-eration and social dialog initiated in the 80s. In this way, and through successive agreements, a call was made to negotia-tors at all levels for model criteria to miti-gate the gender pay gap, advocating the establishment of a job classification sys-tem with objective and neutral criteria,13 the application of the principle of equal pay for equal work and the elimination of
12 See lóPez lóPez, Julia. ‘The guiding principles of OL [Organic Law] 3/2007 on effective equality be-tween men and women in light of the strategies of gender mainstreaming and empowerment’.
13 AINC 1997 stated that ‘sector-wide agreements should establish the model procedure at compa-ny level for adapting old professional categories to professional groups’.
ILO AGREEMENT ON EQUAL PAY, 1951 (NO. 100).
Agreement on equal pay for the male and female work-force for equal work (article 4).
All members must collaborate with interested employ-ers’ and employees’ organizations, in the manner it deems most appropriate, in order to apply the provi-sions of this agreement.

26 / EQUAL PAY AND COLLECTIVE BARGAINING
sexist titles in job classification (catego-ries, roles and tasks). Hence, equal treat-ment and non-discrimination should be important aspects for collective bargain-ing (AINC, 2003).
3.2. Job classification: professional groups and categories
What is job classification?
Job classification is the tool by which employees are systematically organized within each company. This form of organ-ization constitutes one of the basic pillars around which the system of grouping and filling jobs is established within the com-pany. Choosing a model is not a trivial matter, especially because of the impact it has on pay structures and progress to-wards equal work.
The job classification system has been structured around two figures: profession-al groups and professional categories.
• A professional group is understood as a unit of classification that groups to-gether professional aptitudes, required qualifications and general job content.
• A professional category is based on a specific identification criterion, and-tasks of a job; in short, a set of roles that require the same professional ap-titudes. This system is a combination of the tasks or roles carried out and the hierarchical level occupied in the company’s structure.
Example:
The national collective agreement of the production of vegetable preserves (Reso-lution of 31st August 2010) classifies jobs into groups and categories. For group 3, laborers and junior staff, there are also subgroups A, B, C, D and E (see page 27).
Various international texts highlight job classification systems and job assessment
methods as some of the most significant factors behind the gender pay gap. Thus, Directive 2006/54/EC, of 5th July, states the need to consider job classification systems in order to eradicate direct and indirect discri-mination. Therefore, article 4 states: ‘when a job classification system is used to determine pay, this system shall be based on criteria common to employ-ees of both sexes, and shall be established in a way that excludes sex discrimination’.
LABOR ORDINANCES
The old pre-constitutional labor ordinanc-es14 were the product of a historical and political time in which regulation of labor relations was annulled, prohibited. Thus, the ordinances were not the product of the autonomy of collective bargaining; rather, the state alone had the power to regulate.
From their creation, the ordinances reg-ulated15 among other areas, ‘the classifi-cation of staff by professional specialty, including the definitions of each of these’. Job classification was organized ma-inly around ‘groups and subgroups, and with-in these there were several categories.16
14 These came into being in 1942, with the passing of the Employment Regulation Act, ‘Article one. All topics related to employment regulation, under-stood as the systematic regulation of the minimum conditions that must be met by agreed labor rela-tions between employers and their staff in various sectors and activities, shall be the responsibility of the state, which shall exercise it, without delegation, through the Ministry of Employment, in the condi-tions established in this law by the Directorate-Gen-eral of Employment’.
15 See Article 11 of the Law on Employment Regulation: ‘The content of this employment regulation shall refer mainly to establishing conditions with regard to those who have address relations between com-panies and their staff and shall necessarily cover the following points: geographical, functional and per-sonal area and timescale in which the regulations apply; organization of work and job classification by professional specialties, including definitions of each of these; working day, pay and calculation of overtime pay (...)’.
16 See a lahera Forteza, J. “La regulación de la clasi-ficación profesional y de la promoción profesional en los instrumentos de sustitución de las ordenan-

Collective bargaining as an intervention mechanism / 27
This way of grouping and systematizing various roles around a professional group first came into being in old labor ordi-nances, and were then incorporated into Law 8/1980, of 10th March, on the Statute of Workers’ Rights17 by grouping a num-ber of factors, specifically: professional aptitudes, qualifications and general job content.
zas laborales”, in Balance material del proceso de sustitución de las ordenanzas laborales: continui-dad y crisis de sus contenidos normativos. Director: ValDés Dal-ré, F. Colección “Informe y Estudios”, Serie Relaciones Laborales, núm. 23. Madrid, 1999.
17 Article 39. ‘Functional mobility. A professional group is understood as a group that brings togeth-er professional
AGREEMENT ON FILLING GAPS18
With the proclamation in 1980 of the Law on the Statute of Workers’ Rights,19 the legislation in force until that time (labor ordinances) remained effective until its replacement by the relevant applicable collective agreement, with a time limit of 31st December 1995. Throughout those years, employees were classified accord-ing to the provisions of the applicable
18 Resolution of 13th May 1997, from the Directo-rate-General for Labor, which provides for entry in the register and publication of the Agreement on Filling Gaps.
19 Sixth temporary provision of Law 8/1980, of 8th March, on the Statute of Workers’ Rights.
Example
CLASSIFICATION GROUPS Categories within each group
1. Technical staff
1. Technician with a higher-level qualification2. Technician with an intermediate-level qualification3. Head technician in charge of manufacturing or management4. Unqualified technician
2. Administrative staff
1. First-line supervisor.2. Second-in-command.3. Head of sales.4. Skilled worker.5. Semi-skilled worker.6. Support worker.7. Telephonist.8. Traveling salesperson or salesperson.9. Analyst.10. Programmer.11. Operator.
3. Laborers and junior staff
A) Department manager.B) Laborers in industry occupations. 1. Skilled worker.2. Semi-skilled worker.3. Machine operator.,4. Specialist.5. Support worker.C) Cold storage staff.1. Engine driver. 2. Assistant engine driver.D) Staff in various occupations.1. Skilled worker.2. Semi-skilled worker.3. Assistant.Junior staff.1. Shopkeeper.2. Security guard.3. Guard or caretaker.4. Administrative assistant.5. Cleaning staff.

28 / EQUAL PAY AND COLLECTIVE BARGAINING
collective agreement (according to the rules dictated by the LET) or, in its ab-sence, the model of the labor ordinances was adopted.
Seventeen years after the LET was passed, economic and social partners made clear, through an interprofessional agreement20, (the Agreement on Filling Gaps), the need to establish a regulation capable of filling gaps caused by the dis-appearance of the labor ordinances with the aim of ‘filling gaps in content’. This agreement, among other aspects, provid-ed additional rules to the regulations of the LET in order to consider professional structures.
Thus, each set of factors established by the LET, through article 39, states that the job classifications are based on three areas:
• Professional aptitudes necessary for the profession or trade.
• Qualifications that enable the employ-ee to practice the profession or trade.
• General job content, which defines the roles to be carried out.
The Agreement on Filling Gaps introduc-es the need to consider a range of factors to determine and specify professional aptitudes: knowledge, experience, initia-tive, autonomy, responsibility, leadership and complexity.
Provisions for assessment include:
a. Knowledge and experience: assess-ment of this factor shall take into account, in addition to the basic training necessary to do the job prop-erly, the knowledge and expe-rience acquired and the difficulty of acquiring it.
b. Initiative; assessment of this factor shall take into account the extent to which rules or guidelines are fol-lowed in order to perform the tasks or roles.
20 AINC of 1997.
c. Autonomy: assessment of this fac-tor shall take into account the level of dependence on senior staff in performing tasks or roles.
d. Responsibility: assessment of this factor shall take into account the level of autonomy of action of the role holder, the level of influence on results and the importance of man-agement on human, technical and productive resources.
e. Leadership: assessment of this fac-tor shall take into account the level of supervision and organization of roles and tasks, the ability to relate to others, group dynamics and the number of people the employee manages.
f. Complexity: assessment of this fac-tor shall take into account the num-ber and level of integration of the various aforementioned factors of the task or job.
These factors act as an initial tool from which personal aptitudes can be quan-tified and the first objective assessment method, necessary to progress on the path towards eliminating discrimination through job classification.
Despite this first step, the grouping factors in the Agreement on Filling Gaps value masculine jobs –Pérez del Ríó warned that selection of these factors was clearly prejudicial to women. The factors used to classify jobs clearly go against typically feminine jobs, since factors such as initia-tive, autonomy, leadership and complexi-ty are all features of higher, more mascu-line professional categories or groups.
These factors are prejudicial not only in and of themselves, but also because of the definition of each one of them, which de facto favor masculine jobs. They also pro-mote the development of related wage supplements which are very common in masculine jobs (wage supplements for physical effort, responsibility, etc.).

Collective bargaining as an intervention mechanism / 29
LATEST LABOR REFORMS: LAW 3/2012
The reform implemented by Royal Decree Law 3/2012, of 11th February, on urgent measures for labor market reform intro-duces a number of changes that affect the job classification system.
The new model obliges employees to be organized or classified around a so-called professional group, with the aim of re-moving other possibilities for subclassifi-cation within the central element of the group through professional categories.
The aim of this model is to encourage the disappearance of job profiles, i.e.profes-sionalization through categories, dehier-archization and greater versatility within the group among the old categories of which it was made up.
3.3. Pay structures
THE ROLE OF COLLECTIVE AGREEMENTS IN REGULATING WAGES
The Statute of Workers’ Rights entrusts collective bargaining or, in its absence, in-dividual contracts with regulating wage structures (article 26.3, LET). For their part, interprofessional agreements have recommended the inclusion of wage is-sues among the different levels of ne-gotiation. Thus, sector-wide collective agreements ha-ve the role of establish-ing concepts or criteria that define wage structures and recommend that ‘wage issues be referred to the lower levels’ (In-terconfederal Agreement of 1997).
In practice, we can see that there are many sector-wide collective agreements that calculate wages and include salary scales without prejudice to the possibility of improvements by more beneficial con-ditions agreed between employees and employers. This desire for precision which
affects 90% of national sector-wide col-lective agreements probably explains the proliferation of small and medium-sized enterprises that do not have their own collective agreement.
On the basis of a specific legal duty to negotiate measures aimed at promot-ing equal pay for men and women, leg-islation does not set out the full impact of the possibilities of collective bargain-ing in this area. Consequently, based on the legislation, the performance and real pote-ntial of the obligation to negotiate to promote wage equality must be linked to certain conditions or requirements of collective bargaining itself:
• Gender mainstreaming, crucial in com-bating both the danger of gender in-visibility and a practice that tends to reduce the presence of the gender issue to a specific or isolated clause in the agreement, with no connection to general regulations on working condi-tions.
• Innovation in collective bargaining from the equality perspective, which must act as a brake on negative effects for women, facilitate the review of purely declarative or repetitive claus-es in legislation on non-discrimination in wages and recommend a compre-hensive review of the conventional el-ements (classification and pay struc-ture) that are often the basis of wage differentials between men and women.
• Complementarity of legislation and collective bargaining, firstly to adapt agreements to existing legislation through a review of their content and secondly to use all legal possibilities of the agreements to achieve the effec-tive equality required in a constitution-al manner. It should be remembered that although in certain areas legisla-tion is imperative and leaves little room for collective bargaining, in the regula-tion of many other issues the legislator resubmits agreements for revisi-on or recognizes without further formality the importance of collective bargain-ing in their organization. The latter is

30 / EQUAL PAY AND COLLECTIVE BARGAINING
reflected in key aspects for the guar-antee of equal pay, such as job clas-sification, professional development and wage rates and their necessary adaptation to the reality of the sector or company.
• Greater awareness among social ac-tors of the impact of collective bar-gaining on gender equality, which is crucial in preventing indirect discrimi-nation, often responsible for different pay for equal work, and even the abil-ity to introduce positive action meas-ures provided by law where these are sufficient to end persistent inequality.
NOTION OF PAY
Pursuant to the standard of ‘equal pay for equal work’, European and Constitutional Court case law embraces a much broad-er concept of pay than the definition of wages provided by the Law on the Stat-ute of Workers’ Rights (article 26.1, LET).
Wages may be paid in cash and/or in kind provided that the latter does not exceed 30% of total pay. The use and enjoyment in an individual capacity by the employee and his or her family of certain goods or services provided by the company (use of a car or house, mobile, etc.) must also be counted as wages.
The wage structure regulated in the Stat-ute of Workers’ Rights is based on:
• Basic salary, which is determined by the job classification system and type of working day, in accordance with re-sullts or a combination of both criteria. Collective bargaining is often used to fix the basic salary according to the professional group and/or category. This is a floor salary and introduces stability by mitigating wage disparity and, where applicable, preven-ting an increase in the pay gap. Therefore, col-lective agreements that regulate a sec-tor-wide guaranteed mini-mum wage deserve praise.
• Special payments are regulated sep-arately from the basic salary and are considered as wages with the dis-tinctive feature that they are paid at intervals of more than one month. In the regulation of bonuses, collective agreements should avoid penalizing career breaks linked to maternity/pa-ternity or other conciliation rights. Equally, it is advisable not to include wage supplements that, although not discriminatory, are not gender-neutral such as, for example, seniority.
• Wage supplements. The Statute of Workers’ Rights makes it clear that the inclusion of wage supplements is op-tional, although the majority of collec-tive agreements regulate them. Article 26.3, ET, lists only the three main rea-sons for wage supplements: the em-ployee’s personal circumstances, the work undertaken and the company’s situation and results.
• Bonuses. The most common bonuses those that are awarded regularly, but also subsistence allowances, voluntary benefits and contributions to pension plans and other social benefits.


32
4

33
METHODOLOGYOF THE STUDY

34 / EQUAL PAY AND COLLECTIVE BARGAINING
In carrying out this study, spanish na-tional sector-wide collective agreements were analyzed. There are 129 agreements whose information was obtained from the Register of Collective Agreements of the spanish Ministry of Employment and Social Security. This register offers lists of the collective agreements, as well as in-for-mation on each of them, part of which shall be explained in part 5.1 of the follow-ing section, with data on the sectors, em-ployees, women and companies affected by each agreement. It must be noted that this information is only available for col-lective agreements published from 2010 onwards, since that was the year when the Register of Collective Agreements took effect, so there is no information for agreements prior to that year.21
For the study, the agreements were grouped according to the applicable economic activity sector from the 2009 CNAE [National Classification of Eco-nomic Activities] classification. It should be specified that some agreements apply to activities that are classified in different sectors, such as the agreement of con-struction or the collective agreement of tiles, bricks and special baked clay parts. In this case, the information in the agree-ment was found exclusively in sector ‘F’: ‘Construction’
Furthermore, in order to simplify the study, the information from these two agreements was added to the economic activity of construction and the collective
21 28 of the 129 agreements studied were registered prior to 2010.
agreement of the salt industry, the only national agreement exclusive to econom-ic sector ‘B’: ‘Extractive industries’. In this way, we have included a single activity sector with information from these three agreements, which we have named ‘B+F: Extractive industries and construction’.
Point 5.2 analyzes the agreements and provides information gleaned from a thor-ough reading of each of them. Information was obtained from each agreement on the different remuneration mechanisms included, the job classification systems and any other information on equality.
Given that the information provided on annual wages is different in each agree-ment and we wanted to compare wage levels between agreements, it was nec-essary to standardize the information on wages in all the collective agreements studied. Therefore, we took into account the number of bonuses set out in the agreements in order to obtain compa-rable monthly wages. Furthermore, we used the 2014 CPI to update the wages of those collective agreements prior to 2010.


36
5

37
RESULTS ANDANALYSIS

38 / EQUAL PAY AND COLLECTIVE BARGAINING
5.1. Data from the agreements
Of the 129 agreements studied, 86 c-or-respond to activities in the service sector and 43 to other sectors, of which 32 are agreements from the manufacturing in-dustry; 5 from the sectors of agriculture, livestock, forestry and fishing; 3 from the
supply of water, sanitation, waste man-agement and decontamination, and 3 from the extractive industry and con-struction. Given that many of the agree-ments apply to more than one economic activity belonging to different sectors, they have been grouped into two main sectors: industry22 and services.
22 The ‘industry’ classification includes agreements
Table 8. Number of agreements per sector, coverage of collective agreements overall and by sex, and distribution of employees affected
Source: Compiled using data from the Register of Collective Agreements.
No, of agreements
Total number of employees
affected
Women affected
Men affected
Distribution of
employees
Distribution of female
employees
Distribution of male
employees
% women affected
% men affected
AGRICULTURE. LIVESTOCK. FORESTRY AND FISHING
43 2,377,968 335,168 2,042,800 41.8% 16.6% 55.7% 14.1% 85.9%
A: Agriculture. livestock. forestry and fishing
5 186,735 13,485 173,250 3.3% 0.7% 4.7% 7.2% 92.8%
B.F: Extractive industries and construction’
3 1,249,635 62,731 1,186,904 22.0% 3.1% 32.4% 5.0% 95.0%
C: Manufacturing 32 779,497 228,358 551,139 13.7% 11.3% 15.0% 29.3% 70.7%
E: Supply of water. sanitation. etc,
3 162,101 30,594 131,507 2.9% 1.5% 3.6% 18.9% 81.1%
SERVICES 86 3,308,327 1,686,201 1,622,126 58.2% 83.4% 44.3% 51.0% 49.0%
G: Retail and wholesale
10 238,500 124,356 114,144 4.2% 6.2% 3.1% 52.1% 47.9%
H: Transportation and storage
13 403,810 40,732 363,078 7.1% 2.0% 9.9% 10.1% 89.9%
I: Hospitality 2 29,699 14,850 14,849 0.5% 0.7% 0.4% 50.0% 50.0%
J: Information and communications
6 6,152 3,062 3,090 0.1% 0.2% 0.1% 49.8% 50.2%
K: Financial services and insurance
6 341,046 142,418 198,628 6.0% 7.0% 5.4% 41.8% 58.2%
L: Real estate 1 70,157 35,157 35,000 1.2% 1.7% 1.0% 50.1% 49.9%
M: Professional. scientific and technical activities
7 175,396 62,913 112,483 3.1% 3.1% 3.1% 35.9% 64.1%
O: Administrative and support services
11 610,181 327,611 282,570 10.7% 16.2% 7.7% 53.7% 46.3%
P: Education 12 749,360 450,590 298,770 13.2% 22.3% 8.2% 60.1% 39.9%
Q: Health and social services
5 388,000 292,375 95,625 6.8% 14.5% 2.6% 75.4% 24.6%
R: Arts and recreational activities
8 154,716 76,490 78,226 2.7% 3.8% 2.1% 49.4% 50.6%
S: Other services 5 141,310 115,647 25,663 2.5% 5.7% 0.7% 81.8% 18.2%
OVERALL TOTAL 129 5,686,295 2,021,369 3,664,926 100.0% 100.0% 100.0% 35.5% 64.5%

Results and analysis / 39
The activities belonging to the major ‘ser-vice’ sector that have the largest number of agreements are ‘transportation and storage’ (13), ‘education’ (12), ‘administra-tive and support services’ (11) and ‘retail and wholesale’, except ‘motor ve-hicles and motorcycles’ (10).
These 129 agreements cover a total of 5,656,295 employees, of whom 58.2% work in the service sector and 41.8% in the agriculture, industry and construction
from the agriculture and construction sectors.
sectors. The sectors with agreements covering the most people are the extrac-tive industries and construction23 (22%), the manufacturing industry (13.7%), ed-ucation (13.2%), and administrative and support services (10.7%).
By sex, 83.4% of women are covered by sector-wide agreements in the service sector, compared with 16.6% in the indus-
23 The extractive industries and the construction sec-tor have been added together in the tables, since these two activities share agreements that affect them equally.
Graph 7. Number of employees covered, in total and women, and number of agreements by sector
Source: Compiled using data from the Register of Collective Agreements.
1,400,000 %
1,200,000 %
1,000,000 %
800,000 %
600,000 %
400,000 %
200,000 %
0 %
35
30
25
20
15
10
5
0
B+F
: Ext
ract
ive
indu
strie
s an
d co
nstr
uctio
n
C: M
anuf
actu
ring
indu
stry
P: E
duca
tion
N: A
dmin
istr
ativ
e an
d su
ppor
t ser
vice
s
H: T
rans
port
atio
n an
d st
orag
e
Q. H
ealth
and
soc
ial s
ervi
ces
K: F
inan
cial
ser
vice
s an
d in
sura
nce
G: R
etai
l and
who
lesa
le, e
xcep
t mot
or v
ehic
les
and
mot
orcy
cles
A: A
gric
ultu
re, l
ives
tock
, for
estr
y an
d fis
hing
M: P
rofe
ssio
nal,
scie
ntifi
c an
d te
chni
cal a
ctiv
ities
E: S
uppl
y of
wat
er, s
anita
tion,
was
te m
anag
emen
t an
d de
cont
amin
atio
n
R: A
rts,
recr
eatio
nal a
ctiv
ities
and
ent
erta
inm
ent
S: O
ther
ser
vice
s
L: R
eal e
stat
e
I: H
ospi
talit
y
J: In
form
atio
n an
d co
mm
unic
atio
ns
3
32
12 11 13
56
10
57
3
8
5
12
6
Total number of employees affected by sector-wide agreements
Total number of women affected by sector-wide agreements
Number of agreements

40 / EQUAL PAY AND COLLECTIVE BARGAINING
trial, agricultural or construction sectors. Women working in industrial sectors are virtually all concentrated in the manufac-turing industry, mainly the subsectors of food and textiles. For their part, agree-ments covering women in the service sector are concentrated in three sectors: education (22.3%), administrative and support services (16.2%) and health and social services (14.5%).
The level of feminization of the agree-ments –i.e. the percentage of women covered by agreements according to sec-tor– coincides with the data on the fem-iniaztion of sectors seen previously from the National Institute of Statistics. The service sector is the most feminized, with 51% of women covered by agreements in that sector, compared to 14.1% in the ag-riculture, industry and construction sec-tors. Agreements in the ‘other services’, ‘health and social services’ and ‘educa-tion’ sectors are the most feminized, cov-ering 81.8%, 75.4% and 60.1% of women respectively. (See Table 8)
Graph 7 shows the total number of em-ployees and the number of women cov-ered by agreements, by sector, as well as the number of agreements in each sector. There is a certain correlation between the number of agreements and the number of employees affected by sector, since the number of agreements decreases at the same time as the number of employ-ees covered. The major exception is the extractive industries and the construction sector, which cover 1,249,635 people and only have three agreements. This is be-cause the national ag-reement in the con-struction sector covers 1,241,620 people.
5.2. Study of the agreements
As has been explained, for this study, information was gathered from 129 sec-tor-wide collective agreements, 43 from the industry, agriculture and construction sectors and 86 from the service sector. In quantitative terms, the 32 agreements from the manufacturing industry stand out.
The majority of agreements were easily classified into the applicable economic activity sectors. In some cases classifi-cation was more complicated, since the agreement covered more than one eco-nomic activity sector. This is the case, for example, with the construction agree-ment, which covers 20 economic ac-tivities belonging to different activity sectors. In order to analyze data for this study, the agreement was placed in the construction sector.
Furthermore, activity sectors B and F are included in the same sector throughout the study, since they have few agree-ments (only 324), which in turn are not ap-plicable to a single economic sector.
The items that have been analyzed through a comprehensive reading of the collective agr-eements are the following:
24 National agreement of tiles, bricks and special baked clay parts, national agreement of the salt in-dustry and national agreement of the construction sector.

Results and analysis / 41
• Type of language used in drawing up the text of the agreement.
• Reference to gender equality in wages
• Job classification structure.
• Salary scales.
• Existence of an agreed guaranteed minimum wage.
• Basic salary.
• Level of coverage of the lowest salary in the agreements in relation to the SMI.
• Wage supplements:
a. Fixed according to the personal qualit-ies of employees.
b. Fixed according to circumstances relating to the work carried out (the job and the quantity/quality of work).
c. Fixed according to circumstances relating to the company’s situation and results.
d. Other items of remuneration.
Graph 8. Number of national agreements studied for each economic activity sector
Source: Compiled using data from the Register of Collective Agreements.
A: Agriculture, livestock, forestry and fishing
B+F: Extractive industries and construction’
C: Manufacturing
E: Supply of water, sanitation, etc.
G: Retail and wholesale
H: Transportation and storage
I: Hospitality
J: Information and communications
K: Financial services and insurance
L: Real estate
M: Professional, scientific and technical activities
O: Administrative and support services
P: Education
Q: Health and social services
R: Arts and recreational activities
S: Other services
5
3
32
3
10
13
2
6
6
1
7
11
12
5
8
5
AGRICULTURE, INDUSTRY
CONSTRUCTION
SERVICES

42 / EQUAL PAY AND COLLECTIVE BARGAINING
5.3. Language
Language is a vital tool to keep progress-ing on the path towards a labor mar-ket free from gender bias. Organic Law 3/2007, on effective equality between men and women, emphasizes that lan-guage is an ideal instru-ment for correct-ing inequality of opportunity.
Using equal and inclusive language makes women visible, breaking stereotypes and sexist prejudices; therefore, it is necessary to modify the androcentric approach of expressions, using neutral and non-sex-ist titles. Thus, not including the feminine noun alongside the masculine
makes women invisible in negotiation regulations, overriding the visibility and therefore the participation of women in the productive sector to which the agree-ment applies.
In the words of the linguist Eulalia Lledó, ‘language in itself is not sexist, but its use is’. Throughout the negotiation texts, the unnecesary or excessive use of the gener-ic male form is a way of hiding women, establishing itself as an obstacle to real equality between men and women.
Androcentrism, in linguistic terms, is based on two fundamental rules:
a. everyone is male, unless otherwise specified;
b. women are erased from language.
Table 9. Distribution of agreements according to type of language used
Source: Compiled using data from the sector-wide national collective agreements studied.
TotalMasculine
with a gender-neutral clause
Sexist- masculine
Non-sexist- masculine and
feminine or neutral
Discriminatory
AGRICULTURE INDUSTRY CONSTRUCTION 43 0 35 6 2
A: Agriculture, livestock, forestry and fishing 5 0 5 0 0
B+F: Extractive industries and construction 3 0 3 0 0
C: Manufacturing industry 32 0 26 4 2
E: Supply of water, sanitation, waste management and decontamination
3 0 1 2 0
SERVICES 86 8 61 13 4
G: Retail and wholesale, except motor vehicles and motorcycles
10 0 7 1 2
H: Transportation and storage 13 0 12 1 0
I: Hospitality 2 0 2 0 0
J: Information and communications 6 1 5 0 0
K: Financial services and insurance 6 0 6 0 0
L: Real estate 1 0 0 0 1
M: Professional, scientific and technical activities 7 3 4 0 0
O: Administrative and support services 11 4 3 3 1
P: Education 12 0 9 3 0
Q: Health and social services 5 0 2 3 0
R: Arts, recreational activities and entertainment 8 0 6 2 0
S: Other services 5 0 5 0 0
OVERALL TOTAL 129 8 96 19 6
% OF THE TOTAL 100% 6% 74% 15% 5%

Results and analysis / 43
From this perspective, by studying the type of language used in national sec-tor-wide collective agreements, it has been found that almost all collective agreements (80%) use androcentrist lan-guage: 74% use masculine nouns for pro-fessional categories and other references. 6% also extensively use masculine nouns, but have a clause entitled ‘Gender-neu-tral clause’, which states the following: ‘The text of the agreement uses mascu-line nouns as the generic form encom-passing all male and female emplo-yees without ignoring existing gender differ-ences in order not to make the writing to complex’.25
In this regard, it should be noted that Span-ish does not have neutral nouns. Only the article lo, the third person impersonal pro-nouns and the demonstratives (esto, eso, aquello) have neutral forms. The use of sexist language in collective agreements ‘legitimizes, albeit indirectly through lan-guage, an inegalitarian discourse’.26
Although they are in the minority, agree-ments that are clearly discriminatory in language are still being drafted and pub-lished. 6 of the 129 agreements use dif-ferent language for different genders, choosing the sex according to typically ‘masculine’ or ‘feminine’ roles in the cat-egory or job.27
25 See the national collective agreement on adminis-trative agencies (2014), fifth additional provision: Neutral gender. ‘Some parts of the text of the agreement use masculine singular or plural nouns as the generic form encompassing all male and fe-male employees without ignoring existing gender differences in order not to make the writing ex-cessively complex’. See also the national collective agreement of temporary agency workers (2008) and the general collective agreement of the main-tenance and preservation of water installations (2014), among others.
26 See lousaDa arochena, José Fernando El principio de igualdad en la negociación colectiva, National Advisory Commisision on Collective Agreements. Colección “Informes y Estudios”, Serie Relaciones Laborales, número 85. Ministry of Employment and Immigration. Sub-Directorate-General of Adminis-trative Information and Publications. Madrid, 2005.
27 The collective agreement of companies that pro-duce seafood using freezing and refrigeration pro-cesses uses masculine or feminine nouns according
Finally, only 15% of agreements use non-sexist and neutral language (or al-ways use both masculine and feminine nouns or a neutral gender).
5.4. Reference to gender equality in wages
On average, 32,6 % of all sector-wide agre-ements contain a reference to equal pay. Distributed by major sectors, almost 42% of the 43 agreements from the in-dustry, agriculture and construction sec-tors and 28% of agreements from the ser-vice sector make some reference to equal pay.
Not all agreements do this in the same way or in the same amount of detail. Some, such as the general collective agreement of jobs in the textile industry and dressmaking (2014), are precise in their definition of the concept of pay and prohibit discrimination not only in terms of pay, but also in the conditions for ob-taining payments. The text in this case is very similar to article 28 of the Statute of Workers’ Rights.
In the general collective agreement of jobs in the textile industry and dress (2014), article 59, reads: ‘Equal pay on the grounds of sex: The company is obliged to pay the same for equal work, whether in wages or in benefits, directly or indi-rectly; under no circumstances may there be any discrimination on the grounds of sex in any of its elements or conditions’.
to the role undertaken: feminine noun for depart-ment manager, masculine noun for head of mainte-nance, masculine noun for driver, feminine noun for line manager, etc.; the national collective agreement of the extractive , glass and ceramics industries uses the feminine noun for packer and masculine nous for everything else; the agreement for drugs retailers, herbalists and perfumeries us-es mascu-line nouns for everything except secretary, which uses both masculine and feminine nouns.

44 / EQUAL PAY AND COLLECTIVE BARGAINING
Other agreements, such as the collec-tive agreement of the transportation sec-tor, aerial work with helicopters and their maintenance and repair, are less precise and only mention equal pay for equal work.
Article 50 of this agreement states: ‘Equal pay on the grounds of sex. The company is obliged to pay the same for equal work, with no discrimination on the grounds of sex’.
Finally, there is a third group of agree-ments that refer to equality and non-dis-crimination in pay by listing the areas to be taken into account in the development of equality plans, according to the provi-sions of the agreement.
Article 63 of the national collective agree-ment of universities and research centers (2012) includes the following: ‘In order to achieve the objectives set, equality plans may consider, among other things, access
to employment; job classification, profes-sional development and training; pay; or-ganization of the working day to encour-age, in terms of equality between men and women, a balance between work, personal and family life; and the preven-tion of sexual harassment and sex-based harassment’.
Table 10. Total number of agreements, number of agreements that refer to pay equality and percentage of the total
Source: Compiled using data from the national sector-wide collective agreements studied.
Total number of
agreements
Reference to equal pay Percentage
AGRICULTURE INDUSTRY CONSTRUCTION 43 18 41.9%
A: Agriculture. livestock. forestry and fishing 5 3 60.0%
B+F: Extractive industries and construction 3 2 66.7%
C: Manufacturing industry 32 12 37.5%
E: Supply of water. sanitation. waste management and decontamination 3 1 33.3%
SERVICES 86 24 27.9%
G: Retail and wholesale. except motor vehicles and motorcycles 10 7 70.0%
H: Transportation and storage 13 4 30.8%
I: Hospitality 2 0 0.0%
J: Information and communications 6 2 33.3%
K: Financial services and insurance 6 0 0.0%
L: Real estate 1 1 100.0%
M: Professional. scientific and technical activities 7 2 28.6%
O: Administrative and support services 11 4 36.4%
P: Education 12 2 16.7%
Q: Health and social services 5 0 0.0%
R: Arts. recreational activities and entertainment 8 0 0.0%
S: Other services 5 2 40.0%
OVERALL TOTAL 129 42 32.6%
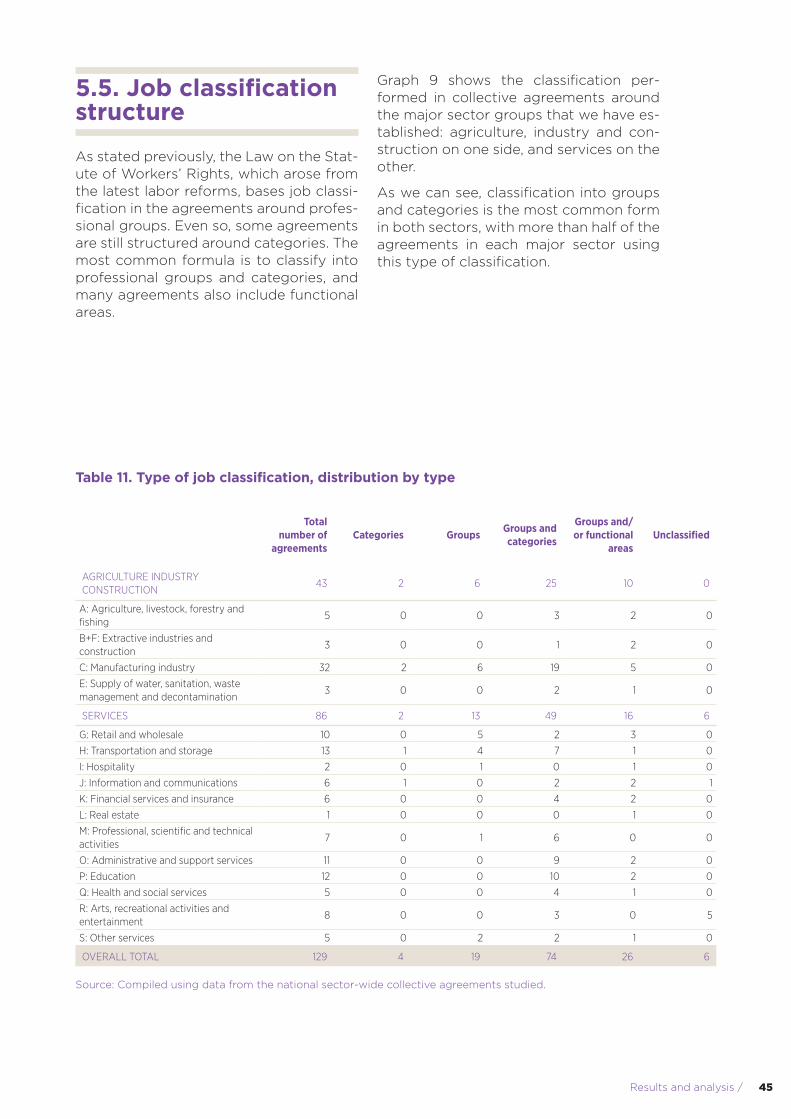
Results and analysis / 45
5.5. Job classification structure
As stated previously, the Law on the Stat-ute of Workers’ Rights, which arose from the latest labor reforms, bases job classi-fication in the agreements around profes-sional groups. Even so, some agreements are still structured around categories. The most common formula is to classify into professional groups and categories, and many agreements also include functional areas.
Graph 9 shows the classification per-formed in collective agreements around the major sector groups that we have es-tablished: agriculture, industry and con-struction on one side, and services on the other.
As we can see, classification into groups and categories is the most common form in both sectors, with more than half of the agreements in each major sector using this type of classification.
Table 11. Type of job classification, distribution by type
Source: Compiled using data from the national sector-wide collective agreements studied.
Total number of
agreementsCategories Groups Groups and
categories
Groups and/or functional
areasUnclassified
AGRICULTURE INDUSTRY CONSTRUCTION
43 2 6 25 10 0
A: Agriculture, livestock, forestry and fishing
5 0 0 3 2 0
B+F: Extractive industries and construction
3 0 0 1 2 0
C: Manufacturing industry 32 2 6 19 5 0
E: Supply of water, sanitation, waste management and decontamination
3 0 0 2 1 0
SERVICES 86 2 13 49 16 6
G: Retail and wholesale 10 0 5 2 3 0
H: Transportation and storage 13 1 4 7 1 0
I: Hospitality 2 0 1 0 1 0
J: Information and communications 6 1 0 2 2 1
K: Financial services and insurance 6 0 0 4 2 0
L: Real estate 1 0 0 0 1 0
M: Professional, scientific and technical activities
7 0 1 6 0 0
O: Administrative and support services 11 0 0 9 2 0
P: Education 12 0 0 10 2 0
Q: Health and social services 5 0 0 4 1 0
R: Arts, recreational activities and entertainment
8 0 0 3 0 5
S: Other services 5 0 2 2 1 0
OVERALL TOTAL 129 4 19 74 26 6

46 / EQUAL PAY AND COLLECTIVE BARGAINING
As well as the type of job classification in each agreement, we analyzed the follow-ing issues (see Table 12):
• Bargaining structure: we see here the number of agreements that organ-ize topi-cs at the lower levels of col-lective ba-rgaining. Thus, almost 40% of the national collective agreements studied list and define the topics to be addressed by agreements with a geo-graphical scope other than national.
• Labor ordinance: as we have seen, the regulations in force until the pro-mul-gation in 1980 of the Law on the Stat-ute of Workers’ Rights were labor or-dinances, which remained effective until their replacement by the rele-vant applicable national agreement.28 Throughout that time, employees were classified according to the provisions of the applicable collective agreement (according to the rules dictated by the LET) or, in its absence, the model of the labor ordinances was adopted.
28 With a time limit of 31st December 1994.
We can see that, even today, there are agreements that continue to regulate the job classification system following the model of the old labor ordinances. Thus, 1 in 4 agreements still set up their job classifi-cation system in the same way as that provided in the relevant labor ordinance.29
• Agreement on gaps: as has been de-scribed previously, seventeen years after the LET was passed, economic and social partners made clear through an interprofessional agreement, the Agreement on Filling Gaps, the need to establish a regulation capable of fill-ing gaps caused by the disappearance
29 See the collective agreement of hair salons, beau-ty parlours and gymnasiums, which continues to adopt the classification model of the repealed labor ordinance on hair salons alongside group-ing factors from the Agreement on Filling Gaps; the sector-wide collective agreement on cleaning bui-ldings and facilities; the general agreement of companies that transport goods by road; and the collective agreement for the sector of preserves, semi-preserves, smoked goods, boiled goods, dried goods, manufactured goods, salting, fish oil, fish-meal, and seafood, which retains the classification of the labor ordinance.
Graph 9. Distribution of agreements according to type of job classification, by major sectors
Source: Compiled using data from the national sector-wide collective agreements studied.
Categories
Groups
Groups and categories
Groups and/or functional areas
Categories
Groups
Groups and categories
Groups and/or functional
AGRICULTUREINDUSTRY
CONSTRUCTION
SERVICES
4.7%
14%
58.1%
23.3%
2.3%
15.1%
57%
18.6%

Results and analysis / 47
of the labor ordinances, i.e. ‘fill gaps in content’. This agreement included, among other aspects, some addition-al regulations to those provided by the LET to consider professional str-uc-tures. In this case, 36.4% of the agree-ments studied use a classification sys-tem based on the factors provided for in the agreement on filling gaps.
• Good practice:30 agreements that in-novate with regard to j-ob classifica-tion with a gender perspective. Thus, we have already explained throughout this report the factors recognized in the Agreement on Filling Gaps –initi-ative, autonomy, responsibility, leader-ship and complexity. As an instrument from which personal aptitudes can be quantified, the personal aptitudes of women are assessed negatively, bear-ing in mind the definition in the agree-ment itself. In this sense, we under-stand as good practice those collective agreements that have comple-mented the grouping factors in the agreement on gaps with a series of subfactors that allow for a more objective profes-sional grouping that does not reward or incentivize those factors common to typically masculine jobs
In this sense, the national collective agree-ment on timber is one of the three exam-ples of good practice that we found and defines, by way of example:
‘Complexity. This factor is assessed ac-cording to the greater or lesser number, as well as the greater or lesser level of integration, of the other factors listed in the assigned task or position. a) Difficul-ty of the job. This subfactor considers the complexity of the task to be carried out and the frequency of possible inci-dents. b) Special skills. This subfactor determines the skills required for certain jobs, which may be physical effort, men-
30 The English term ‘labor good practices’ has been translated into Spanish as ‘buenas prácticas’. To date, there is still no agreed definition in this regard. We use the definition provided by lóPez lóPez. J.: ‘performance criteria that are considered useful for obtaining certain results’.
tal skills, good vision, etc., and their fre-quency in the working day. c) Work en-vironment. This subfactor assesses the circumstances under which the work must be carried out, and the extent to which these conditions make the job unpleasant. This subfactor shall not in-clude circumstances relating to the way of working (night work, shift work, etc.)’.
In the definition of this factor in the agree-ment on gaps, the national agreement on timber incorporates other factors with a gender-neutral perspective, such as man-ual dexterity, good vision and an unpleas-ant working environment.
On page 49, we list three different exam-ples from the collective agreements stud-ied: according to the type of job classifi-cation, the use of grouping factors from the agreement on gaps and references to the old labor ordinances.
5.6. Salary scales
This section refers to the presence of salary scales in the national sector-wide collective agreements studied. In 88.4% of cases, the agreements organize and structure the pay of employees covered according to salary scales. In this case, there are no differences between the major activity sectors, since the percent-age of agreements both in services and in industry, agriculture and construction is practically the same. (See Table 13)
One of the agreements that does not include salary scales is the collective agreement of the construction sector (2012), but it does give a detailed de-scription of the various items of remu-neration and their structure, and sets out a minimum annual gross pay scale by professional levels:
‘Minimum gross annual pay for the con-struc-tion sector was set out on 1st Jan-uary 2012, for full-time employees, taking into account for this purpose all items of remuneration’.
4.7%
14%
58.1%
23.3%
2.3%
15.1%
57%
18.6%

48 / EQUAL PAY AND COLLECTIVE BARGAINING
Table 12. Agreements with a bargaining structure, classification factors from the agreement on gaps, systems inherited from the labor ordinances and good practice (total number of agreements and percentage, by activity sector)
Source: Compiled using data from the national sector-wide collective agreements studied.
Total number of
agreements
Collective bargaining
structure
Agreement on gaps
Laborordinances
Good practice
AGRICULTURE INDUSTRY CONSTRUCTION 43 20 25 21 3
A: Agriculture. livestock. forestry and fishing 5 4 3 4 1
B+F: Extractive industries and construction 3 1 3 2 0
C: Manufacturing industry 32 12 17 14 2
E: Supply of water. sanitation. waste management and decontamination
3 3 2 1 0
SERVICES 86 30 22 10 0
G: Retail and wholesale 10 5 7 2 0
H: Transportation and storage 13 4 1 3 0
I: Hospitality 2 0 2 0 0
J: Information and communications 6 0 0 0 0
K: Financial services and insurance 6 2 1 0 0
L: Real estate 1 0 1 0 0
M: Professional. scientific and technical activities 7 1 3 3 0
O: Administrative and support services 11 5 3 2 0
P: Education 12 4 0 0 0
Q: Health and social services 5 4 1 0 0
R: Arts. recreational activities and entertainment 8 2 0 0 0
S: Other services 5 3 3 0 0
OVERALL TOTAL 129 50 47 31 3
Total number of
agreements
Collective bargaining
structure
Agreement on gaps
Laborordinances
Good practice
AGRICULTURE INDUSTRY CONSTRUCTION 43 46.5% 58.1% 48.8% 7.0%
A: Agriculture. livestock. forestry and fishing 5 80.0% 60.0% 80.0% 20.0%
B+F: Extractive industries and construction 3 33.3% 100.0% 66.7% 0.0%
C: Manufacturing industry 32 37.5% 53.1% 43.8% 6.3%
E: Supply of water. sanitation. waste management and decontamination
3 100.0% 66.7% 33.3% 0.0%
SERVICES 86 34.9% 25.6% 11.6% 0.0%
G: Retail and wholesale 10 50.0% 70.0% 20.0% 0.0%
H: Transportation and storage 13 30.8% 7.7% 23.1% 0.0%
I: Hospitality 2 0.0% 100.0% 0.0% 0.0%
J: Information and communications 6 0.0% 0.0% 0.0% 0.0%
K: Financial services and insurance 6 33.3% 16.7% 0.0% 0.0%
L: Real estate 1 0.0% 100.0% 0.0% 0.0%
M: Professional. scientific and technical activities 7 14.3% 42.9% 42.9% 0.0%
O: Administrative and support services 11 45.5% 27.3% 18.2% 0.0%
P: Education 12 33.3% 0.0% 0.0% 0.0%
Q: Health and social services 5 80.0% 20.0% 0.0% 0.0%
R: Arts. recreational activities and entertainment 8 25.0% 0.0% 0.0% 0.0%
S: Other services 5 60.0% 60.0% 0.0% 0.0%
OVERALL TOTAL 129 38.8% 36.4% 24.0% 2.3%

Results and analysis / 49
For its part, the sector-wide collective agreement on cleaning buildings and facilities, which forms part of the ad-mi-nistrative and support services sector, classifies the topics to be negotiated according to the scope of the agreement and establishes, among other things, the amount of the basic salary, the deter-mination and amount of wage supple-ments, the wage structure and benefits as topics to be negotiated at provincial or autonomous community level. Therefore, the national agreement is exempt from including these topics in negotiation.
In five of the eight agreements in the arts, recreational activities and entertain-ment sector, there are no salary scales. These are the national collective agree-ments of professional football, profes-sional basketball, professional cycling, professional handball and professional women’s league basketball; agreements which, given their genuine organization
and job classification, do not include salary scales, although they do include minimum pay.
5.7. Existence of a guaranteed minimum wage
Some agreements introduce the concept of a guaranteed minimum wage (SMG), as has previously been explained by the agreement of the construction sector, which determines minimum gross annu-al pay and does not include salary scales with basic salaries for each professional group or category.
BASIC NATIONAL COLLECTIVE AGREEMENT FOR THE MANUFACTURE OF VEGETABLE PRESERVES (BOE [OFFICIAL
STATE GAZETTE], 26/12/2014)
Job classification:
• This is organized around professional groups and categories.
• Its grouping factors are: initiative, autonomy and responsibility. It uses the same definition as the agree-ment on gaps.
NATIONAL COLLECTIVE AGREEMENT OF THE NOUGAT AND MARZIPAN INDUSTRY (BOE, 1/4/2014)
Job classification:
• This is organized around professional groups and categories.
• Its grouping factors are: level of autonomy, level of training, initiative, leadership, responsibility and job complexity, using the same definition as that provided by the agreement on gaps.
• Classification within the groups of professional categories is based on the nomenclature of the repealed Labor ordinance for the food industries (Ministerial Order of 8th July 1975).
NATIONAL COLLECTIVE AGREEMENT OF DRUGS RETAILERS, HERBALISTS AND PERFUMERIES (BOE, 2/10/2014)
Job classification:
• This is organized around professional groups and functional areas.
• The 5 professional groups use the grouping factors (level of autonomy, level of training, initiative, lead-ership, responsibility and job complexity) provided for in the 1997 agreement on gaps.

50 / EQUAL PAY AND COLLECTIVE BARGAINING
There are, in addition, quite a few agre-ements which, as well as containing sec-tor-wide salary scales, also incorporate the concept of an SMG. This is true of the na-tional collective agreement of perfumeries and related shops (2011), and the general collective agreement of the chemical in-dustry (2013), which in article 31 calculates the SMG and defines the items that make up this minimum, excluding supplements and payments that do not derive from normal or habitual activity.31
31 General collective agreement of the chemical indus-try: ‘Article 31. Guaranteed minimum wage (SMG). This agreement assigns to full-time employees a guaranteed annual minimum wage of 14,255.57 euros gross. The SMG shall be made up exclusively of all items of remuneration received by employees in each company, in the course of their normal or habitual activities in non-assessed jobs. The SMG does not include the following concepts: seniority; shift bonus; night shift bonus; hazard pay; job-re-lated supplement (CPT); sales commission and in-centives, except where these incentives consist of a
For its part, the general collective agree-ment of centers and services for people with disabilities (2012) defines in article 31 the composition of the SMG, which ‘shall be calculated by adding the basic salary and the amount received for the former sen-iority or quality improvement supplement prior to 30th June 2012’.
The recently published national collec-tive agreement of the daily press (2015) sets out in article 3 the SMG for each professional group, which ‘shall be made up of all payments received by employ-ees in each company, in their course of their normal or habitual activities, as well as the personal allowances necessary to make up this amount’.
fixed payment received by employees in the course of their normal or habitual activity in non-assessed jobs (…)”.
Table 13. Total number of agreements, number of agreements with salary scales and percentage of the total
Source: Compiled using data from the national sector-wide collective agreements studied.
Total With scales % with scales
AGRICULTURE INDUSTRY CONSTRUCTION 43 39 90.7%
A: Agriculture. livestock. forestry and fishing 5 5 100.0%
B+F: Extractive industries and construction 3 1 33.3%
C: Manufacturing industry 32 31 96.9%
E: Supply of water. sanitation. waste management and decontamination 3 2 66.7%
SERVICES 86 75 87.2%
G: Retail and wholesale. except motor vehicles and motorcycles 10 10 100.0%
H: Transportation and storage 13 9 69.2%
I: Hospitality 2 2 100.0%
J: Information and communications 6 5 83.3%
K: Financial services and insurance 6 6 100.0%
L: Real estate 1 1 100.0%
M: Professional. scientific and technical activities 7 7 100.0%
O: Administrative and support services 11 10 90.9%
P: Education 12 12 100.0%
Q: Health and social services 5 5 100.0%
R: Arts. recreational activities and entertainment 8 3 37.5%
S: Other services 5 5 100.0%
OVERALL TOTAL 129 114 88.4%

Results and analysis / 51
Few agreements refer to a guaranteed minimum wage; only 29 of the 129 studied, distributed fairly evenly between the agri-culture, industry and construction sector and the service sector. (See Table 14)
5.8. Basic salary
Table 15 shows the average of the lowest and highest salaries established in the salary scales of the 123 collective agree-ments32 studied, by sector. In order to
32 For a better interpretation of the results of the study of salaries in the collective agreements, the six collective agreements applicable to professional sports and the agreement of film production and actors have been excluded, since the minimum sal-aries established therein are unrepresentative and too far from the overall average.
compare the lowest and highest salaries in the agreements studied, it was necessary to standardize them. Therefore, the num-ber of bonuses set out in the agreements has been taken into account, pro-rated over twelve months and added to the lowest and highest basic salaries in the agreements. In this way, it has been pos-sible to compare the purchasing power of the salaries.
The overall average of the lowest and higher salary in the salary scales of the 123 collective agreements is 784 euros and 1,517 euros a month respectively (12 payments); The average salaries of agree-ments in the agriculture, industry and construction sectors are 789 euros and 1,475 euros a month, while the averages in the service sector are 781 euros and 1,538 euros.
The last column in table 12 shows the in-equality in the lowest and highest basic
Table 14. Total number of agreements, number of agreements with a guaranteed minimum wage and percentage of the total
Source: Compiled using data from the national sector-wide collective agreements studied.
Total number of
agreementswith an SMG % of the total
with an SMG
AGRICULTURE INDUSTRY CONSTRUCTION 43 13 30%
A: Agriculture, livestock, forestry and fishing 5 1 20%
B+F: Extractive industries and construction 3 2 67%
C: Manufacturing industry 32 10 31%
E: Supply of water, sanitation, waste management and decontamination 3 0 0%
SERVICES 86 16 19%
G: Retail and wholesale, except motor vehicles and motorcycles 10 2 20%
H: Transportation and storage 13 3 23%
I: Hospitality 2 0 0%
J: Information and communications 6 0 0%
K: Financial services and insurance 6 0 0%
L: Real estate 1 1 100%
M: Professional, scientific and technical activities 7 1 14%
O: Administrative and support services 11 1 9%
P: Education 12 0 0%
Q: Health and social services 5 2 40%
R: Arts, recreational activities and entertainment 8 4 50%
S: Other services 5 2 40%
OVERALL TOTAL 129 29 22%

52 / EQUAL PAY AND COLLECTIVE BARGAINING
salaries in the agreements: on average, the highest basic salary is 93.5% higher than the lowest salary, and this differen-tial is greater in the service sector, which is more feminized, as shown in the sec-ond column in the table.
While the correlation study is not conclu-sive, graph 10 shows that there is a certain relationship between the level of femini-zation of the sector and the level of ine-quality between the minimum and maxi-mum basic salaries on the salary scales.
The economic activity sectors with the greatest disparity between the lowest and highest basic salaries are J: Informa-tion and communications (155.5%), K: fi-nancial services and insurance (147.4%), P: education (137.8%) and I: Hospitality (125.1%).
This indicator of inequality does not ex-plicitly show the level of income inequal-ity between men and women in each ac-tivity sector, but we can presume that it de facto represents the level of gender pay inequality in each economic activity and, therefore, there is consistency in the positive correlation between the femi-nization of the agreement and the level of inequality. As we have seen previous-ly, women are employed at lower levels, which shows the so-called glass ceiling –defined as the clear barrier or subtle dis-crimination against women that prevents them from reaching the highest levels in organizations and companies.33 For this reason, we can presume that the greater inequality between the lowest and high-
33 Morrison, A. Breaking the Glass Ceiling, 1987.
Table 15. Total number of agreements, feminization of the agreements, lowest and highest basic salary on the salary scale and the relationship between the two
Source: Compiled using data from the national sector-wide collective agreements studied.
Number of agreements Feminization Lowest
basic salaryHighest
basic salary
Relationship between
highest and lowest
AGRICULTURE INDUSTRY CONSTRUCTION 43 39 90.7% 1,475 87.0%
A: Agriculture, livestock, forestry and fishing 5 5 100.0% 1,497 81.9%
B+F: Extractive industries and construction 3 1 33.3% 1,020 42.9%
C: Manufacturing industry 32 31 96.9% 1,508 90.4%
E: Supply of water, sanitation, waste management and decontamination
3 2 66.7% 1,160 66.5%
SERVICES 86 75 87.2% 1,538 96.8%
G: Retail and wholesale, except motor vehicles and motorcycles
10 10 100.0% 1,289 51.5%
H: Transportation and storage 13 9 69.2% 1,281 72.1%
I: Hospitality 2 2 100.0% 1,785 125.1%
J: Information and communications 6 5 83.3% 1,880 155.5%
K: Financial services and insurance 6 6 100.0% 2,296 147.4%
L: Real estate 1 1 100.0% 1,295 65.6%
M: Professional, scientific and technical activities 7 7 100.0% 1,408 88.0%
O: Administrative and support services 11 10 90.9% 1,485 90.1%
P: Education 12 12 100.0% 1,613 137.8%
Q: Health and social services 5 5 100.0% 1,522 108.4%
R: Arts, recreational activities and entertainment 8 3 37.5% 1,175 32.5%
S: Other services 5 5 100.0% 1,605 88.4%
OVERALL TOTAL 129 114 88.4% 1,517 93.5%

Results and analysis / 53
est basic salaries on the salary scales in agreements would have a greater impact on women, employed in inferior occupa-tions with lower salaries.
5.9. Level of coverage of the lowest salary in the agreement in relation to the minimum wage
One of the desired functions of nation-al collective agreements is to guarantee a minimum income threshold that guar-antees an improvement over the mea-ger Spanish minimum wage (SMI), which does not reach the level of 60% of the av-erage salary indicated through the Euro-pean Social Charter.
In this sense, it is interesting to compare the basic salary in relation to the SMI since the lowest salary on the salary scales will show pay for the higher categories. We can see that on average, the lowest basic salary in the collective agreements stud-ied is 45.9% higher than the SMI in the year of publication of the agreement. By sector, and on average, all improve on the annual SMI, from 18.8% for agreements in sector E: supply of water, sanitation, waste management and decontamina-tion, to 66.7% for agreements in sector K: financial services and insurance.34 (See Table 16)
34 Again, for a better interpretation of the results of the study of salaries in the collective agreements, the five collective agreements applicable to profes-sional sports and the agreement on film production and actors have been excluded, since the minimum salaries established therein are unrepresentative and too far from the overall average.
Graph 10. Correlation between the feminization of agreements and the level of pay inequality
Source: Compiled using data from the national sector-wide collective agreements studied.
180 %
160 %
140 %
120 %
100 %
80 %
60 %
40 %
20 %
0 %
0 % 10 % 20 % 30 % 40 % 50 % 60% 70%
Level of inequality between the highest and lowest salaries in the agreements
Feminization of the sector

54 / EQUAL PAY AND COLLECTIVE BARGAINING
5.10. Wage supplements
Article 26.335 of the ET lists only the three main reasons for wage supplements: the employee’s personal circumstances, the work carried out and the company’s sit-uation and results. Therefore, any supple-ments that do not fall within these three categories must be considered as basic salary.
This is the case with regular bonuses such as the so-called standard bonus, whose
35 ‘Through collective bargaining or, in its absence, in-dividual contracts, the wage structure shall be de-termined, which must include the basic salary, as fixed remuneration per unit of time or work and, where applicable, wage supplements fixed accord-ing to circumstances relating to the employee’s per-sonal conditions, the work carried out or the com-pany’s situation and results, (...)’.
existence is often explained in the guar-antee of rights acquired by employees in relation to items of remuneration that have been removed.
Following the classification in the legal text, we have studied the type of wage supp-lements incorporated in the vari-ous collective agreements. According to legislation, wage supplements are deter-mined voluntarily. Even so, we have iden-tified that 121 of the 129 collective agree-ments (94% of the total) include wage supplements.
In order to study them, we have classified them into four categories: wage supple-ments fixed according to the employee’s personal circumstances, including senior-ity and other aspects; supplements fixed according to circumstances relating to the work carried out, which have in turn been divided into two types: those relat-ing to the job performed by the employee
Table 16. Average lowest salaries by economic activity and percentage in relation to the minimum wage
Source: Compiled using data from the national sector-wide collective agreements studied.
Lowest basic salary Average of SMI
AGRICULTURE INDUSTRY CONSTRUCTION 789 144.6%
A: Agriculture, livestock, forestry and fishing 823 151.6%
B+F: Extractive industries and construction 714 129.1%
C: Manufacturing industry 792 145.7%
E: Supply of water, sanitation, waste management and decontamination 697 118.8%
SERVICES 781 146.5%
G: Retail and wholesale 851 165.2%
H: Transportation and storage 744 145.3%
I: Hospitality 793 143.9%
J: Information and communications 736 147.9%
K: Financial services and insurance 928 166.7%
L: Real estate 782 141.3%
M: Professional, scientific and technical activities 749 136.4%
O: Administrative and support services 781 144.4%
P: Education 678 128.6%
Q: Health and social services 730 133.1%
R: Arts, recreational activities and entertainment 887 153.4%
S: Other services 852 158.7%
OVERALL TOTAL 784 145.9%

Results and analysis / 55
Table 17. Total number of agreements with supplements and by type of supplement. By economic activity sector (total number of agreements and percentage)
NUMBER OF AGREEMENTS WITH SUPPLEMENTS
1. Personal
2. Circumstances relating to the work carried out 3. Company’s
results 4. Other
Job Quantity
Num
ber o
f aa
gree
men
ts
Num
ber o
f ag
reem
ents
with
su
pple
men
ts
With
sen
iorit
y su
pple
men
ts
With
oth
er
supp
lem
ents
With
haz
ard
pay
With
shi
ft w
ork
supp
lem
ents
With
nig
ht s
hift
su
pple
men
ts
Oth
er
Ove
rtim
e
Oth
er
In k
ind
Stan
dard
bon
us
AGRICULTURE INDUSTRY CONSTRUCTION
43 40 24 1 23 7 37 14 38 26 9 39 27
A: Agriculture, livestock, forestry and fishing
5 4 2 0 4 1 5 1 5 3 0 5 4
B+F: Extractive industries and construction
3 2 1 1 1 1 2 1 3 3 0 3 2
C: Manufacturing industry 32 31 18 0 17 4 27 10 28 19 9 28 19
E: Supply of water, sanitation, etc.
3 3 3 0 1 1 3 2 2 1 0 3 2
SERVICES 86 81 43 16 9 5 44 33 59 33 14 72 27
G: Retail and wholesale 10 10 6 2 1 0 8 4 7 5 3 8 3
H: Transportation and storage
13 12 7 1 1 1 7 4 7 5 0 8 6
I: Hospitality 2 2 1 0 0 0 1 1 2 0 0 2 1
J: Information and communications
6 5 1 1 0 0 1 3 4 3 0 5 2
K: Financial services and insurance
6 6 3 3 0 1 0 4 5 4 5 6 2
L: Real estate 1 1 1 0 0 0 0 1 1 1 0 1 1
M: Professional, scientific and technical activities
7 7 4 0 2 0 1 0 4 1 2 6 5
O: Administrative and support services
11 11 6 4 3 0 8 6 10 6 1 9 2
P: Education 12 12 7 3 1 0 8 6 10 3 1 12 1
Q: Health and social services
5 3 3 2 0 2 4 2 2 3 0 3 2
R: Arts, recreational activities and entertainment
8 7 2 0 0 0 2 1 3 1 0 7 1
S: Other services 5 5 2 0 1 1 4 1 4 1 2 5 1
OVERALL TOTAL 129 121 67 17 32 12 81 47 97 59 23 111 54

56 / EQUAL PAY AND COLLECTIVE BARGAINING
Source: Compiled using data from the national sector-wide collective agreements studied.
NUMBER OF AGREEMENTS WITH SUPPLEMENTS
1. Personal
2. Circumstances relating to the work carried out 3. Company’s
results 4. Other
Job Quantity
Num
ber o
f aa
gree
men
ts
Num
ber o
f ag
reem
ents
with
su
pple
men
ts
With
sen
iorit
y su
pple
men
ts
With
oth
er
supp
lem
ents
With
haz
ard
pay
With
shi
ft w
ork
supp
lem
ents
With
nig
ht s
hift
su
pple
men
ts
Oth
er
Ove
rtim
e
Oth
er
In k
ind
Stan
dard
bon
us
AGRICULTURE INDUSTRY CONSTRUCTION
43 93% 56% 2% 53% 16% 86% 33% 88% 60% 21% 91% 63%
A: Agriculture, livestock, forestry and fishing
5 80% 40% 0% 80% 20% 100% 20% 100% 60% 0% 100% 80%
B+F: Extractive industries and construction
32 67% 33% 33% 33% 33% 67% 33% 100% 100% 0% 100% 67%
C: Manufacturing industry 3 97% 56% 0% 53% 13% 84% 31% 88% 59% 28% 88% 59%
E: Supply of water, sanitation, etc.
3 100% 100% 0% 33% 33% 100% 67% 67% 33% 0% 100% 67%
SERVICES 86 94% 50% 19% 10% 6% 51% 38% 69% 38% 16% 84% 31%
G: Retail and wholesale 11 100% 60% 20% 10% 0% 80% 40% 70% 50% 30% 80% 30%
H: Transportation and storage
8 92% 54% 8% 8% 8% 54% 31% 54% 38% 0% 62% 46%
I: Hospitality 6 100% 50% 0% 0% 0% 50% 50% 100% 0% 0% 100% 50%
J: Information and communications
1 83% 17% 17% 0% 0% 17% 50% 67% 50% 0% 83% 33%
K: Financial services and insurance
7 100% 50% 50% 0% 17% 0% 67% 83% 67% 83% 100% 33%
L: Real estate 5 100% 100% 0% 0% 0% 0% 100% 100% 100% 0% 100% 100%
M: Professional, scientific and technical activities
10 100% 57% 0% 29% 0% 14% 0% 57% 14% 29% 86% 71%
O: Administrative and support services
12 100% 55% 36% 27% 0% 73% 55% 91% 55% 9% 82% 18%
P: Education 2 100% 58% 25% 8% 0% 67% 50% 83% 25% 8% 100% 8%
Q: Health and social services
6 60% 60% 40% 0% 40% 80% 40% 40% 60% 0% 60% 40%
R: Arts, recreational activities and entertainment
5 88% 25% 0% 0% 0% 25% 13% 38% 13% 0% 88% 13%
S: Other services 13 100% 40% 0% 20% 20% 80% 20% 80% 20% 40% 100% 20%
OVERALL TOTAL 129 94% 52% 13% 25% 9% 63% 36% 75% 46% 18% 86% 42%

Results and analysis / 57
and those relating to the quantity or qual-ity of the work carried out; those relating to the company’s situation or results; and finally others that are very common in the majority of agreements such as benefits in kind or the ‘standard bonus’.
Of all these, the wage supplements that are most common in national sector-wide collective agreements are benefits in kind (in 86% of agreements), overtime payments as a supplement for quantity of work (75%), night shift supplements (63%), personal seniority supplements (52%), the ‘standard bonus’ (42%), hazard pay (25%), company results supplements (18%) and finally shift work supplements (9%). (See Graph 11)
SUPPLEMENTS FIXED ACCORDING TO THE EMPLOYEE’S PERSONAL CIRCUMSTANCES
The first type of wage supplements pro-vided for in the Statute on Workers’ Rights are those fixed according to the personal circumstances of the potential recipient.
The most common personal supplement in the agreements studied is the seniority supplement. This refers to the employee’s seniority in the company, so he or she
receives a reward that normally increas-es over the years spent in the company. Over half of agreements (52%) include this supplement (67 of the 129 agree-ments studied).
56% of collective agreements in the ag-riculture, industry and construction sec-tors include this supplement, compared to 50% of agreements applicable to the service sector. Thus, there is no signifi-cant difference between the two sectors. (See Graph 12)
We found other personal supplements in 17 agreements, the most common of which were the qualifications supplement and the languages supplement. In total, we counted 10 types of personal supple-ments.
Some agreements, such as the national collective agreement of temporary em-ployment agencies (2008), encompass in one supplement all of the employee’s personal conditions that have not been assessed previously,36 such as qualifica-tions, languages or specialist knowledge.
36 ‘Article 28.5. Personal supplement: a supplement ap-plied to qualifications, languages, specialist knowl-edge or similar deriving from the employee’s per-sonal circumstances which were not assessed when fixing the basic salary’.
Graph 11. Presence of the main wage supplements in national sector-wide collective agreements (percentage of agreements)
Source: Compiled using data from the national sector-wide collective agreements studied.
Benefits in kind
Overtime payments
Night shift supplements
Seniority
Standard supplements bonus
Hazard pay
Company results supplements
Shift
86%
75%
63%
52%
42%
25%
18%
9%

58 / EQUAL PAY AND COLLECTIVE BARGAINING
Conversely, the national collective agree-ment of the trade cycle of paper and graphic arts (2010) envisages payment for diplomas, even though its text does not define this as a supplement; rather, it refers to ‘special cases of remuneration’.37
The national collective agreement of pri-vate universities, private university centers and postgraduate training centers (2010) takes into account payment of a qualifi-cation supplement linked to a certain pro-fessional category, so this supplement is called ‘functional’.38
The languages supplement or bonus is often awarded for habitual use, For ex-ample, the national collective agreement on gardening (2013) defines it as follows: ‘All administrative personnel with perfect
37 ‘Article 24. (...) Special cases of remuneration. Em-ployees with knowledge accredited by their com-panies of one or more foreign languages, provided that this knowledge is required and agreed with the company, shall receive 10% of their basic salary for each language. Employees who have a diplo-ma issued by a School of Library and Information Science shall receive a 10% increase on their basic salary, provided that they work in the library sector’.
38 ‘Article 22. Functional supplement. (...) In addition, all those with doctorates in the professional cate-gory of lecturer working in universities shall receive, over twelve monthly payments, a supplement also specified in Annex 1’.
knowledge of a written or spoken lan-guage(s) that they habitually use for the benefit of the company shall receive the so-called languages bonus (...)’
This supplement is not always defined as personal. The national collective agree-ment of the contact center sector (pre-viously telemarketing) (2012) includes a languages bonus in the article defining job-related supplements.39
Other supplements that may be classified as personal that we found when study-ing the agreements take into account ex-perience, age or disability, among other things. (See Table 18)
SUPPLEMENTS FOR CIRCUMSTANCES RELATING TO THE WORK CARRIED OUT JOB-RELATED SUPPLEMENTS.
The second group for classifying wage supplements is those fixed according to the circumstances of the work carried out. For their part, these supplements
39 ‘Article 46. Job-related supplements. Languages bonus: this is received by all operations personnel whose job requires them to use one or more for-eign languages or one or more co-official languag-es of Spain outside of the Autonomous Community, where the co-official language is recognized (...)’
Graph 12. Presence of personal supplements in national sector-wide collective agreements: seniority supplement and others (percentage of agreements by major sector)
Source: Compiled using data from the national sector-wide collective agreements studied.
With seniority supplements
With other personal supplements
With seniority supplements
With other personal supplements
AGRICULTURE INDUSTRY
CONSTRUCTION
SERVICES
56%
2%
50%
19%

Results and analysis / 59
can be classified into two subcategories. The first, which refers to conditions asso-ciated with the normal course of activi-ties, are called job-related supplements. These include hazard pay, shift work sup-plements and night shift supplements.
In this case, there are key differences be-tween sectors: 53% of agreements cover-ing the typically masculine sector of in-dustry (and agriculture and construction) include hazard pay compared to 10% of the service sector, which is highly femi-nized. 16% include supplements for shift work and 86% include supplements for night shifts, compared to 6% and 51% re-spectively of service sector agreements.
The supplements cited are the most com-mon in the category of job-based– or workplace-based– supplements and, as we have seen, they are much more com-mon in masculine sectors. Lower pay for more feminine activities partly explains the lower pay of women, who have fewer opportunities to improve their wage con-ditions.
Other job-based or workplace-based supplements
36% of the collective agreements analyz-ed (47 agreements) include other types of work-place-based supplements. There are 79 references to job-based wage sup-plements, divided into four categories (see Table 19):
• Supplements associated with high-lev-el professional categories are present in 25.3% of cases. These are supple-ments related to highl-level categories or leadership positions, such as, for example, the coordination bonus (in the collective agreement of wholesal-ers, specialist distributors and phar-maceutical products); the instruction, supervision and assessment bonus (collective agreement of civilian pri-vate air traffic control service provid-ers); the responsibility bonus (external support services and customer service in rail companies and the co-llective agreement on educational leisure and sociocultural animation); and the man-agement supplement (in the collective agreement on youth reform and child protection and the collective agree-ment of centers and services for disa-bled people).
• We counted 28 examples of supple-ments that compensate job-related financial losses. These include, for ex-ample, the currency devaluation bonus (in the collective agreement of the steel industry, the collective agree-ments of cooperative credit societies and gas stations, and the collective agreement of companies that organ-ize bingo games, among others); the transport or distance bonus (the col-lective agree-ment of home delivery companies and the collective agree-
Table 18. Other personal supplements, distributed by type
Source: Compiled using data from the Annual Wage Structure Survey (2013)
Other personal supplements Number of references
Qualifications 5
Languages 4
Experience 2
Seniority supplement 2
Location and insularity bonus 1
Specialization bonus 1
Age bonus 1
Disability 1
Professional development 1
Personal level supplement 1

60 / EQUAL PAY AND COLLECTIVE BARGAINING
ment of field services companies for replenishment activities); and the cleaning and maintenance of work-wear bonus (the collective agreement on disinfection, fumigation and rodent control), among others.
• We found 6 supplements that compen-sate poor working conditions which, in addition to the hazard pay we have al-ready seen, are specific supplements in certain collective agreements, such as, for example, the cold or refrigera-tion bonus, the airport X-ray bonus, depth su-pplements and the versatility bonus, among others. All of these refer to worse physical working conditions.
• Finally, there are some supplements associated with the professionalization or specialization of the employee for any condition required in the job. By way of example, some of the 25 agree-ments counted in this category are: the caretaker bonus (the collective agree-ment of security companies); the cas-hier bonus (the collective agreement of savings banks); the delivery person bonus (the collective agreement on
self-propelled mobile cranes; and the general service bonus (the collective agreement on banking).
The vast majority of supplements fixed ac-cording to the circumstances of the work carried out are applicable to masculine jobs. By way of example, the higher cate-gories with greater responsibility are most-ly occupied by men, and so these types of sup-plements favor men. Furthermore, they have a multiplying effect on the gap, since they doubly reward the highest posi-tions which are already masculine.
In addition, as we have seen, the majori-ty of supplements for unfavorable work-ing conditions are for hazard pay, which is closely associated with masculine jobs. In turn, we can see that other job-related supplements that compensate for other kinds of unfavorable working conditions are also associated with conditions in masculine workplaces, such as the cold or refrigeration bonus. An exception is the versatility bonus in the national collective agreement on banking, since it rewards or compensates multitasking at work, a fea-ture typically associated with women.
Graph 13. Presence of job-related supplements in national sector-wide collective agreements: hazard pay, night shift supplements and others (percentage of agreements by major sector)
Source: Complied using data from the national sector-wide collective agreements studied.
With hazard pay
With shift work
Night shift
Other jobs
With hazard pay
With shift work
Night shift
Other jobs
AGRICULTURE INDUSTRY
CONSTRUCTION
SERVICES
53%
16%
86%
33%
10%
6%
51%
38%

Results and analysis / 61
SUPPLEMENTS FOR CIRCUMSTANCES RELATING TO THE WORK CARRIED OUT: SUPPLEMENTS FOR QUALITY OR QUANTITY OF WORK
The second category by which supple-ments for circumstances relating to the work carried out can be classified are supplements for quality or quantity of work. Of this group of supplements, over-time pay is the most common in the col-lective agreements studied, appearing in 75% of cases.
Again, as with job-based supplements, these this type of supplement is more common in agreements in the most mas-culine sectors. 88% of agreements in the agriculture, industry and construction sectors include overtime pay, compared to 69% in the service sector.
It should be noted here that the collec-tive agreement on lasts, heels, wedges, shanks, wood and cork expressly prohib-its pregnant women from working over-time, thus resulting in clear sex discrimi-nation: ‘article 24. Over-time at night, with certain legal exceptions, and by appren-tices, pregnant women and those under the age of 18, is hereby prohibited’.
46 % of the collective agreements analyz-ed (59 agreements) include other types of supplements for quality or quantity of work. In this case, they are again more common in collective agreements in more masculine sectors: 60% of agreements in the agriculture, industry and construc-
tion sectors include supplements for the quality or quantity of work other than the overtime supplement, compared to only 38% in the more feminine service sector. (See Graph 14)
Other supplements for quality or quan-tity of work
Supplements for quality or quantity of work have been classified into three subcatego-ries or types (see Table 20):
• The first has been called the quality of attendance supplement, which main-ly rewards attendance, diligence and punctuality in the workplace. Of the 97 supplements for quality or quantity of work present in the collective agree-ments analyzed, 17.5% are associated with this concept of quality in the work carried out.
• The second subcategory of supple-ments for quality of work is those bonuses or supplements that reward flexibility, such as, for example, avail-ability bonuses; weekend bonuses; ready availability bonuses; holiday supplements and extension of working hours bonuses. These make up 37.1% of supplements for quality or quantity of work.
• Finally, the third subcategory is for sup-plements associated with the quantity and results of the work carried out: bonuses; incentives; pieceworks; effi-ciency bonuses; and revenue bonus-es, among others. The type of supple-ments in this subcategory are most
Table 19. Other job-related supplements, distributed by type
Source: Compiled using data from the national sector-wide collective agreements studied.
Other job-related supplements Number of references Distribution
High categories 20 25.3%
Compensation 28 35.4%
Physical working conditions 6 7.6%
Specialization 25 31.6%
TOTAL 79 100.0%

62 / EQUAL PAY AND COLLECTIVE BARGAINING
common, since they are found in 44% of the collective agreements analyzed.
Wage supplements for quality or quantity of work are more common in collective agreements in the most masculine sec-tors. In turn, this type of supplement, as we have seen, is closely linked to availa-bility. Again, compensation through sup-plements is prejudicial to women, as they are the ones who de facto have to bal-ance work and family life and are also less able to improve their earnings.
In terms of attendance bonuses, few agreements define situations that are considered as absence from work. One of these, the collective agreement of private civilian air traffic service providers, de-fines it as follows: ‘any time an employee misses work, including temporary inva-lidity, shall be considered absence unless caused by an accident at work or occu-pational illness’.
SUPPLEMENTS FIXED ACCORDING TO CIRCUMSTANCES RELATING TO THE COMPANY’S SITUATION AND RESULTS, BENEFITS IN KIND AND STANDARD BONUS
The third group of wage supplements are those fixed according to circumstances relating to the company’s situation and results. In the study we analyzed collec-tive agreements that include the payment of profit-sharing supplements or bonus-es. 23 agreements include this, making up 18% of the total number of agreements. By major sector, 21% of agreements in the agriculture, industry and construction sectors include this, compared to 16% in the service sector.
Finally, we noted that many agreements include the payment of benefits in kind. 111 agreements, which equates to 86% of the total, include this type of supplement (91% in the agriculture, industry and con-struction sectors and 84% in the service sector.
We highlight the ‘standard bonus’, present in 63% of agreements in the most mascu-line sectors of industry (and agriculture and construction) and 31% of agreements in the most feminine service sector. This figure corresponds in 61% of cases to old seniority supplements which, after
Graph 14. Presence of quality or quantity supplements in national sector-wide collective agreements: overtime and others (percentage of agreements by major sector)
Source: Compiled using data from the national sector-wide collective agreements studied.
Overtime
Other quantity
Overtime
Other quantity
AGRICULTURE INDUSTRY
CONSTRUCTION
SERVICES
88%
60%
69%
38%

Results and analysis / 63
being removed from new agreements, have been maintained in the figure of the standard bonus. On other occasions, this supplement corresponds to other types of improvements and bonuses that have been removed, and thus act as a guaran-tee of the rights acquired. (See Graph 15)
BENEFITS: VOLUNTARY BENEFITS (FOR COMMON TEMPORARY INVALIDITY AND ACCIDENTS OUTSIDE WORK)
Because of its equal significance in ex-amining the gender impact, we have also analyzed the most common benefits such as voluntary benefits. We highlight vol-untary benefits laid down by collective
agreements for payments for temporary invalidity due to common illness or an ac-cident outside of work.
These figures are extremely important for the analysis of the gender impact, as illnesses or disabilities suffered in the most feminine occupations and eco-nomic activities are not yet cataloged as work-related (which are better paid), so many women are financially penalized for the duration of their incapacity.
In this sense, 64% of agreements offer improvements in pay for temporary inca-pa-city due to common illness and 56% for accidents outside work, and the per-centage is higher in agreements for the more traditionally feminine service sector. (See Table 21)
Table 20. Other supplements for quality or quantity of work, distributed by type
Source: Compiled using data from the national sector-wide collective agreements studied.
Other supplements for quality or quantity of work Number of references Distribution
Quality of attendance 17 17.5%
Quality: flexibility 36 37.1%
Quantity: results 44 45.4%
TOTAL 97 100.0%
Graph 15. Presence of supplements fixed according to the company’s situation or results, benefits in kind and standard bonus (percentage of agreements by major sector)
Source: Compiled using data from the national sector-wide collective agreements studied.
Company results supplements
Benefits in kind
Standard bonus
Company results supplements
Benefits in kind
Standard bonus
AGRICULTURE INDUSTRY
CONSTRUCTION
SERVICES
21%
91%
63%
16%
84%
31%

64 / EQUAL PAY AND COLLECTIVE BARGAINING
Table 21. Voluntary benefits in agreements, distributed by type, By economic activity sector (total number of agreements and percentage)
Source: Compiled using data from the national sector-wide collective agreements studied.
Total number of agreements
Temporary invalidity due
to common illness
Temporary invalidity due
to accident outside
work
Other voluntary
benefits
AGRICULTURE INDUSTRY CONSTRUCTION 43 25 17 24
A: Agriculture, livestock, forestry and fishing 5 2 2
B+F: Extractive industries and construction 3 2 0 3
C: Manufacturing industry 32 20 14 20
E: Supply of water, sanitation, etc. 3 1 1 1
SERVICES 86 58 55 46
G: Retail and wholesale 10 10 6 3
H: Transportation and storage 13 4 3 6
I: Hospitality 2 2 2 2
J: Information and communications 6 3 3 2
K: Financial services and insurance 6 5 4 5
L: Real estate 1 1 1 0
M: Professional, scientific and technical activities 7 6 6 4
O: Administrative and support services 11 5 6 7
P: Education 12 10 10 7
Q: Health and social services 5 3 3 1
R: Arts, recreational activities and entertainment 8 6 8 4
S: Other services 5 3 3 5
OVERALL TOTAL 129 83 72 70
Total number of agreements
Temporary invalidity due
to common illness
Temporary invalidity due
to accident outside
work
Other voluntary
benefits
AGRICULTURE INDUSTRY CONSTRUCTION 43 58% 40% 56%
A: Agriculture, livestock, forestry and fishing 5 40% 40% 0%
B+F: Extractive industries and construction 3 67% 0% 100%
C: Manufacturing industry 32 63% 44% 63%
E: Supply of water, sanitation, etc. 3 33% 33% 33%
SERVICES 86 67% 64% 53%
G: Retail and wholesale 10 100% 60% 30%
H: Transportation and storage 13 31% 23% 46%
I: Hospitality 2 100% 100% 100%
J: Information and communications 6 50% 50% 33%
K: Financial services and insurance 6 83% 67% 83%
L: Real estate 1 100% 100% 0%
M: Professional, scientific and technical activities 7 86% 86% 57%
O: Administrative and support services 11 45% 55% 64%
P: Education 12 83% 83% 58%
Q: Health and social services 5 60% 60% 20%
R: Arts, recreational activities and entertainment 8 75% 100% 50%
S: Other services 5 60% 60% 100%
OVERALL TOTAL 129 64% 56% 54%


66
6

67
SUMMARY AND
CONCLUSIONS

68 / EQUAL PAY AND COLLECTIVE BARGAINING
6.1. SUMMARY
MAP OF WAGE INEQUALITY ACCORDING TO THE WAGE STRUCTURE SURVEY
Pay gap and type of economic activity. The data shows that there is a certain corre-lation between the economic ac-tivity and the pay gap: the more femi-nized the sector, the greater the income inequality between men and women. The high level of feminization of some sectors reflects the horizontal segregation suf-fered by women in the labor market: they are employed in certain economic activ-ity sectors within the service and care sectors. In turn, it is these sectors where the pay differential between the sexes is greatest, since they are probably the worst paid and placed on lower levels of the job classification system.
Pay gap and type of occupation. While occupations in lower-level categories are more feminized, there is no positive cor-relation between the level of feminization of the occupation and the level of wage in-equality.
Pay gap and working conditions. There is a greater wage gap between men and women with better working conditions: permanent contract and full time. This could be because the pay structure for these better conditions is more complex, with wage supplements and other finan-cial benefits linked to stability that are more common in masculine sectors and occupations.
Pay gap and age. Older women suffer lim-itations in their professional and wage de-velopment because of the so-called ‘glass ceiling’ and the need to balance work and family life, which falls mainly on women of reproductive age. This creates worse ca-reer paths, with irregular entries and exits from the labor market that are penalized at retirement age. We can see the income differential between men and women from the age of 65 which increases to 41.2%, a
result of penalization by the Spanish con-tributory social security system.
Pay gap and wage level. There is a nega-tive correlation between the wage level and the pay gap; the higher the wage, the lower the income inequality between the sexes.
Pay gap and wage supplements. Supple-ments and other types of remuneration have a positive impact on the gap, i.e. they significantly increase the pay differential between men and women. We can see that wage supplements in all economic activi-ty sectors aggravate inequality. The gap in basic salaries increases because of su-pple-ments and other items of remuneration. These increase the initial gap in basic salary by between 30% and 470%.
RESULTS OBTAINED FROM THE STUDY OF NATIONAL SECTOR-WIDE COLLECTIVE AGREEMENTS
Agreements studied. The 129 agree-ments studied cover a total of 5,656,295 employees, of whom 35.5% are women. 83.4% of women are covered by agree-ments in the service sector, compared to 16.6% who are covered by agreements in the industrial, agriculture or construction sectors.
Language. Using egalitarian and inclusive language makes women visible, breaking sexist stereotypes and prejudices; it is therefore a vital tool in continuing to pro-gress on the path towards a labor market free form gender bias. By studying agree-ments, we found that virtually all collec-tive agreements (80%) use androcentric and sexist language, using masculine nouns for job categories and other refer-ences. We found 6 agreements that also discriminate through language by using feminine nouns for typically feminine job categories.
Reference to gender equality in wages. Only 32,6% of all sector-wide agreements contain any reference to equal pay.
Job classification structure. The Law on the Statute of Workers’ Rights, which

Summary and conclusions / 69
arose from the latest labor reforms, bases job classification in the agreements around professional groups. Howev-er, there are still some agreements that structure only by category, even though the most common formula in the majority of collective agreements is classification into professional groups and categories.
Furthermore, almost 25% of collective agreements still determine their job clas-sification system in the same way as that provided for in the relevant labor ordi-nance and 36.4% of the agreements stud-ied adopt a classification system based on factors provided for in the Agreement on Filling Gaps.
Salary scales. Even though it is not re-quired by law, 88.4% of agreements or-ganize and structure the pay of the em-ployees covered according to salary scales.
Agreed Guaranteed Minimum Wage. Few agreements refer to a guaranteed minimum wage (only 29 of the 129 agree-ments studied).
Basic salaries and inequality between minimum and maximum salaries on the salary scale. The average of the lowest and highest salaries on the salary scales in the collective agreements analyzed is 784 euros and 1,517 euros a month re-spectively (12 payments). Therefore, the highest basic salary is 93.5% higher than the lowest salary, and this difference is more pronounced in the more feminine service sector.
This indicator of inequality is not in itself a reflection of the level of income inequality between men and women in each activity sector. However, it can be taken as such, since more women than men are em-ployed in lower categories, thus receiving lower wages.
Level of coverage of the agreed salary and SMI. We can see that, on average, the lowest basic salary in the collective agreements studied is 45.9% higher than the SMI in the year of publication of the agreement.
Wage supplements. 94% of the 129 col-lective agreements include the existence of wage supplements. Of all these, the wage supplements that are most com-mon in national sector-wide collective agreements are benefits in kind (in 86% of agreements), overtime supplements (75%), night shift supplements (63%), per-sonal seniority su-pplements (52%), the ‘standard bonus’ (42%), hazard pay (25%), company results supplements (18%) and finally shift work supplements (9%).
• Supplements fixed according to the employee’s personal circumstances
Seniority supplement: This is a type of a supplement that has a negative im-pact on many women, especially in tra-ditionally masculine occupations, since women’s inclusion in these sectors came later and they therefore have less earning potential. Over half of the agreements (52%) include a seniority supplement (67 of the 129 studied) and there is no significant difference between the industry and service sec-tors.
• Supplements related to the work car-ried out
Job-related supplements: These sup-plements are mostly associated with occupations and professional ca-tego-ries typically made up of men and take into account criteria such as physical effort, environmental conditions, etc.; they are much more common in agree-ments in masculine sectors. This is true of hazard pay, which is included in 53% of agreements in the industrial sector compared to 10% in the service sector.
Job-related supplements associated with high-level job categories (coor-dination bonus, responsibility bonus, management bonus, etc.) are present in 25.3% of cases, and again improve the high-level categories that are more masculine. Furthermore, they have a multiplying effect on the gap, since they doubly reward the highest posi-tions which are already masculine.

70 / EQUAL PAY AND COLLECTIVE BARGAINING
Supplements for quality or quantity of work: Wage supplements for quality or quantity of work are more common in collective agreements in the most masculine sectors. In turn, this type of supplement, as we have seen, is closely linked to availability. Again, compensa-tion through supplements is prejudicial to women, as they are the ones who de facto have to balance work and family life and are also less able to improve their earnings.
88% of agreements in the agri-culture, industrial and construction sectors in-clude overtime payments, compared to 69% in the service sector.
We highlight the ‘standard bonus’, present in 63% of agreements in the most masculine industrial (and agricul-ture and construction) sectors and 31% of agreements in the most feminine service sector.
6.2. CONCLUSIONS
JOB CLASSIFICATION AS A DETERMINING FACTOR IN THE SHAPING OF PAY STRUCTURES
The current labor relations model has its roots in the scientific Taylorist method of organizing jobs that emerged in the 1920s in France. This method originat-ed as a consequence of the needs of the productive system at a time of high in-dustrialization.
It shaped the job classification system of the old labor ordinances, organizing jobs into professional categories by breaking down the various tasks and roles per-formed by employees in those jobs. This method of classification involved a high level of hierarchization, linked to the lev-els of res-ponsibility and initiative neces-sary to perform those roles.
Since their creation, the ordinances reg-ulated, among other things, the ‘clas-sification of personnel by professional specialties’ including the definitions of each of these. The ordinances, still pres-ent in many of the agreements analyzed, maintain this description of roles and the names of many jobs are also taken from this productive model.
17 years after the Law on the Statute on Workers’ Rights was passed, and faced with the need for an instrument capable of filling gaps caused by the disappear-ance of the labor ordinances, the Agree-ment on Filling Gaps was signed in 1997.
This agreement established a number of grouping factors (knowledge, expe-rience, initiative, autonomy, responsibil-ity, leadership and complexity) with the aim of quantifying the professional apti-tudes necessary to appoint an employee to a certain job. These elements were not reflective of the time, with heavy losses in industry in favor of a growing service sector and feminization of the productive model.
The study of the collective agreements shows that the grouping factors estab-lished in the agreement on gaps are still used to assess personal aptitudes.
The introduction of these classification models and professional grouping fac-tors, which are still used in many collec-tive agreements, has given rise to an as-sessment of the professional aptitudes of employees through an old-fashioned methodology, unsuited to the widespread inclusion of women in paid employment.
If job classification systems have not adapted to the large increase in jobs in the typically feminine service sector, and the factors most taken into account are those such as initiative and responsibility, associated with typically masculine jobs, we can accept the theory that job clas-sification systems, and job assessment methods, are some of the main factors behind the gender pay gap.
It should be noted that grouping factors are not prejudicial in terms of gender in

Summary and conclusions / 71
and of themselves. What makes them prejudicial is the definition established by the Agreement on Filling Gaps, which de factor favors masculine jobs. It also pro-motes the development of wage supple-ments linked to factors that are very com-mon in masculine jobs (wage supplements for physical effort, responsibility, etc.).
The factors used to classify jobs are clear-ly prejudicial to typically feminine jobs, since factors such as initiative, autonomy, leadership and complexity are all includ-ed in higher, more masculine professional categories or groups.
Consequences for pay structure
As a consequence of the above, the basic sa-lary received by women is lower than that of men: the roles they carry out are less valued and job classifications places more feminine jobs in lower professional categories or groups.
As a result of the old ordinances and the application of assessment criteria from the Agreement on Filling Gaps, which benefits more masculine categories and workplaces, the presence of wage sup-plements in more masculine sectors and professional categories is also common: hazard pay, productivity supplements and attendance or initiative supplements, among others. However, capa-cities that are desirable or necessary for more re-cent and typically feminine paid jobs are hardly valued.
Supplements associated with the man-ufacturing and productive system or highly industrialized jobs, with ascendant and linear careers, are still very common. The seniority supplement, for example, rewards long service in a company, whi-chis much more common for men than women, whose career paths are intermit-tent, with many more entrances and exits from the labor market than men due to their dual role of work and family care.
Overtime, also a result of the productive system, is again prejudicial to new fem-inine jobs, for the same reason already explained. This supplement remains in collective agreements for the more mas-
culine sectors of industry and less so in agreements for the service sector.
What should a job classification with no negative impact on women look like?
• Turning to the situation in which we find ourselves, it would be advisable to start a process to adapt the basis of the current job classification model to a much more feminized labor market with a much more important service sector.
• Job classification must be neutral from the gender perspective: General pro-fessional grouping criteria must fa-cilitate a neutral allocation of roles to each group of employees.
• The names of professional categories must be neutral and aim not to pre-judge.
• Jobs requiring equal work must be placed in equal categories for the pur-poses of equal pay.
What should a wage structure with no negative impact on women look like?
• Criteria for items of remuneration must be clearly fixed and transparent.
• It is recommended that the collective agreement fix a sector-wide guaran-teed minimum wage to avoid signifi-cant wage dispersion.
• We must determine what percentage of the total pay is made up of wage supplements and benefits.
• We must review the reasons for wage supplements and benefits to make sure they have an objective and rea-sonable justification.
• We must avoid supplements that pe-nalize extended leaves of absence linked to conciliation (attendance and length of service bonuses).
• We must avoid giving excessive weight to supplements linked to attendance and flexibility of working hours (exten-sion of working hours bonus) or mo-bility.

72 / EQUAL PAY AND COLLECTIVE BARGAINING
• We must avoid giving excessive weight to seniority and take into account other aspects linked to professional experience such as the knowledge and training acquired.
• It is advisable to avoid supplements that penalize extended leaves of ab-sence linked to conciliation (attend-ance and length of service bonuses).
• In the regulation of bonuses, collec-tive agreements must avoid penalties caused by career breaks linked to ma-ternity/paternity or other conciliation rights. Equally, it is advisable not to include wage supplements that, al-though not discriminatory, are not neutral from the gender perspective such as, for example, seniority.


74
7

75
BIBLIOGRAPHY

76 / EQUAL PAY AND COLLECTIVE BARGAINING
caBeza Pereiro, J. Estrategias para la in-corporación transversal del género en la negociación colectiva. Negociando la igualdad en las empresas: estado de la cuestión y estrategias para la implemen-tación de una política de igualdad de gé-nero, 2012.
European Commission (2010). Communi-cation from the Commission to the Euro-pean Parliament, the Council, the Europe-an Economic and Social Committee and the Committee of the Regions, Strategy for Equality between Women and Men. 2010-2015.
Del río, Coral and Villar, Alonso. “Muje-res ante el empleo (y el desempleo) en el mercado laboral español, 1996-2013”. In “Desigualdades de género en España: continuidades y cambios”. Áreas Revista Internacional de Ciencias Sociales, no. 33, 2014.
chacartegui JaVea, C. “El largo recorrido hacia igualdad de oportunidades entre hombres y mujeres en el ámbito laboral: un avance significativo con las medidas previstas en la Ley Orgánica de Igualdad”. Revista Jurídica de Catalunya, Volume 106, no. 1/2007.
chacartegui JaVea, C. “La igualdad de oportunidades en la negociación colecti-va: un antes y un después tras la reforma laboral de 2012”. Anuario IET, de trabajo y relaciones laborales, volume 1/2013.
escuDero roDríguez, R.J. and Palomo BalDa, E. La reforma en el régimen de salarios en la Reforma del Estatuto de los Trabajado-res. Wolters Kluwer, Madrid, 1994.
FernánDez lóPez, M.F. “Negociación colec-tiva y contrato de trabajo: Apuntes sobre sus conexiones”, Revista andaluza de tra-bajo y bienestar social, no. 76/2004.
FernánDez lóPez, M.F. “Igualdad en el em-pleo y la ocupación”, Revista andaluza de trabajo y bienestar social, no. 91/2007.
FernánDez lóPez, M.F. “Igualdad y sistemas de seguridad social”, Revista del Ministe-rio de Trabajo e inmigración, no. 1/2007.
FernánDez lóPez, M.F. “Las causas de la discriminación o la movilidad del concep-
to”, Revista andaluza de trabajo y bienes-tar social, no. 981/2009.
lahera Forteza, J. “La regulación de la clasificación profesional y de la promo-ción profesional en los instrumentos de sustitución de las ordenanzas laborales”, en Balance material del proceso de susti-tución de las ordenanzas laborales: conti-nuidad y crisis de sus contenidos normati-vos. Director ValDés Dal-ré, F. Colección “Informe y Estudios”, Serie Relaciones La-borales, no. 23. Madrid, 1999.
lóPez lóPez, J. “Relaciones Laborales en las administraciones públicas y política de género: reflexiones sobre el impacto de la transversalidad”. Cuadernos de de-recho judicial, no. 7/2007.
lóPez lóPez, J. “Los principios rectores de la LO 3/2007 sobre igualdad efectiva entre mujeres y hombres a la luz de las estrategias de “Gender Mainstreaming” y “Enpowerment””. Revista del Ministerio de Trabajo e Inmigración, no. extra 2/2007.
lóPez lóPez, J. Un lado oculto de la flexibi-lidad salarial: el incremento de la judiciali-zación. Bomarzo, Albacete, 2008.
lóPez lóPez, J. and AA.VV. Buenas prác-ticas en la negociación colectiva, Consell Econòmic i Social de Barcelona, Quader-ns del CESB. Barcelona.
lousaDa arochena, J.F. “El impacto de gé-nero de la reforma de la negociación co-lectiva”. Revista Aequalitas, no. 33/2013.
morrison, a. Breaking the Glass Ceiling, 1987.
Organización Internacional del Trabajo. Igualdad de género en la Negociación Colectiva. Análisis desde la perspectiva de género de los convenios colectivos vi-gentes en Centroamérica y República Do-minicana. San José, 2013
Pérez Del río, T. “Diálogo social y negocia-ción colectiva en Andalucía: una óptica de género; Los Planes de igualdad en las empresas”. Revista andaluza de trabajo y bienestar social, no. 100 /2009.
Pérez Del río, M.T. “La función de los in-terlocutores sociales y de la negociación colectiva en la Ley Orgánica de igualdad

Bibliography / 77
efectiva entre mujeres y hombres 3/2007. Los planes de igualdad en las empresas”, Revista del Ministerio de Trabajo e Inmi-gración, no. extra 2/2007.
Pérez Del río, T. Igualdad y género en el empleo: guías de negociación, Consejo Andaluz de Relaciones Laborales. 2006.
Pérez Del río, T. and Cruz Villalón, J. Una aproximación al derecho social comunita-rio. Tecnos, 2000.
Pumar i Beltrán, N. La igualdad ante la ley en el ámbito de la Seguridad Social. Edi-torial Aranzadi, 2001.
Pumar i Beltrán, N. “Reforma de pensiones en España, carreras profesionales irregu-lares e impacto de género”, Revista de Derecho Social, no. 55/ 2011.
serrano garcía, J.M. Igualdad por razón de género en el empleo: Una cuestión pen-diente de la negociación. Observatorio de la negociación colectiva, empleo público, igualdad, nuevas tecnologías y globaliza-ción. CC.OO, 2010.
ValDés Dal-re, F. Igualdad de género y negociación colectiva: el marco general. Relaciones laborales, Revista crítica de teoría y práctica. 2010, no. 2.
ValDés Dal-re, F. “La problemática salarial en la negociación colectiva”. Revista de Derecho Social, no. 3/1998.
ValDés Dal-re, F. “La prohibición de dis-criminación salarial por razón de sexo: comentario a la sentencia del Tribunal Constitucional sobre el asunto Fontane-da”. Revista Andaluza de trabajo y bien-estar social. no. 38 / 1996.

78
8

79
ANNEX

80 / EQUAL PAY AND COLLECTIVE BARGAINING
NATIONAL SECTOR-WIDE COLLECTIVE AGREEMENTS STUDIED
AGRICULTURE INDUSTRY CONSTRUCTION
A: AGRICULTURE, LIVESTOCK, FORESTRY AND FISHING
NATIONAL MARINE AQUACULTURE
NATIONAL COLLECTIVE AGREEMENT ON GARDENING
POULTRY FARMS AND OTHER ANIMALS
WOOD
RABBIT AND POULTRY ABBATOIRS
B+F: EXTRACTIVE INDUSTRIES AND CONSTRUCTION
CONSTRUCTION (SECTOR)
SALT INDUSTRY
TILES, BRICKS AND SPECIAL BAKED CLAY PARTS
C: MANUFACTURING INDUSTRY
GRAPHIC ARTS PAPER AND CARDBOARD MANIPULATION, EDITORIAL AND ANCILLARY INDUSTRIES
SUGAR (INDUSTRY)
FIBRE OPTIC CABLE DEALERSHIPS
VEGETABLE PRESERVES
SALTED, TINNED AND PRESERVED FISH AND SEAFOOD
TANNED STRAPS AND INDUSTRIAL LEATHER AND TANNING SKINS FOR PRODUCTION
CEMENT PRODUCTS
COMPANIES SPECIALISING IN PRODUCING SEAFOOD PRODUCTS WITH FREEZING AND REFRIGERATION PROCESSES
PRODUCERS OF PLASTER , CASTS, LIMES AND THEIR PREFABRICATION
STEEL INDUSTRIES
REFRIGERATION INDUSTRIES
BAKING AND SEMOLINA FLOURS (FLOUR AND SEMOLINA INDUSTRY)
ICECREAM, PRODUCTION OF
WOODEN AND CORK LASTS, HEELS, WEDGES AND MIDSOLES
FOOTWEAR INDUSTRY
CHEMICAL INDUSTRY
MEAT INDUSTRY
BOTTLED WATER INDUSTRY
COMPOUND FEEDINGSTUFFS INDUSTRY
RICE PRODUCTION INDUSTRY
CEREAL PRODUCTS INDUSTRY
PERFUME AND RELATED INDUSTRIES
NOUGART AND MARZIPAN INDUSTRY
EXTRACTIVE INDUSTRY, GLASS INDUSTRY, CERAMIC INDUSTRY
DAIRY INDUSTRIES AND THEIR DERIVATIVES
LEATHER GOODS, TRAVEL ITEMS, EMBOSSED LEATHER AND SKINS
RECUPERATION AND RECYCLING OF WASTE AND SECONDARY RAW MATERIALS
TAILORING, SHIRTMAKING, DRESSMAKING, AND OTHER TAILOR-MADE ARTISAN PRODUCTS
CORK SECTOR
TABACALERA S.A. (GUARANTEED REPRESENTATIONS)
TEXTILES AND CLOTHING (INDUSTRY)
TRANSPORT AND AREAL WORK THROUGH HELICOPTERS, THEIR MAINTENANCE AND REPAIR
E: SUPPLY OF WATER, SANITATION, WASTE MANAGEMENT AND DECONTAMINATION
IND. COLLECTION, ELEVATION, PIPING, TREATMENT, DISTRIBUTION, SANITATION AND PURIFICATION OF DRINKING WATER AND
SEWAGE
RECUPERATION AND RECYCLING OF WASTE AND SECONDARY RAW MATERIALS
SANITATION PUBLIC, ROAD CLEANING, IRRIGATIONS, TREATMENT AND ELIMINATION OF WASTE MATERIALS, CLEANING AND
CONVERSATION OF SEWAGE
SERVICES G: RETAIL AND WHOLESALE, EXCEPT MOTOR VEHICLES AND MOTORCYCLES
CONVENIENCE STORE CHAINS
WHOLESALE AND IMPORTERS OF CHEMICAL, PHARMACEUTICAL, PERFUMERY AND RELATED PRODUCTS

Annex / 81
FLOWERS AND PLANTS TRADE
PAPER AND GRAPHIC ARTS TRADE (CYCLE)
SPECIALIST WHOLESALE DISTRIBUTORS AND PHARMACEUTICAL PRODUCTS
NATIONAL COLLECTIVE AGREEMENT OF DRUGS RETAILERS, HERBALISTS AND PERFUMERIES
GARDEN CENTRE COMPANIES
GAS STATIONS
DEPARTMENT STORES
PHARMACIES
H: TRANSPORTATION AND STORAGE
AUTO-TAXIS
BOAT WORKERS
PARKING LOTS AND GARAGES (PREVIOUSLY VEHICLE PARKING, UTILITY COMPANIES AND PRIVATE COMPANIES
HOME DELIVERY COMPANIES
UNDIRECTED DELIVERY COMPANIES
PRIVATE CIVILIAN AIR TRAFFIC SERVICE PROVIDERS
PORT HANDLING
SELF-PROPELLED MOBILE CRANES
COURIER SERVICES
UNDIRECTED DELIVERY COMPANIES
AIRPORT GROUND HANDLING SERVICES
EXTERNAL SUPPORT AND CUSTOMER SERVICES IN RAIL COMPANIES
ROAD TRANSPORT OF GOODS
I: HOSPITALITY
HALLS OF RESIDENCE
MANUFACTURERS OF COOKED PRODUCTS FOR DOOR-TO-DOOR SELLING
J: INFORMATION AND COMMUNICATIONS
FILM DISTRIBUTORS AND THEIR EMPLOYEES
MAINTENANCE OF TELEPHONE BOXES, SUPPORTS AND TELEPHONES FOR PUBLIC USE
NON-DAILY PRESS
FIRST NATIONAL COLLECTIVE AGREEMENT OF THE COMMERCIAL SOUND BROADCASTING SECTOR
AUDIOVISUAL PRODUCTION INDUSTRY (TECHNICIANS)
FILM PRODUCTION AND ACTORS
K: FINANCIAL SERVICES AND INSURANCE
BANKING
SAVINGS BANKS
MEDIATION COMPANIES IN PRIVATE INSURANCE (PREVIOUSLY INSURANCE AGENTS AND BROKERS)
INSURANCE AND REINSURANCE COMPANIES, MUTUAL FUNDS FOR OCCUPATIONAL ACCIDENTS
CREDIT INSTITUTIONS
COOPERATIVE CREDIT SOCIETIES
L: REAL ESTATE
REAL ESTATE MANAGEMENT AND MEDIATION COMPANIES
M: PROFESSIONAL, SCIENTIFIC AND TECHNICAL ACTIVITIES
CONSULTANCY, MARKET RESEARCH AND PUBLIC OPINION SURVEYS
TAX TECHNICIANS AND CONSULTANCY FIRMS
ADMINISTRATIVE AGENCIES
PHOTOGRAPHIC INDUSTRIES
ENGINEERING COMPANIES AND TECHNICAL CONSIULTANCY FIRMS
ADVERTISING COMPANIES
PROPERTY AND TRADE REGISTRARS
O: ADMINISTRATIVE AND SUPPORT SERVICES
TRAVEL AGENCIES
CONTACT CENTERS (previously TELEMARKETING SECTOR)
RAIL CONTRACTS
NATIONAL COLLECTIVE AGREEMENT ON GARDENING
DISINFECTION, FUMIGATION AND RODENT CONTROL
SECURITY COMPANIES
82 / EQUAL PAY AND COLLECTIVE BARGAINING
FIELD SERVICES COMPANIES FOR REPLENISHMENT ACTIVITIES
CLEANING OF BUILDINGS AND FACILITIES
MAINTENANCE AND PRESERVATION OF WATER INSTALLATIONS
PARKING REGULATIONS LIMITED TO PUBLIC THOROUGHFARES
TEMPORARY EMPLOYMENT AGENCIES
P: EDUCATION
DRIVING SCHOOLS
PROFESSIONAL DIVING AND HYPERBARICS
CHILDCARE AND PRE-SCHOOL CENTERS
HAIRDRESSING AND BEAUTY SHOOLS, MUSIC AND APPLIED ARTS SCHOOLS AND ARTISTIC PROFESSIONS
GENERAL PRIVATE SCHOOLS OR REGULATED SCHOOLS WITH NO SUPPORT OR SUBSIDIES
UNIVERSITIES AND RESEARCH CENTERS
CENTERS AND SERVICES FOR DISABLED PEOPLE
PRIVATE EDUCATIONAL INSTITUTIONS FINANCED WHOLLY OR PARTLY WITH PUBLIC FUNDS
UNREGULATED EDUCATION AND TRAINING
TOURISM SCHOOLS
EDUCATIONAL LEISURE AND SOCIOCULTURAL ANIMATION
PRIVATE UNIVERSITIES, PRIVATE UNIVERSITY CENTERS AND POSTGRADUATE TRAINING CENTERS
Q: HEALTH AND SOCIAL SERVICES
AMBULANCES (TRANSPORT OF THE SICK AND ACCIDENT VICTIMS)
CENTERS AND SERVICES FOR DISABLED PEOPLE
NATUROPATHY CENTERS AND PROFESSIONAL NATUROPATHS
YOUTH REFORM AND CHILD PROTECTION
SERVICES FOR DEPENDANT PERSONS AND THE DEVELOPMENT OF PERSONAL AUTONOMY
R: ARTS, RECREATIONAL ACTIVITIES AND ENTERTAINMENT
PROFESSIONAL BASKETBALL
WOMEN’S LEAGUE PROFESSIONAL BASKETBALL
PROFESSIONAL HANDBALL
PROFESSIONAL CYCLING
COMPANIES THAT ORANIZE GAMES OF BINGO
PROFESSIONAL FOOTBALL
SPORTS FACILITIES AND GYMNASIUMS
FUNCTION ROOMS, DANCE HALLS AND NIGHTCLUBS IN SPAIN
S: OTHER SERVICES
GARDEN CENTER COMPANIES
PULP, PAPER AND CARDBOARD
HAIR SALONS, BEAUTY PARLOUS, GYMNASIUMS AND SIMILAR
DAILY PRESS
EXTERNAL PREVENTION SERVICES