Eq21 Iit Kanpur
27
Document No. :: IITK-GSDMA-EQ21-V2.0 Final Report :: A - Earthquake Codes IITK-GSDMA Project on Building Codes Explanatory Examples on Indian Seismic Code IS 1893 (Part I) by Dr. Sudhir K Jain Department of Civil Engineering Indian Institute of Technology Kanpur Kanpur
description
1
Transcript of Eq21 Iit Kanpur

Document No. :: IITK-GSDMA-EQ21-V2.0 Final Report :: A - Earthquake Codes
IITK-GSDMA Project on Building Codes
Explanatory Examples on Indian Seismic Code IS 1893 (Part I)
by
Dr. Sudhir K Jain Department of Civil Engineering
Indian Institute of Technology Kanpur Kanpur

• The solved examples included in this document are based on a draft
code being developed under IITK-GSDMA Project on Building Codes. The draft code is available at http://www.nicee.org/IITK-GSDMA/IITK-GSDMA.htm (document number IITK-GSDMA-EQ05-V3.0).
• This document has been developed through the IITK-GSDMA Project on Building Codes.
• The views and opinions expressed are those of the authors and not necessarily of the GSDMA, the World Bank, IIT Kanpur, or the Bureau of Indian Standards.
• Comments and feedbacks may please be forwarded to: Prof. Sudhir K Jain, Dept. of Civil Engineering, IIT Kanpur, Kanpur 208016, email: [email protected]

Examples on IS 1893(Part 1)
IITK-GSDMA-EQ21-V2.0
CONTENTS
Sl. No Title Page No.
1. Calculation of Design Seismic Force by Static Analysis Method 4 2. Calculation of Design Seismic Force by Dynamic Analysis Method 7 3. Location of Centre of Mass 10 4. Location of Centre of Stiffness 11 5. Lateral Force Distribution as per Torsion Provisions of IS 1893-2002 (Part I) 12 6. Lateral Force Distribution as per New Torsion Provisions 14 7. Design for Anchorage of an Equipment 16 8. Anchorage Design for an Equipment Supported on Vibration Isolator 18 9. Design of a Large Sign Board on a Building 20 10. Liquefaction Analysis Using SPT Data 21 11. Liquefaction Analysis Using CPT Data 23

Examples on IS 1893(Part 1)
IITK-GSDMA-EQ21-V2.0 Example 1/Page 4
Example 1 – Calculation of Design Seismic Force by Static Analysis Method
Problem Statement: Consider a four-storey reinforced concrete office building shown in Fig. 1.1. The building is located in Shillong (seismic zone V). The soil conditions are medium stiff and the entire building is supported on a raft foundation. The R. C. frames are infilled with brick-masonry. The lumped weight due to dead loads is 12 kN/m2 on floors and 10 kN/m2 on the roof. The floors are to cater for a live load of 4 kN/m2 on floors and 1.5 kN/m2 on the roof. Determine design seismic load on the structure as per new code.
[Problem adopted from Jain S.K, “A Proposed Draft for IS:1893 Provisions on Seismic Design of Buildings; Part II: Commentary and Examples”, Journal of Structural Engineering, Vol.22, No.2, July 1995, pp.73-90 ]
Figure 1.1 – Building configuration
3 @
500
0
PLAN
3200
3200
3200
4200
ELEVATION
(4) (1)
x (D)
(C)
(A)
(B)
(4)(3) (2)
4 @ 5000
(5)y

Examples on IS 1893(Part 1)
IITK-GSDMA-EQ21-V2.0 Example 1/Page 5
Solution:
Design Parameters:
For seismic zone V, the zone factor Z is 0.36 (Table 2 of IS: 1893). Being an office building, the importance factor, I, is 1.0 (Table 6 of IS: 1893). Building is required to be provided with moment resisting frames detailed as per IS: 13920-1993. Hence, the response reduction factor, R, is 5.
(Table 7 of IS: 1893 Part 1)
Seismic Weights:
The floor area is 15×20=300 sq. m. Since the live load class is 4kN/sq.m, only 50% of the live load is lumped at the floors. At roof, no live load is to be lumped. Hence, the total seismic weight on the floors and the roof is:
Floors:
W1=W2 =W3 =300×(12+0.5×4) = 4,200 kN
Roof:
W4 = 300×10 = 3,000 kN
(clause7.3.1, Table 8 of IS: 1893 Part 1)
Total Seismic weight of the structure,
W = ΣWi = 3×4,200 + 3,000 = 15,600 kN
Fundamental Period:
Lateral load resistance is provided by moment resisting frames infilled with brick masonry panels. Hence, approximate fundamental natural period:
(Clause 7.6.2. of IS: 1893 Part 1)
EL in X-Direction:
T dh /09.0=
20/)8.13(09.0= = 0.28 sec The building is located on Type II (medium soil). From Fig. 2 of IS: 1893, for T=0.28 sec, g
S a =
2.5
hA R
ZI2
=gSa
5.252
0.136.0×
××
=
09.0=
(Clause 6.4.2 of IS: 1893 Part 1)
Design base shear
BV WAh= 600,1509.0 ×= 440,1= kN
(Clause 7.5.3 of IS: 1893 Part 1)
Force Distribution with Building Height:
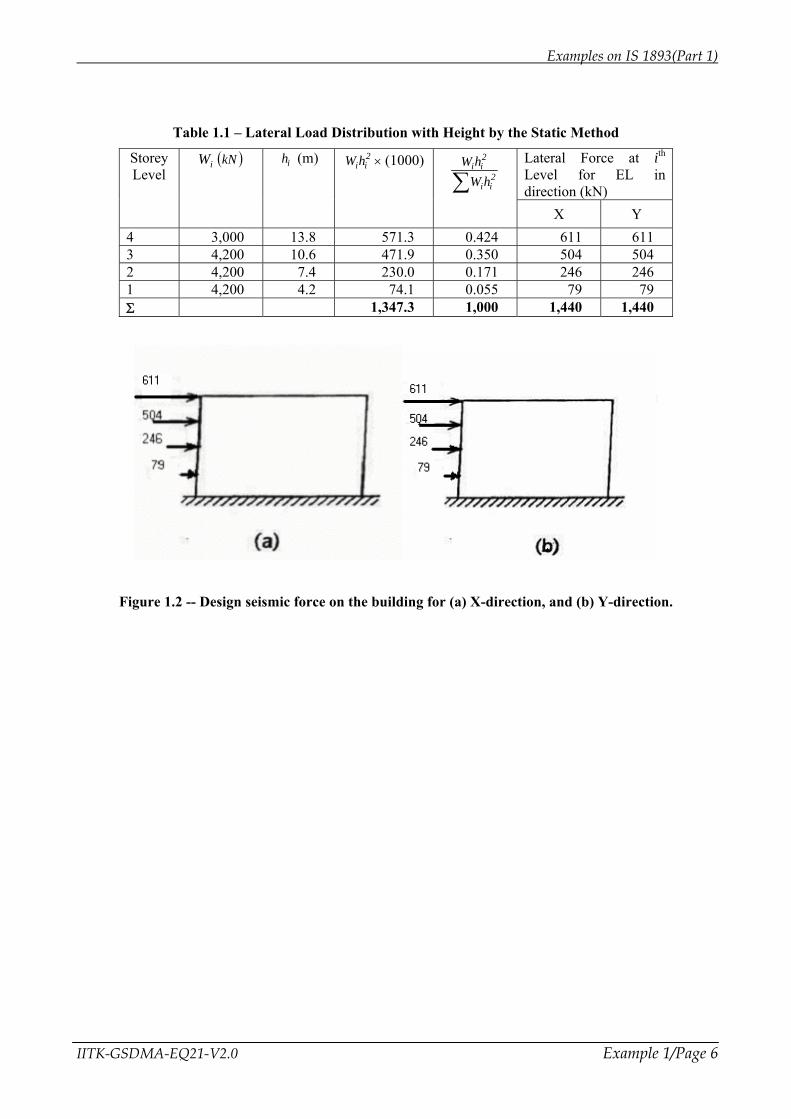
The design base shear is to be distributed with height as per clause 7.7.1. Table 1.1 gives the calculations. Fig. 1.2(a) shows the design seismic force in X-direction for the entire building.
EL in Y-Direction:
T dh09.0= 15/)8.13(09.0= 32.0= sec
gSa = 2.5;
Ah = 0.09
Therefore, for this building the design seismic force in Y-direction is same as that in the X-direction. Fig. 1.2(b) shows the design seismic force on the building in the Y-direction.
Examples on IS 1893(Part 1)
IITK-GSDMA-EQ21-V2.0 Example 1/Page 6
Table 1.1 – Lateral Load Distribution with Height by the Static Method
Lateral Force at ith Level for EL in direction (kN)
Storey Level
iW ( )kN ih (m) 2iihW × (1000)
∑ 2ii
2ii
hWhW
X Y 4 3,000 13.8 571.3 0.424 611 611 3 4,200 10.6 471.9 0.350 504 504 2 4,200 7.4 230.0 0.171 246 246 1 4,200 4.2 74.1 0.055 79 79 Σ 1,347.3 1,000 1,440 1,440
Figure 1.2 -- Design seismic force on the building for (a) X-direction, and (b) Y-direction.

Examples on IS 1893(Part 1)
IITK-GSDMA-EQ21-V2.0 Example 2/Page 7
Example 2 – Calculation of Design Seismic Force by Dynamic Analysis Method
Problem Statement: For the building of Example 1, the dynamic properties (natural periods, and mode shapes) for vibration in the X-direction have been obtained by carrying out a free vibration analysis (Table 2.1). Obtain the design seismic force in the X-direction by the dynamic analysis method outlined in cl. 7.8.4.5 and distribute it with building height.
Table 2.1 – Free Vibration Properties of the building for vibration in the X-Direction
Mode 1 Mode 2 Mode 3 0.860 0.265 0.145
Natural Period (sec)
Mode Shape Roof 1.000 1.000 1.000 3rd Floor 0.904 0.216 -0.831 2nd Floor 0.716 -0.701 -0.574 1st Floor 0.441 -0.921 1.016
[Problem adopted from, Jain S.K, “A Proposed Draft for IS: 1893 Provisions on Seismic Design of Buildings; Part II: Commentary and Examples”, Journal of Structural Engineering, Vol.22, No.2, July 1995, pp.73-90]
Solution: Table 2.2 -- Calculation of modal mass and modal participation factor (clause 7.8.4.5)
Storey Level i
Weight ( )kNWi
Mode 1
Mode 2
Mode 3
4 3,000 1.000 3,000 3,000 1.000 3,000 3,000 1.000 3,000 3,0003 4,200 0.904 3,797 3,432 0.216 907 196 -0.831 -3,490 2,9002 4,200 0.716 3,007 2,153 -0.701 -2,944 2,064 -0.574 -2,411 1,3841 4,200 0.441 1,852 817 -0.921 -3,868 3,563 1.016 4,267 4,335Σ 15,600 11,656 9,402 -2,905 8,822 1,366 11,620
[ ]∑
∑= 2iki
2iki
k wg
wM
φ
φ g
kNg
450,14402,9656,11 2
=
= 14,45,000 kg gkN
g957
822,8905,2 2
=
=95,700 kg gkN
g161
620,11366,1 2
=
= 16,100 kg % of Total weight 92.6% 6.1% 1.0%
∑∑= 2
iki
ikik w
wP
φ
φ
240.1402,9656,11
=
329.0822,8905,2
−=−
118.0620,11
366,1=
It is seen that the first mode excites 92.6% of the total mass. Hence, in this case, codal requirements on number of modes to be considered such that at least 90% of the total mass is excited, will be satisfied by considering the first mode of
vibration only. However, for illustration, solution to this example considers the first three modes of vibration.
The lateral load Qik acting at ith floor in the kth mode is
ikikhkik WPAQ φ=

Examples on IS 1893(Part 1)
IITK-GSDMA-EQ21-V2.0 Example 2/Page 8
(clause 7.8.4.5 c of IS: 1893 Part 1)
The value of Ahk for different modes is obtained from clause 6.4.2.
Mode 1:
860.01 =T sec;
16.186.00.1)/( ==gSa ;
1hA )/(2
gSR
ZIa=
)16.1(52
136.0×
××
=
= 0.0418 1iQ ii W×××= 1240.10418.0 φ
Mode 2:
265.02 =T sec; 5.2)/( =gSa ;
2hA )/(2
gSR
ZIa=
)5.2(52
136.0×
××
=
= 0.09 1iQ ii W××−×= 2)329.0(09.0 φ
Mode 3:
145.03 =T sec; 5.2)/( =gSa ;
3hA )/(2
gSR
ZIa=
)5.2(52
136.0×
××
=
= 0.09 3iQ ii W×××= 3)118.0(09.0 φ
Table 2.3 summarizes the calculation of lateral load at different floors in each mode.
Table 2.3 – Lateral load calculation by modal analysis method (earthquake in X-direction)
Mode 1
Mode 2
Mode 3
Floor Level
i
Weight iW
( )kN 1iφ 1iQ 1iV 2iφ 2iQ 2iV 3iφ 3iQ 3iV 4 3,000 1.000 155.5 155.5 1.000 -88.8 -88.8 1.000 31.9 31.93 4,200 0.904 196.8 352.3 0.216 -26.8 -115.6 -0.831 -37.1 -5.22 4,200 0.716 155.9 508.2 -0.701 87.2 -28.4 -0.574 -25.6 -30.81 4,200 0.441 96.0 604.2 -0.921 114.6 86.2 1.016 45.4 14.6
Since all of the modes are well separated (clause 3.2), the contribution of different modes is combined by the SRSS (square root of the sum of the square) method
V4 = [(155.5)2+ (88.8)2+ (31.9)2]1/2 = 182 kN V3 = [(352.3)2+ (115.6)2+ (5.2)2]1/2 = 371 kN V2 = [(508.2)2+ (28.4)2+ (30.8)2]1/2 = 510 kN V1 = [(604.2)2+ (86.2)2+ (14.6)2] 1/2 = 610 kN
(Clause 7.8.4.4a of IS: 1893 Part 1)
The externally applied design loads are then obtained as:
Q4 = V4 = 182 kN Q3 = V3 – V4 = 371 – 182 = 189 kN Q2 = V2 – V3 = 510 – 371 = 139 kN Q1 = V1 – V2 = 610 – 510 = 100 kN
(Clause 7.8.4.5f of IS: 1893 Part 1)
Clause 7.8.2 requires that the base shear obtained by dynamic analysis (VB = 610 kN) be compared with that obtained from empirical fundamental period as per Clause 7.6. If VB is less than that from empirical value, the response quantities are to be scaled up.
We may interpret “base shear calculated using a fundamental period as per 7.6” in two ways:
1. We calculate base shear as per Cl. 7.5.3. This was done in the previous example for the same building and we found the base shear as 1,404 kN. Now, dynamic analysis gives us base shear of 610 kN which is lower. Hence, all the response quantities are to be scaled up in the ratio (1,404/610 = 2.30). Thus, the seismic forces obtained above by dynamic analysis should be scaled up as follows:
Q4 = 182 × 2.30 = 419 kN Q3 = 189 × 2.30 = 435 kN Q2 = 139 × 2.30 = 320 kN

Examples on IS 1893(Part 1)
IITK-GSDMA-EQ21-V2.0 Example 2/Page 9
Q1 = 100 × 2.30 = 230 kN
2. We may also interpret this clause to mean that we redo the dynamic analysis but replace the fundamental time period value by Ta (= 0.28 sec). In that case, for mode 1:
1T = 0.28 sec; 5.2)/( =gSa ;
1hA = )/(2
gSR
ZIa
=0.09 Modal mass times Ah1
= 14,450 × 0.09 = 1,300 kN
Base shear in modes 2 and 3 is as calculated earlier: Now, base shear in first mode of vibration =1300 kN, 86.2 kN and 14.6 kN, respectively.
Total base shear by SRSS
=222 6.142.861300 ++
= 1,303 kN
Notice that most of the base shear is contributed by first mode only. In this interpretation of Cl 7.8.2, we need to scale up the values of response quantities in the ratio (1,303/610 = 2.14). For instance, the external seismic forces at floor levels will now be:
Q4 = 182 × 2.14 = 389 kN Q3 = 189 × 2.14 = 404 kN Q2 = 139 × 2.14 = 297 kN Q1 = 100 × 2.14 = 214 kN
Clearly, the second interpretation gives about 10% lower forces. We could make either interpretation. Herein we will proceed with the values from the second interpretation and compare the design values with those obtained in Example 1 as per static analysis:
Table 2.4 – Base shear at different storeys
Floor Level
i
Q (static) Q (dynamic, scaled)
Storey Shear V (static)
Storey ShearV (dynamic,
scaled)
Storey Moment, M (Static)
Storey Moment, M (Dynamic)
4 611 kN 389 kN 611 kN 389 kN 1,907 kNm 1,245 kNm
3 504 kN 404 kN 1,115kN 793 kN 5,386 kNm 3,782 kNm
2 297 kN 297 kN 1,412kN 1,090 kN 9.632 kNm 7,270 kNm
1 79 kN 214 kN 1,491 kN 1,304 kN 15,530 kNm 12,750 kNm
Notice that even though the base shear by the static and the dynamic analyses are comparable, there is considerable difference in the lateral load distribution with building height, and therein lies the advantage of dynamic analysis. For instance, the storey moments are significantly affected by change in load distribution.

Examples on IS 1893(Part 1)
IITK-GSDMA-EQ21 –V2.0 Example 3 /Page10
Example 3 – Location of Centre of Mass
Problem Statement: Locate centre of mass of a building having non-uniform distribution of mass as shown in the figure 3.1
Figure 3.1 –Plan
Solution: Let us divide the roof slab into three rectangular parts as shown in figure 2.1
Figure 3.2
Mass of part I is 1200 kg/m2, while that of the other two parts is 1000 kg/m2. .
Let origin be at point A, and the coordinates of the centre of mass be at (X, Y)
( ) ( ) ( )( ) ( ) ( )100042010004101200410
10100042015100041051200410××+××+××
×××+×××+×××=X
= 9.76 m
( ) ( ) ( )( ) ( ) ( )100042010004101200410
210004206100041061200410××+××+××
×××+×××+×××=Y
= 4.1 m
Hence, coordinates of centre of mass are (9.76, 4.1)
1200 kg/m2
1000 kg/m2
I II
III
1200 kg/m2
1000 kg/m2
20 m
4 m
10 m
A
8 m
10 m
4 m
20 m
8 m

Examples on IS 1893(Part 1)
IITK-GSDMA-EQ21 –V2.0 Example 4 /Page11
Example 4 – Location of Centre of Stiffness
Problem Statement: The plan of a simple one storey building is shown in figure 3.1. All columns and beams are same. Obtain its centre of stiffness.
Figure 4.1 –Plan
Solution:
In the X-direction there are three identical frames located at uniform spacing. Hence, the y-coordinate of centre of stiffness is located symmetrically, i.e., at 5.0 m from the left bottom corner.
In the Y-direction, there are four identical frames having equal lateral stiffness. However, the spacing is not uniform. Let the lateral stiffness of each transverse frame be k, and coordinating of center of stiffness be (X, Y).
kkkkkkkkX
+++×+×+×+×
=201050
= 8.75 m
Hence, coordinates of centre of stiffness are (8.75, 5.0).
5 m
5 m
5 m 5 m 10 m

Examples on IS 1893(Part 1)
IITK-GSDMA-EQ21 –V2.0 Example 5 /Page 12
Example 5 –Lateral Force Distribution as per Torsion Provisions of IS 1893-2002 (Part 1)
Problem Statement: Consider a simple one-storey building having two shear walls in each direction. It has some gravity columns that are not shown. All four walls are in M25 grade concrete, 200 thick and 4 m long. Storey height is 4.5 m. Floor consists of cast-in-situ reinforced concrete. Design shear force on the building is 100 kN in either direction.
Compute design lateral forces on different shear walls using the torsion provisions of 2002 edition of IS 1893 (Part 1).
Figure 5.1 – Plan
Solution: Grade of concrete: M25
25000255000 ==E N/mm2 Storey height h = 4500 m Thickness of wall t = 200 mm Length of walls L = 4000 mm All walls are same, and hence, spaces have same lateral stiffness, k.
Centre of mass (CM) will be the geometric centre of the floor slab, i.e., (8.0, 4.0).
Centre of rigidity (CR) will be at (6.0, 4.0).
EQ Force in X-direction: Because of symmetry in this direction, calculated eccentricity = 0.0 m
Design eccentricity:
4.0805.00.05.1 =×+×=de , and
4.0805.00.0 −=×−=de (Clause 7.9.2 of IS 1893:2002)
Lateral forces in the walls due to translation:
0.50=+
= FKK
KF
DC
CCT kN
0.50=+
= FKK
KF
DC
DDT kN
Lateral forces in the walls due to torsional moment:
( )d
DCBAiii
iiiR Fe
rKrK
F∑
=
=
,,,
2
where ri is the distance of the shear wall from CR.
All the walls have same stiffness, KA = KB = KC = KD = k, and
rA = -6.0 m rB = -6.0 m
X
4m 2m
8m
16m
A B
C
D
4m
4m
Y

Examples on IS 1893(Part 1)
IITK-GSDMA-EQ21-V2.0 Example 5/Page 13
rC = 4.0 m rD = -4.0 m, and 4.0±=de m
Therefore,
( ) ( )2222 +++= d
DCBA
AAR Fe
krrrrkrF
= 31.2± kN
Similarly, FBR = 31.2± kN FCR = 54.1± kN
FDR = 54.1± kN
Total lateral forces in the walls due to seismic load in X direction:
FA = 2.31 kN FB = 2.31 kN FC = Max (50 54.1± ) = 51.54 kN FD = Max (50 54.1± ) = 51.54 kN
EQ Force in Y-direction: Calculated eccentricity= 2.0 m Design eccentricity:
8.31605.00.25.1 =×+×=de m or 2.11605.00.2 =×−= m
Lateral forces in the walls due to translation:
0.50=+
= FKK
KF
BA
AAT kN
0.50=+
= FKK
KFBA
BBT kN
Lateral force in the walls due to torsional moment: when ed = 3.8 m
( ) ( )2222 +++= d
DCBA
AAR Fe
krrrrkr
F = -
21.92 kN
Similarly, FBR = 21.92 kN FCR = -14.62 kN FDR = 14.62 kN
Total lateral forces in the walls: FA = 50 - 21.92= 28.08 kN FB = 50 +20.77= 71.92 kN FC = -14.62 kN FD = 14.62 kN
Similarly, when ed = 1.2 m, then the total lateral forces in the walls will be,
FA = 50 – 6.93 = 43.07 kN FB = 50 + 6.93 = 56.93 kN FC = - 4.62 kN FD = 4.62 kN
Maximum forces in walls due to seismic load in Y direction:
FA = Max (28.08, 43.07) = 43.07 kN; FB = Max (71.92, 56.93) = 71.92 kN; FC = Max (14.62, 4.62) = 14.62 kN; FD = Max (14.62, 4.62) = 14.62 kN;
Combining the forces obtained from seismic loading in X and Y directions:
FA = 43.07 kN FB =71.92 kN FC =51.54 kN FD =51.54 kN. However, note that clause 7.9.1 also states
that “However, negative torsional shear shall be neglected”. Hence, wall A should be designed for not less than 50 kN.

Examples on IS 1893(Part 1)
IITK-GSDMA-EQ21 –V2.0 Example 6 /Page 14
Example 6 – Lateral Force Distribution as per New Torsion Provisions
Problem Statement: For the building of example 5, compute design lateral forces on different shear walls using the torsion provisions of revised draft code IS 1893 (part 1), i.e., IITK-GSDMA-EQ05-V2.0.
Figure 6.1 – Plan
Solution: Grade of concrete: M25
25000255000 ==E N/mm2 Storey height h = 4500 m Thickness of wall t = 200 mm Length of walls L = 4000 mm All walls are same, and hence, same lateral stiffness, k. Centre of mass (CM) will be the geometric centre of the floor slab, i.e., (8.0, 4.0).
Centre of rigidity (CR) will be at (6.0, 4.0).
EQ Force in X-direction: Because of symmetry in this direction, calculated eccentricity = 0.0 m
Design eccentricity, 8.081.00.0 ±=×±=de (clause 7.9.2 of Draft IS 1893: (Part1))
Lateral forces in the walls due to translation:
0.50=+
= FKK
KF
DC
CCT kN
0.50=+
= FKK
KFDC
DDT kN
Lateral forces in the walls due to torsional moment:
( )d
DCBAiii
iiiR Fe
rKrK
F∑
=
=
,,,
2
where ri is the distance of the shear wall from CR
All the walls have same stiffness, KA = KB = KC = KD = k
rA= -6.0 m rB= -6.0 m rC= 4.0 m rD= -4.0 m
( ) ( )2222 +++= d
DCBA
AAR Fe
krrrrkrF
= - 4.62 kN
Similarly, FBR = 4.62 kN FCR = 3.08 kN FDR = -3.08 kN
Total lateral forces in the walls: FA = 4.62 kN FB = - 4.62 kN FC = 50+3.08 = 53.08 kN FD = 50-3.08 = 46.92 kN
4m 2m
8m
16m
A B
C
D
4m
4m
X
Y 6m

Examples on IS 1893(Part 1)
IITK-GSDMA-EQ21-V2.0 Example 6/Page 15
Similarly, when ed= - 0.8 m, then the lateral forces in the walls will be,
FA = - 4.62 kN FB = 4.62 kN FC = 50-3.08 = 46.92 kN FD = 50+3.08 = 53.08kN
Design lateral forces in walls C and D are: FC= FD= 53.05 kN
EQ Force in Y-direction: Calculated eccentricity= 2.0 m Design eccentricity,
med 6.3161.00.2 =×+= or
med 4.0161.00.2 =×−=
Lateral forces in the walls due to translation:
0.50=+
= FKK
KFBA
AAT kN
0.50=+
= FKK
KF
BA
BBT kN
Lateral force in the walls due to torsional moment: when ed= 3.6 m
( ) ( )2222 +++= d
DCBA
AAR Fe
krrrrkr
F = -
20.77 kN
Similarly, FBR = 20.77 kN FCR = 13.85 kN FDR = -13.8 kN
Total lateral forces in the walls: FA = 50-20.77= 29.23 kN FB = 50+20.77= 70.77 kN FC = 13.85 kN FD = -13.85 kN
Similarly, when ed= 0.4 m, then the total lateral forces in the walls will be,
FA = 50-2.31= 47.69 kN FB = 50+2.31= 53.31 kN FC = 1.54 kN FD = - 1.54 kN
Maximum forces in walls A and B FA =47.69 kN, FB =70.77 kN
Design lateral forces in all the walls are as follows:
FA =47.69 kN FB =70.77 kN FC =53.05 kN FD =53.05 kN.

Examples on IS 1893(Part 1)
IITK-GSDMA-EQ21-V2.0 Example 7/Page 16
Example 7 – Design for Anchorage of an Equipment
Problem Statement: A 100 kN equipment (Figure 7.1) is to be installed on the roof of a five storey building in Simla (seismic zone IV). It is attached by four anchored bolts, one at each corner of the equipment, embedded in a concrete slab. Floor to floor height of the building is 3.0 m. except the ground storey which is 4.2 m. Determine the shear and tension demands on the anchored bolts during earthquake shaking.
Figure 7.1– Equipment installed at roof
Solution: Zone factor, Z = 0.24 (for zone IV, Table 2 of IS 1893),
Height of point of attachment of the equipment above the foundation of the building, x = (4.2 +3.0 × 4) m = 16.2 m,
Height of the building, h = 16.2 m,
Amplification factor of the equipment, =pa 1 (rigid component, Table 11),
Response modification factor Rp = 2.5 (Table 11),
Importance factor Ip = 1 (not life safety component, Table 12),
Weight of the equipment, Wp = 100 kN
The design seismic force
12
pp p p
p
aZ xF I Wh R
⎛ ⎞= +⎜ ⎟⎝ ⎠
( )( )0.24 16.2 1.01 1 1002 16.2 2.5
⎛ ⎞= +⎜ ⎟⎝ ⎠
kN
9.6= kN < 0.1 10.0pW kN=
Hence, design seismic force, for the equipment
pF =10.0 kN.
pF
1.0 m
1.5 m
Anchor bolt
CG
pW
Anchor
bolt

Examples on IS 1893(Part 1)
IITK-GSDMA-EQ21-V2.0 Example 7/Page 17
The anchorage of equipment with the building must be designed for twice of this force (Clause 7.13.3.4 of draft IS 1893)
Shear per anchor bolt, V = 2Fp/4
=2×10.0/4 kN
=5.0 kN
The overturning moment is
0.10(0.2 ×=otM kN) 5.1(× m)
= 30.0 kN-m
The overturning moment is resisted by two anchor bolts on either side. Hence, tension per anchor bolt from overturning is
)2)(0.1()0.30(
=tF kN
=15.0kN

Examples on IS 1893(Part 1)
IITK-GSDMA-EQ21-V2.0 Example 8/Page 18
Example 8 – Anchorage Design for an Equipment Supported on Vibration Isolator
Problem Statement: A 100 kN electrical generator of a emergency power supply system is to be installed on the fourth floor of a 6-storey hospital building in Guwahati (zone V). It is to be mounted on four flexible vibration isolators, one at each corner of the unit, to damp the vibrations generated during the operation. Floor to floor height of the building is 3.0 m. except the ground storey which is 4.2 m. Determine the shear and tension demands on the isolators during earthquake shaking.
Figure 8.1 – Electrical generator installed on the floor
Solution: Zone factor, Z = 0.36 (for zone V, Table 2 of IS 1893),
Height of point of attachment of the generator above the foundation of the building, x = (4.2 + 3.0 × 3) m
= 13.2 m,
Height of the building,
h = (4.2 + 3.0 × 5) m
= 19.2 m,
Amplification factor of the generator, =pa 2.5 (flexible component, Table 11),
Response modification factor Rp = 2.5 (vibration isolator, Table 11),
Importance factor Ip = 1.5 (life safety component, Table 12),
Weight of the generator, Wp = 100 kN
The design lateral force on the generator,
12
pp p p
p
aZ xF I Wh R
⎛ ⎞= +⎜ ⎟⎝ ⎠
1.2 m
0 .8 m Vibration
Isolator
pF CG
pW

Examples on IS 1893(Part 1)
IITK-GSDMA-EQ21-V2.0 Example 8/Page 19
( )( )0.36 13.2 2.51 1.5 1002 19.2 2.5
⎛ ⎞= +⎜ ⎟⎝ ⎠
kN
45.6= kN
0.1 10.0pW kN=
Since the generator is mounted on flexible vibration isolator, the design force is doubled i.e.,
2 45.6pF = × kN
91.2= kN
Shear force resisted by each isolator,
V = Fp/4
= 22.8 kN
The overturning moment, ( ) ( )91.2 kN 0.8 motM = ×
= 73.0 kN-m
The overturning moment (Mot) is resisted by two vibration isolators on either side. Therefore, tension or compression on each isolator,
( )( )( )
73.01.2 2tF = kN
= 30.4 kN

Examples on IS 1893(Part 1)
IITK-GSDMA-EQ21-V2.0 Example 9/Page 20
Example 9 – Design of a Large Sign Board on a Building
Problem Statement: A neon sign board is attached to a 5-storey building in Ahmedabad (seismic zone III). It is attached by two anchors at a height 12.0 m and 8.0 m. From the elastic analysis under design seismic load, it is found that the deflections of upper and lower attachments of the sign board are 35.0 mm and 25.0 mm, respectively. Find the design relative displacement.
Solution: Since sign board is a displacement sensitive nonstructural element, it should be designed for seismic relative displacement.
Height of level x to which upper connection point is attached, hx = 12.0 m
Height of level y to which lower connection point is attached, hy = 8.0 m
Deflection at building level x of structure A due to design seismic load determined by elastic analysis = 35.0 mm
Deflection at building level y of structure A due to design seismic load determined by elastic analysis = 25.0 mm
Response reduction factor of the building R = 5 (special RC moment resisting frame, Table 7)
xAδ = 5 x 35
= 175.0 mm
yAδ = 5 x 25
= 125.0 mm
(i) p xA yAD δ δ= −
= (175.0 – 125.0) mm
= 50.0 mm
Design the connections of neon board to accommodate a relative motion of 50 mm.
(ii) Alternatively, assuming that the analysis of building is not possible to assess deflections under seismic loads, one may use the drift limits (this presumes that the building complies with seismic code).
Maximum interstorey drift allowance as per clause 7.11.1 is IS : 1893 is 0.004 times the storey height, i.e.,
0.004aA
sxhΔ
=
sx
aAyxp h
hhRDΔ
−= )(
=5 (12000.0 – 8000.0)(0.004) mm
= 80.0 mm
The neon board will be designed to accommodate a relative motion of 80 mm.

Examples on IS 1893(Part 1)
IITK-GSDMA-EQ21-V2.0 Example 10/Page 21
Example: 10 Liquefaction Analysis using SPT data Problem Statement: The measured SPT resistance and results of sieve analysis for a site in Zone IV are indicated in Table 10.1. The water table is at 6m below ground level. Determine the extent to which liquefaction is expected for 7.5 magnitude earthquake. Estimate the liquefaction potential and resulting settlement expected at this location.
Table 10.1: Result of the Standard penetration Test and Sieve Analysis
Depth (m)
60N Soil Classification Percentage fine
0.75 9
Poorly Graded Sand and Silty Sand (SP-SM)
11
3.75 17 Poorly Graded Sand and Silty Sand (SP-SM) 16
6.75 13 Poorly Graded Sand and Silty Sand (SP-SM) 12
9.75 18 Poorly Graded Sand and Silty Sand (SP-SM) 8
12.75 17 Poorly Graded Sand and Silty Sand (SP-SM) 8
15.75 15 Poorly Graded Sand and Silty Sand (SP-SM) 7
18.75 26 Poorly Graded Sand and Silty Sand (SP-SM) 6
Solution:
Site Characterization: This site consists of loose to dense poorly graded sand to silty sand (SP-SM). The SPT values ranges from 9 to 26. The site is located in zone IV. The peak horizontal ground acceleration value for the site will be taken as 0.24g corresponding to zone factor Z = 0.24
Liquefaction Potential of Underlying Soil Step by step calculation for the depth of 12.75m is given below. Detailed calculations for all the depths are given in Table 10.2. This table provides the factor of safety against liquefaction (FSliq), maximum depth of liquefaction below the ground surface, and the vertical settlement of the soil due to liquefaction (Δv).
24.0max =g
a, 5.7=wM ,
3/5.18 mkNsat =γ , 3/8.9 mkNw =γ
Depth of water level below G.L. = 6.00m
Depth at which liquefaction potential is to be
evaluated = 12.75m
Initial stresses:
kPav 9.2355.1875.12 =×=σ
kPau 2.668.9)00.675.12(0 =×−=
( ) 2.669.2350' −=−= uvv σσ
= 169.7 kPa
Stress reduction factor:
81.075.12015.01015.01 =×−=−= zrd
Critical stress ratio induced by earthquake:
ga 24.0max = , 5.7=wM
( ) ( )'//65.0 vvdmazeq rgaCSR σσ×××=
( ) ( )7.169/9.23581.024.065.0 ×××=eqCSR = 0.18
Correction for SPT (N) value for overburden pressure:
( ) 6060 NCN N ×=
( ) 2/1'/179.9 vNC σ=

IITK-GSDMA-EQ21-V2.0
Figure F-2 (for SPT data)
Figure F-4 provides a plot for km . Algebraically, the relationship is simply
km ≥ 0.75
Figure F-6
Examples on IS 1893(Part 1)
Example 10
2 (for SPT data) Figure F-2 (for CPT data: calculation in column 2 of page 24 this figure is
wrongly cited as F
. Algebraically, the relationship is simply km =10
Figure F
Figure F-8
IS 1893(Part 1)
Example 10/Page 21 A
2 (for CPT data: in “factor of safety”
calculation in column 2 of page 24 this figure is
wrongly cited as F-6)
102.24 Mw2.56 subjected to
Figure F-5

Examples on IS 1893(Part 1)
IITK-GSDMA-EQ21-V2.0 Example 10/Page 22
( ) 75.07.169/179.9 2/1 ==NC
( ) 131775.060 =×=N
Critical stress ratio resisting liquefaction:
For ( ) 1360 =N , fines content of %8
14.05.7 =CSR (Figure F-2)
Corrected Critical Stress Ratio Resisting Liquefaction:
σα kkkCSRCSR mL 5.7=
=mk Correction factor for earthquake magnitude other than 7.5 (Figure F-4)
00.1= for 5.7=wM
=αk Correction factor for initial driving static shear
(Figure F-6)
= 1.00, since no initial static shear
=σk Correction factor for stress level larger than 96 kPa (Figure F-5) = 0.88
12.088.01114.0 =×××=LCSR
Factor of safety against liquefaction:
67.018.0/12.0/ === eqLL CSRCSRFS
Percentage volumetric strain (%ε)
For )(/ σα kkkCSRCSR meqeql =
= 0.18 / (1x1x0.88) = 0.21
( ) 13601 =N
=ε% 2.10 (from Figure F-8)
Liquefaction induced vertical settlement (ΔV):
(ΔV) = volumetric strain x thickness of liquefiable level
mmm 63063.0100/0.31.2 ==×=
Summary:
Analysis shows that the strata between depths 6m and 19.5m are liable to liquefy. The maximum settlement of the soil due to liquefaction is estimated as 315mm (Table 10.2)
Table 10.2: Liquefaction Analysis: Water Level 6.00 m below GL (Units: Tons and Meters)
Depth %Fine
vσ
(kPa)
'vσ
(kPa) 60N NC ( )60N dr
eqCSR eqlCSR 5.7CSR LCSR LFS ε% ΔV
0.75 11.00 13.9 13.9 9.00 2.00 18 0.99 0.15 0.14 0.22 0.25 1.67 - -
3.75 16.00 69.4 69.4 17.00 1.18 20 0.94 0.15 0.14 0.32 0.34 2.27 - -
6.75 12.00 124.9 117.5 13.00 0.90 12 0.90 0.15 0.15 0.13 0.13 0.86 2.30 0.069
9.75 8.00 180.4 143.6 18.00 0.82 15 0.85 0.17 0.18 0.16 0.15 0.88 1.90 0.057
12.75 8.00 235.9 169.7 17.00 0.75 13 0.81 0.18 0.20 0.14 0.12 0.67 2.10 0.063
15.75 7.00 291.4 195.8 15.00 0.70 10 0.76 0.18 0.21 0.11 0.09 0.50 2.50 0.075
18.75 6.00 346.9 221.9 26.00 0.66 17 0.72 0.18 0.22 0.18 0.15 0.83 1.70 0.051
Total Δ 0.315

Examples on IS 1893(Part 1)
IITK-GSDMA-EQ21 –V2.0 Example 11 /Page 23
Example: 11 Liquefaction Analysis using CPT data Problem Statement: Prepare a plot of factors of safety against liquefaction versus depth. The results of the cone penetration test (CPT) of 20m thick layer in Zone V are indicated in Table 11.1. Assume the water table to be at a depth of 2.35 m, the unit weight of the soil to be 18 kN/m3 and the magnitude of 7.5.
Table 11.1: Result of the Cone penetration Test Depth (m) cq sf
Depth (m) cq sf
Depth (m) cq sf
0.50 144.31 0.652 7.50 45.46 0.132 14.50 46.60 0.161
1.00 95.49 0.602 8.00 39.39 0.135 15.00 46.77 0.155
1.50 39.28 0.281 8.50 36.68 0.099 15.50 47.58 0.184
2.00 20.62 0.219 9.00 45.30 0.129 16.00 41.99 0.130
2.50 150.93 1.027 9.50 51.05 0.185 16.50 48.94 0.329
3.00 55.50 0.595 10.00 46.39 0.193 17.00 56.69 0.184
3.50 10.74 0.359 10.50 58.05 0.248 17.50 112.90 0.392
4.00 9.11 0.144 11.00 48.94 0.159 18.00 104.49 0.346
4.50 33.69 0.297 11.50 63.75 0.218 18.50 77.75 0.256
5.00 70.69 0.357 12.00 53.93 0.193 19.00 91.58 0.282
5.50 49.70 0.235 12.50 53.60 0.231 19.50 74.16 0.217
6.00 51.43 0.233 13.00 62.39 0.275 20.00 115.02 0.375
6.50 64.94 0.291 13.50 54.58 0.208
7.00 57.24 0.181 14.00 52.08 0.173
Solution:
Liquefaction Potential of Underlying Soil Step by step calculation for the depth of 4.5m is given below. Detailed calculations are given in Table 11.2. This table provides the factor of safety against liquefaction (FSliq).
The site is located in zone V. The peak horizontal ground acceleration value for the site will be taken as 0.36g corresponding to zone factor Z = 0.36
amax/g = 0.36, Mw=7.5,
3/8 mkNsat 1=γ , 3/8.9 mkNw =γ
Depth of water level below G.L. = 2.35m
Depth at which liquefaction potential is to be evaluated = 4.5m
Initial stresses:
kPav 00.81185.4 =×=σ
kPau 07.218.9)35.25.4(0 =×−=
( ) kPauvv 93.5907.21810' =−=−= σσ
Stress reduction factor:

Examples on IS 1893(Part 1)
IITK-GSDMA-EQ21-V2.0 Example 11/Page 24
997.05.4000765.01000765.01
=×−=−= zrd
Critical stress ratio induced by earthquake:
( ) ( )'//65.0 vvdmazeq rgaCSR σσ×××=
( ) ( )32.0
93.59/81997.036.065.0
=
×××=eqCSR
Corrected Critical Stress Ratio Resisting Liquefaction:
σα kkkCSRCSR meqL =
=mk Correction factor for earthquake magnitude other than 7.5 (Figure F-4)
00.1= for 5.7=wM
=αk Correction factor for initial driving static shear
(Figure F-6)
00.1= , since no initial static shear
=σk Correction factor for stress level larger than 96 kPa (Figure F-5)
00.1=
32.011132.0 =×××=LCSR
Correction factor for grain characteristics:
64.1for 88.1775.3363.21581.5403.0
and 641for 0.1234
>−+−+−=
≤=
cc
cccc
cc
IIIIIK
.IK
M
The soil behavior type index, cI , is given by
( ) ( )22 log22.1log47.3 FQI c ++−=
( ) ( )19.2
903.0log22.119.42log47.3 22
=
++−=cI
Where,
( ) 100×−= vcqfF σ
( )[ ] 903.0100813369/7.29 =×−=F and
( )[ ]( )nvaavc PPqQ σσ ′−=
( )[ ] ( )19.42
93.5935.10135.101813369 5.0
=×−=Q
( ) ( ) ( )( ) 64.1 88.1719.275.33
19.263.2119.2581.519.2403.0 234
=−+−+−=
M
cK
Normalized Cone Tip Resistance:
( ) ( ) ( )acn
vaccsNc PqPKq σ ′=1
( ) ( ) ( )77.70
35.101336993.5935.10164.1 5.01
=
=csNcq
Factor of safety against liquefaction:
For ( ) 77.701 =csNcq ,
CRR =0.11 (Figure F-6)
Lliq CSRCRRFS /=
34.032.0/11.0 ==liqFS
Summary:
Analysis shows that the strata between depths 0-1m are liable to liquefy under earthquake shaking corresponding to peak ground acceleration of 0.36g. The plot for depth verses factor of safety is shown in Figure 11.1

Examples on IS 1893(Part 1)
IITK-GSDMA-EQ21-V2.0 Example 11/Page 25
Table 11.2: Liquefaction Analysis: Water Level 2.35 m below GL (Units: kN and Meters)
Depth σv σv ' rd
qc (kPa)
fs (kPa) CSReq CSRL F Q Ic Kc (qc1N)cs CRR FSliq
0.50 9.00 9.00 1.00 14431 65.20 0.23 0.23 0.45 241.91 1.40 1.00 242.06 100.00 434.78
1.00 18.00 18.00 1.00 9549 60.20 0.23 0.23 0.63 159.87 1.63 1.00 160.17 100.00 434.78
1.50 27.00 27.00 1.00 3928 28.10 0.23 0.23 0.72 65.43 1.97 1.27 83.53 0.13 0.57
2.00 36.00 36.00 1.00 2062 21.90 0.23 0.23 1.08 33.54 2.31 1.99 68.04 0.11 0.47
2.50 45.00 43.53 1.00 15093 102.70 0.24 0.24 0.68 226.55 1.53 1.00 227.23 100.00 416.67
3.00 54.00 47.63 1.00 5550 59.50 0.26 0.26 1.08 79.10 2.01 1.31 105.02 0.19 0.73
3.50 63.00 51.73 1.00 1074 35.90 0.28 0.28 3.55 13.96 2.92 5.92 87.81 0.14 0.50
4.00 72.00 55.83 1.00 911 14.40 0.30 0.30 1.72 11.15 2.83 5.01 60.64 0.10 0.33
4.50 81.00 59.93 1.00 3369 29.70 0.32 0.32 0.90 42.19 2.19 1.64 70.77 0.11 0.34
5.00 90.00 64.03 1.00 7069 35.70 0.33 0.33 0.51 86.63 1.79 1.10 96.60 0.16 0.48
5.50 99.00 68.13 1.00 4970 23.50 0.34 0.34 0.48 58.62 1.93 1.22 72.68 0.12 0.35
6.00 108.00 72.23 1.00 5143 23.30 0.35 0.35 0.46 58.85 1.92 1.21 72.45 0.12 0.34
6.50 117.00 76.33 1.00 6494 29.10 0.36 0.36 0.46 72.50 1.83 1.13 83.61 0.13 0.36
7.00 126.00 80.43 0.99 5724 18.10 0.36 0.36 0.32 62.00 1.83 1.13 71.56 0.11 0.31
7.50 135.00 84.53 0.99 4546 13.20 0.37 0.37 0.30 47.66 1.92 1.21 59.46 0.10 0.27
8.00 144.00 88.63 0.99 3939 13.50 0.38 0.38 0.36 40.04 2.02 1.33 55.18 0.10 0.26
8.50 153.00 92.73 0.99 3668 9.90 0.38 0.38 0.28 36.26 2.02 1.33 50.45 0.09 0.24
9.00 162.00 96.83 0.99 4530 12.90 0.39 0.39 0.30 44.09 1.95 1.24 56.79 0.10 0.26
9.50 171.00 100.93 0.75 5105 18.50 0.30 0.30 0.37 48.78 1.95 1.24 62.62 0.10 0.33
10.00 180.00 105.03 0.73 4639 19.30 0.29 0.29 0.43 43.22 2.02 1.33 59.94 0.10 0.34
10.50 189.00 109.13 0.72 5805 24.80 0.29 0.29 0.44 53.40 1.95 1.23 68.16 0.11 0.38
11.00 198.00 113.23 0.71 4894 15.90 0.29 0.29 0.34 43.84 1.98 1.27 58.01 0.10 0.34
11.50 207.00 117.33 0.69 6375 21.80 0.29 0.29 0.35 56.56 1.88 1.17 68.51 0.11 0.38
12.00 216.00 121.43 0.68 5393 19.30 0.28 0.28 0.37 46.67 1.97 1.26 61.23 0.10 0.36
12.50 225.00 125.53 0.67 5360 23.10 0.28 0.28 0.45 45.53 2.01 1.31 62.48 0.10 0.36
13.00 234.00 129.63 0.65 6239 27.50 0.28 0.28 0.46 52.39 1.96 1.25 68.09 0.11 0.39
13.50 243.00 133.73 0.64 5458 20.80 0.27 0.27 0.40 44.79 2.00 1.29 60.67 0.10 0.37
14.00 252.00 137.83 0.63 5208 17.30 0.27 0.27 0.35 41.93 2.00 1.30 57.21 0.10 0.37
14.50 261.00 141.93 0.61 4660 16.10 0.26 0.26 0.37 36.68 2.06 1.39 53.90 0.09 0.35
15.00 270.00 146.03 0.60 4677 15.50 0.26 0.26 0.35 36.23 2.06 1.38 53.24 0.09 0.35
15.50 279.00 150.13 0.59 4758 18.40 0.25 0.25 0.41 36.31 2.08 1.43 55.02 0.10 0.40
16.00 288.00 154.23 0.57 4199 13.00 0.25 0.25 0.33 31.28 2.11 1.47 49.44 0.09 0.36
16.50 297.00 158.33 0.56 4894 32.90 0.25 0.25 0.72 36.29 2.19 1.65 63.63 0.10 0.40
17.00 306.00 162.43 0.55 5669 18.40 0.24 0.24 0.34 41.80 2.00 1.30 57.28 0.10 0.42
17.50 315.00 166.53 0.53 11290 39.20 0.24 0.24 0.36 84.48 1.73 1.06 91.71 0.15 0.63
18.00 324.00 170.63 0.52 10449 34.60 0.23 0.23 0.34 76.99 1.75 1.07 85.35 0.14 0.61
18.50 333.00 174.73 0.51 7775 25.60 0.23 0.23 0.34 55.92 1.88 1.17 68.46 0.11 0.48
19.00 342.00 178.83 0.49 9158 28.20 0.22 0.22 0.32 65.48 1.81 1.11 75.57 0.12 0.55
19.50 351.00 182.93 0.48 7416 21.70 0.22 0.22 0.31 51.89 1.89 1.18 64.35 0.10 0.45
20.00 360.00 187.03 0.47 11502 37.50 0.21 0.21 0.34 80.93 1.73 1.06 88.47 0.14 0.67

Examples on IS 1893(Part 1)
IITK-GSDMA-EQ21-V2.0 Example 11/Page 26
0
3
5
8
10
13
15
18
20
0.0 0.5 1.0 1.5 2.0
Factor of SafetyD
epth
(m)
Figure 11.1: Factor of Safety against Liquefaction