
EPSE 594: Meta-Analysis: Quantitative Research Synthesis · Meta-Analysis: Quantitative Research...
32
EPSE 594: Meta-Analysis: Quantitative Research Synthesis Ed Kroc University of British Columbia [email protected] March 28, 2019 Ed Kroc (UBC) EPSE 594 March 28, 2019 1 / 32
Transcript of EPSE 594: Meta-Analysis: Quantitative Research Synthesis · Meta-Analysis: Quantitative Research...

EPSE 594:Meta-Analysis: Quantitative Research Synthesis
Ed Kroc
University of British Columbia
March 28, 2019
Ed Kroc (UBC) EPSE 594 March 28, 2019 1 / 32

Last Time
Publication bias
Funnel plots, trim-and-fill procedures
Ed Kroc (UBC) EPSE 594 March 28, 2019 2 / 32

Today
Simpson’s Paradox
Psychometric considerations in meta-analysis
Ed Kroc (UBC) EPSE 594 March 28, 2019 3 / 32

Funnel plots
A useful visual tool to diagnose possible publication bias is a funnelplot:
Plot each study’s outcome effect size against its standard error.
If the scatter of points is a symmetric blob around the summary effectsize, then no evidence of significance bias.
If the scatter of points trails off to the right (positive effect size) or tothe left (negative effect size), then we have possible evidence ofsignificance bias.
Note: typical to draw a triangle (funnel) around the scatterplot ofpoints: triangle is centred at summary effect, and has vertex angledefined by the 95% CI of the summary effect.
Ed Kroc (UBC) EPSE 594 March 28, 2019 4 / 32

Funnel plots
Funnel plot for Zheng et al. (2016): no evidence of PB
Ed Kroc (UBC) EPSE 594 March 28, 2019 5 / 32

Funnel plots
Funnel plot for hypothetical meta-analysis: possible evidence of PB
Ed Kroc (UBC) EPSE 594 March 28, 2019 6 / 32

Asymmetry in funnel plots does not always imply PB
Notice that we have been careful to say that nonsymmetric plots onlyshow possible evidence of publication bias.
This is because under a random effects model, we should expect somevariation in the true effect sizes.
Moreover, true effect size is often correlated with sample size (and sostandard error).
For example, when meta-analyzing well-designed RCTs, studiestargeting smaller effect sizes will have larger sample sizes (to achievereasonable power).
Thus, we might expect studies with smaller standard errors to arisefrom studies estimating smaller true effect sizes.
More generally, a moderating variable may explain the asymmetry inthe funnel plot.
Ed Kroc (UBC) EPSE 594 March 28, 2019 7 / 32
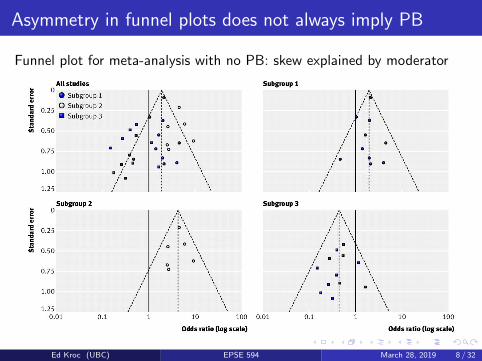
Asymmetry in funnel plots does not always imply PB
Funnel plot for meta-analysis with no PB: skew explained by moderator
Ed Kroc (UBC) EPSE 594 March 28, 2019 8 / 32

Asymmetry in funnel plots does not always imply PB
When meta-analyzing well-designed studies, power will correlate with trueeffect size. Simulated meta-analysis with correlation between true effectsand targeted effects (all with 80% power) of 0.6. No PB.
Ed Kroc (UBC) EPSE 594 March 28, 2019 9 / 32

Trim and fill procedures
If we see evidence of PB in the funnel plot, then we may want toadjust for it. How?
Most common procedure is trim and fill (assume positive meaneffect):
Remove the study furthest to the right (biggest effect size);
Compute the new summary effect;
Repeat until funnel plot is symmetric;
Then, to ensure we don’t artificially deflate uncertainty, add theremoved studies back in, and also add their mirror images on theopposite side of the new summary effect;
Now we have an unbiased estimate of the summary effect and asemi-reasonable estimate of its uncertainty, assuming the initialasymmetry actually reflects true PB.
Ed Kroc (UBC) EPSE 594 March 28, 2019 10 / 32

Trim and fill procedures
Trim . . .
Ed Kroc (UBC) EPSE 594 March 28, 2019 11 / 32

Trim and fill procedures
. . . and fill
Ed Kroc (UBC) EPSE 594 March 28, 2019 12 / 32
Trim and fill procedures
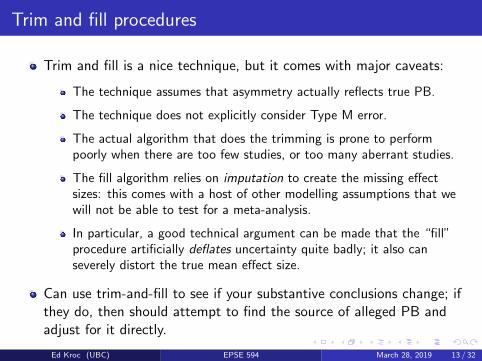
Trim and fill is a nice technique, but it comes with major caveats:
The technique assumes that asymmetry actually reflects true PB.
The technique does not explicitly consider Type M error.
The actual algorithm that does the trimming is prone to performpoorly when there are too few studies, or too many aberrant studies.
The fill algorithm relies on imputation to create the missing effectsizes: this comes with a host of other modelling assumptions that wewill not be able to test for a meta-analysis.
In particular, a good technical argument can be made that the “fill”procedure artificially deflates uncertainty quite badly; it also canseverely distort the true mean effect size.
Can use trim-and-fill to see if your substantive conclusions change; ifthey do, then should attempt to find the source of alleged PB andadjust for it directly.
Ed Kroc (UBC) EPSE 594 March 28, 2019 13 / 32

Simpson’s Paradox
Simpson’s Paradox (also called Simpson-Yule Paradox or Lord’sParadox) occurs when a trend present in an aggregate datasetdisappears or reverses when the dataset is split into groups, or moregenerally, when an omitted confounding variable is accounted for.
This has major implications for inference.
It is particularly troublesome in the context of meta-analysis, where weare combining a bunch of group (study) effects into a single(composite) effect.
Ed Kroc (UBC) EPSE 594 March 28, 2019 14 / 32

Simpson’s Paradox: Ex. 1
Ed Kroc (UBC) EPSE 594 March 28, 2019 15 / 32

Simpson’s Paradox: Ex. 2
Ed Kroc (UBC) EPSE 594 March 28, 2019 16 / 32

Simpson’s Paradox: Berkeley admissions
In 1973, alleged gender bias in grad school admissions at UC-Berkeley:
Chi-squared test yields p-value ! 0.000001.
So ostensible evidence for gender bias, but . . .
Ed Kroc (UBC) EPSE 594 March 28, 2019 17 / 32

Simpson’s Paradox: Berkeley admissions
Broken down by department, a very different picture emerges:
Ed Kroc (UBC) EPSE 594 March 28, 2019 18 / 32

Simpson’s Paradox: Berkeley admissions
(1) No consistent evidence of gender bias; in fact, one could argue that apossible gender bias exists in favour of women applicants inDepartment A.
Ed Kroc (UBC) EPSE 594 March 28, 2019 19 / 32

Simpson’s Paradox: Berkeley admissions
(2) Women tend to apply to departments with higher overall rejectionrates; may reflect underlying societal gender biases at work, but notin the admissions process.
Ed Kroc (UBC) EPSE 594 March 28, 2019 20 / 32

Simpson’s Paradox: Kidney stone treatments
Two treatments for kidney stones: A = open surgery (invasive), B =laparoscopy (mildly invasive)
Larger kidney stones is a more severe condition than small stones.
Ed Kroc (UBC) EPSE 594 March 28, 2019 21 / 32

Simpson’s Paradox: Kidney stone treatments
Ignoring severity (confounding variable), Treatment B is moreeffective.
Yet Treatment A is more effective at treating both mild and severecases.
Ed Kroc (UBC) EPSE 594 March 28, 2019 22 / 32

Simpson’s Paradox: Kidney stone treatments
Why does this happen?
Notice the cell counts: Groups 2 and 3 dominate.
Thus, the combined estimates are driven by the proportions in Groups2 and 3, and Group 2 success rate is higher.
Ed Kroc (UBC) EPSE 594 March 28, 2019 23 / 32

Simpson’s Paradox as Ecological Fallacy
Simpson’s Paradox is an example of a more general phenomenon known asthe ecological fallacy.
An ecological fallacy occurs when we use an inference at an ecological(aggregate) level to make claims about what happens at theindividual (group) level.
Classic example: Income positively correlates with tendency to voteRepublican (USA). Thus, richer states tend to vote Republican morethan poorer states. . .
FALSE!
Here, voting preference is affected by overall wealth of the state evenafter controlling for individual wealth: “self-perceived relative wealth”?
Ed Kroc (UBC) EPSE 594 March 28, 2019 24 / 32

Simpson’s Paradox as Ecological Fallacy
In a meta-analysis, this is a potentially serious concern. Why?
We are aggregating group (study) level effects to estimate acombined (ecological) effect.
Thus, a positive aggregate association of treatment with conditionmay actually mask negative associations within each individual study.
Ed Kroc (UBC) EPSE 594 March 28, 2019 25 / 32

Psychometric issues in meta-analysis
In psychometrics, we are often very concerned with issues of measurement,namely:
Reliability: how variable, or imprecise, a measurement process is.
Validity: how well (how accurately) the measurement captures thephenomenon it is trying to quantify.
Ed Kroc (UBC) EPSE 594 March 28, 2019 26 / 32

Psychometric issues in meta-analysis
Classically, one proposes the following framework:
Each subject (e.g. person) has a unique true value (score), T , ofsome particular phenomenon of interest.
This true value cannot be measured directly; instead, we observe(measure) only a proxy for it; this is the observed score, X .
This observed score may differ from the true score; thus we propose ageneric measurement error model:
X “ T ` E ,
where E denotes the measurement error.
Usually, further assumptions are then imposed on the the structure ofthe errors to more accurately model a real-life phenomenon andmeasurement process.
Ed Kroc (UBC) EPSE 594 March 28, 2019 27 / 32

Psychometric issues in meta-analysis
In the context of meta-analysis, it may be natural to ask how reliableor how valid are measurements (observed effects) are for the actualphenomenon (true effects) they are trying to quantify.
Notice: this is not the same thing as sample error. Sample erroroccurs because our sample will not capture every relevant feature ofthe overall population.
In contrast, measurement error speaks to how well our measurementprocess captures the phenomenon it is try to quantify.
E.g. one could have census-level data (no sampling error), that is stillsubject to substantial measurement error.
Ed Kroc (UBC) EPSE 594 March 28, 2019 28 / 32

Psychometric issues in meta-analysis
In the context of meta-analysis, one may want study weights to explicitlyaccount for the reliability or validity of a measurement from a particularstudy.
For many reasons, you really only see this done with estimates ofreliability.
For most (but not all) measurement error situations, extra variancedue to measurement error (i.e. imperfect reliability) will have anattenuating effect on model estimates; i.e. measurement error tendsto cause our estimates to shrink towards the null.
However, if we could adjust our estimates before meta-analyzingthem, then we could potentially remove (at least some) of thisattenuation bias.
Ed Kroc (UBC) EPSE 594 March 28, 2019 29 / 32

Psychometric issues in meta-analysis
First, we need to understand what reliability of a measurement process is,and how to quantify it.
Formally, reliability of a measurement X for a true score T is definedas
R :“VarpT q
VarpX q“ 1´
VarpE q
VarpX q.
Under the classical test theory measurement error model, if one hastwo parallel measurements X and X 1 for T , then reliability is alsoequal to:
R “ ρ2XT .
X and X 1 are parallel measurements for T if their variances are equal,and their corresponding errors are uncorrelated.
Ed Kroc (UBC) EPSE 594 March 28, 2019 30 / 32

Psychometric issues in meta-analysis
It can be shown that if ρ is a correlation (effect size) betweenvariables, with one subject to this kind of classical measurement error,and if ρadj is the corrected correlation (free of measurement error),then
a “ρ
ρadj
is equal to the square root of the reliability of the measurementprocess.
Thus, to adjust for attenuation due to this kind of measurementerror, we need a way to estimate reliability.
Many methods for this: Cronbach’s α is the most common. Crucially,all these methods always yield underestimates of the actual(theoretical) reliability.
Ed Kroc (UBC) EPSE 594 March 28, 2019 31 / 32

Psychometric issues in meta-analysis
With some (under)-estimate of reliability in place, we could nowadjust our observed effects for measurement error:
radj “r
pa
Similarly, we can adjust the corresponding variance of the observedeffects via:
Varpradjq “Varprq
pa2
Now can proceed to meta-analysis as usual, but using these adjustedestimates of effect size and standard error.
Ed Kroc (UBC) EPSE 594 March 28, 2019 32 / 32


![META [DADOS] / META [DATA]](https://static.fdocuments.net/doc/165x107/5790780b1a28ab6874c09b8f/meta-dados-meta-data.jpg)


