
Epidermal Growth Factor Induces Serine Phosphorylation of ... · the mRNA has been found at low...
10
THE JOURNAL OF BIOLOGICAL CHEMISTRY Q 1993 by The American Society for Biochemistry and Moleculal ’ Biology, Inc Vol. 268, No. 18, Issue of June 25, pp. 13396-13405,1993 Printed in U.S.A. Epidermal Growth Factor Induces Serine Phosphorylation of Stathmin in a Human Colon Carcinoma Cell Line (LIM 1215)” (Received for publication, March 2, 1993) Hong Ji, Graham S. Baldwin, Antony W. Burgess, Robert L. Moritz, Larry D. Ward, and Richard J. Simpson$ From the Joint Protein Structure Laboratory, the Ludwig Institute for Cancer Research and the Walter and Eliza Hall Institute of Medical Research, Parkuille, Victoria, 3050 Australia Changes in protein phosphorylation in the human colon carcinoma cell line LIM 1215 after stimulation with epidermal growth factor (EGF) have been ana- lyzed by two-dimensional gel electrophoresis and phos- phoamino acid analysis. In addition to a number of tyrosine-phosphorylated proteins, a family of small proteins (Mr 19,000-20,000) is maximally phos- phorylated on serine within5 min of EGF stimulation. One member of the family has been purified by a com- bination of two-dimensional electrophoresis and re- versed-phase high performance liquid chromatogra- phy and identified by amino acid sequence analysis as stathmin. Although phosphorylation of stathmin has been reported previously in leukemia cells and follow- ing stimulation of hemopoietic or lymphoid cells with several mitogenic agents, this is the first report of stathmin phosphorylation in response to EGF. Epidermal growth factor (EGF)‘ stimulates mitogenesis by binding to its cell surface receptor and stimulating tyrosine phosphorylation of intracellularsubstrates (for review see Refs. 1-4). It appears that theEGF-induced activationof the tyrosine kinase activity intrinsic to the receptor is mediated by receptor dimerization (5, 6). Subsequently, an array of cellular responses is triggered, leading to the eventual com- mitment of the cell to enter the mitotic cycle resulting in cell division (3, 4). One of the major targets of the EGF receptor tyrosine kinase is the cytoplasmic domain of the EGF receptor itself. In addition, screening of phage expression libraries with the autophosphorylated cytoplasmic domain has identified p85, the noncatalytic subunit of the phosphatidylinositol 3-kinase (7), and GRB2, a 25-kDa protein of unidentified function (8). The presence of two SH2 domains in both p85 and GRB2 is presumably responsible for their avid binding to phosphoty- *This work was supported in part by Grant 910033 from the National Health and Medical Research Council of Australia. The costs of publication of this article were defrayed in part by the payment of page charges. This article must therefore be hereby marked “aduertisement” in accordance with 18 U.S.C. Section 1734 solely to indicate this fact. 4 To whom correspondence should be addressed Joint Protein Structure Laboratory, Ludwig Institute for Cancer Research, P. 0. Royal Melbourne Hospital, Victoria, 3050 Australia. Tel.: 61-3-347- 3155; Fax: 61-3-348-1925:Email: SimpsongLicre.ludwig.edu.au. The abbreviations used are: EGF, human epidermal growth factor; MAP, mitogen-activated protein; TGF-a, transforming growth fac- tor-a; FGF, fibroblast growth factor: CAPS, 3-(cyclohexylamino)-1- propanesulfonic acid DME, Dulbecco’s modified Eagle’smedium: PAGE, polyacrylamide gel electrophoresis; RP-HPLC, reversed- phase high performance liquid chromatography; TPA, 12-0-tetrade- canoylphorbol-13-acetate; NGF, nerve growth factor. rosine residues in the receptor. The close homology between GRB2 and the Caenorhabditis elegans protein Sem-5 (9), which lies on the same signaling pathway as the ras-like protein let-60 (lo), further suggests that GRB2 may either interact directly with, or signal to, amember of the ras family (10). The recent cloning of p110, the catalytic subunit of phosphatidylinositol 3-kinase, has revealed a relationship with Vps34p, a yeast protein involved in sorting of proteins to the vacuole (11). It thus appears that a variety of specific linker molecules can be utilized to couple the activated EGF receptor to diverse intracellular signaling pathways. In addition to enhanced tyrosine phosphorylation, stimu- lation of cells with EGF also results in increased serine phosphorylation of cellular proteins (4, 12). Although the intermediate steps have not yet been defined, treatment with EGF or several other extracellular stimuli leads Lo activation of MAP (mitogen-activated protein) kinase kinase (13), which in turn activates MAP kinase via phosphorylation of threo- nine 183 and tyrosine 185 (14, 15). The substrate specificity of MAP kinases is strictly limited to serine and threonine residues N-terminal to proline residues (16-18).Homology between MAP kinase kinase and the products of the yeast STE7 and byrl genes (19) and between MAP kinase and the yeast FUS3, KSS1, and spkl genes (20) suggests that the cascade found in mammalian cells maybe related to that found in yeast. The steps intervening between the EGF recep- tor and MAP kinase kinase may therefore involve a ras-like protein equivalent to the yeast RAS gene product which intervenes between the mating factor receptor and the STE7I byrl gene products (19). To investigate the biochemical pathway(s) of EGF signal transduction further we chose the human colon carcinoma- derived cell line LIM 1215 (21) as an experimental model. Recent studies have demonstrated that LIM 1215 cells require at least two autocrine growth factors to undergo autonomous morphological change and proliferation (22,23). One of these autocrine factors has been identified as TGF-a (23), for which the mRNA has been found at low levels in several colon carcinoma cell lines (24). Furthermore, it has been reported that the autocrine production of this factor stimulates the proliferation of LIM 1215 cells by activating the EGF receptor and that the addition of antisense oligonucleotide to TGF-a mRNA blocks the autocrine growth of these cells (23). LIM 1215 cells also respond to other regulatory agents such as fibroblast growth factor(FGF), which has been shown to reproduce most if not all of the biological actions of EGF (25), via stimulation of the tyrosine kinase activity of the FGF receptor. In this report we describe the early EGF-induced protein phosphorylation events in LIM 1215 cells, as detected by two- dimensional PAGE analysis. In addition to phosphorylation 13396
Transcript of Epidermal Growth Factor Induces Serine Phosphorylation of ... · the mRNA has been found at low...
THE JOURNAL OF BIOLOGICAL CHEMISTRY Q 1993 by The American Society for Biochemistry and Moleculal ’ Biology, Inc
Vol. 268, No. 18, Issue of June 25, pp. 13396-13405,1993 Printed in U.S.A.
Epidermal Growth Factor Induces Serine Phosphorylation of Stathmin in a Human Colon Carcinoma Cell Line (LIM 1215)”
(Received for publication, March 2, 1993)
Hong Ji, Graham S. Baldwin, Antony W. Burgess, Robert L. Moritz, Larry D. Ward, and Richard J. Simpson$ From the Joint Protein Structure Laboratory, the Ludwig Institute for Cancer Research and the Walter and Eliza Hall Institute of Medical Research, Parkuille, Victoria, 3050 Australia
Changes in protein phosphorylation in the human colon carcinoma cell line LIM 1215 after stimulation with epidermal growth factor (EGF) have been ana- lyzed by two-dimensional gel electrophoresis and phos- phoamino acid analysis. In addition to a number of tyrosine-phosphorylated proteins, a family of small proteins (Mr 19,000-20,000) is maximally phos- phorylated on serine within 5 min of EGF stimulation. One member of the family has been purified by a com- bination of two-dimensional electrophoresis and re- versed-phase high performance liquid chromatogra- phy and identified by amino acid sequence analysis as stathmin. Although phosphorylation of stathmin has been reported previously in leukemia cells and follow- ing stimulation of hemopoietic or lymphoid cells with several mitogenic agents, this is the first report of stathmin phosphorylation in response to EGF.
Epidermal growth factor (EGF)‘ stimulates mitogenesis by binding to its cell surface receptor and stimulating tyrosine phosphorylation of intracellular substrates (for review see Refs. 1-4). It appears that the EGF-induced activation of the tyrosine kinase activity intrinsic to the receptor is mediated by receptor dimerization (5, 6). Subsequently, an array of cellular responses is triggered, leading to the eventual com- mitment of the cell to enter the mitotic cycle resulting in cell division (3, 4).
One of the major targets of the EGF receptor tyrosine kinase is the cytoplasmic domain of the EGF receptor itself. In addition, screening of phage expression libraries with the autophosphorylated cytoplasmic domain has identified p85, the noncatalytic subunit of the phosphatidylinositol 3-kinase (7), and GRB2, a 25-kDa protein of unidentified function (8). The presence of two SH2 domains in both p85 and GRB2 is presumably responsible for their avid binding to phosphoty-
*This work was supported in part by Grant 910033 from the National Health and Medical Research Council of Australia. The costs of publication of this article were defrayed in part by the payment of page charges. This article must therefore be hereby marked “aduertisement” in accordance with 18 U.S.C. Section 1734 solely to indicate this fact.
4 To whom correspondence should be addressed Joint Protein Structure Laboratory, Ludwig Institute for Cancer Research, P. 0. Royal Melbourne Hospital, Victoria, 3050 Australia. Tel.: 61-3-347- 3155; Fax: 61-3-348-1925: Email: SimpsongLicre.ludwig.edu.au.
The abbreviations used are: EGF, human epidermal growth factor; MAP, mitogen-activated protein; TGF-a, transforming growth fac- tor-a; FGF, fibroblast growth factor: CAPS, 3-(cyclohexylamino)-1- propanesulfonic acid DME, Dulbecco’s modified Eagle’s medium: PAGE, polyacrylamide gel electrophoresis; RP-HPLC, reversed- phase high performance liquid chromatography; TPA, 12-0-tetrade- canoylphorbol-13-acetate; NGF, nerve growth factor.
rosine residues in the receptor. The close homology between GRB2 and the Caenorhabditis elegans protein Sem-5 (9), which lies on the same signaling pathway as the ras-like protein let-60 (lo), further suggests that GRB2 may either interact directly with, or signal to, a member of the ras family (10). The recent cloning of p110, the catalytic subunit of phosphatidylinositol 3-kinase, has revealed a relationship with Vps34p, a yeast protein involved in sorting of proteins to the vacuole (11). It thus appears that a variety of specific linker molecules can be utilized to couple the activated EGF receptor to diverse intracellular signaling pathways.
In addition to enhanced tyrosine phosphorylation, stimu- lation of cells with EGF also results in increased serine phosphorylation of cellular proteins (4, 12). Although the intermediate steps have not yet been defined, treatment with EGF or several other extracellular stimuli leads Lo activation of MAP (mitogen-activated protein) kinase kinase (13), which in turn activates MAP kinase via phosphorylation of threo- nine 183 and tyrosine 185 (14, 15). The substrate specificity of MAP kinases is strictly limited to serine and threonine residues N-terminal to proline residues (16-18). Homology between MAP kinase kinase and the products of the yeast STE7 and byrl genes (19) and between MAP kinase and the yeast FUS3, KSS1, and spkl genes (20) suggests that the cascade found in mammalian cells may be related to that found in yeast. The steps intervening between the EGF recep- tor and MAP kinase kinase may therefore involve a ras-like protein equivalent to the yeast RAS gene product which intervenes between the mating factor receptor and the STE7I byrl gene products (19).
To investigate the biochemical pathway(s) of EGF signal transduction further we chose the human colon carcinoma- derived cell line LIM 1215 (21) as an experimental model. Recent studies have demonstrated that LIM 1215 cells require at least two autocrine growth factors to undergo autonomous morphological change and proliferation (22,23). One of these autocrine factors has been identified as TGF-a (23), for which the mRNA has been found at low levels in several colon carcinoma cell lines (24). Furthermore, it has been reported that the autocrine production of this factor stimulates the proliferation of LIM 1215 cells by activating the EGF receptor and that the addition of antisense oligonucleotide to TGF-a mRNA blocks the autocrine growth of these cells (23). LIM 1215 cells also respond to other regulatory agents such as fibroblast growth factor (FGF), which has been shown to reproduce most if not all of the biological actions of EGF (25), via stimulation of the tyrosine kinase activity of the FGF receptor.
In this report we describe the early EGF-induced protein phosphorylation events in LIM 1215 cells, as detected by two- dimensional PAGE analysis. In addition to phosphorylation
13396

EGF-induced Phosphorylation of Stathmin 13397
of several cellular proteins on tyrosine, we show that a number of low molecular weight proteins (M, 19,000-20,000, PI 5.4- 6.8) in LIM 1215 cells are maximally phosphorylated on serine within 5 min following EGF stimulation. Purification of one of these phosphoproteins, designated P10, was achieved by two-dimensional PAGE and RP-HPLC. Subsequent amino acid sequence analysis of P10 identified this molecule as stathmin, a recently described ubiquitous phosphoprotein whose phosphorylation is associated with diverse second mes- senger pathways in both normal and neoplastic cells (26, 27).
EXPERIMENTAL PROCEDURES
Cell Culture
The human colon carcinoma cell line LIM 1215 (21) was passaged in 150-cm2 flasks (Becton Dickinson, Mountain View, CA), in Ham's F-l2/DME medium supplemented with 10% (v/v) fetal calf serum (Commonwealth Serum Laboratories, Parkville, Australia). Adherent LIM 1215 cells were harvested with 0.1% (w/v) trypsin in 0.2 mg/ml EDTA, and the trypsin was inactivated with soybean trypsin inhibitor (1 mg/ml; Sigma). The cells were washed three times in phosphate- buffered saline, resuspended in Ham's F-12/DME medium supple- mented with 300 mg/ml bovine serum albumin, 5 mg/ml iron-satu- rated transferrin and 2 mM glutamine and plated into 35-cm2 plates at 5-10 X lo' cells/cm2.
Antisense Oligonucleotide to Transforming Growth Factor-a (TGF-a) mRNA
The strategy for design and use of the antisense probe to TGF-a mRNA was adopted from Sizeland and Burgess (23). A synthetic 23- base oligodeoxynucleotide that included the ATG initiation codon of the cDNA encoding human TGF-a (28) was used in the antisense orientation; a random oligodeoxynucleotide identical in base compo- sition to the antisense oligonucleotide was used as a control. The sequences of the oligonucleotides were 5"TCCAGCCGAGGGGAC- CATTTTAG-3' (TGF-a antisense) and 5"GATGATTACGTAACT- GGCCCGCG-3' (random). Cells were grown to confluence, harvested by trypsinization as described above, resuspended in serum-free me- dium (described above) containing antisense or random oligonucleo- tide (final concentration of 20 p ~ ) , and recultured for 18 h.
Cell Labeling and Immunoprecipitation
32P Labeling-Adherent LIM 1215 cells were washed three times with phosphate-free Eagle's minimum essential medium and incu- bated at 37 "C with 32P04 at 500 pCi/ml. After 2 h the cells were cultured for differing time intervals with human EGF (obtained from Amgen, Thousand Oaks, CA). In some experiments, cells were cul- tured with basic FGF (obtained from Amgen), fetal calf serum, and 12-0-tetradecanoylphorbol-13-acetate (TPA, Sigma). Labeling was quenched by washing three times in ice-cold phosphate-buffered saline.
Preparation of Cell Lysates-For immunoprecipitation studies, LIM 1215 cells were lysed in RIPA buffer (1% (v/v) Triton X-100, 1% (w/v) sodium deoxycholate, 10 mM Tris-HC1, pH 7.4, 1 mM EDTA, 150 mM NaC1). Phenylmethylsulfonyl fluoride (final concen- tration, 1 mM) and Trasylol (100 units/ml) were added to prevent proteolysis. After 15 min on ice, the lysates were clarified by centrif- ugation at 100,000 X g in a Beckman TL-100 centrifuge for 15 min at 4 "C. For two-dimensional gel electrophoresis experiments, LIM 1215 cells were lysed in 500 pl of 2% (v/v) Nonidet P-40, 1% (w/v) dithiothreitol, 9 M urea, 2% (w/v) isoelectric focusing carrier ampho- lytes (pH range 9-11, Pharmacia LKB Biotechnology Inc.). Insoluble material was removed by centrifugation (Eppendorf centrifuge, 5 rnin).
Immunoprecipitation-The lysates were precleared (40 min) with 100 PI of protein A-Sepharose 4B beads (Pharmacia). Supernatants were transferred to fresh tubes, mixed with 1 pg of anti-phosphoty- rosine monoclonal antibody PY-20 (39) (ICN Biochemicals, Cleve- land, OH), and mixed at 4 "C on an end-over-end stirrer for a t least 2 h. The immune complexes were precipitated with 5 pg of goat anti- mouse IgG antibody and protein A-Sepharose 4B beads (as above) and the precipitates washed three times with RIPA buffer. Samples were eluted from the beads with 50 p1 of 10 mM phenyl phosphate in RIPA buffer.
Polyacrylamide Gel Electrophoresis Two-dimensional Gel Electrophoresis-Detailed description of our
two-dimensional gel electrophoresis system has been published pre- viously (29). Briefly, isoelectric focusing was performed for 16 h at 300 V and 5 h at 800 V, in 125 X 1.5-mm tube gels (3.3% (w/v) acrylamide, 9 M urea, 2% (v/v) Nonidet P-40, 2% (w/v) carrier ampholytes, pH range 3.5-10.0) using a Bio-Rad model 156 gel apparatus. After isoelectric focusing, tube gels were equilibrated in 62.5 mM Tris-HC1, pH 6.8, 2% (w/v) SDS, 5% (v/v) P-mercaptoeth- anol, 10% (w/v) glycerol prior to performing the second-dimension SDS-PAGE. SDS-PAGE was performed using a 12.5% (w/v) poly- acrylamide gel (130 X 130 X 1.5 mm) employing the Laemmli buffer system (30) and the Bio-Rad Protean I1 apparatus. Electrophoresis was performed at 90-V constant voltage for 16 h, the temperature being maintained at 4 "C by the circulation of water from an external cooling system. Thioglycolic acid (1 mM) was included in the upper buffer reservoir during electrophoresis. Proteins were stained using 0.2% (w/v) Coomassie Brilliant Blue R-250 in 50% (v/v) methanol, 10% (v/v) acetic acid and then destained using 12% (v/v) methanol, 7% (v/v) acetic acid. 32P-Labeled phosphoproteins were detected in dried gel slabs by autoradiography or by image analysis employing a PhosphorImager apparatus (Molecular Dynamics, Palo Alto, CA) and ImageQuant software version 3.0.
Electroblotting of Proteins onto Polyvinylidene Difluoride Mem- branes-After two-dimensional electrophoresis, the gel was equili- brated in transfer buffer (10 mM CAPS, pH 11, containing 15% (v/ v) methanol and 1 mM thioglycolic acid) for 30 min prior to electro- blotting onto a polyvinylidene difluoride membrane. The transfer was carried out a t 4 "C for 2 h at 90 V using a Bio-Rad Transblot apparatus. Polyvinylidene difluoride membranes were wetted with methanol, soaked with water (5 rnin), and equilibrated (15 min) in transfer buffer prior to use. Protein was stained using 0.1% (w/v) Coomassie Blue in 50% (v/v) methanol and destained using 50% (v/ v) methanol, 10% (v/v) acetic acid and then washed extensively with water (15 h) to remove contaminating amino acids which otherwise contaminate the first cycle of the Edman degradation procedure (29), prior to air drying (20 min) and N-terminal sequence analysis.
Analysis of Phosphoamino Acids Dried polyvinylidene difluoride membranes from the two-dimen-
sional electrophoresis experiments were aligned with autoradi- ographs, and protein spots containing 32P-labeled phosphoproteins were excised with a scalpel blade and then hydrolyzed in vacuo with 100 pl of 6 M HCl for 1 h at 100 "C. The hydrolysates were dried in vacuo and then redissolved in 5 p1 of formic acid/acetic acid/water at 101001890, v/v/v, pH 1.9. Samples and phosphoamino acid stand- ards (phosphotyrosine, phosphoserine, and phosphothreonine; Sigma) were analyzed on precoated cellulose thin layer chromatog- raphy plates (Merck 5577, Darmstadt, Germany) by two-dimensional chromatography performed as described previously (31), with modi- fications according to Hildebrandt and Fried (32), using an HTLE- 7000 apparatus (C.B.S. Scientific Company Inc., Del Mar, CA). The TLC plates were stained with 0.25% (w/v) ninhydrin, dried, and subjected to PhosphorImager analysis.
Phosphopeptide Mapping
formed as described by Cleveland (33). 32P-Labeled proteins, localized One-dimensional peptide mapping of phosphoproteins was per-
on a dried two-dimensional electrophoresis gel by autoradiography, were excised, rehydrated, and placed in the sample well of a 15% SDS-polyacrylamide gel, together with 20 p l of a solution containing 125 mM Tris-HC1, pH 6.8, 0.1% SDS, 10% glycerol, 1 mM EDTA, 0.003% mercaptoethanol. After 15 min, 10 pl of a solution of Staph- ylococcus aureus V8 protease (1 mg/ml in the above buffer) was added, and electrophoresis was performed at 60 V until the bromphenol blue migrated into the resolving gel. The voltage was then increased to 100 V until electrophoresis was completed. The gel was stained and the phosphopeptides detected as described under "Two-dimensional Gel Electrophoresis."
Phosphoprotein Purification After 2-3 days culture in Ham's F-lS/DME medium containing
5% fetal calf serum, LIM 1215 cells were stimulated with EGF for 5 min in batches of 10' cells. The cells were scraped off the culture dishes, harvested by centrifugation (1,500 X g, 5 min) and lysed in 2 ml of lysis buffer (125 mM Tris-HC1, pH 6.8, 50 mM dithiothreitol,
13398 EGF-induced Phosphorylation of Stathmin 2% (v/v) Nonidet P-40, 8.5 M urea). The lysate was centrifuged (Eppendorf) for 5 min at 4 "C, and SDS was added to 2% (w/v) to the supernatant fluid.
Enrichment of 15-25-kDa Proteins-The total cell lysate was sep- arated using a 12.5% (w/v) polyacrylamide gel employing the Laemmli buffer system and the Bio-Rad Protean I1 apparatus as described above. After electrophoresis, a gel slice (about 1.5 cm long) containing proteins with molecular masses in the range 15-25 kDa was excised according to the elution position of prestained proteins of known molecular mass (Pharmacia). The gel slice was cut into small pieces and soaked for 24 h in 30 ml of 50 mM ammonium bicarbonate, 40 p~ sodium vanadate (plus protease inhibitors as described above) using an end-over-end stirrer. Gel pieces were removed by filtering the mixture through a cotton-plugged glass Pasteur pipette, the filtrate was lyophilized, redissolved in 5 ml of water, and then trans- ferred to a 30-ml glass centrifuge tube (Corex). Protein was recovered from the solution by precipitation with methanol (80% methanol at -70 "C for 1 h) and centrifugation (20,000 X g) for 20 min. The protein pellet was dried by lyophilization, dissolved in 150 pl of isoelectric focusing buffer (2% (w/v) total carrier ampholytes, pH 9- 11, 50 mM dithiothreitol, 0.3% (w/v) SDS, 9.0 M urea, 2% (v/v) Nonidet P-40), and centrifuged (Eppendorf) for 5 min prior to per- forming isoelectric focusing.
Two-dimensional Gel Electrophoresis-Enriched 15-25-kDa pro- teins from 10' cells, plus the total 32P-labeled proteins from lo6 cells (prepared as described above) in 20 pl of isoelectric focusing buffer were centrifuged (Eppendorf) for 5 min and the supernatant was taken for two-dimensional gel electrophoresis. Proteins were visual- ized by staining with Coomassie Brilliant Blue R-250, and the gels were dried. 3*P-Labeled proteins were located with autoradiographs.
Recovery of Proteins from Acrylnmide Gel Matrix-Coomassie Blue- stained protein spots from 10 identical two-dimensional gels were excised, washed extensively with water (10 times), positioned in the sample well of a 12.5% (w/v) polyacrylamide gel, and reelectrop- horesed (to remove Coomassie Blue stain and concentrate the protein) employing the Laemmli buffer system (as described above). Electro- phoresis was performed at 100 V at constant voltage at ambient temperature, and the proteins were visualized, in real time, by high resolution dynamic imaging as described previously (34) employing an AutophoresisTM model 1000 instrument (Molecular Dynamics). Photographic images of the gels were recorded using Polaroid type 55 film, and gels were aligned with photographic images. Localized protein-containing gel bands were excised using a scalpel blade. Proteins were passively eluted from the gel pieces by two 24-h extractions with 1 ml of 1% ammonium bicarbonate containing 0.02% (v/v) Tween 20.
RP-HPLC-Proteins extracted from acrylamide gel pieces by pas- sive elution were recovered from the extract by RP-HPLC on a Brownlee RP-300 cartridge (2.1 X 100 mm, Applied Biosystems, Foster City, CA) employing a Hewlett-Packard 1090A liquid chro- matograph, fitted with a model 1040A diode array detector as de- scribed previously (35). The column was developed at 100 pl/min with a linear 60-min gradient of 0-100% B, where solvent A was 0.1% aqueous trifluoroacetic acid, and solvent B was 60% (v/v) acetonitrile, 40% water containing 0.09% (v/v) trifluoroacetic acid.
Peptide Mapping-Tween 20 (final concentration 0.02%) was added to phosphoprotein-containing fractions (150-200 pl) from RP- HPLC. The volume was reduced to approximately 20 pl by centrifugal lyophilization (Savant concentrator) and then increased to -100 p1 by the addition of 0.1% (w/v) ammonium bicarbonate, 0.01% Tween 20. Phosphoproteins (-2 pg) were digested with trypsin (Promega, Rozelle, New South Wales), at an enzyme/substrate mass ratio of 5:l for 16 h at 37 "C. Fractionation of peptides was performed by RP- HPLC (34, 36) using the same column and chromatographic condi- tions described above.
Amino Acid Sequence Analysis Sequence analysis of electroblotted proteins and peptides recovered
by RP-HPLC was performed using an Applied Biosystems (model 470A) Sequencer equipped with an on-line phenylthiohydantoin de- rivative analyzer (model 120A). To facilitate total injection of the phenylthiohydantoin derivatives, an improved transfer device (37) was fitted to the system.
RESULTS
Two-dimensional PAGE Protein Phosphorylation Patterns in L IM 1215 Cells-Since it has been reported previously that
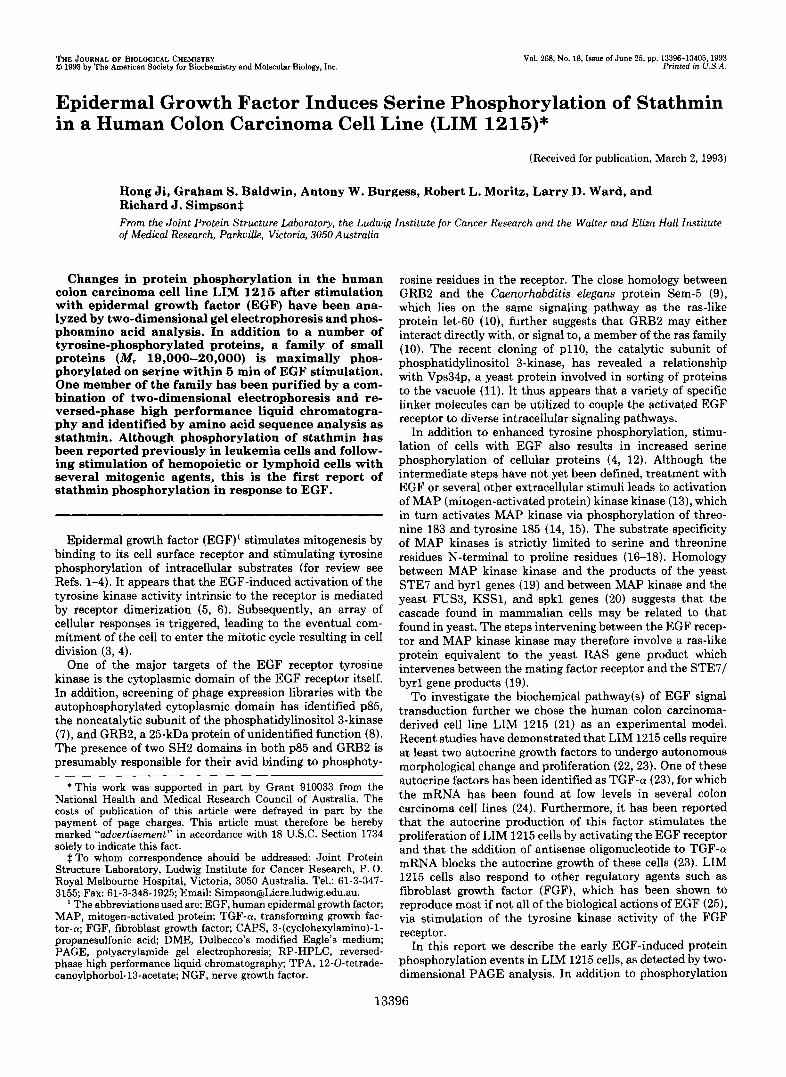
LIM 1215 cells produce TGF-a in an autocrine manner (23) and that TGF-a may mask the EGF-induced protein phos- phorylation pattern in these cells, we first examined the effect of oligomers antisense to TGF-a mRNA on EGF-stimulated protein phosphorylation in cell cultures (Fig. 1). Adherent LIM 1215 cells were harvested by trypsinization and replated in 100-mm2 culture dishes with 20 ~ L M oligomers in serum- free medium. After 18 h of exposure to oligomers under these conditions, the medium was replaced with phosphate-free Eagle's minimum essential medium supplemented with 32P04 and the incubation continued for 2 h followed by EGF treat- ment (12.5 ng/ml) for 5 min. Protein phosphorylation pat- terns were analyzed by two-dimensional PAGE (Fig. 1). Treatment of cell cultures with oligomers antisense to TGF- a: mRNA resulted in an enhancement of EGF-induced protein phosphorylation (compare Fig. 1, C and D) as compared with control cultures incubated with random oligomers (compare Fig. 1, A and B ) . A comparison of 32P-labeled two-dimensional PAGE patterns allowed us to detect a number of small phos- phoproteins ( M , 19,000-20,000) whose phosphorylation either increased (e.g. phosphoproteins P9, P10, and P13) or de- creased (e.g. phosphoproteins P5 and P6) following 5-min stimulation with EGF. The isoelectric points of this group of phosphoproteins, which ranged from 5.4 (P13) to 6.8 (P5), were determined by comparison with the standard two-di- mensional electrophoresis gel published by Celis and co-work- ers (38).
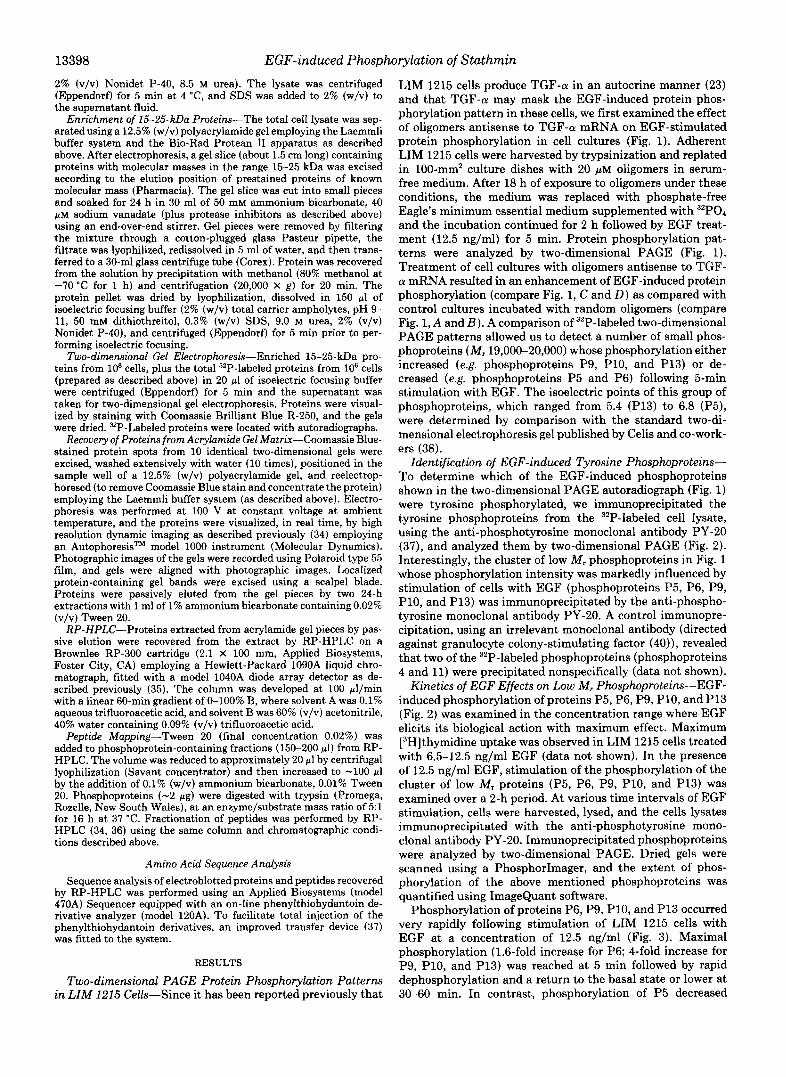
Identification of EGF-induced Tyrosine Phosphoproteins- To determine which of the EGF-induced phosphoproteins shown in the two-dimensional PAGE autoradiograph (Fig. 1) were tyrosine phosphorylated, we immunoprecipitated the tyrosine phosphoproteins from the 32P-labeled cell lysate, using the anti-phosphotyrosine monoclonal antibody PY-20 (37), and analyzed them by two-dimensional PAGE (Fig. 2). Interestingly, the cluster of low M , phosphoproteins in Fig. 1 whose phosphorylation intensity was markedly influenced by stimulation of cells with EGF (phosphoproteins P5, P6, P9, P10, and P13) was immunoprecipitated by the anti-phospho- tyrosine monoclonal antibody PY-20. A control immunopre- cipitation, using an irrelevant monoclonal antibody (directed against granulocyte colony-stimulating factor (40)), revealed that two of the 32P-labeled phosphoproteins (phosphoproteins 4 and 11) were precipitated nonspecifically (data not shown).
Kinetics of EGF Effects on Low M, Phosphoproteins-EGF- induced phosphorylation of proteins P5, P6, P9, P10, and P13 (Fig. 2) was examined in the concentration range where EGF elicits its biological action with maximum effect. Maximum [3H]thymidine uptake was observed in LIM 1215 cells treated with 6.5-12.5 ng/ml EGF (data not shown). In the presence of 12.5 ng/ml EGF, stimulation of the phosphorylation of the cluster of low M, proteins (P5, P6, P9, P10, and P13) was examined over a 2-h period. At various time intervals of EGF stimulation, cells were harvested, lysed, and the cells lysates immunoprecipitated with the anti-phosphotyrosine mono- clonal antibody PY-20. Immunoprecipitated phosphoproteins were analyzed by two-dimensional PAGE. Dried gels were scanned using a PhosphorImager, and the extent of phos- phorylation of the above mentioned phosphoproteins was quantified using ImageQuant software.
Phosphorylation of proteins P6, P9, P10, and P13 occurred very rapidly following stimulation of LIM 1215 cells with EGF at a concentration of 12.5 ng/ml (Fig. 3). Maximal phosphorylation (1.6-fold increase for P6; 4-fold increase for P9, P10, and P13) was reached at 5 min followed by rapid dephosphorylation and a return to the basal state or lower at 30-60 min. In contrast, phosphorylation of P5 decreased
EGF-induced Phosphorylation of Stathmin 13399
I EF --* Mr'kDa)
- 30 I
t
I 20 1
.14
0
D
M r kDa
30
20
14
' . e - 14
~ 'I
FIG. 1. Two-dimensional PAGE identification of EGF-induced phosphoprotein changes in LIM 1215 cells. The figure shows two-dimensional PAGE autoradiographs of total cellular 32P-labeled proteins from LIM 1215 cells. Cells were cultured for 18 h in serum-free F-lZ/DME medium supplemented with 20 p~ oligomers antisense to TGF-(U mRNA (panels C and D ) or random oligomers (panels A and B ) . LIM 1215 cells were prelabeled for 2 h with '"PO, and then treated for 5 min with EGF (12.5 ng/ml) (panels I? and D ) or phosphate- buffered saline (panels A and C). The changes in phosphorylation of phosphoproteins P5, P6, P9, P10, and P13 are presented as a bar graph in Fig. 7.
continuously and was negligible by 30 min. EGF-induced 32P incorporation into the above described phosphoproteins in total cell lysates at 5 min, examined in three separate exper- iments, was greatest for P13 (4-12-fold increase) followed by P9 (2-3-fold) and P10 (1.7-2-fold).
Phosphoamino Acid Analysis of Phosphoproteins P5, P6, P9, PIO, and PI3"The data showing that the five above men- tioned phosphoproteins (Fig. 1) were immunoprecipitated with the anti-phosphotyrosine monoclonal antibody PY-20 suggested to us that these proteins might be phosphorylated on tyrosine residues. To test this possibility cell lysates were prepared from "P-labeled LIM 1215 cells stimulated with EGF for 5 min. The total "P-labeled cellular proteins were separated by two-dimensional PAGE, electrotransferred to a polyvinylidene difluoride membrane, and identified by PhosphorImager analysis (see "Experimental Procedures"). Phosphoproteins P5, P6, P9, P10, and P13 were excised and subjected to phosphoamino analysis which, in each case, surprisingly, revealed phosphorylation on serine only (Fig. 4).
Structural Relatedness of Phosphoproteins P5, P6, P9, PIO, and PIS-Since the relative molecular masses of this cluster of phosphoproteins are similar (approximately 20 kDa), we investigated next whether they might be structurally related. To explore this possibility 32P-labeled LIM 1215 proteins were prepared as described above and separated by two-dimen- sional PAGE. Phosphoproteins P5, P6, P9, P10, and P13 were identified by PhosphorImager analysis, excised from the gel, and subjected to limited in situ proteolysis in the polyacryl- amide matrix using staphylococcal V8 protease. The gener- ated fragments were separated by SDS-PAGE and visualized by PhosphorImager analysis (Fig. 5). Although the relative intensity of the bands differed, a similar pattern of peptides
~~
was revealed for phosphoproteins P5 and P6. The peptide maps for phosphoproteins P9, P10, and P13 were comparable to each other but differed from the maps of phosphoproteins P5 and P6. These data suggested that this cluster of proteins might represent isoforms of two proteins differing in the extents of their phosphorylation.
Two-dimensional PAGE Phosphorylation Patterns of Phos- phoproteins P5, P6, P9, PIO, and PI3 Induced by Other Growth Stimuli-The same approach as with EGF (Fig. 1) was used to examine the effects on total cellular phosphopro- teins of fetal calf serum, basic FGF, and TPA, all of which exert profound biological and morphological actions on LIM 1215 cells (25). As revealed in Fig. 6, the phosphorylation patterns of the above mentioned cluster of phosphoproteins were affected, but to differing extents, by stimulation with fetal calf serum, FGF (4 ng/ml), or TPA (10 ng/ml) for 5 min. Although EGF and TPA induced the dephosphorylation of phosphoproteins P5 and P6, this effect was not observed with fetal calf serum or FGF. In contrast to the phosphorylation of phosphoprotein P I0 observed after treatment with EGF and FGF, little change in the phosphorylation of phosphopro- tein P10 was observed when LIM 1215 cells were stimulated with fetal calf serum or TPA. Interestingly, the marked in- crease (4-12-fold) in "P-labeling of phosphoprotein P13 upon EGF stimulation was lower for cells treated with fetal calf serum and even less pronounced for cells treated with TPA or FGF.
Two-dimensional PAGE Protein Phosphorylation Pattern in A431 Cells-Phosphorylation of the cluster of low M, proteins, described above, was stimulated at a concentration (12.5 ng/ml) at which EGF elicits a maximal mitogenic re- sponse in LIM 1215 cells (25) but inhibits the growth of A431
13400 EGF-induced Phosphorylation of Stathmin
I
A
'I 0 7
X - m c cn . _ cI> L
t
_c 0
Q cn 0 L a
-67 t
I
-43
I -30
-20
I
-14
E
-94 6
-67
-43
-30 .. 7
-13
I .
3 ' r l
10 9 -
-
- n C
-20
Phosphoproteins FIG. 2. Two-dimensional PAGE identification of tyrosine phosphoproteins in LIM 1215 cells. The figure shows two-dimensional
PAGE autoradiographs of 32P-labeled proteins immunoprecipitated with the anti-tyrosine monoclonal antibody PY-20. Cells were cultured in serum-free medium and '*P-labeled as described in the legend to Fig. 1. After treatment with EGF cells were washed with phosphate- buffered saline and lysed in RIPA buffer. Tyrosine-phosphorylated proteins were immunoprecipitated with PY-20 monoclonal antibody and analyzed by two-dimensional PAGE. Panel A, control (cells treated with phosphate-buffered saline for 5 min); panel B, cells treated with EGF (12.5 ng/ml) for 5 min; panel C, comparison of PhosphorImager signals from panels A and B.
cells (41, 42). For this reason, we examined next the effects of EGF (12.5 ng/ml) on the phosphorylation pattern of pro- teins P5, P6, P9, P10, and P13 in cell lysates from A431 cells. In contrast to LIM 1215 cells, protein P6 was significantly phosphorylated, and there was no marked change in R2P incorporation in protein P5 or P13 a t 5 min (Fig. 7). Although the phosphorylation of phosphoprotein P10 was increased in LIM 1215 cells upon EGF stimulation (-1.5-fold), the extent of this 32P incorporation was not as high as that observed for A431 cells treated with EGF (2-3-fold).
Isolation of Phosphoprotein PlO-To establish the identity of the above mentioned low M , cluster of phosphoproteins we sought amino acid sequence information. The most abundant of these low M , phosphoproteins, P10, was purified by enrich- ing the 15-25-kDa proteins in the cell lysate and scaling up
the two-dimensional PAGE procedure as follows. Three 150- mm2 dishes of cells (about 10* cells) were prepared for phos- phoprotein isolation. Enrichment of the low M, proteins was achieved by separating the total cell lysate on a 12.5% SDS- polyacrylamide gel, excising the unstained gel band containing the 15-25 kDa proteins (using prestained M , marker pro- teins), and passively eluting the proteins. Proteins were re- covered from the eluate by precipitation with 80% methanol (-70 "C), further resolved by two-dimensional PAGE, and visualized by Coomassie Blue R-250 staining (Fig. 8).
A comparison of the two-dimensional PAGE maps of the enriched 15-20-kDa cellular proteins (Fig. 8 B ) with the total cell lysate proteins (Fig. SA) revealed that proteins P6 and P10, which were barely visible in the total lysate two-dimen- sional PAGE map (Fig. 8A) , were enriched 10-15-fold in Fig.
EGF-induced Phosphorylation of Stathmin 13401
0 30 GO 90 170 0 30 GO 90 120
Tlmc (mln) Time (min)
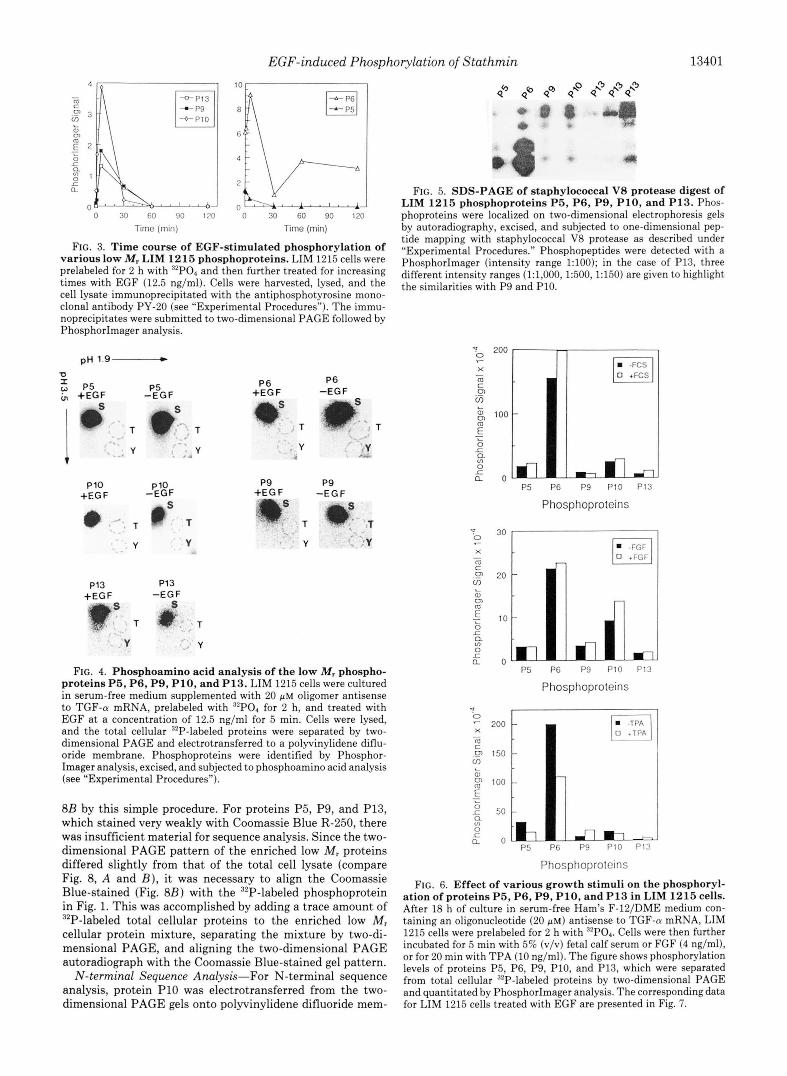
FIG. 3. Time course of EGF-stimulated phosphorylation of various low M, LIM 1215 phosphoproteins. LIM 1215 cells were prelabeled for 2 h with 32P04 and then further treated for increasing times with EGF (12.5 ng/ml). Cells were harvested, lysed, and the cell lysate immunoprecipitated with the antiphosphotyrosine mono- clonal antibody PY-20 (see “Experimental Procedures”). The immu- noprecipitates were submitted to two-dimensional PAGE followed by PhosphorImager analysis.
pH 1.9- 0 I 0 p5 P5 P6 P6
+EGF -EGF +EGF “EG F as a s T T
Y I
P9 +EG F
P9 -EGF
Y Y Y
PI3 P13 +EGF “EG F
:Y
Y .,’ Y
FIG. 4. Phosphoamino acid analysis of the low M, phospho- proteins P5, P6, P9, P10, and P13. LIM 1215 cells were cultured in serum-free medium supplemented with 20 p~ oligomer antisense to TGF-CY mRNA, prelabeled with 32P04 for 2 h, and treated with EGF at a concentration of 12.5 ng/ml for 5 min. Cells were lysed, and the total cellular 32P-labeled proteins were separated by two- dimensional PAGE and electrotransferred to a polyvinylidene diflu- oride membrane. Phosphoproteins were identified by Phosphor- Imager analysis, excised, and subjected to phosphoamino acid analysis (see “Experimental Procedures”).
8B by this simple procedure. For proteins P5, P9, and P13, which stained very weakly with Coomassie Blue R-250, there was insufficient material for sequence analysis. Since the two- dimensional PAGE pattern of the enriched low M, proteins differed slightly from that of the total cell lysate (compare Fig. 8, A and B ) , it was necessary to align the Coomassie Blue-stained (Fig. 8B) with the 32P-labeled phosphoprotein in Fig. 1. This was accomplished by adding a trace amount of 32P-labeled total cellular proteins to the enriched low M, cellular protein mixture, separating the mixture by two-di- mensional PAGE, and aligning the two-dimensional PAGE autoradiograph with the Coomassie Blue-stained gel pattern.
N-terminal Sequence Analysis-For N-terminal sequence analysis, protein P10 was electrotransferred from the two- dimensional PAGE gels onto polyvinylidene difluoride mem-
FIG. 5. SDS-PAGE of staphylococcal V8 protease digest of LIM 1215 phosphoproteins P5, P6, P9, P10, and P13. Phos- phoproteins were localized on two-dimensional electrophoresis gels by autoradiography, excised, and subjected to one-dimensional pep- tide mapping with staphylococcal V8 protease as described under “Experimental Procedures.” Phosphopeptides were detected with a PhosphorImager (intensity range 1:lOO); in the case of P13, three different intensity ranges (1:1,000, 1:500,1:150) are given to highlight the similarities with P9 and P10.
To 200 7
X
m C
-
iT, m L g 100
- E“ L
.K 0 Q
L
ul 0
n o m
-FCS
1’5 I’G P9 1’19 P13
Phosphoproteins
wo 30 I
? 0
X 7
- m C a, ul
200
150
100
50
0
Phosphoproteins
Phosphoproteins
FIG. 6. Effect of various growth stimuli on the phosphoryl- ation of proteins P5, P6, P9, P10, and P13 in LIM 1215 cells. After 18 h of culture in serum-free Ham’s F-lZ/DME medium con- taining an oligonucleotide (20 p ~ ) antisense to TGF-n mRNA, LIM 1215 cells were prelabeled for 2 h with ”PO4. Cells were then further incubated for 5 min with 5% (v/v) fetal calf serum or FGF (4 ng/ml), or for 20 min with TPA (10 ng/ml). The figure showsphosphorylation levels of proteins P5, P6, P9, P10, and P13, which were separated from total cellular 32P-labeled proteins by two-dimensional PAGE and quantitated by PhosphorImager analysis. The corresponding data for LIM 1215 cells treated with EGF are presented in Fig. 7.

13402 EGF-induced Phosphorylation of Sta thmin
400 A431 I
Phosphoprotcins Phosphoprotcins
FIG. 7. Comparison of the effect of EGF on the phosphoryl- ation of proteins P5, P6, P9, P10, and P13 in LIM 1215 and A431 cells. LIM 1215 or A431 cells were cultured in serum-free medium containing 20 PM TGF-a antisense oligonucleotide for 18 h, labeled with “P for 2 h, and treated with PBS or EGF (12.5 ng/ml) for 5 min. The stimulation was stopped by washing cells in ice-cold PBS. The cells were lysed in isoelectric focusing sample buffer, and total cellular “P-labeled proteins were resolved by two-dimensional PAGE. The figure shows phosphorylation levels of proteins P5, P6, P9, P10, and P13, determined by PhosphorImager analysis.
U
V C
34
57 1
43
30
20
,14
(0 D (0
I E F MI (kt%’
-94
-67
“4 3
-30
= .. r
FIG. 8. Two-dimensional PAGE patterns of total cell lysate and enriched 15-25-kDa cellular proteins from LIM 1215 cells. The figure shows two-dimensional PAGE patterns of total cell lysate proteins (panel A ) and enriched 15-25 kDa cellular proteins (panel B ) after staining with Coomassie Brilliant Blue R-250.
branes, visualized by staining with Coomassie Blue R-250, excised, and subjected to automated Edman degradation. In each case, no sequence data were obtained (combining eight spots from identical gels), indicating that this protein was, most likely, N-terminally blocked.
Internal sequencing was performed on a separate batch of material obtained from lo9 cells. Coomassie Blue-stained protein P I 0 excised from 10 identical two-dimensional gels was concentrated by SDS-PAGE, visualized by high resolu-
tion dynamic imaging (32), passively eluted from the acryl- amide matrix, and recovered from the eluate by microbore column RP-HPLC (Fig. 9A).
The amount of protein P10 recovered from RP-HPLC, free from SDS and acrylamide gel contaminants, was approxi- mately 1-2 pg. Internal sequence was obtained by digestion of protein P I0 with trypsin. The generated peptides were separated by RP-HPLC (Fig. 9B), and selected peptides were subjected to N-terminal sequence analysis yielding the se- quences shown in Table I. When these sequences were com- pared with proteins of known sequence in all of the available protein and DNA data bases it was revealed that they were in perfect agreement with the corresponding peptides from stathmin (44,45).
DISCUSSION
We have shown that EGF stimulates the rapid phosphoryl- ation of a number of low M , proteins in the human LIM 1215 colon carcinoma cell line (Fig. 1) and that this phenomenon is enhanced when the cells are precultured in the presence of an oligonucleotide antisense to TGF-CY mRNA. This latter finding is in accordance with a previous report that demon- strates that the TGF-a produced by LIM 1215 cells stimulates autocrine proliferation by activating the EGF receptor (23).
Although five of these low M , phosphoproteins (P5, P6, P9, P10, and P13; M , -19,000-20,000; PI -6.8-5.4) were clearly immunoprecipitated by the anti-phosphotyrosine monoclonal antibody PY-20 (Fig. 2), in all cases phosphoamino acid analysis revealed phosphorylation on serine residues only (Fig. 4). One explanation for this anomalous behavior is that proteins P5, P6, P9, P10, and P13 may complex with a hitherto unidentified phosphotyrosine protein (5) thereby fa- cilitating their immunoprecipitation with the PY-20 antibody. It has been proposed that receptor tyrosine kinase target molecules are components of a preexisting complex of mole- cules (including guanine nucleoside triphosphatase-activating protein, phospholipase C-71, Raf, and phosphatidylinositol 3- kinase), a “signal transfer particle,” involved in the action of various signaling pathways (3,46). This notion is not entirely unfounded since signal transduction has been shown to in- volve a cascade of protein kinases which contributes to the induction of phosphorylation a t serinelthreonine residues by tyrosine kinases (4, 47). In addition, coimmunoprecipitation of the stimulated EGF receptor with Raf-1 serine- and thre- onine-specific protein kinase has been recently reported (48).
Complex formation with a phosphotyrosine-containingpro- tein may also explain an apparent discrepancy in the effect of EGF on phosphorylation of P6. Analysis of total cellular phosphoproteins (Fig. 1) revealed that EGF caused a decrease in the phosphorylation of P6. In contrast, EGF increased the serine phosphorylation of P6 in antiphosphotyrosine immu- noprecipitates (Fig. 2). One possible explanation for this phenomenon is that the phosphorylated form of P6 may be more resistant to phosphatases when bound to an as yet unidentified phosphotyrosine-containing protein than when unbound. By increasing the phosphotyrosine content of the binding protein EGF treatment could therefore cause an apparent increase in the amount of phosphorylated P6.
We have purified, by two-dimensional PAGE, the most abundant protein of the low M , cluster of phosphoproteins, P10. Analysis of the total cell lysate indicated that P10 was barely visible by Coomassie Blue R-250 staining (Fig. 8). To overcome this problem, we developed a procedure for enrich- ing proteins of a defined range of molecular mass for two- dimensional PAGE analysis. Initially, the total cell lysate was separated by SDS-PAGE, and the unstained proteins in the

EGF-induced Phosphorylation of Stathmin 13403
0.16
0.14
0 12
0.10
0.08
0.06
0.04
0.02
/
0 10 ?U 30 d(l 50 hU 7 0
Retention time (min)
0 10 20 30 40 50 60 70 Retention time (min)
FIG. 9. Panel A , recovery of phosphoprotein P10 from acrylamide gel eluates by RP-HPLC. Coomassie Blue-stained protein spots ex- cised from ten identical two-dimensional PAGE gels were concen- trated by SDS-PAGE, visualized by high resolution dynamic imaging, and passively eluted in 1 ml of 1% ammonium bicarbonate (see “Experimental Procedures”). Gel eluates were chromatographed on a Brownlee RP-300 column (100 X 2.1 mm, inner diameter). The column was developed with a linear 60-min gradient from 0 to 100% B, where solvent A was 0.1% trifluoroacetic acid and solvent B was 60% acetonitrile, 40% water containing 0.09% trifluoroacetic acid. Flow rate, 0.1 ml/min. The identity of protein P10, shown as a hatched peak, was confirmed by SDS-PAGE (12.5% acrylamide gel) and silver staining. Panel B, separation of tryptic peptides from phosphoprotein P10 by RP-HPLC. Protein P10 (-1-2 pg) frompanel A was digested with trypsin (see “Experimental Procedures”), and the generated peptides were separated on a Brownlee RP-300 car- tridge (30 X 2.1 mm, inner diameter) using the chromatographic conditions described in panel A.
TABLE I Sequences obtained from tryptic peptides derived from
phosphoprotein PI0 The sequences were obtained from tryptic peptides T2, T3, and T4
(see Fig. 9). Peptide T1 was obtained by rechromatography of the breakthrough in Fig. 9B on an ODS-Hypersil column (100 X 2.1-mm internal diameter) using the ion-pairing reagent 1-octane sulfonic acid as described elsewhere (43) (data not shown). The yields of phenylthiohydantoin derivative observed in the first cycle of the Edman degradation for each sequence are shown in parentheses. The amino acid residue numbers were derived from the reported cDNA- deduced amino acid sequences (40,411.
Peptide Sequence Residue
T1 LTHK (50 pmol) 101-104 T2 SHEAEVLK (35 pmol) 63-70 T3 AIEENNFSK (41 pmol) 86-95 T4 SKESVPEFPLXPPK (50 pmol) 28-41
molecular weight range -15,000-25,000 were passively eluted from the acrylamide matrix. Next, the eluted proteins were concentrated by precipitation with methanol and separated by two-dimensional PAGE. By this means the amount of 15- 25-kDa protein that we were able to load onto the high resolving two-dimensional acrylamide gel was increased ap- proximately 15-fold (Fig. 8B).
We have established the identity of phosphoprotein P10 by internal protein sequence analysis of four peptides derived from P10 by tryptic digestion (Table I). The obtained amino acid sequences matched perfectly the sequences of four tryptic peptides from stathmin (44,45). Stathmin (also known as p19 (49), 19-K (50), p18 (51), Op18 (52), pp20-23 (53), pp17 or prosolin (54)) has been identified as a small (19-23-kDa) heat-stable phosphoprotein whose expression and phos- phorylation vary during development. Phosphorylation of stathmin is also responsive to a variety of extracellular signals that activate distinct second messenger pathways controlling cell proliferation, differentiation, and cell-specific function (for a detailed review, see Sobel (27)). It is a ubiquitous protein, present in the cytoplasm of cells as variably phos- phorylated and immunologically related molecular isoforms (PI values in the range 5.4-6.2 (26)), and is particularly abundant in brain (27). Our finding that the N terminus of phosphoprotein P10 was blocked is not surprising since the amino acid following the initiator methionine in the cDNA- deduced amino acid sequence of stathmin (44,45) is alanine. In this situation, it is most likely that the methionine is cleaved, and the resulting N terminus (alanine) is acetylated (55) . Indeed the N-terminal residue of bovine brain stathmin has been identified as N-acetylalanine by combined liquid chromatography and mass spectrometry (56).
Two nonphosphorylated -19-kDa isoforms of stathmin (N1 and N2), upon in uiuo or in oitro phosphorylation, yield several phosphorylated forms, namely P1, P2a, P2b, and P3 which can be readily resolved by two-dimensional PAGE (57). In addition, two other isoforms of higher molecular mass, 21 and 23 kDa (designated as two-dimensional PAGE phosphoryl- ated spots 16 and 17, respectively) have been shown to have similar peptide maps and immunological cross-reactivity with the other stathmin isoforms (27, 53, 58, 59). Two isoforms, CY
and & have now been clearly identified (55) and shown to differ only by post-translational modification (44). The phos- phorylation patterns of the stathmin isoforms have been characterized, by two-dimensional PAGE analysis, for a num- ber of biological systems such as nerve growth factor (NGF) regulation of the rat pheochromocytoma cell line PC12 (59), forskolin-stimulated adult mouse brain (60), andphorbol ester or calcium ionophore-treated human leukemic T cells (58). A

13404 EGF-induced Phosphorylation of Stathmin
comparison of our two-dimensional PAGE EGF-induced phosphorylation pattern (Fig. 1B) with other two-dimensional PAGE patterns of stathmin forms (58-60) indicates that phosphoproteins P9 and P10 from LIM 1215 cells correspond to stathmin forms PI and P2, whereas P13 most likely cor- responds to protein spot 16 (59). Phosphoproteins P5 and P6 (Mr -19,000, PI 5.4-6.8) are not referred to in these earlier studies (58-60).
The changes in stathmin phosphorylation seen in this study with EGF-induced LIM 1215 cells (enhanced phosphorylation of P9, P10, and P13) are similar to those reported for NGF- stimulated PC12 cells (59) and Ca2+ ionophore-treated normal peripheral blood cells (58). The marked increase in phos- phorylation (4-12-fold) of protein spot P13 upon EGF stim- ulation (5 min) is barely detectable following FGF or TPA treatment of LIM 1215 cells (Fig. 6). A similar finding was reported for protein spot 16 in PC12 cells treated with the same stimuli (59). It has been well documented that EGF and NGF trigger the same set of early signaling events (for a review, see Ref. 61). The results from this present study, when considered along with the phosphorylation pattern for NGF- stimulated PC12 cells reported elsewhere (59), suggest that stathmin phosphorylation can be included as a common con- sequence of EGF and NGF stimulation. Since the biological effects promoted by EGF are primarily proliferative (62), whereas NGF is a differentiation factor in vivo (63), it would appear that the routes for NGF and EGF signaling bifurcate at some step beyond stathmin phosphorylation (or that stath- min phosphorylation is not responsible for either proliferation or differentiation).
The concentration of EGF used in this study for maximum stimulation of LIM 1215 cells (12.5 ng/ml) has an inhibitory effect upon the growth of the human epidermoid carcinoma cell line A431. Whereas EGF at very low concentrations (15- 500 pg/ml) stimulates the growth of A431 cells (64), at higher concentrations (1-100 ng/ml) it has an inhibitory effect upon cell growth (31, 42). A comparison of the phosphorylation patterns of proteins from A431 and LIM 1215 cells stimulated for 5 min with EGF at a concentration of 12.5 ng/ml is shown in Fig. 7. Although the phosphorylation of P13 was increased more than 12-fold in LIM 1215 cells, the increase was less pronounced (-%fold) in A431 cells. Interestingly, under these conditions phosphoproteins P5 and P6 were dephosphoryl- ated (0.5-fold) in LIM 1215 cells, but in A431 cells phos- phorylation of P5 was unchanged and phosphorylation of P6 was increased (2-fold). The dephosphorylation pattern of P5 and P6 in LIM 1215 cells seen for EGF stimulation was similar to that seen for TPA treatment. Although mapping of phosphoprotein P5 and P6 indicates that they are most likely structurally related to each other (Fig. 5), their identification is currently not known.
Stathmin contains several sites for distinct protein kinases which accounts, most likely, for the observed diversity of phosphorylated stathmin isoforms (27). There are three con- sensus sequences around Ser-16, Ser-46, and Ser-63 corre- sponding to potential phosphorylation sites for CAMP-de- pendent protein kinases (65) and two consensus sequences around Ser-25 and Ser-38 corresponding to potential sites for proline-directed protein kinases (18, 66). Both Ser-25 and Ser-38 have been reported to be phosphorylated in prepara- tions of stathmin from bovine brain (56). In particular the sequence surrounding Ser-38 (Pro-Leu-Ser-Pro) has been re- cently identified as a minimal recognition sequence for the proline-directed serine/threonine kinase identified in rat PC12 cells (18) and MAP kinases in general (16, 17). Inter- estingly, this proline-directed protein kinase is increased tran-
siently in PC12 cells following treatment with NGF (18). In the present study, the negligible levels of phenylthiohydan- toin-serine seen in cycle 11 (this corresponds to Ser-38 in the stathmin sequence) during the sequence analysis of tryptic peptide T4 derived from phosphoprotein P10 (Table I) sug- gests that Ser-38 in protein P10 may also be phosphorylated upon EGF stimulation of LIM 1215 cells. More studies need to be performed to define the phosphorylation sites and their phosphorylation/dephosphorylation patterns in response to various extracellular biological stimuli, but with the limited data currently available, it appears that stathmin is phos- phorylated by a member of the MAP kinase family.
In conclusion, we have shown that the phosphorylation pattern of P10, a stathmin-like protein, in LIM 1215 cells changes rapidly following EGF stimulation. This is the first report of stathmin phosphorylation in response to EGF treat- ment. The further characterization of phosphoproteins P5, P6, P9, and P13 and their phosphorylation sites may give further clues to the intracellular signaling mechanism by which EGF exerts its biological effects in LIM 1215 cells.
REFERENCES
1. Yarden, Y., and Ullrich, A. (1988) Annu. Reu. Biochem. 67,443-478 2. Hunter, T., and Cooper, J. A. (1985) Annu. Reu. Biochern. 64,897-930 3. Ullrich, A,, and Schlessinger, J. (1990) Cell 6 1 , 203-211 4. Carpenter, G., and Cohen, S. (1990) J . Biol. Chem. 266,7709-7712 5. Schlessinger, J. (1986) J. Cell Biol. 103 , 2067-2072 6. Schlessinger, J. (1988) Trends Biochem. Sci. 13,443-447 7. Otsu, M., Hiles, I., Gout, I., Fry, M. J., Ruiz-Larrea, F., Panayotou, G.,
Thompson, A., Dhand, R., Hsuan, J. Totty, N., Smith, A. D., Morgan, S. J., Courtneidge, S. A., Parker, P. J., and Waterfield, M. D. (1991) Cell
8. Lowenstein, E. J., Daly, R. J., Batzer, A. G., Li, W., Margolis, B., Lammers, 66,91-104
R.. Ullrich. A.. Skolnik. E. Y.. Bar-Sa& D.. and Schleasinaer. J . (1992) Cell 70,431-442
- . . - . .
9. Clark, S. G., Stern, M. J., and Horvitz, H. R. (1992) Nature 366 , 340-344 10. Han, M., and Sternberg, P. W. (1990) Cell 63,921-931 11. Hiles, I. D., Otsu, M., Volinia, S., Fry, M. J., Gout, I., Dhand, R., Pana otou
neldge, S. A., Parker, P. J., and Waterfield, M. D. (1992) Cell 70, 419- G.! Ruiz-Larrea, F., Thompson, A., Totty, N. F., Hsuan, J. J., court:
12. Giugni, T. D., Chen. K., and Cohen, S. (1988) J . Biol. Chem. 263,18988- 429
13.
14.
15.
16.
17. 18.
19.
20.
21.
22. 23. 24. 25.
26.
27. 28.
29.
30. 31.
32. 33. 34. 35.
36.
37.
38.
L'Allemain, G:, Her, J.-H., Wu, J., Sturgill, T. W., and Weber, M. J. (1992) 18995
Pa ne, D. M., Rossomando, A. J., Martino, P., Erickson, A. K., Her, J.-H., Mol. Cell. B~ol. 1 2 , 2222-2229
ghabanowitz, J., Hunt, D. F., Weber, M. J., and Sturgill, T. W. (1991)
Seger, R., Ahn, N. G., Posada, J., Munar, E. S., Jensen, A. M., Cooper, J. EMBO J. 10,885-892
A., Cohb, M. H., and Krebs, E. G. (1992) J. Biol. Chem. 2 6 7 , 14373-
Alvarez, E., Northwood, I. C., Gonzalez, F. A,, Latour, D. A., Seth, A., 14381
Abate, C., Gurran, T., and Davis, R. J. (1991) J . Biol. Chen. 266,15277- 169Q6
St&$ T. W., and Wu, J. (1991) Biochim. Bio hys Acta 1092,350-357 Vulliet, R. P., Hall, F. L., Mitchell, J. P., and gardie, D. G. (1989) J . Biol.
Crews, C. M., and Erikson, R. L. (1992) Proc. N d . A c d . Sci. U. S. A. 8 9 ,
Boulton, T. G., Yancopoulos, G. D., Gregory, J. S., Slaughter, C., Moomaw,
Whitehead, R. H., Macrae, F. A,, St. John, D. J., and Ma, J. (1985) JNCZ
Sizeland, A,, Bol, S., and Burgess, A. W. (1991) Growth Factors 4 , 129-143 Sizeland, A., and Burgess, A. W. (1991) Mol. Cell. Biol. 11,4005-4014 Baldwin, G. S., and Zhang, Q-X. (1992) Cancer Res. 62,2261-2267 Whitehead, R. H., Nice, E. C., Lloyd, C. J., James, R., and Burgess, A. W.
Sobel, A., Boutterin, M.-C., Beretp, L., Chneiweiss, H., Doye, V., and
Sobel, A. (1991) Trends Biochem. Sci. 16,301-305 Derynck, R., Roberts, A. B., Winker, M. E., Chen, E. Y., and Goeddel, D.
Ward, L. D., Hong, J., Whitehead, R. H., and Simpson, R. J. (1990)
Laemmli, U. K. (1970) Nature 227,680-685 Cooper, J. A,, Sefton, B. M., and Hunter, T. (1983) Methods Enzymol. 99,
Cleveland, D. W. (1983) Methods Enzyrnol. 96,222-229 Hildebrandt, E., and Fried, V. A. (1989) Anal. Biochern. 177,407-412
Ward L. D., and Simpson, R. J. (1991) Peptide Res. 4 , 187-193 Simpion, R. J., Moritz, R. L., Rubira, M. R., and Van Snick, J. (1988) Eur.
Simpson, R. J., Moritz, R. L., Begg, G. S., Rubira, M. R., and Nice, E. C. J. Biochem. 176,187-197
Begg, G. S., and Simpson, R. J. (1989) in Techniques in Protein Chemistry (1989) Anal. Biochem. 177,221-236
Celis, J. E., Gesser, B., Rasmussen, H. H., Madsen, P., Leffers, H., Dejgaard, (Hugli, T. E., ed) pp. 79-88, Academic Press, New York
K., Honore, B., Olsen, E., Ratz, G., Lauridsen, J. B., Basse, B., Mouritzen,
Chem. 264,16292-16298
8205-8209
C., Hsu, J., and Cobb, M. H. (1990) Science 249,64-67
74, 759-765
(1990) Znt. J . Cancer 46,858-863
Peyro-Saint-Paul, H. (1989) J . Bml. Chem. 264,3765-3772
V. (1984) Cell 38,287-297
Electrophoresis 11,883-891
387-402
EGF-induced Phosphorylation of Stathrnin 13405 S., Hellerup, M., Andersen, A., Walbum, E., Celis, A., Bauw, G., Puype, M., Van Damme, J., and Vandekerckhove, J. (1990) Electrophoresis 11, 52. Hailat, N., Strahler, J. R., Melhem, R., Zhu. X. X., Brodeur, G., Seeger, R.
(1988) J. Biol. Chem. 263,12813-12815
989-1071 39. Glenney, J. R., Jr., Zokaa, L., and Kamps, M. P. (1988) J. ImmunoL 53. Peyron, J.-F., Aussel, C., Ferrua, B., Hiiring, H., and Fehlmann, M. (1989)
C., Reynolds, C. P., and Hanash, S. (1990) Oncogene 6, 1615-1618
40. La on, J. E., Morstyn, G., Fabri, L. J., Reid, G. E., Burgess, A. W., 54. Braverman, R,, Bhattacharya, B., Feuerstein, N., and Cooper, H. L. (1986) Methods 109,277-285 Biochem. J. 268,505-510 gmpson, R. J., and Nice, E. C. (1991) J. Bwl. Chem. 266,23815-23823
41. Barnes, D. (1987) M e t W Enzymol. 146,89-92 J. Biol. Chem. 261, 14342-14348
42. Buss, J. E., Kudlow, J. E., Lazar, C. S., and Gill, G. N. (1982) Proc. Natl. 55. Huang, S., Elliot, R. C., Liu, P. S., Koduri, R. K., Weickmann, J. L., Lee,
J. H., Blair, L. C., Ghosh-Dastidar, P., Bradshaw, R. A,, Bryan, K. M.,
43. Sim son, R. J., Moritz, R. L., Lloyd, C. J., Fabri, L. J., Nice, E. C., Rubira, Einarson, B., Kendall, R. L., Kolacz, K. H., and Saito, K. (1987) Bio-
d R., and Burgess, A. W. (1987) FEBS Lett. 224,128-132 56. Labdon, J. E., Nieves, E., and Schubart, U. K. (1992) J. Biol. Chem. 267, chemistry 26,8242-8246
44. Doye, V., Soubrier, F., Bauw, G., Boutterin, M.-C.,, Beretta, L., Koppel, J., Vandekerckhove, J., and Sobel, A. (1989) J. Bud. Chem. 264, 12134- 57. Beretta, L., Houdouin, F., and Sobel, A. (1989) J . B i d . Chem. 264,9932-
3506-3513
45. Zhu, X.-% Kozarsky, K., Strahler, J. R., Eckerskorn, C., Lottspeich F. 58. Cooper, H. L., Fuldner, R., McDuffie, E., and Braverman, R. (1990) J. 12137 9938
Melhem, R., Lowe, J., Fox, D. A., Hanash, S. M., and Atweh, G. F. (1689; J. Bwl. Chem. 264,14556-14560
Immunol. 146,1205-1213
46. Margolis, B., Rhee, S. G., Felder, S., Mervic, M., Lyall, R., Levitzki, A., 59. Doye, V., Boutterin, M.-C., and Sobel, A. (1990) J. Bioi. Chem. 266,11650-
Ullrich, A., Zilberstein, A., and Schlessinger, J. (1989) Cell 67, 1101- 60. Chneiweiss, H., Beretta, L., Cordier, J., Boutterin, M.-C., Glowinski, J., 11655
1107 and Sobel, A. (1989) J. Neurochem. 53,856863
8. (1991) Mol. Cell. Biol. 11,913-919
Endocrinology 119, 1229-1238 J . (1983) Proc. Natl. Acad. Sei. U. S. A. 80,1337-1341
(19907 J. Biol. Chem. 266,17499-17505
Acad. Sci. U. S. A. 79,2574-2578
47. Posada, J., and Cooper, J. A. (1992) Mol. Bwl. Cell 3,583-592 48. Ap , H., Hazan, R., Zilberstein, A., Ullrich, A., Schlessinger, J., and Rapp, 62. Burgess, A. W. (1989) Br. Med. Bull. 46,401-424
49. Pasmantier, R., Danoff, A., Fleischer, N., and Schubart, U. K. (1986) 64. Kawamoto,T., &to, J. D., Le, A., Polikoff, J., Sab , G. H., and Mendelsohn,
50. Gullber , M., Noreus, K., Brattsand, G., Friedrich, B., and Shingler, V. 65. Edelman, A. M., Blumenthal, D. K., and Krebs, E. G. (1987) Annu. Rev,
51. Hanash, S. M., Strahler, J. R., Kuick, R., Chu, E. H. Y., and Nichols, D. 66. Moreno, S., and Nurse, P. (1990) Cell 61, 549-551
61. Chao, M. V. (1992) Cell 68,995-997
63. Greene, L. A., and Tischler, A. S. (1982) Ado. Cell Neurobwl. 3,374-414
Biochem. 66,567-613


