Epidemiology of Nosocomial Pneumonia in Adults ... · Epidemiology of Nosocomial Pneumonia in...
124
Epidemiology of Nosocomial Pneumonia in Adults Hospitalized in Canadian Acute Care Facilities by Barbara Lynn Johnston A thesis submitted in conformity with the requirements for the degree of Master of Science, Public Health Science (Epidemiology) Graduate Department of Public Health Sciences Dalla Lana School of Public Health University of Toronto © Copyright by Barbara Lynn Johnston 2011
Transcript of Epidemiology of Nosocomial Pneumonia in Adults ... · Epidemiology of Nosocomial Pneumonia in...

Epidemiology of Nosocomial Pneumonia in Adults Hospitalized in Canadian Acute Care Facilities
by
Barbara Lynn Johnston
A thesis submitted in conformity with the requirements for the degree of Master of Science, Public Health Science (Epidemiology)
Graduate Department of Public Health Sciences Dalla Lana School of Public Health
University of Toronto
© Copyright by Barbara Lynn Johnston 2011

ii
Epidemiology of Nosocomial Pneumonia in Adults Hospitalized in
Canadian Acute Care Facilities
Barbara Lynn Johnston
Master of Science, Public Health Science (Epidemiology)
Graduate Department of Public Health Sciences Dalla Lana School of Public Health
University of Toronto
2011
Abstract
Background: Nosocomial pneumonia (NP) is a significant cause of morbidity and mortality in
hospitalized patients.
Objective: The objectives of this study were to describe the epidemiology of NP in adult patients
hospitalized in Canadian acute care facilities and identify prognostic indicators for death.
Methods: A retrospective cohort study was conducted in 114 patients with NP admitted to
hospitals that participated in a 2002 Canadian point prevalence survey.
Results: A high proportion of NP patients had a rapidly or ultimately fatal underlying illness. NP
in non-intensive care unit (ICU) patients accounted for the larger proportion of these infections.
There was no mortality difference between patients with and without ventilator-associated NP, or
with and without ICU-acquired NP. Delayed initiation of appropriate antimicrobial therapy was
associated with a poorer outcome.
Discussion: Strategies that result in the timely administration of appropriate antimicrobial
therapy should be investigated in an effort to reduce NP-associated mortality.

iii
Acknowledgments I gratefully acknowledge the support and expertise of my Thesis Committee: Dr. Allison
McGeer, Ms. Marianna Ofner-Agostini, Dr. Andrew Simor, and Dr. James Scott. This thesis
took years to complete and Marianna (who started as my supervisor), Allison (who finished as
my supervisor) and Andy remained encouraging and supportive throughout, making very
constructive comments on the several drafts. I learned much from their astute observations on my
study findings and interpretation. I would never have finished my thesis without their helpful
nudges. James was kind enough to step in at the last minute as a replacement member of my
Thesis Committee, without whom I would have been unable to defend my thesis. He too offered
comments that strengthened this final report.
I am thankful to the many infection control practitioners who assisted in data collection and the
hospital epidemiologists who provided me with the opportunity to include their hospitals in this
study.
Finally, I am forever grateful to my family. My parents instilled in me a love of learning and my
siblings, their spouses, and my nieces and nephews give me reason to enjoy every day.

iv
Table of Contents Chapter 1. Introduction …………………………………………………………………………...1
Chapter 2. Objectives ……………………………………………………………………………..3
Chapter 3. Literature Review ……………………………………………………………………..4
3.1. Nosocomial infection overview – frequency and mortality ……………………………...4
3.2. Nosocomial pneumonia – diagnosis ……………………………………………………..5
3.3. Nosocomial pneumonia – frequency …………………………………………………….7
3.4. Nosocomial pneumonia – risk factors for occurrence …………………………………...9
3.5. Nosocomial pneumonia – outcomes ……………………………………………………10
3.6. Nosocomial pneumonia – Canadian experience ………………………………………..16
3.7. Nosocomial pneumonia – summary ……………………………………………………17
Chapter 4. Methods ……………………………………………………………………………...18
4.1. Research design ………………………………………………………………………...18
4.2. Data collection ………………………………………………………………………….19
4.3. Data analysis ……………………………………………………………………………21
4.4. Ethical considerations, potential benefits and harms …………………………………...22
Chapter 5. Results ……………………………………………………………………………….23
5.1. Epidemiology of nosocomial pneumonia ………………………………………………23
5.2. Predictors for survival ………………………………………………………………….32

v
Chapter 6. Discussion …………………………………………………………………………...38
6.1. Study findings ………………………………………………………………………….38
6.1.1. Prevalence of nosocomial pneumonia …………………………………………..38
6.1.2. Characteristics of the study population ………………………………………….39
6.1.3. Pneumonia factors ……………………………………………………………….40
6.1.4. Nosocomial pneumonia outcomes ………………………………………………42
6.1.5. Predictors of nosocomial pneumonia survival …………………………………..43
6.2. Limitations ……………………………………………………………………………...45
Chapter 7. Summary of Key Findings and Recommendations ………………………………….48
7.1. Key findings …………………………………………………………………………….48
7.2. Recommendations ………………………………………………………………………48
References ……………………………………………………………………………………….50
Appendix I – Patient Information Form …………………………………………………………62
Appendix II – Definitions ……………………………………………………………………….71
Appendix III – Patient Information Form Instructions ………………………………………….73
Appendix IV – SAS Codes ……………………………………………………………………...82

vi
List of Tables Table 1. Nosocomial pneumonia rates ……………………………………………………………8
Table 2. Independent risk factors for nosocomial pneumonia ……………………………………9
Table 3. Mortality risk of nosocomial pneumonia in critically ill patients ……………………...11
Table 4. Independent risk factors for death in nosocomial pneumonia studies …………………14
Table 5. Characteristics of the study population ………………………………………………...25
Table 6. Characteristics of patients with incident and prevalent pneumonia ……………………27
Table 7. Characteristics of patients with and without all pneumonia criteria …………………...28
Table 8. Microbiology of nosocomial pneumonia according to nosocomial pneumonia type ….30
Table 9. Characteristics of patients with and without a high-risk bacterium ……………………30
Table 10. Patient characteristics stratified by 28-day and discharge outcome ………………….32
Table 11. Results of multivariable analysis (including risk bacteria variable) ………………….36
Table 12. Results of multivariable analysis (excluding risk bacteria variable) …………………37

vii
List of Figures Figure 1. Study participation ……………………………………………………………………24

viii
List of Appendices Appendix I – Patient Information Form …………………………………………………………62
Appendix II – Definitions ……………………………………………………………………….71
Appendix III – Patient Information Form Instructions ………………………………………….73
Appendix IV – SAS Codes ……………………………………………………………………...82

1
Chapter 1 Introduction
Developing a nosocomial (health care-acquired) infection (NI), one not present or incubating on
admission, is a well-recognized adverse outcome of hospitalization. In 1996 the Centers for
Disease Control and Prevention (CDC) estimated that more than 2.1 million NIs occur annually
in the United States (US), of which more than one third is preventable1. These estimates continue
to be quoted as the likely incidence of NI in the US each year. A 1994-95 study from England
found that 7.8% of inpatients developed at least one NI during hospitalization2. Based on their
results, the authors estimated that NIs cost the National Health System £930.62 (Can$1814.71)
million/year2. Adjusted for inflation, this would equal Can$2509.56 million in 2011
(http://www.bankofcanada.ca /en/ rates/ inflation_calc.html; accessed April 17, 2011). In a national
prevalence survey conducted in Scotland over two years (2002 and 2003), 9.5% of patients in
acute care hospitals developed a NI3. A Canadian multicentre study conducted in February 2002
revealed that patients hospitalized in Canada are similarly affected, with 10.2% of patients
developing a NI4. A similar study conducted in 2009 in association with a nationwide
surveillance program found that 12.3 % of patients hospitalized in 49 Canadian hospitals had a
NI (personal communication: Denise Gravel, Public Health Agency of Canada). While there is
some understanding of the scale of morbidity and mortality related to NIs, a number of other
factors are less well explored, such as the financial costs to the health care system, patient and
family, and society in general. Thus, the impact of NIs may be even greater than appreciated and
is an area where further research is both required and warranted.
There are several types of NIs and they vary in their associated morbidity and crude mortality1.
Of these, nosocomial pneumonias (NP) and bacteremias have the greatest impact on patient
outcome1. Given that NP occurs more frequently than bacteremia and is associated with a
similarly high crude mortality, it accounts for the largest number of deaths related to NI-related
deaths1. Identifying effective preventive and management strategies for NP has the potential to
significantly improve patient outcomes.
Numerous studies have demonstrated that mortality rates associated with severe NI such as
pneumonia are high. It has been difficult to establish whether these infections represent

2
independent risk factors for death. If the evidence supports an independent association between
NP and death, this would further support the need for additional research into preventive
strategies. Additionally, it is not clear whether there are factors that, if modified, might reduce
mortality rates due to NP. The overall purpose of this thesis is to describe the epidemiology of
NP in adults hospitalized in Canadian acute care facilities.

3
Chapter 2 Objectives
The primary analysis objective of this thesis is:
• To describe the epidemiology of NP in adult patients hospitalized in Canadian acute care
facilities; specifically the demographics, coexistent morbidities, selected characteristics
of the hospital setting, pneumonia type and treatment factors, as well as patient outcomes.
The secondary analysis objective of this thesis is:
• To identify prognostic indicators for death in adults with NP in Canadian acute care
facilities. Expected factors for consideration are age, underlying severity of illness,
duration of hospitalization before onset of the NP, and adequacy of treatment for the NP.

4
Chapter 3 Literature Review
3.1 Nosocomial infection overview – frequency and mortality Since the 1960s, NIs have been recognized as an important health problem associated with
significant morbidity, mortality, and cost5-8. The Study of the Efficacy of Nosocomial Infection
Control (SENIC) project estimated that there were 2.1 million NIs among 37.7 million
hospitalized patients over a one-year period in 1975-76 7, or 5.7 NIs/100 admissions and 7.18
NIs/1000 patient-days. A study of the rate and costs of NI in a general hospital in England
between 1994 and 1995 found that 7.8% of patients developed one or more NIs2. In a national
prevalence survey conducted in Scotland over two years (2002 and 2003), 9.5% of patients in
acute care hospitals were found to develop a NI3. More recently, the first year of data regarding
number of NIs in Pennsylvania hospitals, following introduction of legislation mandating
reporting, reported 7.5 NIs per1000 admitted patients9. The first nationwide assessment of the
impact of NI in Canada was conducted in February 2002. In this point prevalence survey
involving 29 hospitals in 9 Canadian provinces, it was determined that 686 of 6745 patients
(10.2%) had one or more NIs on the day of the survey4. A follow-up survey conducted in 2009
involving 49 hospitals in 9 Canadian provinces revealed an increase to 11.8% (personal
communication: Denise Gravel, Public Health Agency of Canada).
Nosocomial infection rates are higher among critically ill patients than in the general patient
population. A 1992 prevalence survey in intensive care units (ICUs) in 17 Western European
countries found that 20.6% of patients developed an ICU-acquired infection10-13. A prospective,
multicentre incidence survey in five university hospital ICUs in France over 3 months in 1994-95
found that 13.1% of patients had an ICU-acquired infection, reflecting a rate of 20.3 NIs per
1000 patient-days11. The occurrence of ICU-related infections does not appear to have changed
substantially over the years despite improved knowledge about their etiology and the
implementation of targeted preventive strategies12,13.
Nosocomial infections have been associated with excess hospital mortality. In a systematic
review of 1000 postmortem reports of inpatient deaths, NI was found to be the direct cause of
death in 7.4% of cases and a contributing factor in another 6.3%14. In another study, it was noted

5
that NIs were more common in patients who died during their hospitalization (33%) than in
survivors (13%)15. The European ICU prevalence study reported an overall NI-associated
mortality rate of 16.8%10. In a study carried out ten years after the European ICU prevalence
study, investigators in Finland found an 8.8% ICU mortality and 31.3% hospital mortality for
patients with an ICU-acquired infection, which represented an independent risk for death (OR
2.7; 95% CI:1.34-5.40, p=0.005) 12. In a cohort study published in 2006, the odds of death in
patients with a NI increased in the presence of ventilator-associated pneumonia (VAP)
(p<0.0001)9. Additionally, patients with a NI had longer lengths of stay (13 days vs. 5 days) and
higher hospital costs (US$173, 206 vs. US$ 44,367) than those without. These data suggest that
there are excess mortality, morbidity, and costs that can be attributed to a NI.
The four most common NIs are urinary tract, surgical site, pulmonary, and bloodstream
infections16. Their relative frequency has varied somewhat from study to study, in part related to
different patient populations studied and changing hospitalization patterns. Overall, NP typically
ranks second or third most common in frequency4,5,16. Nosocomial pneumonia accounted for
15% of infections in the patient population studied by Wenzel in the early 1970s8. During a
prevalence survey of NI in 72 German hospitals in 1994, NP accounted for 20.7% of all such
infections17. In the Canadian prevalence survey, NP accounted for 26.6% of all NIs4. Nosocomial
pneumonia represents the first or second most common NI in the ICU setting2,10. In the European
Prevalence of Infection in ICU Study, pneumonia was the most common (46.9%) of the NIs10.
This is similar to other ICU studies where NP accounted for 25.2% – 47.4% of NIs12,13.
3.2 Nosocomial pneumonia – diagnosis Pneumonia is infection mediated inflammation of the distal lung caused by a variety of different
microorganisms. Nosocomial pneumonia may be classified as ventilator-associated (VAP),
further sub-classified as early-onset and late-onset VAP, or non-VAP. One of the greater
limitations to the study of NP has been the difficulty in achieving consistent and reliable
diagnosis, especially in ventilated patients. Historically, and for routine hospital surveillance
purposes, a clinical definition based on the presence of certain symptoms and signs (specifically
new onset of sputum production or a change in sputum characteristics and crackles or dullness to
percussion on chest examination), microbiological culture results, and radiographic findings has
been used. The poor specificity of clinical diagnosis has been suggested by various

6
investigators18-20. Additionally, one study has questioned even the sensitivity of clinical
diagnosis21. As a result, the use of invasive diagnostic techniques has been promoted to improve
diagnostic specificity, thereby reducing misclassification and enhancing the validity of studies of
NP. These techniques have included the collection and culture of transtracheal or transthoracic
aspirates and bronchoscopy to collect protected specimen brush (PSB) and bronchoalveolar
lavage (PBAL) samples 19,20,22-24. Unfortunately, some of these procedures cannot be safely
performed in critically ill patients. Furthermore, the sensitivity of PBAL may be as low as 69%24.
When the outcomes of VAPs diagnosed using both clinical (suspected) and microbiological
(confirmed) criteria were examined by multivariable analysis in a study investigating the
usefulness of PBAL, only suspected VAP remained associated with increased mortality24. One
interpretation of this finding is that a clinical diagnosis carries the same significance as a
microbiologically confirmed one. Similarly, Timsit et al found that suspected VAP (clinical
diagnosis alone) and confirmed VAP (confirmed by PSB and PBAL) had similar mortality25.
This finding was confirmed in a study evaluating the benefit of PBAL in managing VAP, which
reported a high mortality in patients for whom there was a strong clinical suspicion of VAP
regardless of whether the diagnosis was confirmed by PBAL26. In one study of pneumonia (both
community- and hospital- acquired) requiring ICU admission, it was estimated that 22 of 152
cases represented false positive diagnoses once the clinical course and diagnostic results became
apparent27. Obtaining a specimen to make a microbiological diagnosis can be difficult in non-
ICU patients. In their study of general medical and surgical patients, Everts found that only 41%
of patients submitted a suitable respiratory specimen. Of these, only 37% demonstrated a
microbial etiology28.
Currently, there is insufficient evidence to support the superiority of a diagnosis of VAP made
using invasive methods over a clinical diagnosis, and good evidence that survival is similar for
patients with a strong clinical suspicion of VAP and those with a culture-confirmed diagnosis. At
the same time, the potential for misclassification of patients and its impact on research findings,
as well as the comparability of different studies, must always be kept in mind. In general,
misclassification bias arising from suboptimal diagnostic techniques would contribute to an
inability to identify differences between case and control patients. Uncertainty surrounding an
accurate diagnosis remains one of the major limiting factors in interpreting the NP literature.

7
3.3 Nosocomial pneumonia – frequency The literature reports a range of NP rates, using a variety of metrics, including incidence and
prevalence rates, and incidence density rates (Table 1). The SENIC project reported that NP
occurred in 0.6% of hospital admissions with an incidence density rate of 0.76 pneumonias/1000
patient-days7. This is generally similar to rates reported at the University of Virginia over two
time periods (1972-19758 and 1979-198329); by the National Nosocomial Infection Surveillance
(NNIS) program in the US in 19845; the Winnipeg Health Sciences Centre between 1987-198830;
Christchurch Hospital in New Zealand from 1994-199528; and a hospital in Nagasaki, Japan from
1996-200031. The 2002 Canadian prevalence survey found that 175 of 5750 adult patients (3%)
developed a NP4. In the 2009 Canadian survey, a similar (2.7%) prevalence of NP was identified
(personal communication: Denise Gravel, Public Health Agency of Canada). A limitation of
these two Canadian studies, by virtue of their being prevalence surveys, is that incidence density
rates cannot be determined, either in terms of patient- or ventilator- days at risk. Thus, we are left
with only an approximation of the incidence of NP in adults admitted to hospital in Canada.
With the realization that mechanically ventilated patients are at greater risk to develop NP than
non-ventilated patients, attention has focused on NP rates in ICUs. In a prevalence study
conducted in 72 German hospitals in 1994, NP prevalence was 0.51% and 0.26% on general
medicine and surgery wards respectively, but 5.87% in ICU17. A number of published studies
have reported NP rates in ventilated patients in critical care units ranging from 9.6%-26.7%11,13,
18, 19, 32-36. This variation in rates is likely contributed to by the use of differing case definitions
and diagnostic strategies, as well as different patient populations (e.g. trauma patients, post-
surgical patients) and unit types (e.g. cardiovascular surgery ICU, medical ICU). It is also
possible that regional and national factors, such as antimicrobial use and antimicrobial resistance
patterns, contribute to NP rate differences among the various studies. The major risk factor for
NP in ventilated patients relates to mechanical ventilation itself. Nosocomial pneumonia rates are
therefore more appropriately reported in terms of device exposure, for which rates range from
6.7-37.6 VAP cases per 1000 ventilator- days11-13, 19, 34-38.

8
Table 1. Nosocomial pneumonia rates
Years NP Type % of admits % of patients
/1000 admits /1000 discharges
/1000 pt-days
/1000 vent-days
1975-67 All 0.60 0.76
1972-58 All 9.40
1979-8329 All 8.60
19845 All 6.00
1987-830 All 5.70
1994-528 Non-VAP 6.10
1996-200031 Non-VAP 1.86
20024 All 3.00
199417 Gen Med 0.51
199417 ICU 5.87
1994-511 ICU 9.60 9.40
2002-312 ICU 8.10 18.8
2002-513 ICU 18.9 26.50
1983-432 VAP 21.00
1990-119 ICU 7.80 12.50 20.50
1983-433 VAP 26.60
1996-734 ICU 15.40 20.00
2002&335 ICU 15.00 29.00
1999-200336 VAP 22.30 37.60
1992-637 VAP 17.50 14.80
1992-738 VAP 11.80
Not stated39 ICU 18.00 18.30
1997-200340 ICU 16.90 15.90
2005-641 Non- ICU 3.30
1994-200042 VAP 19.90

9
3.4 Nosocomial pneumonia – risk factors for occurrence A number of studies have examined risk factors (Table 2) for the occurrence of NP. Most have
focused on those patients most at risk, i.e. patients in ICU. The results have been discrepant for
several reasons including differences in study methodology, population composition, case
definitions, sample sizes, and risk factors examined.
Table 2. Independent risk factors for nosocomial pneumonia
Country, yr. Study Design Patients Risk factors
US
1990-199119
Prospective
cohort
358 MICU
28 VAP
Low serum albumin, PEEP≥7.5cm H2O, no
antibiotics, colonization with GNR, pack-yrs
smoking, duration of ventilation
Canada
1992-199637
Prospective
cohort
1014 ICU
177 VAP
Burns, trauma, CNS disease, respiratory disease,
cardiac disease, ventilated prior 24 hrs, witnessed
aspiration, paralytic agents; prior antibiotics
protective
US
1997-199843
Prospective
cohort
3668 M/SICU
420 HAP
↑APACHE score, reintubation, H2 blockers, duration of ventilation, tracheostomy
US
199244
Prospective
cohort
277 ICU
43 NP
Organ system failure score ≥3, age ≥60 yrs, prior
antibiotics, patient head positioning
Spain
1987-8845
Prospective
cohort
322 ICU
78 NP
>1 intubation, prior aspiration, ventilation>3days,
COPD, PEEP
US
1998-9946
Prospective
cohort
888M/SICU
132 VAP
Tracheostomy, multiple central line insertions,
reintubation, antacids
Spain
1980s47
Case control 120 each group,
ICU and non-
ICU
Intubation, depressed level of consciousness,
chronic lung disease, thoracic or upper abdominal
surgery, large volume aspiration, age >70yrs

10
Germany
199417
Prevalence
survey
14966 patients
107 LRTI
Chronic airway disease, impaired consciousness,
polytrauma, surgery, CV disease
Brazil 1996-
199734
Prospective
cohort
540 ICU
83
Tracheotomy, NG tube feeding, H2 blocker use, ↓
level of consciousness
France
1996-200148
Case control 177 each group Prior antibiotics during ICU stay, neurological
failure; tracheotomy protective
Germany
2000-200149
Prospective
cohort
1876
158 NP
Elective surgery, emergency surgery admission,
NG tube, mechanical ventilation
Sweden
2002&200335
Prospective
cohort
221 ICU
33 VAP
Aspiration, recent surgery, trauma
Switzerland
1999-200336
Prospective
cohort
2470 ICU 262
VAP
Central venous catheter, low nurse/patient ratio
for late VAP; therapeutic antibiotic protective
France
1997-200340
Prospective
cohort
1856 ICU
319 VAP
Male gender, admission SOFA score, broad
spectrum antibiotics 1st 2 days of ventilation,
absence of parenteral nutrition, duration of
mechanical ventilation
Given these discrepancies, it is difficult to draw definitive conclusions regarding which factors
are most likely to put patients at risk for developing NP.
3.5 Nosocomial pneumonia - outcomes Although not the most common NI, NP is overall responsible for the greatest NI-attributable
mortality in the hospital setting. In a study of postmortem findings, Daschner et al found that the
most frequent NI causing or contributing to death was NP14. In a review of 100 consecutive
inpatient deaths at two facilities, it was determined that when a NI was causally related or
contributory to death, infection of the lower respiratory tract was predominant50. At the
University of Virginia between 1979 and 1983, the overall case fatality rate of NP was 30%, with
an attributable mortality of 33% (p=0.089) and a 7 day longer hospital stay (p<0.0001) compared

11
to patients without NP 29. Louie et al reported a NP mortality rate of 25% in patients at a tertiary
care centre in Winnipeg from 1987-198830. This is greater than the 11% case fatality rate noted
in New Zealand patients28 and 6.5% in patients on general wards in Japan31. While secular trends
in mortality may reflect improvements in diagnosis and treatment over the years, differences in
outcome between studies may also be due to differences in study design, case definitions, study
populations, and duration of follow-up. Mortality rates for NP (Table 3) have been generally
been higher in ICU patients, ranging from 33%-58%20-22, 32, 35, 43, 51-54.
Table 3. Mortality risk of nosocomial pneumonia in critically ill patients
Country, yr. Design Patients Summary results Comments
US
1997-9843
Prospective
cohort
3668
420 NP
Adjusted OR 1.74 (95%
CI 1.50-2.03)
Clinical diagnosis; multivariable
analysis; 50 % ‘high-risk’ bacteria
US
199451
Prospective
cohort
314
87 NP
‘High-risk’bacteria
adjusted OR 3.40
(95% CI 1.21-10.00)
Clinical diagnosis; multivariable
analysis; insufficient power to
determine risk due to all bacteria
France
1996-9922
Matched
case-cohort 135 each
group
Adjusted OR 2.10
(95% CI 1.20-3.60)
PSB diagnosis; time-dependent,
multivariable analysis; 32% with
‘high-risk’bacteria
France
1989-9452
Prospective
cohort
1978
328 NP
Adjusted OR 2.08
(95% CI 1.55-2.80)
PSB diagnosis; multivariable
analysis
France
1988-9036
Matched
case-cohort
48 each
group
Risk ratio 2 (95% CI
1.41-3.71)
PSB diagnosis; matching
successful for 92.5%variables;
higher mortality with ‘high-risk’
bacteria
US
199244
Prospective
cohort
277
43 NP
Crude OR 6.34 Clinical diagnosis; NP fell out with
multivariable analysis
Spain Prospective 265 Crude risk ratio 1.10 Many patients had PSB; univariate

12
1988-8955 cohort 58 NP analysis
Spain
1987-8845
Prospective
cohort
322
78 NP
Crude risk ratio 1.73 Some patients had PSB; NP not
examined in multivariable analysis
France
1989-9356
Matched
Case-cohort
85 each
group
VAP mortality 40%
NonVAP mortality 39%
Patients had PSB; Unable to find
matches for 12/97; stratified
analysis for nonmatched factors;
most surgical patients
US
1998-9946
Prospective
cohort
888
132 NP
VAP mortality 46%
NonVAP mortality 32%
Clinical diagnosis
VAP fell out in multivariable
analysis
Canada
1992-9657
Matched
Case-cohort
173 each
group
Attributable mortality
5.80% (95% CI –2.40-
14.00%)
Patients had PSB; stratified
analysis; done in context of
randomized controlled trial
Sweden
2002&200335
Prospective
cohort
221
33 VAP
Adjusted OR 2.73 (0.97-
7.63)
70% of patients had PSB and/or
BAL
Switzerland
1999-200336
Prospective
cohort
2470 262
VAP
VAP mortality 33.50%
Non-VAP mortality
31.20%
Clinical diagnosis. VAP divided
into early and late onset
Germany
2000-200149
Prospective
cohort
1876
158 NP
Crude risk ratio 0.87 Clinical diagnosis
VAP not a risk in multivariable
analysis
France
2002-200358
Prospective
cohort
101
40VAP
Attributable mortality
18.50% (95%CI 3.10-
34.80)
All confirmed with PSB.
Attributable mortality= Expected
based on APACHE-observed.
Excess mortality in late VAP
Europe Prospective
cohort
2436 827
NP
NP mortality 37.70% Not all had invasive diagnosis. No
multivariable analysis for mortality

13
Not given39 No-NP mortality 31.60% from NP
France
1996-200759
Prospective
cohort
2873
434 VAP
Attributable mortality
8.10% (95%CI 3.10-
13.10%)
Clinical diagnosis allowed. Study
compared logistic regression and
time-dependent models.
Various60 Meta-
analysis
52 studies Overall RR: 1.27 (95%CI
1.15-1.39)
Trauma RR: 1.09 (95%CI
0.87-1.37)
ARDS RR 0.86 (95%CI
0.72-1.04)
Heterogeneity among studies other
than those in trauma and ARDS
limits ability to quantify RR
PSB=protected specimen brush BAL=bronchoalveolar lavage
Several studies identify NP as an independent predictor for death21,22,43,51,52 ,while others do
not44-46, 55-57. Mortality rates are higher in severely ill patients, even in the absence of infection.
Nosocomial pneumonia and mortality share several risk factors that confound their relationship.
Thus, the question is whether death in a patient with a NP arises primarily as a consequence of
infection, if infection merely hastens the conclusion of an underlying disease process, or if the
infection is non-contributory to death. Each of the studies looking at outcome has demonstrated
the important role that the patient’s associated conditions and premorbid status play. When
evaluating the various studies, the balance of evidence tends to favour an independent role for
NP as a prognostic factor in critically ill patients. The only study to examine prognostic factors
associated with NP in non-critically ill patients has not identified the pneumonia as an
independent risk factor for death61.
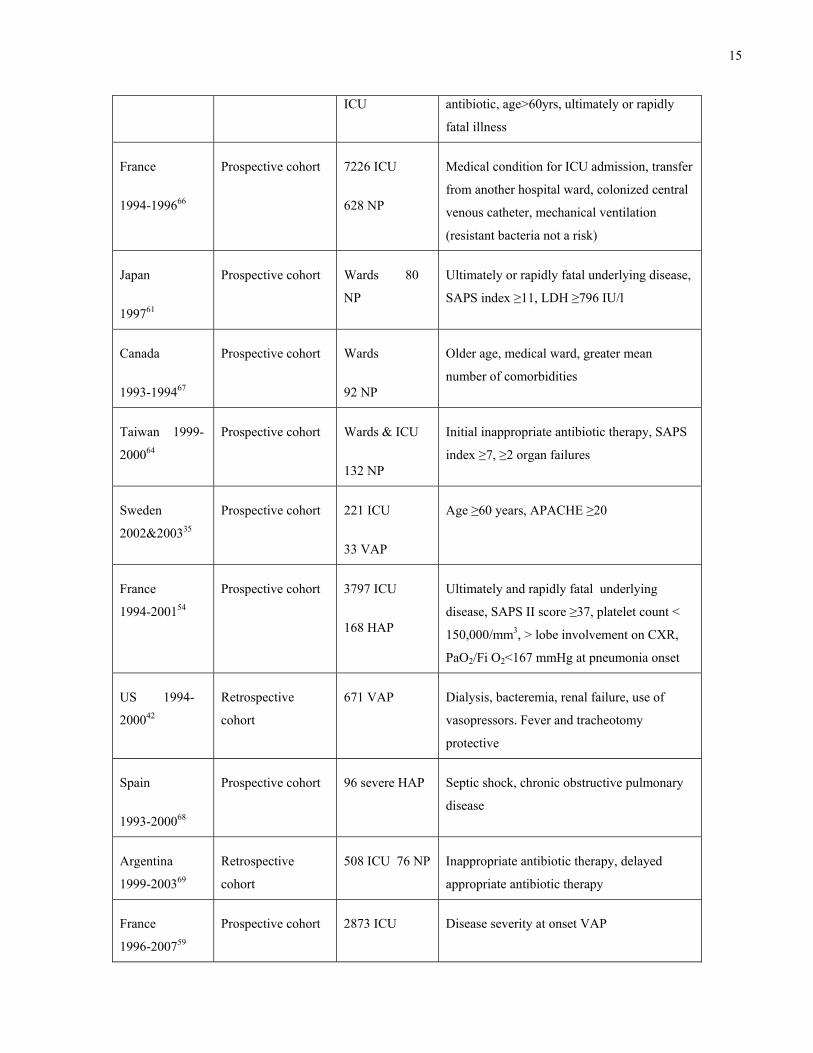
A number of studies have examined risk factors for death in ICU patients (Table 4). Among
these are inappropriate initial antibiotic therapy62 and infection with ‘high-risk’
microorganisms43,51 such as Pseudomonas aeruginosa27, 51, 63, Acinetobacter species63,64,
methicillin-resistant Staphylococcus aureus65 and Aspergillus species47. Other studies have not
been able to attribute risk to these pathogens; discrepant findings again may have arisen from
varying diagnostic strategies and sample sizes43,55,56,66.

14
Table 4. Independent risk factors for death in nosocomial pneumonia studies
Country, yr. Design Patients Risks
US
1983-8432
RCT of ventilator
circuit changes
233
49 VAP
↑creatinine, pneumonia on admission, no
bronchodilators, duration of ventilation, no
abdominal surgery, admission from other
ward of hospital, coma on admission
US
1997-199843
Prospective cohort 3668 M/SICU
420 HAP
Use of vasopressors, multiorgan failure, NP,
underlying malignancy, use of steroids,
APACHE II score, age
US
199451
Prospective cohort 314 ICU
87 VAP
VAP due to high-risk bacteria. Organ system
failure score ≥3, nonsurgical diagnosis,
premorbid lifestyle score≥2, antacids or H2
blockers
France
1996-9922
Matched case-
cohort
135 ICU
patients each
group
Neurologic diagnosis, cardiac diagnosis,
chronic alcoholism, surgery during ICU stay,
NP due to resistant organisms
France
1989-9452
Prospective
cohort
1978 ICU
328 NP
APACHE II score, # dysfunctional organs,
NP, nosocomial bacteremia, fatal underlying
disease, admission from other ICU
US
199221
Prospective
cohort
277 ICU
43 NP
Organ system failure score ≥3, premorbid
lifestyle score ≥2, supine head positioning
Spain
1987-8845
Prospective
cohort
322 ICU
78 NP
Ultimately or rapidly fatal disease, worsening
respiratory failure, septic shock, inappropriate
antibiotic
US
1998-9946
Prospective
cohort
888M/SICU
132 VAP
Bacteremia, compromised immune system,
higher APACHE II score, older age
Spain
1980s47
Case control 120 each group,
ICU and non-
High-risk microorganism, bilateral
involvement, respiratory failure, inappropriate
15
ICU antibiotic, age>60yrs, ultimately or rapidly
fatal illness
France
1994-199666
Prospective cohort 7226 ICU
628 NP
Medical condition for ICU admission, transfer
from another hospital ward, colonized central
venous catheter, mechanical ventilation
(resistant bacteria not a risk)
Japan
199761
Prospective cohort Wards 80
NP
Ultimately or rapidly fatal underlying disease,
SAPS index ≥11, LDH ≥796 IU/l
Canada
1993-199467
Prospective cohort Wards
92 NP
Older age, medical ward, greater mean
number of comorbidities
Taiwan 1999-
200064
Prospective cohort Wards & ICU
132 NP
Initial inappropriate antibiotic therapy, SAPS
index ≥7, ≥2 organ failures
Sweden
2002&200335
Prospective cohort 221 ICU
33 VAP
Age ≥60 years, APACHE ≥20
France
1994-200154
Prospective cohort 3797 ICU
168 HAP
Ultimately and rapidly fatal underlying
disease, SAPS II score ≥37, platelet count <
150,000/mm3, > lobe involvement on CXR,
PaO2/Fi O2<167 mmHg at pneumonia onset
US 1994-
200042
Retrospective
cohort
671 VAP Dialysis, bacteremia, renal failure, use of
vasopressors. Fever and tracheotomy
protective
Spain
1993-200068
Prospective cohort 96 severe HAP Septic shock, chronic obstructive pulmonary
disease
Argentina
1999-200369
Retrospective
cohort
508 ICU 76 NP Inappropriate antibiotic therapy, delayed
appropriate antibiotic therapy
France
1996-200759
Prospective cohort 2873 ICU Disease severity at onset VAP

16
434 VAP
Turkey
2005-200641
Prospective cohort 45679 admits
154 NP (non-
ICU)
Age, chronic renal failure, aspiration risk,
steroid use, multilobar infiltrates
Various70 Meta-analysis 26 studies Acute respiratory failure, prior CAP,
malignancy, inappropriate initial therapy,
bacteremia, ARDS/ALI, shock, late VAP,
sepsis, infection with Acinetobacter baumanii
Regardless of whether VAP increases the risk of death, most studies have demonstrated that it
does prolong the length of hospitalization by 7– 17 days21,35,36,43,45,55,56,71. Kollef et al compared
patients hospitalized with community-acquired pneumonia (CAP), hospital-acquired pneumonia
(HAP), and VAP in a large, multi-centre database study72. They determined that the mean
hospital charge for CAP was US$25,218, increasing to US$ 65,292 for HAP, and US$150,841
for VAP72. Recognizing the importance of NP in terms of frequency and associated
complications (morbidity, mortality and costs), there has been great interest over the years in
studying its epidemiology and evaluating preventive measures.
3.6 Nosocomial pneumonia – Canadian experience Despite the large literature on NP, there is very little describing the Canadian experience. One
study examined the morbidity and mortality attributable to VAP in critically ill patients who
participated in a randomized controlled trial (RCT) of sucralfate versus ranitidine in 15
university affiliated ICUs across Canada. It found that there was a trend towards increased
mortality in patients with VAP57compared to patients who did not develop VAP. As with most
RCT, the study participants may not be representative of patients with NP and results must be
interpreted with caution57. The other three studies are single centre (two from one centre) and
largely descriptive reports that did not assess attributable mortality30,67, 73. Among those who had
NP, predictors for death were older age, a greater number of comorbidities, and residing on a
medical ward67. A great deal more remains to be learned about NP in Canadian health care
facilities.

17
3.7 Nosocomial pneumonia - summary The literature speaks to the clinical impact of NP. It is one of the most common of the NIs and
associated with a high crude mortality rate. Its role as an independent risk factor for death is not
clear, with different results reported in various studies. Given the variation in results from study
to study, the epidemiology of NP in Canada is not necessarily predictable. One reason for this
may be regional differences in the prevalence of antimicrobial-resistant microorganisms. Several
studies show a poorer outcome for patients whose NP is caused by a high-risk microorganism,
including antimicrobial-resistant strains27,43, 51,63-65. Canadian data have suggested a relatively
low prevalence of the important antimicrobial-resistant pathogen, methicillin-resistant S.aureus
(MRSA), However, the incidence of infection with this bacterium has increased 17-fold (0.36 to
3.43/10,000 patient days) from 1995 to 2007, suggesting that it is likely to emerge as a more
common nosocomial pathogen74. It may well be that NP in Canada is associated with mortality
rates that differ from those reported in the literature, in part because of a lower prevalence of
antimicrobial-resistant bacteria. With the paucity of Canadian data and the discrepant results in
the literature, it is crucial that we have a better understanding of the significance of NP as a
health issue for Canadians. If the evidence supports a relationship between NP and death then
further research into prognostic indicators and preventive strategies is warranted.

18
Chapter 4 Methods
4.1 Research design Study design: We conducted a retrospective cohort study to describe the epidemiology of NP in
adult patients hospitalized in Canadian acute care facilities and to identify prognostic indicators
for death in adults with NP.
Study population: The target population is adult patients admitted to acute-care hospitals in
Canada. Patients admitted to adult acute care facilities across Canada that participated in the
Canadian Nosocomial Infection Surveillance Program (CNISP) point prevalence survey of
hospital-acquired infections, conducted in February 2002, formed the sampling population.
Patients potentially eligible to be included in the prevalence survey were identified by the
hospital census on a single day. All patient units were surveyed except long term care,
rehabilitation, psychiatric, and maternity wards. The study population was adult patients
admitted to a unit where surveillance was performed and who were identified as having a NP at
the time of this one-day cross-Canada CNISP point prevalence survey.
Study setting: CNISP hospitals are major teaching hospitals, and located in all provinces except
Prince Edward Island. At the time of the study, each of the country’s medical schools had a
CNISP affiliated hospital. These hospitals have been collaborating on NI surveillance projects
since 1995.
NP detection: Experienced infection control practitioners (ICPs) reviewed the charts of all
inpatients on the wards where surveillance was conducted on the day of the point prevalence
survey. They identified patients who had NP (newly diagnosed that day or previously diagnosed
and still on treatment) according to point prevalence study definitions based on accepted
surveillance definitions75.
NP definition: Nosocomial pneumonia was diagnosed, according to CDC definitions, based on
the presence of either i) abnormal findings on physical examination (rales or dullness to
percussion) or ii) chest radiograph findings (new or progressive infiltrate, cavitation or pleural
effusion) and any one of a) new onset of purulent sputum or change in character of sputum, b)

19
microorganism isolated from blood culture, c) isolation of pathogen from specimen obtained by
transtracheal aspirate, bronchial washing, brushing, or biopsy, d) isolation of virus or detection
of viral antigen in respiratory secretions, e) diagnostic single antibody titer (IgM) or fourfold
increase in paired serum samples (IgG) for pathogen, or f) histopathologic evidence of
pneumonia75.
Inclusion criteria: Patients were included if they had been admitted for at least 48 hours on the
day of the census or had a previous admission within the last 30 days and met the criteria for NP.
Exclusion criteria: The following criteria resulted in exclusion from the study: age under 16
years, a prior NP during the admission, and hospitalization for more than 90 days before the
onset of the pneumonia.
4.2 Data collection Data abstraction: Data were abstracted from the hospital record by an experienced ICP, research
nurse, or the site principal investigator at each participating hospital using a standard
questionnaire (Appendix I), definitions (Appendix II) and instructions (Appendix III). The data
abstraction form was pilot tested for question form, content, readability and usability by an
experienced ICP and the primary investigator (PI) on 10 patients with NP who were not part of
the cohort. The answers were compared for questionnaire reliability. Data abstractors received
in-depth training on study definitions and completion of the questionnaire by the PI who had
regular email and, as needed, telephone contact with each participating site to maintain data
reliability to the highest degree possible.
Data collected: Study patients were identified by the number (known as the survey number)
assigned to them by Health Canada at the time of the point prevalence survey. Each participating
hospital maintained a log of survey number and hospital identification number. The hospital
identification number was not part of the information collected for this study.
A number of independent variables related to host, hospitalization, and NP that represent
potential confounding factors were obtained from the inpatient record. Demographic variables
included age and sex. Host factors included admission diagnosis and number and type of
comorbidities, presence of an ultimately, rapidly or non-fatal underlying condition according to

20
criteria proposed by McCabe and Jackson76, APACHE III score on admission as defined by
Knaus et al77, and smoking history. Hospitalization factors included date of admission and,
where applicable, dates of ICU admission and discharge; presence, type and date of other NI;
surgical procedures during the hospitalization; type of service at time of pneumonia onset; use of
corticosteroid/ immunosuppressant/anticancer drugs; prior use of antimicrobials; presence and
duration of endotracheal and tracheostomy tubes and mechanical ventilation (invasive and non-
invasive); and reason for ventilation. Infection-related variables included associated bacteremia,
diagnosis of VAP or non-VAP, presence and identity of infecting microorganisms, time (in days)
to initiation of an appropriate antimicrobial regimen as measured by the interval between the
initiation of antimicrobial therapy and the NP diagnosis, duration of treatment, and whether the
use of empiric antimicrobials and treatment duration was “correct” as defined by current IDSA
guidelines for treating NP78. These guidelines differentiate NP as occurring with and without
defined risk factors, and as early (within the first 4 days of hospitalization) or late (after 4 days).
Treatment recommendations are specific to these different subsets of case characteristics. In
terms of duration, for the purposes of this study a treatment course of 7 days was considered
acceptable for all pathogens except P. aeruginosa.
Definitions: The pneumonia was defined as ventilator-associated if the patient had been
intubated and ventilated for ≥ 48 hours prior to and within 48 hours of the pneumonia. ICU
pneumonia was similarly defined: the patient had been in ICU for ≥ 48 hours prior to and within
48 hours of the pneumonia. To assess whether NP survival might be positively influenced by a
preponderance of prevalent cases (survivors) that were systematically different from recently
diagnosed cases, patients were compared according to whether they were a prevalent or incident
NP. A time frame of 3 days was arbitrarily chosen, anticipating that most patients with NP have
at least a three-day survival. Incident pneumonia was defined as a NP case newly diagnosed
within 3 days of the survey. A NP present for more than 3 days at the time of the survey was
called a prevalent pneumonia. High risk microorganisms were defined as methicillin-resistant
S.aureus, P. aeruginosa, and Acinetobacter species. Correct use of antimicrobials was defined as
prescribing of empiric therapy and duration of antibiotic use as outlined by the 2005 IDSA
guidelines for treating NP78. The prescribed antimicrobial was defined as appropriate when it
covered the pathogen isolated or when there was no pathogen isolated. The outcome of interest
was mortality at discharge from hospital or four weeks from the NP diagnosis, whichever

21
occurred first. Four weeks was arbitrarily chosen since it was felt likely that most deaths related
to a NI would have occurred by that time.
4.3 Data analysis Data submission: Completed data collection forms were faxed to the PI at Dalhousie University
where they were held in a locked filing cabinet kept by the PI. Computer files were accessible
only to the investigators by personal and confidential passwords.
Data entry and analysis: Data were entered into an Access (Microsoft Office 2000) database
created specifically for this study and analysis was with SAS version 9.2 (SAS Institute, Cary,
NC). Each questionnaire was reviewed by the PI for completeness and consistency. Accuracy of
data entry was assessed by manual review of each patient data abstraction form entered into the
database and review of summary data for errors and inconsistencies. Data entry, verification, and
analysis (Appendix IV) were conducted by the PI.
Primary analysis objective: Categorical values were analyzed using Χ2, with continuity
adjustment where there were <5 values in a cell. Where 20% of the cells had < 5 observations,
the Fisher’s exact test was used. Continuous variables were analyzed using Student’s t test. All
analyses were two-sided at an alpha of 0.05. Results are reported as relative risks with 95%
confidence intervals. Correlations were determined using Pearson correlation coefficient.
Secondary analysis objective: Variables judged to be clinically important (i.e. number of days
before an effective antibiotic was initiated) or associated with the outcome in univariate analysis
were entered stepwise into multivariable models (Model 1 with variables significant at p≤0.10
and Model 2 with variables significant at p≤0.05; forward selection) to test the independence of
the pneumonia death relationship and identify prognostic factors, taking into consideration
potential confounding and modifying factors. The effect of the McCabe classification was
examined in four ways: i) the McCabe score (an ordinal variable), ii) McCabe scores 2 and 3
compared to McCabe score 1, iii) McCabe score 3 compared to McCabe scores 1 and 2, iv)
McCabe score 2 compared to McCabe score 1, and v) McCabe score 3 compared to McCabe
score 1. None of the variables entered into the model was a potential mediator (i.e. a factor that
occurs in the causal pathway from an independent to a dependent variable). Interactions between

22
the time before treatment and age, APACHE score, presence of high-risk microorganism, and
whether a specimen was collected were assessed.
Model 1: Mortality (Alive) = intercept + age + gender + McCabe + APACHE + surgery + ICU +
service + specimen collected + time before treatment ± high-risk bacteria + error
Model 2: Mortality (Alive) = intercept + McCabe + surgery + ICU + service + time before
treatment ± high-risk bacteria + error
4.4 Ethical considerations, potential benefits and harms Permission to conduct this study was received from the Research Review Board of each
participating facility for which this type of study is not considered part of usual quality assurance
activity as well as the University of Toronto Research Ethics Committee. Under the TriCouncil
agreement, recognizing there were no patient interventions associated with this study, informed
patient consent was not required.

23
Chapter 5 Results
5.1 Epidemiology of nosocomial pneumonia There were 6747 patients (5750 adult, 997 pediatric) surveyed at the 29 hospitals during the
February 2002 prevalence survey4,79. Among the 758 identified NIs (667 adult, 91 pediatric)
there were 196 NPs (175 adult, 21 pediatric) 4, 79. Nosocomial pneumonia accounted for 26% of
NIs in adults (47% of NI in critical care) and 3% of adults surveyed during the point prevalence
study had NP, making it the second most common NI. Among surgical patients, 39/2112 (1.9%)
had a NP and for medical patients this number was 47/2619 (1.8%)4. However, 72/462 critical
care patients (15.6%) had NP, making it the most common NI in those units4. The remaining 17
NPs were in trauma/burn (5), transplant (5), and hematology/oncology (7) unit patients.
Figure 1 graphically represents participation on this study. Fifteen of the 25 hospitals in the adult
point prevalence survey, all university teaching hospitals, participated in this NP retrospective
cohort study. Non-participating hospitals averaged 6 NP case per site (range 1-10). Participating
hospitals submitted data abstraction forms on 134 patients identified as having NP during the
survey. This represented 76.6% of NP identified in adults during the point prevalence survey.
Twenty patients (14 men and 6 women; mean age 65.5 years (range 37-92 years); 18 alive at
hospital discharge) were excluded from the retrospective cohort study. Subsequent review by the
local ICP deemed that eleven patients did not, in retrospect, meet criteria for NP. Among the
additional nine patients excluded, in one the pneumonia occurred >90 days after admission, in
five it was the second NP, and in three the pneumonia had its onset at a non-CNISP hospital. The
study includes 114 patients (78 men and 36 women) with NP. In all but three patients, there was
an abnormal chest radiograph supporting the diagnosis of NP. The remaining three patients met
accepted clinical criteria for NP.

24
Figure 1. Study participation
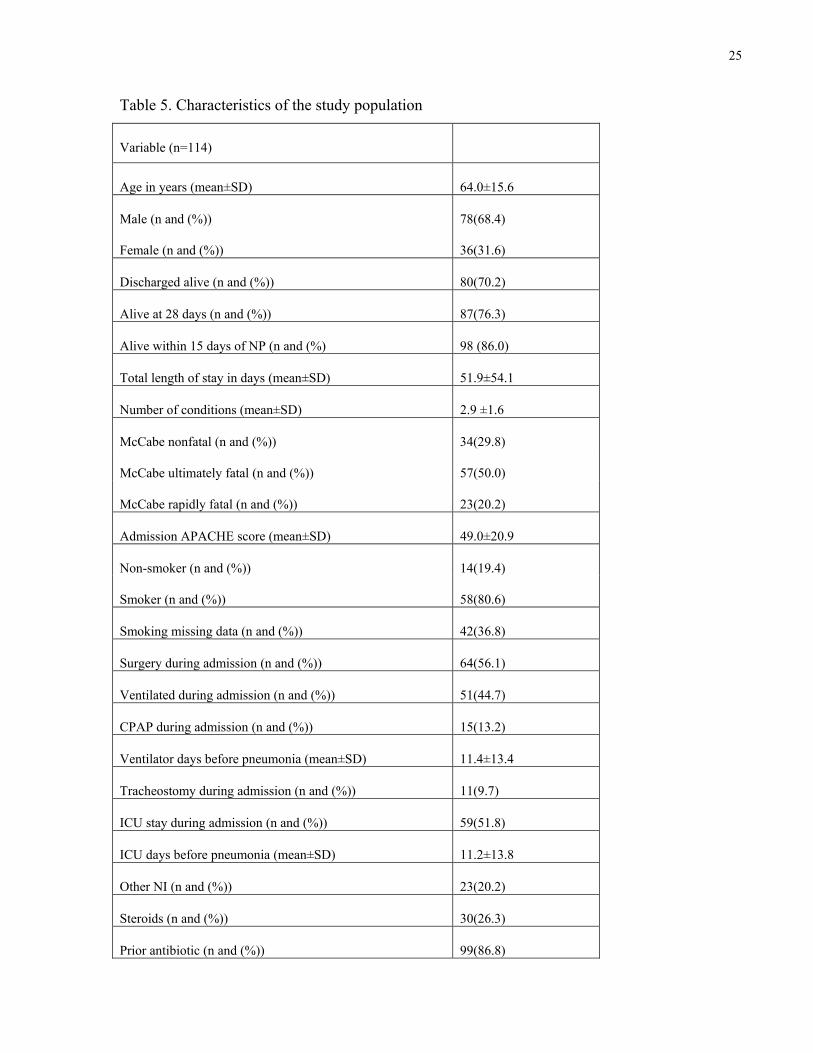
The characteristics of the study population (114 patients) are presented in Table 5. Men
constituted more than two-thirds of the study population. The majority of patients (70.2%) had a
condition that was considered ultimately or rapidly fatal. Where that information was available
(86 patients), 80.6% of the patients were smokers or ex-smokers. The vast majority of study
patients (86.8%) had received an antibiotic in the month prior to their pneumonia. Close to one
third had some form of immune suppression, due either to steroids, chemotherapy, or immune
suppressant drugs. Another NI preceded or accompanied the NP in 20.2% of patients.
5750 adults screened
667 with NI
5083 without NI
175 with NP
134 in participating
492 without NP
41 in non-
participating sites
114 study patients
20 excluded:
11 no NP
25
Table 5. Characteristics of the study population
Variable (n=114)
Age in years (mean±SD) 64.0±15.6
Male (n and (%))
Female (n and (%))
78(68.4)
36(31.6)
Discharged alive (n and (%)) 80(70.2)
Alive at 28 days (n and (%)) 87(76.3)
Alive within 15 days of NP (n and (%) 98 (86.0)
Total length of stay in days (mean±SD) 51.9±54.1
Number of conditions (mean±SD) 2.9 ±1.6
McCabe nonfatal (n and (%)) 34(29.8)
McCabe ultimately fatal (n and (%)) 57(50.0)
McCabe rapidly fatal (n and (%)) 23(20.2)
Admission APACHE score (mean±SD) 49.0±20.9
Non-smoker (n and (%)) 14(19.4)
Smoker (n and (%)) 58(80.6)
Smoking missing data (n and (%)) 42(36.8)
Surgery during admission (n and (%)) 64(56.1)
Ventilated during admission (n and (%)) 51(44.7)
CPAP during admission (n and (%)) 15(13.2)
Ventilator days before pneumonia (mean±SD) 11.4±13.4
Tracheostomy during admission (n and (%)) 11(9.7)
ICU stay during admission (n and (%)) 59(51.8)
ICU days before pneumonia (mean±SD) 11.2±13.8
Other NI (n and (%)) 23(20.2)
Steroids (n and (%)) 30(26.3)
Prior antibiotic (n and (%)) 99(86.8)

26
Variable (n=114)
Chemotherapy (n and (%)) 8(7.0)
Any immunosuppression (n and (%)) 35(30.7)
Documented HAP criteria (n and (%)) 69(60.5)
VAP (n and (%)) 40(35.1)
Service: (n and (%)): Medicine
Surgery
ICU
CCU
30(26.3)
34(29.8)
42(36.8)
8(7.0)
Secondary BSI (n and (%)) 2(1.8)
High-risk bacterium (n and (%)) 16(21.6)
Days before correct treatment (mean±SD) 0.6±1.3
Correct empiric drugs (n and (%)) 26(22.8)
Correct duration of therapy (n and (%)) 94(82.5)
Microorganism(s) covered: (n and (%))
No
Yes
N/A
U/K
6(5.3)
63(55.3)
40(35.1)
5(4.4)
Duration of treatment (n and (%)) < 8 days 20(18.4)
n= number SD = standard deviation U/K = unknown N/A = not applicable
Fifty-nine patients (51.8%) had an ICU stay (mean 11.1 days, range 0-77) and 51 patients
(44.7%) were mechanically ventilated (mean 11.38 days, range 2-77) prior to their pneumonia;
although, the pneumonia was ICU-acquired in only 36.8% and ventilator-associated in only
35.1%. Most (75.4%) of the pneumonias were late, occurring at least 4 days after admission.
Bacteremia secondary to the pneumonia was observed in only 2 NP cases (1.8%).

27
Almost all patients received an antimicrobial to treat their pneumonia. The minority of patients
(26/114; 23%) in the cohort received one of the IDSA recommended empirical agent(s).
However, the majority (82.5%) of all treated patients received an antibiotic for at least the
recommended duration. Those who were treated empirically according to IDSA guidelines
received appropriate treatment (i.e., an antibiotic that covered the causative agent) earlier than
those not given an antibiotic recommended in the IDSA guideline (0.2 days vs. 0.7 days,
p=0.005) and tended to have a higher APACHE score (55.2 vs. 47.2, p=0.09). Patients from
whom a specimen was collected were started on treatment later than those who did not have a
specimen collected (0.82 days vs. 0.15 days, p=0.001). Patients who were infected with a high
risk bacteria also had a delay in receiving appropriate treatment compared to those who did not
have such bacteria (1.86 days vs. 0.52 days, p=0.04).
There were no differences between men and women in demographic, hospital, and infection
factors apart from a greater recent use of antibiotics (p = 0.05) and number of ventilator days
before pneumonia (p=0.03) in men and a tendency for women to have fewer days in ICU before
the diagnosis of pneumonia (p=0.14).
The NP was considered an incident pneumonia in 31.6% of patients, diagnosed within 3 days of
the prevalence survey. There were no differences between patients with incident and prevalent
pneumonia (Table 6) in terms of age and number of hospital, ICU, and ventilator days before the
NP.
Table 6. Characteristics of patients with incident and prevalent pneumonia
Variable Incident n=36
Prevalent n=78
p
Age in years (mean±SD) 63.1 ± 18.8 64.4 ± 14.1 0.72
McCabe rapidly fatal, n (%)
McCabe ultimately fatal, n (%)
McCabe nonfatal, n (%)
5 (13.9)
20 (55.5)
11 (30.6)
18 (23.1)
37 (47.4)
23 (29.5)
0.51
APACHE score (mean±SD) 44.7 ± 20.6 51 ± 20.9 0.14

28
Variable Incident n=36
Prevalent n=78
p
LOS in days (mean±SD) 59.4 ± 69 48.4 ± 45.6 0.39
# days before pneumonia (mean±SD) 15.6 ± 17.8 12.7 ± 13.8 0.35
# days after pneumonia (mean±SD) 42.8 ± 64.2 34.7 ± 41.3 0.49
# ventilator days (mean±SD) 12.9 ± 13.3 10.7 ± 13.7 0.60
#ICU days (mean±SD) 13 ± 15.2 10.2 ± 13.1 0.48
# days before treatment (mean±SD) 0.2 ± 0.7 0.7 ± 1.5 0.80
n= number SD = standard deviation
A number of patients (39.5%) did not meet all the criteria required to meet the diagnosis of NP
as recorded in their hospital charts. In all but two of these patients, there was an abnormal chest
radiograph, but the additional criterion (purulent sputum or diagnostic specimen) was not
recorded as being present. There were no differences between those for whom complete criteria
were and were not recorded (Table 7).
Table 7. Characteristics of patients with and without all pneumonia criteria
Variable All criteria n=69 Not all criteria n=45 p
Age in years (mean±SD) 63.7±15.1 64.5±16.6 0.80
# of underlying conditions (mean±SD) 2.9±1.7 3.0±1.4 0.83
McCabe rapidly fatal, n (%)
McCabe ultimately fatal, n (%)
McCabe nonfatal, n (%)
15(21.7)
32(46.4)
22(31.9)
8(17.8)
25(55.6)
12(26.7)
0.60
APACHE score (mean±SD) 49.4±20.3 48.4±22 0.80

29
Variable All criteria n=69 Not all criteria n=45 p
LOS in days (mean±SD) 53.3±55.7 49.7±52.1 0.73
# days before pneumonia (mean±SD) 14.7±17.7 11.9±10.1 0.29
# days after pneumonia (mean±SD) 37.6±49.8 36.8±49.8 0.94
# ventilator days (mean±SD) 12.0±15.1 10.0±8.6 0.56
#ICU days (mean±SD) 11.8±15.4 9.8±9.8 0.56
# days before treatment (mean±SD) 0.6±1.2 0.6±1.4 0.92
n= number SD = standard deviation
A respiratory specimen was obtained on 64.9% of patients (93% of VAP and 50% of non-VAP
patients; p <0.0001), and 67.6% of them were on antibiotics when the specimen was taken.
Patients from whom a specimen was taken did not have a greater number of days in hospital or in
ICU before the NP. Patients from whom a specimen was obtained tended to have a higher
APACHE score (p=0.14) and have a longer period of time before appropriate therapy was started
(p=0.0013).
The microorganisms isolated from patients in this study are found in Table 8. S.aureus and
P.aeruginosa were the most frequently isolated pathogens. P.aeruginosa was never found in
early NP, but found in both VAP and non-VAP. Enterobacteriaceae, Gram negative afermenters
and MRSA were almost exclusively seen in late NP and MSSA seen equally in early and late
NPS. Non-pathogens included Candida species, coagulase-negative staphylococci, and
enterococci.

30
Table 8. Microbiology of nosocomial pneumonia according to nosocomial pneumonia type Microorganism VAP Non-VAP Early Late
S.aureus
MSSA
MRSA
10
7
3
7
6
1
6
6
0
11
7
4
P.aeruginosa 6 7 0 13
H.influenzae 5 3 4 4
K.pneumoniae 2 3 1 4
E. coli 0 3 0 3
Other enterobacteriaceae 6 3 0 9
Other afermenters 4 0 0 4
S.pneumoniae 1 1 0 2
Non-pathogens 3 10 4 9
Other 4 3 1 6
A high-risk bacterium was present in 21.6% of patients (Table 9). Individuals with a high-risk
microorganism experienced a longer time to initiation of appropriate antimicrobial therapy. They
also tended to be older, have a higher APACHE score, and have more pre-pneumonia hospital,
ventilator, and ICU days (not statistically significant).
Table 9. Characteristics of patients with and without a high-risk bacterium
Variable High-risk bacterium n=16
No high-risk bacterium n=58
p
Age in years (mean±SD) 66.4±12.2 60.2±17.0 0.18
LOS in days (mean±SD) 65.8±47.0 57.8±63.3 0.64
# days before pneumonia (mean±SD) 21.7±24.2 12.3±13.7 0.15
# days after pneumonia (mean±SD) 43.1±32.7 44.5±60.8 0.90
# ventilator days (mean±SD) 18.3±20.2 9.0±10.0 0.15

31
#ICU days (mean±SD) 20.9±23.1 8.1±8.0 0.08
Variable High-risk bacterium n=16
No high-risk bacterium n=58
p
Apache score (mean±SD) 57.8±21.8 49.9±20.4 0.18
# days between pneumonia & survey (mean±SD)
8.3±7.7 7.2±6.1 0.55
# days before treatment (mean±SD) 1.9±2.1 0.5±1.3 0.04
n= number SD = standard deviation
The 15-day, 28-day, and discharge mortality rates, were 14.0%, 23.7%, and 29.8% respectively,
with most deaths (79.4%) within 28 days of NP. There was no difference in 28-day mortality for
patients with (18%) and without (26%) VAP (RR= 1.49 (95% CI 0.68-3.23; p=0.30) or with
(20%) and without ICU/CCU admission (26.6%) (RR= 1.09 (95% CI 0.89-1.33; p=0.50). Non-
ICU NP accounted for 63% of deaths.
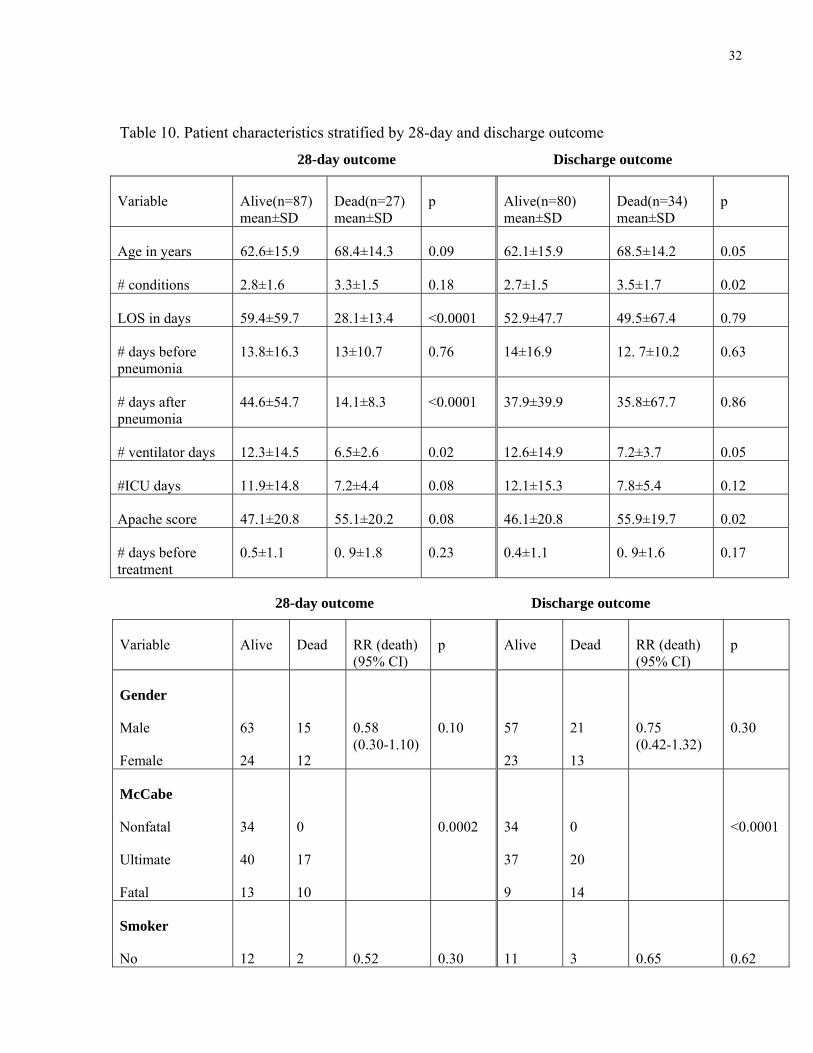
5.2 Predictors for survival On univariate analysis (Table 10), survival was significantly associated with a more favourable
McCabe score, surgery, ICU admission, non-medicine service, absence of a high-risk
microorganism, and greater number of ventilator days prior to NP. Survival tended
(0.05<p≤0.10) to be associated with younger age, male gender, lower APACHE, more days in
ICU before NP, absence of a secondary bacteremia, and having a respiratory specimen taken.
There was no survival difference between those who did and did not receive the IDSA
recommended empiric antibiotics and duration of treatment78. Appropriate antibiotic therapy
was started earlier in survivors than non-survivors, although this did not meet statistical
significance (0.5 ± 1.1 vs. 0.9 ± 1.8 days, p=0.23).
32
Table 10. Patient characteristics stratified by 28-day and discharge outcome
28-day outcome Discharge outcome
Variable Alive(n=87) mean±SD
Dead(n=27) mean±SD
p Alive(n=80) mean±SD
Dead(n=34) mean±SD
p
Age in years 62.6±15.9 68.4±14.3 0.09 62.1±15.9 68.5±14.2 0.05
# conditions 2.8±1.6 3.3±1.5 0.18 2.7±1.5 3.5±1.7 0.02
LOS in days 59.4±59.7 28.1±13.4 <0.0001 52.9±47.7 49.5±67.4 0.79
# days before pneumonia
13.8±16.3 13±10.7 0.76 14±16.9 12. 7±10.2 0.63
# days after pneumonia
44.6±54.7 14.1±8.3 <0.0001 37.9±39.9 35.8±67.7 0.86
# ventilator days 12.3±14.5 6.5±2.6 0.02 12.6±14.9 7.2±3.7 0.05
#ICU days 11.9±14.8 7.2±4.4 0.08 12.1±15.3 7.8±5.4 0.12
Apache score 47.1±20.8 55.1±20.2 0.08 46.1±20.8 55.9±19.7 0.02
# days before treatment
0.5±1.1 0. 9±1.8 0.23 0.4±1.1 0. 9±1.6 0.17
28-day outcome Discharge outcome
Variable Alive Dead RR (death) (95% CI)
p Alive Dead RR (death) (95% CI)
p
Gender
Male
Female
63
24
15
12
0.58 (0.30-1.10)
0.10
57
23
21
13
0.75 (0.42-1.32)
0.30
McCabe
Nonfatal
Ultimate
Fatal
34
40
13
0
17
10
0.0002
34
37
9
0
20
14
<0.0001
Smoker
No
12
2
0.52
0.30
11
3
0.65
0.62

33
Yes 42 16 (0.13-2.00)
39 19 (0.22-1.90)
Variable Alive Dead RR (death) (95% CI)
p Alive Dead RR (death) (95% CI)
p
Surgery
No
Yes
32
55
18
9
2.56 (1.26-5.20)
0.006
27
53
23
11
2.68 (1.45-4.96)
0.0008
Ventilated
No
Yes
45
42
18
9
1.62 (0.80-3.29)
0.17
41
39
22
12
1.48 (0.82-2.70)
0.19
ICU admission
No
Yes
37
50
18
9
2.15 (1.05-4.37)
0.03
34
46
21
13
1.73 (0.96-3.11)
0.06
Other NI
No
Yes
70
17
21
6
0.88 (0.40-1.94)
0.76
66
14
25
9
0.70 (0.38-1.29)
0.27
Steroid
No
Yes
67
20
17
10
0.61 (0.31-1.18)
0.15
63
17
21 13
0.58 (0.33-1.00)
0.06
Prior antibiotic
No
Yes
10
77
5
22
1.50 (0.67-3.36)
0.35
10
70
5
29
1.14 (0.52-2.48)
1.00
Chemotherapy
No
Yes
82
5
24
3
0.60 (0.23-1.58)
0.60
76
4
30
4
0.57 (0.27-1.21)
0.37
Immunosupp
No
Yes
80
7
27
0
4.07 (0.27-60.8)
0.29
73
7
34
0
5.11 (0.34-75.89)
0.18

34
Variable Alive Dead RR (death) (95% CI)
p Alive Dead RR (death) (95% CI)
p
Incident HAP
No
Yes
59
28
19
8
1.10 (0.53-2.26)
0.80
54
26
24
10
1.11 (0.59-2.07)
0.75
Early HAP
No
Yes
63
24
23
4
1.87 (0.71-4.95)
0.18
58
22
28
6
1.52 (0.70-3.29)
0.26
Met NP criteria
No
Yes
32
55
13
14
1.42 (0.74-2.74)
0.29
29
51
16
18
1.36 (0.78-2.38)
0.28
Service
Med
Surg
ICU
CCU
16
31
35
5
14
3
7
3
0.002
13
30
32
5
17
4
10
3
0.0009
VAP
No
Yes
54
33
20
7
1.54 (0.72-3.34)
0.25
49
31
25
9
1.50 (0.78-2.90)
0.21
Secondary BSI
No
Yes
87
0
25
2
0.22 (0.16-0.32)
0.09
80
0
32
2
0.29 (0.21-0.38)
0.16
Spec. taken
No
Yes
27
60
13
14
1.72 (0.90-3.29)
0.10
26
54
14
20
1.30
(0.74-2.28)
0.37

35
Variable Alive Dead RR (death) (95% CI)
p Alive Dead RR (death) (95% CI)
p
Risk bacteria
No
Yes
49
10
9
6
0.41 (0.17-0.99)
0.05
45
8
13
8
0.45 (0.23-0.89)
0.03
IDSA treated
No
Yes
65
22
23
4
1.70 (0.65-4.47)
0.26
59
21
29
5
1.71 (0.74-3.98)
0.18
IDSA duration
No
Yes
U/K
13
70
4
3
24
0
0.44
12
64
4
4
30
0
0.36
Bacteria covered
No
Yes
U/K
5
51
28
1
12
12
0.47
5
45
27
1
18
13
0.82
# treatment days
<5
5-7
8-14
>14
2
11
49
20
3
4
16
4
0.24
2
10
44
19
3
5
21
5
0.36
n= number SD = standard deviation U/K = unknown N/A = not applicable
Variables entered into the first multivariable analysis model were age, gender, McCabe score,
APACHE score, surgery, ICU admission, service type, whether a specimen was taken, and
number of days before appropriate antimicrobial treatment was initiated. Although the presence

36
of secondary bacteremia was statistically associated with 28-day mortality (p=0.09), there were
only 2 bacteremias and the model used to investigate this variable showed questionable fit.
Bacteremia was therefore not included in the final model. Variables in the second model were
McCabe score, surgery, ICU admission, service, and number of days before adequate treatment
started. Both models were run with and without the presence of the high-risk bacteria variable.
On multivariable analysis that included the high-risk bacteria variable in the analysis (Table 11),
the only predictors for survival were lower McCabe score (RR 0.24; 95% CI 0.08-0.67, p=0.006)
and earlier treatment with an appropriate antibiotic (RR 0.68; 95% CI 0.46-1.00, p=0.05). On
multivariable analysis that excluded the high-risk bacteria variable (Table 12), predictors for
survival were lower McCabe score, male gender, and ICU admission. There were no interactions
with age, APACHE score, whether a specimen was collected, or the presence of a high-risk
bacterium. None of the analyses where other variations of the McCabe score were entered as
independent variables had a good fit for the models tested.
Table 11. Results of multivariable analysis (including risk bacteria variable)
parameter DF estimate standard
error
Wald chi-
square
Pr > chi-
square
OR 95% Wald
CL
Intercept 1 4.8387 1.3561 12.7311 0.0004
Pretreatment
days
1 -0.3869 0.1963 3.8833 0.0488 0.679 0.462 0.998
McCabe score 1 1.4412 0.5290 7.4232 0.0064 0.237 0.084 0.667

37
Table 12. Results of multivariable analysis (excluding risk bacteria variable)
parameter DF estimate standard
error
Wald chi-
square
Pr > chi-
square
OR 95% Wald
CL
Intercept 1 4.9169 1.508 18.2556 <0.0001
Sex 1 -1.2311 0.5489 5.0309 0.0249 0.292 0.100
0.856
McCabe score 1 -1.8902 0.5026 14.1415 0.0002 0.151 0.056
0.4051
ICU 1 1.6 070 0.5952 7.2898 0.0069 4.988 1.553
16.016

38
Chapter 6 Discussion
6.1 Study findings
6.1.1 Prevalence of nosocomial pneumonia
During the Canadian Point Prevalence Survey in February 2002, 10.5% of hospitalized adults
had at least one NI, of which 26% were reported to be NP, indicating a NP prevalence rate of 3%
in the hospitalized adults surveyed. The prevalence of NI was higher in critical care units (33%)
where 15.6% of patients had NP. In the critical care setting, NP accounted for 47.1% of all NIs.
The prevalence rate of NP in surgical patients was 1.9%; and in medical patients it was 1.8%.
There is very little literature from which we can draw comparisons. Most NI studies are
incidence studies, in contrast to this point prevalence survey. Eggiman et al demonstrated that the
method of reporting VAP rates has a significant impact on risk estimates80. Hence, it is
important that rates not be directly compared when methodologies differ. However, a similar 1-
day point prevalence survey among European ICUs in 1992 found that 20.6% of 10,038 patients
had an ICU-acquired infection and that 46.9% of these infections were NP10. The proportion of
NIs accounted for by NP are highly comparable in the European and Canadian studies 4,10. An
incidence study in a single Scandinavian mixed medical and surgical ICU in 2002 found that
VAP and other nosocomial lower respiratory tract infections accounted for 53.8% of ICU-
acquired NIs, with 23.9% of patients who had been in the ICU for at least 48 hours developing a
NI12.
Our higher overall critical care NI rate could be related to two factors. In the European study,
there is no indication that patients in the ICU for less than 48 hours were excluded. If this were
the case, that study would have included patients who, by definition, are not at risk of NI,
thereby incorrectly deflating the infection risk. In contrast, our study explicitly included only
patients who had been in a critical care unit for at least 48 hours. The other factor to consider
when comparing the Canadian point prevalence study results with incidence studies is that
prevalence rates tend to overestimate risk in comparison to incidence rates.

39
In terms of non-critical care patients, the only prevalence study found in the literature review was
one conducted in 72 German hospitals in 199417. Comparing rates, our prevalence was somewhat
higher (1.8% vs. 0.51% in medical patients and 1.9% vs. 0.26% in surgical patients). However,
the German study included all patients, regardless of duration of hospitalization, which could
have resulted in a factitiously low prevalence rate.
Overall, comparing results from the Canadian point prevalence survey with these other studies
suggests that our hospitals have a similar experience in terms of NP rates.
6.1.2 Characteristics of the Study Population
A number of studies have described the characteristics of patients who develop NP and identified
risk factors for its occurrence. Findings have been summarized in several review articles 81-83.
The results in the various publications have sometimes been inconsistent, no doubt reflecting the
patient populations and specific potential risk factors examined, variable definitions and
diagnostic criteria for NP, and different sample sizes and analytical methods.
Table 2 summarizes the various factors that have been reported as representing independent risks
for acquiring NP. Several themes emerge. Some risk factors for NP that have been identified are
patient demographic factors that cannot be modified, such as male gender 84,85, increasing age 44,47,63, and advanced severity of illness44,54,63,86. Certain underlying medical or surgical
conditions and their treatments, which may or may not be modifiable, may also increase the risk
for NP. These include neurologic conditions 32, 47,85,87,88, impaired airway reflexes17,37,85,87 ,
surgery17,35,89,90, chronic lung disease17,45,47, ARDS 91, and use of gastric-pH altering
agents32,34,46,85,89,92. By far the most consistently reported risk factors, however, are
intubation/mechanical ventilation19,45,47, 66,86,87,90 and reintubation45,46,84. While the prior receipt
of antimicrobials44,93 has been identified as a risk factor for NP, other studies have found it to
have a protective effect19,37.
There was a disproportionate number of men (68.4%) compared to women (31.6%) in this
retrospective cohort study of patients with NP. Although the study was not designed to identify
risks for NP, this observation suggests that men are at higher risk, a phenomenon that has been
observed previously84, 85, 94. The average ages for men and women in this study were similar
(64±15.6 years vs. 65±17 years).

40
The characteristics of our cohort reflect what one would associate with a generally sicker
hospitalized population of patients. They tended to have a number of underlying co-morbidities
(mean 3± 1.6) and the majority (70.2%) had an ultimately or rapidly fatal condition on
admission. Where smoking information was available, 80.6% were current or ex-smokers. This
is somewhat higher than a 2005 Government of Canada survey that found that 68% of
respondents to the Canadian Community Health Survey (n=65,000) who were aged ≥ 55years
self-identified as a smoker or former smoker (http://www4. hrsdc.gc.ca/ .3ndic.1t.4r@-
eng.jsp?iid=12; accessed December 12, 2010), and likely reflects that these individuals are at
higher risk for a number of chronic medical conditions, which in all likelihood also increase their
risk of developing NP. Almost one-third (30.7%) were immune suppressed as a consequence of
medical therapy, almost half (44.7%) had been ventilated during their admission, and just over
half (51.8%) had spent some time in the ICU. The average number of days ventilated and in the
ICU prior to the onset of NP was approximately 11 days.
6.1.3 Pneumonia factors
ICU-acquired NP and VAP constituted a considerable proportion of the NI cohort, representing
36.8% and 35.1% of NP cases. However, almost two-thirds of NP cases were not associated with
mechanical ventilation. Thus, while ventilated patients may be at the greatest risk for NP, from
an overall perspective, non-ventilator associated NP may pose as great a burden to the health
care system as VAP, and its occurrence and prevention warrant further study.
NP in our study occurred almost equally among medical and surgical patients. This is in contrast
to other studies that suggest that NP is more common on surgical services5,7 and the point
prevalence study that showed medical patients to be at a lower overall risk of NI4, but similar to
the findings of Greenaway et al67 who evaluated NP in patients on general medicine and surgery
wards. Given that prevalence studies tend to identify disease in patients with longer hospital
stays, and medical patients tend to experience greater lengths of stay than surgical patients, the
nature of our sampling population may spuriously explain the higher frequency of NP seen in
medical patients. On the other hand, this observation may represent a true risk and point to the
need to reconsider the risk to medical patients of acquiring a NP.

41
A respiratory specimen was obtained from 64.9% of patients. Given the difficulty in obtaining
respiratory tract specimens on patients who are not intubated, it is not unexpected that specimens
were not obtained from all patients. A high proportion of patients (67.6%) were on antibiotics
when the specimen was taken. Findings from the literature have shown that patients receiving
antibiotic therapy at the time of specimen collection are more likely to grow a Gram-negative
than a Gram-positive bacterium 23, 63, 91, 93. It is therefore difficult to know how reliably the
culture result reflects the true etiologic agent(s), and whether the microorganisms isolated are
pathogens or colonizers that have arisen as a result of the antimicrobials. The microorganisms
isolated from patients in this study, and their occurrence with early or late NP, reflects findings
in the published literature. There was a preponderance of Gram negative bacteria among the
isolates, which were seen primarily in late NP.
A high-risk bacterium (defined as MRSA, Acinetobacter sp, or P.aeruginosa) was present in
21.6% of patients who had a respiratory tract specimen collected for culture. These patients
tended to be older, have a higher Apache score, and have more pre-pneumonia hospital,
ventilator, and ICU days. This is in keeping with the many studies showing that MRSA and P.
aeruginosa are the predominant pathogens in later onset VAP 19,43,57,66,68,91,93. Similar to these
other studies, a large proportion of our patients had received antimicrobials within a month of
their pneumonia, which in all likelihood contributed to the presence of more resistant bacteria,
the more susceptible bacteria having been eradicated by the earlier course(s) of antimicrobials. It
is instructive to note that it took longer to start patients with a high-risk bacterium on appropriate
antibiotics, suggesting that clinicians underestimated the occurrence of these microorganisms,
were not familiar with factors predictive of their presence, and/or discounted these
microorganisms as colonizers and not pathogens for the patient in question. It is also interesting
to note that patients from whom a specimen was collected had a delay in the initiation of
antimicrobial therapy that appropriately covered the isolated bacteria. While this may have been
entirely a definition phenomenon, it may point to a general under-appreciation of the potential
presence of high-risk bacteria in patients with NP. This is an important finding for clinicians and
one worth emphasizing since these high-risk bacteria22,27,47,51,63,68,95,96 and delayed effective
treatment26,45,47,62,64,97,98 are both associated with a poorer prognosis.

42
Only two patients (1.8%) in this study developed bacteremia secondary to NP. In the literature
the occurrence of bacteremia secondary to NP ranges from 0-16.7% of cases20,30,32,35,46,55,67,98
Secondary bacteremia has been identified as a risk factor for death in some studies30,46,72, but not
in others67,98. It remains to be determined whether the presence of bacteremia secondary to NP
provides prognostic information and assists in optimizing antimicrobial therapy where
respiratory tract specimens have not been obtained or are culture negative.
Less than one-fifth of patients were treated with a short-course (≤ 7 days) of antimicrobials, a
strategy supported by the current IDSA treatment guidelines78. These guidelines were published
after this study was conducted, and so adherence to their recommendations cannot be evaluated.
However, our finding of a tendency to use longer courses of antimicrobial therapy for NP
suggests that there is substantial opportunity for decreasing antimicrobial use by shortening the
course of therapy to that recommended in the IDSA guidelines. It will be interesting whether, in
the future, shorter antimicrobial courses for NP become standard practice in Canada.
6.1.4 Nosocomial pneumonia outcomes
The overall 28-day mortality rate in this study was 23.7%. This is similar to the findings of an
earlier study in Manitoba30 in which 25% of patients with NP (the ICU/non-ICU breakdown was
not provided) died and considerably lower than the 48.5% mortality reported from a single
hospital in Taiwan64. This difference could well be accounted for by different patient populations
and risk factors. The lower mortality in our study could also be attributed to the methodology.
Prevalence surveys may underestimate the death rate because they include both existing and new
cases. Survival has already been demonstrated in existing cases. This possibility is underscored
by the presence in this cohort of patients with NP onset more than 2 weeks prior to the survey. It
is likely that most, if not all, of these 5 patients were actually recovered from their pneumonia
despite the persistence of antimicrobial therapy. Most deaths (79.4%) occurred within 28 days of
the NP. On the other hand, fewer than half of the deaths (47.1%) occurred within 15 days of the
NP. This supports our decision that 28-day survival represents a reasonable endpoint at which to
measure outcomes.
The 26% mortality rate for VAP that we found is lower than that generally reported in the
literature, which ranges from 25.1-58%20,22, 32,35,43,44,51-3,56,94, and did not significantly exceed the

43
mortality rate of 18% for non-VAP NP seen in this cohort. While the published reported
mortality rates (6.5%-36.5% 28,31,61,67) for non-ICU NP tend to be lower than those associated
with VAP, it is obvious that a considerable range exists, one that overlaps with the mortality
from VAP NP. We would hypothesize that similar NP mortality rates in non-VAP and VAP
subgroups reflect a situation where patients outside of ICU have almost the same extent and
severity of underlying illness as patients in ICU. It may also be that the non-VAP patients were
not considered candidates for ICU care, and therefore received less aggressive supportive care
for their NP. This hypothesis is supported by the finding that ICU care was associated with
improved survival on univariable analysis, and on multivariable analysis where infection with
high-risk bacteria was not included as an independent variable. This study did not collect
information on resuscitation status. While the most likely reason for our inability to find a
mortality difference between VAP and non-VAP in this study is insufficient power (less than
50% with the mortality rates observed), it may be that there are no mortality differences between
ICU and non-ICU NP, and that NP in the non-ICU setting warrants further attention.
Even though the mortality rate in this study might be considered relatively low compared to that
reported in the literature, the average length of hospital stay was long (mean of 59 days), similar
to other studies’ findings9,22,29,37,56,64. The majority of the hospital stay (75% for survivors and
50% for non-survivors) was accounted for by post-NP days. This is in keeping with the
literature, which generally is in agreement that NP prolongs hospital stay, thereby contributing to
the burden of illness9,22,29,55-57,99.
6.1.5 Predictors of nosocomial pneumonia survival
While a number of patient factors associated with death were identified on univariable analysis,
only one of these, the McCabe score, remained significant on multivariable analysis that
included high risk bacteria as an independent variable. This is in keeping with studies that have
identified a number of different factors that may be associated with a poorer outcome, factors
that may not bear out on multivariable analysis or be confirmed from study to study.
A staggering proportion (86.8%) of patients received an antibiotic in the month prior to their
pneumonia. In the absence of a control group, we do not know whether our study population
received disproportionately more antimicrobial therapy than the general hospitalized patient

44
population. Neither do we know what the indications for these antibiotics were. What appears to
be an excessive use of antibiotics may reflect a group of patients whose underlying illnesses
required antibiotic treatment or prophylaxis and put them at risk of NP. Whatever the reason for
prior antibiotic use, in addition to increasing the risk of NP with high-risk or other multi-resistant
microorganisms23,66,91,93, prior antibiotic use has been shown to increase the risk of NP-
attributable death23. The extent to which antibiotics contribute to this increased mortality risk,
independent of other host factors, through a mechanism of facilitating colonization by high-risk
microorganisms remains to be investigated. We were unable to identify prior use of antibiotics as
a mortality risk factor, no doubt related to their widespread use.
Only 23% of patients in our study received the IDSA recommended empirical antibiotic
therapy78. In many instances this was related to patients receiving only one agent when two
should have been given according to the IDSA guideline. However, failure to receive the
recommended empirical agents was not associated with a poorer outcome in our study. This is in
keeping with the premise that two active agents are not required to treat most infections, and
hence survival is not improved by using two antibacterials when one appropriate agent will do.
In our study, a microorganism that was not susceptible to the prescribed antimicrobial was
isolated in only 8.8% of cases where that information was available. It appears that most
antimicrobials selected on an empirical basis proved to be active against the pathogens isolated.
Delay in initiating appropriate antimicrobial therapy was associated with higher mortality risk on
multivariable analysis that included high risk bacteria as an independent variable. On the other
hand, in multivariate analysis where observations were not limited to patients where the presence
or absence of a high risk bacterium was known, the time to appropriate antimicrobial therapy
was no longer a predictor of survival. It is interesting to hypothesize from this observation that
early initiation of appropriate therapy is most important in the presence of pathogens that are
likely to be associated with a poorer outcome. Other studies have identified the importance of
timely initiation of antibiotics in critically ill patients. Luna et al in their study of VAP found that
the mortality rate was reduced when the initial empirical antibiotic therapy was active against the
microorganisms grown from a BAL sample26. These findings were confirmed by Lee et al, who
demonstrated that the benefit of appropriate initial empiric therapy held, even when therapy was
later modified to ensure appropriate coverage64. Furthermore, Zavascki et al found that
appropriate therapy improved the likelihood of survival in patients with hospital-acquired

45
P.aeruginosa pneumonia97. Similar findings of poorer prognosis where an inappropriate
antimicrobial therapy was initially used, or conversely, an improved outcome where an
appropriate initial therapy was administered have been demonstrated by other
investigators45,47,54,62,94,98. Appropriate empirical therapy is a prognostic factor that warrants
enhanced recognition. The observation that age and APACHE III score were not predictors of
fatal outcome suggests that with appropriate therapy even elderly and acutely, severely ill
patients may be cured of NP. There have been recent publications that demonstrate the benefit
of pre-printed orders and/or standardized care pathways for patients with sepsis100,101. No doubt
patients with NP would benefit from such a strategy given the importance of prompt initiation of
appropriate initial antimicrobial therapy.
6.2 Limitations There are several potential limitations that could cause the results of the study to be influenced
through bias, confounding, or chance. The limitation of greatest concern is sample size. It is
recommended that the sample size for multiple regression analysis be considerably more (5-10
times more) than the number of variables102. Our inability to identify additional mortality risk
factors on multivariable analysis is likely related, in part, to the small sample size. The number
of variables entered into the regression analyses in this study ranged from 5-11 and the number
of observations on which the analyses were performed ranged from 37-54, depending on the
variables included. Several of the models tested were of poor or questionable fit, likely due to the
small sample size for the number of variables tested. As a result, the relative contributions of the
individual components of the McCabe score could not be tested in multivariate analysis. At 114
patients in total, we are likely underpowered to identify small, but clinically significant,
differences in factors that predict survival.
Selection bias may have been introduced if participating centres and their patients differ
systematically from non-participating centres, by virtue of higher (or lower) NP rates related to
site-specific risk factors. We have no reason to believe that this was the case for the CNISP
participating hospitals. Additionally, the patients included in this study represented 76% of the
entire NP cohort.
Another potential limitation was the nature of the methodology, and hence of the cohort. In a
prevalence survey, there is concern that patients who have survived will outnumber those who

46
have not survived and thereby bias the survival analysis. In our study, almost one third of the
patients had their NP onset within 3 days of the survey. However, there were outliers, with 5
patients having the onset of their pneumonia more than 2 weeks before the survey. There were
no demographic or outcome differences between patients with prevalent and incident NP,
suggesting that this factor did not play a role and that prevalence surveys give an accurate
reflection of the impact of NP.
Another potential limitation was the precision of the pneumonia diagnosis and, hence, for our
study, including patients who really did not have pneumonia (misclassification bias). The
questionable ability to accurately diagnose NP has long been recognized in terms of both
surveillance and clinical management. In this study, patients included in the cohort were
identified with NP during the course of a single day point prevalence survey. With detailed chart
data abstraction, not all of the patients were subsequently verified to meet criteria for the
surveillance definition of pneumonia. In the vast majority of instances this was because there
was no purulent sputum or appropriate confirmatory diagnostic specimen to accompany an
abnormal chest radiograph. It is well recognized that many patients with pneumonia are unable
to produce sputum, secondary bacteremia and empyema are uncommon, and the invasive
diagnostic techniques required to support a surveillance definition are not routinely performed.
This suggests that the surveillance criteria in use at the time of the prevalence survey would
misclassify a number of patients with bona fide NP. In our study, the clinical features and
outcomes of patients who did not meet all the criteria for diagnosis of NP were similar to those
of NP patients who did meet the criteria. Given the lack of a validated gold standard for NP
diagnosis and the rigor with which charts of patients suspected to have NP were reviewed, taking
into account clinical course and response to antimicrobial therapy, it is felt that all patients
included in this case cohort study had similar likelihood of NP. As noted in the literature review,
similar mortality risk has been attributed to suspected and confirmed VAP, and there may be less
misclassification than previously thought26. Alternatively, these 2 subpopulations experience
similar mortality related to factors other than the presence of NP. Including patients who did not
have NP would have impacted negatively on our ability to identify prognostic indicators for
survival.
The potential for observer bias is felt to be relatively low. The exposure had already been
determined, well in advance of assessing the outcome or posing the question to be addressed by

47
this study. The outcome of mortality at 4 weeks is objective. It is possible that collection of
information other than exposure and outcome could have been affected by observer bias that
could influence data abstractors in the completeness and accuracy of data collection. We
employed several strategies to minimize this. The first was that the data abstractors were not
aware of specific prognostic factors that were being investigated. Standard definitions were used
and the ICPs were trained to complete the questionnaire in the same manner and with the same
care for all the study subjects. Comparability of data collection was evaluated by examining the
frequency with which observations were made and the degree of completeness and detail of the
observations for both survivors and non-survivors.
Confounding was addressed through multivariable analyses. It is possible that some potential
confounding factors remain unrecognized, although that is unlikely given the number and variety
of published studies.
The validity and reliability of the predictor variables may pose a problem. This relates primarily
to the nature of chart reviews, where we are reliant on data that has been obtained and recorded
by individuals who have generally not collected the information using standard definitions and
interview techniques. However, many previous studies have used the same or similar predictor
variables as markers of patient risk. The questionnaires were reviewed in detail by the PI to
determine completeness, as a surrogate for accuracy.
Finally, even if the findings from this study are valid, they may not be generalizable to all
Canadian hospitals. The majority of CNISP hospitals are large, tertiary care teaching centres,
which are not representative of most Canadian hospitals. While these hospitals are not
representative of hospitals throughout Canada, it is expected that the patients are representative
of patients in secondary and tertiary care hospitals. It is difficult to predict whether rates in other
situations might be higher or lower than in this study. However, the message of prompt initiation
of appropriate antibiotics is likely to apply generally.

48
Chapter 7 Summary of Key Findings and Recommendations
7.1 Key findings • The prevalence of NP, defined as development of pneumonia 48 hours or more post-
admission, in adults in hospitals participating in the CNISP appears similar to rates
reported in the literature
• A high proportion of patients with NP have more than 1 co-morbid illness, and have a
rapidly or ultimately fatal underlying illness, supporting the notion that these types of
patients are at increased risk for a nosocomial infection and death
• While ICU patients are at higher risk for NP than non-ICU patients, NP in non-ICU
patients accounts for the larger proportion of these infections in the hospitalized
population
• Patients infected with a ‘high risk’ microorganism reflected findings in the literature:
they tended to be older, have higher APACHE III scores, and longer hospitalization,
ICU, and ventilator-days; and experienced delayed administration of effective
antimicrobial therapy
• There was a very high rate (86.8%) of recent prior antimicrobial use in this cohort, a
variable that the literature suggests is associated with an increased risk of infection
with a ‘risk’ microorganism and higher mortality
• Delayed initiation of appropriate antimicrobial therapy was associated with poorer
outcome in multivariable analysis
7.2 Recommendations • NP prevalence rates identified during the 2002 point prevalence survey could be used
as benchmark rates for similar Canadian acute care hospitals, limitations inherent to
prevalence studies support the need to conduct incidence surveys to allow calculation
of incidence density rates, which better reflect risk.

49
• Further research should reexamine the impact of NP in non-ICU hospital settings, and
investigate risk factors for both its occurrence and outcome in this specific setting
• Physicians should be aware of local trends in nosocomial microorganisms and their
susceptibility patterns, as well as in their hospitals and patient populations, and use
that knowledge to promptly prescribe appropriate empiric therapy for NP
• Hospitals should identify mechanisms whereby information regarding
contemporaneous microorganisms and their susceptibility patterns is readily
available to physicians
• Strategies and/or interventions that result in the timely administration of appropriate
antimicrobial therapy should be investigated

50
References 1. Jarvis WR. Selected aspects of the socioeconomic impact of nosocomial infections:
morbidity, mortality, cost, and prevention. Infect Control Hosp Epidemiol 1996; 17:552-
7.
2. Plowman R, Graves N, Griffin MAS, Roberts JA, Swan AV, Cookson B, Taylor L. The
rate and cost of hospital-acquired infections occurring in patients admitted to selected
specialties of a district general hospital in England and the national burden imposed. J
Hosp Infect 2001; 47:198-209.
3. Reilly J, Stewart S, Allardice GA, et al. Results from the Scottish National HAI
Prevalence Survey. J Hosp Infect 2008; 69: 62-8.b.
4. Gravel D, Taylor G, Ofner M, et al. Point prevalence survey for healthcare-associated
infections within Canadian adult acute-care hospitals. J Hosp Infect 2007; 66:243-8.
5. CDC. Nosocomial infection surveillance, 1984. MMWR 1986; 35(SS-1): 17-29.
6. Kislak JW, Eickhoff TC, Finland M. Hospital-acquired infections and antibiotic usage in
the Boston City Hospital – January, 1964. N Engl J Med 1965; 271:834-5.
7. Haley RW, Culver DH, White JW, Morgan WM, Emori TG. The nationwide nosocomial
infection rate. A new need for vital statistics. Am J Epidemiol 1985; 121:159-67.
8. Wenzel RP, Osterman CA, Hunting KJ. Hospital-acquired infections. II. Infection rates
by site, service, and common procedures in a university hospital. Am J Epidemiol 1976;
104:645-51.
9. Peng MM, Kurtz S, Johannes RS. Adverse outcomes from hospital-acquired infection in
Pennsylvania cannot be attributed to increased risk on admission. Am J Med Qual 2006;
21:17S-28S.

51
10. Vincent JL, Bihari DJ, Suter PM, et al for the EPIC International Advisory Committee.
The prevalence of nosocomial infection in intensive care units in Europe. Results of the
European prevalence of infection in intensive care (EPIC) study. JAMA 1995; 274:639-
44.
11. Legras A, Malvy D, Quinioux AI, et al. Nosocomial infections: prospective survey of
incidence in five French intensive care units. Intensive Care Med 1998; 24:1040-6.
12. Ylipalosaari P, Ala-Kokko TI, Laurila J, Ohtonen P, Syrjälä H. Epidemiology of
intensive care unit (ICU)-acquired infections in a 14-month prospective cohort study in a
single mixed Scandinavian university hospital ICU. Acta Anaesthesiol Scand 2006;
50:1192-7.
13. Leblebicioglu H, Rosenthal VD, Arikan �A, et al. Device-associated hospital-acquired
infection rates in Turkish intensive care units. Findings of the International Nosocomial
Infection Control Consortium (INICC). J Hosp Infect 2007; 65:251-7.
14. Daschner F, Nadjem H, Langmaack H, Sandritter. Surveillance, prevention and control of
hospital-acquired infections III. Nosocomial infections as cause of death: retrospective
analysis of 1000 autopsy reports. Infection 1978; 6:261-5.
15. Gross PA, Van Antwerpen C. Nosocomial infections and hospital deaths. A case-control
study. Am J Med 1983; 75: 658-62.
16. Haley RW, Hooten TM, Culver DH, et al. Nosocomial infections in U.S. hospitals, 1975-
1976. Estimated frequency by selected characteristics of patients. Am J Med 1981; 70:
947-59.
17. Kampf G, Wischnewski N, Schulgen G, Schumacher M, Daschner F. Prevalence and risk
factors for nosocomial lower respiratory tract infections in German hospitals. J Clin
Epidemiol 1998; 51:495-502.

52
18. Cook DJ. Ventilator associated pneumonia: perspectives on the burden of illness.
Intensive Care Med 2000; 26: S31-7.
19. George DL, Falk PS, Wunderink RG, et al. Epidemiology of ventilator-acquired
pneumonia based on protected bronchoscopic sampling. Am J Respir Crit Care Med
1998; 158:1839-47.
20. Jiménez P, Torres A, Rodríguez-Roisin R, Puig de la Bellacasa J, Aznar R, Gatell M,
Agustí-Vidal A. Incidence and etiology of pneumonia acquired during mechanical
ventilation. Crit Care Med 1989; 17:882-5.
21. Fagon JY, Chastre J, Hance AJ, Domart Y, Trouillet JL, Gibert C. Evaluation of clinical
judgment in the identification and treatment of nosocomial pneumonia in ventilated
patients. Chest 1993; 103:547-53.
22. Bercault N, Boulain T. Mortality rate attributable to ventilator-associated nosocomial
pneumonia in an adult intensive care unit: a prospective case-control study. Crit Care
Med 2001; 29:2303-9.
23. Rello J, Ausina V, Ricart M, Castella J, Prats G. Impact of previous antimicrobial therapy
on the etiology and outcomes of ventilator-associated pneumonia. Chest 1993; 104:1230-
5.
24. Rouby JJ, Martin de Lassale E, Poete P, et al. Nosocomial bronchopneumonia in the
critically ill. Histologic and bacteriologic aspects. Am Rev Respir Dis 1992; 146:1059-
66.
25. Timsit JF, Chevret S, Valcke J, et al. Mortality of nosocomial pneumonia in ventilated
patients: influence of diagnostic tools. Am J Respir Crit Care Med 1996; 154:116-23.
26. Luna CM, Vujacich P, Niederman MS, et al. Impact of BAL on the therapy and outcomes
of ventilator-associated pneumonia. Chest 1997; 111:676-85.

53
27. Almirali J, Mesalles E, Klamburg J, Parra O, Agudo A. Prognostic factors of pneumonia
requiring admission to the intensive care unit. Chest 1995; 107:511-6.
28. Everts RJ, Murdoch DR, Chambers ST, et al. Nosocomial pneumonia in adult general
medical and surgical patients at Christchurch hospital. NZ Med J 2000; 113:221-4.
29. Leu HS, Kaiser DL, Mori M, Woolson RF, Wenzel RP. Hospital-acquired pneumonia.
Attributable mortality and morbidity. Am J Epidemiol 1989; 129:1258-67.
30. Louie M, Dyck B, Parker S, Sekla L, Nicolle LE. Nosocomial pneumonia in a Canadian
tertiary care center: a prospective surveillance study. Infect Control Hosp Epidemiol
1991; 12:356-63.
31. Ohi H, Yanagihara k, Miyazaki Y, et al. Hospital-acquired pneumonia in general wards
of a Japanese tertiary hospital. Respirology 2004; 9:120-4.
32. Craven DE, Kunches LM, Kilinsky V, Lichtenberg DA, Make BJ, McCabe WR. Risk
factors for pneumonia and fatality in patients receiving continuous mechanical
ventilation. Am Rev Respir Dis 1986; 133:792-6.
33. Langer M, Mosconi P, Cigada M, Mandelli M, and the Intensive Care Unit Group of
Infection Control. Long-term respiratory support and risk of pneumonia in critically ill
patients. Am Rev Respir Dis 1989; 140: 302-5.
34. De Maio Carrilho CMD, Grion CMC, Bonametti AM, Medeiros EMS, Matsuo T.
Multivariate analysis of the factors associated with the risk of pneumonia in intensive
care units. Braz J Infect Dis 2007; 11:339-44.
35. Hyllienmark P, Gårdlund B, Persson J-O, Ekdahl K. Nosocomial pneumonia in the ICU:
A prospective cohort study. Scand J Infect Dis 2007; 39:676-82.
36. Hugonnet S, Uçkay I, Pittet D. Staffing level: a determinant of late-onset ventilator-
associated pneumonia. Crit Care 2007; 11:R80-6.

54
37. Cook DJ, Walter SD, Coof RJ, et al for the Canadian Critical Care Trials Group.
Incidence of and risk factors for ventilator-associated pneumonia in critically ill patients.
Ann Intern Med 1998; 129:433-40.
38. NNIS System. National nosocomial infections surveillance (NNIS) report, data summary
from October 1986-April 1997, issued May 1997. Am J Infect Control 1997; 25:477-87.
39. Koulenti D, Lisbon T, Brun-Buisson C, et al. Spectrum of practice in the diagnosis of
nosocomial pneumonia in patients requiring mechanical ventilation in European intensive
care units. Crit Care Med 2009; 37: 2360-8.
40. Zahar JR, Nguile-Makao M, Français A, et al. Predicting the risk of documented
ventilator-associated pneumonia for benchmarking: construction and validation of a
score. Crit Care Med 2009; 37: 2545-51
41. Cakir Edis EC, Hatipoglu ON, Yilmam I et al. Hospital-acquired pneumonia developed
in non-intensive care units. Respiration 2009; 78: 416-22.
42. Ranes JL, Gordon SM, Chen P, et al. Predictors of long-term mortality in patients with
ventilator-associated pneumonia. Am J Med 2006; 119:897.313-9.
43. Ibrahim EH, Ward S, Sherman G, Kollef MH. A comparative analysis of patients with
early-onset vs late-onset nosocomial pneumonia in the ICU setting. Chest 2000;
117:1434-42.
44. Kollef MH. Ventilator-associated pneumonia. A multivariate analysis. JAMA 1993;
270:1965-70.
45. Torres A, Aznar R, Gatell JM, et al. Incidence, risk, and prognosis factors of nosocomial
pneumonia in mechanically ventilated patients. Am Rev Respir Dis 1990; 142:523-8.
46. Ibrahim EH, Tracy L, Hill C, Fraser VJ, Kollef MH. The occurrence of ventilator-
associated pneumonia in a community hospital. Chest 2001; 120:555-61.

55
47. Celis R, Torres A, Gatell JM, Almela M, Rodríguez-Roisin R, Agustí-Vidal A.
Nosocomial pneumonia. A multivariate analysis of risk and prognosis. Chest 1988,
93:318-24.
48. Nseir S, diPompeo C, Jozefowicz E, et al. Relationship between tracheotomy and
ventilator associated pneumonia: a case-control study. Eur Resp J 2007; 30:314-20.
49. Wolkewitz M, Vonberg RP, Grundmann H, et al. Risk factors for the development of
nosocomial pneumonia and mortality on intensive care units: application of competing
risks models. Crit Care 2008; 12:R44.
50. Gross PA, Neu HC, Aswapokee P, Van Antwerpen C, Aswapokee N. Deaths from
nosocomial infections: experience in a university hospital and a community hospital. Am
J Med 1980; 68: 219-23.
51. Kollef MH, Silver P, Murphy DM, Trovillion E. The effect of late-onset ventilator-
associated pneumonia in determining patient mortality. Chest 1995; 108:1655-62.
52. Fagon JY, Chastre J, Vuagnat A, Trouillet JL, Novara A, Gibert C. Nosocomial
pneumonia and mortality among patients in intensive care units. JAMA 1996; 275:866-9.
53. Bryan CS, Reynolds KL. Bacteremic nosocomial pneumonia. Am Rev Respir Dis 1984;
129:668-71.
54. Leroy O, meybeck A, d’Escrivan t, et al. Hospital-acquired pneumonia in critically ill
patients. Mortality risk stratification upon onset. Treat Respir Med 2004; 3:123-31.
55. Rello J, Quintana E, Ausina V, Castella J, Luquin M, Net A, Prats G. Incidence, etiology,
and outcome of nosocomial pneumonia in mechanically ventilated patients. Chest 1991;
100:439-44.
56. Papazian L, Bregeon F, Thirion X, et al. Effect of ventilator-associated pneumonia on
mortality and morbidity. Am J Respir Crit Care Med 1996; 154:91-7.

56
57. Heyland DK, Cook DJ, Griffith L, Keenan SP, Brun-Buisson C for the Canadian Critical
Care Trials Group. The attributable morbidity and mortality of ventilator-associated
pneumonia in the critically ill patient. Am J Respir Crit Care Med 1999; 159:1249-56.
58. Vallés J, Pobo A, García-Esquirol O, et al. Excess ICU mortality attributable to
ventilator-associated pneumonia: the role of early vs late onset. Intensive Care Med 2007;
33:1363-8.
59. Nguile-Makao M, Zahar JR, Français A, et al. Attributable mortality of ventilator-
associated pneumonia: retrospective impact of main characteristics at ICU admission and
VAP onset using conditional logistic regression and multi-state models. Intensive Care
Med 2010; 36:781-9.
60. Melsen WG, Rovers MM, Bonten MJM. Ventilator-associated pneumonia and mortality:
a systematic review of observational studies. Crit Care Med 2009; 37:2709-18.
61. Takano Y, Sakamoto O, Suga M, Muranaka H, Ando M. Prognostic factors of
nosocomial pneumonia in general wards: a prospective multivariate analysis in Japan.
Respir Med 2002; 96:18-23.
62. Alvarez-Lerma, ICU-Acquired Pneumonia Study Group. Modification of empiric
antibiotic treatment in patients with pneumonia acquired in the intensive care unit.
Intensive Care Med 1996; 22:387-94.
63. Fagon JY, Chastre J, Domart Y, Trouillet JL, Pierre J, Darne C, Gibert C. Nosocomial
pneumonia in patients receiving continuous mechanical ventilation. Prospective analysis
of 52 episodes with use of a protected specimen brush and quantitative culture
techniques. Am Rev Respir Dis 1989; 139:877-84.
64. Lee SC, Hua CC, Yu TJ, Shieh WB, See LC. Risk factors of mortality for nosocomial
pneumonia: importance of initial anti-microbial therapy. Int J Clin Pract 2005; 59:39-45.

57
65. Rello J, Torres A, Ricart M, Valles J, Gonzalez J, Artigas A, Rodríguez-Roisin R.
Ventilator-associated pneumonia by Staphylococcus aureus. Comparison of methicillin-
resistant and methicillin-sensitive episodes. Am J Respir Crit Care Med 1994; 150: 1545-
9.
66. Vanhems P, Lepape A, Savey A, Jambou P, Fabry J, and the REA Sud-Est Study Group.
Nosocomial pulmonary infection by antimicrobial-resistant bacteria of patients
hospitalized in intensive care units: risk factors and survival. J Hosp Infect 2000; 45:98-
106.
67. Greenaway CA, Embil J, Orr PH, McLeod J, Dyck B, Nicolle LE. Nosocomial
pneumonia on general medical and surgical wards in a tertiary-care hospital. Infect
Control Hosp Epidemiol 1997; 18:749-56.
68. Vallés J, Mesalles E, Mariscal D, et al. A 7-year study of severe hospital-acquired
pneumonia requiring ICU admission. Intensive Care Med 2003; 29:1981-8.
69. Luna CM, Aruj P, Niederman MS, et al. Appropriateness and delay to initiate therapy in
ventilator-associated pneumonia. Eur Resp J 2006; 27:158-64.
70. Siempos II, Vardakas KZ, Kyriakopoulos CE, Ntaidou TK, Falagas ME. Predictors of
mortality in adult patients with ventilator-associated pneumonia: a meta-analysis. Shock
2010; 33:590-601.
71. Thompson DA, Makary MA, Dorman T, Pronovost PJ. Clinical and economic outcomes
of hospital acquired pneumonia in intra-abdominal surgery patients. Ann Surg 2006;
243:547-52.
72. Kollef MH, Shorr A, Tabak YP, et al. Epidemiology and outcomes of health-care-
associated pneumonia: results from a large US database of culture-positive pneumonia.
Chest 2005; 128:3854-62.

58
73. Taylor GD, Buchanan-Chell M, Kirkland T, McKenzie M, Wiens R. Bacteremic
nosocomial pneumonia. A 7-year experience in one institution. Chest 1995; 108:786-8.
74. Simor AE, Gilbert NL, Gravel D, et al. Methicillin-resistant Staphylococcus aureus
colonization or infection in Canada: national surveillance and changing epidemiology,
1995-2007. Infect Control Hosp Epidemiol 2010; 31:348-56.
75. Garner JS, Jarvis WR, Emori TG, Horan TC, Hughes JM. CDC definitions for
nosocomial infections. In: Olmstead RN,ed.: APIC Infection Control and Applied
Epidemiology: Principles and Practice. St. Louis: Mosby; 1996: pp. A-1 - - A-20.
76. McCabe WR, Jackson GG. Gram-negative bacteremia: I. Etiology and ecology. Arch
Intern Med 1962; 110:847-55.
77. Knaus WA, Wagner DP, Draper EA, et al. The APACHE III prognostic system. Risk
prediction of hospital mortality for critically ill hospitalized adults. Chest 1991;
100:1619-36.
78. American Thoracic Society and Infectious Diseases Society of America. Guidelines for
the management of adults with hospital-acquired, ventilator-associated, and healthcare-
associated pneumonia. Am J Resp Crit Care Med 2005; 171:388-416.
79. Gravel D, Matlow A, Ofner-Agostini M, et al. A point prevalence survey of healthcare-
associated infections in pediatric populations in major Canadian acute care hospitals. Am
J Infect Control 2007; 35:157-62.
80. Eggimann P, Hugonnet S, Sax H, Touveneau S, Chevrolet J-C. Ventilator-associated
pneumonia; caveats for benchmarking. Intensive Care Med 2003; 29:2086-9.
81. Craven DE, Steger KA. Hospital-acquired pneumonia: perspectives for the healthcare
epidemiologist. Infect Control Hosp Epidemiol 1997; 18:783-95.

59
82. Cook DJ, Kollef MH. Risk factors for ICU-acquired pneumonia. JAMA 1998; 279: 1605-
6.
83. Lynch III JP. Hospital-acquired pneumonia:risk factors, microbiology, and treatment.
Chest 2001; 119: 373S-84S.
84. Kollef MH, von Harz B, Prentice D, et al. Patient transport from intensive care increases
the risk of developing ventilator-associated pneumonia. Chest 1997; 112: 765-73.
85. Kropec A, Schulgen G, Just H, Geiger K, Schumacher M, Daschner F. Scoring system
for nosocomial pneumonia in ICUs. Intensive Care Med 1996; 22:1155-61.
86. Chevret S, Hemmer M, Carlet J, Langer M. Incidence and risk factors of pneumonia
acquired in intensive care units: results from a multicentre prospective study on 996
patients. Intensive Care Med 1993; 19:256-64.
87. Mosconi P, Langer M, Cigada M, Mandelli M. Epidemiology and risk factors of
pneumonia in critically ill patients. Eur J Epidemiol 1991; 7:320-7.
88. Stebbings AEL, Ti TY, Tan WC. Hospital acquired pneumonia in the medical intensive
care unit-a prospective study. Singapore Med J 1999; 40(08).
89. Nielsen SL, Roder B, Magnussen P, Engquist A, Frimodt-Moller N. Nosocomial
pneumonia in an intensive care unit in a Danish university hospital: incidence, mortality
and etiology. Scand J Infect Dis 1992; 24:65-70.
90. Cunnion KM, weber DJ, Broadhead E, et al. Risk factors for nosocomial pneumonia:
comparing adult critical-care populations. Am J Respir Crit Care Med 1996; 153:158-62.
91. Chastre J, Trouillet JL, Vuagnat A, et al. Nosocomial pneumonia in patients with acute
respiratory distress syndrome. Am J Respir Crit Care Med 1998; 157:1165-72.

60
92. Beck-Sague CM, Sinkowitz RL, Chinn RY, et al. Risk factors for ventilator-associated
pneumonia in surgical intensive-care unit patients. Infect Control Hosp Epidemiol 1996;
17:374-6.
93. Trouillet JL, Chastre J, Vuagnat A, et al. Ventilator-associated pneumonia caused by
potentially drug-resistant bacteria. Am J Respir Crit Care Med 1998; 157:531-9.
94. Kollef MH, Morrow LE, Niederman MS, et al. Clinical characteristics and treatment
patterns among patients with ventilator-associated pneumonia. Chest 2006; 129:1210-8.
95. Fagon J-Y, Chastre J, Hance AJ, Montravers P, Novara A, Gibert C. Nosocomial
pneumonia in ventilated patients: a cohort study evaluating attributable mortality and
hospital stay. Am J Med 1993; 94:281-8.
96. Rello J, Jubert P, Vallés J, Artigas A, Rué M, Niederman MS. Evaluation of outcome for
intubated patients with pneumonia due to Pseudomonas aeruginosa. Clin Infect Dis 1996;
23:973-8.
97. Zavascki AP, Barth AL, Fernandes JF, et al. Reappraisal of Pseudomonas aeruginosa
hospital-acquired pneumonia mortality in the era of metallo-ß-lactamase-mediated
multidrug resistance: a prospective observational study. Crit Care 2006; 10:R114-20.
98. Luna CM, Videla A, Mattera J, et al. Blood cultures have limited value in predicting
severity of illness and as a diagnostic tool in ventilator-associated pneumonia. Chest
1999; 116:1075-84.
99. Ylipalosaari P, Ala-Kokko TI, Laurila J, Ohtonen P, Syrjälä H. Intensive care acquired
infection is an independent risk factor for hospital mortality: a prospective cohort study.
Crit Care 2006; 10:R66-R71.

61
100. Kumar A, Roberts D, Wood KE, et al. Duration of hypotension prior to initiation of
effective antimicrobial therapy is the crucial determinant of survival in human septic
shock. Crit Care Med 2006; 34:1589-96.
101. Castellanos-Ortega A, Suberviola B, García LA, et al. Impact of the Surviving Sepsis
Campaign protocols on hospital length of stay and mortality in septic shock patients:
results of a three-year follow-up quasi-experimental study. Crit Care Med 2010; 38:1036-
43.
102. Norman GR, Streiner DL. Biostatistics: The Bare Essentials, 2nd edition (2000).
Hamilton, BC Decker Inc.

62
Appendix I – Patient Information Form 1. Patient identifier: ______ - _________________
Part 1: Patient demographic information
2. Date of birth: _____ / _____ / ________ 3. Sex: Male Female MM DD YYYY
4. Date of hospital admission: ______ / ______ / _____ MM DD YY
5. Date of hospital discharge: ______ / ______ / _____ MM DD YY
6. Status at time of discharge: Alive Deceased
7. Discharged to: Home Other hospital Rehab Nursing home Unknown
Other______________________________________
Part 2: Patient underlying health status 8. Most responsible admission diagnosis: ____________________________
9. Concurrent conditions ([ all that apply ): Acute renal failure AIDS Bone marrow transplant Burn
Cirrhosis Community-acquired bacteremia Community-acquired pneumonia Congestive heart failure COPD Diabetes mellitus Dialysis-dependent CRF Hepatic failure HIV Ischemic heart disease Leukemia/multiple myeloma Lymphoma Metastatic cancer Non-metastatic cancer Neuromuscular disease Solid organ transplant Stroke with deficit Trauma Other (specify): ______________________________________ 10. McCabe and Jackson classification:
Rapidly fatal Ultimately fatal Nonfatal
11. Smoking status: Current smoker : Yes No Unknown If not a current smoker: Ex-smoker Never smoked Unknown
Total number of pack-years smoked: ____________________

63
Part 3: Factors related to hospitalization
12. Surgery during admission: No Yes Date: ____ / ____ / ____ MM DD YY
If the patient had surgery, was it elective?: No Yes
13. Patient received invasive mechanical ventilation for > 48 hours:
No Yes
Start date 1: ____ / ____ / ____ Stop date 1: ____ / ____ / ____ MM DD YY MM DD YY Start date 2: ____ / ____ / ____ Stop date 2: ____ / ____ / ____ MM DD YY MM DD YY Start date 3: ____ / ____ / ____ Stop date 3: ____ / ____ / ____ MM DD YY MM DD YY Start date 4: ____ / ____ / ____ Stop date 3: ____ / ____ / ____ MM DD YY MM DD YY
14. Patient received non-invasive mechanical ventilation for > 12 hours:
No Yes
Start date 1: ____ / ____ / ____ Stop date 1: ____ / ____ / ____ MM DD YY MM DD YY Start date 2: ____ / ____ / ____ Stop date 2: ____ / ____ / ____ MM DD YY MM DD YY Start date 3: ____ / ____ / ____ Stop date 3: ____ / ____ / ____ MM DD YY MM DD YY
15. If ventilated, the main indication for mechanical ventilation ( [ only one ); acute respiratory failure adult respiratory distress syndrome exacerbation COPD cardiogenic pulmonary edema multiple trauma neurologic illness
postoperative control 16. Patient had a tracheostomy: No Yes Date: ___ / ___ / ___ MM DD YY
17. Patient was in intensive care: No Yes
Start date 1: ____ / ____ / ____ Stop date 1: ____ / ____ / ____ MM DD YY MM DD YY Start date 2: ____ / ____ / ____ Stop date 2: ____ / ____ / ____ MM DD YY MM DD YY Start date 3: ____ / ____ / ____ Stop date 3: ____ / ____ / ____ MM DD YY MM DD YY Start date 4: ____ / ____ / ____ Stop date 3: ____ / ____ / ____ MM DD YY MM DD YY

64
18. Patient had a nosocomial infection other than pneumonia: No Yes
Bloodstream infection 1 Date: ____ / ____ / ____ MM DD YY Bloodstream infection 2 Date: ____ / ____ / ____
MM DD YY Surgical site infection 1 Date: ____ / ____ / ____ MM DD YY Surgical site infection 2 Date: ____ / ____ / ____ MM DD YY Urinary tract infection 1 Date: ____ / ____ / ____ MM DD YY Urinary tract infection 2 Date: ____ / ____ / ____ MM DD YY C. difficile diarrhea 1 Date: ____ / ____ / ____ MM DD YY C. difficile diarrhea 2 Date: ____ / ____ / ____ MM DD YY
Part 4: Medications prior to and during hospitalization:
19. Corticosteroids: No Yes
20. Antimicrobials : No Yes
21. Chemotherapy within the past 45 days: No Yes
22. Immunosuppressive therapy: No Yes
Part 5: Factors related to the nosocomial pneumonia
23. Patient had nosocomial pneumonia: No Yes
Date: ____ / ____ / ____ If no, go to part 6 MM DD YY
If yes, proceed with question 24.

65
24. Diagnostic criteria ([ all that apply): rales or dullness to percussion on physical exam chest imaging shows new or progressive infiltrate, consolidation,
cavitation, or pleural effusion new onset of purulent sputum or change in the character of the sputum organism isolated from blood culture isolation of an etiologic agent from a specimen obtained by transtracheal
aspirate, bronchial brushing, or biopsy isolation of virus from or detection of viral antigen from respiratory
secretions diagnostic single antibody titre (IgM) or fourfold increase in paired
sera(IgG) for a respiratory pathogen histopathologic evidence of pneumonia
25. Chest imaging findings: number of lobes involved ___________
26. Service where the pneumonia was acquired ([ only one):
Medicine Surgery Intensive care unit Coronary care unit
27. Was this a ventilator-acquired pneumonia? No Yes
28. There was a secondary bacteremia related to the pneumonia:
No Yes
29. A respiratory tract specimen was collected: No Yes If yes, date ___ / ___ / ___
MM DD YY
30. Was the patient on systemic antibacterials ≥ 24 hours when the specimen was
obtained? No Yes
31. Source of respiratory tract specimen: sputum lung biopsy transtracheal aspirate pleural fluid
ETT or tracheostomy suction Bronchoscopy with protected BAL or brush Bronchoscopy with unprotected BAL or brush
32. Was the specimen cultured quantitatively: Yes No

66
33. Pneumonia and secondary bacteremia organisms:
Pneumonia
organism 1
Pneumonia
organism 2
Pneumonia
organism 3
Secondary
bacteremia
organism 1
Secondary
Bacteremia
organism 2
Antimicrobial
S R S R S R S R S R
amikacin
amox/clav
ampicillin
cefaclor
cefazolin
cefepime
cefixime
cefonicid
cefotaxime/
ceftriaxone
cefoxitin
cefuroxime
ceftazidime
cephalexin

67
ciprofloxacin
clindamycin
cloxacillin
erythromycin
fusidic acid
gatifloxacin
gentamicin
imipenem
levofloxacin
meropenem
metronidazole
moxifloxacin
mupirocin
penicillin
pipericillin
pip/tazobactam
rifampin
tetracycline
ticar/clav

68
TMP-SMX
tobramycin
vancomycin
34. Empiric antimicrobial(s):
Drug Route Dose Start Stop
____________ _____ ____________ ___/___/___ ___/___/___ MM DD YY MM DD YY
Drug Route Dose Start Stop
____________ _____ ____________ ___/___/___ ___/___/___ MM DD YY MM DD YY
Drug Route Dose Start Stop
____________ _____ ____________ ___/___/___ ___/___/___ MM DD YY MM DD YY
Drug Route Dose Start Stop
____________ _____ ____________ ___/___/___ ___/___/___ MM DD YY MM DD YY
35. Definitive antimicrobial(s):
Drug Route Dose Start Stop
____________ _____ ____________ ___/___/___ ___/___/___ MM DD YY MM DD YY
Drug Route Dose Start Stop
____________ _____ ____________ ___/___/___ ___/___/___ MM DD YY MM DD YY
Drug Route Dose Start Stop
____________ _____ ____________ ___/___/___ ___/___/___ MM DD YY MM DD YY
Drug Route Dose Start Stop
____________ _____ ____________ ___/___/___ ___/___/___ MM DD YY MM DD YY

69
Part 6. Vital signs and laboratory values 36.
Put comments re: section 36 on back of page.
Parameter On admission lowest highest
72 hours prior lowest highest
At onset lowest highest
respiratory rate pulse BP mean BP (if available) temperature, °C urine output, cc/day Fi O2 paO2 pH paCO2 total WBC hematocrit Na+ glucose BUN creatinine albumin total bilirubin
Yes No Yes No Yes No Eyes open spontaneously or to verbal or painful stimuli
Motor Obeys verbal command Localizes pain Flexion withdrawal or decorticate rigidity Decerebrate rigidity or no response
Verbal Oriented converses Confused conversation Inappropriate words or incomprehensible sounds No response
Patient sedated/paralyzed

70
37. Today’s date: ____(MM) / ____ (DD)
38. Data abstractor: _______________
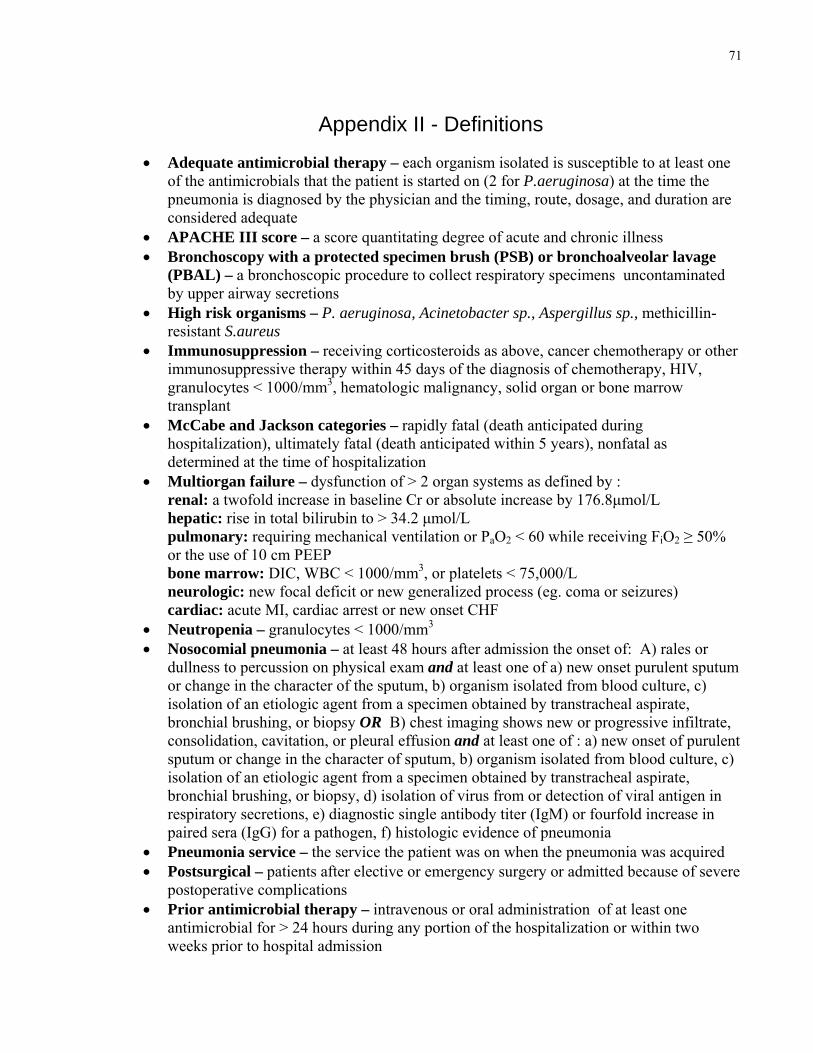
71
Appendix II - Definitions
• Adequate antimicrobial therapy – each organism isolated is susceptible to at least one of the antimicrobials that the patient is started on (2 for P.aeruginosa) at the time the pneumonia is diagnosed by the physician and the timing, route, dosage, and duration are considered adequate
• APACHE III score – a score quantitating degree of acute and chronic illness • Bronchoscopy with a protected specimen brush (PSB) or bronchoalveolar lavage
(PBAL) – a bronchoscopic procedure to collect respiratory specimens uncontaminated by upper airway secretions
• High risk organisms – P. aeruginosa, Acinetobacter sp., Aspergillus sp., methicillin-resistant S.aureus
• Immunosuppression – receiving corticosteroids as above, cancer chemotherapy or other immunosuppressive therapy within 45 days of the diagnosis of chemotherapy, HIV, granulocytes < 1000/mm3, hematologic malignancy, solid organ or bone marrow transplant
• McCabe and Jackson categories – rapidly fatal (death anticipated during hospitalization), ultimately fatal (death anticipated within 5 years), nonfatal as determined at the time of hospitalization
• Multiorgan failure – dysfunction of > 2 organ systems as defined by : renal: a twofold increase in baseline Cr or absolute increase by 176.8μmol/L hepatic: rise in total bilirubin to > 34.2 μmol/L pulmonary: requiring mechanical ventilation or PaO2 < 60 while receiving FiO2 ≥ 50% or the use of 10 cm PEEP bone marrow: DIC, WBC < 1000/mm3, or platelets < 75,000/L
neurologic: new focal deficit or new generalized process (eg. coma or seizures) cardiac: acute MI, cardiac arrest or new onset CHF • Neutropenia – granulocytes < 1000/mm3 • Nosocomial pneumonia – at least 48 hours after admission the onset of: A) rales or
dullness to percussion on physical exam and at least one of a) new onset purulent sputum or change in the character of the sputum, b) organism isolated from blood culture, c) isolation of an etiologic agent from a specimen obtained by transtracheal aspirate, bronchial brushing, or biopsy OR B) chest imaging shows new or progressive infiltrate, consolidation, cavitation, or pleural effusion and at least one of : a) new onset of purulent sputum or change in the character of sputum, b) organism isolated from blood culture, c) isolation of an etiologic agent from a specimen obtained by transtracheal aspirate, bronchial brushing, or biopsy, d) isolation of virus from or detection of viral antigen in respiratory secretions, e) diagnostic single antibody titer (IgM) or fourfold increase in paired sera (IgG) for a pathogen, f) histologic evidence of pneumonia
• Pneumonia service – the service the patient was on when the pneumonia was acquired • Postsurgical – patients after elective or emergency surgery or admitted because of severe
postoperative complications • Prior antimicrobial therapy – intravenous or oral administration of at least one
antimicrobial for > 24 hours during any portion of the hospitalization or within two weeks prior to hospital admission

72
• Shock – systolic blood pressure < 80 mm Hg or requirement for vasopressors to maintain BP > 80 mm Hg for > 4 hours
• Trauma – category for patient even if surgery performed during the admission (eg. hip fracture, MVA)

73
Appendix III – Patient Information Form Instructions 1. The patient identifier is the number given to the patient for the point
prevalence survey in February 2002. It consists of the CHEC number and the patient unique
identifier (eg. 15A-0000000).
2. The patient’s date of birth as identified on the admission sheet.
3. The patient’s biological sex.
4. The date of the hospital admission for which the patient was part of
the point prevalence survey.
5. The date of the hospital discharge for which the patient was part of the prevalence
survey. If the patient is still in hospital from that admission, leave blank.
6. Was the patient dead or alive at the time of discharge? If the patient is still in
hospital, check alive.
7. Indicate where the patient was discharged to.
8. Indicate the main medical or surgical diagnosis for which the patient was
hospitalized as written in the admission history.
9. Indicate all the chronic medical and surgical conditions that the patient had on or during
the admission, even if they were only diagnosed during that admission. Include the
admission diagnosis given in question 8.
a. Acute renal failure: the patient has been identified by a physician as having
acute renal failure. Renal failure is defined as a twofold increase in baseline
creatinine or absolute increase by 176.8μmol/L. It must have been present
prior to and at the onset of the nosocomial pneumonia; the patient cannot
have chronic renal failure.

74
b. AIDS: the patient is identified as having an AIDS defining diagnosis
c. Bone marrow transplant: the patient has had a bone marrow transplant
for any indication prior to the onset of the pneumonia
d. Burn: the patient has a burn as one of the admission diagnoses
e. Cirrhosis: the patient has a diagnosis of cirrhosis, with or without hepatic failure,
from any etiology (eg. hepatitis C, hepatitis B, alcohol, primary biliary cirrhosis, etc)
f. Community-acquired bacteremia: the patient is diagnosed with
and treated for a community-acquired bloodstream infection on admission
g. Community-acquired pneumonia: the patient is diagnosed with and treated for a
community-acquired pneumonia on admission
h. Congestive heart failure: the patient has chronic congestive heart failure from any
cause
i. COPD: the patient is noted to have chronic bronchitis and/or emphysema as recorded
in the chart; does not include asthma; does not require confirmation by pulmonary
function tests
j. Diabetes mellitus: the patient has diabetes requiring treatment with oral medications
and/or insulin; does not include diabetes controlled with diet alone
k. Dialysis-dependent renal failure: the patient has chronic renal failure
requiring either hemodialysis or peritoneal dialysis; does not include acute
renal failure
l. Hepatic failure: the patient has a diagnosis of hepatic failure (eg. hepatic coma,
encephalopathy or coagulopathy) with or without cirrhosis, from any etiology; if it is
diagnosed during the hospitalization its manifestations must have been present
before the onset of the pneumonia
m. HIV: the patient is HIV infected with/without AIDS
n. Ischemic heart disease: the patient has stable or unstable angina, previous or current
myocardial infarction, coronary insufficiency, or is otherwise identified as having
ischemic heart disease
o. Leukemia/multiple myeloma: does not include leukemia or myeloma considered to
be cured (eg. by bone marrow transplant or curative chemotherapy in the past)
p. Lymphoma: does not included lymphoma considered to be cured (eg. by bone
marrow transplant or curative chemotherapy in the past)

75
q. Metastatic cancer: the patient has documented metastatic cancer
r. Non-metastatic cancer: the patient has cancer within 3 months of the point
prevalence survey but no documentation of cancer metastases; exclude non-
melanoma skin cancer
s. Neuromuscular disease: the patient has a chronic neurological disease such
as myasthenia gravis, amyotrophic lateral sclerosis, supranuclear bulbar
palsy, Parkinson’s disease, etc, with associated nerve and/or muscle
t. Solid organ transplant: the patient has had a heart, heart-lung, kidney, liver,
or pancreas transplant prior to the pneumonia
u. Stroke with deficit: the patient has been left with residual neurologic deficit
from a stroke which must have occurred prior to the nosocomial pneumonia
v. Trauma: the patient has had trauma as one of the diagnoses whether or not
surgery is required (eg. MVA, fractured hip
w. Other: specify other conditions that the patient had on admission or chronic
conditions the patient had which were first diagnosed on admission
10. At the time of admission, based on the patient’s admission diagnosis and
concurrent diagnoses, the patient’s death is anticipated during the admission (rapidly fatal) or
within 5 years (ultimately fatal) or is not anticipated (nonfatal).
11. The patient has been smoking within 6 weeks of admission (current) ,
stopped smoking at least 6 weeks ago (ex-smoker), has never smoked, or status is unknown.
Pack years = number of packs smoked/day x number years smoked.
12. Includes any surgery (except tracheostomy) involving an incision and requiring general or
regional anaesthesia during the admission; does not include surgery under local. For a patient
with nosocomial pneumonia, the surgery must have occurred prior to the pneumonia. If the
nosocomial pneumonia patient has had more than one surgical procedure during the
hospitalization, give the date for the procedure closest in time to the pneumonia. If the non-
pneumonia patient has had more than one surgical procedure, give the date of the first surgical
procedure.

76
13. Invasive mechanical ventilation includes ventilation with an endotracheal
tube (nasotracheal or orotracheal) or tracheostomy. For the nosocomial
pneumonia patient, the invasive mechanical ventilation must have been in use prior to
the diagnosis of pneumonia. If the invasive mechanical ventilation is ongoing at the
time of onset of the nosocomial pneumonia, the stop date is not required. Start and stop
dates are required for invasive mechanical ventilations occurring prior to but not
ongoing at the time of the onset of the pneumonia. This question does not include
mechanical ventilation given for anaesthesia.
14. Non-invasive mechanical ventilation involves ventilation by face-mask
(there is no endotracheal tube or tracheostomy). For the nosocomial pneumonia patient,
the non-invasive mechanical ventilation must have been in use prior to the diagnosis of
pneumonia. If the non-invasive mechanical ventilation is ongoing at the time of onset
of the nosocomial pneumonia, the stop date is not required. Start and stop dates are
required for non-invasive mechanical ventilations occurring prior to but not
ongoing at the time of the onset of the pneumonia.
15. Choose the major indication for initiating the invasive or non-invasive mechanical
ventilation.
16. For the nosocomial pneumonia patient, the tracheosotomy must be present prior
to the pneumonia. Give the date that the tracheostomy was done, if done during this
hospitalization.
17. The patient was admitted to an intensive care unit at any time during
the admission and, for the nosocomial pneumonia patient, prior to the
pneumonia. If the patient was still in the ICU at the onset of the pneumonia, the stop
date is not required.
18. The patient had a nosocomial infection(s) other than nosocomial

77
pneumonia. For the nosocomial pneumonia patient, the infection(s) must have been diagnosed
prior to the pneumonia. This does not include bacteremia secondary to the nosocomial
pneumonia (this is question 28). Only symptomatic UTIs are included.
19. Prior to or during the hospital admission the patient received a systemic
corticosteroid at a dose equivalent to prednisone ≥ 20 mg/day for ≥ 2 weeks or
≥ 30 mg/day for ≥ 1 week . Does not include topical steroids. Dose equivalencies are:
Steroid Equivalent dose
Cortisone 25 mg.
Hydrocortisone 20 mg.
Methylprednisolone 4 mg.
Prednisolone 5 mg.
Prednisone 5 mg.
Triamcinolone 4 mg.
Betamethasone 0.6 mg.
Dexamethasone (Decadron) 0.75 mg.
Fludnocortisone 10 mg.
20. Within two weeks of or at any time during the hospital admission the patient
received oral or intravenous antibacterials for more than 24 hours. In addition to the
antibiotics listed in question 33, include clarithromycin, azithromycin, and norfloxacin.
21. The patient received oral or intravenous anticancer chemotherapy
as an inpatient or outpatient within 45 days of admission to hospital.
22. The patient was on immunosuppressive therapy within 45 days of admission to hospital.
Immunosuppressive therapies include azathioprine,methotrexate, cyclosporine, tacrolimus,
sirolimus, cyclophosphamide, antithmyoctye/antilymphocyte globulin.
23. The patient was diagnosed as having nosocomial pneumonia during the
point prevalence survey in February 2002. Give the date of onset as recorded on the
CHEC point prevalence survey.

78
24. Indicate all the criteria that were used to diagnose the nosocomial pneumonia.
These are the criteria used for the diagnosis of nosocomial pneumonia during the point
prevalence survey.
25. Indicate the number of lobes involved with the pneumonia as reported by the
radiologist on chest imaging at the time the pneumonia is diagnosed. The number of lobes
involved is 1-5. Chest Xray or CT scan may be used. If the two differ, use the
results from the CT scan.
26. Indicate the service that the patient was on when the pneumonia was acquired. This
may not be the service that the patient was on at the time the pneumonia was diagnosed or at
the time of the prevalence survey. Generally, the ward the patient was on ~ 48 hours prior to
the onset of the pneumonia is the one where it was acquired. Medicine includes all medical
specialties (including bone marrow transplant, dialysis,etc.) and surgery includes all surgical
specialties(including orthopedics, neurosurgery,etc), urology, gynecology, and
oromaxillofacial surgery provided the patient is not in an intensive or coronary care unit.
Medicine and surgery refer to general and intermediate care units. Intensive care unit includes
cardiovascular, medical, surgical and mixed medical/surgical intensive care units. Coronary
care unit includes only coronary care (not cardiovascular intensive care).
27. The patient has received mechanical ventilation for at least 48 hours prior to
the onset of the pneumonia and has received mechanical ventilation within 48 hours of the
onset of nosocomial pneumonia.
28. The patient has bacteremia secondary to the nosocomial pneumonia.
There must be no evidence that the bacteremia is secondary to another
nosocomial infection.
29. Indicate whether a respiratory tract specimen was collected. To be included, the
specimen must have been collected on the day of or within 48 hours prior to the onset of the
pneumonia. Do not include specimens included after the diagnosis is made.

79
30. Indicate whether the patient was on oral or IV antibacterials for ≥ 24 hours at the
time the specimen was collected. Question 33 has a detailed list of antibacterials. Also
included as antibacterials are azithromycin, clarithromycin, and norfloxacin.
31. Indicate the type of respiratory tract specimen that the organisms listed
in question 27 were isolated from. To be considered a PBAL or PSB (protected BAL or
specimen brush), this must clearly be documented in the chart. The documentation may be
found in the progress note, procedure sheet, or microbiology lab requisition. Protected (double
catheter) specimens are meant to be cultured quantitatively. A laboratory specimen reported
quantitatively (example: 3x10⁴ colonies /ml of ….)is likely a protected BAL or brush.
32. If a specimen was cultured quantitavely, the report will be given as # cfu/ml.
Semiquantitative measures (heavy, light, etc.) do not represent quantitative cultures.
33. Write the name of the organism (bacteria, virus, fungus) isolated from the
respiratory tract or blood (only for bacteremia secondary to pneumonia) or identified by
serology. Indicate the growth (eg: heavy, light, etc.) when available on the report. For
identified bacteria, indicate ‘S’ (susceptible) or ‘R’ (resistant) for all susceptibility results
reported by the laboratory. A missing value means that the antimicrobial was not tested.
TMP/SMX=trimethoprim/sulfamethoxazole. For this table,
amoxicillin=ampicillin
oxacillin=nafcillin=methicillin=cloxacillin
penicillinG=penicillinV=penicillin
cephalothin=cefazolin
ceftriaxone=ceftizoxime=cefotaxime
34. Indicate the antimicrobial(s) that the patient was started on to treat the
pneumonia before the laboratory results were available. If the patient was already on
antimicrobial(s) when the pneumonia was diagnosed and if they were not changed when the
pneumonia was diagnosed, these are the empiric antimicrobial(s).

80
35. Indicate the antimicrobial(s) that the patient was changed to in response to the laboratory
results or because the patient failed to respond to empiric therapy.
If the patient’s antimicrobials were not changed this question will be unanswered. In general,
include only those changes made within the first 2-3 weeks after diagnosis.
36. Give the values for the 24 hour time frame indicated. The 24 hour time frame is
midnight to midnight of the date indicated(ie, the calendar day). The day of admission is day
1. If only one result was available for the date, give it. Where the result was not available,
leave blank.
a. respiratory rate: lowest and highest
b. pulse: lowest and highest
c. BP: lowest and highest . This is not required if the lowest and highest mean BP are
available.
d. mean BP: when available from the chart. This is usually only available for ICU
patients. Give lowest and highest
e. temperature: lowest and highest
f. urine output: total cc/24hours . If monitored < 24 hours, cannot be calculated
g. Fi O2 : highest
h. Pa O2: lowest
i. pH: lowest and highest
j. PaCO2: corresponding value for lowest and highest pH
k. total WBC: lowest and highest
l. hematocrit: lowest and highest
m. Na2: lowest and highest
n. Glucose: lowest and highest
o. BUN: highest
p. creatinine: lowest and highest
q. albumin: lowest and highest
r. total bilirubin: highest
s. Record the worst neurological status for the 24 hours. Use a time when the patient
was not heavily sedated and/or paralyzed whenever available. Indicate whether the

81
patient was heavily sedated and/or paralyzed when the neurological evaluation was
done.
For nosocomial pneumonia patients, 72 hours prior is 72 hours before the onset of nosocomial
pneumonia. For the non-pneumonia patients ,72 hours prior is 72 hours before the ‘index date’.
The ‘index date’ is the hospitalization day that corresponds to the hospitalization day that the
case had the onset of nosocomial pneumonia. As an example, if the case patient developed
nosocomial pneumonia on day 7 of hospitalization then the index date is day 7 for the
nonpneumonia patient and 72 hours prior is day 4. At diagnosis is the date of the onset of the
nosocomial pneumonia for the case patient and the corresponding hospitalization day for the
nonpneumonia patient.
When a value is blank we are assuming that it is normal (and therefore not ordered). Comment in
the space available if you believe that the result might be abnormal but the test was not ordered
for a specific reason such as therapy and/or active care had been withdrawn or bloodwork was
being ordered only every few days.
37. Today’s date is the date the patient information form was completed.
38. Data abstractor is the name of the person completing the patient information form.

82
Appendix IV – SAS Codes *-----------------------------------------------------*
Program Name: PNEUMO_July4 stored in "P\my documents"
Purpose: To analyze nosocomial pneumonia data
Number of additional variables defined,
graphs removed compared to earlier data analyses, and
various regression analyses run.
Lynn Johnston
July 31, 2011
*-----------------------------------------------------*;
* To summarize contents of the database;
proc contents data=sasuser.pneumo_july4 varnum;
run;
* To add value labels;
proc format;
value sex 0='male' 1='female';
value Mcabe 1='nonfatal' 2='ultimately fatal' 3='rapidly fatal';
value smoke 1='never' 2='exsmoker' 3='current' 4='unknown';
value smoker 0='never smoked/unknown' 1='ever smoked';
value service 1='medicine' 2='surgery' 3='ICU' 4='CCU';
value spec 1='sputum' 2='biopsy' 3='ETT' 4='PBAL' 5='BAL'
6='TTA' 7='pleural fluid' 8='none';

83
value treatdays 1='< 5days' 2='5-7days' 3='8-14 days' 4='> 14days';
value yesno 0='no' 1='yes';
value outcome 0='dead' 1='alive';
run;
* To 1) create new variables LOS, prepnu,postpnu, test
incident, smoker, early, short, morbid, earlymort,fatalMcCabe, rapidMcCabe,
slowMcCabe and
2)add variable labels;
data sasuser.pneumo_july4a;
set sasuser.pneumo_july4;
LOS=(datepart(DOD)-datepart(DOA))+1;
prepnu=(datepart(PDATE)-datepart(DOA));
postpnu=(datepart(DOD)-datepart(PDATE));
If postpnu LE 15 and status = 0 then earlymort=0;
else earlymort=1;
If conds LE 3 then morbid=0;
else if conds GT 3 then morbid=1;
If service GT 1 then medical=0;
else if service EQ 1 then medical=1;
If spec EQ 8 then test =0;
else if spec NE 8 then test = 1;
If prev GT 3 then incident = 0;
else if prev LE 3 then incident = 1;

84
If prepnu GT 4 then early = 0;
else if prepnu LE 4 then early = 1;
If smoke = 1 then smoker = 0;
else if 2 LE smoke LE 3 then smoker = 1;
If treatdays GE 3 then short = 0;
else if treatdays LT 3 then short = 1;
If Mcabe LT 2 then fatalMcCabe = 0;
else if Mcabe GE 2 then fatalMcCabe = 1;
If Mcabe LT 3 then rapidmccabe1 = 0;
else if Mcabe EQ 3 then rapidmccabe1 = 1;
If Mcabe LT 2 then rapidmccabe = 0;
else if Mcabe EQ 3 then rapidmccabe = 1;
If Mcabe LT 2 then slowmccabe = 0;
else if Mcabe EQ 2 then slowmccabe = 1;
Format morbid medical smoker surg esurg vent CPAP trach ICU NI steroid
antibiotic
chemo immsupp suppress pneumo crit VAP BSI prebiotic
riskbug IDSAtreat IDSAdura Orgcover test incident early short fatalMcCabe
rapidmccabe
slowmccabe rapidMccabe1 yesno.
status mortal earlymort outcome.;
label sex='gender'
status='discharge status'
conds='number of admission comorbid illnesses'

85
morbid='more than 3 comorbidities'
MCabe='McCabe score on admission'
fatalMcCabe='McCabe score of 2 or 3'
rapidMccabe='McCabe score of 3 vs 1'
rapidMccabe1='McCabe score of 3 vs 1+2'
slowMcCabe='McCabe score of 2'
smoke='smoking status on admission'
smoker='ever smoked'
surg='surgery during admission'
vent='ventilated during admission'
CPAP='CPAP during admission'
trach='trach during admission'
ICU='ICU stay during admission'
NI='nosocomial infection other than pneumonia'
steroid='had received steroids'
antibiotic='had received an antibiotic'
chemo='had received chemotherapy'
immsupp='had received an immunosuppressant'
suppress='any immunosuppression'
crit='met nosocomial pneumonia definition'
service='service where pneumonia acquired'
medical='medical patient'
VAP='ventilator-acquired pneumonia'

86
BSI='secondary bloodstream infection'
spec='type of respiratory specimen'
test='respiratory specimen obtained'
prebiotic='on antibiotic when specimen taken'
riskbug='MRSA, P.aeruginosa,or Acinetobacter isolated'
IDSAtreat='patient received recommended empiric drugs'
IDSAdura='patient received recommended duration of therapy'
Orgcover='antibiotics covered bacteria grown'
Treatdays='duration of pneumonia treatment'
mortal='28 day outcome'
earlymort = 'outcome at 15 days'
incident='pneumonia onset within 3 days of survey'
early='pneumonia onset within 4 days of admission'
short ='treatment less that 8 days'
site='hospital';
Format sex sex. mcabe mcabe. smoke smoke. service service.
spec spec. treatdays treatdays.;
run;
*To summarize contents of the labelled database;
proc contents data=sasuser.pneumo_july4a varnum;
run;
* To sort the data by gender;
Proc sort data=sasuser.pneumo_july4a;

87
by sex;
run;
* To sort the data by mortal;
Proc sort data=sasuser.pneumo_july4a;
by mortal;
run;
* To sort the data by status;
Proc sort data=sasuser.pneumo_july4a;
by status;
run;
* to generate descriptive statistics for pneumonia study;
proc univariate data=sasuser.pneumo_july4a normal plot;
Title'Descriptive Statistics - Entire Group';
var age conds LOS prepnu postpnu vdays icudays apache prev pretreatdays
RR pulse MBP temp O2 hct WBC Cr alb glu;
ID ID;
run;
* to generate descriptive statistics by day 28 outcome;
proc univariate data=sasuser.pneumo_july4a normal plot;
Title'Descriptive Statistics - 28 Day Outcome';
by mortal;
var age conds LOS prepnu postpnu vdays icudays apache prev pretreatdays;
run;

88
* to generate descriptive statistics by discharge outcome;
proc univariate data=sasuser.pneumo_july4a normal plot;
Title'Descriptive Statistics - Discharge Outcome';
by status;
var age conds LOS prepnu postpnu vdays icudays apache prev pretreatdays;
run;
* to compare age, etc. among various groups;
proc ttest data=sasuser.pneumo_july4a;
title' continuous variables by discharge status';
class status;
var age conds LOS prepnu postpnu vdays icudays apache prev pretreatdays;
run;
* to compare age, etc. among various groups;
proc ttest data=sasuser.pneumo_july4a;
title' continuous variables by 28 day status';
class mortal;
var age conds LOS prepnu postpnu vdays icudays apache prev pretreatdays;
run;
* to compare age, etc. among various groups;
proc ttest data=sasuser.pneumo_july4a;
title' continuous variables by sex';
class sex;

89
var age conds LOS prepnu postpnu vdays icudays apache prev pretreatdays;
run;
* to compare age, etc. among various groups;
proc ttest data=sasuser.pneumo_july4a;
title' continuous variables by presence of risk bug';
class riskbug;
var age conds LOS prepnu postpnu vdays icudays apache prev pretreatdays;
run;
* to compare age, etc. among various groups;
proc ttest data=sasuser.pneumo_july4a;
title' continuous variables by treated according to IDSA criteria';
class IDSAtreat;
var age conds LOS prepnu postpnu vdays icudays apache prev pretreatdays;
run;
* to compare age, etc. among various groups;
proc ttest data=sasuser.pneumo_july4a;
title' continuous variables by whether pneumonia criteria met';
class crit;
var age conds LOS prepnu postpnu vdays icudays apache prev pretreatdays;
run;
* to compare age, etc. among various groups;
proc ttest data=sasuser.pneumo_july4a;
title' continuous variables by whether a specimen was sent';

90
class test;
var age conds LOS prepnu postpnu vdays icudays apache prev pretreatdays;
run;
* to compare age, etc. among various groups;
proc ttest data=sasuser.pneumo_july4a;
title' continuous variables by whether it was an incident pneumonia';
class incident;
var age conds LOS prepnu postpnu vdays icudays apache prev pretreatdays;
run;
* to compare age, etc. among various groups;
proc ttest data=sasuser.pneumo_july4a;
title' continuous variables by presence of early pneumonia';
class early;
var age conds LOS prepnu postpnu vdays icudays apache prev pretreatdays;
run;
* to compare age, etc. among various groups;
proc ttest data=sasuser.pneumo_july4a;
title' continuous variables by presence of medical patient';
class medical;
var age conds LOS prepnu postpnu vdays icudays apache prev pretreatdays;
run;
* to compare age, etc. among various groups;
proc ttest data=sasuser.pneumo_july4a;

91
title' continuous variables by 15 day status';
class earlymort;
var age conds LOS prepnu postpnu vdays icudays apache prev pretreatdays;
run;
* to compare pretreatment days among surgery vs non-surgery patients;
proc ttest data=sasuser.pneumo_july4a;
title' pretreatment days by whether surgery patient';
class surg;
var pretreatdays;
run;
* to compare pretreatment days among ICU vs non-ICU patients;
proc ttest data=sasuser.pneumo_july4a;
title' pretreatment days by whether ICU patient';
class ICU;
var pretreatdays;
run;
* to compare pretreatment days among fatal and non-fatal McCabe patients;
proc ttest data=sasuser.pneumo_july4a;
title' pretreatment days by whether fatal or nonfatal McCabe patient';
class fatalMcCabe;
var pretreatdays;
run;
* to compare the number of conditions among various groups;

92
proc npar1way data=sasuser.pneumo_july4a wilcoxon;
title' comparison of number of conditions by sex';
class sex;
var conds; exact wilcoxon;
run;
* to compare the number of conditions among various groups;
proc npar1way data=sasuser.pneumo_july4a wilcoxon;
title' comparison of number of conditions by discharge status ';
class status;
var conds; exact wilcoxon;
run;
* to compare the number of conditions among various groups;
proc npar1way data=sasuser.pneumo_july4a wilcoxon;
title' comparison of number of conditions by 28 day outcome ';
class mortal;
var conds; exact wilcoxon;
run;
* to compare the number of conditions among various groups;
proc npar1way data=sasuser.pneumo_july4a wilcoxon;
title' comparison of number of conditions by whether pneumonia criteria met
';
class crit;
var conds; exact wilcoxon;

93
run;
* to compare the number of conditions among various groups;
proc npar1way data=sasuser.pneumo_july4a wilcoxon;
title' comparison of number of conditions by whether pneumonia criteria met
';
class early;
var conds; exact wilcoxon;
run;
* to compare the number of conditions among various groups;
proc npar1way data=sasuser.pneumo_july4a wilcoxon;
title' comparison of number of conditions by whether pneumonia criteria met
';
class medical;
var conds; exact wilcoxon;
run;
* to compare the number of conditions among various groups;
proc npar1way data=sasuser.pneumo_july4a wilcoxon;
title' comparison of number of conditions by presence of a risk bug ';
class riskbug;
var conds; exact wilcoxon;
run;
* to compare the number of conditions among various groups;
proc npar1way data=sasuser.pneumo_july4a wilcoxon;

94
title' comparison of number of conditions by whether treated according to
IDSA guidelines ';
class IDSAtreat;
var conds; exact wilcoxon;
run;
* to compare number of pretreatment days among McCabe classes;
proc npar1way data=sasuser.pneumo_july4a wilcoxon;
title' comparison of pretreatment days among McCabe classes ';
class Mcabe;
var pretreatdays; exact wilcoxon;
run;
* to generate frequency counts for categorical variables;
proc freq data=sasuser.pneumo_july4a;
title ' Frequency Counts for Categorical Variables';
Tables sex status mortal earlymort MCabe morbid smoker surg vent CPAP trach
ICU NI steroid antibiotic
chemo suppress immsupp crit service medical VAP early incident BSI
test prebiotic riskbug IDSAtreat
IDSAdura orgcover treatdays short site;
run;
* to determine correlations between age, number of conditions, number of
ventilator days,
number of ICU days, and APACHE score;
proc corr data=sasuser.pneumo_july4a pearson spearman nosimple Best=8;
title' Correlations between continuous variables';

95
var age conds LOS prepnu postpnu vdays ICUdays prev apache;
run;
* to determine correlations between age, pretreatment days and APACHE score;
proc corr data=sasuser.pneumo_july4a pearson spearman nosimple;
title' Correlations between age, Apache, and pretreatment days';
var age apache pretreatdays;
run;
* To evaluate partial correlations;
proc corr data=sasuser.pneumo_july4a nosimple;
Title ' Role of age in correlation between LOS, prepnu, postpnu, vdays,
ICUdays, pretreatdays and APACHE';
var LOS prepnu postpnu vdays ICUdays pretreatdays;
with APACHE;
partial age;
run;
* to examine whether outcome is affected by number of conditions;
proc freq data=sasuser.pneumo_july4a;
title ' chi-square test for trend';
tables (status mortal)* conds/chisq;
run;
* to analyze discharge and 28 day outcomes according to key variables;
proc freq data=sasuser.pneumo_july4a;

96
tables (sex fatalMcCabe rapidMcCabe slowMcCabe rapidMccabe1 MCabe morbid
smoker surg vent ICU NI steroid antibiotic chemo immsupp
incident suppress crit service medical VAP early BSI test riskbug
IDSAtreat IDSAdura orgcover
treatdays short site)* (status mortal earlymort)/chisq CMH;
run;
* to compare key variables between men and women;
proc freq data=sasuser.pneumo_july4a;
tables (MCabe morbid smoker surg vent ICU NI steroid antibiotic chemo
immsupp
incident suppress crit service medical VAP early BSI test riskbug
IDSAtreat IDSAdura orgcover
treatdays short)* (sex)/chisq CMH;
run;
* to run regression analysis: predictors of 28 day outcome;
proc logistic data=sasuser.pneumo_july4a;
title'Model 1 McCabe:28 day outcome; p<0.10 excluding riskbug';
model mortal=age sex apache pretreatdays mcabe
surg ICU BSI spec service/
selection=forward
ctable pprob = (0 to 1 by 0.1)
lackfit
risklimits;
run;
* to run regression analysis: predictors of 28 day outcome;

97
proc logistic data=sasuser.pneumo_july4a;
title'Model 2 McCabe:28 day outcome; p<0.10 including riskbug';
model mortal=age sex apache pretreatdays mcabe
surg ICU BSI spec service riskbug/
selection=forward
ctable pprob = (0 to 1 by 0.1)
lackfit
risklimits;
run;
* to run regression analysis: predictors of 28 day outcome;
proc logistic data=sasuser.pneumo_july4a;
title'Model 3 McCabe: 28 day outcome; p<0.05 excluding riskbug';
model mortal=mcabe surg ICU service pretreatdays/
selection=forward
ctable pprob = (0 to 1 by 0.1)
lackfit
risklimits;
run;
* to run regression analysis: predictors of 28 day outcome;
proc logistic data=sasuser.pneumo_july4a;
title'Model 4 McCabe: 28 day outcome; p<0.05 including riskbug';
model mortal=mcabe surg ICU service pretreatdays riskbug/
selection=forward

98
ctable pprob = (0 to 1 by 0.1)
lackfit
risklimits;
run;
* to run regression analysis: predictors of 28 day outcome;
proc logistic data=sasuser.pneumo_july4a;
title'Model 5 McCabe: 28 day outcome; p<0.10 include riskbug/exclude BSI';
model mortal=age sex apache pretreatdays mcabe
surg ICU spec service riskbug/
selection=forward
ctable pprob = (0 to 1 by 0.1)
lackfit
risklimits;
run;
* to run regression analysis: predictors of 28 day outcome;
proc logistic data=sasuser.pneumo_july4a;
title'Model 6 McCabe: 28 day outcome; p<0.10 include riskbug/exclude
BSI,service';
model mortal=age sex apache pretreatdays mcabe
surg ICU spec riskbug/
selection=forward
ctable pprob = (0 to 1 by 0.1)
lackfit

99
risklimits;
run;
* to run regression analysis: predictors of 28 day outcome;
proc logistic data=sasuser.pneumo_july4a;
title'Model 7 McCabe:28 day outcome; p<0.10 excluding riskbug and BSI';
model mortal=age sex apache pretreatdays mcabe
surg ICU spec service/
selection=forward
ctable pprob = (0 to 1 by 0.1)
lackfit
risklimits;
run;
* to run regression analysis: predictors of 28 day outcome;
proc logistic data=sasuser.pneumo_july4a;
title'Model 8 McCabe: 28 day outcome;with potential interactions';
model mortal=age sex apache pretreatdays mcabe
surg ICU spec riskbug age*pretreatdays apache*pretreatdays
spec*pretreatdays riskbug*pretreatdays/
selection=forward
ctable pprob = (0 to 1 by 0.1)
lackfit
risklimits;
run;

100
* to run regression analysis: predictors of 28 day outcome;
proc logistic data=sasuser.pneumo_july4a;
title'Model 1 Rapid: 28 day outcome; p<0.10 excluding riskbug';
model mortal=age sex apache pretreatdays rapidmccabe
surg ICU BSI spec service/
selection=forward
ctable pprob = (0 to 1 by 0.1)
lackfit
risklimits;
run;
* to run regression analysis: predictors of 28 day outcome;
proc logistic data=sasuser.pneumo_july4a;
title'Model 2 Rapid: 28 day outcome; p<0.10 including riskbug';
model mortal=age sex apache pretreatdays rapidmccabe
surg ICU BSI spec service riskbug/
selection=forward
ctable pprob = (0 to 1 by 0.1)
lackfit
risklimits;
run;
* to run regression analysis: predictors of 28 day outcome;
proc logistic data=sasuser.pneumo_july4a;
title'Model 3 Rapid: 28 day outcome; p<0.05 excluding riskbug';
101
model mortal=rapidmccabe surg ICU service pretreatdays/
selection=forward
ctable pprob = (0 to 1 by 0.1)
lackfit
risklimits;
run;
* to run regression analysis: predictors of 28 day outcome;
proc logistic data=sasuser.pneumo_july4a;
title'Model 4 Rapid: 28 day outcome; p<0.05 including riskbug';
model mortal=rapidmccabe surg ICU service pretreatdays
riskbug/
selection=forward
ctable pprob = (0 to 1 by 0.1)
lackfit
risklimits;
run;
* to run regression analysis: predictors of 28 day outcome;
proc logistic data=sasuser.pneumo_july4a;
title'Model 5 Rapid:28 day outcome; p<0.10 include riskbug/exclude BSI';
model mortal=age sex apache pretreatdays rapidmccabe
surg ICU spec service riskbug/
selection=forward
ctable pprob = (0 to 1 by 0.1)

102
lackfit
risklimits;
run;
* to run regression analysis: predictors of 28 day outcome;
proc logistic data=sasuser.pneumo_july4a;
title'Model 6 Rapid:28 day outcome; p<0.10 include riskbug/exclude
BSI,service';
model mortal=age sex apache pretreatdays rapidmccabe
surg ICU spec riskbug/
selection=forward
ctable pprob = (0 to 1 by 0.1)
lackfit
risklimits;
run;
* to run regression analysis: predictors of 28 day outcome;
proc logistic data=sasuser.pneumo_july4a;
title'Model 7 Rapid:28 day outcome; p<0.10 excluding riskbug and BSI';
model mortal=age sex apache pretreatdays rapidmccabe
surg ICU spec service/
selection=forward
ctable pprob = (0 to 1 by 0.1)
lackfit
risklimits;

103
run;
* to run regression analysis: predictors of 28 day outcome;
proc logistic data=sasuser.pneumo_july4a;
title'Model 8 Rapid: 28 day outcome;with potential interactions';
model mortal=age sex apache pretreatdays rapidmccabe
surg ICU spec riskbug age*pretreatdays apache*pretreatdays
spec*pretreatdays riskbug*pretreatdays/
selection=forward
ctable pprob = (0 to 1 by 0.1)
lackfit
risklimits;
run;
* to run regression analysis: predictors of 28 day outcome;
proc logistic data=sasuser.pneumo_july4a;
title'Model 1 Slow:28 day outcome; p<0.10 excluding riskbug';
model mortal=age sex apache pretreatdays slowmccabe
surg ICU BSI spec service/
selection=forward
ctable pprob = (0 to 1 by 0.1)
lackfit
risklimits;
run;
* to run regression analysis: predictors of 28 day outcome;

104
proc logistic data=sasuser.pneumo_july4a;
title'Model 2 Slow:28 day outcome; p<0.10 including riskbug';
model mortal=age sex apache pretreatdays slowmccabe
surg ICU BSI spec service riskbug/
selection=forward
ctable pprob = (0 to 1 by 0.1)
lackfit
risklimits;
run;
* to run regression analysis: predictors of 28 day outcome;
proc logistic data=sasuser.pneumo_july4a;
title'Model 3 Slow: 28 day outcome; p<0.05 excluding riskbug';
model mortal=slowmccabe surg ICU service pretreatdays/
selection=forward
ctable pprob = (0 to 1 by 0.1)
lackfit
risklimits;
run;
* to run regression analysis: predictors of 28 day outcome;
proc logistic data=sasuser.pneumo_july4a;
title'Model 4 Slow:28 day outcome; p<0.05 including riskbug';
model mortal=slowmccabe surg ICU service pretreatdays riskbug/
selection=forward

105
ctable pprob = (0 to 1 by 0.1)
lackfit
risklimits;
run;
* to run regression analysis: predictors of 28 day outcome;
proc logistic data=sasuser.pneumo_july4a;
title'Model 5 Slow: 28 day; p<0.10 include riskbug/exclude BSI';
model mortal=age sex apache pretreatdays slowmccabe
surg ICU spec service riskbug/
selection=forward
ctable pprob = (0 to 1 by 0.1)
lackfit
risklimits;
run;
* to run regression analysis: predictors of 28 day outcome;
proc logistic data=sasuser.pneumo_july4a;
title'Model 6 Slow: 28 day outcome; p<0.10 include riskbug/exclude
BSI,service';
model mortal=age sex apache pretreatdays slowmccabe
surg ICU spec riskbug/
selection=forward
ctable pprob = (0 to 1 by 0.1)
lackfit

106
risklimits;
run;
* to run regression analysis: predictors of 28 day outcome;
proc logistic data=sasuser.pneumo_july4a;
title'Model 7 Slow:28 day outcome; p<0.10 excluding riskbug and BSI';
model mortal=age sex apache pretreatdays slowmcabe
surg ICU spec service/
selection=forward
ctable pprob = (0 to 1 by 0.1)
lackfit
risklimits;
run;
* to run regression analysis: predictors of 28 day outcome;
proc logistic data=sasuser.pneumo_july4a;
title'Model 8 Slow:28 day outcome;with potential interactions';
model mortal=age sex apache pretreatdays slowmccabe
surg ICU spec riskbug age*pretreatdays apache*pretreatdays
spec*pretreatdays riskbug*pretreatdays/
selection=forward
ctable pprob = (0 to 1 by 0.1)
lackfit
risklimits;
run;

107
* to run regression analysis: predictors of 28 day outcome;
proc logistic data=sasuser.pneumo_july4a;
title'Model 1 Rapid1:28 day outcome; p<0.10 excluding riskbug';
model mortal=age sex apache pretreatdays rapidmccabe1
surg ICU BSI spec service/
selection=forward
ctable pprob = (0 to 1 by 0.1)
lackfit
risklimits;
run;
* to run regression analysis: predictors of 28 day outcome;
proc logistic data=sasuser.pneumo_july4a;
title'Model 2 Rapid1:28 day outcome; p<0.10 including riskbug';
model mortal=age sex apache pretreatdays rapidmccabe1
surg ICU BSI spec service riskbug/
selection=forward
ctable pprob = (0 to 1 by 0.1)
lackfit
risklimits;
run;
* to run regression analysis: predictors of 28 day outcome;
proc logistic data=sasuser.pneumo_july4a;
title'Model 3 Rapid1:28 day outcome; p<0.05 excluding riskbug';

108
model mortal=rapidmccabe1 surg ICU service pretreatdays/
selection=forward
ctable pprob = (0 to 1 by 0.1)
lackfit
risklimits;
run;
* to run regression analysis: predictors of 28 day outcome;
proc logistic data=sasuser.pneumo_july4a;
title'Model 4 Rapid1:28 day outcome; p<0.05 including riskbug';
model mortal=rapidmccabe1 surg ICU service pretreatdays
riskbug/
selection=forward
ctable pprob = (0 to 1 by 0.1)
lackfit
risklimits;
run;
* to run regression analysis: predictors of 28 day outcome;
proc logistic data=sasuser.pneumo_july4a;
title'Model 5 Rapid1: 28 day outcome; p<0.10 include riskbug/exclude BSI';
model mortal=age sex apache pretreatdays rapidmccabe1
surg ICU spec service riskbug/
selection=forward
ctable pprob = (0 to 1 by 0.1)

109
lackfit
risklimits;
run;
* to run regression analysis: predictors of 28 day outcome;
proc logistic data=sasuser.pneumo_july4a;
title'Model 6 Rapid1:28 day outcome; p<0.10 include riskbug/exclude
BSI,service';
model mortal=age sex apache pretreatdays rapidmccabe1
surg ICU spec riskbug/
selection=forward
ctable pprob = (0 to 1 by 0.1)
lackfit
risklimits;
run;
* to run regression analysis: predictors of 28 day outcome;
proc logistic data=sasuser.pneumo_july4a;
title'Model 7 Rapid1:28 day outcome; p<0.10 excluding riskbug and BSI';
model mortal=age sex apache pretreatdays rapidmccabe1
surg ICU spec service/
selection=forward
ctable pprob = (0 to 1 by 0.1)
lackfit
risklimits;

110
run;
* to run regression analysis: predictors of 28 day outcome;
proc logistic data=sasuser.pneumo_july4a;
title'Model 8 Rapid1:28 day outcome;with potential interactions';
model mortal=age sex apache pretreatdays rapidmccabe1
surg ICU spec riskbug age*pretreatdays apache*pretreatdays
spec*pretreatdays riskbug*pretreatdays/
selection=forward
ctable pprob = (0 to 1 by 0.1)
lackfit
risklimits;
run;
* to run regression analysis: predictors of 28 day outcome;
proc logistic data=sasuser.pneumo_july4a;
title'Model 1 Fatal:28 day outcome; p<0.10 excluding riskbug';
model mortal=age sex apache pretreatdays fatalmccabe
surg ICU BSI spec service/
selection=forward
ctable pprob = (0 to 1 by 0.1)
lackfit
risklimits;
run;
* to run regression analysis: predictors of 28 day outcome;

111
proc logistic data=sasuser.pneumo_july4a;
title'Model 2 Fatal: 28 day outcome; p<0.10 including riskbug';
model mortal=age sex apache pretreatdays fatalmccabe
surg ICU BSI spec service riskbug/
selection=forward
ctable pprob = (0 to 1 by 0.1)
lackfit
risklimits;
run;
* to run regression analysis: predictors of 28 day outcome;
proc logistic data=sasuser.pneumo_july4a;
title'Model 3 Fatal:28 day outcome; p<0.05 excluding riskbug';
model mortal=fatalmccabe surg ICU service pretreatdays/
selection=forward
ctable pprob = (0 to 1 by 0.1)
lackfit
risklimits;
run;
* to run regression analysis: predictors of 28 day outcome;
proc logistic data=sasuser.pneumo_july4a;
title'Model 4 Fatal:28 day outcome; p<0.05 including riskbug';
model mortal=fatalmccabe surg ICU service pretreatdays
riskbug/

112
selection=forward
ctable pprob = (0 to 1 by 0.1)
lackfit
risklimits;
run;
* to run regression analysis: predictors of 28 day outcome;
proc logistic data=sasuser.pneumo_july4a;
title'Model 5 Fatal: 28 day outcome; p<0.10 include riskbug/exclude BSI';
model mortal=age sex apache pretreatdays fatalmccabe
surg ICU spec service riskbug/
selection=forward
ctable pprob = (0 to 1 by 0.1)
lackfit
risklimits;
run;
* to run regression analysis: predictors of 28 day outcome;
proc logistic data=sasuser.pneumo_july4a;
title'Model 6 Fatal:28 day outcome; p<0.10 include riskbug/exclude
BSI,service';
model mortal=age sex apache pretreatdays fatalmccabe
surg ICU spec riskbug/
selection=forward
ctable pprob = (0 to 1 by 0.1)

113
lackfit
risklimits;
run;
* to run regression analysis: predictors of 28 day outcome;
proc logistic data=sasuser.pneumo_july4a;
title'Model 7 Fatal:28 day outcome; p<0.10 excluding riskbug and BSI';
model mortal=age sex apache pretreatdays fatalmccabe
surg ICU spec service/
selection=forward
ctable pprob = (0 to 1 by 0.1)
lackfit
risklimits;
run;
* to run regression analysis: predictors of 28 day outcome;
proc logistic data=sasuser.pneumo_july4a;
title'Model 8 Fatal:28 day outcome;with potential interactions';
model mortal=age sex apache pretreatdays fatalmccabe
surg ICU spec riskbug age*pretreatdays apache*pretreatdays
spec*pretreatdays riskbug*pretreatdays/
selection=forward
ctable pprob = (0 to 1 by 0.1)
lackfit
risklimits;

114
run;
* to run regression analysis: predictors of 28 day outcome;
proc logistic data=sasuser.pneumo_july4a;
title'Model 9 McCabe: 28 day outcome;all factors < 0.05 except service';
model mortal=pretreatdays mcabe surg ICU riskbug/
selection=forward
ctable pprob = (0 to 1 by 0.1)
lackfit
risklimits;
run;
* to run regression analysis: predictors of 28 day outcome;
proc logistic data=sasuser.pneumo_july4a;
title'Model 9 Rapid1: 28 day outcome;all factors < 0.05 except service';
model mortal=pretreatdays rapidmccabe1 surg ICU riskbug/
selection=forward
ctable pprob = (0 to 1 by 0.1)
lackfit
risklimits;
run;
* to run regression analysis: predictors of 28 day outcome;
proc logistic data=sasuser.pneumo_july4a;
title'Model 9 Fatal: 28 day outcome;all factors < 0.05 except service';
model mortal=pretreatdays fatalmccabe surg ICU riskbug/

115
selection=forward
ctable pprob = (0 to 1 by 0.1)
lackfit
risklimits;
run;
* to run regression analysis: predictors of 28 day outcome;
proc logistic data=sasuser.pneumo_july4a;
title'Model 10 Rapid1: 28 day outcome; p<0.10 excluding service, risk bug,
and BSI';
model mortal=rapidMccabe1 age sex apache pretreatdays
surg ICU spec/
selection=forward
ctable pprob = (0 to 1 by 0.1)
lackfit
risklimits;
run;
* to run regression analysis: predictors of 28 day outcome;
proc logistic data=sasuser.pneumo_july4a;
title'Model 11 No McCabe: 28 day outcome; p<0.05 excluding McCabe';
model mortal=pretreatdays surg ICU service riskbug/
selection=forward
ctable pprob = (0 to 1 by 0.1)
lackfit

116
risklimits;
run;
* to compare specimen collection between VAP and non-VAP patients;
proc freq data=sasuser.pneumo_july4a;
tables test* VAP /chisq CMH;
run;
* to compare survival and McCabe scores between incident and prevalent NP;
proc freq data=sasuser.pneumo_july4a;
tables incident*(status mortal mcabe) /chisq CMH;
quit;