EPIDEMIOLOGY: Introduction to the Agent-based epidemic modeling Dr. Qi Mi Department of Sports...
39
EPIDEMIOLOGY: Introduction to the Agent-based epidemic modeling Dr. Qi Mi Department of Sports Medicine and Nutrition, SHRS, Univ. of Pitt
-
date post
19-Dec-2015 -
Category
Documents
-
view
216 -
download
1
Transcript of EPIDEMIOLOGY: Introduction to the Agent-based epidemic modeling Dr. Qi Mi Department of Sports...

EPIDEMIOLOGY: Introduction to the Agent-based epidemic modeling
Dr. Qi MiDepartment of Sports Medicine and
Nutrition, SHRS, Univ. of Pitt

Why An Epidemic Model?• The study of how disease is distributed
in populations and the factors that influence or determine this distribution
• Epidemics have been responsible for great losses of life and have acted as a population control (Black Plague, Spanish Influenza)and are still a cause of concern today and in the future (SARS, H1N1 Swine Flu)
• The study is important in understanding and preventing the spread of disease throughout a population.
http://www.solarnavigator.net/animal_kingdom/animal_images/death_black_plague_street_scene.jpg

Host
Agent Environment
vector
Fig1. The epidemiologic triad of a disease
Age, sex ,occupation or the immune status of the individual
Biological (bacteria, viruses), chemical (poisons), physical (trauma from radiation or fire)
Temperature, humidity, housing, availability of food and water

Why Agent-Based?• Originally tried System
Dynamics• Agent-Based Modeling makes
more sense– Individual behaviors differ and
can greatly affect the course of an epidemic outbreak
– A user can observe an individual agent over time
– Good visual representation

Features of Agent-based Modeling (ABM)
• Rule-based• Discrete-event/Discrete-time• Spatial• Parallelism• Stochastic• Ease to translate conceptual models to
executable formAn, G., Mi, Q., Dutta-Moscato, J., Vodovotz, Y., Agent-based Models in translational systems biology, Wiley Interdisciplinary Reviews: System Biology and Medicine, 2009 Volume1, Issue 2: 159-171

Components of ABM
• Turtle• Patch• Space

Two Samples
• AIDS• Tyhoid Fever on Disaster Area

ABM tool: NetLogo
• NetLogo 4.1 (Developed at Northwestern)• User friendly programming environment and
simple language (Logo like)• Cross-platform support–Windows, Linux, Mac
• Depends on Java• Free!

Tutorial 1: Sample model (Wolf Sheep Predation)

• Press the "setup" button. What do you see appear in the view? • Press the "go" button to start the simulation. As the model is running, what is happening to
the wolf and sheep populations? • Press the "go" button to stop the model.

Controlling the Model: Buttons
"forever" button
"once" button

Controlling speed: Speed Slider

Adjusting Settings: Sliders and Switches

• Press "setup" and "go" and let the model run for about a 100 time-ticks. (Note: there is a readout of the number of ticks right above the plot.)
• Stop the model by pressing the "go" button. What happened to the sheep over time?
Let's take a look and see what would happen to the sheep if we change one of the settings.
• Turn the "grass?" switch on. • Press "setup" and "go" and let the model run for a similar
amount of time as before. What did this switch do to the model? Was the outcome
the same as your previous run?

What would happen to the sheep population if there was more initial sheep and less initial wolves at the beginning of the simulation?
• Turn the "grass?" switch off. • Set the "initial-number-sheep" slider to 100. • Set the "initial-number-wolves" slider to 20. • Press "setup" and then "go". • Let the model run for about 100 time-ticks.

What other sliders or switches can be adjusted to help out the sheep population?
• Set "initial-number-sheep" to 80 and "initial-number-wolves" to 50. (This is close to how they were when you first opened the model.)
• Set "sheep-reproduce" to 10.0%. • Press "setup" and then "go". • Let the model run for about 100 time ticks. What happened to the wolves in this run?

Gathering Information: Plots and Monitors
Plot
Monitor

Controlling the View
. Press "setup" and then "go" to start the model running. . As the model runs, move the speed slider to the left. What happens? This slider is helpful if a model is running too fast for you to see what's going on in detail. . Move the speed slider to the middle. . Try moving the speed slider to the right. . Now try checking and unchecking the view updates checkbox. What happens?

Press “Settings”

In these diagrams, max-pxcor is 3 , min-pxcor is -3, max-pycor is 2 and min-pycor is -2.

Tutorial 2: Procedures
• You will now learn to write procedures that make turtles move, eat, reproduce, and die.
• You will also learn how to make monitors, sliders, and plots.


Press “setup”

Add “go” button


Patches and variables

Result

Turtle variables

Result

Monitors


Switches and labels


Result

More procedures

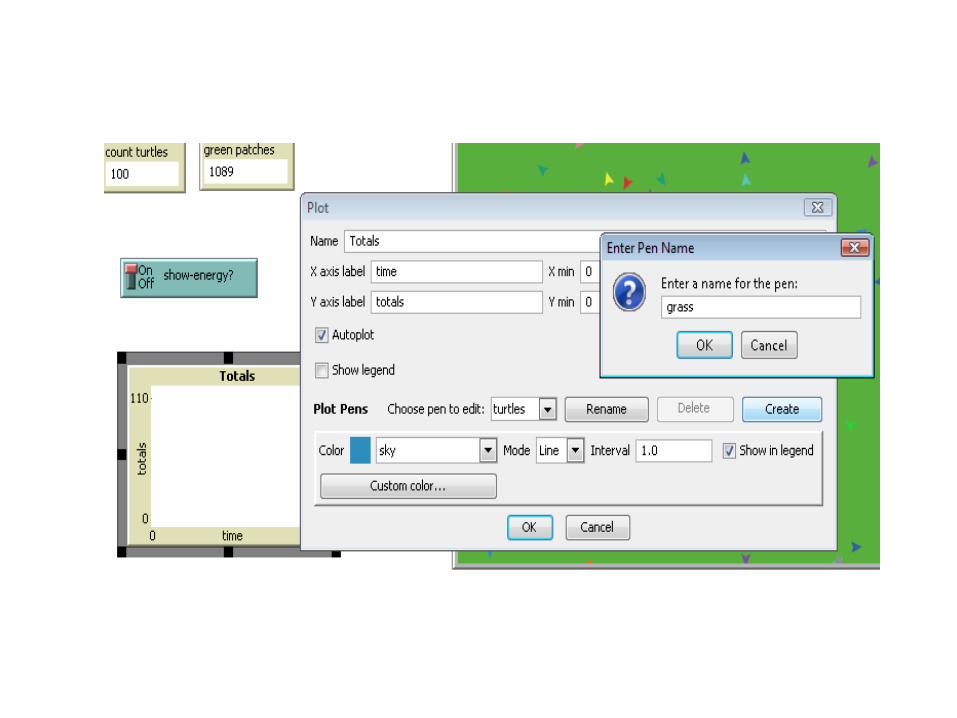
Plotting

SPARK is available at: www.pitt.edu/~cirm/SPARK