Epidemiology cheat sheet
4
Inductive reasoning: The process of making generalized inferences about ‘causation’ based on repeated observations. Deductive reasoning: The process of infer- ring that a general ‘law of nature’ exists and has application in a specific, or local, instance. Cause: Any factor that produces a change in severity or frequency of the outcome. Necessary cause: One without which the disease cannot occur. Sufficient cause: Produces the disease if the factor is present. Component-cause: One of a number of factors that, in combination, con Target Population: The population to which it might be possible to extrapolate re- sults from a study. Source Population: The population from which the study subjects are drawn. Study Sample/Group: Consists of the indi- viduals (animals or groups of animals) that end up in the study. Internal validity: The study results are valid for members of the source population. External validity: The study results are valid for the source population, target population, and beyond. Causal-web model: Consists of multi- ple indirect and direct causes. The fol- lowing is an example of a Causal-web model. Non-probability sampling: individual’s probability of selection is not determined (Judgment, Convenience, Purposive) Probability sampling: every element has a known non-zero probability of being included in the sample Simple random sample: Every study subject in the source population has an equal probability of being included. Systematic random sample: A complete list of the population to be sampled is not required provided an estimate of the total number of animals is available and all the animals are sequentially available. Stratified random sample: Prior to sampling, the population is divided into mutually exclu- sive strata based on factors likely to affect the outcome. Cluster sampling: Every study subject within the cluster (collection of subjects with 1 or more common characteristics) is included in the sample and the primary sampling unit is larger than the unit of concern. Multistage sampling: After the primary sam- pling unit is chosen, then a sample of secondary sampling units is selected. Targeted (risk-based) sampling: Animals are assigned point values based on the probability of them having the disease of interest and sam- pling is proportional to that estimate of risk. Sampling frame: List of all sampling units in the source population Type I (α) error: Concluding that the outcomes in the groups being compared are different (association exists) when they are not. Type II (β) error: Concluding that the outcomes are not different (no associa- tion) when they are Power: Probability that you will find a statistically significant difference when it exists and is of a certain magnitude (i.e. power = 1-β) Causal Concepts Sampling Epidemiological Concepts Outcomes and data analysis Continuous // dichotomous // nominal // count // time to event Animals Herds causal Areas inferences Indirect Cause Direct cause Direct Cause (Exposure) Outcome Created by Keila Perez [email protected]
description
Study guide on epidemiological concepts
Transcript of Epidemiology cheat sheet

Inductive reasoning: The process of making
generalized inferences about ‘causation’ based
on repeated observations.
Deductive reasoning: The process of infer-
ring that a general ‘law of nature’ exists and
has application in a specific, or local, instance.
Cause: Any factor that produces a change in
severity or frequency of the outcome.
Necessary cause: One without which the
disease cannot occur.
Sufficient cause: Produces the disease if the
factor is present.
Component-cause: One of a number of
factors that, in combination, con
Target Population: The population to
which it might be possible to extrapolate re-
sults from a study.
Source Population: The population from
which the study subjects are drawn.
Study Sample/Group: Consists of the indi-
viduals (animals or groups of animals) that
end up in the study.
Internal validity: The study results are valid
for members of the source population.
External validity: The study results are valid
for the source population, target population,
and beyond.
Causal-web model: Consists of multi-
ple indirect and direct causes. The fol-
lowing is an example of a Causal-web
model.
Non-probability sampling: individual’s
probability of selection is not determined
(Judgment, Convenience, Purposive)
Probability sampling: every element has
a known non-zero probability of being
included in the sample
Simple random sample: Every study
subject in the source population has an
equal probability of being included.
Systematic random sample: A complete
list of the population to be sampled is not
required provided an estimate of the total
number of animals is available and all the
animals are sequentially available.
Stratified random sample: Prior to sampling,
the population is divided into mutually exclu-
sive strata based on factors likely to affect the
outcome.
Cluster sampling: Every study subject within
the cluster (collection of subjects with 1 or
more common characteristics) is included in the
sample and the primary sampling unit is larger
than the unit of concern.
Multistage sampling: After the primary sam-
pling unit is chosen, then a sample of secondary
sampling units is selected.
Targeted (risk-based) sampling: Animals are
assigned point values based on the probability
of them having the disease of interest and sam-
pling is proportional to that estimate of risk.
Sampling frame: List of all sampling
units in the source population
Type I (α) error: Concluding that the
outcomes in the groups being compared
are different (association exists) when they
are not.
Type II (β) error: Concluding that the
outcomes are not different (no associa-
tion) when they are
Power: Probability that you will find a
statistically significant difference when it
exists and is of a certain magnitude (i.e.
power = 1-β)
Causal Concepts
Sampling
Epidemiological Concepts
Outcomes and data analysis
Continuous // dichotomous // nominal // count // time to event
Animals
Herds causal
Areas inferences
Indirect
Cause
Direct
cause
Direct
Cause
(Exposure)
Outcome
Created by Keila Perez
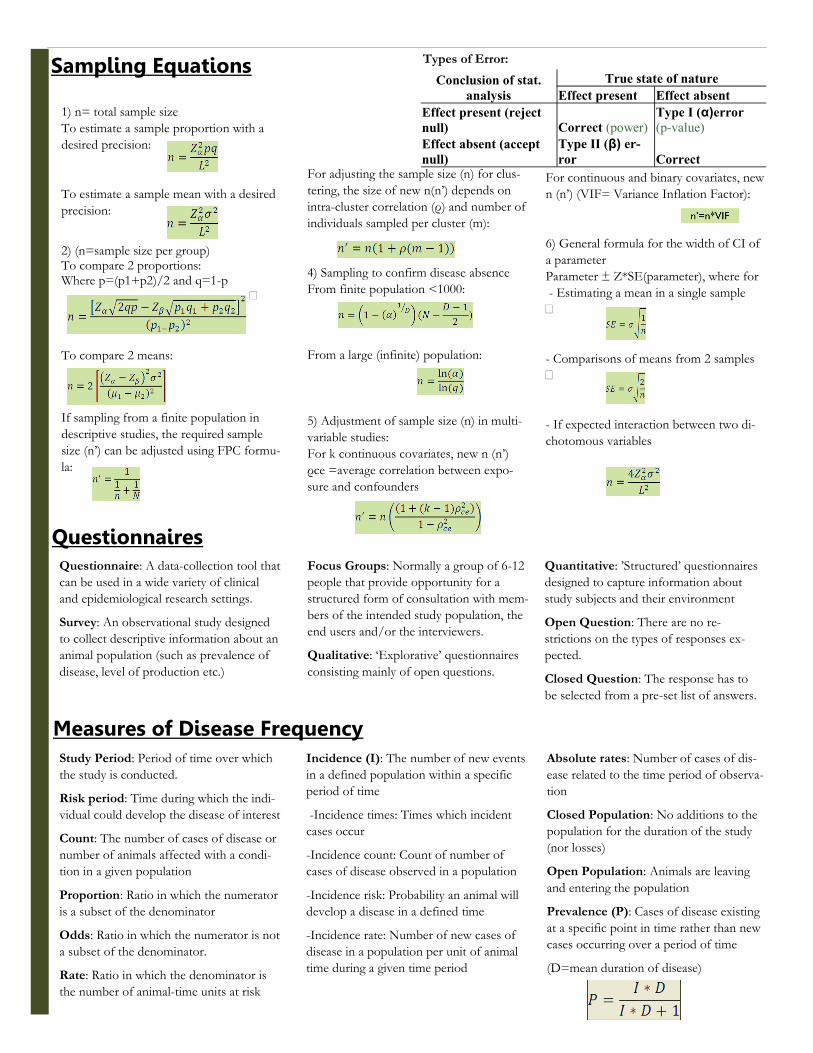
1) n= total sample size
To estimate a sample proportion with a
desired precision:
To estimate a sample mean with a desired
precision:
2) (n=sample size per group) To compare 2 proportions: Where p=(p1+p2)/2 and q=1-p
—
To compare 2 means:
If sampling from a finite population in
descriptive studies, the required sample
size (n’) can be adjusted using FPC formu-
la:
Incidence (I): The number of new events
in a defined population within a specific
period of time
-Incidence times: Times which incident
cases occur
-Incidence count: Count of number of
cases of disease observed in a population
-Incidence risk: Probability an animal will
develop a disease in a defined time
-Incidence rate: Number of new cases of
disease in a population per unit of animal
time during a given time period
Study Period: Period of time over which
the study is conducted.
Risk period: Time during which the indi-
vidual could develop the disease of interest
Count: The number of cases of disease or
number of animals affected with a condi-
tion in a given population
Proportion: Ratio in which the numerator
is a subset of the denominator
Odds: Ratio in which the numerator is not
a subset of the denominator.
Rate: Ratio in which the denominator is
the number of animal-time units at risk
Absolute rates: Number of cases of dis-
ease related to the time period of observa-
tion
Closed Population: No additions to the
population for the duration of the study
(nor losses)
Open Population: Animals are leaving
and entering the population
Prevalence (P): Cases of disease existing
at a specific point in time rather than new
cases occurring over a period of time
(D=mean duration of disease)
Sampling Equations
Focus Groups: Normally a group of 6-12
people that provide opportunity for a
structured form of consultation with mem-
bers of the intended study population, the
end users and/or the interviewers.
Qualitative: ‘Explorative’ questionnaires
consisting mainly of open questions.
Quantitative: ’Structured’ questionnaires
designed to capture information about
study subjects and their environment
Open Question: There are no re-
strictions on the types of responses ex-
pected.
Closed Question: The response has to
be selected from a pre-set list of answers.
Questionnaire: A data-collection tool that
can be used in a wide variety of clinical
and epidemiological research settings.
Survey: An observational study designed
to collect descriptive information about an
animal population (such as prevalence of
disease, level of production etc.)
Questionnaires
Measures of Disease Frequency
Conclusion of stat.
analysis
True state of nature
Effect present Effect absent
Effect present (reject
null) Correct (power) Type I (α)error
(p-value)
Effect absent (accept
null) Type II (β) er-
ror Correct
Types of Error:
For adjusting the sample size (n) for clus-
tering, the size of new n(n’) depends on
intra-cluster correlation (ρ) and number of
individuals sampled per cluster (m):
4) Sampling to confirm disease absence
From finite population <1000:
From a large (infinite) population:
5) Adjustment of sample size (n) in multi-
variable studies:
For k continuous covariates, new n (n’)
ρce =average correlation between expo-
sure and confounders
For continuous and binary covariates, new
n (n’) (VIF= Variance Inflation Factor):
6) General formula for the width of CI of
a parameter
Parameter ± Z*SE(parameter), where for
- Estimating a mean in a single sample
–
- Comparisons of means from 2 samples
–
- If expected interaction between two di-
chotomous variables

Measure of association (MA): Assesses
the magnitude of the relationship between
an exposure to a disease and a disease
Attributable fraction (Afe): Proportion
of diseases in exposed that is due to the
exposure
Approaches for hypothesis testing in-
clude:
- Estimating standard error (SE) of the
parameter as a measure of precision of the
point estimate (uncertainty)
- Compute test statistic and from the ex-
pected distribution of this test statistic
determine p-value
- Compute confidence interval (CI) for
the point estimate. CI reflect the level of
uncertainty in point estimates and indicate
the range of values that a parameter might
have (with values closer to the center being
more likely than those at the ends of the
range).
Multiple Tests Interpretation:
- Series: Result is considered positive only
if both tests are positive
- Parallel: result is considered positive if
either test is positive
Sensitivity (Se): proportion of diseased
animals that test positive (TP): p(T+|D+)
Specificity (Sp): proportion of non-
diseased animals that test negative (TN):
p(T-|D-)
Accuracy: Average is close to true value
Precision: The amount of variability
among test results.
Coefficient of variation (CV): Standard
Devation/Mean (for repeat runs on same
sample)
Pearson correlation coefficient (PCC):
Ignores the scales of the 2 sets of results
Concordance correlation coefficient
(CCC): Takes into account data position
from equality line.
Kappa Statistic: Measure of agreement
for tests with qualitative outcomes. Ranges
from 0 (poor agreement) to 1 (perfect
agreement.
Agreement: How well 2 different tests
agree on the same sample.
True prevalence: The true state of nature.
Apparent prevalence: The result in the
study due to imperfections in the diagnos-
tic tests.
Predictive Values: The probability that
the animal has or does not have the dis-
ease, given the test result.
—PV(+) = p(D+|T+)
—PV(-) = p(D-|T-)
Define cutoff: Sp increases, Se decreases.
See graph below.
Measures of Association
Diagnostic Tests
Interpretation of Risk ratio (RR), Rate ratio (IR), and Odds ratio (OR): <1 exposure is protective, =1 no effect, and >1 exposure is positively associated with disease
Interpretation of Risk difference (RD) and Incidence difference (IR): <0 exposure is protective, =0 no effect, and >0 exposure is positively associated with disease
The range for AFe: Values from 0 (risks equal regardless of exposure) to 1 (no disease in non-exposedà i.e. all disease is due to ex-posure). Vaccine efficacy is a form of AFe.

Cross-sectional Study: Objective is to esti-
mate some sort of population parameter. The
outcome frequency of measure is prevalence
since this study looks only a snip of time.
Cohort Study: A cohort is a group of sub-
jects with common exposure, and the objec-
tive of a cohort study is to evaluate causal
association between specific exposures and
outcome. Most often prospective.
Case-control Study: Objective is to evaluate
association(s) between exposure(s) and out-
come. Most often retrospective and deter-
mine cause.
Descriptive Study: Describe the nature of
the disease.
- Case report: Based on individual
- Case series: Based on group
- Survey: Based on population
Explanatory Study: Objective is to identi-
fy associations between factors (exposures)
and disease status. (Experimental and Ob-
servational Studies)
Experimental Study: Objective is to
identify the effect of an exposure that is
easy to manipulate (E.g. vaccine, drug)
Observational Study: Objective is to
study effect of complex exposures in natu-
ral state. Types: Cross-sectional, Cohort,
and Case-control study
Retrospective: Disease occurred when the
study began.
Prospective: The cases do not develop
until after the study begins and the cases
are enrolled in the study over time.
Study base: Population from which the
cases and controls are obtained.
Controlled trial: Planned experiment
carried out on subjects in their usual
environment (clinical trail in a clinical
setting)
•Phase I: (formulation trials): Trials in
healthy animals to evaluate safety of
the drug (dose, adverse reactions…)
•Phase II: Trials in a small number of
animals from the target population
(e.g., sick animals) to document the
activity of the drug. Might involve
before/after comparisons and often
without controls.
•Phase III: Large-scale experimental
studies to determine the efficacy of a
drug in a typical clinical population,
to monitor side effects and compare
the drug with other available treat-
ments. Should be based on random-
ized controlled trials!
•Phase IV: Post-registration trials
designed to evaluate the most effec-
tive way of using a product. Also,
should be carried out as randomized
Study Designs
Confounding: Due to effects of factors
other than the exposure of interest on the
observed measure of association.
Confounding control at the study de-
sign stage includes:
- Exclusion (Restricted sampling)
- Matching: Involves making distribution
of the extraneous factor(s) in the groups
being compared the same. Prevents con-
founding and may increase power of the
study.
Confounding control during analysis:
The Mantel-Haenszel (MH) estimator for
Categorical data with dichotomous expo-
sure. Will need: 1) to stratify data accord-
ing to the combination of levels of the
confounding variables; 2) examine stratum
specific measures; 3) assure that stratum
specific measures are equal using a homo-
geneity test; 4)calculate a pooled weighted
(adjusted) estimate of association
Selection bias: Composition of the study
group(s) differs from that in the source
population (and target population).
Information bias: Incorrectly measured/
classified subject’s exposure, outcome,
extraneous factors
Misclassification: Rearrangement of
study individuals into incorrect categories
because of errors in classifying exposure,
outcome or both
Non-differential Misclassification: If
misclassification of the exposure and the
outcome “disease” are independent. Will
bias the measures of association toward
the null.
Differential Misclassification: If the
errors in exposure classification are related
to the status of the outcome under study.
Resulting bias in the measure of associa-
tion might be in any direction
Measurement error: Errors in measuring
quantitative factors can lead to biased
measures of association.
Interaction: Stratum specific measures
different (based on the homogeneity test)
providing a more detailed description of
the relationship between exposure and
disease. Needs to be measured on either
the additive or multiplicative scale.
No interaction on an Additive scale:
(RR11 ‑ 1) = (RR10 ‑ 1) + (RR01 ‑ 1)
No interaction on a Multiplicative scale:
RR11 = RR10 * RR01
R11 = Pr(D|A1B1)
R10 = Pr(D|A1B0)
R01 = Pr(D|A0B1)
R00 = Pr(D|A0B0)
RR11 =R11/R00,
RR10 =R10/R00,
RR01 =R01/R00
Bias