Epidemiology and control profile of malaria in Kenya Schellenberg Dr Rebecca Kiptui National Malaria...
84
Epidemiology and control profile of malaria in Kenya
Transcript of Epidemiology and control profile of malaria in Kenya Schellenberg Dr Rebecca Kiptui National Malaria...

Epidemiology and control profile of malaria in
Kenya


List of Authors Affiliation
Abdisalan M Noor Information for Malaria Project (INFORM), Spatial Health Metrics Group,
KEMRI-Wellcome Trust Research Programme, Nairobi, Kenya
Peter Macharia
Paul Ouma
Stephen Oloo
Joseph Maina
Ezekiel Gogo
David Kyalo
Lukio Olweny
Caroline Kabaria
Damaris Kinyoki
Robert W Snow
Ngozi Erondu London School of Hygiene & Tropical Medicine, UK
David Schellenberg
Dr Rebecca Kiptui National Malaria Control Programme, Ministry of Health
Dr Kiambo Njagi
Mr Andrew Wamari
Mrs Christine Mbuli
Dr Ahmed Deen Omar
Dr Waqo Ejersa
Please use the following citation when quoting any part of the whole of this document: Ministry of Health (2016). The epidemiology and control profile of malaria in Kenya: reviewing the evidence to guide the future vector control. National Malaria Control Programme, Ministry of Health. Technical support provided by the LINK Project (London School of Hygiene & Tropical Medicine and the Information for Malaria (INFORM) Project, KEMRI-Wellcome Trust Research Programme), Nairobi, Kenya, April 2016.
Published by: National Malaria Control Programme
Ministry of Health
PO Box 1992 KNH
Nairobi 00202, Kenya
Email: [email protected]
http://www.nmcp.or.ke
The preparation of this report was made possible through financial assistance from the Department for International Development (DFID), UK. The opinions expressed in this publication do not necessarily reflect the views of the funder and or the UK Government. Publication: Version 1: The epidemiology and control profile of malaria in Kenya - printed June 2016. Version 2: Epidemiology and control profile of malaria in Kenya – reprinted March 2017.

Preface Over the last 15 years the Government and international donors under the Roll Back Malaria
Partnership have invested billions of shillings in reducing the burden of malaria in Kenya. In
particular, significant funding and technical support has been received from the GFATM, PMI, DFID, WHO and other partners. Across the country, tens of million insecticide treated nets
(ITNs) and artemisinin combination therapy (ACT) have been distributed to protect the
population and to treat those sick with malaria, respectively. In epidemic prone and a few
selected high burden counties, millions of households have also been covered with indoor
residual spraying (IRS). To build on these achievements, the National Malaria Strategy (NMS)
2009-2017 has even more ambitious goals to fulfil the fundamental vision of a malaria free
Kenya.
To achieve these goals, effective planning and allocation of resources is paramount. This
requires high quality evidence on the epidemiology of malaria, the distribution of population under different transmission settings and their access to various interventions. This evidence
must be at geographic units where relevant policy implementation decisions are made. Under
the new devolved system established by the 2010 Kenya constitution, the delivery of health care
to the population, including implementation of malaria prevention and treatment, has become
the role of the County government, with budgetary and regulatory support from the National
Ministry of Health. To support evidence-based decision making, the Kenya government, with
support from partners developed a detailed County malaria epidemiology and control profiles
in 2013. This effort was the first across sub-Saharan Africa to link resource allocation with such
detailed sub-national evidence in the epidemiology of malaria and has since been adopted by
several countries in the continent.
In the intervening years, new data on the malaria burden have become available and large scale
efforts at the scale up of malaria have been undertaken. Furthermore, updated profiles are also
required to mark the end of the Millennium Development Goals and develop baseline data for
the Sustainable Development Goals (SDGs). It is for these reasons that the NMCP, with financial
support from DFID has commissioned the Kenya Medical Research Institute/Wellcome Trust
Research Programme and the London School of Hygiene & Tropical Medicine of the United
Kingdom, under the LINK Project, to undertake a detailed review of the epidemiology and
control of malaria in Kenya. Updated data on malaria epidemiology and vector control and new
evidence on case management and prevention of malaria in pregnant women has been included.
The Ministry of Health is confident that the County epidemiology and control profiles developed
here will provide the basis for more efficient decision-making for malaria control. The Kenyan
government, in collaboration with donors and other partners, is confident that the country is on
track to achieve the goals set out in the NMS 2009-2018, the Vision 2030 and the SDGs.
Dr Kioko Jackson K. OGW
Director of Medical Services
Ministry of Health Kenya

Acknowledgements We acknowledge all those who have generously provided unpublished parasite, vectors and
intervention data, helped locate information or the geo-coordinates of data necessary to
complete the analysis and/or provided comments on this report:
Timothy Abuya, Kubaje Adazu, Willis Akhwale, Pauline Andang’o, Abdinasir Amin, Abdulkadir
Amin Awes, Ken Awuondo, Nathan Bakyaita, Fred Baliraine, Nabie Bayoh, Donatien Beguy,
Philip Bejon, Simon Brooker, Ann Buff, Maria Pia Chaparro, Leonard Cosmas, Jon Cox, Meghna
Desai, Mark Divall, Ulrike Fillinger, Lia Smith Florey, Kyoko Futami, Hellen Gatakaa, John
Gimnig, Andrew Githeko, Carol Gitonga, Adano Godana, Joana Greenfield, Helen Guyatt,
Katherine Halliday, Mary Hamel, Laura Hammitt, Christie Hershey, Allen Hightower, Tobias
Homan, Annabel Howard, Susan Imbahale, Rachel Jenkins, Chandy John, Elizabeth Juma,
Ephantus Kabiru, Lydia Kaduka, Jimmy Kahara, Akira Kaneko, Simon Kariuki, Christine Kerubo,
James Kiarie, Robert Kimbui, Charles King, Chris King, Rebecca Kiptui, Astrid Knoblauch, Yeri
Kombe, Feiko ter Kuile, Kayla Laserson, Tjalling Leenstra, Eugiena Lo, Brett Lowe, Hortance
Manda, Evans Mathenge, Agneta Mbithi, Charles Mbogo, Christine Mbuli, Margaret McKinnon,
Janet Midega, Noboru Minakawa, Sue Montgomery, Eric Muchiri, Samuel Muiruri, Richard
Mukabana, Dunstan Mukoko, Stephen Munga, Charles Mwandawiro, Joseph Mwangangi, Tabitha Mwangi, Miriam Mwjame, Charlotte Neumann, Emmily Ngetich, Kiambo Njagi, Patricia Njiri,
Patricia Njuguna, Oscar Nyangari, George Nyangweso, Christopher Nyundo, Christopher Odero,
Edna Ogada, Bernards Ogutu, Robi Okara, Bernard Okech, George Okello, Maurice Ombok,
Raymond Omollo, Simon Omollo, Monica Omondi, Samuel Oti Milka Owuor, Beth Rapuoda,
Josea Rono, Evan Secor, Dennis Shanks, Larry Slutsker, Bob Snow, David Soti, Jennifer
Stevenson, Willem Takken, Feiko Ter Kuile, Jacobien Veenemans, Davis Wachira, Juliana
Wambua, Vincent Were, Tom Williams, Shona Wilson, Guiyun Yan, Yazoume Ye, Guofa Zhou,
Dejan Zurovac.

Table of Contents
1. Introduction ................................................................................................................................................................... 1
2. Country context ............................................................................................................................................................ 2
2.1 Geography and climate ...................................................................................................................................... 2
2.2 Population ............................................................................................................................................................... 4
2.3 Administration ...................................................................................................................................................... 6
2.4 Health service delivery and mapping of health facilities ..................................................................... 8
3. Malaria control in Kenya – Milestones ............................................................................................................. 10
4. Mapping malaria risk .............................................................................................................................................. 19
4.1 Previous mapping of malaria risk in Kenya ........................................................................................... 19
4.2 Mapping P. falciparum malaria risk from 2000-2015 ........................................................................ 22
4.2.1 Parasite prevalence data ........................................................................................................................ 22
4.2.2 Geostatistical modelling of P. falciparum prevalence ................................................................ 23
4.3 Mapping the distribution of vectors .......................................................................................................... 27
5. Mapping of vector control interventions ........................................................................................................ 31
5.1 Scale-up of vector control in Kenya ........................................................................................................... 31
5.2 Number of ITNs distributed in Kenya, 2004-2015 .............................................................................. 32
5.3 Coverage and use of vector control in Kenya ........................................................................................ 37
5.3.1 Coverage and use of insecticide treated nets (ITNs).................................................................. 38
5.3.2 Coverage of indoor residual spraying (IRS) ................................................................................... 43
6. Prevention of malaria in pregnancy .................................................................................................................. 45
7. Malaria case management ..................................................................................................................................... 49
8. Key findings ................................................................................................................................................................. 53
8.1 Changing P. falciparum parasite prevalence .......................................................................................... 53
8.2 Progress in vector control interventions ................................................................................................ 53
8.3 Prevention of malaria in pregnancy .......................................................................................................... 54
8.4 Improvements in treatment-seeking and access to recommended treatment ....................... 54
9. Bibliography ................................................................................................................................................................ 55
Appendix A List of counties and sub-counties in Kenya................................................................................ 62
Appendix B Model-based geostatistical methods ............................................................................................ 67
Appendix C Small area estimation methods ....................................................................................................... 72

Abbreviations
ACT Artemisinin based Combination Therapy
AL Artemether-Lumefanthrine
ANC Ante-Natal Care
CBS Central Bureau of Statistics
CDC Centers for Disease Control and Prevention
CHW Community Health Worker
CQ Chloroquine
DEM Digital Elevation Map
DFID Department for International Development
DHMT District Health Management Teams
DOMC Division of Malaria Control
DSS Demographic Surveillance System
DVBD Division of Vector Borne Diseases
DVBND Division of Vector Borne and Neglected Diseases
EA Enumeration Area
EPI Expanded Programme on Immunization
EVI Enhanced Vegetation Index
FSD Financial Services Deepening
GIS Geographic Information System
GFATM Global Fund to Fight AIDS, Tuberculosis and Malaria
GMP Global Malaria Programme, WHO
GOK Government of Kenya
HIMAL Highland Malaria Project
HMIS Health Management Information System
IEC Information, Education and Communications
IEBC Independent Electoral and Boundaries Commission
IMCI Integrated Management of Childhood Illness
IPTp Intermittent Presumptive Treatment in Pregnancy
IRS Indoor Residual House Spraying
ITN Insecticide-Treated Nets
INFORM Information for Malaria
KAIS Kenya Aids Indicator Survey
KDHS Kenya Demographic & Health Survey
KEMRI Kenya Medical Research Institute KEMRI-WTRP Kenya Medical Research Institute-Wellcome Trust Research Programme
KEMSA Kenya Medical Supplies Agency
KEPI Kenya Expanded Programme on Immunization
KNBS Kenya National Bureau of Statistics
KNMS Kenya National Malaria Strategy
KSPA Kenya Service Provision Assessment
LLIN Long-Lasting Insecticidal Net
LSHTM London School of Hygiene & Tropical Medicine
M&E Monitoring and Evaluation
MDG Millennium Development Goal
MCH Maternal and Child Health
MIP Malaria in Pregnancy
MIS Malaria Indicator Survey

MOE Ministry of Education
MOH Ministry of Health
MOMS Ministry of Medical Services
MOPHS Ministry of Public Health & Sanitation
MPHD Malaria Public Health Department
NGO Non-Governmental Organisation
NHFD National Health Facility Database
NHSSP National Health Sector Strategic Plan
PfPR Plasmodium falciparum parasite rate
PfPR2-10 Plasmodium falciparum parasite rate standardised to ages 2 to 9 years
PMI President’s Malaria Initiative
PSI Population Services International
QN Quinine
RBM Roll Back Malaria
RBM-HWG Roll Back Malaria Harmonization Working group
RDT Rapid Diagnostic Test
SP Sulphadoxine-Pyrimethamine
TSI Temperature Suitability Index
UN United Nations
UNICEF United Nations Children’s Fund
USAID United States Agency for International Development
WHO World Health Organization

1
1. Introduction
In 2012, county-level malaria epidemiological profiles of Kenya were developed by the National Malaria Control Programme (NMCP) with funding from the United States President’s Malaria Initiative (PMI) and technical support from the Kenya Medical Research Institute-Wellcome Trust Research Programme (KEMRI-WTRP) and MEASURE Evaluation (Noor et al 2013). The county profiles have been the basis for sub-national malaria control planning since the devolution of health service delivery in 2013. This pioneering work represents the first initiative led by a Ministry of Health in sub-Saharan Africa to systematically assemble and analyze empirical malaria risk and intervention data and adapt control to the heterogeneous epidemiology of the disease. This approach to malaria epidemiological profiling has now been implemented in more than 20 countries in sub-Saharan Africa (SSA) through funding support from the United Kingdom Department for International Development (DFID)starting in 2013 (www.inform-malaria.org). At the same time, changes in the malaria funding landscape have led to an increasing demand for detailed epidemiological evidence as the basis for support and targeting of interventions. The Department for International Development’s support started as a Phase 1 pilot initiative in 2013-14 covering Ethiopia, the Democratic Republic of Congo, Ghana, Mali, Malawi, Nigeria, Tanzania and Uganda led by the KEMRI-WTRP’s Information for Malaria (INFORM) Project (www.inform-malaria.org). Since then, DFID extended funding to the LINK project, which is a partnership between the London School of Hygiene & Tropical Medicine (LSHTM) and INFORM (www.inform-malaria.org), to implement a four-year Phase II project beginning October 2014 to re-profile Kenya and the eight pilot countries and develop profiles in 14 new countries. The 2012 Kenya county epidemiological profiles generated considerable interest among malaria control stakeholders nationally and at the counties. A considerable amount of data relevant to malaria control has since become available in Kenya including: the largest ever Demographic and Health Survey (DHS) undertaken in 2014-15 designed to provide measures precise at the county level; the third national Malaria Indicator Survey (MIS) in 2015; the scale up of the second version of the District Health Information System (DHIS2); and the distribution data on the free mass distribution of long lasting Insecticidal Nets (LLINs) in 2014 and 2015. In line with the NMCP’s commitment to continuous assembly and use of the relevant evidence, it commissioned the LINK project team, in December 2015, to start the process of developing an updated county epidemiological profile in Kenya with the aim of providing information on sub-county variations in both malaria risk and intervention coverage to support better control planning at the county level. This report therefore represents the outcome and extensive assembly and analysis of malaria data in Kenya, building on the experiences of Phase 1, to better guide policy and operational decisions to improve malaria control at national and county levels.
2
2. Country context
2.1 Geography and climate
Kenya covers an area of 582,550 km2 and has a diverse ecology – savannah, tropical, equatorial, volcanic and tectonic. It is bordered by Tanzania to the south, Uganda to the west, South Sudan to the north-west, Ethiopia to the north and Somalia to the north-east. Approximately 80% of Kenya’s land is arid and semi-arid, only 20% is arable and only 1.9% of the total surface area is occupied by standing water (Figure 2.1a). The great East African Rift Valley extends from Lake Victoria to Lake Turkana and further south-east to the Indian Ocean. The country has a number of large rivers including the Tana, Galana, Turkwel and Nzoia. The arid and semi-arid areas, the savannah plateau and the coastal hinterland have considerably lower rainfall (Figure 2.1b) that is acutely seasonal with an annual average of about <250–500 mm. The Lake Victoria region, the western and central highlands receive the highest rainfall in the country and exhibit less seasonality. The “long rains” occur from March/April to May/June. The “short rains” occur from October to November/December. The start of these seasons depends largely on the location and altitude, whether lowlands or highlands. The hottest period is February and March, leading into the season of the long rains, and the coldest is in July, until mid-August. The varied topography and altitude contributes to large variations in ambient temperature (Figure 2.2c). The country has a warm and humid tropical climate on its 400 km Indian Ocean coastline, including the port city of Mombasa, which also serves as an importation gateway to other East African countries. The climate is cooler in the savannah grasslands around the capital, Nairobi, and increasingly cooler towards Mount Kenya. The Nyanza region experiences a hot and dry climate, which becomes humid around Lake Victoria. Away from the Lake, are the temperate and forested hilly areas in the neighbouring western highland region. The Kenyan Highlands comprise the greenest (Figure 2.1d) and one of the most successful agricultural production regions in Africa. The highlands are the site of the highest point in Kenya and the second highest peak on the continent: Mount Kenya (5,199 m above mean sea level). The north-eastern regions along the border with Somalia and Ethiopia are arid and semi-arid areas with some desert areas (Figure 2.1e). A Temperature Suitability Index (TSI) for malaria transmission (Gething et al., 2011) shows that the Lake Victoria and Coastal regions have the ambient temperatures suitable for malaria transmission (Figure 2.1f) and have the necessary amount and seasonality of rainfall to sustain lengthy periods of transmission.

3
Figure 2.1 Maps of Kenya showing: a) elevation (0 to 5,199 m above mean seas level) and main water features; b) mean monthly rainfall (mm); c) mean temperature (oC); d) vegetation; e) aridity index f) Temperature suitability index (TSI) on malaria transmission.1
a) b)
c) d)
1. Figure 2.1a shows altitude in metres above sea level. The Kenya‘s Digital Elevation Models was downloaded from NASA’s Shuttle Radar Topography Mission at the USGS Land Processes Distributed Active Archive Center (LP DAAC) website (http://gdex.cr.usgs.gov/gdex/ accessed 19 March 2013) at 30m resolution. The lakes surface was obtained from the Global Lakes and Wetlands Database (http://www.worldwildlife.org/pages/global-lakes-and-wetlands-database). The rivers were from International Livestock Research Institute (ILRI) GIS services portal provided at http://192.156.137.110/gis/ . Rainfall (Figure 2.1b) is one of the determinants of vector abundance. Monthly rainfall surfaces exist that are produced from global weather station records gathered from various sources (1950‐2000) and interpolated using thin‐plate smoothing spline algorithm to produce a continuous global surface (Hijmans et al., 2005) and monthly average rainfall raster surfaces at 1 km ×1 km resolution available from the WorldClim website. Precipitation is shown in mm averages per pixel over this period of time (1950-2000). For vegetation cover (Figure 2.4d), Fourier–processed Enhanced Vegetation Index (EVI), derived from the MODerate‐resolution Imaging Spectroradiometer (MODIS) sensor imagery and available at approx. 1 km ×1 km spatial resolution (Scharlemann et al., 2008) was used to develop an annual mean EVI surface. EVI is an index of intensity of photosynthetic activity and ranges from 0 (no vegetation) to 1 (complete vegetation).

4
Figure 2.1 Maps of Kenya showing: e) aridity index f) Temperature suitability index (TSI)
e)2 f)
2.2 Population
Based on the 2009 census, the population of Kenya was 38,610,097 and projected to be more than 43 million by 2015 (KNBS, 2010). Kenya’s population is over-dispersed with the highest densities along the west-east belt comprising of the Lake Victoria region, the western and central highlands, the Nairobi corridor through to the main coastal areas. The southern and northern regions are sparsely populated. This over-dispersion of population has consequences for disease distribution and health service delivery and requires mapping at the highest spatial resolutions possible. To improve mapping of population distribution patterns, spatial modelling techniques have been developed to reallocate populations within census units to finer gridded surfaces (Linard et al., 2012). In brief, a dasymetric modeling technique (Mennis, 2009) was used to redistribute population counts within the 6,603 sub-locations used during the 2009 national census and land cover data sets derived from satellite imagery. A different population weight was assigned
2. Global mean Aridity Index for the period 1950-2000 at 30’ spatial resolution has been developed as a function of precipitation and eva-transportation (Trabucco et al,. 2009). The Aridity Index (AI) = Mean Annual Precipitation (MAP)/Mean Annual Potential Evapo-Transpiration, where values increase for more humid conditions, and decrease with more arid conditions. Mean annual precipitation (MAP) values were obtained from the WorldClim Global Climate Data (Hijmans et al., 2005) for the years 1950-2000. The Global Potential Evapo-Transpiration (PET) layers estimated on a monthly average basis were used to generate/aggregate mean annual values (MAE). PET is a measure of the ability of the atmosphere to remove water through Evapo-Transpiration process. PET is calculated as PET = 0.0023 • RA • (Tmean + 17.8) • TD0.5 (mm / day) where Tmean is mean monthly temperature, TD is mean monthly temperature range and RA is the mean monthly extra-terrestrial radiation. The Hargreaves method has been used, monthly average temperature has been sourced from WorldClim database, and monthly extra-terrestrial radiation, calculated using a methodology presented by Allen et al. (1998). Temperature range (TD) is a proxy to describe the effect of cloud cover on the quantity of extra-terrestrial radiation reaching the land surface. TSI (Figure 2.1.f) is a metric for the effect of temperature on malaria transmission. A TSI has been developed at a spatial resolution of 1 km ×1 km (Gething et al., 2011). The TSI model uses a biological framework based on survival of vectors and the fluctuating monthly ambient temperature effects on the duration of sporogony that must be completed within the lifetime of a single generation of Anophelines and constructed using monthly temperature time series (Hijmans et al., 2005). On a scale of increasing transmission suitability, TSI ranges from 0 (unsuitable) to 1 (most suitable).

5
to each land cover class in order to shift populations away from unlikely populated areas, for example game reserves or arid deserts and concentrate populations in built-up areas. The net result was a gridded dataset of population distribution (counts) at 0.1 km × 0.1 km resolution. The population distribution datasets were projected to years used to predict malaria risk (see Section 4) using UN national rural and urban growth rates (UN, 2011) and made to match the total national population estimates provided by the UN Population Division (UN, 2010) for these years (Figure 2.2a). The population redistribution process accounted for restricted unpopulated areas such as national parks and game reserves (Figure 2.2b). Figure 2.2 Maps of Kenya showing: a) population distribution at 1 km x 1 km spatial resolution; b) parks and game reserves (n=39, shown in green)3; and c) urban areas (shown in red).
a) b)
c)
3. Data on Kenyan National Parks and Game Reserves was downloaded from the World Database on Protected Areas (WDPA) (IUCN and UNEP_WCMC, 2015). The WDPA is a joint project between the United Nations Environment Programme (UNEP) and the International Union for Conservation of Nature (IUCN), managed by UNEP World Conservation Monitoring Centre (UNEP-WCMC) (IUCN and UNEP_WCMC, 2015). There are 39 gazette and mapped protected areas in Kenya, the largest being the huge expanses occupied by Tsavo East and Tsavo West national parks north of the counties of Kilifi, Kwale and Mombasa.

6
Further classification of population by urban and rural is important to understand the variation of malaria risk and intervention coverage by residence. In malaria endemic settings, urban areas have been shown to have generally lower risk of malaria transmission (Hay et al., 2005). In Kenya an urban area is defined as an area with an increased density of human-created structures in comparison to the areas surrounding it and has a population of 2,000 and above. In this definition, urban areas include the following: Cities, Municipalities, Town Councils and Urban councils and even relatively small trading centres (KNBS, 2010). To develop an urban surface that would have a credible relationship with malaria transmission, the population surface was aggregated to 1 km × 1 km spatial resolution (Figure 2.2a). Areas with counts of people >=2000 per square kilometre were extracted from the population density map in the previous slide (n=233) and were overlaid on Google Earth (Google Inc Version 7.1.5) to capture the true extent of urban areas. The final urban areas identified were 69 (Figure 2.2c) and among those with a projected population of more than 100,000 include Nairobi (4,684,000), Mombasa (1,092,000), Nakuru (458,000), Kisumu (424,000), Eldoret (250,000) Ruiru (139,000), Thika (112,000), and Malindi (106,000).
2.3 Administration
In August 2010, a new constitution moved governance from a centralised system to one that devolved political governance and the delivery of some key services to 47 county governments (Government of Kenya [GoK], 2010) with budgetary support and oversight from the national government. The fourth schedule of the constitution of Kenya identifies the need to facilitate progressive realisation by all to the right to health by assigning functions to both the national and county governments. The counties are assigned the service delivery functions while the national government provides national referral, policy guidelines, capacity building and technical assistance. The national government, in consultation with the county governments, develops legislative and administrative frameworks that guide the classification and operations of each level of the health service delivery system (Ministry of Health [MoH], 2014). The constitution empowers counties to determine the organization of the county and its various departments. The counties therefore have the freedom to modify the organisational structure in a manner that best promotes efficiency in the delivery of services and utilisation of resources (MoH, 2014). The functions and provision of services of each county government in theory are decentralised further to the sub-counties established under Article 89 of the Constitution (Country Government Act, 2012). Following the general elections in 2013, the health service delivery function was formally transferred to counties in August of the same year, and one-third of the total devolved budget of KSh 210 billion was earmarked for health in the 2013/2014, enabling counties to become operational. The implementation of the Kenya Health Sector Strategic and Investment Plan 2013-2017 (KHSSP 2013-2017) takes into account the devolved system of governance. Thus, the arrangements and processes of the various institutions are being re-oriented. The strategy is also aligned to the Kenya vision 2030 policy framework and other global health commitments, using a three-pronged framework (comprehensive, balanced and coherent) to define policy direction (KPMG, 2013)
7
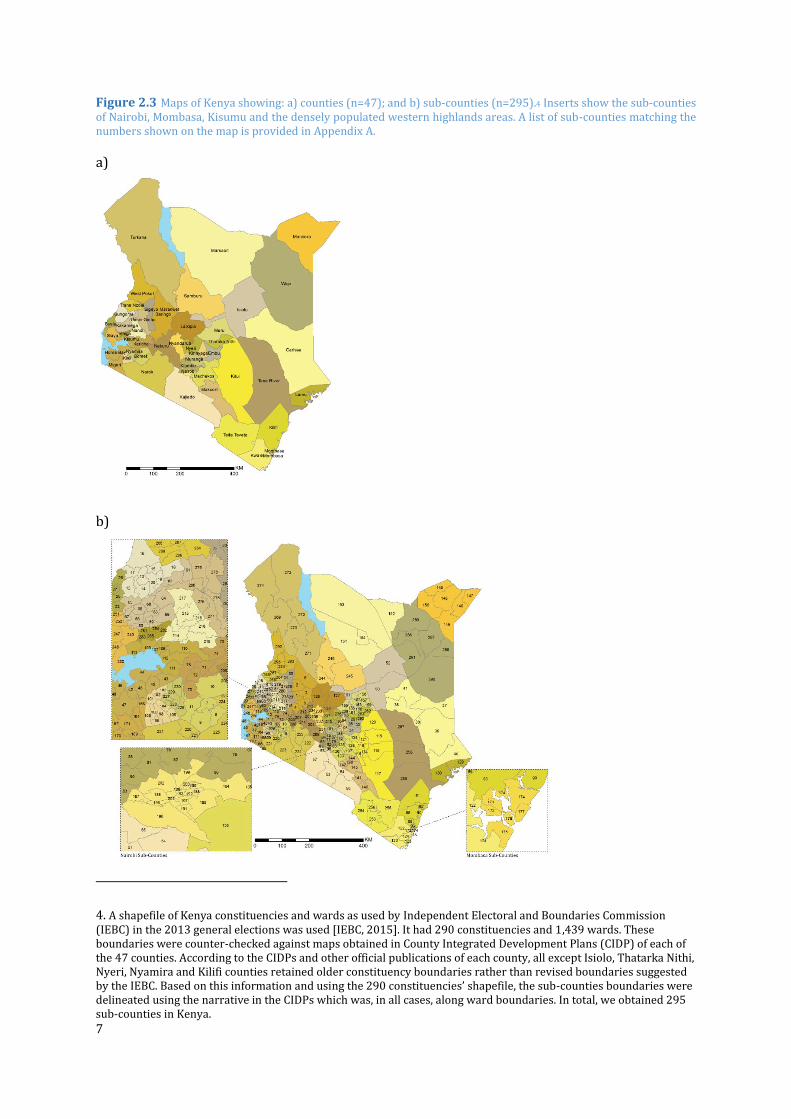
Figure 2.3 Maps of Kenya showing: a) counties (n=47); and b) sub-counties (n=295).4 Inserts show the sub-counties of Nairobi, Mombasa, Kisumu and the densely populated western highlands areas. A list of sub-counties matching the numbers shown on the map is provided in Appendix A.
a)
b)
4. A shapefile of Kenya constituencies and wards as used by Independent Electoral and Boundaries Commission (IEBC) in the 2013 general elections was used [IEBC, 2015]. It had 290 constituencies and 1,439 wards. These boundaries were counter-checked against maps obtained in County Integrated Development Plans (CIDP) of each of the 47 counties. According to the CIDPs and other official publications of each county, all except Isiolo, Thatarka Nithi, Nyeri, Nyamira and Kilifi counties retained older constituency boundaries rather than revised boundaries suggested by the IEBC. Based on this information and using the 290 constituencies’ shapefile, the sub-counties boundaries were delineated using the narrative in the CIDPs which was, in all cases, along ward boundaries. In total, we obtained 295 sub-counties in Kenya.

8
2.4 Health service delivery and mapping of health facilities
The health service delivery system in Kenya is guided by the KHSSP (2013-2017). The strategy is also aligned to the Kenya Vision 2030 policy framework and other global health commitments, such as the Millennium Development Goals, using a framework that is structured and comprehensive (KPMG, 2014). In this system, health service delivery is shared between the county and national governments. The national government has responsibility for referral services while counties are responsible for three levels of care: community health services, primary care services and county referral services. In the devolved system, healthcare service delivery is organised in a four-tiered system consisting of:
• Community health services: comprised of all the community based activities that identify the cases that need to be managed at higher levels of the health sector.
• Primary care services: comprised of all dispensaries, health centers and maternity homes from providers
• County referral services: comprised of former level four and district hospitals in specific counties and are operated and managed by the county governments
• National referral services: comprised of facilities that provide highly specialised services and includes all tertiary referral facilities
The Ministry of Health maintains a master health facility list using information supplied from district health records information officers. This list is available online from http://ehealth.or.ke/facilities/ and was downloaded 6 November 2015 (MoH, 2015). In total, the master facility list noted 6,589 (63%) public health facilities and 3,906 (37%) private facilities. The KEMRI-Wellcome Trust Research Programme also maintains geocoded databases of health facilities, which are periodically updated and contain information such as Facility Name; Administrative data (Province, district, division, location, sub-location); Facility type; Agency; Longitude and Latitude; EPI services (Y/N); ITN services (Y/N) and volume by month (Noor et al., 2004; 2009). These databases were reconciled, checked for duplicates and other incorrect information and mapped (Figure 2.4).

9
Figure 2.4 Map of Kenya showing the distribution of 7,087 public health facilities: Hospitals (142 Red), Health Centres (1,208 blue) and Dispensaries (5,737 green).5
5. Summary of Data cleaning: Public health facilities were first extracted from the MoH master facility lists, including those facilities owned by: Ministry of Health, Christian Health Association of Kenya, community development, humanitarian agencies, Kenya Episcopal Conference-Catholic Secretariat, local authority, Local Authority Trust Fund, Mission, NGOs, other faith-based organisations and SUPKEM. Public facilities were identified as dispensaries, district hospitals, health centres, hospitals, other hospitals, medical centres, medical clinics, provincial general hospitals, sub district hospitals. The MoH master facility was compared to the KEMRI/Wellcome Trust database, where 3,892 matched in both name and master facility code, while 4,418 health facilities could not be matched. These contained 2,068 from the Welcome trust database and 2,352 from the updated master facility list. These two lists were then subjected to a rigorous exercise that included checking for unique facilities in either of the lists. There were 7,237 public health facilities and 3,905 private health facilities. Another list, provided by Population Services international was also obtained and after merging with the two, from which an additional 20 health facilities were added. In the merged database, only 5,157 were geocoded. A rapid cross-referencing exercise was implemented with other available digital sources to geocode the master list. First, an online list maintained by the Development partners for Health in Kenya (DPHK) (Development Partners for Health in Kenya, 2015), was used. This website contains latitude and longitude information of facilities, with geolocated information provided by the MoH. The coordinates were checked with health administrative boundary maps to locate those facilities that were in the wrong administrative boundary. In addition, points along the coastline were checked using the Global Administrative Unit Layers (GAUL) 2008 coastline shape file. The Global Lakes and Wetlands (GLWD) database developed by the World Wildlife Fund was used to ensure facilities were not located on water features. The geocoded list included some other facilities, such as stand-alone voluntary counselling and testing (VCT) centres and health programmes (53) which were excluded in the mapping. The final list mapped was 7,087. In the final public health facilities database, 7,140 (98%) were geocoded.

10
3. Malaria control in Kenya – Milestones
1990
Reports of use of larviciding with Reskol and HS Oil at Aldai, Mosop, Kilibwoni, and Tinderet Divisions of Nandi district to prevent epidemics.
1991
Widespread CQ clinical failures across the country.
1992
National plan of action designed with continued emphasis on case-management including use of CHWs and community promotion of ITN through BI sites through to 1997; national strategy defines strata of risk based on maps developed during 1960s: stable, epidemic, low risk and malaria free but not used to tailor interventions
BI sites located in 25 districts in Western and Nyanza provinces covering approximately 235
communities where malaria prevention gradually was introduced by DVBD and Division of
Environmental Health.
1993
Large-scale ITN trial in Kilifi, Coast Province among 53,000 people.
1994
April – Malaria Control Unit (MCU) was established within DVBD under Communicable Diseases
Department.
Operational plan included use of CHWs to promote ITN use through BI sites and presumptive
treatment of uncomplicated malaria cases.
More challenges of Epidemics in highlands were experienced particularly in: Nandi, Kericho,
Uasin Gishu, Trans Nzoia, Kakamega, Kisii, Nyamira, Trans Mara, Narok, West Pokot and
Turkana. High morbidity and mortality among all age groups were experienced.
1995
Permethrin impregnated nets trial against Bancroftain filariasis and malaria in Kwale, in Coast
Province.
1996
More than 50% of studies of CQ efficacy showed significant treatment failure rates nationwide.
Large-scale ITN trial at Asembo and Gem in Nyanza Province among a population of 125,000
people.
Trials on impregnated bednets for prevention of malaria in pregnancy were conducted in Bondo
and Kilifi Districts.
Integrated management of childhood illnesses (IMCI) introduced for first time in Bungoma as
part of the Bungoma District Malaria Initiative (BDMI) that continued through to 2000.

11
1997/1998
El Nino related epidemics nationwide notably in Kenyan highlands and arid and semi lowlands
of northern Kenya with large, excess mortality leading to an emergency task force being
established.
East African Network for Monitoring Antimalarial Treatment (EANMAT) sub-regional network
of Ministries of Health and research agencies was established in 1997 and begins standardised
testing of CQ, SP and AQ; in Kenya at seven epidemiologically representative sites among other
sites in East Africa.
1998
CQ replaced with SP as first line treatment and national treatment guidelines developed
accordingly.
African Medical Research Foundation (AMREF) launched an Employer Based ITN scheme with
commercial and industrial partners including several tourist companies and hotels and others
such as the Kenya Ports Authority, Bamburi and Simbarite cement industries, the Athi River
Mining Company at Kaloleni, Umoja Rubber Company and the Kilifi and Vipingo Sisal
Plantations, Muhoroni and Mumias Sugar companies, Malakisi Tobacco Company, Webuye
Paper Mills.
1999
Policy changed from weekly CQ to two doses of SP to pregnant women living in malaria endemic
areas during their second and third trimester.
Lambda-cyhalothrin IRS +/- ITNs distributed in epidemic prone of Gucha, Kisii, Nandi and Uasin
Gishu districts.
2000
Malaria Control Unit became a Division of Malaria Control (DOMC) at the same time staff who
were housed at different office locations moved into a new office building which was part of the
government and partner commitment to malaria control.
Rapidly emerging SP resistance experienced through to 2003.
The role of DVBD’s 48 field stations becomes more about providing support to hospital services
than surveillance vector control.
Lambda-cyhalothrin IRS and ITNs expanded across epidemic prone highland districts.
Focused Antenatal Care (FANC) approach to promote the health of pregnant women launched.
2001
National Malaria Strategy 2001-2010 launched with an emphasis on scaling up distribution of
ITNs, improving access to effective medicines for treatment and epidemic preparedness and
response. Strategy provided evidence of different epidemiological strata but used only to
defined epidemic prone areas for special intervention.
12
National ITN strategy launched promoting an enabling environment for public private sector
public sector partnership through retail sector and subsidised public sector distribution.
UNICEF provided 700,000 ITNs to pregnant women living in 35 of 69 districts through ANC
clinics at no cost to beneficiaries.
kdr resistance mutations in vector populations remained low in Western and Coast regions.
IMCI rolled out to include Vihiga, Embu and Kajiado followed by slow adoption in other districts
supported by NGO partners through to 2009.
2002
Larviciding pilots using Bacillus thuringiensis israelensis (Bti) at Mbita, Suba District protecting
8,000 people by ICIPE.
Social marketing through retail sector and minimal subsidised cost recovery through special
franchised kiosk launched and distributed 5 million ITN nationwide by 2004.
Focused ANC and Malaria in Pregnancy programme (FANC) scaled up nationwide to improve
coverage of IPTp in additional 19 endemic prone districts.
Malaria epidemic in western highlands with approximately 400 deaths (Nandi, Kericho, Uasin
Gishu, Buret, Bomet, West Pokot, Trans Mara, Trans Nzoia, Kisii, Gucha and Nyamira)
experienced.
Annual single round seasonal focalised IRS using pyrethroids to prevent epidemics in16
classified epidemic prone districts.
2003
4.3% of children slept under an ITN and only 4% of pregnant women had received two doses of
SP in their last pregnancy (April-August, Kenya National Demographic and Health Survey 2003).
Four epidemiologically representative sentinel districts (Kwale, Makueni, Bondo and
Kisii/Gucha) established to provide core indicators for malaria control and prevention from
random household surveys, case-management indicators from facilities and hospital admission
data through to 2007 when they were stopped.
2004
Global Fund approved Round 2 funding awarded USD 33,586,790 to support the use of nets by
pregnant women and children under five years; scaling up IPTp in conjunction with
reproductive health services; effective case management through the implementation of IMCI in
conjunction with child health; improve dispensing practices in retail outlets
The distribution of heavily subsidised nets through ANC and MCH clinics begins and this policy
complimented the social marketing approach to ITN (nets and re-treatment kits) distribution
approach which was conducted by PSI with support of the UK Government.
Consensus approval of policy change from SP to ACT (Artemether-Lumefantrine) for first-line
treatment of uncomplicated malaria. A transitional plan was put in place. Treatment guidelines

13
were revised, and training undertaken. However, commodities were procured until 2006 when
GF round was secured.
2005
Larviciding and ITN trials (Bti and Bacillus sphaericu (Bs)) in Kakamega and Vihiga through to
2007.
Biological control, Bti, in Nyabondo and Kisii around brick making rural areas that continues
through to 2006 covering circa 150,000 people under ICIPE.
Combinations of Bti and Bs piloted in Malindi, Coast Province by KEMRI Wellcome Trust.
Heavily subsidised Supanet-branded long-lasting insecticidal nets (LLINs), Olyset and Permanet
receives additional funding from UK Government.
23.9% of children slept under an ITN (August, National PSI TRac Survey).
2006
Global Fund Round 4 funding awarded over USD 150 million through to 2010, although only
102 million spent; PMI begins country-level annual support circa USD 6 million USD in 2007,
with a total investment of approximately 263 million by 2015.
July-September, mass free LLIN distribution of 3.4 million nets combined with measles
vaccination catch-up campaign during first phase and not during second phase.
ACT policy to replace SP implemented with AL drug supply, in-service training and -production
of new standard treatment guidelines, 32 months following 2004 decision.
The “Advocacy and Public Awareness Campaign for Artemisinin Combination Therapy (ACT) in
Kenya” plan was launched, including multimedia, print media advertisements, television,
national and regional vernacular radio, community road shows, circa 100,000 posters and
500,000 brochures distributed nationwide; emphasis on AL free-of-charge.
During Africa Malaria Day commemoration, President Mwai Kibaki launched the launched the
new treatment policy under the campaign branded “Komesha Malaria, Okoa Maisha” (“Stop
Malaria, Save Lives”).
IMCI partners also adopt the new treatment guidelines.
Trial of IPT using SP+AQ among school children in Bondo, Nyanza Province.
Biological control, Bti, of larvae in urban centres of Malindi began, expanding to peri-urban core
in 2013 and by 2016 covered 400,000 people in urban and rural areas around Malindi as part of
integrated vector management (IVM).
2007
38.8% of children slept under an ITN and 12.5% of women reported taking at least two doses of
SP in their last pregnancy (KMIS 2007).
31.6% of children slept under an ITN (September, National PSI Trac Household Survey).

14
RTS,S/AS01E malaria vaccine trial in Kilifi, Siaya and Kisumu Districts starts.
Malezi Bora weeks launched by Ministry of Public Health as door-to-door campaigns on broad
child health issues, including malaria messages.
National Guidelines for laboratory diagnosis of malaria developed and launched.
A more systematic approach to pyrethroidn IRS each year in April, targeting about 1.2 million
households, covering a population of 3.8 million people, 97% operational coverage, in 16
epidemic prone districts.
MENTOR Initiative started IRS in Tana River and Garissa Districts using pyrethroids and 1,493
trained volunteers covering 36,337 households.
EANMAT regional, sentinel drug sensitivity testing programme ends.
December-March 2008, post-election violence disrupts basic health services and malaria
control
2008
IRS continues at scale in 14 epidemic prone districts. However, two of the epidemic prone
(Nandi North and South) districts and one endemic district (Rachuonyo) undertook intensive
IRS supported by PMI. Rachuonyo was adopted as part of trial to determine the added value of
combining IRS with LLIN in endemic regions.
Mass re-treat campaign in October for nets using longer lasting retreatment kits to convert 1.9
million nets owned by communities then to long lasting while 270,000 disused nets were
replaced.
47% of children slept under an ITN and 15% of women reported taking at least two doses of SP
during their last pregnancy (KDHS 2008-2009).
Evidence of declining malaria admissions in Coast province but not in areas surrounding Lake
Victoria since 2000. However, there was evidence of reduced mortality in Siaya.
Trial of delivery of ITNs through school children in Tana River.
National school-based malaria surveillance continued through to 2013.
2009
Malaria Programme Review undertaken to prepare for new eight-year strategic plan.
National Malaria Strategy launched with a vision of a malaria free Kenya where the goal was to
have reduced morbidity and mortality caused by malaria in the various epidemiological zones
by two-thirds of the 2007/08 level by 2017; for the first time all intervention recommendations
were based on malaria prevalence in the county.
IPTp intervention using SP was restricted only to areas of Coast endemic and Lake Victoria
regions.
15
Integrated Vector Management policy guidelines developed to encompass a range of disease
vectors and control methods.
Revised case-management guidelines that promote Test, Treat and Track (TTT) leading to
expansion of diagnostic capacities nationwide including use of rapid diagnostic tests (RDTs) for
all age groups and in all malaria transmission settings.
32.6% of children slept under an ITN (January-March, National Financial Services Deepening
Household Survey).
2010
Kenya adopts new constitution that radically devolved management of health service delivery to
47 county governments.
Blanket IRS in 16 epidemic prone districts stops and strategy changes to IRS only in epidemic
foci detected.
Three stable endemic sub-counties (Ranchonyo, Migori and Nyando) included in pyrethroid-
based IRS covering about 2.2 million people.
Since 2008 about five million LLIN distributed through routine ANC/CWC clinics.
42% of children slept under an ITN and 26% of pregnant women reported taking at least 2
doses of SP their last pregnancy (KMIS 2010).
AMFm quality assured ACTs through private sector launched through to 2011 with Global Fund
support.
Treatment policy further revised to recommend diagnosis before treatment and
dihydroartemisinin-piperaquine (DHA-PPQ) for the second-line treatment, and the use of AL in
the second and the third trimester of pregnancy across all weight bands.
AL dispersible tablets introduced into Kenya Public Health Sector.
Step-wise in-service training reached 5,000 health workers for new malaria case-management.
3T guidelines, provided with printed copies and wall charts, completed in 2013.
Bi-annual national health facility Quality of Care audits continued through to 2015 totalling 10
surveys.
2011
Focalised IRS continued targeting 12 high-risk highland epidemic prone counties using
pyrethroids.
Endemic counties (Ranchuonyo, Migori and Nyando) continue pyrethroid-based IRS where the
entire Homa Bay county was included.
16
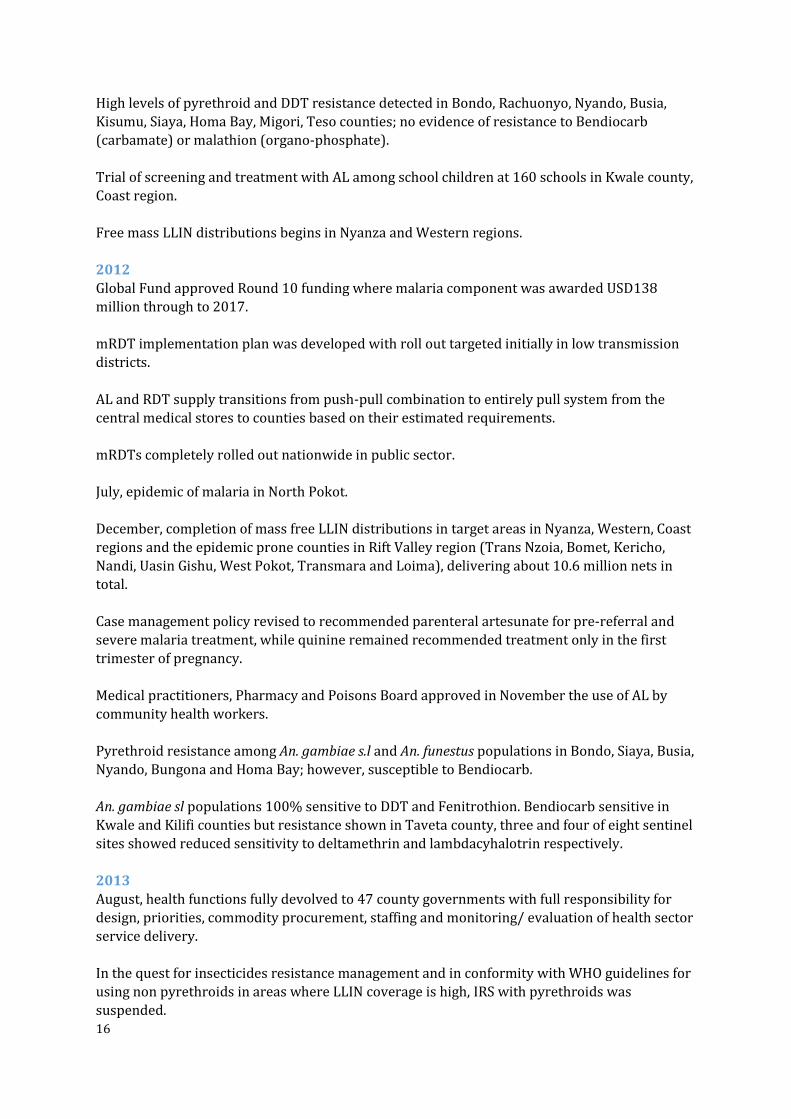
High levels of pyrethroid and DDT resistance detected in Bondo, Rachuonyo, Nyando, Busia,
Kisumu, Siaya, Homa Bay, Migori, Teso counties; no evidence of resistance to Bendiocarb
(carbamate) or malathion (organo-phosphate).
Trial of screening and treatment with AL among school children at 160 schools in Kwale county,
Coast region.
Free mass LLIN distributions begins in Nyanza and Western regions.
2012
Global Fund approved Round 10 funding where malaria component was awarded USD138
million through to 2017.
mRDT implementation plan was developed with roll out targeted initially in low transmission
districts.
AL and RDT supply transitions from push-pull combination to entirely pull system from the
central medical stores to counties based on their estimated requirements.
mRDTs completely rolled out nationwide in public sector.
July, epidemic of malaria in North Pokot.
December, completion of mass free LLIN distributions in target areas in Nyanza, Western, Coast
regions and the epidemic prone counties in Rift Valley region (Trans Nzoia, Bomet, Kericho,
Nandi, Uasin Gishu, West Pokot, Transmara and Loima), delivering about 10.6 million nets in
total.
Case management policy revised to recommended parenteral artesunate for pre-referral and
severe malaria treatment, while quinine remained recommended treatment only in the first
trimester of pregnancy.
Medical practitioners, Pharmacy and Poisons Board approved in November the use of AL by
community health workers.
Pyrethroid resistance among An. gambiae s.l and An. funestus populations in Bondo, Siaya, Busia,
Nyando, Bungona and Homa Bay; however, susceptible to Bendiocarb.
An. gambiae sl populations 100% sensitive to DDT and Fenitrothion. Bendiocarb sensitive in
Kwale and Kilifi counties but resistance shown in Taveta county, three and four of eight sentinel
sites showed reduced sensitivity to deltamethrin and lambdacyhalotrin respectively.
2013
August, health functions fully devolved to 47 county governments with full responsibility for
design, priorities, commodity procurement, staffing and monitoring/ evaluation of health sector
service delivery.
In the quest for insecticides resistance management and in conformity with WHO guidelines for
using non pyrethroids in areas where LLIN coverage is high, IRS with pyrethroids was
suspended.

17
Fire in January at Kenya medical supplies agency stores destroys more than four million RDTs
resulting in major stock outs.
MSAT trial of three rounds where target populations were screened with RDTs and treated
DHA-piperaquine treatment among 30,000 people in Gem, Karemo in Siaya county, Nyanza
Province.
Malaria surveillance curriculum developed for health workers.
DHA-PPQ had not been distributed to facilities despite policy change, through to 2016, and
parental artesunate had only been supplied on a very limited scale.
Division of Malaria Control, becomes Malaria Control Unit again under the Division of
Communicable Disease Prevention and Control.
UK Government support to malaria in Kenya comes to an end. From 2000 it had provided about
USD 15 million per annum to the national strategic plan.
Integrated Community case management of childhood illness (iCCM) plan of action launched
with a component for CHWs to diagnoses malaria with an mRDT and treat with AL at household
levels.
Pilot trial of iCCM in Bondo county, including malaria case-management at household levels.
Artesunate replaces quinine as drug policy recommendation for severe and complicated
malaria.
First detailed national malaria control and epidemiological profile launched.
2014
42% of children slept under an ITN (May-June, PSI TRac National Household Survey).
54% of children slept under an ITN and 15% of pregnant women reported taking at least two
doses of SP, and 10% taking three doses and about 30% of women received one or more doses
of IPTp (KDHS 2014-2015).
LLIN distribution catch-up campaign, first phase began in September in Migori launched by
President and then in, Homa Bay, Kisumu, Siaya and Vihiga in 2014 distributing about three
million nets.
LLIN distribution second phase began in November in West Pokot attributing 350,000 nets.
Pyrethroid resistance remains high, but An. gambiae populations remain susceptible to
Bendiocarb and Malathion at sentinel sites located in counties of Western and Nyanza. The 24-
hour mortality of less than 50% among An gambiae and An funestus populations to deltamethrin
and permethrin were recorded in Siaya, Homa Bay, Kisumu and Migori; 75-80% mortality rates
resistance among An gambiae in Siaya to Bendiocarb.
About 6,000 private and public health workers training in TTT case-management guidelines.

18
CCM with test and Rx rolled out in Western/Nyanza.
2015
Mass LLIN distribution Phase 3 completed by June distributing 2.8 million nets in Uasin Gishu,
Nandi, Kericho, Narok and Bomet.
Mass LLIN distribution Phase 4 was completed by September distributing 2.6 million nets in
Trans-Nzoia, Mombasa, Lamu, Tana River, Taita Taveta, Kilifi, and Kwale.
Mass LLIN distribution Phase 5 was completed by December distributing 3.8 million nets in
Kakamega, Kisii, Nyamira, Bungoma, and Busia Counties.
56% of children slept under an ITN and 22% of pregnant women reported taking at least three
doses of SP after quickening, 38% of women in endemic focus areas (KMIS 2015).
More than 10,000 health workers from private and public sectors received in-service training in
TTT case management policy.
More than 3000 health workers from 13 epidemic prone and seasonal transmission sub-
counties trained in malaria surveillance and epidemic preparedness.
Global Fund comes up with the new funding model and the NMCP is asked to re-programme its
funds (Round10) with an additional USD 25 million; the total grant comes to USD 68.4 million.
2016
Insecticide resistance management strategy and plan developed through to 2018.
In May 2016, IPTp strategy revised prevention to a minimum three doses of SP every four
weeks after quickening.

19
4. Mapping malaria risk
4.1 Previous mapping of malaria risk in Kenya
The use of malaria risk mapping to guide interventions in Kenya began during the 1990s (MoH, 1992), based on maps of climate associated risk developed in the 1950s (Butler, 1959). However, it was not until the launch of the National Malaria Strategy 2009-2017 (DOMC, 2009) that a more empirical basis for targeting different mixes of interventions was proposed based upon malaria prevalence by district (Noor et al., 2009) to accelerate progress toward a “malaria free” Kenya. At the time Kenya represented one of very few sub-Saharan African countries with a strategic plan based on strong epidemiological stratification that allowed for the vast differences in the sub-national risks of malaria (Omumbo et al., 2013).
Figure 4.1 First representation of the cartography of malaria risk developed from information on length of transmission and seasonality of malaria (Butler 1959).
The first cartography of malaria risk in the country was produced as part of an atlas by the Government of Kenya in 1959 (Butler 1959). This map was developed as a length of transmission season map, based on a combination of expert opinion and climatology. There is no evidence that this map was ever used in any formal way to guide control decisions at the time, but it represented an early recognition that all was not equal across the country. This map was used for a further 20+ years and featured in descriptions of national malaria risk in the

20
1970s (Roberts, 1974), who also attempted to use topography and climate to classify areas of the country into endemicity zones based on best approximations of spleen rates in children aged 2-9 years. This map was used for the formulation of Kenya’s malaria plan in 1992 (MoH 1992). However, other than a recognition of the epidemic potential of the Kenyan highlands, there were few attempts to stratify control measures based on the country’s diverse malaria ecology. It wasn’t until the mid-1990s, with the launch of the MARA initiative (Snow et al., 1996), that empirical malariometric data was used to map a revised cartography of malaria risk in Kenya (Snow et al., 1998; Omumbo et al., 1998). The 1990s were a decade of unprecedented epidemics across Kenya and as such strategic plans developed during the early 2000s promoted a universal set of recommendations, with the exception of epidemic early warning systems in the Kenyan highlands. In 2009, a malaria risk map for Kenya was developed based on 2,682 parasite surveys undertaken between 1975 and 2009 and using modern statistical approaches for interpolating survey data collected in different places at different times (Noor et al., 2009). The map was based on the largest parasite survey data for a single country in the SSA region and included data from the Kenya Malaria Indicator Surveys (KMIS) of 2007 and 2010. With the publication of this map of the prevalence of P. falciparum in 2009, Kenya led the way as one of the first countries in sub-Saharan Africa to develop a formal sub-national framework of “suites of control packages” using empirical data on malaria transmission (Figure 4.2), serving as a platform to single out the 16 most intractable districts around Lake Victoria for special, concerted interventions to significantly reduce their endemicity. This map was updated in 2012 when the first comprehensive malaria epidemiological and control profile was developed (Noor et al 2013) and was used to stratify counties into varying levels of average malaria endemicity to the planning of devolved governance in Kenya in 2013 (Figure 4.3). Since then, the KEMRI-Wellcome Trust/INFORM programme has continued to work with the NMCP to update information on malaria prevalence nationwide through school surveys, providing technical support during the KMIS 2015 and assembling evidence from various research groups across the country. The present profile, therefore, provides an opportunity to update and review the levels of malaria risk nationwide and by county. It also improves on the 2012 profile with the presentation of malaria risk and intervention coverage by sub-county to support within county decision making.

21
Figure 4.2 Map of 2009 malaria endemicity showing estimated P falciparum prevalence among children 2-10 years of age (PfPR2-10) in Kenya (Noor et al., 2009) showing a suite of interventions by transmission zone developed for the Kenya National Strategic Plans for Malaria 2009-2017 (NMCP 2009).
Figure 4.3 Map of county malaria endemicity based on population adjusted estimates of (PfPR2-10) showing five transmission zones (Noor et al., 2012). Low risk = 10 counties, 13.4 million population in 2015; Seasonal = 14 counties, 10.1 million population in 2015; Highland = 10 counties, 9.1 million population in 2015; Coastal endemic = 5 counties, 3.7 million population in 2015; Lake endemic = 8 counties, 9.4 million population in 2015.
LLIN (R&C) IRS ACTS/RDT
CCM IPTp
LLIN (R&C) EPR
RDTACTSurveillanc
e
RDTACTLLIN (3 Districts only)
LLIN (R&C) ACTSRDTIPTp

22
4.2 Mapping P. falciparum malaria risk from 2000-2015
4.2.1 Parasite prevalence data Community-based surveys of malaria parasite prevalence have become the main source of data
for mapping malaria transmission intensity (Snow et al 2015a). For Kenya, the data used in the
2012 profile (Noor et al 2012) were updated from a variety of sources including peer-reviewed
journals, international and national ministry of health and academic archives, personal
correspondence and more recent national household and school sample surveys. Methods used
to identify, extract and geocode survey reports are presented elsewhere (Snow et al., 2015a).
Of the assembled data, inclusion was restricted to all surveys undertaken from January 1980
with a sample size of 10 or more individuals examined for malaria infection. Three survey sites
could not be geolocated and 19 had sample sizes less than 10 individuals. Fifty-four surveys
were undertaken on islands off Lamu on the Coast or Suba/Homa Bay in Lake Victoria and for
the purposes of continuous spatial modelling these were modelled separately. The remaining
data used for mapping malaria consisted of 4,862 (Figure 4.4) surveys at 3,684 unique
locations (Figure 4.5a and b). This assembly of survey data in time and space, represents one of
the largest of any country in Africa and includes national community/school surveys from 1980-
1984 conducted by: Division of Vector Borne Diseases (DVBD); MIS 2007; National school
surveys 2009/10; MIS 2010; partial national schools survey 2014; and the MIS 2015. Despite
repeated attempts, it was not possible to obtain the malaria infection data collected as part of
the MoH/UNICEF nutritional survey of 2010. Of the 4,862 survey prevalence measures, 3,274
used microscopy alone, 953 used RDTs alone, 634 used RDTs confirmed by microscopy; and one
used microscopy confirmed by PCR.
Figure 4.4 Frequency of communities surveyed for malaria infection between 1980 and 2015 (4,862 surveys in 3,684 unique locations)
At 1,926 survey/time specific sites between 1980 and 2015, 183,643 individuals were
examined using microscopy, RDTs confirmed by microscopy or microscopy confirmed using
PCR to determine the malaria parasite species. Of those surveyed 32,348 were infected with P.
falciparum, 2160 with P. malariae and 792 with P. ovale. There were four cases of P. vivax
described at Nganja (Kwale) (Sutherland et al., 2011) and Asembo Bay (Siaya) (KEMRI-CDC
2015, unpublished data). While there is an incredibly low likelihood of P. vivax in Kenya, the red

23
cell duffy-negative protection among people in Nyanza and Coast is not completely refractory
(Ryan et al., 2007). Of all infections detected the majority were P. falciparum (92%), followed by
P. malariae (6%) and P. ovale (2%). All data assembled is provided to the NMCP accompanying
this report, for future use and updating.
Figure 4.5 Locations of communities surveyed for malaria infection between 1980 and 2015 (4,862 surveys in
3,684 unique locations) a) highest PfPR2-10 values on top; b) lowest PfPR2-10 values on top.
a) b)
4.2.2 Geostatistical modelling of P. falciparum prevalence To develop continuous malaria risk maps from the community parasite survey data, geostatistical methods were used to interpolate the observed parasite prevalence from sampled locations in space and time to provide predictions at locations and times where data did not exist. These methods operate under Tobler’s First Law of Geography, which states that things that are closer in space and time are more similar than those more spatially and temporally distal (Tobler, 1970). When applied within a Bayesian inference framework, these methods are referred to as model-based geostatistical (MBG) methods (Diggle et al., 1998). Bayesian inference allows for better use of sparse data and the application of prior knowledge of an outcome in an iterative process that is useful for robust estimation of uncertainties around the mean estimates of the outcome variable. The procedures used to model and validate the transformation of empirical P. falciparum parasite prevalence data to continuous predictions of age-corrected mean prevalence in children aged 2-10 years (PfPR2-10) are provided elsewhere (Noor et al., 2014). In brief, information from available age-corrected survey data (sample size and numbers positive) at known locations (longitude and latitude) and times (year) all data assembled from 1980-2014 were used together with a minimal set of conservative, long-term covariates traditionally used in vector-borne disease mapping. The data were used within a Bayesian hierarchical space-time model, implemented through an adapted Stochastic Partial Differential Equations (SPDE) approach using Integrated Nested Laplace Approximations (INLA) for inference (R-INLA 2013; Rue et al., 2009) to produce continuous maps of PfPR2-10 for 2008, 2012 and 2015 at 1 km x 1 km spatial resolutions. See Appendix B for methodological details.
24
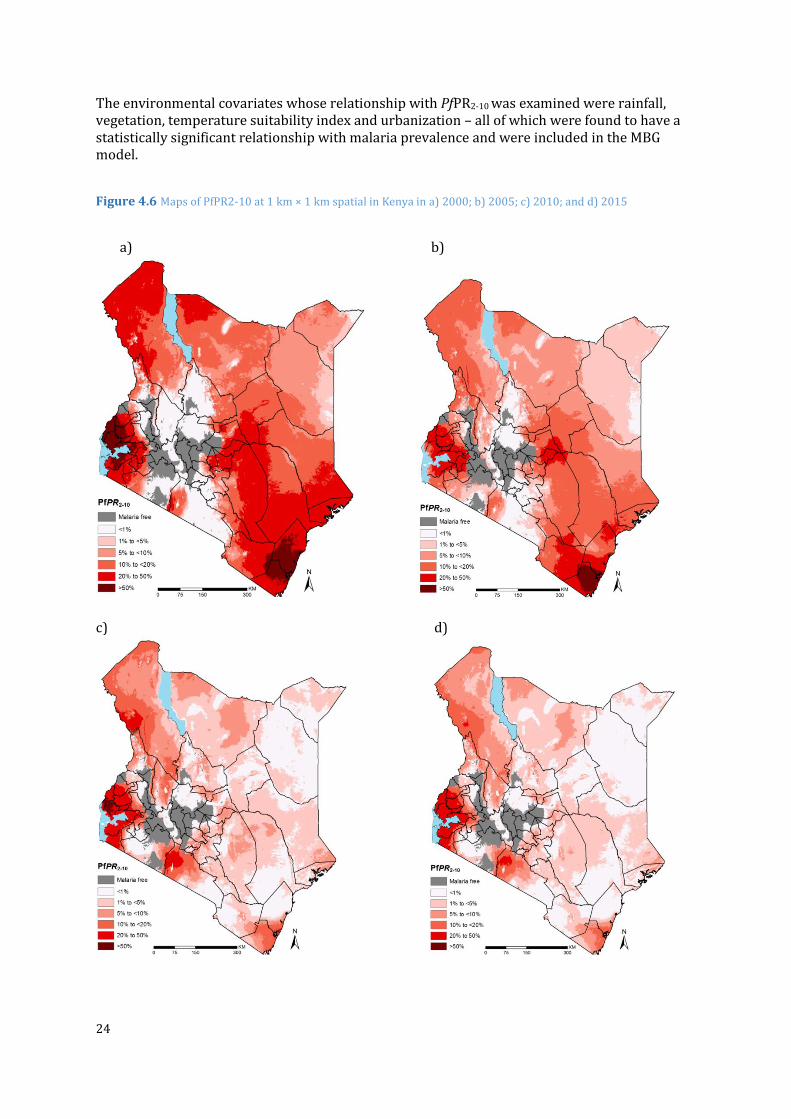
The environmental covariates whose relationship with PfPR2-10 was examined were rainfall, vegetation, temperature suitability index and urbanization – all of which were found to have a statistically significant relationship with malaria prevalence and were included in the MBG model.
Figure 4.6 Maps of PfPR2-10 at 1 km × 1 km spatial in Kenya in a) 2000; b) 2005; c) 2010; and d) 2015
a) b)
c) d)

25
Figure 4.7 Maps of population adjusted PfPR2-10 (PA PfPR2-10) at 1 km × 1 km spatial by sub-county in Kenya in a) 2000 b) 2005; c) 2010; and d) 2015.
a) 2000 b) 2005
c) 2010 d) 2015

26
Figure 4.8 Changing population at risk of malaria by PfPR2-10 endemicity from 2000-2015: a) count b) percentage
a)
b)

27
4.3 Mapping the distribution of vectors
The first map of the Anopheles vectors in Kenya was published nearly 40 years ago and shows the distribution of the An. gambiae complex and An. funestus (Roberts, 1974). A national inventory of dominant malaria vectors was developed in 2009 covering largely only members of the An. gambiae and An. funestus complexes (Okara et al., 2010) and this provisional assembly of data was used to show the distribution of dominant vectors in the National Insecticide Resistance Management Strategy 2015-2018 (NMCP, 2015). This has been significantly updated through a more detailed search of historical archives, graduate and post-graduate theses, grey literature and published sources, with increased documentation of potential secondary vectors. Full details of the data assembly, geocoding methods and classifications of species according to their role in malaria transmission are provided elsewhere (Snow et al., 2015b). The database has been arranged as a site-specific, referenced inventory to capture details of species identification recorded since the earliest surveys in 1900 through to the latest records in 2014. The full digital PDF library, database and bibliography accompanies this report. From each identified report, data extraction included whether a species was identified at a given site, methods used to capture adults or larvae and methods used to speciate each anopheline collection. “Y” was recorded if species was identified and “N” was only recorded when the true absence of the species was reported. The database is therefore one of species presence, not absence and nor proportional presence of various vectors. The final database contained 1,028 site/time specific reports of anopheline vectors occurring in Kenya between 1900 and 2014 for which coordinates were available. Geolocation data for seven (0.68%) survey sites were unavailable from all accessible sources. The database includes records from some of the earliest national inventories undertaken during the 1930s (Evans and Symes, 1937); more recent national mosquito surveys done by Ochieng and colleagues from 2007 to 2012 (Ochieng et al., 2013) for a mosquito-borne arbovirus study in Kenya; and resistance surveillance sites managed by the NMCP and its partners. Since January 2005, there have been 440 sites surveyed in Kenya. Major malaria vectors have never been recorded in Kitui county, while in Bomet, Elgeyo Marakwet, Laikipia, Mandera, Meru, Nyandarua and West Pokot counties, no malaria vectors have ever been described. Although there has been a substantial number of vector surveys since 2005, the precise detection of sibling species using PCR has not been as prolific as previous vector sampling surveys. Among 502 sites where An. gambiae s.l have been reported since 2000, 105 (21%) have not used molecular techniques to define the sibling species. There are no definitions of An. gambiae sibling species in Garissa, Isiolo, Mombasa, Nyamira, Samburu, Uasin Gishu and Wajir. Where sibling species have been distinguished, An. arabiensis and An. gambaie s.s. appear to be sympatric in their distribution, however, there is evidence that An. arabiensis has, with time, begun to displace An. gambaie s.s. as the more dominant vector where both coincide. There have been few attempts to distinguish the s.s sibling species into M forms, S forms or An. coluzzii. Where records exist, the M form has been recorded in Kilifi and Kwale counties in the Coast region and Siaya and Kisumu counties in Nyanza. The S form has never been described in Kenya.

28
Figure 4.9 Location of mosquito sampling sites for 1,029 surveys undertaken between 1900 and 2014
An. merus has a distribution largely within a 25 km inland extent from the Kenyan coast and is an important secondary vector within its range. An. quadriannulatus has been identified in Kenya but is not a malaria vector. Molecular characterisation of the members of the An. funestsus complex in Kenya has only recently been possible (Kamau et al., 2002), therefore where An. funestus has been reported we have assumed these are predominantly An. funestus s.s. However, there have been multiple reports of An. rivulorum from the Funestus complex and are regarded as a potential vector for malaria in Kenya (Kamau et al., 2002; Kamau et al., 2003; Kawada et al., 2012). The presence of the An. gambiae complex and the An. funestus group are sympatric across the entire county, except in two counties namely Narok and Tharaka Nithi where An. funestus was not recorded. An. pharoensis has been described in all central, eastern Nyanza and Western regions in Kenya. Although an important vector in Egypt and Sudan, and previously thought to transmit malaria during the 1940s in Kenya (Garnham, 1945), the precise role of this vector in malaria transmission today in Kenya is poorly described. An. nili has been recorded in only a few locations scattered throughout the country, at 26 sites along the coast, the Taveta area, Thika, the Mwea Tebere Rice Irrigation Scheme, Kaimosi Forest in Vihiga county, and Trans Nzoia. The precise role of this vector in malaria transmission in Kenya is poorly described. An. coustani, has been implicated as a potential vector in Taveta (Mwangangi et al., 2013), although not unambiguously implicated in human infections and therefore not currently regarded as a secondary vector in Kenya (M Coetzee, personal communication). An. moucheti has only been described in Mwea rice irrigation scheme in Kirinyaga county (Muturi et al., 2008). It is not clear whether it plays any role in transmission of malaria in the area. An. hancocki has never been described in Kenya.

29
Figure 4.10 Distribution of dominant vector species in Kenya

30
Figure 4.11 Recorded species identifications across all surveys by county
There are records of 41 other anopheline species in Kenya, either non-vectors or considered incidental vectors of malaria since 1900
An. ardensis, An. azaniae, An. christyi, An. cinereus, An. confusus, An. coustani, An. demeilloni, An.
d'thali, An. flavicosta, An. garnhami, An. gibbinsi, An. harperi, An. implexus, An. keniensis, An. kingi,
An. leesoni, An. longipalpis, An. macmahoni, An. maculipalpis, An. marshalli, An. mauritianus, An.
multicinctus, An. natalensis, An. paludis, An. parensis, An. pitchfordi, An. pretoriensis, An.
quadriannulatus, An. rabaiensis, An. rhodesiensis, An. rufipes, An. smithii, An. squamosus, An.
swahilicus, An. symesi, An. tenebrosus, An. theileri, An. transvaalensis, An. vaneedeni, An. wilconi,
An. ziemanni
Data in space and time related to vector resistance that have been carefully curated, validated and mapped by the IRBase initiative (IRBase; Knox et al., 2014) but were not assembled for this report although their availability is described in Chapter 3. However, it should be noted that resistance to pyrethroids and other classes of insecticides has now been recorded in almost all high burden counties (see Section 3).
31
5. Mapping of vector control interventions
5.1 Scale-up of vector control in Kenya
In 2000 the Ministry of Health (MoH) and partners developed an ITN strategy paper in which various approaches to scale-up ITNs were outlined to reach a target of 60% coverage of populations at risk by 2005 (MoH, 2001). Since then, several mechanisms for ITN distribution to populations at risk have been implemented. These include: commercial distribution; social-marketing; routine subsidised and free distribution; and free mass distribution campaigns (Noor et al., 2007; Noor et al., 2010; Snow et al.,2010). At the beginning of this period, ITNs were accessed mainly from the private-for-profit retail sector, while a few were distributed by research projects or NGOs (Shretta, 1999; Snow et al., 2010). This was followed by various attempts to socially market retail sector nets or heavily subsidised nets through clinics run by the government that met with only limited success in reaching the rural poor and ensuring maximal coverage of at risk populations (Noor et al., 2007: DOMC and MPHEG, 2007; Snow et al., 2009). However, a free mass-campaign was launched in 2006 using USD 17 million from the GFATM Round II funding to distribute 3.4 million nets free-of charge to children under the age of five years within two weeks in July and two weeks in September 2006 (Noor et al., 2007; 2010; Snow et al., 2009). Soon after, a study evaluating which of the delivery mechanisms was most effective in terms of increased coverage and equity in communities from four districts of different malaria ecologies was published (Noor et al., 2007). This study showed that free mass campaign was the most effective and equitable mechanism. A parallel study in the same communities also showed a significant impact of the nets in averting malaria mortality (Fegan et al., 2007). Using this evidence, the WHO consequently revised its ITN guidelines recommending the free distribution of nets to vulnerable individuals of all ages (WHO, 2008). Following this recommendation, PSI replaced its highly subsidised routine distribution targeting mothers of children and pregnant women for LLIN (Permanet®) to providing the nets free of charge using a grant of close to USD 50 million funding from DFID with supplementation from the GFATM (Snow et al., 2009). In 2008 a national campaign to re-treat untreated nets with K O-TAB 1-2-3, and replace torn or damaged nets was undertaken in 55 districts with funding support from DFID, WHO-Kenya and USAID and some support from GFATM Round II (Snow et al., 2009). A total of 1.93 million nets were re-treated and 207,290 torn nets were replaced (DOMC, 2008). Between 2008 and the end of 2011, routine distribution of LLINs was provided through ANC and MCH clinics in priority districts. In 2011, mass “catch-up” campaigns were re-launched starting in Nyanza and Western. In December 2012, mass free LLIN distributions in target areas in Nyanza, Western, Coast provinces and the epidemic prone districts in Rift Valley province (Trans Nzoia, Bomet, Kericho, Nandi, Uasin Gishu, West Pokot, Transmara and Loima) were completed. LLIN distribution catch-up campaigns, began again in September 2014 in Migori, Homa Bay, Kisumu, Siaya, Vihiga and West Pokot. In June 2015, mass LLIN distribution in Uasin Gishu, Nandi, Kericho, Narok and Bomet; in September 2015 nets in Trans-Nzoia, Mombasa, Lamu, Tana River, Taita Taveta, Kilifi, and Kwale; and in December 2015 in Kakamega, Kisii, Nyamira, Bungoma, and Busia counties. The mechanisms of ITN distribution used in each county since 2004 are illustrated in Figure 5.1.

32
Figure 5.1 Map of counties showing the dominant mechanisms for ITN distribution. Routine distributions have been implemented in 41 counties since 2004-2015 and in 37 counties since 2009; free mass campaigns have occurred in 32 countries since 2006 and 25 counties since 2009.
5.2 Number of ITNs distributed in Kenya, 2004-2015
Over the period 2004 to 2015, approximately 50.2 million ITNs, of which almost 49 million were of the LLIN variety, were distributed in Kenya. The distribution was undertaken through a routine system that began in October 2004 (23.3 million nets) and the free mass campaigns in 2006, 2011-12 and 2014-15 (26.9 million nets). The free mass campaigns of 2006 targeted 32 of the current 47 counties. Following the development of an empirical malaria risk map (Noor et al., 2009), better targeting of the LLIN distributions (Figure 5.1) was implemented and subsequent campaigns were implemented in 25 counties. Between 2012 and 2015, more than 23.8 million nets were distributed in Kenya through the two main channels. More than 50 million ITNs, of which 49 million were of the LLIN variety, were distributed in Kenya from 2004 to 2015 (Figure 5.2). Among the highland epidemic, lake and coastal endemic zone that are targeted for universal coverage of LLIN, the fewest number of LLINs were distributed in Lamu and Tana River (Figure 5.3), although these counties also have relatively low population. Annual ITN distributions by sub-county in Kenya from 2004 to 2015 are presented in the maps shown in Figure 5.4.

33
Figure 5.2 Annual ITN distribution by mechanism and overall since 2004
Figure 5.3 Total ITN distributions in Kenya by county grouped by malaria endemicity from 2004-2015.

34
Figure 5.4 Annual ITN distribution by sub-county in Kenya from 2004-2015. Distribution of LLINs started in May 2005
2004
2006
2005
2007

35
2008
2010
2009
2011

36
2012
2014
2013
2015

37
5.3 Coverage and use of vector control in Kenya
Typically, intervention coverage and use indicators are obtained from national household surveys that are designed to be precise at national and regional levels and rarely at lower levels, such as counties. In Kenya, there have been several national household surveys designed to capture indicators of malaria intervention and/or prevalence. For this study, data from six national surveys implemented from 2003-2015 (Table 5.1) was used. Excluded were data from the household budget surveys of 2005-6 and the Financial Strength Deepening survey of 2010 (Noor et al., 2012) because they had only a limited set of ITN use indicators. The PSI TRaC surveys of 2005, 2007 and 2014 were also not used as these were focused on specific implementation districts. The DHS 2014-15, was the first survey in Kenya specially designed to be representative by county for a number of key indicators, and allowed for sub-county modelled estimation of intervention coverage. Sub-national modelling of intervention data was undertaken using spatial and spatial-temporal small area estimation (SAE) methods that handle the problem of making reliable estimates of a variable at preferred areal units under conditions where the information available for the variable, on its own, is not sufficient to make valid estimates, primarily because of sampling inadequacies (Rao et al., 2003; BIAS, 2007). The geocoded national household survey data (Figure 5.5) was used to model national intervention indicators at county level for all six household surveys and by sub-county using the combined DHS 2014-2015 and MIS 2015 data. The indicators that have been estimated included: household ownership of at least one ITN; universal coverage of ITNs; and utilisation of ITNs by the general population and among pregnant women. In addition, access to IPTp and first-line recommended treatment were analysed and are presented in Sections 6 and 7 respectively.
Table 5.1 Summary of survey data used for the analysis of intervention indicators
DHS 2003 MIS 2007 DHS 2008-9 MIS 2010 DHS 2014-15 MIS 2015
Sampling domain 8 provinces
8 provinces
8 provinces 8 provinces
47 counties 8 provinces
Number of counties
46 42 47 47 47 47
Number of clusters
399 200 397 240 1,594 245
Number of households
8,543 6,818 9,033 6,308 36,430 6,481
Number of persons interviewed for ITN use
37,504 30,049 38,384 27,321 153,840 25,430
Number of pregnant women interviewed for ITN use
645 524 629 409 2,113 369
To analyse intervention coverage data, hierarchical Bayesian spatial and temporal SAE techniques using a geo-additive regression approach was used (Banerjee et al., 2004; Best et al., 2005). This method uses survey data from a county/sub-county and neighborhood information from adjacent counties/sub-counties to smooth values at the county/sub-county. For ITN utilisation, data was analysed by all ages to measure universal coverage which is the intervention metric necessary when computing likely impacts on malaria transmission (Smith et al., 2009; Griffin et al., 2010). See Appendix C for details of the SAE methods.

38
5.3.1 Coverage and use of insecticide treated nets (ITNs)
Figure 5.5 Percentage of households with at least one ITN by county and survey year. For 2015, the data from the DHS 2014-15 and MIS 2015 were combined to produce both county and sub-county estimates.

39
Figure 5.6 Percentage of households with at least one ITN by county and malaria endemicity in 2015. Estimated ITN ownership for 2015 was computed using the combined DHS 2014-15 and MIS 2015.
*County is predominantly in the highland epidemic zone with few parts experiencing seasonal transmission. **County is predominantly in the lake endemic zone with few parts in the highland epidemic zone.

40
Figure 5.7 Percentage of households with universal ITN coverage (≤ 2 persons per ITN) by county and survey year. For 2015, the data from the DHS 2014-15 and MIS 2015 were combined to produce both county and sub-county estimates.

41
Figure 5.8 Percentage of households with universal ITN coverage (≤ 2 persons per ITN) by county and malaria endemicity in 2015. Estimated ITN ownership for 2015 was computed using the combined DHS 2014-15 and MIS 2015.
*County is predominantly in the highland epidemic zone with few parts experiencing seasonal transmission. **County is predominantly in the lake endemic zone with few parts in the highland epidemic zone.
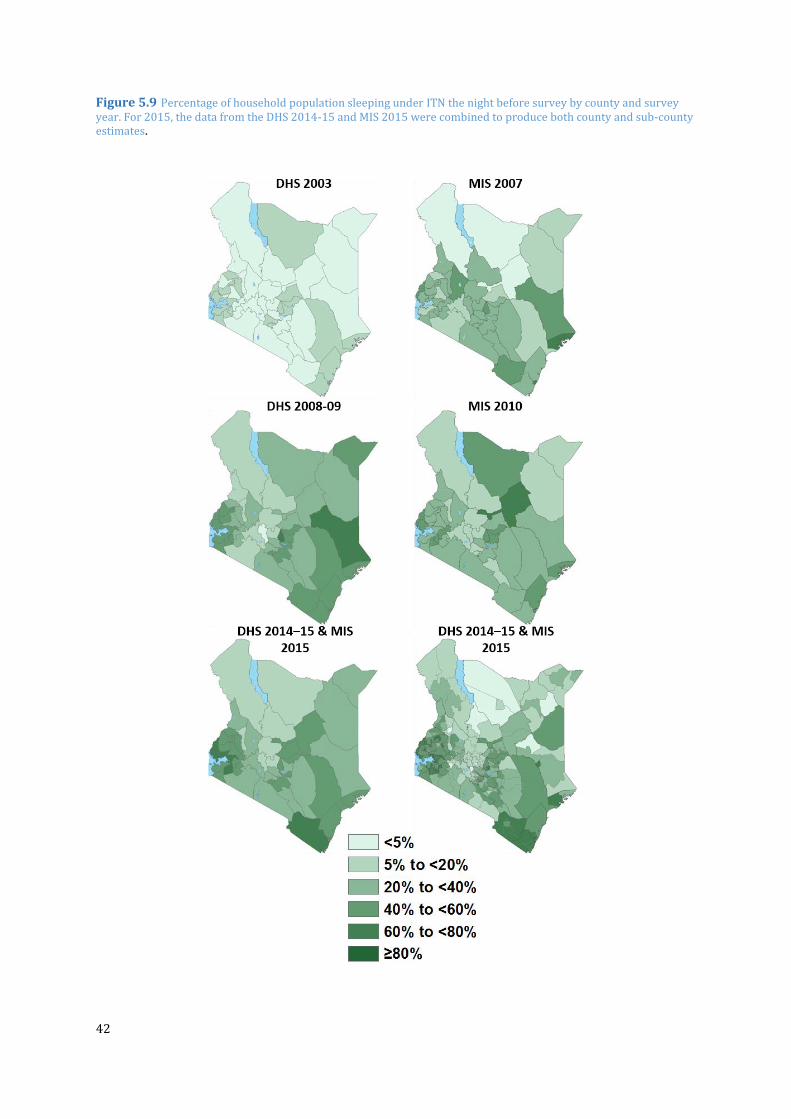
42
Figure 5.9 Percentage of household population sleeping under ITN the night before survey by county and survey year. For 2015, the data from the DHS 2014-15 and MIS 2015 were combined to produce both county and sub-county estimates.

43
Figure 5.10 Percentage of household population sleeping under ITN the night before survey by county and malaria endemicity in 2015. Estimated ITN ownership for 2015 was computed using the combined DHS 2014-15 and MIS 2015.
*County is predominantly in the highland epidemic zone with few parts experiencing seasonal transmission. **County is predominantly in the lake endemic zone with few parts in the highland epidemic zone.
5.3.2 Coverage of indoor residual spraying (IRS) Since the launch of the KNMS (2001–2010) the DOMC has focused IRS efforts in 12 “epidemic prone” counties and three endemic counties (Figure 5.11). The target was to annually spray 80% of households in these districts using lambda-cyhalothrin (ICON®) six to eight weeks before the onset of the heavy rains, usually May-August. Indoor residual house spraying was previously seen as an epidemic response measure following appropriate signals from an early warning system. Since 2007 a more systematic annualised approach has been taken as an epidemic prevention activity rather than an epidemic response measure. In the three counties of Homa Bay, Migori and part of Kisumu where malaria transmission has been perennial, complete coverage with IRS began in 2010 (in Kisumu only Nyando district was targeted) as a pilot scheme to see if its combination with LLIN will bring down transmission rapidly. In the other 12 counties, IRS is targeted only at potential hotspots determined through weekly surveillance. There have been no IRS activities since 2013 according to WHO guidance on insecticide resistance management following the detection of high resistance to pyrethroids.

44
Figure 5.11 Counties where indoor residual spraying (IRS) was targeted in Kenya since 2005
Figure 5.12 Percentage of targeted housing structures covered in targeted areas during IRS implementation from 2005 to 2012
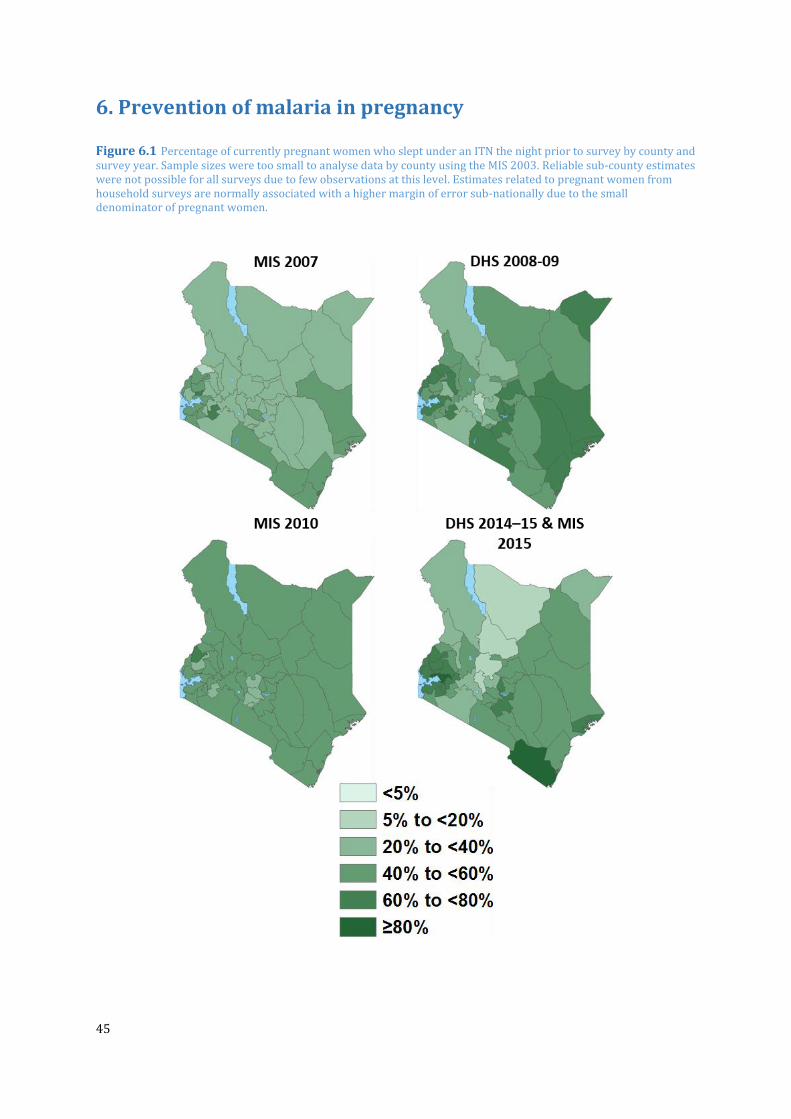
45
6. Prevention of malaria in pregnancy
Figure 6.1 Percentage of currently pregnant women who slept under an ITN the night prior to survey by county and survey year. Sample sizes were too small to analyse data by county using the MIS 2003. Reliable sub-county estimates were not possible for all surveys due to few observations at this level. Estimates related to pregnant women from household surveys are normally associated with a higher margin of error sub-nationally due to the small denominator of pregnant women.

46
Figure 6.2 Percentage of currently pregnant women who slept under an ITN the night prior to survey by county in 2015. Estimated ITN use among pregnant women for 2015 was computed using the combined DHS 2014-2015 and MIS 2015. Reliable sub-county estimates were not possible for all surveys due to few observations at this level. Estimates related to pregnant women from household surveys are normally associated with higher margin of errors sub-nationally due to the small denominator of pregnant women.
*County is predominantly in the highland epidemic zone with few parts experiencing seasonal transmission. **County is predominantly in the lake endemic zone with few parts in the highland epidemic zone.

47
Figure 6.3 Percentage of women who received at least two doses of IPTp during a pregnancy within the last two years. Sample sizes were too small to analyse data by county using the MIS 2003. Reliable sub-county estimates were not possible for all the survey due to few observations at this level. Estimates related to pregnant women from household surveys are normally associated with higher margin of errors sub-nationally due to the small denominator of pregnant women.

48
Figure 6.4 Percentage of women who received at least two doses of IPTp during a pregnancy within the last two years. Estimated IPTp use among pregnant women for 2015 was computed using the combined DHS 2014-15 and MIS 2015. Reliable sub-county estimates were not possible for all surveys due to few observations at this level. Estimates related to pregnant women from household surveys are normally associated with a higher margin of error sub-nationally due to the small denominator of pregnant women.
*County is predominantly in the highland epidemic zone with few parts experiencing seasonal transmission. **County is predominantly in the lake endemic zone with few parts in the highland epidemic zone.

49
7. Malaria case management
Following a massive therapeutic failure of chloroquine, SP was adopted as the first-line malaria
treatment in 1998. By 2003, SP had also completely failed. In 2004, artemether lumefantrine
(AL) was approved as the replacement for SP. The scale-up of AL however, only began in July
2006 (Amin et al., 2007). By 2012, RDTs were rolled out nationally and in 2013, the counties
began taking over the responsibility for provision of primary health care.
Figure 7.1 Percentage of children under age five years with fever in the two weeks prior to survey who sought treatment at an appropriate source (public and private health facilities, pharmacies and drug stores) by county and survey year. For 2015, the data from the DHS 2014-15 and MIS 2015 were combined to produce both county and sub-county estimates.

50
Figure 7.2 Percentage of children under age five years with fever in the two weeks prior to survey who were treated at an appropriate source (public and private health facilities, pharmacies and drug stores) in 2015 by county grouped according to malaria endemicity. The data from the DHS 2014-15 and MIS 2015 were combined to produce these estimates.
*County is predominantly in the highland epidemic zone with few parts experiencing seasonal transmission. **County is predominantly in the lake endemic zone with few parts in the highland epidemic zone.

51
Figure 7.3 Percentage of fevers among children age under five years treated with the recommended first line
antimalarial drug among those treated for malaria by county and survey year. For 2015, the data from the DHS 2014-
15 and MIS 2015 were combined to produce both county and sub-county estimates.

52
Figure 7.4 Percentage of fevers among children under the age of five years treated with the recommended first line antimalarial drug among those treated for malaria in 2015 by county grouped according to malaria endemicity. The data from the DHS 2014-15 and MIS 2015 were combined to produce these estimates.
*County is predominantly in the highland epidemic zone with few parts experiencing seasonal transmission. **County is predominantly in the lake endemic zone with few parts in the highland epidemic zone.

53
8. Key findings
8.1 Changing P. falciparum parasite prevalence
From a 2000 baseline, the estimated P. falciparum malaria infection prevalence in children aged two to below 10 years of age (PfPR2-10) has reduced substantially. In 2000, 13.2% of Kenya’s population lived in areas where PfPR2-10 was >50% and by 2015, on average, there were no areas of hyper or holo-endemic transmission (>50%PfPR2-10). In contrast, population in areas of PfPR2-10 was <1% or malaria free increased from 35.1% in 2000 to 53.6% in 2015. Malaria-free areas were defined on the basis of temperature limits and therefore the proportion of population in this zone remained constant throughout. Not surprisingly, the largest absolute reductions in transmission were observed in the Lake endemic and Coastal regions, where malaria was naturally highest and where most intervention efforts were concentrated. Despite these reductions, some of the gains made were undercut by the rapid increase in population. In addition, there were pockets within some counties where transmission increased. Equally important is that most of the reductions in transmission in the hyper and holoendemic areas appear to be in the period 2000-2005, suggesting a natural transition from peak transmission, although major gains were also made across the board between 2005-2010. The pace of reduction seems lower in the period 2010-2015, where declines in transmission were mainly in the Lake endemic zone. For detailed with county changes in reference should be made to the county profiles. As transmission declines, community parasite prevalence data becomes a less sensitive indicator for measuring progress. Many areas in Kenya are now under very low transmission and efforts must now be concentrated in the assembly of high quality and timely routine data to track the trends and compare with the intermittent community parasite survey data.
8.2 Progress in vector control interventions
Since 2004, more than 50 million ITNs, of which nearly 49 million were of the LLIN variety, have been distributed in Kenya. Most of these distributions have occurred since 2011, following the change of LLIN strategy in 2009, whereby the free mass campaigns and routine distributions were targeted in malarious counties, instead of nationwide distributions. From the household survey data, household ownership of ITNs has risen considerably since 2003. Household ownership of one ITN by 2015 was above 70% in the majority of targeted counties. However, universal coverage (1 LLIN per 2 persons) was between 40% and 50% in most targeted counties. Use of bed nets by household members was between 40% and 70% in the Lake and Coastal endemic counties. Therefore, although access to LLINs has improved substantially, universal coverage and use of bed nets remain relatively moderate and further efforts are required to reach the 100% target. Beginning 2013, all IRS activities ceased in Kenya, as the country was realigning the policy with the WHO policy guidelines on insecticides resistance management strategy where non- Pyrethroids were recommended in areas of high LLIN coverage. Kenya has limited non-pyrethroids registered for public health use. By 2014 Pirimaphos methyl, an organophosphate, was registered for use in IRS.

54
8.3 Prevention of malaria in pregnancy
There are uncertainties around the estimations of interventions targeted at pregnant women because the denominator recorded during surveys is often relatively small. Nonetheless, use of LLINs among pregnant women seems to have increased since the MIS of 2007, and was between 50% and 90% in 2015 in the Lake and Coastal endemic counties. Interestingly, the proportion of women receiving at least two doses of SP for IPTp was generally higher in the Coastal endemic counties, expect in Kilifi where it was below 50%, compared to the Lake endemic counties where it was between 30% and 50% across all counties. The policy recommendation to administer IPTp with each scheduled visit after quickening to ensure pregnant women receive a minimum of three doses was launched in 2016. Since then, there are no data to track the coverage of the revised indicator. However, given the relatively modest coverage of IPTp2, major efforts are required in reaching the target of universal coverage in the targeted counties.
8.4 Improvements in treatment-seeking and access to recommended treatment
Treatment-seeking for fever in the formal health sector has substantially increased since 2003 and by 2015 the majority of counties reported more than 60% of children seeking treatment in either a clinic, pharmacy or drug store. Among those who sought treatment and were treated for malaria, the majority also received the first-line recommended drug, AL. Only in Laikipia, Tharaka Nithi, Lamu and West Pokot was prescription of AL below 60%. It is unclear, however, what proportion of these febrile were confirmed to have malaria. In the MIS 2015, only 39% of children with fever in the last week had received a finger or heel prick (KMIS, 2015).

55
9. Bibliography
Allen RG, Pereira LS, Raes D, Smith M (1998). Crop evapotranspiration: Guidelines for computing
crop requirements. Irrigation and Drainage Paper No. 56, FAO, Rome, Italy.
Amin AA, Zurovac D, Kangwana BB, Greenfield J, Otieno DN, Akhwale WS, Snow RW (2007). The
challenges of changing national malaria drug policy to artemisinin-based combinations in
Kenya. Malaria Journal; 6:72.
Banerjee S, Carlin BP, Gelfand AE (2004). Hierarchical Modeling and Analysis for Spatial Data.
New York: Chapman and Hall.
Best N, Richardson S, Thomson A (2005). A comparison of Bayesian spatial models for disease
mapping. Statistical Methods in Medical Research,14: 35–59.
BIAS (2007). Introduction to Bayesian Small Area Estimation, January 2007. http://www.bias-
project.org.uk/software/SAE.pdf.
Butler RJ (1959). Atlas of Kenya: a comprehensive series of new and authenticated maps
prepared from the national survey and other governmental sources with gazetteer and notes on
pronunciations and spelling, 1st edition. Nairobi: the Survey of Kenya.
Central Bureau of Statistics (CBS), Ministry of Health (MoH), Kenyan Medical Research Institute
(KEMRI), National Council for Population & Development (NCPD), ORC Macro and Centres for
Disease Control (CDC) (2004). Kenya Demographic and Health Survey 2003. Calverton,
Maryland: ICF Macro; July.
Development Partners for Health in Kenya. (2015). Available from: http://dphk.or.ke/.
Diggle PJ and Ribeiro PJ (2007). Model-Based Geostatistics. New York: Springer.
Division of Malaria Control (DOMC) (2009). Towards a Malaria-Free Kenya: National Malaria
Strategy 2009–2017. DOMC, Ministry of Public Health and Sanitation, Republic of Kenya, July.
Division of Malaria Control (DOMC), Kenyan National Bureau of Statistics and National
Coordinating Agency for Population and Development (2009). Kenyan National Malaria
Indicator Survey, 2007. Nairobi: DOMC, Ministry of Public Health and Sanitation.
Division of Malaria Control (DOMC), Kenyan National Bureau of Statistics and ICF Marco (2011).
Kenyan National Malaria Indicator Survey, 2010. Nairobi: DOMC, Ministry of Public Health and
Sanitation.
Evans AM and Symes CB (1937). Anopheles funestus and its allies in Kenya. Annals of Tropical
Medicine & Parasitology, 31: 105–112.
Garnham PCC (1945). The role of Anopheles pharoensis Theobald in the transmission of malaria
in Kenya Colony. Annals of Tropical Medicine & Parasitology, 39: 63–65.
56
Gething PW, Van Boeckel, Smith DL, Guerra CA, Patil AP, Snow RW, Hay SI (2011). Modelling the
global constraints of temperature on transmission of Plasmodium falciparum and P. vivax.
Parasites & Vectors, 4: 92.
Government of Kenya (2010). Constitution of Kenya. http://www.vision2030.go.ke. Accessed 7
May, 2013.
Griffin JT, Hollingsworth TD, Okell LC, Churcher TS, White M, Hinsley W, et al. (2010). Reducing
Plasmodium falciparum malaria transmission in Africa: a model based evaluation of intervention
strategies. PLoS Medicine, 7: e1000324.
Hargreaves GH, Allen RG (2003). History and evaluation of Hargreaves evapotranspiration
equation. Journal of Irrigation and Drainage Engineering, 129: 53–63.
Hargreaves GL, Hargreaves GH, Riley JP (1985). Irrigation water requirements for Senegal River
basin. Journal of Irrigation and Drainage Engineering, 111: 265–75.
Hay SI, Guerra CA, Tatem AJ, Atkinson P, Snow RW (2005). Urbanization, malaria transmission
and disease burden in Africa. Nature Reviews Microbiology, 3: 81–90.
Herman A, Kumar VB, Arkin PA, Kousky JV (1997). Objectively determined 10-day African
rainfall estimates created for famine early warning systems. International Journal of Remote
Sensing, 18: 2147–2159.
Hijmans R, Cameron S, Parra J, Jones P, Jarvis A (2005). Very high resolution interpolated
climate surfaces for global land areas. International Journal of Climatology, 25: 1965–1978.
Independent Electoral and Boundaries Commission (2015). Election Boundary Maps.
http://tinyurl.com/ofgtae5. Accessed 14 September, 2015.
IRBase: http://www.irmapper.com Accessed 12 March, 2017
IUCN, and UNEP_WCMC (2016). The World Database on Protected Areas (WDPA)-April 2015
version. www.protectedplanet.net. Accessed 1 April, 2016.
Kamau L, Hunt R, Coetzee M (2002). Analysis of the population structure of Anopheles funestus
(Diptera: Culicidae) from western and coastal Kenya using paracentric chromosomal inversion
frequencies. Journal of Medical Entomology, 39: 78–83.
Kamau L, Munyekenye GO, Koekemoer LL, Hunt RH, Coetzee M (2003). A survey of the
Anopheles funestus (Diptera: Culicidae) group of mosquitoes from 10 Sites in Kenya with special
emphasis on population genetic structure based on chromosomal inversion karyotypes. Journal
of Medical Entomology, 40: 664–671.
Kawada H, Dida GO, Sonye G, Njenga SM, Mwandawiro C, Minakawa N (2012). Reconsideration
of Anopheles rivulorum as a vector of Plasmodium falciparum in Western Kenya: some evidence
from biting time, blood preference, sporozoite positive rate, and pyrethroid resistance. Parasites
& Vectors, 5: 230.

57
Kenya National Bureau of Statistics (2010). The 2009 Kenya Population and Housing Census
“Counting Our People for the Implementation of Vision 2030” VOLUME IC Population
Distribution by Age, Sex and Administrative Units.
Kenya National Bureau of Statistics (KNBS) and ICF Macro (2010). Kenya Demographic and
Health Survey 2008-09. Calverton, Maryland: KNBS and ICF Macro.
Kenya National Bureau of Statistics (KNBS), Ministry of Health, National AIDs council, KEMRI
and National Council for Population and Development (2015). Kenya Demographic and Health
Survey 2014. March.
Kenya Wildlife Services (KWS) (2016). Our Conservation Areas Overview.
http://www.kws.go.ke/content/overview . Accessed 1 April, 2016.
Knox TB, Juma EO, Ochomo EO, Pates Jamet H, Ndungo L, Chege P, Bayoh NM, N’Guessan R,
Christian RN, Hunt RH, Coetzee M (2014). An online tool for mapping insecticide resistance in
major Anopheles vectors of human malaria parasites and review of resistance status for the
Afrotropical region. Parasites & Vectors, 7: 76.
KPMG International (2013). Devolution of Healthcare Services in Kenya: Lessons Learnt from
Other Countries. https://www.kpmg.com/Africa/en/IssuesAndInsights/Articles-
Publications/Pages/Devolution-of-Healthcare-Services-in-Kenya.aspx
Linard C, Gilbert M, Snow RW, Noor AM, Tatem AJ (2012). Population distribution, settlement
patterns and accessibility across Africa in 2010. PLoS One, 7: e31743.
Matiru V (1999). The World Conservation Union IUCN (1996), revised by Violet Matiru (Dec
1999). Forest cover and forest reserves in Kenya: policy and practice. Report.
http://cmsdata.iucn.org/downloads/forestcover. Accessed 1 April, 2016.
Mburu N (2003). Delimitation of the Elastic Ilemi Triangle: Pastoral Conflicts and Official
Indifference in the Horn of Africa. African Studies Quarterly, 7 (1). http://tinyurl.com/nt5u2h7.
Accessed 27 August, 2015.
Mennis J (2009). Dasymetric mapping for estimating population in small areas. Geography
Compass, 3: 727–745.
Ministry of Health (1992). Kenya National Plan of Action for Malaria Control: Five-Year Plan and
Budget. Nairobi: Government of Kenya. October.
Ministry of Health (2001). Insecticide Treated Nets Strategy: 2001–2006. Nairobi: Government of
Kenya. February.
Ministry of Health (2014). Kenya Health Policy 2014–2030. http://tinyurl.com/nw23v9d
Accessed 1 September, 2015.
Ministry of Health (2014). Kenya Service Availability and Readiness Assessment Mapping
(SARAM). Nairobi: Government of Kenya.

58
Ministry of Health (2014). The Kenya Health Sector Strategic and Investment Plan – KHSSP July
2014 – June 2017. http://tinyurl.com/nw23v9d Accessed 1 September, 2015.
Ministry of Health Kenya (2015). Master Health Facility List. (Internet).
http://ehealth.or.ke/facilities/
MODIS Data repository: http://modis.gsfc.nasa.gov/data/dataprod/mod13.php
Muturi EJ, Shililu JI, Jacob BG, Mwangangi JM, Mbogo CM, Githure JI, Novak RJ (2008). Diversity
of riceland mosquitoes and factors affecting their occurrence and distribution in Mwea, Kenya.
Journal of the American Mosquito Control Association, 24: 349–358.
Mwangangi JM, Muturi EJ, Muriu SM, Nzovu J, Midega JT, Mbogo C (2013). The role of Anopheles
arabiensis and Anopheles coustani in indoor and outdoor malaria transmission in Taveta District,
Kenya. Parasites & Vectors, 6: 114.
National Coordinating Agency for Population and Development (NCAPD), Ministry of Health
(MOH), Central Bureau of Statistics (CBS), and ORC Macro. (2005). Kenya Service Provision
Assessment Survey 2004. Nairobi: National Coordinating Agency for Population and
Development, Ministry of Health, Central Bureau of Statistics, and ORC Macro.
National Council for Law Reporting (2010). Laws of Kenya: The Constitution of Kenya 2010.
Published with the Authority of the Attorney-General. http://tinyurl.com/o8l2lma Accessed 1
September, 2015.
National Council for Law Reporting (2013). Laws of Kenya: County Governments Act No. 17 of
2012. Published with the Authority of the Attorney-General http://tinyurl.com/oqfj8yk.
Accessed 11 September, 2015
National Malaria Control Programme (2015). National Insecticide Management Strategy 2015-
2018. Nairobi: NMCP, Ministry of Heath, Government of Kenya. September 2015
National Malaria Control Programme (NMCP), Kenya National Bureau of Statistics (KNBS), ICF
Macro (2016). Kenya Malaria Indicator Survey 2015. Calverton, Maryland: NMCP, KNBS and ICF
Macro. April.
Noor AM, Gikandi PW, Hay SI, Muga RO, Snow RW (2004). Creating spatially defined databases
for equitable health service planning in low-income countries: the example of Kenya. Acta
Tropica, 3: 227–237.
Noor AM, Kangwana BB, Amin AA, Akwhale WS, Snow RW (2007). Increasing access and
decreasing inequity in insecticide-treated bed net use among rural Kenyan children. PLoS
Medicine, 4: e255.
Noor AM, Alegana VA, Gething PW, Snow RW (2009). A spatial national health facility database
for public health sector planning in Kenya in 2008. International Journal of Health Geographics.
1: 13.
Noor AM, Gething PW, Alegana VA, Patil AP, Hay SI,Muchiri E, Juma E,Snow RW (2009). The
risks of malaria infection in Kenya in 2009. BMC Infectious Diseases, 9: e180.

59
Noor AM, Gikandi PW, Hay SI, Muga RO, Snow RW (2004). Creating spatially defined databases
for equitable health service planning in low-income countries: the example of Kenya. Acta
Tropica, 3: 227–237.
Noor AM, Kinyoki DK, Mundia CW, Kabaria CW, Wambua JM, Alegana VA, Fall IS, Snow RW
(2014). The changing risk of Plasmodium falciparum malaria infection in Africa: 2000 to 2010.
Lancet, 383: 1739–1747.
Noor AM, Kinyoki DK, Ochieng JO, Kabaria CW, Alegana VA, Otieno VA, Kiptui R, Soti D, Yé Y,
Amin AA, Snow RW (2012). The epidemiology and control profile of malaria in Kenya: reviewing
the evidence to guide future vector control. A report for the Division of Malaria Control, Ministry
of Public Health & Sanitation. Commissioned by MEASURE-Evaluation, ICF Macro, December
2012.
Ochieng C, Lutomiah J, Makio A, Koka H, Chepkorir E, Yalwala S, Mutisya J, Musila L, Khamadi S,
Richardson J, Bast J, Schnabel D, Wurapa E, Sang R (2013). Mosquito-borne arbovirus
surveillance at selected sites in diverse ecological zones of Kenya; 2007-2012. Virology Journal,
10: 140.
Okara RM, Sinka ME, Minakawa N, Mbogo CM, Hay SI, Snow RW (2010). Distribution of the main
malaria vectors in Kenya. Malaria Journal, 9: 69.
Omumbo JA, Noor AM, Fall IS, Snow RW (2013). How well are malaria maps used to design and
finance malaria control in Africa? PLoS One, 8: e53198.
Omumbo JA, Ouma J, Rapouda B, Craig M, Le Sueur D, Snow RW (1998). Mapping malaria
transmission intensity using geographical information systems (GIS): an example from Kenya.
Annals of Tropical Medicine & Parasitology, 92: 7–21.
Population Services International (2004) Building a net culture in Kenya.
http://www.psi.org/resources/pubs/kenya-ITN.pdf Accessed 12 March, 2017.
Rao JNK (2003). Small Area Estimation. John Wiley and Sons, Inc., Hoboken, New Jersey, 2003
R-INLA project. http://www.r-inla.org/. Accessed 10 April 2012.
Roberts JMD (1974). Malaria. In Vogel LC, Muller AS, Odingo et al. Health and Diseases in Kenya.
Nairobi: East African Literature Bureau. 305–317.
Rue H, Martino S, Chopin N (2009). Approximate Bayesian inference for latent Gaussian models
by using integrated nested Laplace approximations. Journal of the Royal Statistical Society Series
B, 71: 319–392.
Ryan JR, Stoute JA, Amon J, Dunton RF, Mtalib R, Koros J, Owour B, Luckhart S, Wirtz RA,
Barnwell JW, Rosenberg R (2007). Evidence for transmission of Plasmodium vivax among a duffy
antigen negative population in Western Kenya. American Journal of Tropical Medicine & Hygiene,
75: 575–581.

60
Scharlemann JPW, Benz D, Hay SI, Purse BV, Tatem AJ, Wint GR, Rogers DJ (2008). Global data
for ecology and epidemiology: A novel algorithm for Temporal Fourier Processing MODIS data.
PLoS One, 1: e1408.
Shaka J (2013). Migingo Island: Kenyan or Ugandan Territory? Journal of Conflictology.
http://tinyurl.com/nueohg5 Accessed 16 July, 2015
Shretta R (1999) NETMARK briefing book: Insecticide treated materials in Kenya. Malaria
Consortium, UK, for Academy for Educational Development, December.
Smith DL, Noor AM, Hay SI, Snow RW (2009). Predicting changing malaria risk following
expanded insecticide treated net coverage in Africa. Trends in Parasitology, 25: 511–516.
Snow RW, Marsh K, le Sueur D (1996). The need for maps of transmission intensity to guide
malaria control in Africa. Parasitology Today, 12: 455–457.
Snow RW, Gouws E, Omumbo J, Rapuoda B, Craig MH, Tanser FC, le Sueur D, Ouma J (1998).
Models to predict the intensity of Plasmodium falciparum transmission: applications to the
burden of disease in Kenya. Transactions of Royal Society of Tropical Medicine & Hygiene, 92:
601–606.
Snow RW, Amratia P, Kabaria CW, Noor AM, Marsh K (2012). The changing limits and incidence
of malaria in Africa: 1939-2009. Advances in Parasitology, 78: 169–262.
Snow RW & and Noor AM (2015). Malaria risk mapping in Africa: The historical context to the
Information for Malaria (INFORM) project. Working Paper in support of the INFORM Project
funded by the Department for International Development and the Wellcome Trust. June 2015;
http://www.inform-malaria.org/wp-content/uploads/2015/07/History-of-Malaria-Risk-
Mapping-Version-1.pdf
Snow RW, Amratia P, Mundia CW, Alegana VA, Kirui VC, Kabaria CW, Noor AM (2015).
Assembling a geo-coded repository of malaria infection prevalence survey data in Africa 1900-
2014. INFORM Working Paper, developed with support from the Department of International
Development and Wellcome Trust, UK, June 2015; http://www.inform-malaria.org/wp-
content/uploads/2015/07/Assembly-of-Parasite-Rate-Data-Version-1.pdf.
Snow RW, Kyalo D, Amratia P, Kabaria CW, Noor AM. Developing a geo-coded repository of
malaria vector species occurrence for Africa: methods and data summaries 1900-2014. Working
Paper 2: Report prepared in support of the INFORM Project funded by the Department for
International Development and the Wellcome Trust, April 2015; http://www.inform-
malaria.org/wp-content/uploads/2015/07/Assembly-of-Vector-Data-Version-1.pdf.
Sutherland LJ, Bustinduy AL, Mungai PL, Muchiri EM, Kitron U, Zimmerman PA, King CH (2011).
Performance of a rapid diagnostic card test for detection of single- or multi-species Plasmodium
infections among residents of southern coast province, Kenya. American Society of Tropical
Medicine and Hygiene, 60th annual meeting program, 85:6 supplement. December 4-6.
Philadelphia Marriott Downtown.
Tobler W (1970). A computer movie simulating urban growth in the Detroit region. Economic
Geography, 46: 234–240.

61
Trabucco A and Zomer RJ (2009). Global potential evapo-transpiration (Global-PET) and global
aridity index (Global-Aridity) geo-database. CGIAR Consortium for Spatial Information.
http://www.cgiar-csi.org/
United Nations (2011). World Urbanization Prospects: The 2011 Revision, New York: UN
Department of Economic and Social Affairs, Population Division, Population Estimates and
Projections Section.
USGS early warning system portal. http://earlywarning.usgs.gov/fews/product/119#download
Accessed 12 March, 2017.
World Health Organization (2000). The Abuja Declaration and the Plan of Action. An extract
from the African Summit on Roll Back Malaria. April. http://www.worldclim.org/ Accessed 12
March, 2017.
Xie P and Arkin PA (1997). Global Precipitation: A 17-year monthly analysis based on gauge
observations, satellite estimates, and numerical model outputs. Bulletin of the American
Meteorological Society, 78: 2539–2558.

62
Appendix A List of counties and sub-counties in Kenya
Country County Sub-county Sub-county Code Map Code Kenya Baringo Baringo Central KEN001 1 Kenya Baringo Baringo North KEN002 2 Kenya Baringo Baringo South KEN003 3 Kenya Baringo Eldama Ravine KEN004 4 Kenya Baringo Mogotio KEN005 5 Kenya Baringo Tiaty KEN006 6 Kenya Bomet Bomet Central KEN007 7 Kenya Bomet Bomet East KEN008 8 Kenya Bomet Chepalungu KEN009 9 Kenya Bomet Konoin KEN010 10 Kenya Bomet Sotik KEN011 11 Kenya Bungoma Bumula KEN012 12 Kenya Bungoma Kabuchai KEN013 13 Kenya Bungoma Kanduyi KEN014 14 Kenya Bungoma Kimilili KEN015 15 Kenya Bungoma Mt Elgon KEN016 16 Kenya Bungoma Sirisia KEN017 17 Kenya Bungoma Tongaren KEN018 18 Kenya Bungoma Webuye East KEN019 19 Kenya Bungoma Webuye West KEN020 20 Kenya Busia Budalangi KEN021 21 Kenya Busia Butula KEN022 22 Kenya Busia Funyula KEN023 23 Kenya Busia Matayos KEN024 24 Kenya Busia Nambale KEN025 25 Kenya Busia Teso North KEN026 26 Kenya Busia Teso South KEN027 27 Kenya Elgeyo Marakwet Keiyo North KEN028 28 Kenya Elgeyo Marakwet Keiyo South KEN029 29 Kenya Elgeyo Marakwet Marakwet East KEN030 30 Kenya Elgeyo Marakwet Marakwet West KEN031 31 Kenya Embu Manyatta KEN032 32 Kenya Embu Mbeere North KEN033 33 Kenya Embu Mbeere South KEN034 34 Kenya Embu Runyenjes KEN035 35 Kenya Garissa Balambala KEN036 36 Kenya Garissa Dadaab KEN037 37 Kenya Garissa Dujis KEN038 38 Kenya Garissa Fafi KEN039 39 Kenya Garissa Ijara KEN040 40 Kenya Garissa Lagdera KEN041 41 Kenya Homa Bay Homa Bay KEN042 42 Kenya Homa Bay Kabondo Kasipul KEN043 43 Kenya Homa Bay Karachuonyo KEN044 44 Kenya Homa Bay Kasipul KEN045 45 Kenya Homa Bay Mbita KEN046 46 Kenya Homa Bay Ndhiwa KEN047 47 Kenya Homa Bay Rangwe KEN048 48 Kenya Homa Bay Suba KEN049 49 Kenya Isiolo Garbatulla KEN050 50 Kenya Isiolo Isiolo KEN051 51 Kenya Isiolo Merti KEN052 52 Kenya Kajiado Kajiado Central KEN053 53 Kenya Kajiado Kajiado East KEN054 54 Kenya Kajiado Kajiado North KEN055 55 Kenya Kajiado Kajiado South KEN056 56 Kenya Kajiado Kajiado West KEN057 57 Kenya Kakamega Butere KEN058 58 Kenya Kakamega Ikolomani KEN059 59 Kenya Kakamega Khwisero KEN060 60 Kenya Kakamega Likuyani KEN061 61 Kenya Kakamega Lugari KEN062 62 Kenya Kakamega Lurambi KEN063 63 Kenya Kakamega Malava KEN064 64 Kenya Kakamega Matungu KEN065 65

63
Kenya Kakamega Mumias East KEN066 66 Kenya Kakamega Mumias West KEN067 67 Kenya Kakamega Navakholo KEN068 68 Kenya Kakamega Shinyalu KEN069 69 Kenya Kericho Buret KEN070 70 Kenya Kericho Kericho East KEN071 71 Kenya Kericho Kericho West KEN072 72 Kenya Kericho Kipkelion East KEN073 73 Kenya Kericho Kipkelion West KEN074 74 Kenya Kericho Sigowet KEN075 75 Kenya Kiambu Gatundu North KEN076 76 Kenya Kiambu Gatundu South KEN077 77 Kenya Kiambu Githunguri KEN078 78 Kenya Kiambu Juja KEN079 79 Kenya Kiambu Kabete KEN080 80 Kenya Kiambu Kiambaa KEN081 81 Kenya Kiambu Kiambu KEN082 82 Kenya Kiambu Kikuyu KEN083 83 Kenya Kiambu Lari KEN084 84 Kenya Kiambu Limuru KEN085 85 Kenya Kiambu Ruiru KEN086 86 Kenya Kiambu Thika Town KEN087 87 Kenya Kilifi Ganze KEN088 88 Kenya Kilifi Kaloleni KEN089 89 Kenya Kilifi Kilifi KEN090 90 Kenya Kilifi Magarini KEN091 91 Kenya Kilifi Malindi KEN092 92 Kenya Kilifi Rabai KEN093 93 Kenya Kirinyaga Gichugu KEN094 94 Kenya Kirinyaga Kirinyaga Central KEN095 95 Kenya Kirinyaga Mwea KEN096 96 Kenya Kirinyaga Ndia KEN097 97 Kenya Kisii Bobasi KEN098 98 Kenya Kisii Bomachoge Borabu KEN099 99 Kenya Kisii Bomachoge Chache KEN100 100 Kenya Kisii Bonchari KEN101 101 Kenya Kisii Kitutu Chache North KEN102 102 Kenya Kisii Kitutu Chache South KEN103 103 Kenya Kisii Nyaribari Chache KEN104 104 Kenya Kisii Nyaribari Masaba KEN105 105 Kenya Kisii South Mugirango KEN106 106 Kenya Kisumu Kisumu Central KEN107 107 Kenya Kisumu Kisumu East KEN108 108 Kenya Kisumu Kisumu West KEN109 109 Kenya Kisumu Muhoroni KEN110 110 Kenya Kisumu Nyakach KEN111 111 Kenya Kisumu Nyando KEN112 112 Kenya Kisumu Seme KEN113 113 Kenya Kitui Kitui Central KEN114 114 Kenya Kitui Kitui East KEN115 115 Kenya Kitui Kitui Rural KEN116 116 Kenya Kitui Kitui South KEN117 117 Kenya Kitui Kitui West KEN118 118 Kenya Kitui Mwingi East KEN119 119 Kenya Kitui Mwingi North KEN120 120 Kenya Kitui Mwingi West KEN121 121 Kenya Kwale Kinango KEN122 122 Kenya Kwale Lunga Lunga KEN123 123 Kenya Kwale Matuga KEN124 124 Kenya Kwale Msambweni KEN125 125 Kenya Laikipia Laikipia East KEN126 126 Kenya Laikipia Laikipia North KEN127 127 Kenya Laikipia Laikipia West KEN128 128 Kenya Lamu Lamu East KEN129 129 Kenya Lamu Lamu West KEN130 130 Kenya Machakos Kangundo KEN131 131 Kenya Machakos Kathiani KEN132 132 Kenya Machakos Machakos Town KEN133 133 Kenya Machakos Masinga KEN134 134 Kenya Machakos Matungulu KEN135 135

64
Kenya Machakos Mavoko KEN136 136 Kenya Machakos Mwala KEN137 137 Kenya Machakos Yatta KEN138 138 Kenya Makueni Kaiti KEN139 139 Kenya Makueni Kibwezi East KEN140 140 Kenya Makueni Kibwezi West KEN141 141 Kenya Makueni Kilome KEN142 142 Kenya Makueni Makueni KEN143 143 Kenya Makueni Mbooni KEN144 144 Kenya Mandera Banissa KEN145 145 Kenya Mandera Lafey KEN146 146 Kenya Mandera Mandera East KEN147 147 Kenya Mandera Mandera North KEN148 148 Kenya Mandera Mandera South KEN149 149 Kenya Mandera Mandera West KEN150 150 Kenya Marsabit Laisamis KEN151 151 Kenya Marsabit Moyale KEN152 152 Kenya Marsabit North Horr KEN153 153 Kenya Marsabit Saku KEN154 154 Kenya Meru Buuri KEN155 155 Kenya Meru Central Imenti KEN156 156 Kenya Meru Igembe Central KEN157 157 Kenya Meru Igembe North KEN158 158 Kenya Meru Igembe South KEN159 159 Kenya Meru North Imenti KEN160 160 Kenya Meru South Imenti KEN161 161 Kenya Meru Tigania East KEN162 162 Kenya Meru Tigania West KEN163 163 Kenya Migori Awendo KEN164 164 Kenya Migori Kuria East KEN165 165 Kenya Migori Kuria West KEN166 166 Kenya Migori Nyatike KEN167 167 Kenya Migori Rongo KEN168 168 Kenya Migori Suna East KEN169 169 Kenya Migori Suna West KEN170 170 Kenya Migori Uriri KEN171 171 Kenya Mombasa Changamwe KEN172 172 Kenya Mombasa Jomvu KEN173 173 Kenya Mombasa Kisauni KEN174 174 Kenya Mombasa Likoni KEN175 175 Kenya Mombasa Mvita KEN176 176 Kenya Mombasa Nyali KEN177 177 Kenya Murang'a Gatanga KEN178 178 Kenya Murang'a Kahuro KEN179 179 Kenya Murang'a Kandara KEN180 180 Kenya Murang'a Kangema KEN181 181 Kenya Murang'a Kigumo KEN182 182 Kenya Murang'a Kiharu KEN183 183 Kenya Murang'a Mathioya KEN184 184 Kenya Murang'a Murang'a South KEN185 185 Kenya Nairobi Dagoretti North KEN186 186 Kenya Nairobi Dagoretti South KEN187 187 Kenya Nairobi Embakasi Central KEN188 188 Kenya Nairobi Embakasi East KEN189 189 Kenya Nairobi Embakasi North KEN190 190 Kenya Nairobi Embakasi South KEN191 191 Kenya Nairobi Embakasi West KEN192 192 Kenya Nairobi Kamukunji KEN193 193 Kenya Nairobi Kasarani KEN194 194 Kenya Nairobi Kibra KEN195 195 Kenya Nairobi Langata KEN196 196 Kenya Nairobi Makadara KEN197 197 Kenya Nairobi Mathare KEN198 198 Kenya Nairobi Roysambu KEN199 199 Kenya Nairobi Ruaraka KEN200 200 Kenya Nairobi Starehe KEN201 201 Kenya Nairobi Westlands KEN202 202 Kenya Nakuru Bahati KEN203 203 Kenya Nakuru Gilgil KEN204 204 Kenya Nakuru Kuresoi North KEN205 205

65
Kenya Nakuru Kuresoi South KEN206 206 Kenya Nakuru Molo KEN207 207 Kenya Nakuru Naivasha KEN208 208 Kenya Nakuru Nakuru Town East KEN209 209 Kenya Nakuru Nakuru Town West KEN210 210 Kenya Nakuru Njoro KEN211 211 Kenya Nakuru Rongai KEN212 212 Kenya Nakuru Subukia KEN213 213 Kenya Nandi Aldai KEN214 214 Kenya Nandi Chesumei KEN215 215 Kenya Nandi Emgwen KEN216 216 Kenya Nandi Mosop KEN217 217 Kenya Nandi Nandi Hills KEN218 218 Kenya Nandi Tinderet KEN219 219 Kenya Narok Emurua Dikirr KEN220 220 Kenya Narok Kilgoris KEN221 221 Kenya Narok Narok East KEN222 222 Kenya Narok Narok North KEN223 223 Kenya Narok Narok South KEN224 224 Kenya Narok Narok West KEN225 225 Kenya Nyamira Borabu KEN226 226 Kenya Nyamira Manga KEN227 227 Kenya Nyamira Masaba North KEN228 228 Kenya Nyamira Nyamira KEN229 229 Kenya Nyamira Nyamira North KEN230 230 Kenya Nyandarua Kinangop KEN231 231 Kenya Nyandarua Kipipiri KEN232 232 Kenya Nyandarua Ndaragwa KEN233 233 Kenya Nyandarua Ol Jorok KEN234 234 Kenya Nyandarua Ol Kalou KEN235 235 Kenya Nyeri Kieni East KEN236 236 Kenya Nyeri Kieni West KEN237 237 Kenya Nyeri Mathira East KEN238 238 Kenya Nyeri Mathira West KEN239 239 Kenya Nyeri Mukurweini KEN240 240 Kenya Nyeri Nyeri Town KEN241 241 Kenya Nyeri Othaya KEN242 242 Kenya Nyeri Tetu KEN243 243 Kenya Samburu Samburu Central KEN244 244 Kenya Samburu Samburu East KEN245 245 Kenya Samburu Samburu North KEN246 246 Kenya Siaya Alego Usonga KEN247 247 Kenya Siaya Bondo KEN248 248 Kenya Siaya Gem KEN249 249 Kenya Siaya Rarieda KEN250 250 Kenya Siaya Ugenya KEN251 251 Kenya Siaya Ugunja KEN252 252 Kenya Taita Taveta Mwatate KEN253 253 Kenya Taita Taveta Taveta KEN254 254 Kenya Taita Taveta Voi KEN255 255 Kenya Taita Taveta Wundanyi KEN256 256 Kenya Tana River Bura KEN257 257 Kenya Tana River Galole KEN258 258 Kenya Tana River Garsen KEN259 259 Kenya Tharaka Nithi Maara KEN260 260 Kenya Tharaka Nithi Meru South KEN261 261 Kenya Tharaka Nithi Tharaka North KEN262 262 Kenya Tharaka Nithi Tharaka South KEN263 263 Kenya Trans Nzoia Cherangany KEN264 264 Kenya Trans Nzoia Endebess KEN265 265 Kenya Trans Nzoia Kiminini KEN266 266 Kenya Trans Nzoia Kwanza KEN267 267 Kenya Trans Nzoia Saboti KEN268 268 Kenya Turkana Loima KEN269 269 Kenya Turkana Turkana Central KEN270 270 Kenya Turkana Turkana East KEN271 271 Kenya Turkana Turkana North KEN272 272 Kenya Turkana Turkana South KEN273 273 Kenya Turkana Turkana West KEN274 274 Kenya Uasin Gishu Ainabkoi KEN275 275

66
Kenya Uasin Gishu Kapseret KEN276 276 Kenya Uasin Gishu Kesses KEN277 277 Kenya Uasin Gishu Moiben KEN278 278 Kenya Uasin Gishu Soy KEN279 279 Kenya Uasin Gishu Turbo KEN280 280 Kenya Vihiga Emuhaya KEN281 281 Kenya Vihiga Hamisi KEN282 282 Kenya Vihiga Luanda KEN283 283 Kenya Vihiga Sabatia KEN284 284 Kenya Vihiga Vihiga KEN285 285 Kenya Wajir Eldas KEN286 286 Kenya Wajir Tarbaj KEN287 287 Kenya Wajir Wajir East KEN288 288 Kenya Wajir Wajir North KEN289 289 Kenya Wajir Wajir South KEN290 290 Kenya Wajir Wajir West KEN291 291 Kenya West Pokot North Pokot KEN292 292 Kenya West Pokot Pokot Central KEN293 293 Kenya West Pokot Pokot South KEN294 294 Kenya West Pokot West Pokot KEN295 295

67
Appendix B Model-based geostatistical methods
B1. Covariate processing and selection
A set of four geographical covariates were examined; Precipitation, Enhanced Vegetation Index
(EVI), Temperature Suitability Index (TSI) and Urbanisation. Precipitation and temperature
rasters were derived from the monthly average rasters obtained from WorldClim website and
were summarised to get the annual mean rainfall and annual mean temperature surfaces.6 The
EVI surface was derived from the MODerate-resolution Imaging Spectroradiometer (MODIS)
sensor imagery7 while the urbanisation surface was obtained from Global Rural Urban Mapping
Project (GRUMP)8
The best generalised linear approach was used to generate minimum adequate set of covariates
that have a significant effect on malaria to be used in geostatistical model. The function
“bestglm” was used as implemented in R-Project version 3.0.1 package. This function selects the
best subset of the input covariates for the GLM family.9 Bayes Information Criterion (BIC) was
used to select the significant covariates for the study because it has been shown that BIC often
selects more parsimonious models than the AIC.10 A uniform prior of the model of fixed size
implemented in BIC was used (see Equation B1 following):
log(n) 2 logp
BIC D kk
This is where
is an adjustable parameter, p is the number of possible input covariates not
counting the bias or intercept term and k is the number of the parameters in the model.11
6. Murtaugh PA (2009): Performance of several variable-selection methods applied to real ecological data. Ecology Letters, 12(10):1061-1068. 7. Scharlemann JorP, Benz D, Hay SI, Purse BV, Tatem AJ, Wint GW, Rogers DJ (2009). Global data for ecology and epidemiology: a novel algorithm for temporal Fourier processing MODIS data. PLoS One 2008, 3(1):e1408. 8. Schneider A, Friedl M, Potere D (2009): A new map of global urban extent from MODIS satellite data. Environmental Research Letters, 4(4):044003. 9. McLeod A, Xu C bestglm (2010): Best Subset GLM. URL http://CRAN R-project org/package= bestglm. 10. Ibid. 11. Ibid.

68
B2. SI 2: Space-time Bayesian geostatistical model
Bayesian hierarchical space-time model was implemented through Stochastic Partial
Differential Equations (SPDE) approach using Integrated Nested Laplace Approximations
(INLA) in R-INLA library to produce continuous malaria risk maps at 1 km x 1 km spatial
resolution and predicting to each year of study: 2000, 2005, 2010 and 2015 in Kenya.12 This
SPDE is formulated as a link between Gaussian random fields (GRFs) and the Gaussian Markov
Random Fields (GMRFs).13 The spatio-temporal covariance function and the dense covariance
matrix of the Gaussian field are replaced by a neighbourhood structure and a sparse precision
matrix respectively that together define a GMRF.14 This finite-dimensional GMRF that
substitutes infinite-dimensional GRF can be expressed as shown in Equation B2 following:
1
( ) ( )n
i i
i
x u u w
Here the iw
represents the Gaussian distributed weights and i are piece-wise linear basis
functions defined on a triangulation of the domain with n nodes defined as mesh. The solution
of a Gaussian random field SPDE with Matern covariance function is represented as in Equation
B3 following:
2 2(k ) (u) (u),x W ,du R 2,v d 0,k 0,v
The innovation process W is the spatial Gaussian white noise and is the Laplacian. Finite
element method (FEM), a numerical technique for solving partial differential equation, has been
successfully used in solving the SPDE of this type.15 This SPDE-formulation is motivated by
computational benefits and also introduces a new class of spatial models.16 In this SPDE
approach, a non-stationary model was used and achieved by modifying the SPDE to obtain the
GRFs with defined dependence structure and is expressed in Equation B4 as:
12. Rue Hav, Martino S, Chopin N (2009). Approximate Bayesian inference for latent Gaussian models by using integrated nested Laplace approximations. Journal of the Royal Statistical Society: Series B (statistical methodology), 71(2):319-392. 13. Lindgren F, Rue H (2015). Bayesian Spatial and Spatio-temporal Modelling with R-INLA. Journal of Statistical Software, 63 (19). 14. Cameletti M, Lindgren F, Simpson D, Rue Hav (2013). Spatio-temporal modeling of particulate matter concentration through the SPDE approach. AStA Advances in Statistical Analysis:1-23. 15. Lindgren F, Rue H (2015). Op cit. 16. Ingebrigtsen R, Lindgren F, Steinsland I (2013). Spatial models with explanatory variables in the dependence structure. Spatial Statistic, 8: 6.

69
2( (u) )( (u) x(u)) w(u),k ,u
In the current version of the SPDE package17 as implemented in (6), a non-stationary model
defined via spatial varying (u)k and (u) is available for the case 2 . The logk(u) and
log (u) are defined as linear combinations of basic functions in Equation B5:
0
1
log( (u)) b (u) (u) ,p
k k
k
b
0
1
log(k(u)) b (u) (u) ,p
k k
k k
k
b
The precision matrix with parameter fields in the diagonal matrices is evaluated in a mesh in
Equation B6 as:
( (u )),iT diag (k(u )),iK diag
2 2 2 2
1 1 2(K CK K G G K G )TTQ T
The space-time SPDE model used in this study is represented as show in Equation 7. This is by constructing Kronecker product model by first starting with the basis function represented as
where each basis function is computed as a product of a spatial and a temporal basis function, (u, t) (u) (t)u t
i i j , thus the space-time SPDE.18 The temporal aspect of the model is based on
autoregressive (AR) second order process in Equation B7:
2 2(k(u) ) ( (u) x(u, t)) w(u, t),
t
(u, t) R
Therefore, the overall non-stationary hierarchical space-time binomial model of the prevalence
of malaria was represented as the realization of a spatial-temporal process of malaria risk at the
survey location, survey date, significant covariates at sampled locations and date, and the
measurement error defined by the Gaussian white noise process. This can simply be denoted as
in Equation B8:
( , ) ( , ) ( , ) ( , )i i i iy u t z u t u t u t
17. Lindgren F, Rue H (2015). Op cit. 18. Lindgren F, Rue H (2015). Op cit

70
This equation defines a hierarchical model where (u , )iy t
is a realization of a spatial-temporal
process that represents risk of malaria at study location 1...i n , and year . ,t T ,
1(u , ) ( (u , ), , (u , ))i j i j p i jz t z t z t denotes the vector of p
covariates for cluster iu at time jt
, 1( , )p is the coefficient vector, 2(u , ) ~ (0, )i jt N
is the measurement error
defined by the Gaussian white noise process that is uncorrelated both over space and time.
B3. Validation
To assess the predictive performance of the model, the predicted prevalence of malaria in the
surveyed locations was extracted and matched with the actual prevalence in surveyed data at
the corresponding locations and time in a randomly sampled 10% holdout validation dataset
using a sampling algorithm which de-clusters over space and time. Four performance indices
were chosen to evaluate predictive performance and model fit: root-mean-square error (RMSE),
mean prediction error (MPE), mean absolute prediction error (MAPE), and the correlation
coefficient between the predicted and the observed values. The RMSE is simply the square-root
of the mean of the squared difference between the posterior predicted mean and observed
value and it is used to measure the accuracy of the model. The MPE provides a measure of the
bias of the predictor, the MAPE provides a measure of the mean accuracy of individual
predictions, and the correlation coefficient provides a measure of association between the
observed data and prediction sets.19 The correlation between the observed and predicted data
was visualised in a scatter plot with a least-squares best fitting line.
19. Magalhaes RJS, Clements ACA (2011). Mapping the risk of anaemia in preschool-age children: The contribution of malnutrition, malaria, and helminth infections in West Africa. PLoS Medicine, 8(6).

71
B4. Validation results From the validation statistics, the RMSE was 0.177; MPE0.010; MAPE0.126 and the correlation
coefficient 0.813. Maps of the posterior standard deviation from the mean can be found in
Figure B1. The scatterplot for the observed and predicted prevalence is shown in Figure B1.
Figure B1. The correlation graph of observed PfPR2-10 and predicted PfPR2-10 for the 10% holdout dataset

72
Appendix C Small area estimation methods
Weighted probability estimates were modelled as binomial proportions, for each areal unit,
where an underlying spatial correlation in the observations is assumed, and attributed to
geographical adjacency between the areas of study. The spatially autocorrelated predictions are
smoothened out by assigning an intrinsic conditional auto-regressive (CAR) prior to the
spatially varying random effect in a Bayesian hierarchical modelling framework (Besag et al.,
1991).
Let 𝑦𝑖
∗|𝑝𝑖 ~ 𝐵𝑖𝑛𝑜𝑚𝑖𝑎𝑙(𝑚𝑖∗, 𝑝𝑖) 𝑓𝑜𝑟 𝑖𝑡ℎ 𝑎𝑟𝑒𝑎𝑙 𝑢𝑛𝑖𝑡 , where 𝑦𝑖
∗the true prevalence rates is.
The true value of 𝑦𝑖∗can be estimated by taking care of spatial autocorrelation, a normally
distributed intercept and also including area-level spatially correlated covariates in such a
model frame as below in Equation C1:
�̂�𝑝,𝑖 = �̂� + �̂��̅�𝑖 + �̂�𝑖 + �̂�𝑖
Where �̂� , �̅�𝑖 , �̂�𝑖 , �̂�𝑖 are the intercept, spatially correlated covariate ,spatially structured
random effect and non-spatially structure random effect- for each study district, respectively.
However, a simpler version of model (1) was adopted as in Equation C2:
�̂�𝑝,𝑖 = �̂�𝑖 + �̂�𝑖 + 휀𝑖 ,
The spatial autocorrelation was computed through a neighbourhood structure that is defined as
a function of distance between centroids of study districts. However, the neighbourhood
structure can similarly be based on shared boundaries between study regions.
C1. Random effects and model priors
To make the resulting posterior distributions amenable to analytical integration in INLA, the
probabilities of intervention coverage were modelled on a logit or signal scale, then back-
transformed to coverage scale or to observation scale which is originally binomial. Thus the
sampling model was as in Equation C3:
𝑙𝑜𝑔𝑖𝑡(𝑝𝑖) = 𝛽0 + 𝑈𝑖 + 𝑉𝑖
The spatially smooth random effects 𝑈𝑖 , for area i, are assigned a conditional normal
distribution with mean given as the average of its neighbours and conditional variance inversely
proportional to the number of neighbours of that particular area. This representation is given
below in Equation 4. For the non-spatially structured random effect 𝑉𝑖 an independent normal
distribution was assigned.
𝑈𝑖|𝑈𝑗 , 𝑗 ≠ 𝑖 ~ 𝑁(1
𝑘𝑖∑ 𝑈𝑖𝑗∈𝛿𝑖
,𝜎𝑢
2
𝑘𝑖)
𝑉𝑖~ 𝑖𝑖𝑑 𝑁(0, 𝜎𝑉2)

73
𝑈𝑖 , 𝑈𝑗 are spatially smooth effect for the 𝑖𝑡ℎ 𝑎𝑛𝑑 𝑗𝑡ℎ neighbors while 𝛿𝑖is the set of neighbors of i.
The set of spatially smooth random effects 𝑈𝑖 are assigned a CAR prior, specifically in this case, a
Besag prior (Besag et al., 1991; Mercer et al., 2014).
Required were priors for 𝛽0 and random effect variances: 𝜎𝑢2 and 𝜎𝑉
2. The 𝛽0′′𝑠 are given normal
hyperprior and the latter are assigned gamma distributions (Gomez-Rubio et al., 2010).The
parameters are then estimated using an approximate Bayesian framework, namely INLA; which
relies on the Gaussian Markov Random Field as supported by Rue et al., 2009.
C2. Including sampling weights in the model
The sampling weights are required to adjust for biases due to complex surveys. A survey is
complex in the context of choice of sampling scheme, rates of no-responses and objectivity
introduced in the sample. For example, a multi-stage sampling framework each carried out in a
strata may introduce non-response bias, non-coverage bias and variance.
While bias due to variance is taken care of by smoothing in hierarchical models, the other types
of bias are countered by introducing weights in our model. However, non-response bias is
explained by post-stratification which requires sampling population data (Cici et al 2014); this
might not be available in some survey datasets. Weights can be incorporated in the model
response in the two ways highlighted below. The first option was used in our analysis.
a) Direct standardisation of proportions using design weight
In the simplest form, weights 𝑤𝑖𝑗 adjusts true population mean �̂�𝑢,𝑖 as in Equation C5 following:
�̂�𝑢,𝑖 = ∑ 𝑤𝑖𝑗𝑦𝑖𝑗𝑗
∑ 𝑤𝑖𝑗𝑗= �̅�𝑖
𝑤𝑖𝑗 = (𝑁𝑖𝑛𝑖⁄ ) ; 𝑖, 𝑗 indexes area and observation in an area, respectively
𝑣𝑎𝑟(�̂�𝑢,𝑖) = (1 −𝑛𝑖
𝑁𝑖) 𝑠𝑖
2 ; 𝑠𝑖2 is sample variance.
This expression only reduces bias from non-coverage and confounding but not non-response.
b) Horwitz –Thompson estimator for Bayesian hierarchical model
The most commonly used direct unbiased estimator of the area proportion in complex surveys
is the post-stratified Horwitz-Thompson estimator (Horvitz and Thompson, 1952; Sarndal et al., 1992). This weighting option is more robust in the sense that it takes care grouping variables
that discriminate outcomes to subpopulations, for example, the age-gender structure of the
population under study. (See Equation C6 following):
�̂�𝑖 =∑ ∑ 𝑅𝑖𝑗𝑘
𝑁𝑖𝑗𝐾=1 𝑤𝑖𝑗𝑘𝑦𝑖𝑗𝑘
𝐽𝐽=1
∑ ∑ 𝑅𝑖𝑗𝑘𝑁𝑖𝑗𝑘=1 𝑤𝑖𝑗𝑘
𝐽𝑗=1
𝑦𝑖𝑗𝑘 is the observed response.
𝑤𝑖𝑗𝑘 is the sampling weights of kth person in area i and group j, a group could permutations of
factor variables like age and gender etc

74
Using Horwitz-Thompson estimator, weights are often calculated as the products of the
reciprocal of sampling probability for selection (design weight) and the post-stratification
weights as in Equation C7 following:
𝑤𝑖𝑗𝑘 = 𝜋𝑖𝑗𝑘−1 ×
𝑁𝑗
�̂�𝑗 ;for k=1,…,𝑁𝑖𝑗
Where �̂�𝑗=∑ ∑ 𝑅𝑖𝑗𝑘𝑁𝑖𝑗𝑘=1
𝐼𝑖=1 𝜋𝑖𝑗𝑘
−1 so that 𝑁𝑗=∑ ∑ 𝑤𝑖𝑗𝑘𝑁𝑖𝑗𝑘=1
𝐼𝑖=1 , the known group totals in the
population.
Hence the design weight adjusts for systematic sampling used, while the post-stratification
weights attempt to adjust for non-response, by rescaling each group j so that the estimated
population total matches the known population total. The estimated variance for post-stratified
mean is as in Equation C8 following:
𝑣𝑎𝑟(�̂�𝑖) =1
𝑛𝑖(𝑛𝑖−1)(1 −
𝑛𝑖
𝑁𝑖) ∑ ∑ 𝑅𝑖𝑗𝑘
𝑁𝑖𝑗𝑘=1
𝐽𝑗=1 𝜌𝑖𝑗𝑘
2 ; is sample variance.
𝜌𝑖𝑗𝑘 = 𝑦𝑖𝑗𝑘 − �̂�.𝑗
The effective number of cases is defined by as in Equation C9 following:
𝑦∗ = 𝑚𝑖∗ × �̂�𝑖
C3. Model selection
The best model was selected in terms of prediction of the values in the small areas using the DIC
(Deviance Information Criterion) – a hierarchical modelling generalisation of the BIC-when all
models are run on the same data. Model with the smallest DIC is picked for inference.
𝐷(𝜃) = −2𝑙𝑜𝑔(𝑝(𝑦|𝜃)) + 𝐶
𝐷𝐼𝐶 = 𝐷(𝜃) + 2𝑃𝐷
𝑃𝐷 = 0.5𝑣𝑎�̂�(𝐷(𝜃)), is the effective number of parameters (Gelman et al., 2004). The more the
number of effective parameters, the bigger chances of over-fitting we have, so the DIC is
penalised to avoid effects of over-fitting.
𝑝(𝑦|𝜃);is the likelihood function and C is a constant that cancels out in all calculations
comparing different models.
C4. Extracting results
The main results to be extracted are the summary of predicted means and standard errors- for each study area as sampled from the predictive distribution. These results are merged with the
boundary shape files and mapped accordingly.
Posterior distributions of spatially structured and unstructured random effects were also
extracted, which are plotted and mapped. These help diagnose presence of multimodal
distribution in spatial estimates, evaluate proportion of variance explained by spatially
structured component etc.
Besides calculating and mapping the fitted values and spatial risk we can also manually use
predictions to evaluate spatial exceedance for a relative risk of 𝑝 say (Pr(𝑝> 0.4)).
75
References Besag J, York J, Mollie A (1991). Bayesian image restoration, with two applications in spatial
statistics. Annals of the Institute of Statistical Mathematics; 43:1–59.
Cici C, Jon W, Thomas L (2014). The use of sampling weights in Bayesian hierarchical models for
small area estimation. Spatial and Spatio-temporal Epidemiology; 11:33–43.
Gelnman A, Carlin JB, Stern HS, Rubin DB. (2004). Bayesian Data Analysis: Second Edition.
Chapman and Hall/CRC Texts in Statistical Science.
Gomez-Rubio V, Best N, Li G, Clarke P (2010). Bayesian statistics for small area estimation.
Imperial College London http://eprints.ncrm.ac.uk/1686/1/BayesianSAE.pdf Accessed 12
March, 2017.
Horvitz DG, Thompson ME (1952). A generalization of sampling without replacement from a
finite universe. Journal of American Statistical Association, 47:663–685.
Mercer L, Wakefield J, Chen C, Lumley T (2014). A comparison of spatial smoothing methods for
small area estimation with sampling weights. Spatial Statistics; 8: 69–85
Rue H, Martino S, Chopin N (2009) Approximate Bayesian inference for latent Gaussian Models
using INLA. Journal of the Royal Statistical Society, Series B; 71: 319–392
Särndal CE, Swensson B, Wretman JH (1992). Model Assisted Survey Sampling. Springer Series in
Statistics. New York: Springer-Verlag: 694

Epidemiology and control profile of malaria in
Kenya


![Untitled-3 [tuplanmaestro.com]...Title Untitled-3.cpt Author josea Created Date 4/28/2020 1:34:55 PM](https://static.fdocuments.net/doc/165x107/5ecf51e8872eca1ce71eda41/untitled-3-title-untitled-3cpt-author-josea-created-date-4282020-13455.jpg)
![Untitled-1 [tuplanmaestro.com]...Title: Untitled-1.cpt Author: josea Created Date: 4/29/2020 3:28:23 PM](https://static.fdocuments.net/doc/165x107/5f05c7377e708231d414a8d7/untitled-1-title-untitled-1cpt-author-josea-created-date-4292020-32823.jpg)