Epidemic Spread in Mobile Ad Hoc...
15
Epidemic Spread in Mobile Ad Hoc Networks Determining the Tipping Point Nicholas C. Valler 1 , B. Aditya Prakash 2 , Hanghang Tong 2 , Michalis Faloutsos 1 , and Christos Faloutsos 2 1 Department of Computer Science and Enginnering University of California, Riverside {nvaller, michalis}@cs.ucr.edu 2 Computer Science Department Carnegie Mellon University {badityap, htong, christos}@cs.cmu.edu Abstract. Short-range, point-to-point communications for mobile users enjoy increasing popularity, particularly with the rise in Bluetooth-equipped mobile devices. Unfortunately, virus writers have begun exploiting lax security in many mobile devices and subsequently developed malware ex- ploiting proximity-based propagation mechanisms (e.g. Cabir or CommWar- rior). So, if given an ad-hoc network of such mobile users, will a proximity- spreading virus survive or die out; that is, can we determine the “tipping point” between survival and die out? What effect does the average user velocity have on such spread? We answer the initial questions and more. Our contributions in this paper are: (a) we present a framework for an- alyzing epidemic spreading processes on mobile ad hoc networks, (b) using our framework, we are the first to derive the epidemic threshold for any mobility model under the SIS model, and (c) we show that the node velocity in mobility models does not affect the epidemic threshold. Additionally, we introduce a periodic mobility model and provide eval- uation via our framework. We validate our theoretical predictions using a combination of real, synthetic and simulated mobility data, showing ultimately, our predictions accurately estimate the epidemic threshold of such systems. 1 Introduction The prevalence and increased functionality of mobile phones present an unique oppor- tunity for malicious software writers. According to popular reports, 45.4 million U.S. citizens own smartphones in 2010 [12], roughly 15% of the total population. These de- vices are becoming more and more essential for the daily lives of end-users, especially as smartphones offer more and more capabilities. At the same time, mobile devices are equipped with device-to-device (a.k.a. point-to-point) communication technolo- gies (such as Bluetooth), where the communication does not use the phone’s service provider’s infrastructure. There are estimated over 920 million Bluetooth-equipped de- vices worldwide shipped in 2008, making Bluetooth the most common point-to-point communication protocol in today’s smartphones. To date, at least two smartphone
Transcript of Epidemic Spread in Mobile Ad Hoc...
Epidemic Spread in Mobile Ad Hoc Networks
Determining the Tipping Point
Nicholas C. Valler1, B. Aditya Prakash2, Hanghang Tong2, Michalis Faloutsos1,and Christos Faloutsos2
1 Department of Computer Science and EnginneringUniversity of California, Riverside{nvaller, michalis}@cs.ucr.edu2 Computer Science Department
Carnegie Mellon University{badityap, htong, christos}@cs.cmu.edu
Abstract. Short-range, point-to-point communications for mobile usersenjoy increasing popularity, particularly with the rise in Bluetooth-equippedmobile devices. Unfortunately, virus writers have begun exploiting laxsecurity in many mobile devices and subsequently developed malware ex-ploiting proximity-based propagation mechanisms (e.g. Cabir or CommWar-rior). So, if given an ad-hoc network of such mobile users, will a proximity-spreading virus survive or die out; that is, can we determine the “tippingpoint” between survival and die out? What effect does the average uservelocity have on such spread? We answer the initial questions and more.Our contributions in this paper are: (a) we present a framework for an-alyzing epidemic spreading processes on mobile ad hoc networks, (b)using our framework, we are the first to derive the epidemic thresholdfor any mobility model under the SIS model, and (c) we show that thenode velocity in mobility models does not affect the epidemic threshold.Additionally, we introduce a periodic mobility model and provide eval-uation via our framework. We validate our theoretical predictions usinga combination of real, synthetic and simulated mobility data, showingultimately, our predictions accurately estimate the epidemic threshold ofsuch systems.
1 Introduction
The prevalence and increased functionality of mobile phones present an unique oppor-tunity for malicious software writers. According to popular reports, 45.4 million U.S.citizens own smartphones in 2010 [12], roughly 15% of the total population. These de-vices are becoming more and more essential for the daily lives of end-users, especiallyas smartphones offer more and more capabilities. At the same time, mobile devicesare equipped with device-to-device (a.k.a. point-to-point) communication technolo-gies (such as Bluetooth), where the communication does not use the phone’s serviceprovider’s infrastructure. There are estimated over 920 million Bluetooth-equipped de-vices worldwide shipped in 2008, making Bluetooth the most common point-to-pointcommunication protocol in today’s smartphones. To date, at least two smartphone

worms have been found in the wild, Cabir and CommWarrior, which spread usingBluetooth.
Given a system of mobile agents, such as smartphones, what can we say about thepropagation of a virus3 within the system? A key question is to identify the tippingpoint, known as the system’s epidemic threshold, or take-off point, below which a virus isguaranteed to “die out.” For the epidemic models, we focus on one of the most popularmodels, the flu-like one susceptible-infected-susceptible - SIS (see Section 5 where wehandle other models). There, agents maintain no immunity, and become susceptible,immediately after they heal. Our key contributions are as follows:
1. Framework and Formula: We present a framework for estimating the epidemicthreshold on any, arbitrary mobile ad hoc network model. To the best of ourknowledge, ours is the first theoretical study for the general mobility case. Theidea is to derive a sequence of adjacency matrices, and then compute the firsteigenvalue of the so-called system matrix (see Theorem 1). There, we show thatthe epidemic threshold depends only on this first eigenvalue, and nothing else.
2. Closed Formulas: We show how to use our framework to derive simple, approximate(but accurate) formulas for several, popular special cases (Random Walk model,Levy flight model).
3. Insensitivity to Velocity: To our surprise, our results show that the epidemic thresh-old does not depend on the node velocity (v > 0). Our experiments confirm theaccuracy of our approximations, as well as our ‘insensitivity’ observation.
Jumping ahead, Figure 1 showcases the accuracy of our results (Lemma 3) of theepidemic threshold for the SIS (=flu-like) model on the so-called ‘Levy Flight’ mobilitymodel. See section 4 for more details - but the point is that our prediction for thetake-off point (= epidemic threshold, indicated with a black arrow) is exactly where allcurves take off.
We have two additional contributions: through extensive simulation experiments,we show that similar insensitivity results hold for other popular mobility models likeLevy flight, Random Waypoint etc.; and, moreover, we introduce the periodic mobilitymodel, which is very popular in biological virus epidemiology [1, 4], and show how touse our framework to estimate its epidemic threshold.
The rest of this paper has the typical organization: background (Section 2, proposedframework and theorems (Section 3), experiments (Section 4), additional observations(Section 5), and finally, related work and conclusions. (Sections 6 and 7).
2 Preliminaries
In this section, we present a general background on proximity-based epidemic spreadingmodels and formulate our problem statement.
2.1 Epidemic Model: SIS (flu-like)
The SIS epidemic model resembles a flu-like virus, where nodes have no immunity.Healthy (‘S’ = susceptible) nodes become sick (‘I’ = infected) stochastically from their
3 We focus on proximity propagation, which in mobile networks is affected by mobility.However, virus for smartphones can also propagate through email, mms, or directaccess to the web. We do not consider these cases, sine they are not directly affectedby mobility

Predicted Take-off Point
Fig. 1. Accuracy of our results (Lemma 3), for the ‘Levy-Flight’ model. Take-off plot,plotting the max number of infections vs. strength of the virus. Notice that our pre-dicted take-off point (black arrow) agrees with the simulations, for several node veloc-ities.
infected neighbors with a probability β. Alternatively, a sick node becomes healthy(and open to re-infection), with a probability δ. These two parameters are also referredto as the birth rate (β) and death rate (δ) of the virus.
The tipping point τ , or epidemic threshold, of an SIS epidemic model is the condi-tion under which an infection will die out exponentially quickly irrespective of initialinfection, as opposed to spreading out, causing and epidemic (technically, a pandemic).For a survey on SIS and numerous other epidemic models, see Hethcote [14], or [7, 11].
2.2 Problem Formulation
Using the background discussed above, we now formulate our problem statement. SeeTable 1 for definitions of various symbols. In this paper, we consider an epidemic ona mobile network, which provides an underlying contact structure for the virus to useas it propagates. By doing so, at any point in time, the system is non-homogenous, asnodes may only transmit the virus to its neighbors.Given:1. Mobile ad hoc network mobility models, described below.2. The SIS model parameters, i.e., the virus birth and death probabilities β and δ.
Find:The epidemic threshold τ or tipping point for the system such that for τ < 1 aninfection will die out quickly, irrespective of initial conditions.
Our problem naturally leads to other issues like the effect of node velocity in modelson the threshold, giving approximations in specific cases etc. We elaborate on them inthe upcoming sections.
3 Framework
In this section, we detail our framework for analyzing mobility models and then moveon to specific approximations and questions arising out of the framework. We will

Table 1. Terminology
Symbol Definition and Description
General Terms:A,B, . . . matrices (bold upper case)
A(i, j) element at the ith row and jth column of A
A(i, :) ith row of matrix A
A(:, j) jth column of matrix AI standard n× n identity matrixa,b, . . . column vectorsI,J , . . . sets (calligraphic)λB first eigenvalue (in absolute value) of a
matrix BMobility Terms:M mobility modelPi,t position of node i at time tN number of nodesA simulation areaρ node density (N/A)∆T Time stepT number of different alternating behaviorsA1, . . . ,AT T corresponding size (n× n) symmetric
alternating adjacency matricesEpidemic Terms:β virus transmission probability in the SIS modelδ virus death probability in the SIS modelτ epidemic thresholdAcronyms and Terms:USS Uniform Steady-State ApproximationEAAM Eigenvalue of Average Adjacency Matrix
ApproximationTake-off Plot Max number of infected agents vs.
Epidemic Threshold τ
present extensive simulations demonstrating the results later in Section 4. Also pleasesee Section 4.2 for a description of the mobility models.
Note that node-to-node contacts at a particular time can be represented by an adja-cency matrix A. We next provide a general theorem expressing the epidemic thresholdfor mobility models.
3.1 Epidemic Thresholds on Mobility Models
Theorem 1 (Mobility model threshold). If a mobility model can be representedas a sequence of connectivity graphs L = {A1,A2, . . . ,AT }, one adjacency matrix At
for each time step t ∈ {1..T}, then the epidemic threshold is:
τ = λS (1)
where λS is the first eigenvalue of matrix S and S =Qi Si and ∀i ∈ {1..T} Si =
(1− δ)I + βAi (I is the standard N ×N identity matrix).
Proof. If the mobility model can be represented as a sequence of graphs, then theepidemic threshold depends on the first eigenvalue of the system matrix [26]. Hence,τ = λQ
i((1−δ)I+βAi). ut
We can now give a simpler closed-form approximation for the threshold in Equa-tion 1 in the following lemma:

Lemma 1 (EAAM Approximation for Threshold). Under the same conditionsas in Theorem 1, the following is an approximation for the epidemic threshold:
τ ≈ β
δ× λAavg (2)
where Aavg =PiAi/T is the average adjacency matrix.
Proof. Note that,
S =Yi
((1− δ)I + βAi)
= (1− δ)T I + βXi
Ai +O(β2) +O(β ∗ δ) +O(δ2)
≈ (1− Tδ)I + TβAavg (3)
where we neglected second or lower order terms involving β and δ. Hence, we find thatB = (1 − Tδ)I + TβAavg is a first order approximation for the S =
Qi Si matrix.
Hence from Theorem 1 we want λB < 1 which implies Equation 2. ut
We will refer to the above approximation as the ‘Eigenvalue of the Average AdjacencyMatrix’ (EAAM) approximation.
3.2 Specific Approximations
Lemma 2 (Random-Walk Threshold). In the random-walk mobility model andunder the SIS model, the following is an approximate epidemic threshold:
τ ≈ β/δ × πR2 ×N/A (4)
where R is the radius of influence of each node.
Proof. Under the random-walk model, at every point of time, each node is at a random(x, y) position, uniformly distributed on the field of interest. Each node has a radiusof possible connections (like the BlueTooth radius) R. Consequently each node hasd = πR2 × N/A neighbors on average (ignoring boundary effects). The connectivitygraph at each time step is roughly a random graph with average degree d. Hence it hasfirst eigenvalue λ1 = d on average. Hence this is approximately equivalent to havinga static graph under the SIS model where the epidemic threshold [7] is τ = β/δ × λ1.We now obtain the lemma after obvious substitutions. ut
In fact, we can go further and generalize this to any mobility model where thegeographic steady state distribution is uniform.
Lemma 3 (Uniformly-Distributed Steady State (USS) Threshold). For anymobility model where the geographic distribution of nodes at the steady state is uniformover the area of interest and under the SIS model, the following is an approximateepidemic threshold:
τ ≈ β/δ × πR2 ×N/A (5)
where R is the radius of influence of each node.

Proof. The proof for Lemma 2 goes through even here precisely because of the geo-graphically uniformly distributed nature of the steady state. Each node has roughlythe same number of connections and hence the adjacency graph is approximately ahomogenous graph with constant first eigenvalue. The result follows as before. ut
We will refer to the above approximation as the ‘Uniform Steady-State’ (USS)approximation. Mobility models like Levy Flight and Random-Walk are examples ofmodels with a geographically uniform distribution of the nodes at the steady state.Lemma 3 allows us to quickly estimate the threshold for these and many other models.
3.3 Insensitivity to Node Velocity
As there is no factor depending on the node velocity in Lemma 3, we conclude thefollowing surprising implication:
Corollary 1 (Node velocity and threshold). The node velocity (v > 0) does notaffect the epidemic threshold in mobility models where the steady state has a geograph-ically uniform steady state distribution like Random Walk, Levy Flight etc.
We conjecture that the velocity does not affect the threshold even for non-geographicallyuniformly distributed steady state mobility models like Random Waypoint. We provideempirical results supporting this claim later in Section 4.
Conjecture 1 (Effect of velocity). The node velocity (v > 0) does not affect the epidemicthreshold in the Random Waypoint mobility model.
Does Velocity have an impact at all? The above discussion raises the point whetherthe node velocity has any effect at all on the dynamics of the epidemic spreading. Weexpect that the velocity of motion does have an effect, when we are above threshold.Furthermore, simulations resulted in a non-obvious observation. The velocity had animpact on the steady-state number of infected agents in the system. We elaborate moreon these issues in Section 5.
4 Simulation Methodology and Results
4.1 Experimental Setup
To facilitate the simulation, we wrote a custom Python2.6 simulation program using theNumPy/SciPy python libraries. All simulations were conducted on a 4 core Intel(R)Xeon(R) CPU operating at 2.53 GHz and 72 GB of memory running CentOS-5.5(Linux kernel 2.6). We varied the number of agents (nodes) N between 250 and 1500within a simulation field of area A = 40, 000m2 (200m by 200m). Thus, node density ρ,commonly defined a N/A, was between 0.125 and .125 nodes per m2. All nodes had atransmission range of 5.0 meters. We did not account for signal attenuation, reflectionnor other wireless phenomena. Prior to the beginning of the simulation, nodes weredistributed on the simulation field in a uniform fashion. Simulations were generally runfor a period of 100s with time intervals of ∆T = 0.1 seconds.
We studied three mobility models common to mobile ad hoc networking: RandomWalk, Levy Flight and Random Waypoint. In the following sections, we provide detailon each model as well as simulation results. The position Pi,t of each node in the system

at time t is a function of mobility model and previous position and time step ∆T , suchthat Pi,t+1 = M(Pi,t,∆T ), where M is the mobility model.
The purpose of our simulations was to determine the role of the mobility model inthe spread of malware in a point-to-point contact network loosely describing BlueToothcommunication technology.
4.2 Mobility Models
Random Walk. The Random Walk (RW) mobility model (also referred to as Brow-nian Motion) was originally formulated to describe the seemingly random motion ofparticles. Numerous variations exists, here we describe our implementation.
Each node i in the system is parameterized by speed (Vi) and angle (θi). BothVi and θi are drawn uniformly from systemwide predefined ranges, [vmin, vmax] and[0, 2π), respectively. Clearly, such a system is memoryless. The model we employ variesfrom the simple RW model by introducing a flight time for each node, Ti. Flight time isdrawn uniformly from a range [τmin, τmax]. The spatial distribution of the RW mobilitymodel is uniform over the simulation field. According to our framework, we predict theRW mobility model will follow Lemma 2.
Levy Flight. Levy Flight mobility models have recently attracted attention due totheir statistical similarities with human mobility [28]. At the beginning of each flight,each node selects an angle uniformly from within (0, 2 ∗ π], a flight time drawn fromsome distribution, a flight length and a pause time. Flight length and pause time aredrawn from Levy distributions p(t) ∝ |t|−(1+α) and ψ(t) ∝ t−(1+β), where time t > 0,respectively. When α = 2 and β = 2 the result is a special case of the Levy distributionresulting in a Gaussian distribution. As with the Random Walk, the spatial distributionof the Levy Flight mobility model is uniform over the simulation field.
Random Waypoint. The Random Waypoint (RWP) mobility model is often citedas the de facto mobility model in ad hoc networks. As originally proposed by Johnson et.al [15], the RWP mobility model each node i is described by three parameters: currentlocation (Pi), speed (Vi), waypoint (Wi), and pause time (ρ). In general, the RWPmobility model operates as follows: Initially, a node is stationary. After a pause time ρ,the node selects a waypoint uniformly from the simulation field, then, travels along theshortest path to its waypoint P at a velocity Vi drawn uniformly from (vmin, vmax].Upon arrival at their waypoint, each node will pause for a time t = ρ. After the pauseperiod is done, each node will repeat the process. The spatial distribution of the RWPmobility model is bell-shaped [5].
4.3 Summary of Results
Accuracy of Approximations, Random Walk. We present a series of simulationstudies of the Random Walk mobility model in Figure 2. In these studies, we varied thebirth (β) and death (α) parameters of the SIS infection model. We refer to the resultingplots as “take-off plots,” which show the maximum number of infected agents seen inour simulation against our approximated epidemic threshold. For each plot, we labeledthe estimated take-off point according to the specific threshold approximation.
Figure 2(A), we approximated the epidemic threshold using the first eigenvalue ofthe average adjacency matrix, Aavg (the EAAM threshold approximation of Lemma1). We indicate the predicted threshold value at τ = 1. As expected, no epidemic was
Predicted Take-off
Point
avg
Predicted Take-off
Point
(A) EAAM (B) USS
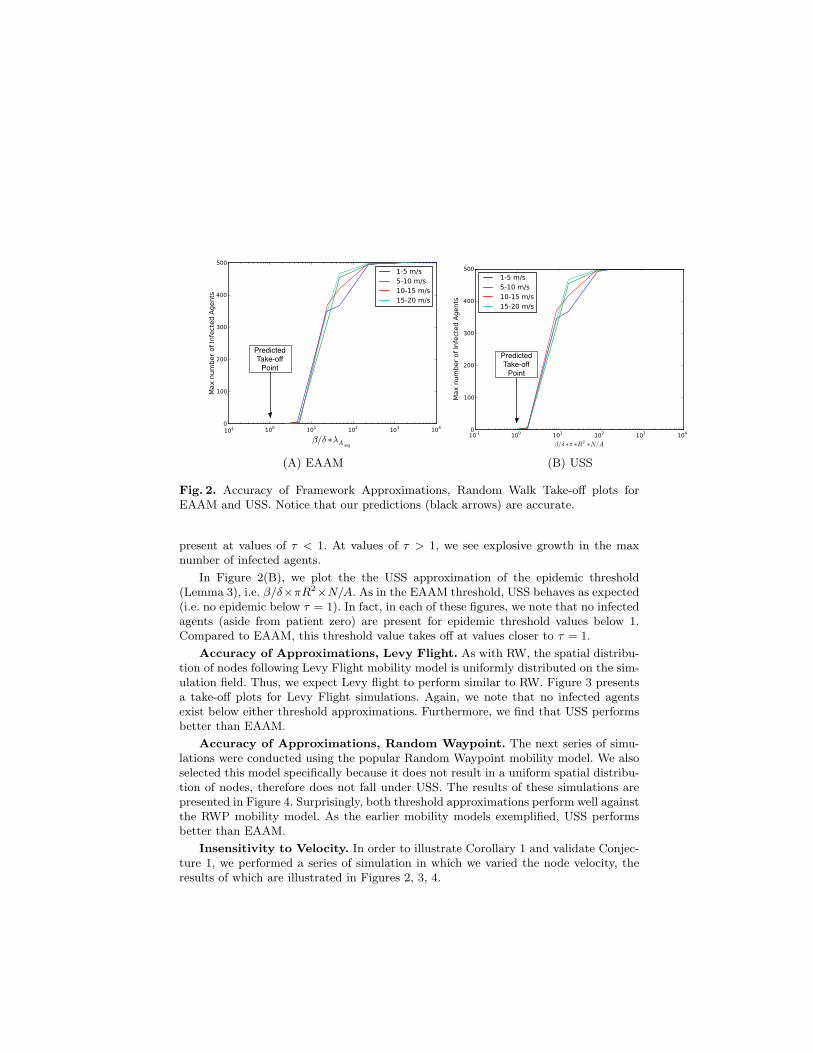
Fig. 2. Accuracy of Framework Approximations, Random Walk Take-off plots forEAAM and USS. Notice that our predictions (black arrows) are accurate.
present at values of τ < 1. At values of τ > 1, we see explosive growth in the maxnumber of infected agents.
In Figure 2(B), we plot the the USS approximation of the epidemic threshold(Lemma 3), i.e. β/δ×πR2×N/A. As in the EAAM threshold, USS behaves as expected(i.e. no epidemic below τ = 1). In fact, in each of these figures, we note that no infectedagents (aside from patient zero) are present for epidemic threshold values below 1.Compared to EAAM, this threshold value takes off at values closer to τ = 1.
Accuracy of Approximations, Levy Flight. As with RW, the spatial distribu-tion of nodes following Levy Flight mobility model is uniformly distributed on the sim-ulation field. Thus, we expect Levy flight to perform similar to RW. Figure 3 presentsa take-off plots for Levy Flight simulations. Again, we note that no infected agentsexist below either threshold approximations. Furthermore, we find that USS performsbetter than EAAM.
Accuracy of Approximations, Random Waypoint. The next series of simu-lations were conducted using the popular Random Waypoint mobility model. We alsoselected this model specifically because it does not result in a uniform spatial distribu-tion of nodes, therefore does not fall under USS. The results of these simulations arepresented in Figure 4. Surprisingly, both threshold approximations perform well againstthe RWP mobility model. As the earlier mobility models exemplified, USS performsbetter than EAAM.
Insensitivity to Velocity. In order to illustrate Corollary 1 and validate Conjec-ture 1, we performed a series of simulation in which we varied the node velocity, theresults of which are illustrated in Figures 2, 3, 4.

1 to 5 m/s5 to 10 m/s10 to 15 m/s15 to 20 m/s
PredictedTake-off Point
avg
Predicted Take-off Point
(A) EAAM (B) USS
Fig. 3. Accuracy of Framework Approximations, Levy Flight Take-off plots for EAAMand USS. Again our predictions (black arrows) prove accurate.
As expected, for both the RW and Levy Flight mobility models, the take-off pointswere not greatly affected by increasing the nodes velocity. Furthermore, Figure 4 showsthat the take-off point for the RWP mobility model was not affected by velocity, af-firming Conjecture 1.
5 Discussion
We elaborate here on the effect of node velocity on the dynamics of epidemic spreading.We also introduce the periodic mobility model and present an analysis of it via ourframework. In addition, we touch upon other epidemic models as well.
5.1 More on impact of node velocity
As discussed previously in Section 3, node velocity does not seem to effect the thresholdin many models. We now ask whether the velocity affects the epidemic at all?
For an “above threshold” system, two more parameters are of interest: (a) steady-state maximum, and (b) warm-up period. The steady-state maximum is the maximumnumber of infected agents in the system till steady state, whereas the warm-up periodis the time necessary to reach steady state. We expect that the velocity of motion doeshave an effect, when we are above threshold. Clearly, speed will effect the speed ofpropagation of the virus and thus the warm-up period. Higher velocity means bettermixing of agents, and thus faster convergence to the steady state. This observation isalso demonstrated through simulations.
Figure 5 (best viewed in color) shows the number of infected agents per unit time(in seconds) for both the Random Walk and Random Waypoint mobility models. Thevelocity varied between a fixed 1 m/s fixed and an uniform selected 15 − 20 m/s, asindicated in the legends. We performed a longer simulation in order for the systems tosettle in a steady state.
Less intuitive is that velocity appears to affect the number of infected agents atsteady-state. For example, in Figure 5(A), the line corresponding to 1 m/s appears to

avg
Predicted Take-off
Point
Predicted Take-off Point
(A) EAAM (B) USS
Fig. 4. Accuracy of Framework Approximations. Random Waypoint Take-off plots forEAAM and USS.
reach a steady-state of approximately 65 − 70% infected agents, whereas, at 15 − 20m/s, the steady-state is roughly 90%. The steady-state for velocities between these twoextremes lay in-between. We suspect the degree of mixing, influenced by node velocity,is the root cause of the above observation.
5.2 The Periodic Mobility Model
As we indicated in Section 3, our framework predicts the epidemic threshold of mo-bility models that can be represented as a series of adjacency matrices. The PeriodicMobility Model is a special case of such a series, where a set of k adjacency matrices{A1,A2, · · · ,Ak} are repeated periodically.
This is a typical model used in biological virus studies [4] to model general move-ments of a population. As an example, let A1 be an adjacency matrix of people dur-ing the day (say, at the office). Let A2 be an adjacency matrix representing con-tacts/interactions during the evening (say, at home). So the series formed by repeating{A1,A2} represents the daily, repeated interactions of our population. The periodicmodel offers a realistic, yet general model of mobility, capturing general patterns ratherthan specific movements of the system.
Lemma 4 (Periodic Model Threshold). Under the periodic mobility model with kalternating behaviors repeating periodically, the epidemic threshold is given by τ = λSwhere S =
Qki=1 Si and, as before, Si = (1− δ)I + βAi.
Proof. Omitted for brevity, similar to Theorem 1.
As an example, Figure 6 shows the take-off plot of a periodic mobility models whereN = 500 nodes, k = 2 adjacency matrices. As predicted by Lemma 4, the max numberof infected agents over the simulation period takes off at λS = 1.

10008006004002000
100%
80%
60%
40%
20%
0
15-20 m/s (Uniform)10 - 15 m/s (Uniform)5 - 10 m/s (Uniform)1 - 5 m/s (Uniform)3 m/s (Fixed)1 m/s (Fixed)
Perc
ent o
f Inf
ecte
d Ag
ents
Time (s)
100%
80%
60%
40%
20%V = 15-20 m/sV = 10-15 m/sV = 5-10 m/sV = 1-5m/s
Perc
ent o
f Inf
ecte
d Ag
ents
Time (s)
(A) RW, 1000s (B) RWP, 100s
Fig. 5. Number of Infected Agents vs. Time on the Random Walk and Random Way-point. Node velocities were varied as indicated in the legends. Steady-State numberof infected agents increases with node velocity, while warm-up period shrinks (bestviewed in color).
5.3 Other Epidemic Models
Given recent results on epidemic thresholds on static networks [25], we believe that ourresults will carry through for many other epidemic models as well e.g. SIR (mumps-like), SIRS, SEIR, MSEIR etc [13] which capture differences between the way variousdiseases spread.
Conjecture 2 (Other Epidemic models). Our results for all the mobility models dis-cussed in this paper hold for all the epidemic models covered in [25] as well.
6 Related Work
Here, we review the related work. We begin by discussing general epidemic models,followed by epidemic spread on static networks. Next, we review epidemic spread indynamic networks. Finally, we comment on works related to the mobility models de-scribed above. It is worth pointing out that while most of existing studies about epi-demic spread on mobile networks focus on (1) some particular types of network struc-tures, and/or (2) one specific mobility model; our framework is very general and itapplies to arbitrary network structure, and all the three popular mobility model.
General Epidemic Modeling. Bailey provides the canonical text on epidemicmodeling [2]. A more recent survey is provided by Hethcote in [14]. Kephart andWhite [16, 17] were among the first to propose epidemiology-based models to analyzethe spread of computer viruses. The model they suggest provides a good approxima-tion of virus propagation in networks where contact among individuals is essentiallyhomogeneous. Recent discoveries suggest real networks (including social networks [9],router and AS networks [10], and Gnutella overlay graphs [29]) follow a power-lawstructure instead, prompting a re-evaluation of the homogeneity assumption commonin the works above.

Predicted Take-off
Point
Fig. 6. Take-off Plot for System Matrix Eigenvalue of a Periodic Mobility Model. A1
and A2 had N = 500 nodes spread uniformly across a 200×200 simulation field. Noticethe accurate our prediction (black arrow).
Epidemics on Static Networks. Observation suggests that real networks are nothomogeneous, rather, overwhelming evidence suggests real networks follow a power lawstructure instead. By introducing an underlying structure for a disease to spread, suchas a static network, removes the original homogeneous assumption pioneered by thosereference above. Newman [22] studied the epidemic thresholds for multiple competingviruses on special, random graphs. Pastor-Satorras and Vespignani studied viral prop-agation for such power-law networks [21, 23, 24]. They developed an analytic model forthe Barabasi-Albert (BA) power-law topology [3]. However, their derivation dependson some assumptions which does not hold for many real networks [18, 10]. Pastor-Satorras et al. [24] also proposed an epidemic threshold condition, but this uses the“mean-field” approach, where all graphs with a given degree distribution are consid-ered equal. There is no particular reason why all such graphs should behave similarlyin terms of viral propagation. Chakrabarti et. al. [7] observe that epidemic thresholdof an arbitrary graph can be captured in a single parameter, the first eigenvalue of theadjacency matrix λ1,A. Their observation was rigorously confirmed in [8] and indepen-dently by [31]. We again leverage the above observations to formulate our solution inSection 3
Epidemics on Mobile Networks. Prompted by the emergence of mobile devices,such as Bluetooth-equipped smartphones, researchers introduced mobility to epidemicspread. Mickens et. al. were among the first to examine device-to-device spreading ofmalicious software in mobile ad hoc networks [20][19]. In their work, they present aqueue-based technique for the RWP model to overcome the limitations of the earlierhomogeneous models of Kephart and White. In a similar work, Yan et. al. extend theobservations of Mickens et. al. by examining additional mobility models and their effecton epidemic spreading of a SIS virus [32]. Their work is unique in that it models viruspropagation, in detail, a Cabir-like bluetooth worm, including the Bluetooth stack andunique worm properties.
Mobility Models. The mobility models used in Section 4 are fairly common,with significant literature devoted to the subject. For an overview on mobility models,we refer our readers to the following surveys [6]. The RWP mobility model has been

extensively used, despite well know flaws. For a discussion of the merits of RWP, refer to[33]. The Levy mobility model was first described in [30], yet has been used extensivelyto model human and animal movements [28, 27].
7 Conclusions
To conclude, recent malware in the wild, using device-to-device virus propagationschemes, prompted our study of the epidemic threshold in mobile ad hoc networks.Our contributions in this paper are:
1. Framework: We present a framework for the determining the epidemic threshold(for the SIS model) on any mobility model which can be converted into a series ofadjacency matrices and give a formula for it (Theorem 1).
2. Closed Formulas: We also give a closed-form approximation for the SIS epidemicthreshold on general mobility models (Lemma 1).
3. Insensitivity to Velocity: We analyze the impact of velocity in popular mobilitymodels like Random walk, Levy Flight, Random waypoint etc. and find that itunexpectedly does not affect the threshold (Lemmas 2, 3 and Conjecture 1).
In addition, we introduced the “periodic mobility model,” popular in other fields likeepidemiology [1, 4], to the networking community and solved it using our framework(Lemma 4). Finally we presented extensive simulations to demonstrate our analysisand results.
Future work may concentrate on providing theoretical analysis on the effect ofvelocities on the steady state behavior of an epidemic on various mobility models.
References
1. Anderson, R.M., May, R.M.: Infectious Diseases of Humans. Oxford UniversityPress (1991)
2. Bailey, N.: The Mathematical Theory of Infectious Diseases and its Applications.Griffin, London (1975)
3. Barabasi, A.L., Albert, R.: Emergence of scaling in random networks. Science 286,509–512 (15 October 1999)
4. Barrett, C.L., Bisset, K.R., Eubank, S.G., Feng, X., Marathe, M.V.: Episimdemics:an efficient algorithm for simulating the spread of infectious disease over largerealistic social networks. ACM/IEEE Conf. on Supercomputing (2008)
5. Bettstetter, C., Resta, G., Santi, P.: The node distribution of the random waypointmobility model for wireless ad hoc networks. IEEE Trans. on Mobile Computing2(3) (2003)
6. Camp, T., Boleng, J., , Davies, V.: A Survey of Mobility Models for Ad HocNetwork Research. In: Wireless Communication and Mobile Computing SpecialIssue on Mobile Ad Hoc Networking: Research, Trends and Applications. pp. 483–502 (2002)
7. Chakrabarti, D., Wang, Y., Wang, C., Leskovec, J., Faloutsos, C.: Epidemic thresh-olds in real networks. ACM TISSEC 10(4) (2008)
8. Chakrabarti, D., Leskovec, J., Faloutsos, C., Madden, S., Guestrin, C., Faloutsos,M.: Information Survival Threshold in Sensor and P2P Networks. In: Proceedingsof 26th Annual IEEE ICC (2007)
9. Domingos, P., Richardson, M.: Mining the network value of customers. In: KDD.pp. 57–66 (2001)
10. Faloutsos, M., Faloutsos, P., Faloutsos, C.: On power-law relationships of the in-ternet topology. SIGCOMM pp. 251–262 (Aug-Sept 1999)
11. Ganesh, A., Massoulie, L., Towsley, D.: The effect of network topology in spreadof epidemics. IEEE INFOCOM (2005)
12. Gonsalves, A.: Android Phones Steal Market Share. Information Week(04 2010), http://www.informationweek.com/news/mobility/smart_phones/
showArticle.jhtml?articleID=224201881
13. Hethcote, H.W.: The mathematics of infectious diseases. SIAM Review 42 (2000)14. Hethcote, H.W.: The mathematics of infectious diseases. SIAM Rev. 42(4), 599–653
(2000)15. Johnson, D.B., Maltz, D.A.: Dynamic Source Routing in Ad Hoc Wireless Net-
works. In: Mobile Computing (1996)16. Kephart, J.O., White, S.R.: Directed-graph epidemiological models of computer
viruses. In: Proceedings of the 1991 IEEE Computer Society Symposium on Re-search in Security and Privacy. pp. 343–359 (May 1991)
17. Kephart, J.O., White, S.R.: Measuring and modeling computer virus prevalence.In: Proceedings of the 1993 IEEE Computer Society Symposium on Research inSecurity and Privacy. pp. 2–15 (May 1993)
18. Kumar, S.R., Raghavan, P., Rajagopalan, S., Tomkins, A.: Trawling the web foremerging cyber-communities. Computer Networks 31(11-16), 1481–1493 (1999)
19. Mickens, J.W., Noble, B.D.: Modeling Epidemic Spreading in Mobile Environ-ments. In: WiSe ’05: Proceedings of the 4th ACM workshop on Wireless security.pp. 77–86. ACM, New York, NY, USA (2005)
20. Mickens, J.W., Noble, B.D.: Analytical models for epidemics in mobile networks.Wireless and Mobile Computing, Networking and Communication, IEEE Interna-tional Conference on 0, 77 (2007)
21. Moreno, Y., Pastor-Satorras, R., Vespignani, A.: Epidemic outbreaks in complexheterogeneous networks. The European Physical Journal B 26, 521–529 (4 February2002)
22. Newman, M.E.J.: Threshold effects for two pathogens spreading on a network.Phys. Rev. Lett (2005)
23. Pastor-Satorras, R., Vespignani, A.: Epidemic dynamics and endemic states incomplex networks. Physical Review E 63, 066117 (2001)
24. Pastor-Satorras, R., Vespignani, A.: Epidemic dynamics in finite size scale-freenetworks. Physical Review E 65, 035108 (2002)
25. Prakash, B.A., Chakrabarti, D., Faloutsos, M., Valler, N., Faloutsos, C.: Got theflu (or mumps)? check the eigenvalue! arXiv:1004.0060v1 [physics.soc-ph] (2010)
26. Prakash, B.A., Tong, H., Valler, N., Faloutsos, M., Faloutsos, C.: Virus propagationon time-varying networks: Theory and immunization algorithms. ECML/PKDD,Barcelona (2010)
27. Rhee, I., Shin, M., Hong, S., Lee, K., Chong, S.: Human mobility patterns andtheir impact on delay tolerant networks. In: ACM HotNets IV (2007)
28. Rhee, I., Shin, M., Hong, S., Lee, K., Chong, S.: On the levy-walk nature of humanmobility. In: INFOCOM. pp. 924–932. IEEE (2008), http://dblp.uni-trier.de/db/conf/infocom/infocom2008.html#RheeSHLC08
29. Ripeanu, M., Foster, I., Iamnitchi, A.: Mapping the gnutella network: Properties oflarge-scale peer-to-peer systems and implications for system design. IEEE InternetComputing Journal 6(1) (2002)

30. Shlesinger, M.F., Klafter, J., Wong, Y.M.: Random walks with infinite spatial andtemporal moments. In: J. Stat. Phys. vol. 27, pp. 499– 512 (1982)
31. Van Mieghem, P., Omic, J., Kooij, R.: Virus spread in networks. IEEE/ACM Trans.Netw. 17(1), 1–14 (2009)
32. Yan, G., Flores, H.D., Cuellar, L., Hengartner, N., Eidenbenz, S., Vu, V.: BluetoothWorm Propagation: Mobility Pattern Matters! In: ASIACCS ’07: Proceedings ofthe 2nd ACM symposium on Information, computer and communications security.pp. 32–44. ACM, New York, NY, USA (2007)
33. Yoon, J., Liu, M., Noble, B.: Random waypoint considered harmful. In: INFO-COM 2003. Twenty-Second Annual Joint Conference of the IEEE Computer andCommunications. IEEE Societies. vol. 2, pp. 1312 – 1321 vol.2 (30 2003)