Epic research special report of 14 dec 2015
8
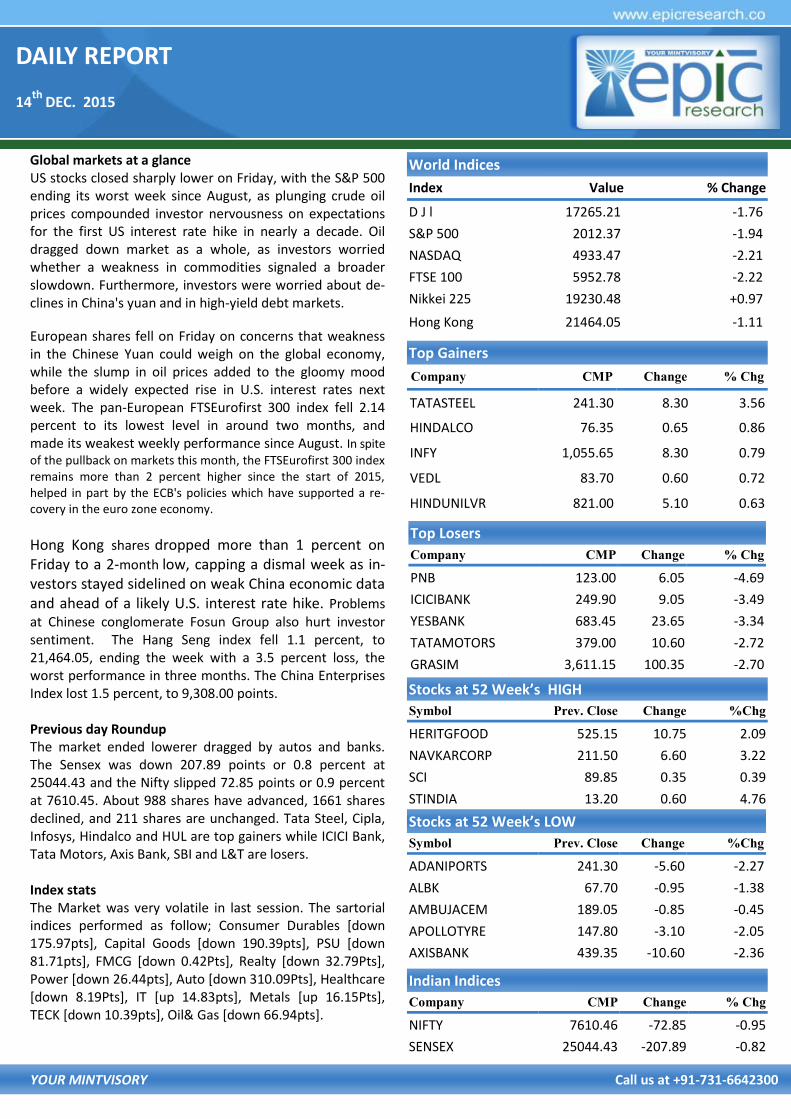
DAILY REPORT 14 th DEC. 2015 YOUR MINTVISORY Call us at +91-731-6642300 Global markets at a glance US stocks closed sharply lower on Friday, with the S&P 500 ending its worst week since August, as plunging crude oil prices compounded investor nervousness on expectations for the first US interest rate hike in nearly a decade. Oil dragged down market as a whole, as investors worried whether a weakness in commodities signaled a broader slowdown. Furthermore, investors were worried about de- clines in China's yuan and in high-yield debt markets. European shares fell on Friday on concerns that weakness in the Chinese Yuan could weigh on the global economy, while the slump in oil prices added to the gloomy mood before a widely expected rise in U.S. interest rates next week. The pan-European FTSEurofirst 300 index fell 2.14 percent to its lowest level in around two months, and made its weakest weekly performance since August. In spite of the pullback on markets this month, the FTSEurofirst 300 index remains more than 2 percent higher since the start of 2015, helped in part by the ECB's policies which have supported a re- covery in the euro zone economy. Hong Kong shares dropped more than 1 percent on Friday to a 2-month low, capping a dismal week as in- vestors stayed sidelined on weak China economic data and ahead of a likely U.S. interest rate hike. Problems at Chinese conglomerate Fosun Group also hurt investor sentiment. The Hang Seng index fell 1.1 percent, to 21,464.05, ending the week with a 3.5 percent loss, the worst performance in three months. The China Enterprises Index lost 1.5 percent, to 9,308.00 points. Previous day Roundup The market ended lowerer dragged by autos and banks. The Sensex was down 207.89 points or 0.8 percent at 25044.43 and the Nifty slipped 72.85 points or 0.9 percent at 7610.45. About 988 shares have advanced, 1661 shares declined, and 211 shares are unchanged. Tata Steel, Cipla, Infosys, Hindalco and HUL are top gainers while ICICI Bank, Tata Motors, Axis Bank, SBI and L&T are losers. Index stats The Market was very volatile in last session. The sartorial indices performed as follow; Consumer Durables [down 175.97pts], Capital Goods [down 190.39pts], PSU [down 81.71pts], FMCG [down 0.42Pts], Realty [down 32.79Pts], Power [down 26.44pts], Auto [down 310.09Pts], Healthcare [down 8.19Pts], IT [up 14.83pts], Metals [up 16.15Pts], TECK [down 10.39pts], Oil& Gas [down 66.94pts]. World Indices Index Value % Change D J l 17265.21 -1.76 S&P 500 2012.37 -1.94 NASDAQ 4933.47 -2.21 FTSE 100 5952.78 -2.22 Nikkei 225 19230.48 +0.97 Hong Kong 21464.05 -1.11 Top Gainers Company CMP Change % Chg TATASTEEL 241.30 8.30 3.56 HINDALCO 76.35 0.65 0.86 INFY 1,055.65 8.30 0.79 VEDL 83.70 0.60 0.72 HINDUNILVR 821.00 5.10 0.63 Top Losers Company CMP Change % Chg PNB 123.00 6.05 -4.69 ICICIBANK 249.90 9.05 -3.49 YESBANK 683.45 23.65 -3.34 TATAMOTORS 379.00 10.60 -2.72 GRASIM 3,611.15 100.35 -2.70 Stocks at 52 Week’s HIGH Symbol Prev. Close Change %Chg HERITGFOOD 525.15 10.75 2.09 NAVKARCORP 211.50 6.60 3.22 SCI 89.85 0.35 0.39 STINDIA 13.20 0.60 4.76 Indian Indices Company CMP Change % Chg NIFTY 7610.46 -72.85 -0.95 SENSEX 25044.43 -207.89 -0.82 Stocks at 52 Week’s LOW Symbol Prev. Close Change %Chg ADANIPORTS 241.30 -5.60 -2.27 ALBK 67.70 -0.95 -1.38 AMBUJACEM 189.05 -0.85 -0.45 APOLLOTYRE 147.80 -3.10 -2.05 AXISBANK 439.35 -10.60 -2.36
-
Upload
epic-research -
Category
Business
-
view
403 -
download
0
Transcript of Epic research special report of 14 dec 2015
DAILY REPORT
14th
DEC. 2015
YOUR MINTVISORY Call us at +91-731-6642300
Global markets at a glance US stocks closed sharply lower on Friday, with the S&P 500 ending its worst week since August, as plunging crude oil prices compounded investor nervousness on expectations for the first US interest rate hike in nearly a decade. Oil dragged down market as a whole, as investors worried whether a weakness in commodities signaled a broader slowdown. Furthermore, investors were worried about de-clines in China's yuan and in high-yield debt markets.
European shares fell on Friday on concerns that weakness in the Chinese Yuan could weigh on the global economy, while the slump in oil prices added to the gloomy mood before a widely expected rise in U.S. interest rates next week. The pan-European FTSEurofirst 300 index fell 2.14 percent to its lowest level in around two months, and made its weakest weekly performance since August. In spite
of the pullback on markets this month, the FTSEurofirst 300 index remains more than 2 percent higher since the start of 2015, helped in part by the ECB's policies which have supported a re-covery in the euro zone economy.
Hong Kong shares dropped more than 1 percent on Friday to a 2-month low, capping a dismal week as in-vestors stayed sidelined on weak China economic data and ahead of a likely U.S. interest rate hike. Problems at Chinese conglomerate Fosun Group also hurt investor sentiment. The Hang Seng index fell 1.1 percent, to 21,464.05, ending the week with a 3.5 percent loss, the worst performance in three months. The China Enterprises Index lost 1.5 percent, to 9,308.00 points. Previous day Roundup The market ended lowerer dragged by autos and banks. The Sensex was down 207.89 points or 0.8 percent at 25044.43 and the Nifty slipped 72.85 points or 0.9 percent at 7610.45. About 988 shares have advanced, 1661 shares declined, and 211 shares are unchanged. Tata Steel, Cipla, Infosys, Hindalco and HUL are top gainers while ICICI Bank, Tata Motors, Axis Bank, SBI and L&T are losers. Index stats The Market was very volatile in last session. The sartorial indices performed as follow; Consumer Durables [down 175.97pts], Capital Goods [down 190.39pts], PSU [down 81.71pts], FMCG [down 0.42Pts], Realty [down 32.79Pts], Power [down 26.44pts], Auto [down 310.09Pts], Healthcare [down 8.19Pts], IT [up 14.83pts], Metals [up 16.15Pts], TECK [down 10.39pts], Oil& Gas [down 66.94pts].
World Indices
Index Value % Change
D J l 17265.21 -1.76
S&P 500 2012.37 -1.94
NASDAQ 4933.47 -2.21
FTSE 100 5952.78 -2.22
Nikkei 225 19230.48 +0.97
Hong Kong 21464.05 -1.11
Top Gainers
Company CMP Change % Chg
TATASTEEL 241.30 8.30 3.56
HINDALCO 76.35 0.65 0.86
INFY 1,055.65 8.30 0.79
VEDL 83.70 0.60 0.72
HINDUNILVR 821.00 5.10 0.63
Top Losers
Company CMP Change % Chg
PNB 123.00 6.05 -4.69
ICICIBANK 249.90 9.05 -3.49
YESBANK 683.45 23.65 -3.34
TATAMOTORS 379.00 10.60 -2.72
GRASIM 3,611.15 100.35 -2.70
Stocks at 52 Week’s HIGH
Symbol Prev. Close Change %Chg
HERITGFOOD 525.15 10.75 2.09
NAVKARCORP 211.50 6.60 3.22
SCI 89.85 0.35 0.39
STINDIA 13.20 0.60 4.76
Indian Indices
Company CMP Change % Chg
NIFTY 7610.46 -72.85 -0.95
SENSEX 25044.43 -207.89 -0.82
Stocks at 52 Week’s LOW
Symbol Prev. Close Change %Chg
ADANIPORTS 241.30 -5.60 -2.27
ALBK 67.70 -0.95 -1.38
AMBUJACEM 189.05 -0.85 -0.45
APOLLOTYRE 147.80 -3.10 -2.05
AXISBANK 439.35 -10.60 -2.36

DAILY REPORT
14th
DEC. 2015
YOUR MINTVISORY Call us at +91-731-6642300
STOCK RECOMMENDATION [CASH] 3. GRPL [CASH]
Last week GPPL made new 52 week low of 145 then at last session of week it got some fresh buying but due to weak-ness in market around 151 it tested some profit booking since on EOD chart it made spinning top candle which is showing profit booking on rise so we advise to sell it below 145 for target of 140 135 use stop loss of 150.25 MACRO NEWS Bouncing back from the four-month lows it touched in
Sept, the index of IIP for Oct stood at 9.8% versus 3.6% SC to hear FSSAI petition against Maggi noodles ban lift Govt imposes 5-57% anti-dumping duty on cold-rolled
steel Texmaco Rail rises 8% on signal & telecom order from
DFCCIL US oil breaks below $36, hits fresh 2009 lows Over 68,000 tonnes of seized pulses offloaded in mkt TCS, ITC biggest wealth creators during 2010-15: Study Govt garners Rs 12,701cr from disinvestment in FY16 so
far India Inc raises Rs 18,259cr from capital mkts; 4-fold
jump Govt seeks Parliament nod to spend additional Rs
56,256cr Chennai floods to have material impact on Q3 revenues:
TCS Credit cost guidance for FY16 to be maintained: Yes Bank Supreme Court refuses Nestle's plea Godrej Appliances eyes 15% growth at Rs 3,200 crore
this fiscal Tata Power's 120 MW Zambia project gets UNFCCC ap-
proval
STOCK RECOMMENDATIONS [FUTURE] 1. RELCAP [FUTURE]
RELCAPITAL Future given confirmation of trend reversal it broken support of 396 on daily chart but again it has support at 386-365 when it will break 365 then we may see sharp fall since it made top at bullish trend so below 365 target will be 310 for that it will be good to sell on rise around 396-397 use stop loss of 401 for target of 392 387 380.
2. PFC [FUTURE]
PFC FUTURE end positive but on rise it got selling pressure and close near opening level for that it create long inverted hammer on EOD chart since before last session it made low of 192 & in last August it given recovery from 185 since the market is weak so we advise to sell it below 192 for target of 190 188 185.
DAILY REPORT
14th
DEC. 2015
YOUR MINTVISORY Call us at +91-731-6642300
FUTURE & OPTION
MOST ACTIVE CALL OPTION
Symbol Op-
tion
Type
Strike
Price
LTP Traded
Volume
(Contracts)
Open
Interest
NIFTY CE 8,000 18.40 3,15,916 75,73,875
NIFTY CE 7,800 98.50 1,95,030 30,62,550
BANKNIFTY CE 17,500 93.50 77,839 7,11,960
ICICIBANK CE 270 4.30 3,443 43,60,500
SBIN CE 250 4.40 3,333 79,62,000
ICICIBANK CE 280 1.50 3,272 55,64,100
LT CE 1,400 8.40 3,206 12,39,300
SBIN CE 260 1.40 3,175 45,48,000
MOST ACTIVE PUT OPTION
Symbol Op-
tion
Type
Strike
Price
LTP Traded
Volume
(Contracts)
Open
Interest
NIFTY PE 7,800 51.40 3,10,182 49,63,950
NIFTY PE 7,700 25.00 2,38,758 68,09,025
BANKNIFTY PE 16,500 41.90 51,563 5,53,860
LT PE 1,350 20.50 1,710 4,44,300
ICICIBANK PE 260 2.20 1,570 20,60,400
TATAMOTOR PE 400 6.00 1,453 13,26,000
TATASTEEL PE 230 3.10 1,438 13,10,000
SBIN PE 240 1.70 1,377 22,52,000
FII DERIVATIVES STATISTICS
BUY OPEN INTEREST AT THE END OF THE DAY SELL
No. of
Contracts Amount in
Crores No. of
Contracts Amount in
Crores No. of
Contracts Amount in
Crores NET AMOUNT
INDEX FUTURES 24251 1291.81 40231 2213.03 269503 14895.04 -921.21
INDEX OPTIONS 316001 17697.52 312383 17534.64 1302697 73571.99 162.88
STOCK FUTURES 59647 2916.48 54707 2693.04 1017003 48702.16 223.43
STOCK OPTIONS 46957 2279.34 48004 2337.71 64972 3090.05 -58.38
TOTAL -593.27
STOCKS IN NEWS
NTPC raises Rs 500cr via private placement of secured NCDs
Essar secures loan from Russia's VTB to delist shrs: Sources
TataComm to sell Neotel stake to Vodafone South Af-rica arm
M&M sets up new aerospace company in Australia Delhi High Court lands a setback for Maruti Suzuki in
transfer pricing case Cairn moves Delhi High Court for early decision on con-
tract renewal
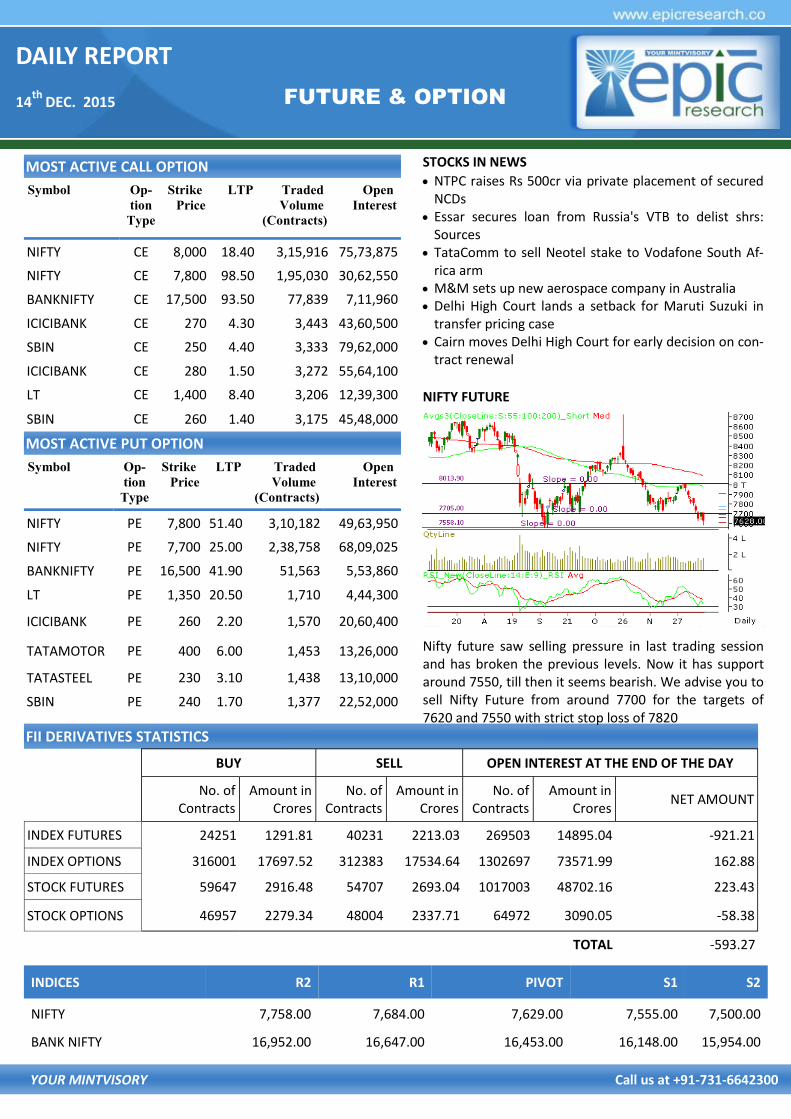
NIFTY FUTURE
Nifty future saw selling pressure in last trading session and has broken the previous levels. Now it has support around 7550, till then it seems bearish. We advise you to sell Nifty Future from around 7700 for the targets of 7620 and 7550 with strict stop loss of 7820
INDICES R2 R1 PIVOT S1 S2
NIFTY 7,758.00 7,684.00 7,629.00 7,555.00 7,500.00
BANK NIFTY 16,952.00 16,647.00 16,453.00 16,148.00 15,954.00

DAILY REPORT
14th
DEC. 2015
YOUR MINTVISORY Call us at +91-731-6642300
RECOMMENDATIONS
GOLD
TRADING STRATEGY:
BUY GOLD FEB ABOVE 25800 TGTS 25880,25970 SL BELOW
25700
SELL GOLD FEB BELOW 25600 TGTS 25520,25430 SL
ABOVE 25700
SILVER
TRADING STRATEGY:
BUY SILVER MAR ABOVE 34300 TGTS 34100,33800 SL BE-
LOW 34000
SELL SILVER MAR BELOW 33700 TGTS 33500,33200 SL
ABOVE 34000
COMMODITY ROUNDUP
Volume of trade in gold and gold hedge contracts on NCDEX
doubled on trader's growing thrust and interest on the ex-
change platform. Total volume of trade was reported at 9.6
tonnes in both gold and gold hedge contracts in Nov from
the level of 4.65 tonnes in October. Considering India's an-
nual gold consumption of 950 tonnes, however, the volume
of trade on NCDEX continued to remain negligible. Total
trading volume in Nov was reported at 5.57 tonnes in Gold
Hedge which shows a spurt of 212% over October 2015. In
Gold, the total trading volume showed a monthly jump of
41 per cent to 4.04 tonnes. The average daily OI on Gold
Hedge surged to 0.56 tonnes, up by 391%, over Oct 2015.
The average daily OI on Gold also continued to grow to 0.37
tonnes, an increase of 122% over the previous month.
Crude oil prices hit fresh 7-year lows on Friday as the IEA
warned global oversupply could worsen in the new year.
Brent slipped below $39 per barrel for first time since Dec
2008 as IEA, which advises developed nations on energy,
warned that demand growth was starting to slow. Brent
crude futures were down 60 cents at $39.13 a barrel at
1058 GMT, bouncing slightly from a session low of $38.90.
WTI U.S. crude futures were at $36.26 per barrel, down 50
cents after touching $36.12, their lowest since Feb 2009.
United States iron and Steel Institute (AISI) announced in
October 2015, U. S. Steel Mills shipped about 7,369,472 net
tons of cargos, an increase of 3.5% MoM to 7,120mn net
tons, down by 13.4% year on year to 8.508 million net tons.
Among them, US's shipment of hot-rolled sheet increases of
8% month on month, those for cold rolled sheet increases
of 2% month on month, for hot-dip galvanized steel sheet
and strip increase of 1% month on month.
Taking weak cues from overseas markets, silver pricesfell by
Rs 114 to Rs 34,518 per kg in futures trade, as participants
trimmed positions. In futures trading at the MCX silver for
delivery in far-month May next year shed Rs 114 or 0.33%
to Rs 34,518 per kg in a business turnover of 7 lots. Simi-
larly, the white metal for delivery in March declined by Rs
100 or 0.29% to Rs 34,115 per kg in a business volume of
297 lots. In the international market, silver fell 0.35% to
$14.05 an ounce in Singapore. Marketmen attributed the
fall in silver prices at futures trade was largely in line with a
weak trend in precious metals in global markets.

DAILY REPORT
14th
DEC. 2015
YOUR MINTVISORY Call us at +91-731-6642300
NCDEX
NCDEX ROUNDUP Supported by a strong demand from bulk consumers amid tight supplies, sugar prices strengthened by a whopping Rs 110 per quintal at the wholesale market in the national capital today. The steep rise in sugar prices was attributed to an increased offtake by bulk consumers as well as retail-ers against a halt in supplies form millers. In addition, ex-port demand too supported the upsurge in the sweetener prices as the Centre announced a compulsory export of at-least 4 million tonnes in the current crushing season to re-duced stockpiles. Sugar ready M-30 and S-30 prices climbed Rs 100 each to end at Rs 3,050-3,260 and Rs 3,040-3,250 per quintal. Mill delivery M-30 and S-30 prices too jumped up by same margins of Rs 100 each to Rs 2,820-3,070 and Rs 2,810-3,060 per quintal. Cardamom prices tumbled 2.75% to Rs 634.10 per kg in fu-tures trading as speculators cut down their bets, tracking a weak trend at spot market on muted demand. Further ade-quate stocks position on higher supplies from producing region fulled the downtrend. At the MCX cardamom for de-livery in Dec month dropped by Rs 17.90, or 2.75% to Rs 634.10 per kg in business turnover of 1 lot. Similarly, the spice for delivery in far-month Jan 2016 contracts moved down by Rs 3.60, or 0.49% to Rs 732.50 per kg in 97 lots. Apart from a weak trend at spot market on easing domestic as well as exports demand, sufficient stocks on higher sup-plies from producing belts kept pressure on cardamom prices at futures trade. Chana prices were down by 0.47% to Rs 5,050 per quintal in futures trade as traders reduced their positions amid ade-quate stocks in the spot markets on higher supplies. At the NCDEX chana for delivery in Dec month fell Rs 24, or 0.47% to Rs 5,050 per quintal with an OI of 35,200 lots.
NCDEX INDICES
Index Value % Change
CAETOR SEED 3778 +1.26
CHANA 5055 -0.37
CORIANDER 10750 +1.30
COTTON SEED 1785 +0.06
GUAR SEED 3143 -1.60
JEERA 15150 -0.13
MUSTARDSEED 4305 -1.67
REF. SOY OIL 634.2 +1.00
SUGAR M GRADE 2884 +0.73
TURMERIC 9400 +2.53
RECOMMENDATIONS
DHANIYA
BUY CORIANDER JAN ABOVE 10080 TARGET 10125 10275
SL BELOW 10015
SELL CORIANDER JAN BELOW 9920 TARGET 9875 9725 SL
ABOVE 9985
GUARSGUM
BUY GUARGUM JAN ABOVE 6050 TARGET 6100 6170 SL BE-
LOW 5990
SELL GUARGUM JAN BELOW 5890 TARGET 5840 5770 SL
ABOVE 5950

DAILY REPORT
14th
DEC. 2015
YOUR MINTVISORY Call us at +91-731-6642300
RBI Reference Rate
Currency Rate Currency Rate
Rupee- $ 66.7860 Yen-100 54.7500
Euro 73.1040 GBP 101.1006
CURRENCY
USD/INR
BUY USD/INR DEC ABOVE 67.05 TARGET 67.18 67.33 SL BE-
LOW 66.85
SELL USD/INR DEC BELOW 66.95 TARGET 66.82 66.67 SL
ABOVE 67.15
EUR/INR
BUY EUR/INR DEC ABOVE 73.65 TARGET 73.8 74 SL BELOW
73.45
SELL EUR/INR DEC BELOW 73.3 TARGET 73.15 72.95 SL
ABOVE 73.5
CURRENCY MARKET UPDATES: The Indian rupee has opened lower by 8 paise at 66.79 per dollar on Friday versus 66.71 Thursday. Rupee pared initial losses, but still quoted down by 5 paise to 66.76 against the greenback in late morning deals on continued bouts of dollar demand from banks and importers amid lower equi-ties. The rupee resumed lower by 66.80 per dollar from yesterday's closing level of 66.71 at the Interbank Forex Market. Later, it moved between 66.82 and 66.74 on the back of bouts of demand and supply before quoting at 66.76 at 1035 hrs. Overseas, the US dollar steadied against the basket currencies in early Asian trade, given some breathing space after a recent surge by the euro lost mo-mentum in wake of dovish comments by a policymaker. The United Nations (UN) has trimmed its forecast for global economic growth in 2015 by 0.4% point to 2.4%, largely due to lower commodity prices, increased market volatility and slow growth in emerging market economies. However, the world economy is projected to grow by 2.9% in 2016 and 3.2% in 2017, supported by generally less re-strictive fiscal and still accommodative monetary policy stances worldwide, the UN noted. The dollar was little changed against the other major cur-rencies on Friday, as investors awaited the release of U.S. data later in the day amid growing speculation the Fed will raise interest rates next week. USD/JPY added 0.17% to 121.78. Demand for the dollar continued to be under-pinned by expectations that the Fed is on track to raise interest rates for the first time since 2006 at its upcoming meeting on Dec 15-16. Higher interest rates would make the dollar more attractive to yield-seeking investors. Mar-ket participants were eyeing upcoming U.S. reports on re-tail sales, producer prices and consumer sentiment due later in the day, for further indications on the strength. The euro remained mildly supported after the latest round of easing announced by the ECB fell well short of market expectations. Dollar edged higher against the pound and the Swiss franc, with GBP/USD down 0.12% at 1.5141 and with USD/CHF rising 0.17% to 0.9893. Australian and New Zealand dollars were weaker, with AUD/USD down 0.77% at 0.7224 and with NZD/USD shedding 0.26% to 0.6740.

DAILY REPORT
14th
DEC. 2015
YOUR MINTVISORY Call us at +91-731-6642300
Date Commodity/ Currency
Pairs Contract Strategy Entry Level Target Stop Loss Remark
11/12/15 NCDEX DHANIYA JAN. BUY 10420 10465-10615 10355 NOT EXECUTED
11/12/15 NCDEX DHANIYA JAN. SELL 10280 10235-10085 10345 BOOKED FULL PROFIT
11/12/15 NCDEX GUARGUM JAN. BUY 6250 6300-6370 6190 NOT EXECUTED
11/12/15 NCDEX GUARGUM JAN. SELL 6060 6010-5940 6120 BOOKED FULL PROFIT
11/12/15 MCX GOLD FEB. BUY 25600 25680-25770 25500 BOOKED PROFIT
11/12/15 MCX GOLD FEB. SELL 25400 25320-2530 25500 NOT EXECUTED
11/12/15 MCX SILVER MAR. BUY 34600 34800-35100 34100 BOOKED PROFIT
11/12/15 MCX SILVER MAR. SELL 34300 34100-33800 34600 NOT EXECUTED
11/12/15 USD/INR DEC. BUY 67.05 67.18-67.33 66.85 NO PROFIT NO LOSS
11/12/15 USD/INR DEC. SELL 66.90 66.77-66.62 67.10 NOT EXECUTED
11/12/15 EUR/INR DEC. BUY 73.43 73.58-73.78 73.23 SL TRIGGERED
11/12/15 EUR/INR DEC. SELL 73.20 73.05-72.85 73.40 SL TRIGGERED
Date Scrip
CASH/
FUTURE/
OPTION
Strategy Entry Level Target Stop Loss Remark
11/12/15 NIFTY FUTURE BUY 7730 7830-7950 7750 NOT EXECUTED
11/12/15 JUST DIAL FUTURE BUY 875 885-900 860 SL TRIGGERED
11/12/15 UNION BANK FUTURE SELL 148 146-143 150.10 BOOKED PROFIT
11/12/15 NCLIND CASH BUY 169 172-175 166 BOOKED FULL PROFIT
10/12/15 MPHASIS CASH BUY 483 495-510 469 SL TRIGGERED
10/12/15 NIFTY FUTURE SELL 7700-7680 7600-7500 7800 BOOKED PROFIT

DAILY REPORT
14th
DEC. 2015
YOUR MINTVISORY Call us at +91-731-6642300
NEXT WEEK'S U.S. ECONOMIC REPORTS
ECONOMIC CALENDAR
The information and views in this report, our website & all the service we provide are believed to be reliable, but we do not accept any
responsibility (or liability) for errors of fact or opinion. Users have the right to choose the product/s that suits them the most. Sincere ef-
forts have been made to present the right investment perspective. The information contained herein is based on analysis and up on sources
that we consider reliable. This material is for personal information and based upon it & takes no responsibility. The information given
herein should be treated as only factor, while making investment decision. The report does not provide individually tailor-made invest-
ment advice. Epic research recommends that investors independently evaluate particular investments and strategies, and encourages in-
vestors to seek the advice of a financial adviser. Epic research shall not be responsible for any transaction conducted based on the infor-
mation given in this report, which is in violation of rules and regulations of NSE and BSE. The share price projections shown are not nec-
essarily indicative of future price performance. The information herein, together with all estimates and forecasts, can change without no-
tice. Analyst or any person related to epic research might be holding positions in the stocks recommended. It is understood that anyone
who is browsing through the site has done so at his free will and does not read any views expressed as a recommendation for which either
the site or its owners or anyone can be held responsible for . Any surfing and reading of the information is the acceptance of this dis-
claimer. All Rights Reserved. Investment in equity & bullion market has its own risks. We, however, do not vouch for the accuracy or the
completeness thereof. We are not responsible for any loss incurred whatsoever for any financial profits or loss which may arise from the
recommendations above epic research does not purport to be an invitation or an offer to buy or sell any financial instrument. Our Clients
(Paid or Unpaid), any third party or anyone else have no rights to forward or share our calls or SMS or Report or Any Information Pro-
vided by us to/with anyone which is received directly or indirectly by them. If found so then Serious Legal Actions can be taken.
Disclaimer
TIME REPORT PERIOD ACTUAL CONSENSUS
FORECAST PREVIOUS
MONDAY, DEC. 14
NONE SCHEDULED
TUESDAY, DEC. 15
8:30 AM CONSUMER PRICE INDEX NOV. 0.0% 0.2%
8:30 AM CORE CPI NOV. 0.2% 0.2%
8:30 AM EMPIRE STATE INDEX DEC. -- -10.7
10 AM HOME BUILDERS' INDEX DEC. -- 62
WEDNESDAY, DEC. 16
8:30 AM HOUSING STARTS NOV. 1.13 MLN 1.06 MLN
9:15 AM INDUSTRIAL PRODUCTION NOV. -0.3% -0.2%
9:15 AM CAPACITY UTILIZATION NOV. 77.2% 77.5%
2 PM FOMC STATEMENT
2:30 PM JANET YELLEN PRESS CONFERENCE
THURSDAY, DEC. 17
8:30 AM WEEKLY JOBLESS CLAIMS DEC. 12 N/A N/A
8:30 AM PHILLY FED DEC. -- 1.9
8:30 AM CURRENT ACCOUNT Q3 -- -$110 BLN
10 AM LEADING INDICATORS NOV. -- 0.6%
FRIDAY, DEC. 18
NONE SCHEDULED