
EPA’s Oversight of the Vehicle Inspection and … · October 5, 2006 MEMORANDUM SUBJECT: EPA’s...
78
OFFICE OF INSPECTOR GENERAL Catalyst for Improving the Environment Evaluation Report EPA’s Oversight of the Vehicle Inspection and Maintenance Program Needs Improvement Report No. 2007-P-00001 October 5, 2006
Transcript of EPA’s Oversight of the Vehicle Inspection and … · October 5, 2006 MEMORANDUM SUBJECT: EPA’s...

OFFICE OF INSPECTOR GENERAL
Catalyst for Improving the Environment
Evaluation Report
EPA’s Oversight of the Vehicle Inspection and Maintenance
Program Needs Improvement Report No. 2007-P-00001
October 5, 2006

Report Contributors: Rick Beusse John Bishop Michelle Brown David Cofer Dan Howard Tiffine Johnson-Davis Patrick Milligan Bill Nelson
Abbreviations:
CAA Clean Air Act CO carbon monoxide EPA U.S. Environmental Protection Agency FACA Federal Advisory Committee Act FTE Full-Time Equivalent HC hydrocarbons I/M Inspection and Maintenance MDE Maryland Department of the Environment NOx nitrogen oxides OBD On-Board Diagnostics OIG Office of Inspector General OTAQ Office of Transportation and Air Quality OTR Ozone Transport Region ppm parts per million SIPs State Implementation Plans STAPPA/ALAPCO State and Territorial Air Pollution Program Administrators/
Association of Local Air Pollution Control Officials VA DEQ Virginia Department of Environmental Quality VINs Vehicle Identification Numbers
Cover photo: Emissions from cars and trucks cause significant air pollution (photos courtesy EPA).

U.S. Environmental Protection Agency 2007-P-00001Office of Inspector General October 5, 2006
At a GlanceCatalyst for Improving the Environment
Why We Did This Review
We conducted this review to determine whether selected Inspection and Maintenance(I/M) programs have beeneffective in identifying poorly performing vehicles, ensuring they are adequately repaired, and achieving emissions reductions. We also assessed whether EPA oversight hasensured that I/M programs are achieving program goals in a timely manner.
Background
About 237 million vehicles were registered in the United States in 2004. On-road mobile source emissions account for from 29 to 51 percent of three key pollutants in our nation's air, and even more in major urban areas. In the 1990 Clean Air Act Amendments, Congress outlined a four-point strategy to reduce emissions from mobile sources, including the vehicle I/M program. If not properly maintained, even newer vehicles will not perform as designed, causing them to work harder, wear out faster, and pollute more.
For further information, contact our Office of Congressional and Public Liaison at (202) 566-2391.
To view the full report, click on the following link: www.epa.gov/oig/reports/2007/ 20061005-2007-P-00001.pdf
EPA’s Oversight of the Vehicle Inspection and Maintenance Program Needs Improvement What We Found
Properly implemented, I/M programs ensure that poorly performing vehicles are identified and timely repaired. These programs represent a key component of the pollution control strategies for major urban areas. Although States in Region 3, where we focused our review, have achieved substantial emissions reductions from vehicles, EPA has not ensured that States have fully met their I/M program commitments. Four of 5 I/M programs in Region 3 reported substantial percentages of vehicles with no known final outcome, ranging from 12 to 22 percent of vehicles that failed their I/M inspection. The fifth program did not report this measure to EPA and, since September 2005, has used a less stringent testing procedure than required. Our in-depth work in one State showed that 12 percent of failing vehicles were not resolved after a year, and that 5 percent were still not resolved after 21 months. Because State I/M programs generally do not have access to each others’ databases, they have been unable to verify the outcome of many vehicles that failed their I/M tests.
Our nationwide survey of all 10 EPA regions covering 34 I/M programs, as well as our detailed work in Region 3, indicate that EPA has not been obtaining sufficient information to ensure that States are meeting their I/M program commitments. In the last 5 years (1999-2004), 11 of the 34 I/M programs submitted timely reports, 14 programs had either never submitted the required reports or the regions were unsure whether the reports were submitted, and 4 programs submitted reports but they were not timely (typically 1-2 years late in the Region we examined). The remaining five programs had mixed results (some reports from these programs were submitted timely but some reports were not received). Also, EPA regions only audited/evaluated 9 of the 34 I/M programs, and EPA reduced resources for overseeing and assisting I/M programs. As a result, EPA does not have reasonable assurance that emission reductions claimed by some I/M programs have been achieved.
What We Recommend
We recommend that EPA obtain and evaluate all required I/M reports to ensure that the programs are operating effectively, and follow up with States on significant issues identified. We also recommend that EPA provide more technical assistance and guidance to States, and work with State I/M programs to follow up on vehicles with no known final outcome to a degree proportional to the problem. EPA generally concurred with our recommendations.

October 5, 2006 MEMORANDUM SUBJECT: EPA’s Oversight of the Vehicle Inspection and Maintenance Program Needs Improvement Report No. 2007-P-00001 TO: William L. Wehrum Acting Assistant Administrator for Air and Radiation This is our report on the subject evaluation conducted by the Office of Inspector General (OIG) of the U.S. Environmental Protection Agency (EPA). This report contains findings that describe the problems the OIG has identified and corrective actions the OIG recommends. This report represents the opinion of the OIG and does not necessarily represent the final EPA position. Final determinations on matters in this report will be made by EPA managers in accordance with established resolution procedures. The estimated cost of this report – calculated by multiplying the project’s staff days by the applicable daily full cost billing rates in effect at the time – is $962,231.1 Action Required In accordance with EPA Manual 2750, you are required to provide a written response to this report within 90 calendar days. You should include a corrective action plan for agreed upon actions, including milestone dates. We have no objections to the further release of this report to the public. This report will be available at http://www.epa.gov/oig. If you or your staff have any questions regarding this report, please contact me at (202) 566-0847 or [email protected]; or Rick Beusse, Director for Program Evaluation, Air Issues, at (919) 541-5747 or [email protected].
Sincerely,
Acting Inspector General
1 The cost of this report was updated on November 29, 2006.
UNITED STATES ENVIRONMENTAL PROTECTION AGENCY WASHINGTON, D.C. 20460
OFFICE OF INSPECTOR GENERAL
Bill A. Roderick

EPA’s Oversight of the Vehicle Inspection and Maintenance Program Needs Improvement
Table of Contents
Chapters
1 Introduction ........................................................................................................... 1
Purpose .......................................................................................................... 1 Background .................................................................................................... 1 Scope and Methodology................................................................................. 7
2 Some I/M Programs Need to Better Identify and Ensure Repair of Vehicles with Excess Emissions ........................................... 9
Less Stringent Emission Tests Used in One I/M Program ............................. 9 Improvements Needed to Ensure Failed Vehicles Repaired Effectively ........ 10 Data Ensuring Effectiveness of Selected State I/M Programs Lacking .......... 21Significant Issues Identified in District of Columbia Annual Report ................ 22 Challenges in Determining Final Outcome of Failing Vehicles....................... 23 States Have Made Efforts to Increase Effectiveness of Repairs .................... 25 Conclusions.................................................................................................... 25
Recommendations ......................................................................................... 26 Agency Comments and OIG Evaluation......................................................... 27
3 Increased EPA Oversight and Technical Assistance Needed for Vehicle I/M Programs ...................................................................................... 28
Survey of EPA Regions Suggests Limited Oversight of I/M Programs .......... 28 Mixed Results in Obtaining Annual Reports ................................................... 29 Some Regions Did Not Perform Audits/Evaluations or Assess Data Completeness of Vehicle I/M Programs............................................ 31 Decreased Level of Technical Assistance and Support ................................. 32 EPA Reduced Resources for I/M Oversight ................................................... 33 Conclusions.................................................................................................... 34
Recommendations ......................................................................................... 34 Agency Comments and OIG Evaluation......................................................... 35
Status of Recommendations and Potential Monetary Benefits................................. 36
-continued-

EPA’s Oversight of the Vehicle Inspection and Maintenance Program Needs Improvement
Table of Contents (continued)
Appendices A Details on Scope and Methodology..................................................................... 38
B Human Health and Environmental Impacts of Vehicle Emissions ................... 42
C States/Areas that Operated I/M Programs in 2005 ............................................. 43
D Key I/M Terms and Most Common Emissions Tests ......................................... 45
E Details of OIG Analysis of Vehicles in Maryland that Failed Initial 2003 I/M Test................................................................................................ 47
F Details on Covert Auditing Guidance.................................................................. 50
G Key Reports Received from the 34 Vehicle I/M Programs................................. 53
H Regional Audits and Evaluations of 34 Vehicle I/M Programs, 1999-2005 ...... 54
I Key Evaluation Questions ................................................................................... 55
J Agency Response to Draft Report....................................................................... 57
K OIG Evaluation of Agency Response .................................................................. 66
L Summary and OIG Analysis of Responses from the District of Columbia, Maryland, and Virginia I/M Programs ............................. 68
M Distribution ............................................................................................................ 72

Chapter 1Introduction
Purpose Pollution from mobile sources contributes to two of our worst urban air pollution problems – smog and carbon monoxide (CO). Cars, light-duty trucks, large trucks, buses, construction equipment, lawn and garden equipment, marine engines, aircraft, and locomotives are just some of the types of motorized vehicles and equipment the U.S. Environmental Protection Agency (EPA) defines as mobile sources. On-road mobile source emissions account for approximately 51 percent of the CO, 29 percent of the hydrocarbons (HC), and 34 percent of the nitrogen oxides (NOx) in our nation's air.1 Emissions from mobile sources are much greater in major urban areas.
For on-road mobile sources like cars and light-duty trucks, the vehicle Inspection and Maintenance (I/M) program is a principal method used to address mobile source pollution in the more severely polluted major urban areas. I/M programs require periodic testing of on-road motor vehicles and repair of vehicles that do not meet standards. These tests are designed to determine whether a vehicle’s emission controls are functioning properly, and whether emissions levels of HC and NOx – which form smog – and CO are acceptable. Because I/M programs are important to reducing health risks in major urban areas, we sought to determine whether:
• Selected enhanced I/M programs have been effective in identifying poorly performing vehicles, and ensuring they are adequately repaired and emission reductions achieved.
• EPA’s oversight has ensured that enhanced I/M programs are achieving program goals in a timely manner.
We selected I/M programs in Maryland, Virginia, and the District of Columbia for more in-depth study because, among other things, the Washington, DC metropolitan area was elevated in 1999 from “serious” to “severe” nonattainment, and mobile sources contribute heavily to the area’s emissions. Further details on their selection are in Appendix A.
Background
The 1990 Clean Air Act (CAA) Amendments outline a four-point strategy to reduce emission from transportation sources, including development of:
1Based on 1999 data, according to EPA’s Website at www.epa.gov/oms/invntory/overview/pollutants/index.htm .
1

• Clean vehicles – more stringent emissions standards for new cars, buses, trucks, and nonroad engines.
• Clean fuels – reformulated gasoline, diesel fuel, and nonpetroleum alternatives.
• Clean transportation alternatives – strategies to encourage transportation alternatives to address growth in vehicle travel.
• Inspection and maintenance programs – programs to identify faulty emission controls and ensure vehicle repair to lower vehicle emissions.
Once vehicles are on the road, I/M programs are a primary mechanism to identify poorly performing vehicles and require that such vehicles be repaired. I/M tests use special equipment to measure the pollution in a vehicle’s exhaust. However, not all I/M tests actually measure emissions, nor are they exclusively focused on exhaust emissions. For example, the gas cap test is a pass-fail check for evaporative leaks, and the On-Board Diagnostics (OBD) test monitors the performance of emissions control systems on the vehicle but does not actually measure emissions. Also, not all I/M tests target all three pollutants of concern (CO, NOx, and HC). For example, the Idle test and the Two-Speed Idle test do not measure NOx. I/M programs perform emissions testing of in-use vehicles typically up to 8,500 pounds Gross Vehicle Weight Rating. Some States also perform a safety inspection at the same time as the I/M emissions test, but we did not review safety tests.
Why Do We Need Vehicle I/M Programs?
In 2004, approximately 237 million vehicles were registered in the United States.2
In 2000, Americans drove 2.3 trillion miles and consumed 8.2 million barrels of fuel per day.3 Vehicle emissions can harm human health, damage crops and forests, and impair visibility. Appendix B provides additional information on the health and environmental impacts of vehicle emissions.
According to EPA and the National Academy of Sciences’ National Research Council,4 vehicle I/M programs are an effective means of reducing vehicle emissions and are considered to be among the most significant emissions control strategies that States use. Identifying and repairing older vehicles in particular is key to reducing emissions in major urban areas. According to a 2001 National Research Council report, approximately 10-20 percent of the fleet contributes more than 50 percent of the emissions for any given pollutant.5 However, while
2 U.S. Department of Transportation Federal Highway Administration, Highway Statistics 2004, October 2005. 3 Worldwatch Institute, Vehicle Production Inches Up, Vital Signs 2003, pp. 56-57. 4 In a July 23, 2001, letter from the Director of Certification and Compliance Division, Office of Transportation and Air Quality, to the National Academy of Sciences’ National Research Council, EPA agreed with the Council that I/M programs are one of the most significant control strategies States use in their pollution reduction strategies.5 Committee on Vehicle Emission Inspection and Maintenance Programs, Board on Environmental Studies and Toxicology, Division on Earth and Life Studies, Transportation Research Board, National Research Council, Evaluating Vehicle Emissions Inspection and Maintenance Programs, 2001; and EPA response dated July 16, 2001.
2

modern cars (1996 and newer) emit less air pollution than older vehicles due to improved technology, they are only cleaner if the emission control systems are adequately maintained and operating properly. If not properly maintained, these vehicles will not perform as originally designed, causing them to work harder, wear out faster, and pollute more. Even seemingly minor malfunctions can cause increased emissions. According to EPA, malfunctions can cause emissions to increase substantially beyond Federal vehicle standards. Therefore, identifying and repairing malfunctioning vehicles continue to be imperative in reducing emissions in major urban areas.
Why Do States Say They Need Vehicle I/M Programs?
Vehicle I/M programs have played a critical role in States’ clean air plans. According to Maryland Department of the Environment (MDE) officials, mobile source control programs play a critical role in reducing air pollution on the regional level. MDE stated that pollution from mobile sources contributes to many of the mid-Atlantic region's worst air pollution problems – ozone, carbon monoxide, and fine particulate matter. Overall since 1990, Maryland has achieved a 50-percent reduction in mobile source emissions despite a 40-percent increase in vehicle miles traveled, according to MDE.6 Multiple factors account for these reductions, including enhanced I/M, fleet turn-over, and other mobile source controls. While reduction credits are no longer broken out for individual mobile source programs, Maryland believes its I/M program remains a cornerstone of mobile source reductions in every SIP the State submits. According to Maryland, its I/M program has accounted for a substantial portion of the required emission reductions in its SIP, including about 40 percent of mobile source emissions reductions and up to 25 percent of the needed reductions for the SIP. As a result of emission reductions in both mobile and stationary sources, several areas7 within Region 3 attained the 1-hour ozone standard of .12 parts per million (ppm) by the 2005 deadline. MDE provided additional information about why its I/M program is an important component of its clean air efforts (see Appendix L).
According to the Virginia Department of Environmental Quality (VA DEQ), its enhanced I/M program achieved a substantial portion of the required emission reductions in its SIP. VA DEQ said the program provided 28 percent of the needed reductions for the SIP, and specifically 45 percent of the mobile source emission reductions in the 1999 SIP. As of May 2006, Virginia had achieved a 60-percent reduction in mobile source emissions since 1990 from its enhanced I/M program, combined with other Federal mobile sources requirements, despite a
6 According to Maryland, the reductions were estimated by using the estimates provided in EPA’s Mobile5b and Mobile6 models. 7 Region 3 areas that attained the .12 ppm 1-hour ozone standard were the Washington Region, the Philadelphia Region, and the Kent and Queen Anne County Regions of Maryland; the Baltimore Region missed attainment by 1 parts per billion at one monitor, according to MDE. In 2004, the Baltimore, Washington, and Philadelphia metropolitan areas were designated as moderate nonattainment areas under the new .08 ppm 8-hour ozone standard; Kent and Queen Anne Counties were designated as marginal nonattainment areas.
3

31-percent increase in vehicle miles traveled, according to VA DEQ officials. The VA DEQ also noted that these benefits do not consider reductions in toxic emissions achieved through I/M programs.8 The VA DEQ further commented that according to EPA’s 1999 National-Scale Air Toxics Assessment,9 mobile sources are responsible for approximately 44 percent of outdoor toxic emissions, almost 50 percent of the cancer risk associated with breathing outdoor toxics, and 74 percent of the noncancer risk. Thus, by ensuring that vehicles function properly, I/M programs also decrease vehicles’ air toxics emissions.
Who Is Required to Implement Vehicle I/M Programs?
Not every State is required to have a vehicle I/M program. Generally, States with areas found to have high levels of ozone and/or CO – known as nonattainment areas – are required to have emission testing programs. A nonattainment area is a geographic area in which the level of a criteria air pollutant is higher than the level allowed by the Federal standards. States with urban areas with populations of 200,000 or more found to exceed standards for ozone10 and/or carbon monoxide by a specified amount are required to have I/M programs. Also, some areas in attainment must implement I/M programs, such as under the CAA’s Ozone Transport Region (OTR) requirements, to maintain areas that were once in nonattainment. Other communities have voluntarily entered into Early Action Compacts to achieve the new .08 ppm 8-hour ozone standard that replaced the .12 ppm 1-hour ozone standard.11
Currently, 33 States and the District of Columbia operate a total of 52 different I/M programs; some States operate different programs in different areas of the State, depending on an area’s nonattainment classification. Of these programs, 25 States and the District of Columbia operate “enhanced” I/M programs. Appendix C lists the I/M program participants for 2005. The differences between basic and enhanced programs are as follows:
8 According to VA DEQ, these numbers are derived from its SIP and are based on modeling estimates using EPA’sMobile5 and Mobile6 models. 9 Control of Hazardous Air Pollutants From Mobile Sources, Proposed Rule, March 29, 2006, Federal Register 71, p. 15808. 10 All of the ozone-triggered I/M programs currently in operation were required because of their designation and classification under the .12 ppm 1-hour ozone standard. The 1-hour ozone standard has since been replaced by the .08 ppm 8-hour ozone standard. In accordance with CAA section 110(l) anti-backsliding requirements, all existing 1-hour ozone I/M programs must continue I/M until the areas have attained the .08 ppm 8-hour standard. EPA allows an exception for basic I/M areas that have been redesignated to attainment under the 1-hour ozone standard. If a 1-hour maintenance area is subsequently designated to nonattainment for the 8-hour standard, but at a classification that would not otherwise trigger the I/M requirement, such an area has the option of converting the I/M program to a contingency measure (as provided in Title 40 Code of Federal Regulations Part 51.372(c)), provided the area can demonstrate that doing so will not interfere with its ability to comply with any National Ambient Air Quality Standard or any other applicable CAA requirement. 11 EPA is working with communities around the country to get clean air as soon as possible. Together with EPA, these communities entered into Early Action Compacts to reduce ground-level ozone about 2 years sooner than required by the CAA. The Early Action Compact option was only available for a limited time, and only under the .08 ppm 8-hour ozone standard, as opposed to the .12 ppm 1-hour ozone standard addressed in the 1990 CAA Amendments.
4

• Basic I/M programs are required in (1) all moderate CO nonattainment areas having a 1990 urban population of 200,000 or more; (2) marginal ozone nonattainment areas that had, or were required to have, an operating vehicle I/M program prior to passage of the 1990 Act; and (3) CO nonattainment areas with a design value of 12.7 ppm or less. States implementing basic I/M must meet a performance standard based on idle testing of light-duty vehicles and OBD testing of 1996 and newer vehicles. While basic I/M programs are required to perform OBD testing on OBD-equipped vehicles, for performance standard purposes, it is the idle test alone (on 1968 and newer vehicles) that establishes the credit level that must be met for basic I/M programs required under the 1-hour ozone standard. 12
• Under the CAA Amendments, certain areas in the country must implement more stringent I/M programs, known as “enhanced I/M.” Sections 182 and 184 made vehicle I/M programs mandatory for these areas based on such criteria as air quality classification, population, and location. Enhanced I/M programs are required in (1) all serious, severe, or extreme ozone nonattainment areas with urban populations of 200,000 or more; (2) Metropolitan Statistical Areas with a population of 100,000 or more in the Northeast Ozone Transport Region13 (irrespective of their air quality classification); and (3) all moderate or worse CO nonattainment areas that had a 1980 urban population of 200,000 or more. States implementing enhanced I/M programs must meet a performance standard that includes OBD testing, emissions testing, and an inspection to detect tampering.
How Do Vehicle I/M Programs Work?
Vehicle I/M programs help improve air quality by identifying high-emitting vehicles in need of repair. This is done through visual inspection, emissions testing, and/or accessing the OBD onboard computer codes from 1996 and newer vehicles. Once identified, I/M programs require noncomplying vehicles to be repaired as a prerequisite to continuing to operate within a given area (with limited exceptions known as waivers).
States can perform testing at either a centralized test-only inspection facility operated by the State or its contractor, or at a privately owned and operated decentralized facility where certified mechanics conduct emissions testing. Some States use hybrid networks where testing can be conducted at either a centralized
12 The 1992 I/M rule included OBD in basic and enhanced performance standards, but model year coverage was not specified because the requirements for OBD had not been developed and EPA did not know when the first OBD-equipped vehicles would be manufactured. At that time, EPA did not know if the OBD test would replace tailpipe testing or merely supplement it. Lastly, no credit for OBD was included in the original performance standards. 13 Section 184 of the 1990 CAA Amendments created the OTR in the Northeast. The ozone-related SIP requirements for States in the OTR are more extensive than those for other States in order to address regionally transported ozone and its precursors in addition to locally elevated ozone levels.
5

or decentralized test facility. Most hybrid programs require that certain criteria be met before a vehicle can be tested at a decentralized station.
Vehicle I/M test pass/fail standards are set according to the car’s model year and vehicle class. Also, State and local areas are allowed some flexibility in designing I/M programs to meet their goals.14 These program designs are reviewed and approved by EPA as part of the SIP, which in essence is the State’s strategy and commitment to achieving its air pollution goals.
Individual State I/M programs differ significantly in key ways, and therefore it is not easy to compare one State’s program to another. For example, States do not use the same types of emission tests and network types, and subject fleets vary from State to State. This can lead to varied results. According to EPA’s Office of Transportation and Air Quality (OTAQ), greater State-to-State consistency and comparability are expected as States begin to rely more on OBD testing. Some tailpipe tests are more stringent than others. One example of a more rigorous tailpipe test is the IM240, which is considered more accurate because it is based upon EPA's Federal Test Procedure. The Federal Test Procedure is sometimes referred to as the “Gold Standard” for exhaust emission tests and is used to determine a vehicle's compliance with new vehicle certification standards.15
Other types of tests include Acceleration Simulation Mode, Two-Speed Idle, and Idle. At the same time, I/M programs can assign cutpoints of different stringency. Because of this variability in both accuracy and stringency of tests, EPA assigns credit for emissions reductions for each variation of tailpipe testing based on the accuracy of the test and the stringency of the cutpoints. Appendix D provides additional information on the most common tailpipe emissions tests.
The OBD test is not a tailpipe test, but rather is an indicator of emissions systems performance, and OBD has been standard equipment on all new light-duty vehicles and light-duty trucks sold in the United States since the 1996 model year. Such testing is required on 1996 and newer light-duty cars and trucks. As of 2004, OBD-equipped vehicles comprised about 60 to 70 percent of the fleet. Many of these first OBD-equipped vehicles are just now operating beyond the 8-year/80,000 mile warranty period on major emissions controls.
What Reports Are Mandated by EPA’s I/M Regulations?
States are required to submit four annual reports to EPA regions (on test data, quality assurance, quality control, and enforcement) and a biennial report on additional requirements. In addition, enhanced I/M programs are required to
14 Rather than one standard test, as originally planned, States use various tailpipe tests. This is due to Section 348 of the National Highway System Designation Act of 1995, which modified existing CAA I/M authority. This act allowed States the time and opportunity to implement innovative program designs because one test standard would not be practical in all States’ I/M programs. 15 The Federal Test Procedure is a laboratory dynamometer test used to certify new cars against new-car emissions standards. The Federal Test Procedure is roughly based on a typical urban area trip, complete with starts and stops. Such a trip is known as a driving cycle, which can be approximated on a dynamometer.
6
submit program evaluations on a biennial basis. Accurate data collection is essential to the management, evaluation, and enforcement of the I/M program. States’ I/M programs are required to gather test data on individual vehicles, as well as quality control data on test equipment. Under Title 40, Code of Federal Regulations, Part 51.365, States are also required to track Vehicle Identification Numbers (VINs) as part of their inspection program. Chapter 3 provides more information about the reporting requirements for State I/M programs.
What is EPA’s Role in I/M Programs?
EPA OTAQ develops and issues I/M regulations. Specifically, OTAQ develops national policies on mobile source emission control, determines the contribution of mobile sources to pollutant emission inventories, and assesses the potential effectiveness of various I/M tests at identifying vehicles in need of repair. OTAQ also establishes the amount of emissions reductions “credits” that proper implementation of various tests should receive. OTAQ provides guidance and technical support to EPA regions and States.
EPA’s regional offices are responsible for the oversight of the vehicle I/M programs in the United States. The regional offices are responsible for reviewing, approving, and overseeing SIPs, which provide for vehicle I/M programs to reduce HC, NOx, and CO emissions. EPA regional offices are also responsible for ensuring that I/M programs meet their SIP commitments, including providing the required reporting. The SIPs contain agreed to requirements such as type of test, compliance rates, and waiver rates. Since promised emissions reductions are part of SIPs, regional offices are required to evaluate the reports provided and follow up with States on any significant issues.
Scope and Methodology
To assess whether selected enhanced I/M programs have been effective in identifying poorly performing vehicles, ensuring they are adequately repaired, and achieving emission reductions, we obtained and analyzed State reports received by one EPA region (Region 3) from 2001 to 2004. We performed onsite work in two Region 3 States (Maryland and Virginia), and assessed the reliability of the I/M testing data provided by those States. To determine whether EPA’s oversight has ensured that enhanced I/M programs are achieving program goals in a timely manner, we developed and administered a survey to obtain I/M oversight information from all 10 EPA regional offices regarding State operations. This survey obtained information for the District of Columbia and each of the 33 States that operated I/M programs in 2005.
Our evaluation was not intended to project conditions, findings, or results onto other EPA regions or States based on findings from Region 3. However, based on our survey of all 10 EPA regions as well as what we learned during our evaluation of 3 individual I/M programs, we do discuss issues and make recommendations
7

concerning EPA oversight that are national in scope. We did not evaluate the accuracy of the emission tests, but rather how the authorized programs operated in relation to their SIP commitments for the identification and repair of poorly performing vehicles.
Chapter 2 provides detailed information about our data analyses of I/M test data for two I/M programs (Maryland and Virginia). Such data was not available for the District of Columbia I/M program during the course of our field work. As a result, we were not able to do similar analyses of I/M test data in the District of Columbia I/M program. This is a limitation in our case study of the three enhanced I/M programs that impact the Washington, DC major metropolitan area.
In Chapter 3, as shown in Chart 3-1, some States did not submit the required reports to EPA, including the required test data report that contains the information on initially failing vehicles and their resolution. Without this information, neither we nor EPA have the data to conduct the analyses of vehicles that failed the I/M test and how they were resolved to determine whether I/M programs are meeting their SIP commitments.
We conducted field work from April 2005 to March 2006. We performed our evaluation in accordance with Government Auditing Standards, issued by the Comptroller General of the United States. Appendix A provides more details regarding our scope and methodology.
8

Chapter 2Some I/M Programs Need to Better Identify and
Ensure Repair of Vehicles with Excess Emissions
While States in Region 3 have achieved substantial emissions reductions from mobile sources through vehicle I/M programs,16 they did not ensure that poorly performing vehicles have been properly identified and timely repaired. Specifically:
• One of the five I/M programs in Region 3 (the District of Columbia) has, since September 2005, used a less stringent testing procedure than agreed to in its SIP, resulting in fewer poorly performing vehicles being identified.
• Four of the five I/M programs (Delaware, Maryland, Pennsylvania, and Virginia) reported substantial percentages of vehicles with no known final outcome, ranging from 12 to 22 percent of vehicles that failed their I/M inspection. The fifth program (District of Columbia) did not report this measure to EPA.
Our in-depth work in one State (Maryland) showed that resolution of about 5 percent of failed vehicles (where the outcome was known) took over 21 months. Depending upon their ultimate disposition and length of time before they are repaired, failing vehicles that are not timely resolved may reduce the air quality benefits achieved from the I/M program. For other vehicles, we could not determine a resolution, and some of these vehicles appeared to continue to be driven in the nonattainment area. Also, some States in Region 3, as well as in other EPA regions, did not meet minimum reporting requirements. This occurred because EPA has provided limited oversight over I/M programs (see Chapter 3). Excess vehicle emissions can harm human health, damage crops and forests, and impair visibility.
Less Stringent Emission Tests Used in One I/M Program Since September 2005, the District of Columbia I/M program has been using a less stringent emissions test than agreed to in its SIP for testing model years 1984 to 1995, which comprise about 25 to 30 percent of the vehicles in their program. This resulted in less accurate identification of poorly performing vehicles. Due largely to hardware and software problems, the District suspended IM24017
testing in September 2005, even though such testing is required by the SIP.
16 See Appendix A for reasons for selecting Region 3 for detailed review. 17 The IM240 is a tailpipe test that requires a vehicle to run on a dynamometer for 240 seconds over a wide range ofoperating modes, while the vehicle’s emissions are sampled.
9

Instead, the District tested these model years under its less stringent idle testing program used for older vehicles. Officials of the District’s Air Quality Division, Department of Health, told us in May 2006 they expected to start IM240 testing again in March 2007. Therefore, for at least 18 months (September 2005-February 2007), the District will not be in compliance with its SIP commitment to use IM240 testing.
Further, until August 2005, District officials said their OBD18 test equipment had had technical problems. For 1996 and newer vehicles (about 70 percent of the District’s vehicles), the District agreed to perform OBD testing. However, the District’s 2003 report acknowledged that OBD testing in the District did not meet EPA standards, and identified potentially significant problems with the I/M program and accuracy of reported data. The report also contained documents related to the current status of the program and planned corrective actions. According to District officials, the previous software could not communicate with some newer vehicles (some 2003 and newer models) because the equipment was not compatible with the 2003 OBD technology and thus did not comply with applicable Federal regulations and EPA guidance.
In May 2006, District officials informed us that they embarked on a major project to renovate and upgrade I/M stations and data systems. District officials also said they had been working with contractors since May 2005 to remedy the problems at their centralized vehicle inspection stations, and the majority of the problems related to the OBD testing protocol have since been fixed.
Improvements Needed to Ensure Failed Vehicles Repaired Effectively Repair of poorly performing vehicles is perhaps the most critical part of a vehicle I/M program, since programs will only be effective if poorly performing vehicles are identified and actually repaired in a timely manner. The I/M programs in Region 3 reported significant percentages of vehicles with no known final outcome (ranging from 12 to 22 percent of initially failed vehicles). Also, vehicle waiver rates exceeded the percent allowed in the approved SIP for Maryland. Our detailed work in Maryland and Virginia suggests that these States need to follow up more thoroughly to determine the outcome of failed vehicles.
Significant Percentages of Vehicles with No Known Final Outcome
Vehicles are known as vehicles with “No Known Final Outcome” if they initially fail their I/M test and then have no record of (1) ever passing a subsequent I/M test, (2) receiving a waiver, (3) retiring from service (scrapped), or (4) being sold outside of the nonattainment area. Because the specific deposition of each vehicle involves data sources outside of the I/M database, I/M programs have difficulty determining if and when vehicles are retired from service or sold outside of the
18 OBD testing uses a computer to indicate the performance of the vehicle’s emissions systems.
10

area. As shown in Table 2-1, I/M programs in Region 3 reported vehicles with no known final outcome ranging from 12.4 to 21.8 percent for 2003 to 2004.
Table 2-1: Number and Percent of Vehicles Reported as Having No Known Final Outcome
State Calendar
Year
Reported Number
Initially Testede
Number Initially Failed
Percent Initially Failed
Number Reported with
No Known Final Outcome
Percentage With No Known Final
Outcomef
Delaware 2003a N.R. N.R. N.R. N.R. N.R. 2004 165,000 14,122 8.6% 2,382 16.9%
Maryland 2003 1,304,998 136,980 10.5% N.R. N.R b
2004 1,315,280 133,001 10.1% 29,044 21.8% Pennsylvania 2003 3,244,449 184,402 5.7% 23,624 12.8%
2004 5,758,270 332,265 5.8% 41,182 12.4% Virginia 2003 718,177 54,328 7.6% 8,324 15.3%
2004 745,455 48,701 6.5% 6,300 12.9% District of 2003 70,066 8,407 12.0% N.R Unknown c
Columbia 2004d 224,655 19,486 8.67% N.R. N.R. N.R.: Not reported a Region 3 had not received a 2003 report from Delaware as of March 2006.b Maryland first reported vehicles with no known final outcome in 2004. According to Maryland officials, 2004 was the first year Maryland was able to fully match vehicle test data with vehicle history data in order to accurately report this category. c District of Columbia did not include “vehicles with no known final outcome” in its reports. Because of reportingdeficiencies in the reports received by Region 3, we could not determine this rate for the District of Columbia I/M program. d Region 3 had not received a 2004 report from the District of Columbia as of March 2006. The District of Columbia provided the 2004 report after our field work and after issuance of our draft report. e Reported numbers of tests include all types of I/M tests (tailpipe and OBD).f Reported vehicles with no known final outcome divided by number of reported initial failures.
Source: Annual reports submitted to Region 3 by its States
Because the District of Columbia was behind in I/M reporting, we could not determine the number of vehicles with no known final outcome. We discussed this issue with District officials, who told us they would include 2005 data in their July 2006 report to EPA. The District of Columbia provided the 2005 report after our field work ended and after issuance of our draft report. The report contains information related to vehicles with no known final outcome. The Region was aware that the District’s I/M program has had both data and operational problems, but regional oversight and assistance to remedy the issues have been limited.
In-Depth Review of Two States Noted Various Issues
Because of the significant percentages of vehicles reported as having no known final outcome, we performed more detailed analyses of the I/M programs in Maryland and Virginia. The data was not available to perform similar analyses for the District Columbia; a later section discusses those data problems. Although States have made efforts to increase the effectiveness of vehicle repairs, further I/M program improvements are needed.
11

Maryland
MDE provided us with data for vehicles tested from January 2003 though April 2005, including data from the Maryland Motor Vehicle Administration. Maryland's Vehicle Emissions Inspection Program is a biennial program, with a centralized network of 19 stations that tested 1,304,998 vehicles in 2003. According to State officials, Maryland tests vehicles up to 26,000 pounds Gross Vehicle Weight Rating, and also uses 4-wheel drive dynamometers for testing all-wheel drive vehicles.19 The State also provides technician and repair facility certification programs, as well as training, support, and outreach activities for the vehicle repair community. Maryland operates a Registration Denial enforcement program (see Appendix C for information about types of vehicle enforcement programs). As shown in Chart 2-1, Maryland identified 136,980 initially failing vehicles in 2003. This means that about 10 percent of the vehicles failed their initial I/M test.
Chart 2-1: Maryland Initially Tested Vehicles, 2003
Initially Tested Vehicles in Maryland 2003 Total Reported Tested: 1,304,998
Initially Passing, 1,168,018
Initially Failing, 136,980
Initially Passing Initially Failing
Source: OIG analysis of data provided by MDE
For vehicles that initially failed an inspection in 2003, we traced their status through April 2005. We analyzed this data to determine whether a vehicle was appropriately resolved (i.e., passed a subsequent inspection, was granted a waiver, had its tags turned in, was no longer in the I/M area, or was exempted). As shown in Chart 2-2, about 82 percent, or 111,435 of the 136,980 vehicles, were resolved by April 2005.
19 Some all-wheel/4-wheel drive vehicles are full time all-wheel drive and unable to turn off this feature. These vehicles cannot be tested on a 2-wheel drive dynamometer. Without 4-wheel drive dynamometers, pre-OBD vehicles would generally be tested using idle testing.
12

Chart 2-2: Status of Initially Failed Vehicles in Maryland
Resolution of Initially Failed Vehicles (based on our analysis) Total Initial fails: 136,161 a
24,726 18%
111,435 82%
Resolved Not Resolved a The total in Chart 2.2 (136,161) is 819 vehicles less than
the total of initially failed vehicles (Chart 2.1), because we found duplicate VIN numbers during our analysis of the data provided.
Source: OIG analysis of data provided by MDE
Chart 2-3: How Initially Failing Vehicles Were Resolved for 111,435 Vehicles With a Known Final Outcome in Maryland
Senior/Disabled.
Resolution of Maryland Vehicles Waiver1048
10
Passed 80,077 72%
Total = 111,435 1% Out of Area
43 0% Exempt Repair Waivers a
14,956 0%13% Passed
Tags Turned in Repair Waivers Senior/Disabled. Waiver
Tags Turned in Out of Area15,301 Exempt
14%
a. Vehicles that cannot be repaired to achieve the emissions standards may qualify for a 2-year waiver if minimum expenditures have been made to repair emissions system components.
Source: OIG data analysis of data provided by MDE
Chart 2-3 shows how the 111,435 vehicles with a known final outcome were resolved. As noted, 99 percent of the vehicles were resolved in one of three ways: the vehicle either passed a subsequent inspection, was granted a repair waiver, or had its tags turned in.
Timeliness of Resolved Vehicles
Maryland’s I/M Statute allows motorists 120 days to repair failed vehicles and return for re-inspection, and motorists can be granted up to two 120-day
13

extensions (cumulatively, nearly up to 1 year). Maryland's I/M enforcement program is based on the suspension/denial of vehicle registration. While registration renewal in Maryland is also biennial, it is not linked to the Vehicle Emissions Inspection Program biennial test cycle. Maryland’s Registration Denial enforcement program includes tracking vehicles to ensure that the vehicles are inspected when due and maintaining a “no show list” for vehicles not brought in when required. If vehicles are not brought in for inspection or re-inspection, Maryland first gives the vehicle owner a warning and then suspends the vehicle’s registration. Maryland also assesses the owner $15 for every 28 days a vehicle is late for an inspection.20 If an owner drives with a suspended registration, he or she could be given a citation by law enforcement (Maryland officials told us that the State does not keep statistics of the number of these citations due solely to Vehicle Emissions Inspection Program violations).
As shown in Chart 2-4, there can be a significant amount of time between when a vehicle fails the emissions test and when it is repaired.
Chart 2-4: Timeline from Initial Failure to Resolution for 111,435 Vehicles With a Known Final Outcome (cumulative)
Timeliness of Resolution of Failed Vehicles in Maryland
100% 94% 100 88%
90 98% 92% 80
esol
ved 70 79%
60 55% 55% 50 Resolved 40
% R 30
20 4 mos - I/M
10 program repair 8% goal
0 0 4 8 12 16 20 24 28
Time (months)
Source: OIG analysis of data provided by MDE
Based on our analysis of Maryland’s vehicle data, 45 percent of the 111,435 initial failures with a known final outcome were not resolved after 4 months, the timeframe Maryland law allows for a motorist to return after an initial test failure. Further, about 12 percent were not resolved after a year, and 5 percent took longer than 21 months for resolution. By comparing VIN numbers with I/M test results in the Maryland database, we identified 1,665 vehicles (about 1.2 percent) that
20 According to Maryland, the State Motor Vehicle Administration checks the no-show list against its vehicle registration database weekly and removes vehicles from the list that have been sold, moved out of the area, scrapped, or granted extensions; the remaining vehicle owners are sent a letter advising that their registration will be suspended 30 days after failure to comply.
14

failed their Maryland I/M test in 2003, never passed a subsequent I/M test, and then failed a Maryland I/M test again in 2005.
Maryland officials explained there are several factors that can contribute to the amount of time taken to resolve vehicles after failing an inspection, including:
• The State’s I/M Statute provides motorists up to 120 days (about 4-months) to have their vehicle repaired and to return for a retest.
• Multiple retests are sometimes necessary before passing (returning vehicles are not always successful in passing a retest).
• Motorists can be granted up to two 120-day extensions (cumulatively, nearly up to 1 year).
• Motorists sometimes arrive late for scheduled re-tests (although they must pay a late fee, this extends the time for repairs).
Maryland officials noted that owners do not get a full 2 years before being required to return for their next inspection; the owner will still be required to have a vehicle tested again every 2 years after its previous I/M anniversary date. For example, if resolution takes 15 months, the vehicle will still be due for its next regularly scheduled I/M inspection 9 months later.
Vehicles with Unclear Final Outcomes
For the 24,726 vehicles that we previously noted had unclear final outcomes (about 18 percent of the 136,980 initially failed vehicles), these vehicles generally fell into three categories, shown in Table 2-2:
Table 2-2: Major Categories of Unclear Final Outcomes in Maryland
Category Number of Vehicles Maryland Explanation
No Current Record for Title
7,945 “In the basic look-up function, if the VIN has been re-titled, or becomes inactive, there will be no record for the given title. In some of the manual lookups, we did not follow through by manually keying in the VIN to determine if [the vehicle] had become inactive, or had a new title number/owner.”
Sold 2,234 “Vehicles that are sold may still be in the area, but not yet re-titled in Maryland, or could subsequently have been registered out of State. Unless the sold vehicles are actually re-titled in Maryland, there is no way to determine the disposition.”
Vehicles With No Result (have not passed retest nor received a waiver), But Are Not on the Current No-Show List
13,655 “These vehicles were checked manually over time during the normal course of operations and removed from the no-show list for a valid reason.” However, as discussed below, MDE did not maintain documentation of the manual checking of these vehicles.
Source: OIG analysis of data provided by MDE and explanations provided by Maryland
The remaining 892 vehicles fell into several categories, including “Office Date Change,” “Wait Time on Return,” “Vehicle has been updated,” and “Other.” See Appendix E for more details.
15

For the first two categories, while many of these vehicles may no longer be driven in the area or may be retired, this could not be ascertained from the category descriptions provided. Maryland officials said their review of the data showed that a majority of these vehicles were neither in the test records nor on the "no show" list, which they concluded means they are most likely not being driven in the area. However, according to Maryland, normally when a failed vehicle is sold, the new owner receives new dates – i.e., the test failure does not carry over to the new owner. Based on this practice, in theory a failing vehicle could be sold multiple times before being required to be retested. Maryland commented that while in theory this is possible, they do not believe this occurs to any significant degree. Also, Maryland noted that since its Motor Vehicle Administration sends out I/M test notices within 6 months after a resale, and the testing due date on the notice is 8 weeks after it is sent, a vehicle would have to be resold within 8 months to avoid testing. The numbers of these vehicles that are no longer in the area could not be determined from the data provided.
For the third category, consisting of 13,655 vehicles, Maryland described the issue of these 13,655 vehicles as a documentation issue. Maryland responded to our draft report that all 13,655 vehicles were checked manually over time during the normal course of operations and removed from the no-show list for a valid reason. Maryland further noted that to recreate this list information for the OIG, it would have to manually look up each vehicle a second time, which would be a substantial amount of work. Rather than recreating this information, Maryland provided a sample of 20 vehicles from the 2003 testing data. Our analysis of the information provided by Maryland for 20 vehicles found that the information was sufficient to establish that 12 vehicles were resolved and 8 vehicles were not clearly resolved. Appendix E provides more detail on these 20 vehicles.
During our field visit to Maryland in September 2005, MDE provided us with an analysis of initially failing vehicles. The MDE analysis showed the following results: 12 percent (16,781vehicles) with no result within 18 months, and 3 percent (4,542 vehicles) that could not be accounted for anywhere in the system. According to MDE, the 9-percent difference (12,239 vehicles) included vehicles that they did not have a result for, but that they could account for as still in the system (e.g., extensions, retests, etc.).
Waiver Rates
Maryland reported a 10-percent waiver rate in the 2003 annual data report submitted to EPA (13,849 vehicles) and again in the 2004 annual data report (13,100 vehicles). This waiver rate is well above the 3 percent rate agreed to in Maryland’s SIP. Vehicles that cannot be repaired to achieve the emissions standards may qualify for a 2-year waiver if minimum expenditures have been made to repair emissions system components. For all vehicles that fail an initial inspection, the minimum waiver expenditure in Maryland is $450. One reason for the high percentage of waivers was that Maryland’s waiver limit remained at $450
16

and this limit cannot be adjusted for inflation without action from the State legislature. Maryland’s waiver limit has not been raised even though adjustment for inflation is required by the Clean Air Act Amendments of 1990. Section 182 (3)(C)(iii) provides:
In view of the air quality purpose of the program, if, for any vehicle, waivers are permitted for emissions related repairs not covered by warranty, an expenditure to qualify for the waiver of an amount of $450 or more for such repairs (adjusted annually as determined by the Administrator on the basis of the Consumer Price Index).
These vehicles represent a significant percentage of initial fails that are driven without passing an inspection and could have a significant impact on emissions.
In response to our draft report, MDE noted that during the time period covered by its SIP, Maryland continually worked to reduce the waiver rate with the ultimate goal of reaching the agreed upon rate. However, the actual waiver rates for the I/M program remained higher than expected and documented in these plans. In 2005, Maryland adjusted its modeling activities to reflect the actual waiver rate, and is working with Region 3 to adjust its related emission credits accordingly for use in planning future SIP revisions, including revisions needed to attain the 8-hour ozone standard.
Gas Cap Test
Maryland only provides motorists with an advisory for gas caps that fail the mandated SIP test (unlike other States that require them to be replaced) and does not follow up to ensure these failing gas caps are replaced. Maryland believes that gas cap tests can give conflicting results compared to OBD results. However, requiring replacement of failing gas caps could lead to further reductions of emissions. EPA concluded that based on data from the Wisconsin I/M program that show over 30 times as many OBD vehicles fail the stand-alone gas cap test as compared to OBD, gas cap testing should continue for OBD I/M checks rather than just relying on OBD results.21 While EPA did not quantify evaporative emissions in this study, the Agency concluded that there appears to be an adequate benefit from conducting a stand-alone functional gas cap test as part of the OBD check of the evaporative emission system.
I/M Implementation Challenges
Maryland also provided information regarding the importance of its I/M program and the challenges that the State has encountered in implementing the I/M program. Among other things, MDE noted that:
21 EPA 420-R-00-018, “Effectiveness of OBD II Evaporative Emission Monitors - 30 Vehicle Study,” revised October 2000.
17

In operation since the mid 1980’s, the Maryland Vehicle Emissions Inspection Program (VEIP) has been reducing emissions from cars and trucks for more than twenty years. As vehicle technologies have continued to advance, I/M technologies have also advanced. The VEIP's evolution has taken it from the idle tailpipe test, to the transient IM240 test, to today’s computerized OBD test. Each step along the way, Maryland has been committed to implementing the best I/M program possible. However, enhancements to this program have produced a wide range of public opinions and concerns. As a result, the incorporation of new test types and procedures has made it one of the most difficult environmental programs to implement over the years. One of the major challenges of the VEIP is to balance the goal of maximizing environmental benefits with consumer acceptance of the program. This challenge is not unique to Maryland. Almost all areas implementing enhanced I/M programs face the same issue. Without consumer acceptance, there will be no environmental benefits. Continued attention to customer service eventually turned public rejection into public acceptance of the VEIP. According to MDE, while this constant balancing approach to the I/M program has left room for continued improvement in some areas, it has produced a program that is unique to Maryland while at the same time enabling it to remain a critical component of the SIP. Most importantly, Maryland's I/M program achieved its most important goal, bringing clean air to Maryland citizens.
Virginia
VA DEQ provided us with data for vehicles tested from January 1, 2004, through July 31, 2005. Virginia operates a decentralized program that tested 745,455 vehicles in 2004. As shown in Chart 2-5, Virginia reported 48,701 initially failing vehicles (7 percent of initial tests).
Chart 2-5: Initially Tested Vehicles in Virginia in 2004
Initially Failed Vehicles in Virginia 2004 Total Reported Tested: 745,455
Initially Failing 48,701
Initially Passing 696,754
Initially Passing Initially Failing
Source: OIG analysis of data provided by VA DEQ
18

Rather than reporting “Vehicles with no known final outcome,” Virginia reported percentages of “retired vehicles,” which it said in its 2004 report it determined by subtracting the number of vehicles with known final outcome (last re-test pass and waiver) from the number of initial fails. While acknowledging that not all are retired, State officials believe the majority of these vehicles are retired. At the time our field work ended, Virginia was still analyzing the issue by tracing vehicles using VIN numbers provided during our evaluation to determine the outcome of vehicles that fail I/M tests, since it will still be important in the future.
We analyzed VA DEQ data by tracing initially failed vehicles by VIN number from January 1, 2004, through July 31, 2005. We found that 7,014 vehicles, or about 14 percent, had no known final outcome (see Chart 2-6). This is close to the percentage Virginia reported to EPA for 2004 (12.9 percent, or 6,300 vehicles).
Chart 2-6: Status of Initially Failed Vehicles in Virginia
Resolution of Initially Failed Vehicles (Based on Our Analysis)
Total Initial Fails: 48,705a
41,691 86%
7,014 14%
Resolved Not Resolved (b) a The total in Chart 2.6 (48,705) is 4 higher than the total of initiallyfailed vehicles (Chart 2.5) because we found a variance during our analysis of the data provided. We consider this variance to be insignificant.
Source: OIG analysis of data provided by VA DEQ
Neither the number of these vehicles no longer in the area nor the number that may still be in the area could be determined from the data provided. We provided our detailed analysis to Virginia for followup, which VA DEQ was still in the process of addressing as of October 1, 2006. VA DEQ provided preliminary information on 46 of the 7,014 vehicles with no known final outcome. It found that 30 vehicles were over 24 years old and no longer subject to I/M, and 16 had received a pass or waiver that was not originally identified in the database because of incorrect VIN entry or other reasons. Virginia is in the process of determining the final disposition of each remaining VIN using national data sources such as Carfax and Virginia Department of Motor Vehicles data. Virginia noted that studies from other I/M programs (California, Arizona, and Colorado) have indicated similar no-final-pass rates. VA DEQ officials estimated that their study of final resolution of all failed vehicles should be completed by fall 2006.
19

In response to our draft report, VA DEQ provided an update on its nearly completed study, noting that preliminary indications are that the status of a substantial number of the vehicles with no known final outcome can be identified through various mechanisms. Appendix L provides more information on the mechanisms used by VA DEQ in its study.
As shown in Chart 2-7, the majority of the 41,691 resolved vehicles passed a subsequent inspection.
Chart 2-7: How Initially Failing Vehicles Were Resolved for 41,691 Vehicles With a Known Final Outcome in Virginia
Resolution of Virginia Vehicles Total = 41,691
Waivers 614 1%
Passed 41,077 99%
Waivers Passed
Source: OIG analysis of data provided by VA DEQ
Virginia offers a one-time 30-day extension for registrations if the vehicle fails an inspection. As shown in Chart 2-8, we also found that the majority of these resolved vehicles were resolved within 3 months (94 percent) and less than 1 percent took longer than 1 year. Virginia’s waiver rate was in compliance with its SIP commitment. The 2005 waiver limit for Virginia was $620. Virginia reported waiver rates below 2 percent for both 2003 (1.6 percent, or 896 vehicles) and 2004 (1.3 percent, or 626 vehicles). This waiver rate is under the 3 percent rate agreed to in Virginia’s SIP.
20

Data Ensuring Effectiveness of Selected State I/M Programs Lacking
EPA did not have adequate information ensuring that selected State I/M programs were achieving the emissions reductions claimed. EPA regulations (see box) require I/M programs to submit reports on test data, quality assurance, quality control, and enforcement to EPA by July of each year. This information should help EPA fulfill its responsibility to ensure that State I/M programs have been effective in identifying poorly performing vehicles and ensuring needed repairs. Further details on reporting are in Chapter 3. Our survey Key I/M Reporting Requirements
for State Programs of all 10 EPA regions for the 34 I/M programs showed that for the period 1999 to 2004: “Data analysis and reporting are
required to allow for monitoring and evaluation of the program by
• Eleven programs submitted all the program management and EPA, required reports in a timely manner. and shall provide information
• regarding the typ Fourteen programs had either never es of program activities performed and their final
submitted the required reporting or the outcomes, including summary regions were unsure whether the reports statistics and effectiveness
were submitted. evaluations of the enforcement mechanism, the quality assurance
• Four programs submitted reports but they system, the quality control program, were not timely. and the testing element.”
• The remaining five programs had mixed Source: Title 40 Code of Federal
results (some reports were submitted Regulations Part 51.366.
timely but some were not received).
Further, our in-depth work in EPA Region 3 indicated that EPA was not consistently provided the key reports needed to assess the effectiveness of its
Chart 2-8: Timeline from Initial Failure to Resolution for 41,691 Vehicles With a Known Final Outcome in Virginia
Timeliness of Resolution of Failed Vehicles in Virginia
100% % 95% 97% 98% 98% 99% 10090% 92% 80%
noi 70%
t 69%
ul 60%
os 50%
e 40%
% R 30%
20% 10%
0% 0 2 4 6 8 10 12 14
Time (months)
86% Resolved
1 mo - I/M program repair
goal
Source: OIG analysis of data provided by VA DEQ
21

authorized State I/M programs. As shown in Table 2-3, Region 3 did not receive these reports from two of five programs (Delaware and District of Columbia). Region 3 also did not receive timely reports from Pennsylvania (2003 and 2004) and Virginia (2003). However, Region 3 approved a time extension for Virginia due to database delays resulting from the change over to a new I/M communications contractor.
Table 2-3: Summary of Key I/M Reporting Requirements for Region 3 States for 2003 and 2004
State/ Program
Calendar Year Date Due
Date Submitted
Submitted Timely a
All Reports
Received Missing Reports Delaware 2003 July 2004 N.R. No No Not submitted as of March 2006
2004b July 2005 Feb. 2006 No No Missing Quality Assurance and Quality Control Reports
District of Columbia
2003 July 2004 Nov. 2005 No No Missing Quality Assurance and Quality Control Reports, and enforcement reports.
2004 July 2005 August 2006 b
Nob No Missing Quality Assurance and Quality Control Reports, and enforcement reports.b
Maryland 2003 July 2004 July 2004 Yes Yes None (but did not report on required Test Data Report category of Vehicles with no known final outcome (regardless of reason)
2004 July 2005 July 2005 Yes Yes None - Made significant changes over 2003 including adding section in report on vehicles with no known final outcome (after our May 2005 discussions with the State) and included schedules for first and subsequent OBD retest results c
Pennsylvania 2003 July 2004 April 2005 No Yes None missing 2004 July 2005 Feb. 2006 No Yes None missing
Virginia 2003 July 2004 Mar. 2005 Yesd Yes None missing 2004 July 2005 June 2005 Yes Yes None missing
a. Reports due by July of each year for prior calendar year. EPA regulations require I/M programs to submit test data, qualityassurance, quality control, and enforcement reports to EPA by July of each year. b As of March 2006, District of Columbia had not submitted report for 2004 data. District officials confirmed in May 2006 they hadnot submitted a report for 2004 and agreed with Region 3 to first focus on submitting a 2005 report and then work on prior reporting. The District of Columbia provided the 2004 report after our field work ended and after issuance of our draft report. c Maryland first reported vehicles with no known final outcome in 2004. According to Maryland officials, 2004 was the first yearMaryland was able to fully match the vehicle testing data with the vehicle history data in order to accurately report this category.d Virginia requested and received an extension from Region 3 because it changed contractors and was in the process of transferring data to a new database.
Source: Annual reports submitted to Region 3 by its States
Significant Issues Identified in District of Columbia Annual Report
The District of Columbia’s 2003 test data report identified potentially significant problems with its I/M program and accuracy of reported data, including that it could not demonstrate compliance with SIP requirements. The report contained documents related to the current status of the program and planned corrective actions, including a discussion of data problems that impacted the accuracy of the annual report.
22

The 2003 District of Columbia test data report provided incomplete details on I/M program effectiveness because it did not include information for all tested vehicles. The 2003 I/M data report shows only about 70,000 initial tests. District officials acknowledged the initial inspection counts reported in the 2003 report were not based on the complete dataset. During 2003, the District’s I/M program implemented the OBD test protocol on an advisory basis (i.e., if a vehicle fails the OBD test, it is given an IM240 test, which is then used as the basis for making a pass/fail determination). There were nearly 30,000 OBD initial tests during 2003, and this OBD data was not included in the 2003 annual report submitted to EPA. This missing data limited our ability to perform a detailed evaluation of the District’s I/M program as we did for Maryland and Virginia. We also did not review the District’s waiver rate due to these data issues.
The 2004 report provided after our field work ended and after issuance of our draft report also did not contain complete information. The District agreed with Region 3 to first focus on submitting a more complete 2005 report and then work on prior reporting. The District of Columbia provided the 2005 report after our field work ended and after issuance of our draft report. This report does contain more information, such as information related to vehicles with no known final outcome. We did not review this report in detail. More accurate and complete reporting is needed to provide EPA with information related to the effectiveness of the program and progress made by the District.
Challenges in Determining Final Outcome of Failing Vehicles
Some of the “vehicles with no known final outcome” identified in State reports and during our review of Maryland and Virginia may be retired or moved out of the I/M area. However, neither Region 3 nor the States know how many of these are no longer on the road. According to Region 3:
There will always be some level of vehicles with no known final outcome, due to some vehicles being retired, sold out of program area, temporarily taken off the road, those receiving legal extensions, etc. It is incumbent upon EPA and the I/M program to find noncompliant vehicles that are still in operation. However, it is unclear what portion of these State-by-State high percentages are valid (i.e., normal retirement) vs. noncompliers. I/M programs do not necessarily capture data to easily identify these noncompliers, and State motor vehicle databases often lack tools to readily track them as well. Investigation can be time consuming, difficult, or costly.
23

In its 2001 report, Evaluating Vehicle Emissions Inspection and Maintenance Programs, the National Academy of Sciences’ National Research Council22
reported that:
Studies also show that between 10% and 27% of vehicles that fail an I/M test never pass the test. Their exact fate has not been well characterized, although some have been found to be still in operation in I/M areas in some states more than a year after their last test.
We acknowledge there are barriers to States knowing the final outcome of a percentage of vehicles. Currently, States do not have access to other States’ information to determine whether vehicles have moved to other States. The U.S. Department of Transportation does not maintain a complete database of VINs, but most States have the information for vehicles in their jurisdiction. Also, States with I/M programs are required to obtain VINs as part of their inspection program, and if they would share this information it would assist in tracking the final outcome of initially failing vehicles. Organizations such as the State and Territorial Air Pollution Program Administrators/Association of Local Air Pollution Control Officials (STAPPA/ALAPCO), the Environmental Council of States, or the National Conference of State Legislatures may be able to assist in establishing reciprocity agreements for sharing such vehicle information. We recognize that cost considerations may impact a State’s decision to further follow up on vehicles with no known final outcome.
This is also a key issue for OBD-equipped vehicles, since the OBD fleet (1996 and newer) is just now starting to operate past the 8-year/80,000 mile warranty period on the major emissions control components. For example, in Maryland, failure rates start to increase above the average 10 percent in the 1997 model year. Failure rates for pre-OBD-equipped vehicles are even higher, ranging from 10 percent (1995 model year) to 36 percent (1984 model year) according to Maryland’s 2004 report. If failing vehicles are identified, the States will still need to ensure that these vehicles are adequately repaired and pass a subsequent test or are given a waiver, retire, etc.
Another challenge involves covert audits (i.e., using unidentified vehicles “rigged” to fail). States are required to perform regular covert audits. However, some have struggled to meet the quality assurance/quality control standards for covert audits for newer technology vehicles, particularly OBD-equipped vehicles, due to the difficulties of setting OBD vehicles to fail an I/M test. Some State officials told us that either the requirements should be changed or EPA should provide further guidance on how to perform covert audits. Appendix F provides more details on this issue.
22 Committee on Vehicle Emission Inspection and Maintenance Programs, Board on Environmental Studies and Toxicology, Division on Earth and Life Studies, Transportation Research Board, National Research Council, Evaluating Vehicle Emissions Inspection and Maintenance Programs, 2001.
24

States Have Made Efforts to Increase Effectiveness of Repairs
Although our work identified areas for improvement, including the need to track the final outcome of failing vehicles, both Maryland and Virginia have made efforts to increase repair effectiveness. These efforts encourage effective repairs of failing vehicles by providing consumers with information related to repair technicians and setting standards for those technicians. Repair of failing vehicles is essential to a successful I/M program, since programs will only be effective if they can locate high emitters and repair them. As a means to address the need for effective repairs, Maryland and Virginia have done the following:
• MDE operates voluntary certification programs for repair facilities and repair technicians, and funds extensive training for certified technicians. Since Maryland does not require motorists to submit repair data except when applying for a waiver, it does not track repair facility success rates. MDE requires three ASE (Automotive Service Excellence) certifications for their certification program, including the advanced engine performance specialist certification. There are 225 certified stations with about 500 Master Certified Emissions Technicians in Maryland. Certified stations are promoted by MDE and provided incentives, such as the ability to advertise their repair services at State stations and on the MDE Website. MDE also provides certified repair facilities in Maryland with the latest information about repair problems or issues with certain vehicle makes/models. MDE provides this information through materials such as the Motor Information Systems, “OBD Drive Cycle Guide,” and news/technical bulletins.
• VA DEQ also operates a certified repair technician program. To facilitate motorists getting proper repairs, VA DEQ provides a listing of certified repair technicians, along with a locator, on its Website. In the near future, it also plans to include repair information, including costs, for owners whose vehicles need repairs. Further, VA DEQ implemented a remote sensing program in May 2006 that utilizes repair assistance. Repair assistance can assist low-income owners in getting needed repairs for vehicles identified as high emitters by the remote sensing program.
Conclusions
Vehicles that are poorly maintained or have malfunctioning emission controls are significant contributors to air pollution, especially in major urban areas. As such, it is important that EPA ensures that I/M programs demonstrate that they are using the test methods they committed to use in their SIPs, testing all vehicles that should be tested, not exceeding their waiver rates, and ensuring that failed vehicles are effectively repaired. Under the SIP process, States have flexibility in deciding the extent of emissions reductions that will be achieved from various sources, including on-road mobile sources. States need to demonstrate that their I/M programs are obtaining emissions reductions equal to or better than the
25

performance standard for the program before their I/M programs can be incorporated into an approved SIP. However, once approved by EPA, these SIPs become requirements. Failing to meet the vehicle I/M program requirements may mean that States will have to place greater requirements on other emission sources, such as industrial facilities where emissions are more readily measured, to achieve State clean air attainment goals.
By ensuring that emissions controls are functioning properly, I/M programs are a key component of EPA as well as State and local strategies for addressing mobile source pollution in major urban areas. Early indications are that this is also an important issue for OBD-equipped vehicles, as these OBD vehicles are just now starting to operate past the 8-year/80,000 mile warranty period for major emissions control components. Despite some implementation problems, States have achieved emissions reductions from mobile sources. Maryland and Virginia both reported significant reductions in mobile source emissions despite substantial increases in vehicle miles traveled. According to I/M program officials in these States and at EPA, vehicle I/M programs have been a significant part of these reductions.
Recommendations
We recommend that the Assistant Administrator for Air and Radiation work with EPA Region 3 to:
2-1 Ensure that the District of Columbia I/M program (a) restores IM240 testing as required by its SIP; and (b) continues to work with the District to ensure it repairs its data issues and provides accurate and reliable reporting in the future.
2-2 Require that the Maryland I/M program (a) achieve the waiver rate in its approved SIP, or continue to work with EPA to adjust the Maryland SIP and related emissions credits to reflect their actual waiver rate; and (b) adjust its waiver limit for inflation as required by the Clean Air Act Amendments of 1990, Section 182 (3)(C)(iii), or seek a variance from EPA to adjust its SIP and related emissions credits to reflect the loss in emissions credits from the non-inflationary adjusted waiver limit.
We recommend that the Assistant Administrator for Air and Radiation encourage EPA regions and the States to:
2-3 Follow up on vehicles with no known final outcome to a degree proportional to the problem, using mechanisms such as a memorandum to regions to encourage States to: (a) develop VIN-based vehicle databases for vehicles failing I/M tests with no known final outcome, and (b) establish reciprocity agreements allowing the sharing of such data among and between I/M programs.
26

Agency Comments and OIG Evaluation
The Agency generally agreed with Recommendations 2-1 and 2-2 and responded that, as a general matter, OIG's findings do not contradict the OTAQ's experiences with regard to the vehicle I/M program. The Agency did not concur with our original Recommendation 2-3, stating that it lacked the legal authority and resources to act on this recommendation. We agree with the Agency’s proposed actions for Recommendations 2-1 and 2-2, and we revised Recommendation 2-3 based on the Agency’s comments. We believe that it is important for the Agency to encourage States with a significant number of vehicles with no known final outcome to follow up on these vehicles and for the Agency to encourage other States to assist in this effort.
The Agency also provided technical comments related to Chapters 1, 2, and 3 of the report. We made changes based on these comments as appropriate. The Agency’s complete written response is in Appendix J. Our evaluation of those comments is in Appendix K.
We also provided copies of our draft report to the District of Columbia, Maryland, and Virginia I/M programs. We received comments from all three programs. Virginia and the District generally agreed with our findings. The District also provided us with copies of the I/M reports that they provided to Region 3 subsequent to issuance of our draft report. We revised the report to reflect this subsequent information. Maryland provided comments to the draft report and we made changes to address its comments as appropriate. Appendix L provides a summary of the responses from the District of Columbia, Maryland, and Virginia I/M programs and our analysis of their responses.
27

Chapter 3Increased EPA Oversight and Technical Assistance
Needed for Vehicle I/M Programs
Our nationwide survey of all 10 EPA regions, as well as our detailed work in Region 3, indicated that EPA has not been obtaining sufficient information to ensure that poorly performing vehicles are identified and, when identified, effectively repaired. EPA has exercised limited oversight over I/M programs, has not held I/M programs accountable for meeting commitments, and has not provided sufficient technical assistance. Most EPA regions did not always obtain required I/M reports and, in some cases, even know whether they were submitted. As required by Title 40, Code of Federal Regulations, Section 51.366, I/M reports are necessary to determine whether I/M programs are meeting their SIP commitments. Also, EPA regions only audited/evaluated 9 of the 34 I/M programs, and reduced resources for overseeing and assisting I/M programs. As a result, EPA does not have reasonable assurance that emission reductions claimed by some I/M programs have been achieved, even though I/M programs are a key component of EPA’s overall strategy for controlling vehicle emissions in major urban areas. Although I/M programs are implemented by State and local agencies, EPA oversight and technical assistance are important in ensuring program effectiveness.
Survey of EPA Regions Suggests Limited Oversight of I/M Programs
We surveyed all 10 EPA regions to obtain information on each State I/M program, as well as the information available to EPA regarding I/M program effectiveness. This included background information for each program (program type, test type, testing frequency, enforcement type, and basic program history); whether States submitted required reports from 1999 to 2005; whether the region had audited or evaluated the programs since 1999; and whether the regions allocated sufficient resources to oversee I/M programs. We also requested similar budgeting and staffing information from OTAQ. Based on the responses to our survey covering all 34 I/M programs, we found that:
• EPA regions received the required reports in a timely manner for only 11 programs;
• EPA regions did not receive the required reports for 8 of the programs; • EPA regions were unsure whether required reports were submitted for
6 programs; • EPA regions had not performed audits/evaluations of 25 of the programs;
and • EPA reduced the level of resources devoted to overseeing and assisting
I/M programs.
28

According to EPA officials, their attention had largely focused on approving SIPs and ensuring proper start-up of State I/M programs, with less emphasis on the day-to-day oversight of whether I/M programs operated effectively. The following sections discuss what we learned from the responses to our survey and discussions held with OTAQ, regions, and States. Appendix I lists the oversight questions we asked in our survey of the 10 EPA regions.
Mixed Results in Obtaining Annual Reports
To evaluate the performance of I/M programs, EPA’s I/M regulations call for EPA to obtain and analyze I/M reports. According to Title 40, Code of Federal Regulations, Section 51.366, Subpart S: Inspection and Maintenance Requirements:
Data analysis and reporting are required to allow for monitoring and evaluation of the program by program management and EPA, and shall provide information regarding the types of program activities performed and their final outcomes, including summary statistics and effectiveness evaluations of the enforcement mechanism, the quality assurance system, the quality control program, and the testing element.
EPA requires the following four key reports to be submitted from authorized I/M programs:
� Annual Test Data Report: Number of vehicles tested by model year and type, failure rates, pass rates for retest, waiver rates, and vehicles with no known outcome.
� Annual Quality Assurance Report: Number of testing lanes in operation receiving overt and covert audits, and results of these audits.
� Annual Quality Control Report: Number of equipment audits by station and lane, number and percentage of stations that failed equipment audits, and number and percentage of stations and lanes shut down as a result of equipment audits.
� Annual Enforcement Report: Compliance information for various types of enforcement programs operated by States (registration denial, computer matching, and sticker-based enforcement programs).
Regions responded that, in the last 5 years (1999-2004), 11 of the 34 I/M programs submitted timely reports, 14 programs had either never submitted the required reporting or the regions were unsure whether the reports were submitted, and 4 programs submitted reports but they were not timely (typically 1-2 years late in the region we examined). The remaining 5 programs had mixed results
29

Perc
enta
ges
(some reports from these programs were submitted timely but some reports were not received). Appendix G provides details on the 34 I/M programs. Chart 3-1 summarizes EPA regional responses regarding these required reports.
Chart 3-1: Responses from Regions Regarding Key I/M Reports Received, 1999-2004
100%
90%
80%
70%
60%
40%
20%
17%
23%
37%
14%
20%
29%
34%
11%
23%
31%
34%
14%
23%
29%
Never Received Uncertain
50% Late Timely
40%
30%
20%
10%
0% Test Data Reports Quality Control Reports Quality Assurance Reports Enforcement Reports
Required Reports
Source: OIG analysis of EPA regions’ responses to OIG survey
We followed up with some of the regions to inquire about why these reports were not received. One region noted that resources were limited. Another region noted that, over time, they have developed working relationships with I/M program staff that they believe are appropriate considering the type of I/M program operated. Three regions asserted that while I/M data reporting is important, they believe keeping in regular contact with States on specific program implementation is equally beneficial. While maintaining close contact with the individual I/M programs may be informative, we believe the required reporting is necessary to provide EPA with the data and information that can be analyzed to assure that individual programs are functioning effectively. These reports are also required by EPA regulations, and the CAA provides EPA with various mechanisms to ensure achievement of State I/M program SIP commitments, including sanctions. Additionally, as noted in Chapter 2, these reports provided important information regarding the operation of the I/M programs we reviewed and identified issues that should have been addressed earlier.
30

Some Regions Did Not Perform Audits/Evaluations or Assess Data Completeness of Vehicle I/M Programs
Regional offices indicated that from 1999 to 2004 they performed audits and/or program evaluations of only 9 of the 34 Vehicle I /M programs. While two regions (2 and 7) had conducted audits/program evaluations and assessed the completeness of the data provided by State programs, three regions (3, 5, and 10) acknowledged they had not assessed the completeness and accuracy of their State vehicle I/M data or performed audits/program evaluations. We also had concerns about potential incongruities in some regional responses to our survey. For example, two regions (1 and 8) said they assessed the completeness and accuracy of their State data by reviewing reports submitted; however, these regions also responded that they never received some of those reports or were unsure if some of the reports were ever received. Appendix H provides details on EPA regions’ audits and/or program evaluations of the 34 vehicle I/M programs.
We inquired about why some of the regions did not assess data accuracy, as well as how the data could be assessed and the programs evaluated if the required reports were not submitted. Details on some of the responses follow:
• Regions 1 and 5 said that EPA’s not formally auditing I/M programs should not be confused with not evaluating them. These regions indicated they are in regular and close contact with State officials regarding their emission testing programs, and they work proactively to help resolve issues as they arise and ensure programs work as expected.
• Region 3 officials explained that they have not attempted to assess the accuracy of the data submitted as part of States’ required I/M data summary reports, and indicated that as the State programs matured they generally expected less, not more, oversight to be necessary. They noted that Region 3’s available I/M resources were focused on implementing and approving State programs and adding OBD checks to the I/M program. Their focus on these activities, coupled with shifting program priorities, has forced the region to reduce its I/M oversight role. They further responded that incomplete and missing reports have been noted internally, but they have not yet made appreciable efforts to rectify the deficiencies. The region noted it has not performed an audit/evaluation of their States’ I/M programs since 1993.
• Region 6 responded that conducting independent audits/evaluations has not been a national priority for EPA regions; therefore, limited resources have not been focused on conducting audits/evaluations of I/M programs.
• Region 9 said that since its oversight abilities were limited, the region did not want to initiate an audit of any State I/M programs without strong reasons.
31

When EPA is not reviewing required I/M reports, assessing data accuracy and completeness, and evaluating programs, it is not ensuring that State I/M programs are operating effectively, meeting their commitments, and achieving the emission reductions committed to in their SIPs.
Decreased Level of Technical Assistance and Support
In addition to limited oversight, EPA has not provided the level of technical assistance and support desired by State and local agencies, which can also hamper I/M Program effectiveness. Twenty-eight States/jurisdictions have expressed a desire for increased technical support and guidance from EPA on a national level. States, with the assistance of STAPPA/ALAPCO, put together a list of priorities they would like to have addressed by OTAQ. Among the priorities were:
• Updating OBD implementation auditing guidance, including the need for effective covert auditing guidance. As noted in Appendix F, this is needed to enable States to satisfy the SIP requirements regarding vehicle I/M programs.
• Direct, continuous EPA support for OBD I/M technical issues.
• Updating I/M OBD program evaluation guidance to help States conduct effective evaluations. The States have relied on this guidance, so they could be confident in the quality and design of their I/M programs and may claim sufficient emission reductions in fulfilling their SIPs.
Through STAPPA/ALAPCO, 11 programs listed I/M program evaluations as a concern, including whether there will be specific training available for OBD. For example, Maryland officials said they needed guidance from EPA on how to quantify the emissions reductions obtained from OBD testing. OTAQ officials told us that due to competing demands and limited resources, further technical support to address STAPPA/ALAPCO’s priorities has been unavailable.
Until 2005, a Federal Advisory Committee Act (FACA) workgroup provided a forum for I/M programs to share information; however, EPA ended this workgroup after 6 years since its purpose had been met. The FACA workgroup was charged with completing specific work related to the implementation of OBD testing. The workgroup advised EPA on best practices for implementing OBD I/M. Participants on the FACA workgroup also participated in the on-going bi-monthly conference calls headed by EPA staff with representation from States, shared information on OBD technology issues, and allowed participants to ask technical questions concerning tampering and fraud. States explained that without these workgroup conferences, communication with EPA has been hampered and they have begun to question EPA’s commitment to solving OBD implementation problems. One State official noted that the face-to-face quarterly
32

workgroup meetings are irreplaceable. They further explained that since disbanding the workgroup, there has been little contact with OTAQ.
The Agency provided documentation of recent agreements that it made with States in response to our draft report. EPA and STAPPA/ALAPCO co-sponsored an “I/M Summit” in Washington, DC, on May 16, 2006. The purpose of this summit was to discuss many of the State concerns referenced. In followup to that meeting, on June 30, 2006, the OTAQ Director wrote to STAPPA/ALAPCO representatives, affirming support for State I/M programs as well as EPA's commitment to establish a FACA workgroup on "bridging" I/M programs to the future. That letter was followed on July 21, 2006, by a more detailed letter from the director of OTAQ's Transportation and Regional Programs Division listing numerous action items OTAQ had agreed to pursue in support of I/M. Among those commitments, OTAQ agreed to:
• Continue to facilitate bi-monthly conference calls of I/M States to discuss technical issues arising from the implementation of local I/M programs, with a specific emphasis on sharing solutions to technical challenges that have arisen in more than one State;
• Update Appendix D of the OBD Implementation Guidance;
• Share information with the States regarding technical service bulletins, recalls, and other relevant enforcement actions with a direct bearing on I/M program implementation, as appropriate; and
• Review suspected OBD defeat devices and refer to EPA’s Office of Enforcement and Compliance Assurance for possible enforcement action.
EPA Reduced Resources for I/M Oversight
Budget and staffing information from OTAQ and the 10 EPA regions shows that EPA reduced the level of resources devoted to overseeing and assisting I/M programs from 1999 to 2005. Table 3-1 shows the Full-Time Equivalent (FTE) resources EPA allocated to I/M programs since 1999.
Table 3-1: Allocated FTEs for OTAQ and Each Regional Vehicle I/M Program, 1999 to 2005 Fiscal EPA Region Year OTAQ 1 2 3 4 5 6 7 8 9 10 Total a
1999 7.0 2 2 3.0 0.5 <1 1 <1 .25 0.4 .05 18.2 2000 7.0 2 1.7 2.5 0.5 <1 1 <1 .25 0.5 .05 18.0 2001 7.0 2 1.5 2.5 0.5 <1 1 <1 .25 0.4 .05 17.2 2002 6.0 2 1.3 1.5 0.5 <1 1 <1 .25 0.4 .05 15.0 2003 4.0 2 1 1.0 0.5 <1 1 <1 .25 0.4 .05 12.2 2004 4.0 1 1 <1 0.4 <1 1 <1 .25 0.4 .05 11.1 2005 3.0 1 1 <1 0.4 <1 1 <1 .25 0.4 .05 10.1
a Rounded to nearest 0.1
Source: Agency responses to OIG survey of all EPA regions and OTAQ
33

OTAQ officials said the number of FTEs dedicated to I/M program implementation has decreased since 2001 as I/M programs matured, thereby requiring fewer resources. They said that, initially, when the programs began, significant resources were needed to provide technical support and outreach to the States. However, by the end of 2003, they said a significant number of States had successfully incorporated OBD testing into their I/M programs. They noted that these programs then served as a template for the remaining programs. Now that most I/M programs are considered mature, they said that fewer Federal resources are needed to support them.
Conclusions
Although vehicle I/M programs are implemented by State and local agencies, EPA oversight and technical assistance are important in ensuring program effectiveness. Our work suggests that EPA needs to give these programs greater attention. Some regions did not obtain the required I/M program reports from their States nor did they fully analyze the data or evaluate the programs. Further, many States have not received the technical assistance and support they believe they needed to achieve program goals. While there have been competing priorities for resources at EPA, we believe obtaining and analyzing key I/M program data is important to ensure that the programs are operating effectively and achieving the I/M program commitments in their SIPs. Absent such oversight and assistance, the effectiveness of some vehicle I/M programs may be uncertain.
Recommendations
We recommend that the Assistant Administrator for Air and Radiation work with EPA regions to:
3-1 Ensure that all State vehicle I/M program requirements are met, including the key reporting required by Title 40, Code of Federal Regulations, Part 51.366.
3-2 Evaluate vehicle I/M reports and other available information to determine whether the programs are operating effectively, including demonstrating that they achieved the emissions reductions committed to in SIPs.
3-3 Determine whether vehicle I/M programs are using appropriate tests, collecting reliable data, and meeting waiver rates committed to in SIPs.
3-4 Follow up with States on significant issues identified during regional analysis of State reporting and work with these States to correct these issues, as needed.
3-5 Use the mechanisms provided under the CAA to ensure achievement of State vehicle I/M program SIP commitments, or require States unable to
34

do so to revise their SIP commitments to reflect the actual I/M program operations.
We also recommend that the Assistant Administrator for Air and Radiation work with OTAQ to:
3-6 Continue to provide technical leadership and guidance to States and regional offices to address OBD implementation issues, including updating OBD I/M implementation guidance, and providing technical assistance to I/M programs to help resolve OBD I/M issues using mechanisms such as bi-monthly conference calls and the planned FACA workgroup.
Agency Comments and OIG Evaluation
EPA generally concurred with our recommendations. The Agency stated that it is encouraged to see that many of our recommendations are consistent with commitments the Agency has already made as part of a May 16, 2006, summit on I/M program issues, which was attended by OTAQ and representatives from over 25 I/M States. OTAQ also followed up that meeting with two letters affirming support for State I/M programs as well as EPA's commitment to establish a FACA workgroup on "bridging" I/M programs to the future, and listed numerous action items that OTAQ agreed to pursue in support of I/M programs. The Agency also responded that it is pleased to see that the OIG affirms the evolving but continued importance of I/M programs as a means by which State and local agencies attain and maintain their air quality goals and protect public health. We are encouraged by the recent commitments made by OTAQ and the States. Information has been added in Chapter 3 related to the May 2006 “I/M Summit,” and the June and July 2006 followup letters from OTAQ to STAPPA/ALAPCO. We have also modified Recommendation 3-6 based on these events.
The full Agency response is in Appendix J. Our evaluation of those comments is in Appendix K.
35

Status of Recommendations and Potential Monetary Benefits
POTENTIAL MONETARY RECOMMENDATIONS BENEFITS (in $000s)2
Rec. No.
Page No. Subject Status1 Action Official
Planned Completion
Date Claimed Amount
Agreed To Amount
2-1
2-2
2-3
3-1
3-2
3-3
26
26
26
34
34
34
Work with EPA Region 3 to ensure that the District of Columbia I/M program (a) restores IM240 testing as required by its SIP, and (b) continues to work with the District to ensure it repairs its data issues and provides accurate and reliable reporting in the future.
Work with EPA Region 3 to require that the Maryland I/M program (a) achieve the waiver rate in its approved SIP, or continue to work with EPA to adjust the Maryland SIP and related emissions credits to reflect their actual waiver rate; and (b) adjust its waiver limit for inflation as required by the Clean Air Act Amendments of 1990, Section 182 (3)(C)(iii), or seek legal variance from EPA to adjust its SIP and related emissions credits to reflect the loss in emissions credits from the non-inflationary adjusted waiver limit.
Encourage EPA regions and the States to follow up on vehicles with no known final outcome to a degree proportional to the problem, using mechanisms such as a memorandum to regions to encourage States to: (a) develop VIN-based vehicle databases for vehicles failing I/M tests with no known final outcome, and (b) establish reciprocity agreements allowing the sharing of such data among and between I/M programs.
Work with EPA regions to ensure that all State vehicle I/M program requirements are met, including the key reporting required by Title 40, Code of Federal Regulations, Part 51.366.
Work with EPA regions to evaluate vehicle I/M reports and other available information to determine whether the programs are operating effectively, including demonstrating that they achieved the emissions reductions committed to in SIPs.
Work with EPA regions to determine whether vehicle I/M programs are using appropriate tests, collecting reliable data, and meeting waiver rates committed to in SIPs.
O
O
O
O
O
O
Assistant Administrator for Air and Radiation
Assistant Administrator for Air and Radiation
Assistant Administrator for Air and Radiation
Assistant Administrator for Air and Radiation
Assistant Administrator for Air and Radiation
Assistant Administrator for Air and Radiation
3-4 34 Work with EPA regions to follow up with States on O Assistant Administrator significant issues identified during regional analysis for Air and Radiation of State reporting and work with these States to correct these issues, as needed.
1 O = recommendation is open with agreed-to corrective actions pending C = recommendation is closed with all agreed-to actions completed U = recommendation is undecided with resolution efforts in progress
2 Identification of potential monetary benefits was not an objective of this evaluation.
36

RECOMMENDATIONS POTENTIAL MONETARY
BENEFITS (in $000s)2
Rec. No.
3-5
3-6
Page No.
34
35
Subject
Work with EPA regions to use the mechanisms provided under the CAA to ensure achievement of State vehicle I/M program SIP commitments, or require States unable to do so to revise their SIP commitments to reflect the actual I/M program operations.
Work with OTAQ to continue to provide technical leadership and guidance to States and regional offices to address OBD implementation issues, including updating OBD I/M implementation guidance, and providing technical assistance to I/M programs to help resolve OBD I/M issues using mechanisms such as bi-monthly conference calls and the planned FACA workgroup.
Status1
O
O
Action Official
Assistant Administrator for Air and Radiation
Assistant Administrator for Air and Radiation
Planned Completion
Date Claimed Amount
Agreed To Amount
1
2
O = recommendation is open with agreed-to corrective actions pending C = recommendation is closed with all agreed-to actions completed U = recommendation is undecided with resolution efforts in progress
Identification of potential monetary benefits was not an objective of this evaluation.
37

Appendix A
Details on Scope and Methodology
To assess whether selected enhanced I/M programs have been effective in identifying poorly performing vehicles, and ensuring they are adequately repaired and emission reductions achieved, we obtained and analyzed State reports received by EPA Region 3 from 2001 to 2004. We did this to determine whether Region 3 States were complying with I/M reporting requirements. We analyzed whether States identified significant issues in these reports, such as high rates of reported vehicles with no known final outcome and waivers. We also compared information in these reports with EPA-approved SIP requirements. Within Region 3, we focused on three programs (Maryland, Virginia, and District of Columbia) for a more in-depth review. These three programs collectively address vehicle pollution for the Washington, DC major metropolitan area. We performed site visits and conducted detailed reviews in Maryland and Virginia. We interviewed key vehicle I/M personnel in Maryland, Virginia, and the District of Columbia.
Region 3 and the District of Columbia metropolitan area were chosen for our case study because of several factors, including that the Washington, DC area was one of three areas (Atlanta, Georgia; Baton Rouge, Louisiana; and Washington, DC) elevated from “serious” to “severe” nonattainment because of its failure to attain the 1-hour standard by 1999, as discussed in a prior OIG report.23 We also wanted to focus on States that operated enhanced programs in serious or higher nonattainment areas where emissions from mobile sources were a significant contribution. The Washington, DC area also provided the opportunity to review various types of programs (such as centralized and decentralized programs and different testing methods).
For Maryland and Virginia, we conducted tests in accordance with the Government Accountability Office Guidance Document GAO-03-273G - Assessing the Reliability of Computer-Processed Data, as defined in Section 6: Taking the First Steps, Performing Initial Testing. For Maryland, there were not a significant number of errors found during initial testing. Similarly for Virginia’s data, we found that the initial testing of data to be sufficiently reliable. As a result, we decided that both sets of data were reliable enough to use for our evaluation of whether initially failed vehicles were effectively repaired. We did identify that we could not rely on the mileage included in the Maryland data to assess vehicle miles traveled for vehicles that were re-tested. This occurred because the data was in thousands of miles and not always recorded accurately by the vehicle inspectors. For example, the mileage for the retest was inconsistent: sometimes greater than, sometimes the same as, and at times lower than the first test.
In our discussions with the District of Columbia’s Air Quality Division personnel, the I/M program staff noted that the District of Columbia’s vehicle inspection program had recently faced equipment and database problems. Because of the database and equipment problems, we
EPA OIG Report No. 2004-P-00033, EPA and States Not Making Sufficient Progress in Reducing Ozone Precursor Emissions In Some Major Metropolitan Areas, dated September 29, 2004.
38
23

determined that a detailed review of the District of Columbia’s I/M data would not provide us with sufficiently adequate information to perform analyses similar to what we performed in Maryland and Virginia. In lieu of these analyses, we confirmed key information from the District’s reports through interviews sufficient for us to understand the current status of the program. We included general information in the report related to annual reports for the District of Columbia that the District provided after the completion of our field work.
To determine whether EPA’s oversight has ensured that enhanced I/M programs are achieving program goals in a timely manner, we developed and administered a Lotus-based survey to all regions. The survey was initially field-tested in Region 3 and discussed with OTAQ. Information gathered included 25 questions relating to the information regions would need to effectively oversee delegated I/M programs. This included background information for each of the 33 States and the District of Columbia with I/M programs (year program began, type of program, testing type and frequency, and enforcement type). Additionally, we asked whether States have submitted the key required reports from 1999 to present, and whether the Region has audited/evaluated the programs since 1999. Questions about regional staffing and other information on I/M program effectiveness were also solicited. Responses received related to EPA’s oversight are summarized in Appendices G and H. The information obtained was not independently verified by OIG and some of the information may be used for future OIG evaluations.
Our work contained the following limitations: we did not evaluate the effectiveness of stationary and area source emission reduction efforts; we did not address the ozone transport issue; and we only looked at fleet turnover as it related to the scope and objectives of this evaluation. Our evaluation was limited to only a general overview of regions other than Region 3.
To gain knowledge of the EPA’s vehicle I/M Program’s design and its associated enforcement, we reviewed policy and guidance documents, including:
� Federal Register Criteria, Title 40, Code of Federal Regulations, Parts 51.350 to 51.373, including Part 51.366 - EPA Guidance on State Annual and Biennial Reporting
� Sections 182 (c) and 184 requirements of the 1990 CAA Amendments for enhanced I/M programs � Office of Air and Radiation’s Final Strategic Plan for 2006-2008 � National Highway Designation Act of 1995 � Vehicle I/M policy documents provided by OTAQ � SIPs for Region 3 Selected States’ (District of Columbia, Maryland, and Virginia [combined]),
I/M portion only, to review waiver rates, compliance rates, model years tested, types of tests, and mobile source contribution to emission reductions
� Region 3 State reports: o Delaware (2001 and 2004) o District of Columbia (2001, 2003, and 2004) o Maryland (2003 and 2004) o Virginia (2002, 2003, and 2004) o Pennsylvania (2002, 2003, and 2004)
We also reviewed the Websites of the Region 3 States with vehicle I/M programs (Maryland, Virginia, Delaware, and Pennsylvania, plus the District of Columbia); and various Websites for EPA, the Government Accountability Office, and State environmental agencies. We also did
39

Website reviews of external stakeholder sites to gather background information and details on pertinent studies. We obtained the status of State I/M programs from OTAQ.
We interviewed staff in the following offices:
� Environmental Protection Agency: • OTAQ • Region 3 Office of Air Programs • Survey to all 10 Regions and e-mailed followup questions, as needed
� Maryland Department of the Environment: Air & Radiation Management Administration - Mobile Sources Control Program
� Maryland Department of Transportation: Maryland Motor Vehicle Administration and its Vehicle Emissions Inspection Program Contractor
� Virginia Department of Environmental Quality: Mobile Source Operations Section � District of Columbia: Department of Health, Regulatory Affairs Section
We reviewed relevant reports, including:
Environmental Protection Agency � Evaluation of On Board Diagnostics for Use in Detecting Malfunctioning and High Emitting
Vehicles (August 2000 – EPA 420-R-00-013) � Analyses of the OBDII Data Collected From the Wisconsin I/M Lanes (August 2000 – EPA 420-
R-00-014) � Effectiveness of OBDII Evaporative Emission Monitors – 30 Vehicle Study (Revised October
2000 – EPA 420-R-00-018) � Summary and EPA Response to the National Research Council Report, “Evaluating Vehicle
Emissions Inspection and Maintenance Programs” (2001) EPA Office of Inspector General
� Final Report of Audit on the Vehicle Inspection/Maintenance Program (1991- Report Number E1KAFO-03-0269-1100359)
Government Accountability Office � EPA’s Inspection and Maintenance Program-Limited New Data on Inspection and Maintenance
Program’s Effectiveness (1996 - GAO/RCED-96-63) � Inspection and Maintenance Contracts and Grants (1996 - GAO/RCED-96-250R) � Environmental Protection Agency: New Motor Vehicles and New Motor Vehicle Engines Air
Pollution Control: Voluntary Standards for Light- Duty Vehicles; Final Rule (1997 -GAO/OGC-97-45 )
� Air Pollution-Limitations of EPA’s Motor Vehicle Emissions Model and Plans to Address Them (1997- GAO/RCED-97-210)
� Environmental Protection Agency: Control of Emissions of Air Pollution From Highway Heavy-Duty Engines (1997- GAO/OGC-98-9)
� Motor Vehicles Inspection Programs - Delays in Motor Vehicle Inspection Programs Jeopardize Attainment of the Ozone Standard (1998- GAO/RCED-98-175)
� EPA: Control of Air Pollution from New Motor Vehicles–Tier 2 Motor Vehicle Emissions Standards and Gasoline Sulfur Control Requirements (2000 - GAO/OGC-00-22)
� Environmental Protection Agency: Control of Emissions of Air Pollution from 2004 and Later Model Year Heavy-Duty Highway Engines and Vehicles; Revision of Light-Duty On-Board Diagnostics Requirement (2000 - GAO/OGC-01-7)
� Environmental Protection Agency: Control of Air Pollution from New Motor Vehicles: Heavy-Duty
40

Engine and Vehicle Standards and Highway Diesel Fuel Sulfur Control Requirement (2001 -GAO-01-338R)
National Academy of Sciences � National Research Council Report - Evaluating Vehicle Emissions Inspection and Maintenance
Programs (2001- ISBN 0-309-07446-0)
To assess internal controls, we reviewed the Office of Air and Radiation’s fiscal year 2004 Integrity Report; the Office of Management and Budget’s Program Assessment Rating Tool for mobile source standards and certification, and for the air toxics program; and applicable laws and regulations for the I/M program as noted above. We did not identify internal control weaknesses.
41

Appendix B
Human Health and Environmental Impacts of Vehicle Emissions
Vehicle emissions can endanger human health, damage crops and forests, damage building materials, and impair visibility. Ozone and photochemical smog, benzene, polycyclic aromatic hydrocarbons, and particulate matter are among the many harmful pollutants generated by vehicle traffic. Vehicles also produce 21 air toxics, including benzene, 1,3 butadiene, MTBE, formaldehyde, and acetaldehyde. Health effects from vehicle emissions occur at a range of levels. Studies have shown that vehicle emissions can have adverse effects on the respiratory and immune system of individuals in direct contact, and can cause cancer in human beings. While many inhaled pollutants have direct respiratory consequences, others affect the heart or nervous system. Prolonged exposure to vehicle emissions can result in a significant increase in mortality and morbidity. There is a statistical relationship between chemical constituents in gasoline vehicle exhaust and toxicity, and some studies suggest that roadside air pollution can cause DNA damage through the addition of these polluting chemicals to the DNA structure.
Although emissions of the six criteria pollutants (sulfur dioxide, nitrogen dioxide, CO, ozone, fine and coarse particulate matter, and lead) have decreased in the United States over the last three decades, approximately half of U.S. citizens still live in nonattainment areas for one or more of the six criteria pollutants (see map below).
Number of National Ambient Air Quality Standards Pollutants by County at Nonattainment Levels, as of May 2003
Source: EPA
In major urban areas, concentrations of three criteria pollutants (CO, nitrogen dioxide, and fine particulate matter [PM-2.5]) are generally greatest on or near high traffic freeways, congested streets, and confined areas such as tunnels and parking garages. Vehicle emissions in these areas have high concentrations of pollutants, which can cause the adverse health effects described above.
42

Appendix C
States/Areas that Operated I/M Programs in 2005 EPA
Region State Program Type Enforcement Typea
1 Connecticut Decentralized/High Enhanced Registration Denial, Computer Matching, Sticker Based
Maine Decentralized/OTR Low Enhanced Sticker Based Massachusetts Decentralized/High Enhanced Registration Denial, Computer Matching,
Sticker Based New Hampshire Decentralized/OTR Low Enhanced Computer Matching, Sticker Based Rhode Island Decentralized/High Enhanced Registration Denial, Computer Matching,
Sticker Based Vermont Decentralized/OTR Low Enhanced Sticker Based
2 New Jersey Centralized /Decentralized/ High Enhanced Sticker Based New York (Metro) New York (Upstate)
Decentralized/High Enhanced
OTR/Low Enhanced
Registration Denial, Computer Matching, Sticker Based Registration Denial, Computer Matching, Sticker Based
3 Delaware Centralized/Low Enhanced Registration Denial District of Columbia
Centralized/High Enhanced Registration Denial
Maryland Centralized/High Enhanced Registration Denial Pennsylvania Decentralized; Philadelphia High Enhanced,
Pittsburgh Low Enhanced Sticker Based
Virginia Decentralized/High Enhanced Registration Denial 4 Georgia Decentralized/High Enhanced Registration Denial
Kentucky Centralized/Basic Registration Denial North Carolina Decentralized/Basic Registration Denial Tennessee Centralized/Basic Registration Denial
5 Illinois Centralized /High Enhanced Computer Matching/Vehicle Registration and Drivers License suspension
Indiana Centralized /High Enhanced Registration Denial Ohio Centralized/Low Enhanced Registration Denial Wisconsin Centralized/High Enhanced Registration Denial
6 Louisiana Decentralized/Low Enhanced Sticker Based New Mexico Decentralized/Basic Sticker Based Texas Decentralized/ Low Enhanced Registration Denial, Sticker Based
7 Missouri Centralized/Basic Registration Denial, 8 Colorado Denver metro area: enhanced/centralized
Colorado Springs, Fort Collins, Greeley: Basic/ decentralized
Registration Denial
Utah Davis County: Hybrid decentralized basic /centralized enhanced Weber/Utah/Salt Lake County: Basic/ decentralized
Registration Denial
9 Arizona Centralized/Basic and High Enhanced Registration Denial California Decentralized/Basic and High Enhanced Registration Denial Nevada Decentralized/Basic and Low Enhanced Registration Denial, Computer Matching
10 Alaska Decentralized/Basic Registration Denial, Sticker Based Idaho Decentralized/Basic Computer Matching Oregon Centralized/Basic Registration Denial Washington Centralized/Low Enhanced Registration Denial
43

a Enforcement Types:
Registration Denial – Defined as rejecting an application for initial registration or re-registration of a used vehicle (i.e., a vehicle being registered after the initial retail sale and associated registration) unless the vehicle has complied with the I/M requirement prior to granting the application.
Sticker Based – Includes the requirement for an easily observed external identifier, such as a windshield sticker or license plate tab that shows whether a subject vehicle is in compliance with I/M requirements.
Computer Matching – Use of a database system that is required to demonstrate that the enforcement mechanism will swiftly and effectively prevent operation of subject vehicles that fail to comply. The system is required to track each vehicle through the steps taken to ensure compliance, including; (a) the compliance deadline; (b) the date of initial notification; (c) the dates warning letters are sent to non-complying vehicle owners; (d) the dates notices of violation or other penalty notices are sent; and (e) the dates and outcomes of other steps in the process, including the final compliance date.
Source: OIG analysis based on responses provided by EPA regions to OIG survey
44
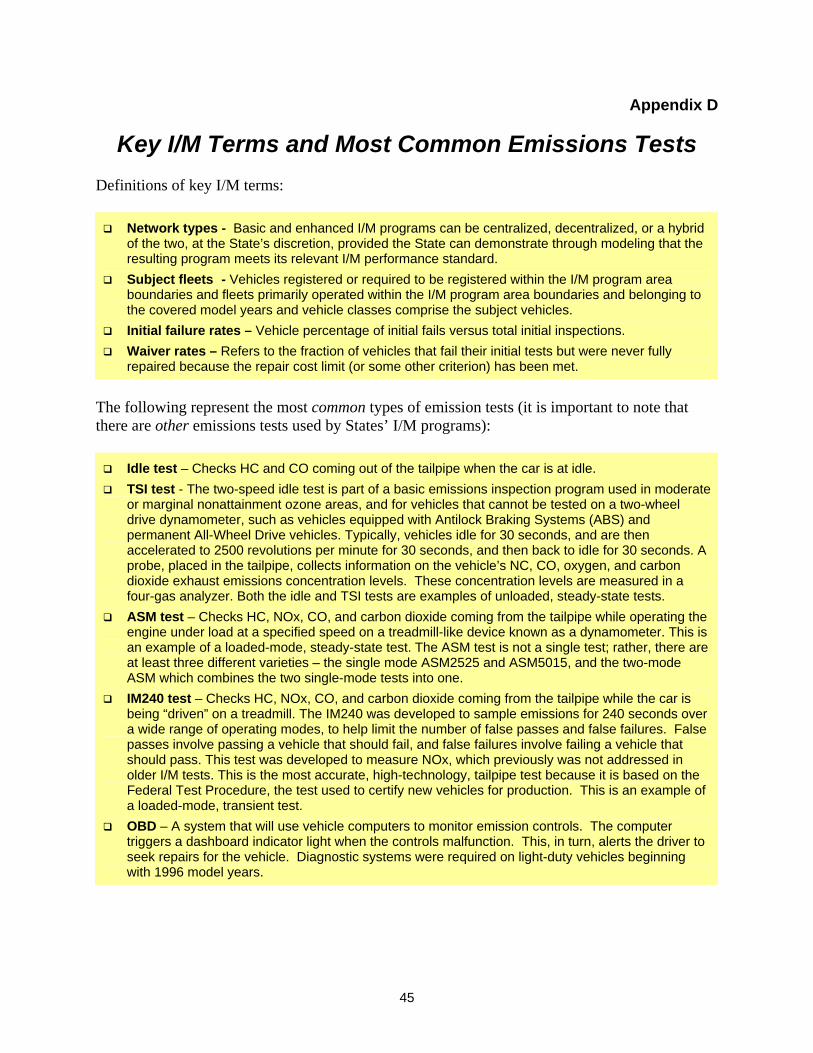
Appendix D
Key I/M Terms and Most Common Emissions Tests Definitions of key I/M terms:
� Network types - Basic and enhanced I/M programs can be centralized, decentralized, or a hybrid of the two, at the State’s discretion, provided the State can demonstrate through modeling that the resulting program meets its relevant I/M performance standard.
� Subject fleets - Vehicles registered or required to be registered within the I/M program areaboundaries and fleets primarily operated within the I/M program area boundaries and belonging to the covered model years and vehicle classes comprise the subject vehicles.
� Initial failure rates – Vehicle percentage of initial fails versus total initial inspections. � Waiver rates – Refers to the fraction of vehicles that fail their initial tests but were never fully
repaired because the repair cost limit (or some other criterion) has been met.
The following represent the most common types of emission tests (it is important to note that there are other emissions tests used by States’ I/M programs):
� Idle test – Checks HC and CO coming out of the tailpipe when the car is at idle. � TSI test - The two-speed idle test is part of a basic emissions inspection program used in moderate
or marginal nonattainment ozone areas, and for vehicles that cannot be tested on a two-wheel drive dynamometer, such as vehicles equipped with Antilock Braking Systems (ABS) and permanent All-Wheel Drive vehicles. Typically, vehicles idle for 30 seconds, and are then accelerated to 2500 revolutions per minute for 30 seconds, and then back to idle for 30 seconds. A probe, placed in the tailpipe, collects information on the vehicle’s NC, CO, oxygen, and carbon dioxide exhaust emissions concentration levels. These concentration levels are measured in a four-gas analyzer. Both the idle and TSI tests are examples of unloaded, steady-state tests.
� ASM test – Checks HC, NOx, CO, and carbon dioxide coming from the tailpipe while operating the engine under load at a specified speed on a treadmill-like device known as a dynamometer. This is an example of a loaded-mode, steady-state test. The ASM test is not a single test; rather, there are at least three different varieties – the single mode ASM2525 and ASM5015, and the two-mode ASM which combines the two single-mode tests into one.
� IM240 test – Checks HC, NOx, CO, and carbon dioxide coming from the tailpipe while the car is being “driven” on a treadmill. The IM240 was developed to sample emissions for 240 seconds over a wide range of operating modes, to help limit the number of false passes and false failures. False passes involve passing a vehicle that should fail, and false failures involve failing a vehicle that should pass. This test was developed to measure NOx, which previously was not addressed in older I/M tests. This is the most accurate, high-technology, tailpipe test because it is based on the Federal Test Procedure, the test used to certify new vehicles for production. This is an example of a loaded-mode, transient test.
� OBD – A system that will use vehicle computers to monitor emission controls. The computer triggers a dashboard indicator light when the controls malfunction. This, in turn, alerts the driver to seek repairs for the vehicle. Diagnostic systems were required on light-duty vehicles beginning with 1996 model years.
45

Details of high enhanced and low enhanced I/M programs follow:
� High enhanced programs typically include some form of dynamometer-based tailpipe testing, evaporative system testing, and OBD testing on vehicles so equipped. As OBD-equipped vehicles (Model Year 1996 and newer) begin to dominate the in-use fleet, it is expected that tailpipe testing will be replaced with OBD-only testing.
� Low enhanced programs typically include some form of idle testing and are very similar to basic I/M programs with the exception that light-duty trucks are also included (as required by the CAA).
46

Appendix E
Details of OIG Analysis of Vehicles in Maryland that Failed Initial 2003 I/M Test
MDE provided us with data for vehicle I/M tests, including information for vehicles that had failed their initial vehicle I/M test in 2003. From the data provided in June 2005, we traced what happened with those vehicles though April 2005. Based on this initial data provided by MDE, approximately 30 percent (41,769 vehicles24) of the 136,980 initial failures reported for 2003 did not pass an inspection nor were given a waiver within the January 2003 to April 2005 timeframe of the data we reviewed. Further, during our field visit to Maryland in September 2005, Maryland provided us with an analysis of initially failing vehicles, and we considered it during our data analysis. The latter MDE analysis showed the following results: 12 percent (16,781vehicles) with no result within 18 months, and 3 percent (4,542 vehicles) that could not be accounted for anywhere in the system. According to MDE, the 9-percent difference (12,239 vehicles) included vehicles that they did not have a result for, but that they could account for as still in the system (e.g., extensions, retest, etc.). MDE’s review also included information from the Maryland Motor Vehicle Administration.
Subsequently, Maryland also provided data from the Maryland Motor Vehicle Administration in November 2005. We matched this data by VIN number with the data previously provided, and determined that for 24,726 (18 percent) vehicles, the final outcome was not clear. These vehicles included the following.
Table E-1: Number and Percent of Vehicles With Unclear Final Outcomes
Reason Number with
Unclear Final Outcome Percent with
Unclear Final Outcome No current record for title 7,945 5.8 Sold 2,234 1.6 Office date change 365 .3 Vehicle has been updated 333 .2 Wait time on return 130 .1 Other 64 0 No VIN match found 13,655 10.0 Total 24,726 18.1 Source: OIG analysis of data provided by Maryland
We also requested explanations for several of the categories shown in their analysis. Maryland provided the following explanations that we considered during our analysis.
No current record for title: In the basic look-up function, if the VIN has been retitled, or becomes inactive, there will be no title record for the given title. In some of the
24 MDE’s analysis showed 46,406, or 34 percent, not passing a retest or receiving a waiver (though April 2005 and before using Motor Vehicle Administration data). While we were not able to completely reconcile these numbers with MDE, reasons for the variance included that we deleted duplicate VIN numbers and there may have been differences in how the data was classified. We used our number since it was lower and therefore showed a lower percentage of vehicles needing additional information related to the final outcome of the vehicle.
47

manual look-ups, we did not follow through by manually keying in the VIN to determine if it had become inactive or had a new title number/owner.
Sold: Vehicles that are sold may still be in the area but not yet retitled in Maryland, or could subsequently have been registered out of State. Unless the sold vehicles are actually retitled in Maryland, there is no way to determine the disposition.
Office date change: This category is used when a long-past-due vehicle needs to have the dates changed to get it back into the system without having to take a makeup test and current test on the same date.
Vehicle has been updated (matched from files without details in Maryland’s analysis): These were matched to the files provided to EPA OIG on November 2, 2005. The files consist of an echo of the No Show list record, with a code included instructing the contractor to delete the record from the No Show list. No data are provided about the reason for deleting the record.
Wait time on return: This category is used when extended test times or equipment problems prevent timely completion of the test.
Other: These are most likely data entry errors, where the entry did not match the list of valid codes. It may very well just be a case of only one character being off and it could not be matched easily by computer.
For the 13,655 vehicles in Table E-1 with no VIN match, Maryland included a category for “Vehicles With No Result (passing retest or receiving a waiver), But Are Not on the Current No-Show List” in the analysis that it provided to us in September 2005. In this analysis, Maryland also provided information for 20 vehicles that were intended to illustrate how the vehicle information is manually recorded and tracked, because a breakdown for all of these vehicles can only be done manually and would be very difficult and time consuming to do for purposes of this OIG study. Our analysis of the 20 vehicles indicates that the information provided by Maryland for 12 of the 20 vehicles was sufficient to establish that they were resolved, and that 8 of the 20 vehicles were not clearly resolved. For the 12 resolved vehicles:
• 7 were resolved in a timely manner • 4 vehicle tags were not turned in until several months after they were suspended • 1 had its tags suspended after more than 9 months
For the 8 vehicles that did not have clear resolution:
• 3 failed multiple inspections and/or were given extensions and appeared to be driven without ever passing a retest – over 18 months after the initial I/M failure
• 3 were sold but had not passed any subsequent inspections since the initial failure • 2 did not have sufficient information provided to determine whether the vehicles were
still in the area
48

Maryland described the issue of these 13,655 vehicles as a documentation issue. Maryland responded to our draft report that all 13,655 vehicles were checked manually over time during the normal course of operations and removed from the no-show list for a valid reason. Maryland further responded that to recreate this list information for the OIG, it would have to go back and manually look up each vehicle a second time, which would be a substantial amount of work. However, as shown above, during our review of the information provided for 20 vehicles, we found that resolution was not always clear or timely. While many of these vehicles may no longer be driven in the area or may be retired, this could not be ascertained from the category descriptions provided. For example, even when tags are suspended, the owner might still drive the vehicle in the area. In tracing the history of one failed vehicle, Maryland found that:
This vehicle was being driven on suspended tags from 6/4/04 until the tags were turned in (2/25/05), for whatever reason - probably renewal denial. We do not send investigators out to pick up tags on VEIP tag suspensions.
Neither the number of these vehicles that are no longer in the area nor the number that may still be in the area could be determined from the data provided. Maryland acknowledged that, even when vehicle tags are suspended, the owner might still drive the vehicle in the area. However, Maryland responded that this problem is broader than any I/M program, e.g., people driving with stolen/forged tags, suspensions due to insurance violations or traffic violations. It further responded that Maryland's procedures must be taken and presented in this broader context.
49

Appendix F
Details on Covert Auditing Guidance States need guidance for how to perform covert audits. Covert audits help ensure that all aspects of the I/M test are performed adequately. States are required to perform regular covert audits in their I/M programs; however, there are difficulties in performing covert audits with vehicles set to fail an emissions tailpipe test. Due to changing vehicle technology, States have requested Agency guidance in setting vehicles to fail to fulfill the requirements for covert audits through STAPPA/ALAPCO. Both Maryland and Virginia met most of the requirements for Quality Assurance and Quality Control programs, including performing extensive overt auditing. However, while meeting other requirements for covert audits, these States did not perform covert audits with vehicles set to fail an emissions tailpipe test. Further, the Delaware and District of Columbia I/M programs did not include the EPA-required Quality Assurance and Quality Control reports in their annual reporting (see Table 2-3 in Chapter 2).
All vehicle I/M programs are subject to quality assurance and quality control checks using both overt and covert audits. Such Quality Assurance and Quality Control procedures can identify possible fraud, incompetence, or other potential problems affecting a program’s effectiveness, and they provide a strong deterrent to test and/or data manipulation. The review includes computerized analysis. Key components of overt and covert audits are listed in Table F-1 below.
Table F-1: Components of Overt and Covert Audits Overt Audits Covert Audits At least two overt audits per test lane must be conducted per year.
Remote visual observation of inspector performance, which may include the use of aids such as binoculars or video cameras, at least once per year per inspector in high-volume stations.
Tests include equipment audits, checks of document security, record keeping, licensing and display information.
Site visits at least once per year per number of inspectors using covert vehicles set to fail.
Evaluation of the inspector's ability to conduct a proper inspection.
For stations that conduct both testing and repairs, at least one covert vehicle visit per station per year including the purchase of repairs and subsequent retesting if the vehicle is initially failed for tailpipe emissions.
Checks of document security, record keeping, licensing, and display information (Quality Control record keeping requirements).
Documentation of the audit, including vehicle condition and preparation, sufficient for building a legal case and establishing a performance record.
Screening or review of inspector and station records is required at least monthly.
Covert vehicles covering the range of vehicle technology groups (e.g., carbureted and fuel-injected vehicles) included in the program, including a full range of introduced malfunctions covering the emission test, the evaporative system tests, and emission control component checks (as applicable).
Process automation requirements, and document security requirements.
Sufficient numbers of covert vehicles and auditors to allow for frequent rotation of both to prevent detection by station personnel.
Calibration gas specifications. Where applicable, access to online inspection databases by State personnel to permit the creation and maintenance of covert vehicle records.
Source: Title 40, Code of Federal Regulations, Parts 51.359 and Part 51.363.
50

How overt and covert audits are carried out in Maryland and Virginia is discussed below.
Maryland
Maryland operates a centralized I/M program, which includes overt audits at stations, and an extensive quality assurance-auditing program. Each test lane undergoes a comprehensive functional audit twice per month. The lane is audited on an unannounced, as-is basis (no calibrations are allowed prior to the audit), so auditing is performed under actual testing conditions. According to Maryland officials, between the twice-monthly audits and the State Customer Service Representatives (including permanent and rotating staff), Maryland maintains a significant on-site presence at all stations.
According to Maryland officials, the State built Quality Assurance into their system, including the following:
• Computer-controlled Quality Assurance/Quality Control checks for all EPA required procedures, including analyzer self-calibration every 2 hours.
• The lanes automatically lock out from testing if a quality control check fails or is not performed on schedule. Testing cannot be performed until the fault is fixed and the quality control check passes.
• Computerized maintenance and repair tracking system that enables the contractor to accomplish repairs quickly with appropriate documentation, so that testing is resumed as soon as possible, lane maintenance is tracked, and trends can be analyzed.
• Testing equipment maintenance technicians employed by the contractor undergo a formal training program and are certified by the State upon successful completion of an exam. Technicians must undergo periodic recertification.
• The State conducts extensive analysis of test data for inconsistencies, anomalies, and trends.
However, according to Maryland, the State does not perform covert audits with a vehicle set to fail (a Title 40, Code of Federal Regulations, Part 51.363 requirement) because the State has built Quality Assurance into the system, as described above. In 2003, Maryland reported that covert performance audits were performed at 5 stations, but 14 stations were not given performance audits. In 2004, covert performance audits were performed at all 19 centralized inspection stations. However, Maryland acknowledged in the 2003 and 2004 data reports to EPA that the State performed no covert audits with vehicles set to fail. Maryland performed covert audits as deemed necessary in response to reports of questionable activities in the test lanes.
Virginia
Virginia operates a decentralized I/M program. VA DEQ follows EPA-recommended quality control measures for overt audits. The State Agency performs four official audits per station per year (two overt and two gas audits). They audit every waiver during their
51

visits to the stations. Overt audits are unannounced; equipment, paperwork, and systems are checked. To prevent operator fraud, VA DEQ has two computer applications that give direct control to the VA DEQ for audits.
For covert audits, however, VA DEQ only partially assesses the quality of the inspection. The State does not test the accuracy of the tailpipe test because it cannot “rig” a vehicle to fail the tailpipe test with the consistency necessary to take an enforcement action. Instead, the State assesses the quality of the inspection by tampering with a component of the vehicle that is required (by State requirements) to be inspected as part of the visual inspection, such as the exhaust gas re-circulation unit and the positive crankcase ventilation valve.
The State provided information on covert audits since 1999, and, as shown in Table F-2, it identified that more than 37 percent of covert audit tests resulted in a false pass (primarily for failure of the inspector to identify a tampered component).
Table F-2: False-positives in Virginia Covert Audits Year Percent False Positives 1999 35% 72/201 2000 22% 32/143 2001 41% 93/225 2002 46% 41/90 2003 31% 27/88 2004 48% 33/69
Average 37.2% 816 Covert Audits
Source: OIG analysis of annual reports submitted by Virginia.
According to VA DEQ, the percentages of reported covert audits resulting in false passing of vehicles is not representative because inspector turnover is high at the stations and because VA DEQ targets some of the covert audits (approximately 20-25 percent of the covert audits) based on reports of suspected activity in the field as recommended by field officers. The remaining covert audits are random. The State added that they have the ability to issue compliance actions with a system to follow through with strict penalties and that these strong enforcement actions can identify those doing a good job or those with poor testing practices. For example, Virginia’s 2004 report listed:
• 9 inspectors and stations that were suspended, fired, or otherwise prohibited from testing as a result of covert audits;
• 6 that were suspended, fired, or otherwise prohibited from testing for other causes; and
• 39 that received fines.
52

Appendix G
Key Reports Received from the 34 Vehicle I/M Programs
EPA Region State
Test Data Report
Quality Control Report
Quality Assurance
Report Enforcement
Report
Additional Required Reportsa
1 Connecticut 2002 (late) 2002 (late) 2002 (late) 2002 (late) No Maine Never Never Never Never No Massachusetts 2003 (late) 2003 (late) 2003 (late) 2003 (late) Yes New Hampshire Never Never Never Never No Rhode Island 2003 (late) 2003 (late) 2003 (late) 2003 (late) No Vermont Never Never Never Never No
2 New Jersey 2004 2004 2004 2004 No New York (Metro) New York (Upstate)
2004 2004
2004 2004
2004 2004
2004 2004
Yes Yes
3 Delaware 2004 (late) Never Never 2004 (late) No District of Columbia 2004 (late) Never Never Never No Maryland 2004 2004 2004 2004 No Pennsylvania 2004 (late) 2004 (late) 2004 (late) 2004 (late) No Virginia 2004 2004 2004 2004 Yes
4 Georgia 2004 2004 2004 2004 Yes Kentucky 2004 2004 2004 2004 No North Carolina 2004 2004 2004 2004 No Tennessee 2004 2004 2004 2005 No
5 Illinois Never Never Never Never Not Sure Indiana Never Never Never Never No Ohio Never Never Never Never Yes Wisconsin Never Never Never Never No
6 Louisiana 2004 2004 2004 2004 Yes New Mexico Not Sure Not Sure Not Sure Not Sure No Texas 2005 1997 (late) Not Sure Not Sure Yes
7 Missouri 2004 2004 2004 2004 Yes 8 Colorado Not Sure Not Sure Not Sure Not Sure Yes
Utah 2003 (late) Not Sure Not Sure Not Sure Yes 9 Arizona Not Sure Not Sure Not Sure Not Sure Yes
California Never Never Never Never Yes Nevada 2004 2004 2004 2004 Yes
10 Alaska Not Sure Not Sure Not Sure Not Sure No Idaho Not sure Not sure Not Sure Not Sure No Oregon 2005 2004 Never Never No Washington Not Sure Not sure Not sure Not Sure No
a As shown in Appendix I, we asked EPA regions whether States submitted any additional reports, including any biennial program evaluations, as required by Title 40, Code of Federal Regulations, Part 51.353.
Source: OIG analysis based on responses by EPA regions to OIG survey.
53

Appendix H
Regional Audits and Evaluations of 34 Vehicle I/M Programs, 1999-2005
EPA Region State
Regional Audits/ Evaluations (Year)
Other Oversight Efforts Identified by EPA Regions in Responses to OIG Survey
1 Connecticut No Reviewed submitted reports; follow up on abnormalities in reports; followed up on reported complaints.
Maine No Same as above. Massachusetts No Same as above. New Hampshire No Same as above. Rhode Island No Same as above. Vermont No Same as above.
2 New Jersey Yes/2004 Reviewed/assessed accuracy of State's own April 2001 enhanced I/M program evaluation; approved Sep. 11, 2001.
New York (Metro) New York (Upstate)
Yes/2004 Yes/2004
Reviewed and assessed accuracy of State's own enhanced I/M program evaluation; approved May 7, 2001.
3 Delaware No Reviewed and noted incomplete portions of received reports, and missing reports, internally.
District of Columbia No Information visit in 1999 and 2002. Reviewed and noted incomplete portions of received reports, and missing reports, internally.
Maryland No Reviewed reports received. Pennsylvania No Reviewed reports received. Virginia No Reviewed reports received.
4 Georgia Yes/1999, 2000, 2002 Reviewed annual reports. Kentucky No Same as above. North Carolina Yes/1999 Same as above. Tennessee Yes/2001 Same as above.
5 Illinois No Focused on assisting State with implementation issues. Indiana No Same as above. Ohio No Same as above. Wisconsin No Same as above.
6 Louisiana Yes/2004 Informally reviewed submitted reports. New Mexico No Same as above. Texas No Same as above.
7 Missouri Yes/2004 Reviewed weekly updates, annual reports and biennial reports.
8 Colorado Not Sure Reviewed submitted reports. Utah Not Sure Same as above.
9 Arizona Yes/2001 and 2002 Reviewed completeness and accuracy of State I/M data for SIP revision for Arizona I/M program, Jan. 2003.
California No Focused on helping State develop approvable SIP and kept informed of activities of other organizations that monitor the State I/M programs in this Region, especially in California.
Nevada Yes/2002 and 2003 Reviewed completeness and accuracy of State I/M data for SIP revision for Clark County I/M program, Sep. 2004.
10 Alaska No Responded to inquiries. Idaho No Same as above. Oregon No Same as above. Washington No Same as above.
Source: OIG analysis based on responses provided by EPA regions to OIG survey.
54

Appendix I Key Evaluation Questions
Below are the oversight questions asked in the OIG survey of all 10 EPA Regions for this evaluation:
State Vehicle I/M Background:
Year I/M Program Began: Basic program: Enhanced program: If applicable, please specify by geographic area of State.
Program Type: (Please check all that apply)
- Centralized - Decentralized - Basic - Low Enhanced - High Enhanced- Others (Please Specify)
Testing Type: (Please check all that apply)
- ASM - IM 240 - Idle Testing - OBD - Gas Cap - Others (Please Specify)For each testing type identified, please specify the models years covered.
Testing Frequency: - Once per year (Annually) - Once every two years (Biennially) - Other (Please Specify)
Enforcement Type: (Please check all that apply)
- Registration Denial - Computer Matching - Sticker Based - Other (Please Specify)Please list by geographic area if it varies in the State.
State Vehicle I/M Reporting:
Please specify the most recent year this State has submitted the following reports to the Region as required by the 40 CFR 51.366.
Report Title Year (Please check one if necessary) Test Data Report Never Not Sure Quality Assurance report Never Not Sure Quality Control report Never Not Sure Enforcement Report Never Not Sure
From 1999 to present, has this State submitted any reports in addition to those listed above, including any biennial program evaluations, as required by 40 CFR 51.353?
55

Audits and Evaluations of State I/M Programs:
Has this State performed any covert audits from 1999 to 2005?
1999 2000 2001 2002 2003 2004 2005 Yes Yes Yes Yes Yes Yes Yes No No No No No No No Not Sure Not Sure Not Sure Not Sure Not Sure Not Sure Not Sure
Has this State performed any overt audits from 1999 to 2005?
1999 2000 2001 2002 2003 2004 2005 Yes Yes Yes Yes Yes Yes Yes No No No No No No No Not Sure Not Sure Not Sure Not Sure Not Sure Not Sure Not Sure
Has the Region performed any audits or evaluations of this State’s Vehicle I/M program since 1999? - Has been audited and/or evaluated (If so, please tell us which years (1999-2005)) - Never (If not, please briefly describe any reason(s) why this State has not been audited and/or
evaluated) - Not Sure
Region Level Information:
Please specify the number of FTEs designated to the Region's I/M program in each of the following years. FTE's 1999: FTE's 2000: FTE's 2001: FTE's 2002: FTE's 2003: FTE's 2004: FTE's 2005: Additional Comments on allocation of FTE's:
Please describe any ways in which the Region assesses the completeness and/or accuracy of State I/M data.
56

Appendix J
Agency Response to Draft Report
AUG 14, 2006
MEMORANDUM
SUBJECT: Comments on OIG’s AEPA=s Oversight of the Vehicle Inspection and Maintenance Program Needs Improvement@
FROM: William L. Wehrum Acting Assistant Administrator Office of Air and Radiation
TO: J. Rick Beusse Director for Program Evaluations, Air Issues
I am writing to provide you with the Office of Air and Radiation’s comments on the draft Inspector General Report, AEPA=s Oversight of the Vehicle Inspection and Maintenance Program Needs Improvement@ (No. 2005-0-00272, July 13, 2006). Thank you for the opportunity to review and comment on this report.
As a general matter, OIG’s findings do not contradict this office’s experiences with regard to the vehicle inspection and maintenance (I/M) program. Therefore, the attached response focuses on the draft report’s several recommendations for improving EPA’s oversight of I/M programs. With very few exceptions, we concur with these recommendations. I am also encouraged to see that many of these recommendations are in keeping with commitments the Agency has already made as part of a recent summit on I/M program issues which was attended by our Office of Transportation and Air Quality (OTAQ) and representatives from over 25 I/M States. And lastly, I am pleased to see OIG affirm the evolving, but continued importance of I/M programs as a means by which state and local agencies attain and maintain their air quality goals and protect public health. Not only have these programs helped to clean the air by finding and fixing vehicles in need of repair, they have also shown the public how to be more conscientious in the maintenance of their vehicles, and spurred vehicle manufacturers to produce more durable vehicles that stay cleaner, longer.
I trust the attached comments will be helpful in completing your work on this report. Please feel free to contact me or Leila Cook at (734) 214-4820 if you have any questions about our comments or if we can provide additional information. If you have questions regarding comments specifically related to Region 3 and/or its States, please contact Judith M. Katz, Region 3 Air Protection Division Director at (215) 814-2654.
Attachment
57

Comments on Draft Evaluation Report: EPA=s Oversight of the Vehicle Inspection and Maintenance Program Needs Improvement
(Assignment No. 2005-0-00272)
Recommendations – Chapter 2
We recommend that the Assistant Administrator for Air and Radiation work with EPA Region 3 to:
2-1 Ensure that the District of Columbia I/M program (a) restores IM240 testing as required by its SIP; and (b) continue to work with the District to ensure it repairs its data issues and provides accurate and reliable reporting in the future.
See Appendix K Note 1
Response: Concur. EPA Region 3 is actively monitoring the District's progress in restoring IM240 as a required testing element, and anticipates full compliance with the SIP-approved testing, including a restoration to IM240 testing by no later than March 2007. The Region is also working with the District to correct data reporting issues from years past, and anticipates full compliance with data reporting elements under 40 CFR 51.366 for CY 2005, and beyond.
2-2 Require that the Maryland I/M program (a) achieve the waiver rate in its approved SIP, or require Maryland to adjust its SIP and related emissions credits to reflect their actual waiver rate; and (b) adjust its waiver limit for inflation as required by the Clean Air Act Amendments of 1990, Section 182 (3)(C)(iii), or seek legal variance from EPA to adjust its SIP and related emissions credits to reflect the loss in emissions credits from the non-inflationary adjusted waiver limit.
See Appendix K Note 2
Response: With regard to recommendation (a), we concur. EPA Region 3 and Maryland are working together to address the waiver amount and rate issues with regard to the approved I/M program. Based upon recent discussion with MDE, Region 3 believes the State is actively modeling the actual waiver rate, and adjusting its related emission credits accordingly, for use in planning future SIP revisions including those to attain the 8-hour ozone standard. While the waiver rate adjustment does negatively impact the level of emission reductions available from the I/M program, Maryland is working to develop attainment planning SIP revisions and conformity analyses that demonstrate improved air quality, despite the effects of modeling this change in waiver rate. EPA Region 3 and MDE are also anticipating a review of the current I/M program design when contract renewal for the I/M program comes due in 2009. Due to the substantial investments and technical analyses that will be made at that time, it is anticipated that a review of the waiver amount will coincide with a review of other important program parameters such as test type and network design.
58

With regard to recommendation (b), we concur, with comments. Although the Clean Air Act is unambiguous with regard to the minimum dollar amount that must be spent prior to being granted a waiver in an enhanced I/M program – and we will work with Region 3 and Maryland to revise the waiver amount – the environmental benefit of raising the waiver limit as recommended here is not at all clear. In its work with I/M programs, EPA has never been able to draw a correlation between the dollar limit set by a State and the resultant waiver rate. Within this context it is important to note that waivers themselves are rapidly becoming a thing of the past as the in-use fleet turns over to OBD-equipped vehicles. Unlike repairs suggested by tailpipe test failures, OBD diagnoses the specific cause of the failure – and these repairs are generally all-or-nothing. Put another way, it is not possible (or at least not practical) to perform half a transmission repair with an eye toward just meeting some pre-set dollar limit. For this reason, EPA’s implementation guidance on OBD testing recommends that States improve upon the $450+CPI adjusted waiver by not allowing waivers of OBD-equipped vehicles at all.
We recommend that the Assistant Administrator for Air and Radiation work with EPA regions and States, or with appropriate organizations such as STAPPA/ALAPCO, the Environmental Council of States, or the National Conference of State Legislatures, to:
2-3 (a) Develop VIN-based vehicle databases for vehicles failing I/M tests with no known final outcome, (b) establish reciprocity agreements allowing the sharing of such data among and between I/M programs, and (c) ensure that I/M programs that can demonstrate that such vehicles have been sold outside of a nonattainment area (or scrapped) receive appropriate emissions reductions credits.
See Appendix K Note 3
Response: We do not concur. We lack the legal authority and resources to act on this recommendation. While this recommendation may be a logical response to the difficulties encountered in reconciling I/M reporting data on “vehicles with no known final outcome” – and we certainly encourage the States to share this information to the extent possible – we also acknowledge that there may be significant obstacles to developing such multi-state databases. Many States store vehicle testing information and vehicle registration information in separate databases, and the format of those databases can vary radically from State to State. In some cases, the relevant information is available only as a paper record, while in other cases; the database software is proprietary and not readily adaptable for communication with other packages and formats. Another consideration is the fact that States are currently required to comply with the Real ID Act of 2005, meeting national standards by 2008 for state-issued driver licenses and non-driver ID cards as well as linking of license and ID card databases. While this might seem like an opportunity for state motor vehicle departments to develop the VIN-based databases recommended, it’s equally likely that such an effort would be viewed as a hindrance competing for resources earmarked for Real ID Act compliance. Additionally, there may be privacy and other
59

issues to resolve which should be thoroughly weighed before committing to such a project. As an alternative, we recommend requiring that States follow up on disappearing vehicles to the best of their abilities, and to a degree proportional to the problem. For example, a State using remote sensing to identify exceptionally clean or dirty vehicles could impose significant fines on registered vehicles with no known final outcome that are photographed operating in the program area. Lastly, with regard to part (c) of this recommendation, there is nothing in the Clean Air Act or the I/M rule that prevents States from taking SIP credit for those initially failing vehicles they can prove are no longer operating in the I/M program area. Even if an I/M program does not have the resources to track these vehicles down for the purpose of adjusting SIP credit, however, the benefits associated with initially failing vehicles no longer operating in the program area will be seen at the air quality monitors.
Recommendations – Chapter 3
We recommend that the Assistant Administrator for Air and Radiation work with EPA regions to:
3-1 Ensure that all State vehicle I/M program requirements are met, including the key reporting required by Title 40, Code of Federal Regulations, Part 51.366.
See Appendix K Note 4
Response: Concur with comment. EPA believes that its ability to assess the success of an I/M program begins with our having available the program statistics and other information required under 40 CFR 51.366. In addition, States should be allowed maximum possible flexibility to provide the required information in whatever format is most convenient, in compliance with OMB recommendations for reducing the respondent burden associated with mandatory data collections. For example, if the State is required by its legislature to provide regular reports of I/M program statistics (and these reports contain the data required under the 40 CFR 51.366) the State should be allowed to submit those reports in lieu of extracting the information to create a separate report to EPA.
3-2 Evaluate vehicle I/M reports and other available information to determine whether the programs are operating effectively, including demonstrating that they achieved the emissions reductions committed to in SIPs. See Appendix K
Note 5
Response: Concur, with comment. To the extent that complying with this recommendation (and others) would require a significant increase in the resource levels associated with I/M implementation and oversight, we must make note of the declining significance of I/M programs in the overall context of State attainment demonstrations due in 2007 for the 8-hour ozone NAAQS and the need for both States and EPA to use more resources implementing and overseeing additional control measures. Thus, this puts more pressure on the limited resources available to both EPA headquarters and
60

Regions for oversight of all control measures. It should also be noted, specifically, that the predicted emission reductions attributable to I/M programs in EPA’s MOBILE6 mobile source emissions factor model have decreased significantly (e.g., from 40-60%) from when most currently operating programs were originally designed, reflecting advances in clean vehicle technology and increased fleet turnover, as motorists buy newer, cleaner vehicles. While we readily agree that remaining reductions obtained by I/M programs are significant and needed to meet or maintain air quality goals in many areas, that significance is declining over time. In addition, areas vary fairly widely in the impact I/M programs can have in an area due to many factors including fleet composition and age. For instance, by 2015, the emission reductions associated with I/M for Phoenix represent less than 1% of the projected emissions inventory in both the CO and 1-hour ozone maintenance plans. Of course, not all areas will see this kind of drop off in I/M credit, but the trend toward less over time for all I/M program areas will continue. As a result, many areas are looking for other, more productive sources of emission reductions. For example, in its attempts to find an I/M alternative for older (and higher-emitting) vehicles, California, which may have a larger share of such vehicles than many other states, is developing incentives to get older vehicles off the road entirely through accelerated vehicle retirement programs.
3-3 Determine whether vehicle I/M programs are using appropriate tests, collecting reliable data, and meeting waiver rates committed to in SIPs. See Appendix K
Note 6 Response: Concur, with comment. As part of its work to develop its next-generation mobile
source emission factor model – also known as MOVES – OTAQ has collected and reviewed a substantial number of test records from several I/M programs and has found the data reliable enough to be used in developing the emission rates in the MOVES model.
3-4 Follow up with States on significant issues identified during regional analysis of State reporting and work with these States to correct these issues, as needed. See Appendix K
Note 7 Response: Concur, with comment. Most Regions meet with their States regularly
to discuss operational and SIP issues. These meetings can provide an alternative avenue to raising and addressing concerns without resorting to the more formal route of performing a program evaluation or data analysis.
3-5 Use the mechanisms provided under the Clean Air Act to ensure achievement of State vehicle I/M program SIP commitments, or require States unable to do so to revise their SIP commitments to reflect the actual I/M emission reductions achieved.
See Appendix K Note 8Response: Concur, with edit. As an alternative to the current phrasing, we
suggest: “Use the mechanisms provided under the Clean Air Act to ensure achievement of State vehicle I/M program SIP commitments, or require States unable
61

to do so to revise their SIP commitments to reflect their actual I/M program operations.” We’re recommending this edit because, strictly speaking, SIPs are based on projected emission reductions. Actual emission reductions are determined under a separate process and submission – the program evaluation report.
We also recommend that the Assistant Administrator for Air and Radiation work with OTAQ to:
3-6 Provide technical leadership and guidance to States and regional offices to address OBD implementation issues, including: updating OBD I/M implementation auditing/ evaluation guidance; establishing on a trial basis an OBD technical workgroup to help I/M programs resolve OBD I/M issues; and providing updated OBD I/M implementation training. See Appendix K
Note 9
Response: Concur, in part. On May 16, 2006 – prior to receiving the IG’s draft July 13th
recommendations for official response – OTAQ co-sponsored an “I/M Summit” with members of the State and Territorial Air Pollution Program Administrators/ Association of Local Air Pollution Control Officials (STAPPA/ ALAPCO) to discuss many of the State concerns referenced by the IG’s draft report. In follow-up to that meeting, on June 30, 2006, OTAQ Director Margo T. Oge wrote to STAPPA/ ALAPCO representatives, affirming support for State I/M programs as well as EPA’s commitment to establish a FACA workgroup on “bridging” I/M programs to the future. That letter was followed on July 21, 2006 by a more detailed letter from the director of OTAQ’s Transportation and Regional Programs Division, Merrylin Zaw-Mon, listing numerous action items OTAQ had agreed to pursue in support of I/M, including several which are directly responsive to the IG’s recommendations. (Copies of both letters are attached to this response.) Among other commitments, OTAQ agreed to:
• Continue to facilitate bimonthly conference calls of I/M states to discuss technical issues arising from the implementation of local I/M programs, with a specific emphasis on sharing solutions to technical challenges that have arisen in more than one state
• Update Appendix D25 of the Onboard Diagnostics (OBD) Implementation Guidance
• Share information with the states regarding technical service bulletins, recalls, and other relevant enforcement actions with a direct bearing on I/M program implementation, as appropriate
25 Appendix D includes a list of vehicle makes, models, and model years exhibiting test difficulties with regard to establishing readiness for some monitors. The Appendix identifies the vehicle, describes the nature of the problem, and the corrective action to be taken to complete the test process.
62

• Review suspected OBD defeat devices and refer to OECA for possible enforcement
With regard to the training recommendation, we do not concur. Several private vendors exist who can provide high quality training for States needing it. In prior years, OTAQ had paid for several training sessions but the market has taken over that function. OTAQ believes that States needing training should contact private vendors for that service.
Findings
As a general matter, the IG’s findings do not contradict our experiences with regard to the I/M program. However, given that many of the findings are based upon analysis of data and survey results that we do not have access to, it is difficult to concur or not concur with the many of the explicit counts and percentages presented here. That said, with the few questions, comments and requested clarifications below, we have no reason to doubt the accuracy of the IG’s analysis.
General comments and/or clarifications
p. 1: The report cites an American Lung Association report which claims that approximately half of total manmade air pollution comes from mobile sources. Typically, the mobile source inventory includes not just cars and light trucks, but also planes, trains, heavy-duty trucks, and non-road engines, like construction equipment and generators. The more illustrative statistic would be the amount of manmade pollution that comes from cars and light-duty trucks typically subject to inspection and maintenance (I/M) testing? See Appendix K
Note 10
p. 3: “According to EPA, major malfunctions can cause emissions to skyrocket…” This claim should be tied to a specific document citation. See Appendix K
Note 11
p. 3: The various reduction figures attributed to Maryland and Virginia on this page need to be further explained. Are these percentages derived from modeling? Or maybe before and after emission scores recorded by the programs(s)? If the percentages are based on modeling, which model was used? MOBILE5? MOBILE6? If the figures are based on before and after emission scores, were the scores in measured grams-per-mile, calculated grams-per-mile, parts-per-million, or percent? How were the OBD and/or gas cap test results accounted for? Also, how was the tailpipe test score data quality controlled?
See Appendix K Note 12
p. 4, footnote 6: The last statement regarding the impact of the 8-hour ozone standard and anti-backsliding requirements on existing 1-hour programs should be modified to address the I/M
63

rule’s redesignation exception for basic I/M programs which is discussed in the May 12, 2004 memo signed by Tom Helms, Ozone Policy and Strategies Group, and Leila Cook, State Measures and Conformity Group, entitled “1-Hour Ozone Maintenance Plans Containing Basic I/M Programs,” a copy of which is attached to these comments.
See Appendix K Note 13
p. 4: The last bullet regarding basic I/M program requirements should be revised to clarify that while basic I/M programs are required to perform OBD testing on OBD-equipped vehicles, for performance standard purposes, it is the idle test alone (on MY 1968 and newer vehicles) that establishes the credit level that must be met for basic I/M programs required under the 1-hour ozone standard.
See Appendix K Note 14
p. 8: The report claims that disappearing vehicles emit “excessive amounts of pollution,” but provides no estimate of what this “excessive” amount is. Furthermore, on page 33 of the report the authors indicate that they are unable to quantify this number given the lack of reliable mileage data. The report also states that areas with significant numbers of disappearing vehicles meet their clean air goals. Given these facts, a more conditional line seems warranted, perhaps something like, “Depending upon their ultimate disposition and quantity, disappearing vehicles may undermine an area’s ability to achieve their clean air goals.”
See Appendix K Note 15
p. 10: The report indicates that DC has promised to include 2005 data on disappearing vehicles in a report scheduled to be submitted by July 2006. Will the authors follow up on this claim prior to finalizing the audit report? Is any additional analysis anticipated, should such a report be submitted prior to the audit report being finalized? Is it possible that the final report may be delayed and/or include text and/or conclusions that EPA has not had an opportunity to comment on?
See Appendix K Note 16
p. 19-20: The sentence beginning “During 2003, the District’s...” is a little confusing regarding its discussion of DC’s advisory only OBD testing. It’s unclear (for example) what is meant by the claim that a vehicle that fails the OBD test were to “go through IM240 protocol without any adverse implications.” Perhaps a better way to phrase the sentence would be to say that if a vehicle fails the OBD test, it is diverted to the IM240, which is then used as the basis for making a pass/fail determination.
See Appendix K Note 17
p. 21, paragraph 3: The report cites Virginia DEQ as performing a bi-annual gas audit of test analyzers in lieu of conducting covert audits with the vehicles set to fail, implying that the point of covert audits is to ensure that test analyzers are accurate. In fact, ensuring analyzer accuracy
64

through an independent gas audit is one of the things that is required as part of the overt audit; the covert audit is intended to identify potential inspector fraud. Lastly, concerning guidance on how to set an OBD-equipped vehicle to fail, one method would be to install a defective oxygen sensor and unscrewing the MIL bulb to fail the bulb check portion of the test. These methods are commonly employed in other programs.
See Appendix K Note 18
p. 28, first paragraph after bullets: The Virginia official who indicated that the program evaluation requirements assumed IM240 testing is citing old information. The I/M rule and EPA’s guidance on program evaluation was revised several years ago to account for areas that do not use IM240 testing (although it is true that that revised guidance does not address what to do with regard to OBD-equipped vehicles).
See Appendix K Note 19
p. 28, second paragraph after bullets: The discussion of bi-monthly calls. Those calls are for State program people only. Tool and vehicle manufacturers are specifically not invited so the State participants can speak freely among regulators.
See Appendix K Note 20
65

Appendix K
OIG Evaluation of Agency Response Note 1- We agree with the Agency’s planned actions.
Note 2- We agree with the Agency’s planned actions.
Note 3- We have revised Recommendation 2-3 based on the Agency’s comment that it lacks the statutory authority to implement the recommendation as written, including deleting part 2-3(c). We continue to believe that it is important for the Agency to encourage States with a significant number of vehicles with no known final outcome to follow up on these vehicles and for the Agency to encourage other States to assist in this effort, as appropriate.
Note 4- We agree that EPA’s ability to assess the success of an I/M program begins with having available the program statistics and other information required under Title 40, Code of Federal Regulations, Part 51.366. We also agree that EPA can allow flexibility in how States provide the required information as long as the necessary information required in Title 40, Code of Federal Regulations, Part 51.366 is met and the reports are submitted to the regions in a timely manner.
Note 5- We understand that the significance of the I/M program is declining, and that resources in headquarters and the regions are limited. However, we believe that there is still a need to evaluate the vehicle I/M reports to determine if the programs are operating effectively. As stated in the Agency response, the remaining reductions obtained are still significant and are needed to meet or maintain air quality goals in many areas. We believe that obtaining and reviewing the information mentioned in Recommendation 3-1 is the most cost effective method to ensure that I/M programs are operating effectively.
Note 6- We are encouraged that the Agency has obtained and reviewed test data and found it reliable enough for developing emission rates for modeling.
Note 7- We agree with the Agency’s proposed method for followup with States.
Note 8- We agree and have modified the recommendation to state “projected” emissions reductions.
Note 9- We agree and are encouraged that the Agency and the States are proactively working together to address issues with the I/M program. We are also encouraged by the recent commitments made by OTAQ. We have added information in Chapter 3 related to the May 2006 “I/M Summit” and June and July 2006 followup letters from OTAQ to STAPPA/ALAPCO. We have also modified the recommendation based on these commitments. We deleted the reference to the Agency providing training from the recommendation. We believe that the
66

commitments made by the Agency when fully implemented will significantly enhance the I/M program.
Note 10- We revised the first paragraph on page 1 of the report to include only emissions from on-road mobile sources.
Note 11- We modified the sentence for clarity. The source for the sentence was EPA Region 3’s I/M Website.
Note 12- According to VA DEQ, these numbers are from their SIP and are based on modeling. VA DEQ used EPA Mobile5 for the 1999 SIP and Mobile6 for the 2006 projections. The numbers are not based on actual emissions results. According to MDE, their numbers are also based on modeling estimates using EPA’s Mobile 5b and Mobile6 models.
Note 13- We added information from EPA/OTAQ’s May 12, 2004 memorandum entitled "1-Hour Ozone Maintenance Plans Containing Basic I/M Programs," to footnote #6 (now footnote #10).
Note 14- Agree. We added information to clarify the performance standard requirements for basic I/M programs.
Note 15- We revised the sentence based on the comment.
Note 16- The District of Columbia provided 2004 and 2005 reports to Region 3 on August 3, 2006. The District also provided copies of these reports to the OIG in response to our draft report. We updated the final report by filling in the information in applicable charts based on the 2004 report and noted in the report that the 2005 report does contain information related to vehicles with no known final outcome. However, we did not review the reports in detail, since the District submitted these reports after the end of our field work. We also did not make substantial changes to the report based on receipt of these reports. EPA Region 3 should review these reports in detail, as part of the Agency’s response to Recommendation 2-1.
Note 17- We made revisions to clarify the statement.
Note 18- EPA and the States we reviewed held differing views regarding the feasibility of meeting the covert audit requirements using OTAQ’s suggested approach. Because of these differing views, we believe the issue of how to meet the covert audit requirements should be resolved using the mechanisms discussed in our Recommendation 3-6.
Note 19- We deleted the sentence as this guidance had been superseded, according to OTAQ.
Note 20- We deleted from the sentence the reference to vehicle manufacturers, tool manufacturers, and consultants.
67

Appendix L
Summary and OIG Analysis of Responses from the District of Columbia, Maryland, and Virginia I/M Programs
District of Columbia
We provided the Air Quality Division of the District of Columbia’s Department of Health with detailed finding outlines prior to issuance of our draft report for comment, and we held conference calls with them to discuss these detailed finding outlines. We incorporated their comments into the draft report. Subsequently, we provided the District of Columbia with a redacted version of the draft report for further comments, and later we also provided them with the full draft report for comment prior to issuance of our final report. We resolved any issues prior to issuance of the draft report; as a result, the District did not provide further detailed comments to the draft report. In response to the redacted version of the draft report the District responded, “We have reviewed the redacted version of the OIG's evaluation report dated 7/17/06. Thank you for your attentiveness to our responses regarding issues pertinent to the D.C. IM Program.” Also, in response to our draft report, the District provided us with copies of its 2004 and 2005 I/M reports that it provided to Region 3 subsequent to issuance of our draft report. We revised the report to reflect this subsequent information.
Maryland
We provided MDE with detailed finding outlines prior to issuance of our draft report for comment, and we held conference calls with them to discuss these detailed finding outlines. We incorporated their comments into the draft report. Subsequently, we provided MDE and the Maryland Motor Vehicle Administration with a redacted version of the draft report for any further comments, and later we also provided MDE with the full draft report for comment prior to issuance of our final report. Maryland made several comments related to the draft report and we made changes to the report, as appropriate. The more significant comments are discussed below along with OIG responses.
Comment: Regarding the information in our report related to vehicles with “no known final outcome” (such as appears in Table 2-1), Maryland commented that it is important to explain that the numbers reported are for a defined timeframe. Maryland further commented that the timeframes need to be included; otherwise, readers may have the impression that these vehicles were "lost" forever, which is not the case. Maryland also responded that readers must understand that Maryland does closely track and follow up on these vehicles continuously, and that looking at a longer timeframe would result in lower numbers of vehicles with no final outcome.
OIG Response to Comment: The numbers presented in Chapter 2 under “Significant Percentages of Vehicles with No Known Final Outcome” are based on the information that States reported to EPA Region 3 in their annual reports. We agree that the numbers are for a given timeframe and that more vehicles may be resolved given a longer time period. However, as is the case with Maryland, this timeframe can be more than 1 year. Using a timeframe of longer
68

than 1 year is possible because the reports are due by July of the each year (6 months after the end of the year reported on). Further, we used longer periods of time in our analysis of data for Maryland (January 2003 though April 2005). We continue to believe that EPA’s requirement to report the number of vehicles with no known final outcome is important because this number and corresponding percentage can be an indicator of whether vehicles identified as failing an emissions test are repaired timely. It is also important to clarify that our analysis was to determine whether initially failing vehicles were resolved (i.e., whether the vehicle passed a subsequent inspection, was granted a waiver, had its tags turned in, was no longer in the I/M area, or was exempted). This is different than whether or not the vehicles are tracked.
Comment: Maryland responded to the 13,655 vehicles shown in Table 2-2 and Table E-1. It commented that:
. . . the OIG does not seem to accept Maryland's explanation of 13,655 vehicles in the category for "Vehicles With No Result (have not passed retest nor received a waiver), But Are Not on the Current No-Show List." When the OIG asked for a breakdown of these vehicles, Maryland explained that all 13,655 vehicles in this category were checked manually over time during the normal course of operations and removed from the No-Show list for a valid reason. To recreate this information for the OIG, we would have to go back and manually look up each vehicle a second time, which would be a substantial amount of time and work. We provided a sample of 20 vehicles to demonstrate how it was done, but did not think it was reasonable to do it for 13,635 additional vehicles. This needs to be clarified here, so that readers are not given the impression that we do not know what happened to the 13,635 remaining vehicles. The key point here is that Maryland demonstrated the ability to do this, and that these vehicles were indeed tracked and accounted for. As a result, our analysis showed approximately 4,500 vehicles that ultimately could not be accounted for.
OIG Response to Comment: We added information in Chapter 2 related to Maryland describing the issue as a documentation issue. We included the 13,655 vehicles in Table 2-2 because, based on our analysis, the data provided did not contain a corresponding resolution. We agree that it is possible that many of these vehicles may be resolved; however, Maryland did not provide documentation of a satisfactory resolution for these vehicles. One issue we believe needs clarification is that Maryland’s response addressed what it said can be “accounted for”; however, we sought to determine whether the initially failing vehicles were clearly resolved during the timeframes of the data provided. As noted in Appendix E, we reviewed 20 vehicle records manually extracted by Maryland. We found that 8 of the 20 vehicles, or 40 percent of the vehicles that Maryland provided as examples for the limited manual test, were not clearly resolved. Also, as discussed in Appendix E, 7 other vehicles were not resolved in a timely manner. We acknowledged in Appendix E that, for this category, as well as for other categories, these vehicles may no longer be driven in the area or may be retired, but this could not be ascertained from the category descriptions provided.
Comment: Maryland also made comments related to ensuring that their enforcement program was understood in perspective. Maryland noted that even when vehicle tags are suspended, the owner might still drive the vehicle in the area. However, Maryland is concerned that the report
69

may give readers the impression that vehicles being driven illegally on suspended tags/registrations is a problem unique to, and caused by, I/M programs. Maryland commented that this problem is far broader than any I/M program, e.g., “people driving with stolen/forged tags, suspensions due to insurance violations or traffic violations.” Maryland also noted that its procedures must be taken and presented in this broader context. Maryland also commented that:
The OIG concludes in the paragraph above that " …. in theory a failing vehicle could be sold multiple times before being required to be retested." (second paragraph below Table 2-2). While we acknowledge that this is, in theory, possible, we do not believe that this occurs to any significant degree in Maryland, or in other I/M programs.
OIG Response to Comment: We added additional information in the report related to these comments. We agree that these problems are not unique to Maryland or to its I/M program and that this may be a broader issue than I/M programs. Our report focuses only on I/M programs.
Comment: Maryland commented that it appears that Maryland is being singled out and penalized for maintaining in-depth program data, while other jurisdictions that did not meet the EPA requirements for data submittal are not evaluated negatively.
OIG Response to Comment: Chapter 3 provides information related to our survey of all EPA regions and whether other I/M programs met EPA’s minimum reporting requirements. However, due to time constraints and the lack of data for the District of Columbia I/M program, we only reviewed the I/M programs in two States in detail. The OIG’s intent was not to require that one I/M program do more than others. Our recommendations in Chapter 3 are national in scope and are designed to ensure that other I/M programs meet the minimum reporting requirements and that EPA take action when significant issues are identified.
Maryland made other clarification comments and suggestions for Chapters 1 and 2, and the appendices. We made changes based on these comments, as appropriate.
Subsequent to its initial response to our draft report, Maryland provided additional comments as well as more information regarding the importance of its I/M program and the challenges that the State has encountered, including information on the challenges of balancing the goal of maximizing environmental benefits with consumer acceptance of the program.
OIG Response to Comment: We added information based on Maryland’s comments to the report as appropriate. However, our evaluation did not address the consumer acceptance issues noted above, but we acknowledge that such issues may exist and we have included Maryland’s views in the report.
Virginia
We provided VA DEQ with detailed finding outlines prior to issuance of our draft report for comment, and we held conference calls with its personnel to discuss these detailed finding outlines. We incorporated their comments into the draft report. Subsequently, we provided VA DEQ with a redacted version of the draft report for further comments, and later we also provided
70

them with the full draft report for comment prior to issuance of our final report. VA DEQ provided technical comments related to the appendices. We made changes based on these comments, as appropriate. We resolved any issues prior to issuance of the final report.
VA DEQ also provided us with an update of its nearly completed study, Resolution of 7,014 Disappeared Vehicles from VA 2004 IM Program, on October 1, 2006, and suggested that we may want to include it as an appendix to our final report. According to VA DEQ’s study, preliminary indications are that the status of a substantial number of the vehicles with no known final outcome can be identified through various mechanisms. The mechanisms used by VA DEQ in its study included: (1) a search of Virginia’s Vehicle Identification Database and Department of Motor Vehicle data, (2) queries to the Carfax national database, (3) comparison with Department of Motor Vehicle registration data, (4) comparison with 2005 and 2006 Virginia remote sensing data, (5) a check for subsequent emissions tests, and (6) a check on the registration status of current VINs.
OIG Response to Comment: We appreciate Virginia’s efforts to determine the outcome of vehicles previously categorized as those with no known final outcome; however, since the study has not yet been finalized and we have not analyzed it, we have not included it in this report. We encourage VA DEQ to finalize this study and share it with EPA and other States.
71

Appendix M
Distribution
Office of the Administrator Acting Assistant Administrator for Air and Radiation Deputy Assistant Administrator for Air and Radiation Audit Followup Coordinator, Office of Air and Radiation Director, Office of Transportation and Air Quality Deputy Director, Office of Transportation and Air Quality Regional Administrators, Regions 1-10 Audit Followup Coordinators, Regions 1-10 Office of General Counsel Agency Followup Official (the CFO) Agency Followup Coordinator Associate Administrator for Congressional and Intergovernmental Relations Associate Administrator for Public Affairs Acting Inspector General
72


