EPAS Development 2011 Class English PLAN 08-09 … · EXPLORE PLAN ACT • College English Comp. 13...
19
11/9/2011 1 1 12 14 16 18 20 22 24 EXPLORE 06-07 (40,860) 14 14.2 14 15.9 14.7 National Norm 13.9 14.4 13.9 15.9 14.7 PLAN 08-09 (38,960) 16 16.5 16.2 17.4 16.7 National Norm 16.9 17.4 16.9 18.2 17.5 ACT 2011 (28,233) 20.5 19.9 21.3 20.6 20.7 National Mean 2011 20.6 21.1 21.3 20.9 21.1 English Math Reading Science Reasoning Composite EPAS Development 2011 Class 2 Oklahoma 2011 ACT scores at or above 19 English Reading 62% at or above 65% at or above 68% at or above 51% at or above Mathematics Science
-
Upload
vuongthuan -
Category
Documents
-
view
213 -
download
0
Transcript of EPAS Development 2011 Class English PLAN 08-09 … · EXPLORE PLAN ACT • College English Comp. 13...

11/9/2011
1
1
12
14
16
18
20
22
24
EXPLORE 06-07 (40,860) 14 14.2 14 15.9 14.7
National Norm 13.9 14.4 13.9 15.9 14.7
PLAN 08-09 (38,960) 16 16.5 16.2 17.4 16.7
National Norm 16.9 17.4 16.9 18.2 17.5
ACT 2011 (28,233) 20.5 19.9 21.3 20.6 20.7
National Mean 2011 20.6 21.1 21.3 20.9 21.1
English Math Reading Science Reasoning Composite
EPAS Development 2011 Class
2
Oklahoma 2011 ACT scores at or above 19
English
Reading
62% at or above
65% at or above 68% at or above
51% at or above
Mathematics
Science

11/9/2011
2
3
ACT Test Takers 1991-2011
0
500
1000
1500
2000
2500
3000
3500
4000
African
Americans
Native
American
Hispanic Two or More
Races
4
2011 ACT
20.7
17.2
19.518.9
21.1
17
18.6 18.7
12
14
16
18
20
22
24
All Students African
American
American Indian Hispanic
Oklahoma National

11/9/2011
3
5
20468
28223
0
5000
10000
15000
20000
25000
30000
ACT takers
56%
4%
40%
5%
36%
59%
0%
10%
20%
30%
40%
50%
60%
70%
<19 19 to 29 = or > 30
OK ACT
1991 and 2011 61%
71%
E. P. A. S. •Educational
•Planning &
•Assessment
•System

11/9/2011
4
What is OK EPAS?
• Explore, Plan, & ACT Assessments
• Comprehensive student preparation system
• Paid for by the Oklahoma State Regents for Higher Education
The system includes . . .
EXPLORE – 8th grade scored 1 to 25 PLAN – 10th grade scored 1 to 32 ACT – 11th or 12th grade scored 1 to 36
• English, mathematics, reading, & science reasoning
• UNIACT Interest Inventory
• Needs Assessment
11/9/2011
5
12
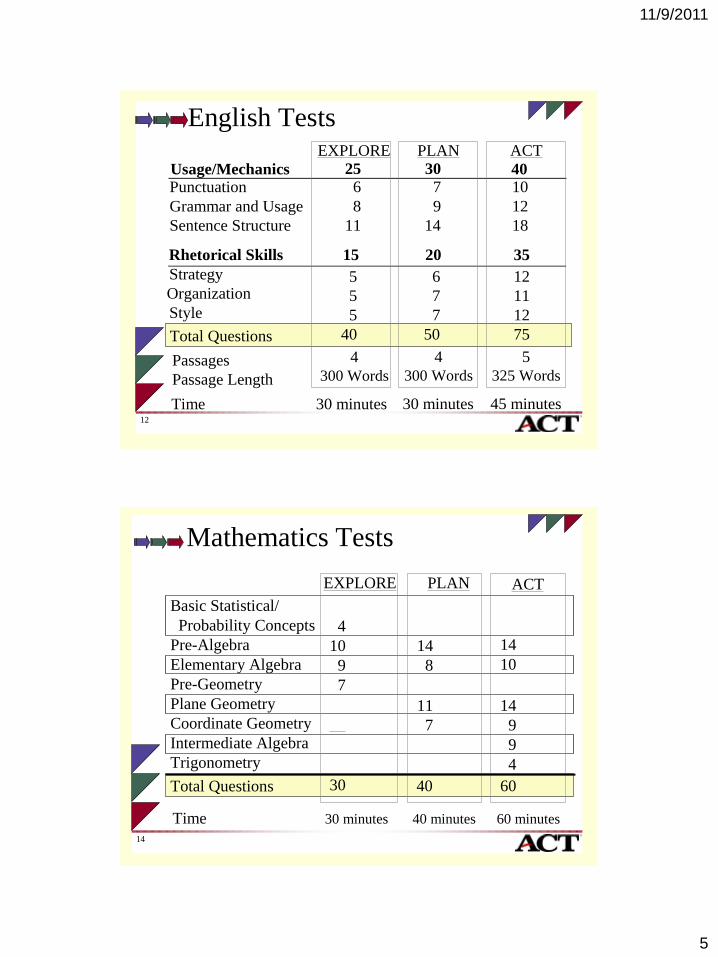
English Tests
Total Questions
Strategy
Organization
Style
Passages
Passage Length
Time
Usage/Mechanics
Rhetorical Skills
Punctuation
Grammar and Usage
Sentence Structure
4
300 Words
EXPLORE
30 minutes
25
15
6
8
11
5
5
5
40
7
9
14
30
PLAN
4
300 Words
30 minutes
20
6
7
7
50
10
12
18
40
35
ACT
5
325 Words
45 minutes
12
11
12
75
14
Basic Statistical/
Probability Concepts
Pre-Algebra
Elementary Algebra
Pre-Geometry
Plane Geometry
Coordinate Geometry
Intermediate Algebra
Trigonometry
Total Questions
Mathematics Tests
Time
EXPLORE
4
10
9
7
30
30 minutes
14
10
14
9
9
4
60
ACT
60 minutes
PLAN
14
8
11
7
40
40 minutes

11/9/2011
6
16
Content Area
Prose Fiction
Humanities
Social Science
Natural Science
Total Questions
Reading Tests
Passages
Passage Length
Time
10
10
10
30
EXPLORE
3
500 Words
30 minutes
PLAN
3
500 Words
20 minutes
8
9
8
25
ACT
4
750 Words
35 minutes
10
10
10
10
40

11/9/2011
7
EXPLORE &
PLAN
Score Report
Side 1
EXPLORE &
PLAN Score Report
Side 2

11/9/2011
8
This system is designed to help schools . . .
• Evaluate instructional programs
• Align curriculum
• Prepare all students to pursue their after high school plans
PLAN Predicts AP Success

11/9/2011
9
What is the difference
between
assessment FOR learning
and
assessment OF learning?
Using EPAS as a Transition to
Common Core
11/9/2011
10
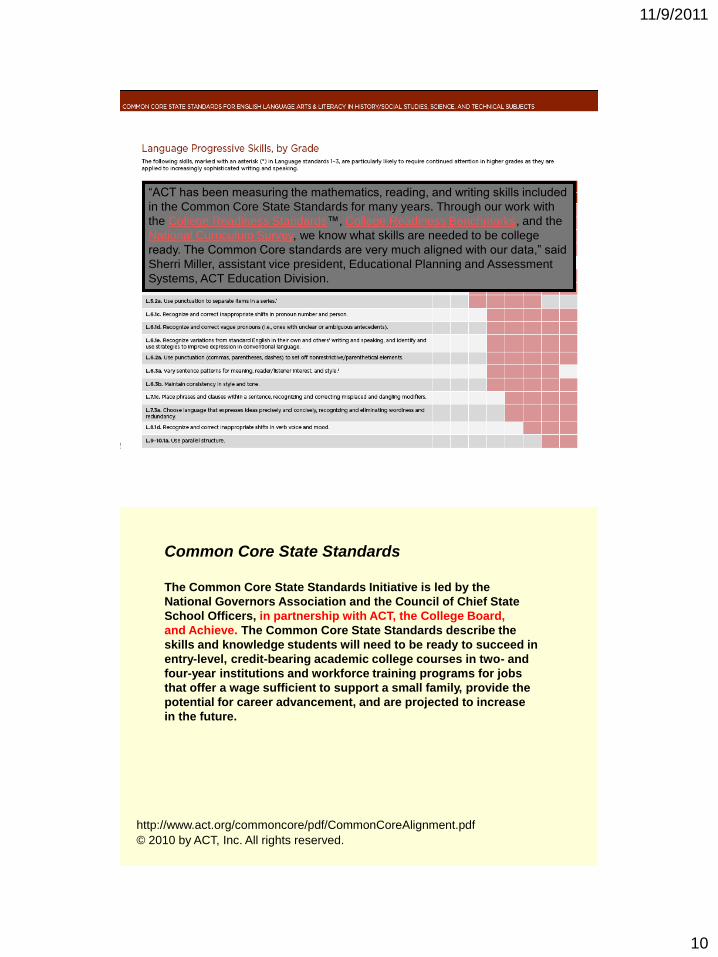
“ACT has been measuring the mathematics, reading, and writing skills included
in the Common Core State Standards for many years. Through our work with
the College Readiness Standards™, College Readiness Benchmarks, and the
National Curriculum Survey, we know what skills are needed to be college
ready. The Common Core standards are very much aligned with our data,” said
Sherri Miller, assistant vice president, Educational Planning and Assessment
Systems, ACT Education Division.
Common Core State Standards
The Common Core State Standards Initiative is led by the
National Governors Association and the Council of Chief State
School Officers, in partnership with ACT, the College Board,
and Achieve. The Common Core State Standards describe the
skills and knowledge students will need to be ready to succeed in
entry-level, credit-bearing academic college courses in two- and
four-year institutions and workforce training programs for jobs
that offer a wage sufficient to support a small family, provide the
potential for career advancement, and are projected to increase
in the future.
© 2010 by ACT, Inc. All rights reserved.
http://www.act.org/commoncore/pdf/CommonCoreAlignment.pdf

11/9/2011
11
Common Core State Standards
Finally, for schools, districts, and states currently using or
considering the adoption of ACT’s College and Career
Readiness System, this report represents ACT’s assurance that
the solutions provided by ACT’s system are well aligned to the
Common Core State Standards. Given the central role ACT
played in providing research and evidence to support the
development of the Common Core State Standards, it should be
no surprise that the overwhelming majority of the Standards can
and will continue to be assessed by ACT’s College and Career
Readiness System.
© 2010 by ACT, Inc. All rights reserved. http://www.act.org/commoncore/pdf/CommonCoreAlignment.pdf
ACT College Readiness Standards
The ACT College Readiness Standards are precise, empirically
derived descriptions of the essential skills and knowledge that
students need to enroll in credit-bearing courses without the
need for remediation.
Three ACT testing programs are aligned with the ACT College
Readiness Standards: EXPLORE® for eighth and ninth graders,
PLAN® for tenth graders, and the ACT® for eleventh and twelfth
graders. Each of these testing programs aligns with the subset of
the ACT College Readiness Standards that is appropriate for the
program’s grade level. Each program provides scores that offer
an indication of students’ educational progress relative to ACT’s
College Readiness Standards and, by extension, relative to the
Common Core State Standards.
© 2010 by ACT, Inc. All rights reserved.
http://www.act.org/commoncore/pdf/CommonCoreAlignment.pdf

11/9/2011
12
How are we going to perform on the
new Common Core assessments?
• 1999 EXPLORE English avg: 14.1
• 2011 EXPLORE English avg: 13.9
• 1999 PLAN English avg: 16.7
• 2011 PLAN English avg: 15.8
• 1999 EXPLORE Math avg: 14.3
• 2011 EXPLORE Math avg: 14.8
• 1999 PLAN Math avg: 16.5
• 2011 PLAN Math avg: 16.9
How are we going to perform on the
new Common Core assessments?
• 1999 EXPLORE Reading avg: 14.4
• 2011 EXPLORE Reading avg: 14.4
• 1999 PLAN Reading avg: 16.4
• 2011 PLAN Reading avg: 16.7
• 1999 EXPLORE Science avg: 16.1
• 2011 EXPLORE Science avg: 16.2
• 1999 PLAN Science avg: 17.7
• 2011 PLAN Science avg: 17.6

11/9/2011
13
EPAS 10 year trends 1999 - 2009
0
5
10
15
20
25
English Math Reading Science Reasoning

11/9/2011
14
College Readiness Benchmarks predict:
• A 50% chance of earning an A or B or in
the matched college course.
Freshman Comp 1
College Algebra
American History
Intro Biology
A 75% chance of a C or higher.
EXPLORE, PLAN, ACT
College Readiness Benchmarks
EXPLORE PLAN ACT
• College English Comp. 13 15 18
• College Algebra 17 19 22
• College Social Sciences 15 17 21
• College Biology 20 21 24
These scores reflect students’ expected growth
from EXPLORE to PLAN to the ACT, assuming
sustained academic effort throughout high school.

11/9/2011
15
Data-Driven Decision Making
• What is our reality?
• What are we doing well?
• What are our students not learning?
• What could we do differently to increase
scores?
• How do we use the data to better prepare
our students for success?
EPAS as a School Improvement Tool

11/9/2011
16
ACT College Readiness Standards (Table 1C, Profile Summary)
• Identify College Readiness Standards
necessary for your class
• Identify students within each score range
• Add student names to report to
personalize data
• Use Ideas for Progress to move students
to next scoreband
Score Range
Score Range
Score Range
Score Range Standards
Standards
Standards
Standards
Ideas for
Progress
Ideas for
Progress
Ideas for
Progress
Ideas for
Progress

11/9/2011
17
Think in Score Ranges
Item-Response Summary Report
Allows Instructional Staff to Evaluate Student Learning

11/9/2011
18
Color code to identify
successes And
challenges
Blue: 75%+ Correct
Green: 50-74% Correct
Yellow: 25-49% Correct
Orange: 0-24% Correct
Identify strengths
and weaknesses in student learning.

11/9/2011
19
ACT Curriculum Review Worksheets http://www.act.org/standard/instruct/pdf/CurriculumReviewWorksheets.pdf
Contact Information:
Oklahoma State Regents for Higher Education
Office of Student Preparation
Lisa Nelson/Field Coordinator
e-mail: [email protected]
Phone: (580) 614-1328
Matt Higdon/Field Coordinator
e-mail: [email protected]
Phone: (405) 517-0301
Cindy Brown/Director
e-mail: [email protected]