EPANET SPATIAL MODELING FOR EQUITABLE PIPE · PDF fileepanet spatial modeling for equitable...
19
EPANET SPATIAL MODELING FOR EQUITABLE PIPE-BORNE WATER DISTRIBUTION IN CALABAR METROPOLIS, CROSS RIVER STATE, SOUTHERN NIGERIA 1 Chukwudi G. Njoku*, 2 Inah Okon, 3 Francis Okpiliya, 4 Emmanuel A. Agbor and 5 Innocent Ekwok 1,2,4 Department of Geography and Environmental Science, University of Calabar, Calabar, PMB 1115, Calabar, Cross River State, Nigeria 3 Cross River University of Technology (CRUTECH), Calabar, PMB 1123, Calabar, Cross River State, Nigeria E-mail: [email protected] ( * Corresponding Author) Abstract: Epanet network modeling tools perform real-time simulation of hydraulic behavior within pipe networks and are designed to be a research tool that improves understanding of the movement and performance of water within a distribution system. An extended period simulation of 6:00 am, 12:00 noon and 6:00pm times of the day was performed using data obtained from the water board, Earth Explorer and Google Earth. Based on universal standards, a minimum pressure of 15m and maximum of 70m as well as a minimum flow-rate of 0.15 litres per second (LPS) were benchmarked. Locations with pressures and flow-rates that fell short of the standards were identified. Notably were areas around Barracks Road and Bogobiri Streets in Eta Agbor zone where 15 junctions depicted low pressures at dawn. Similar situations were observed in Ikot Effanga zone, mostly in Federal Housing Estate where at least 100 pipe junctions were deficient in pressures at all simulated times. Low pressures were also discovered in Atekong Drive, Ediba Road and Chief Obot Streets of the Diamond Hill zone. About 7 junctions also showed pressures higher than 70m at the north- eastern end of Ediba Qua zone. The height of the elevated water tanks (EWTs) and pipe junctions above mean sea level (AMSL) proved to significantly influence the water pressure. Results further showed that there were more pipes with flow-rates lower than 0.15 LPS at noon time in all the distribution zones, when household water consumption is usually most minimal. The implication of low pressures and subsequent flow-rates is intermittency or water hammer at consumer points. A reassessment of the existing pipe-borne water distribution network of the metropolis was recommended guided by the simulation result, precisely, the installation of pressure pumps enroute locations with low pressures and flows as well as pressure breaks for high situations. Keywords: Epanet modeling, Pipe-borne water distribution, water pressure, water flow-rate. 1.0 Background to the Study Water quality models are increasingly being routinely used to help ascertain the performance of water distribution systems for design and operational management purposes. Practical application of hydraulic modeling progressed significantly in the 1990s with the introduction International Journal of Science, Environment ISSN 2278-3687 (O) and Technology, Vol. 6, No 4, 2017, 2655 – 2673 2277-663X (P) Received July 5, 2017 * Published Aug 2, 2017 * www.ijset.net
Transcript of EPANET SPATIAL MODELING FOR EQUITABLE PIPE · PDF fileepanet spatial modeling for equitable...

EPANET SPATIAL MODELING FOR EQUITABLE PIPE-BORNE
WATER DISTRIBUTION IN CALABAR METROPOLIS, CROSS
RIVER STATE, SOUTHERN NIGERIA 1Chukwudi G. Njoku*,
2Inah Okon,
3Francis Okpiliya,
4Emmanuel A. Agbor and
5Innocent Ekwok
1,2,4Department of Geography and Environmental Science, University of Calabar, Calabar,
PMB 1115, Calabar, Cross River State, Nigeria 3Cross River University of Technology (CRUTECH), Calabar, PMB 1123, Calabar,
Cross River State, Nigeria
E-mail: [email protected] (*Corresponding Author)
Abstract: Epanet network modeling tools perform real-time simulation of hydraulic behavior
within pipe networks and are designed to be a research tool that improves understanding of
the movement and performance of water within a distribution system. An extended period
simulation of 6:00 am, 12:00 noon and 6:00pm times of the day was performed using data
obtained from the water board, Earth Explorer and Google Earth. Based on universal
standards, a minimum pressure of 15m and maximum of 70m as well as a minimum flow-rate
of 0.15 litres per second (LPS) were benchmarked. Locations with pressures and flow-rates
that fell short of the standards were identified. Notably were areas around Barracks Road and
Bogobiri Streets in Eta Agbor zone where 15 junctions depicted low pressures at dawn.
Similar situations were observed in Ikot Effanga zone, mostly in Federal Housing Estate
where at least 100 pipe junctions were deficient in pressures at all simulated times. Low
pressures were also discovered in Atekong Drive, Ediba Road and Chief Obot Streets of the
Diamond Hill zone. About 7 junctions also showed pressures higher than 70m at the north-
eastern end of Ediba Qua zone. The height of the elevated water tanks (EWTs) and pipe
junctions above mean sea level (AMSL) proved to significantly influence the water pressure.
Results further showed that there were more pipes with flow-rates lower than 0.15 LPS at
noon time in all the distribution zones, when household water consumption is usually most
minimal. The implication of low pressures and subsequent flow-rates is intermittency or
water hammer at consumer points. A reassessment of the existing pipe-borne water
distribution network of the metropolis was recommended guided by the simulation result,
precisely, the installation of pressure pumps enroute locations with low pressures and flows
as well as pressure breaks for high situations.
Keywords: Epanet modeling, Pipe-borne water distribution, water pressure, water flow-rate.
1.0 Background to the Study
Water quality models are increasingly being routinely used to help ascertain the performance
of water distribution systems for design and operational management purposes. Practical
application of hydraulic modeling progressed significantly in the 1990s with the introduction
International Journal of Science, Environment ISSN 2278-3687 (O)
and Technology, Vol. 6, No 4, 2017, 2655 – 2673 2277-663X (P)
Received July 5, 2017 * Published Aug 2, 2017 * www.ijset.net

2656 Chukwudi G. Njoku, Inah Okon, Francis Okpiliya, Emmanuel A. Agbor and Innocent Ekwok
of the public domain EPANET model (Rossman, 2000). Other Windows-based commercial
water distribution system models such as Water CAD and Water GEMS were introduced as
well. However, advance in applications development now allow for the construction of
models that reflect both the temporal and spatial behavior of the network, known as Extended
Period Simulation (EPS) models (Fitaye, 2015). Hydraulic modeling functionality has
therefore become essential in the global water industry and is now an integral part of most
water system design, master planning, and fire flow analysis, particularly in the developed
world (Walski et al. 2003). Other scholars (Harding, 2007; Arunkumar and Mariappan, 2011;
Bwire, Onchiri and Mburu, 2015; Ayanshola and Sule, 2006, etc.) have used the Epanet 2
pressure-dependent hydraulic model extensively to simulate the performance of water
distribution systems. The application of this methodology becomes necessary due to the
problems of inequitable access to pipe-borne water distribution in Calabar.
The Water Project Report (2014) indicated that 783 million people do not have access to
clean and safe water, 37 percent of this population is in sub-Saharan Africa (United Nations
Sustainable Development Plan, 2015). This informed the United Nations Sustainable
Development Goals 6 (UNSDGs). The sixth goal of the sustainable development goal (SDG)
is to achieve universal and equitable access to safe and affordable water by the year 2030
(UNSDP, 2015). Water collection, treatment and distributionin Nigerian are a duties long
assigned to the State Water Boards (SWBs) Agencies or Corporations. In Calabar metropolis,
the provision of pipe-borne water has been tasked to the CRSWBLsince 1998 which was
earlier established as Water Board, by edict No. 13 of 1975. Its major functions were to
establish, control, manage and develop new water works and to extend and develop existing
ones for the purpose of providing water for individual and domestic needs (Cross River State
Technical Unit, 2009). In 2015, CRSWBL recorded an average monthly water supply of
573,981 m3. The supply rate has gradually increased since inception of the water board
service where in 2007 the average monthly supply was 360,738 m3
(CRSWBL,
2015).CRSWBL distributes processed water from their treatment facility at Ndidem Isong
Road, Calabar, through a series of pipes, mostly of plasticized polyvinyl chloride (PVC)
materials. The water is pumped from the ground level reservoirs (GLRs) into the elevated
water tanks (EWTs) from where it is gravitationally fed to homes. The behavior of a water
distribution system is governed by; physical laws that describe the flow relationships in the
pipes and hydraulic control elements, consumer demand, and system layout (Ostfield, Kogan
and Shamir, 2002).

Epanet Spatial Modeling for Equitable Pipe-Borne Water …. 2657
Changing technology and the availability of detailed spatial data have allowed for the
representation of geographic phenomena in a Geographic Information System (GIS) to more
closely resemble real-world phenomena (Cromley and Mclafferty, 2002; Matthew, 2012).
These fast growing technologies have introduced real-time computer simulation modeling of
water networks, such as the Epanet 2.0 software designed by the Water Supply and Water
Resources Division of the United States Environmental Protection Agency used in this study
to model the present distribution situation in the area. This tool becomes handy for planning
of pipe network systems to meet present and forecasted water demands as well as to manage
the operation status of the system (Rossman, 2000).
Calabar metropolis is the capital city of Cross River State in south-south Nigeria. It lies
between longitudes 8o18’00’’E to 8
o24’00’’E and latitudes 4
o54’00’’N to 5
o04’00’’N. The
Metropolis covers a land area of 137.039 square kilometers (sqkm) andan estimated
population of 435,196 in 2016.Calabar is located on a gently undulating plain ranging from
85 (Ikot Effanga) to 09 (Eta Agbor) mean sea levels.The pipe-borne water distribution area is
delineated into 4 zones; Ikot Effanga, Diamond Hill, Ediba Qua, and Eta Agbor distribution
zones(figure 1). Each zone has its EWT and a network of pipes and junctions. The pipes vary
in size from the 600mm diameter pipes which convey water from the tanks to the 75mm
pipes and finally to the service lines which disburses the water to residences. Therefore the
focus of this study is to use Epanet spatial modeling tools in assessing the physical challenges
of sustainable pipe-borne water distribution in Calabar. This is with a focus on water pressure
and flow rate at the consumer points.
2.0 Literature Review
Empirical literatures as regards to spatial modeling of pipe-borne water distribution are
lacking within the scope of this study, in as much as recent technologies abound on how to
simulate water distribution from available data in other locations. Sonaje (2015) buttressed
the continual increase in demand for portable water geared by a corresponding increase in
population. He noted that the ever increasing demand can be taken care of by designing
efficient water distribution networks based on advance computing systems including modern
hydraulic modeling and designing software including Epanet (public domain software),
Branch and Loop, Aquis, Water GEMS, Water CAD, etc.
Harding (2007) assessed the water distribution system of Mae La Temporary Shelter,
Thailand using GIS techniques. About 7,117 homes were selected as samples for the study
using Google Earth and in situ visits. ArcGIS and Epanet were used to evaluate the predicted
2658 Chukwudi G. Njoku, Inah Okon, Francis Okpiliya, Emmanuel A. Agbor and Innocent Ekwok
daily volume of drinking water available per home. His research found out that flow rates
predicted by the Epanet model are highly dependent on the elevation of distribution system
infrastructure points, which are difficult to determine accurately. Thus, while the final results
show one in four homes are not adequately served, the reliability of the rope-pump-well
proximity assessment and volume per home assessment is insufficient, and the findings could
be overly pessimistic. However, the research showed that the vast majority of residents in
Mae La have sufficient access to water.
The work of Arunkumar and Mariappan (2011) in urbanized areas of Chennai Metropolitan,
Tamil Nadu, India, examined the water demand analysis of public water supply in
municipalities using Epanet software. This was with the aim of providing effective planning,
development and operation of water supply and distribution networks. The study used data
provided by the municipality to delineate the areas that are un-served or underserved and the
demands for these areas calculated. The pipe-borne water network of the area was analyzed
for a 24 and 6 hour supply and the consumer satisfaction in obtaining water at the tail end
without any loss of pressure. The 6 hour analysis which represented intermittent supply as
mostly experienced in the area showed pressure loss at tail ends. Recommendations were
made on practical ways to balance distribution for intermittent supply through maintaining
even pressure at all nodes during supply.
Bwire, Onchiri and Mburu (2015) opined that a well-designed water system is meant to
operate optimally such that consumers have access to portable water of sufficient pressure
and quality at all times. Their study investigated the operations of Kimilili water supply
system in Bungoma County of Kenya in terms of pressure variations from the treatment
works to the consumer points. The main objective was to simulate pressure variations in the
distribution system using Epanet software and compare with measured data in the field.
Results from their analyses showed that simulated water pressure did not vary significantly
with the actual values indicating that the pipes still had their hydraulic capacities even though
some sections of the network need augmentation.

Epanet Spatial Modeling for Equitable Pipe-Borne Water …. 2659
FIG 1: Topography of Calabar metropolis and the four distribution zones
(Source: Earth Explorer, 2015; Author’s field work, 2016)
Furthermore, Ayanshola and Sule (2006) assessed the flow pressure in selected zones of
Ilorin township water supply network, in Kwara State, Nigeria. Pipe network analysis was
carried out based on the demand for 10 cases using the location of the service reservoirs and
the actual production for distribution to three zones within the study area. The maximum and
the minimum nodal pressures obtained were compared with recommended values for
satisfactory performance of a water supply pipe network. This review shows that lapses in
pipe-borne water distribution due to insufficient flow rate and pressure can impede equitable
access to the service by households.

2660 Chukwudi G. Njoku, Inah Okon, Francis Okpiliya, Emmanuel A. Agbor and Innocent Ekwok
3.0 Materials and Methods
Data were sourced from the 1991 census data from the NPC and CRSWBL data such as; the
2015 map of pipe-borne water network and distribution zones, locational and attribute data of
EWTs, pipes and junctions. A 1-arc second resolution Advanced Space-borne Thermal
Emission and Reflection Radiometer (ASTER) Digital Elevation Model of the metropolis
was also sourced from Earth Explorer (www.earthexplorer.usgs.gov, 2015) to aid in
determining the topographic nature of the area. GIS analytical methods were used to model
the existing pipe-borne water network of the metropolis in preparation for the pipe network
data in a geometric network topology, plotting the tank locations (points) and distinguishing
the pipes (lines) from the junctions (nodes). The Epanet program performed real-time
simulation of hydraulic and water quality behavior within pressurized pipe networks and is
designed to be a research tool that improves our understanding of the movement and fate of
water within the system (Rossman, 1999).
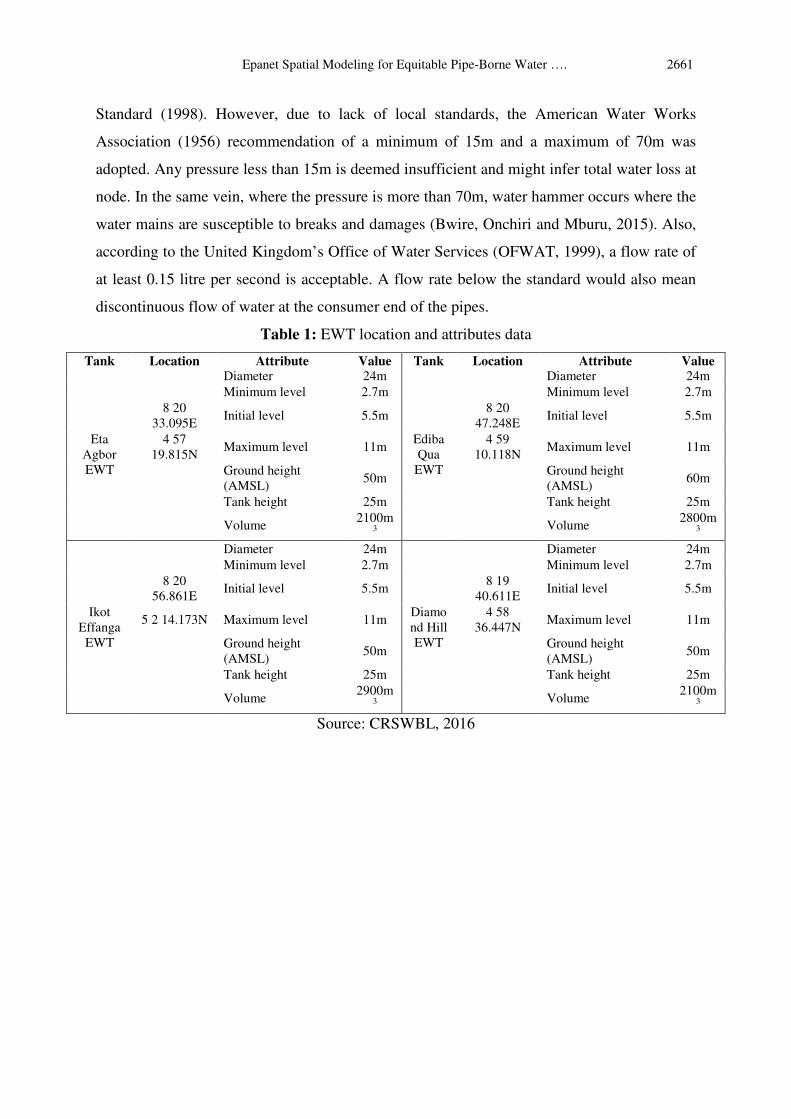
To simulate daily water use, analyze the pressure at each node and track the flow of water in
each pipe, attribute data of the EWTs, pipes and junctions (Table 1) were imputed into the
software. The ground elevation of these components are very important in the network as it
greatly determines the pressure and flow rate of water to homes, especially as the CRSWBL
uses a gravity fed distribution system consistent with Harding (2007). The simulation was
done for each distribution zone, as households in each zone are served from their respective
EWTs. Parameters set included the Hazen-Williams (H-W) head-loss formula to compute the
hydraulic head lost by water flowing in a pipe due to friction with the pipe walls (Almasri,
2012), and others shown in Table 2. Furthermore, a household water demand time pattern
was assigned for each junction, representing demand at different times of the day. The 24
hour time period pattern was used, where water demand was modeled to be higher in the
early hours of the morning and in the evening guided by Rossman’s (2000) EPANET 2
User’s Manual. This pattern also aided in Extended Period Simulation (EPS) of pressure and
flow rate at different hours of the day (6:00am, 12 noon and 6:00pm).
According to Ayanshola and Sule (2006), the minimum residual pressure for pipe network
systems pressure varies from one water agency to another and among countries. Bhardwaj
(2001) recommended a minimum pressure head of 25m and maximum of 70m. Arunkumar
and Mariappan, 2011, quoted the Central Public Health and Environmental Engineering, New
Delhi, India (1999) to have stipulated a minimum pressure of 12m at destination junctions.
About 35m and 140m were recommended by Washington State University Uniform Design
Epanet Spatial Modeling for Equitable Pipe-Borne Water …. 2661
Standard (1998). However, due to lack of local standards, the American Water Works
Association (1956) recommendation of a minimum of 15m and a maximum of 70m was
adopted. Any pressure less than 15m is deemed insufficient and might infer total water loss at
node. In the same vein, where the pressure is more than 70m, water hammer occurs where the
water mains are susceptible to breaks and damages (Bwire, Onchiri and Mburu, 2015). Also,
according to the United Kingdom’s Office of Water Services (OFWAT, 1999), a flow rate of
at least 0.15 litre per second is acceptable. A flow rate below the standard would also mean
discontinuous flow of water at the consumer end of the pipes.
Table 1: EWT location and attributes data
Tank Location Attribute Value Tank Location Attribute Value
Eta
Agbor
EWT
Diameter 24m
Ediba
Qua
EWT
Diameter 24m
Minimum level 2.7m Minimum level 2.7m
8 20
33.095E Initial level 5.5m
8 20
47.248E Initial level 5.5m
4 57
19.815N Maximum level 11m
4 59
10.118N Maximum level 11m
Ground height
(AMSL) 50m
Ground height
(AMSL) 60m
Tank height 25m Tank height 25m
Volume 2100m
3
Volume 2800m
3
Ikot
Effanga
EWT
Diameter 24m
Diamo
nd Hill
EWT
Diameter 24m
Minimum level 2.7m Minimum level 2.7m
8 20
56.861E Initial level 5.5m
8 19
40.611E Initial level 5.5m
5 2 14.173N Maximum level 11m 4 58
36.447N Maximum level 11m
Ground height
(AMSL) 50m
Ground height
(AMSL) 50m
Tank height 25m Tank height 25m
Volume 2900m
3
Volume 2100m
3
Source: CRSWBL, 2016

2662 Chukwudi G. Njoku, Inah Okon, Francis Okpiliya, Emmanuel A. Agbor and Innocent Ekwok
Table 2: Inputs for pipes and junctions within the network
Feature Input Attribute
Pipe ID Px
Start Node Junction A
Pipes End Node Junction B
Length (m)
Auto generated for every
pipe
Diameter (mm)
75, 110, 160, 200, 225, 350,
500, 600
Roughness 140
Junction ID Jx
Node Coordinates Eastings and Northings
Junctions Elevation (AMSL) Inputed for every node
Base Demand (LPD, Per
Household) 80
Demand Pattern Pa1
Source: CRSWBL, 2016
4.0 Results and Discussions
Having identified the need to model the pipe-borne water network of the city to
ensure equitable pipe-borne water distribution and an improved access to the resource in the
long run, the existing piping network of the area is subjected to computer simulations using
Arc Map and EPANET analytical tools. The inputs for the junctions and pipes within the
network are illustrated in table 2. For the pipes, the results of the analyses are the flow rate of
water within the system, while for the junctions, the pressure of water. The results of the
analyses are presented in colour ramped maps showing the pressure and flow rate variations
at all the four pipe-borne water distribution zones of the metropolis. The maximum and the
minimum nodal pressures obtained from the EPS were compared with recommended values
for satisfactory performance of the water supply pipe network.
4.1.1 Eta Agbor distribution zone water pressure and flow rate
During early hours of the morning (6:00 am) when water use is presumed to be high, the
analysis showed that low water pressure was recorded within Ward 1 of the Municipal LGA,
specifically around Barracks Road and Bogobiri Street. A total of 15 junctions as shown in
Appendix 1depicted pressures below 15m and no junction exhibited pressures more than the
70m bar. The flow rate analysis at this time also showed variation within the zone, generally
below 0.15 LPS in 491 of the 676 pipes. By 12:00 noon, pressures for all junctions were
above the 15m stipulated and flow rates were lower than 0.15 LPS with exemption to the
pipes parallel to Yellow Duke Street, Mount Zion Road and Goldie Street in Calabar South
LGA as expressed in Appendix 2. In the evening (6:00 pm), there was no significant

Epanet Spatial Modeling for Equitable Pipe-Borne Water …. 2663
difference with pressure values obtained by noon. As shown in Appendix 3, no junction had
pressures below the standard, 89 between 25m and 15m clustered around the EWT. No
junction depicted high pressures of concern and the result of the flow rate analysis showed
that 107 pipes met the specification. The implication of the low pressures portrayed in the
morning period within the vicinity of Barracks Road and Bogobiri Street would most likely
mean intermittency in water supply for residents of these locations.
4.1.2 Ikot Effanga distribution zone water pressure and flow rate
At dawn (6:00 am), pressure was less than required in 35.1 percent of the junctions
representing 103 junctions in the area. Appendix 4 shows that pressure was deficient around
N line, Phase 1, SPC, Road 7 and Block 13 of Federal Housing Estate in Ward 8, as well as
Ward 9, both of the municipality. Flow rate at dawn is shown on Appendix 4to be below par
in 24 pipes and high rates around the EWT. Pressure at 12:00 noon had similar characteristics
with what was obtainable at dawn. The difference is slight with 105 junctions having
pressures less than the standard. The flow rate at noon practically reduced as envisioned in
Appendix 5. Here, only 43 pipes had sufficient flows while 287 were deficient of the required
rate. By sunset (6:00 pm), pressure was once again depicted similar characteristics with the
rate at dawn at same areas, with 103 nodes above the permissible limit and 145 pipes had
flows more than 0.15 LPS as pictured in same Appendix 5. Based on the flow rate of the
water, the service would be most sufficient in the morning and in the evening periods. Ikot
Effanga area as noted earlier has the highest elevation in the metropolis. This may be the
reason for the low pressure experienced at more than 100 junctions at all simulated periods of
the day. These locations with high elevations and resultant low pressure rates most likely
experience intermittency in water supply, thus reducing their overall access to pipe-borne
water. The problem here is compounded when ground heights at the junctions are higher or at
near elevation with the tank overall height. Table 1 reveals that the ground height measured at
the Ikot Effanga EWT location is 50m while the height of the tank is 25m, thus a total of
75m. Given that locations exist with heights of 85m within the area, it becomes less
surprising that low pressures are eminent within the zone.
4.1.3 Ediba Qua distribution zone water pressure and flow rate
At exactly 6:00 am, pressure ranged between 25m and 50m around 3rd
Avenue of Ward 4 and
Nipost Street of Ward 6, both of Calabar Municipality. 7 junctions exhibited pressures higher
than the 70m standard at the northeastern end of the zone, around the tail end of MCC Road
(Appendix 6). On the other hand, only 21 pipes had flow rates below 0.15 LPS. Noticeable,

2664 Chukwudi G. Njoku, Inah Okon, Francis Okpiliya, Emmanuel A. Agbor and Innocent Ekwok
flow rate was highest in the pipes with larger diameters across the zone such as those aligning
parallel to Ndidem Usang Isoand MCC Roads. Pressure at 12 noon was similar to what was
obtainable at 6:00 am. As presented in Appendix 7, 7 junctions still had pressures higher than
70m and no area had a cause for low pressure concerns while flow rate decreased at noon for
most parts of the zone. The analysis also showed that, in the evening (6:00 pm), pressure was
not significantly different from what was deduced at noon, although at this time, flow rate
increased, even though as much as 149 of the 283 pipes had flows less than 0.15 LPS. The
implication of having pressures above the specification is that the water could destroy the
facilities by causing frequent breakage of pipes and junctions. When the system gets damaged
frequently, geographic dimensions of access to water begins to get jeopardized in the areas
with such scenario. The Ediba Qua EWT was observed to be sited at a ground level 60m
AMSL, relatively higher than other areas within the zone. This obviously informed the
absence of low pressure within the zone and most likely the same reason why some areas on
MCC Road depict pressure above the 70m bar.
4.1.4 Diamond Hill distribution zone water pressure and flow rate
For Diamond Hill zone, in the morning (6:00 am), water pressure was lower than 15m at 18
junctions around Atekong Drive and Ediba Road. The other 311 junctions were within
acceptable limits. This is presented in Appendix 8. At same time, as exhibited in the same
figure, flow was generally within workable measures, except for 34 pipes scattered around
the zone. Appendix 9 indicates that, by 12:00 noon, in Diamond Hill zone, water pressure
was generally within given standards as only 6 junctions had low pressures around same area
as at dawn. Flow was seen to reduce significantly, leaving only the pipes with diameters
greater than 200mm with high flow rates. The analysis revealed that at sunset (6:00 pm),
pressure was low around Atekong Street, Chief Obot Street and the intersection of Ediba
Road and Ndidem Usan Road. All these locations of low pressures were within Ward 4 of the
Municipality. 24 junctions exhibited low pressures while 38 pipes had flow rates below 0.15
LPS (Appendix 10). At the morning and evening hours, when water use is at its peak, water
flow rate was significantly high and good enough for sufficient supply. This is however still
dependent on the quality of pressure. The northeastern end of this zone is highest in ground
elevation as shown in the topographic map (Figure 1) and is a contributor to the presence of
low pressures at some nodes within the area. Whereas other residents within the zone would
receive adequate amount of water whenever it is disbursed, some residents around Atekong

Epanet Spatial Modeling for Equitable Pipe-Borne Water …. 2665
Drive, Ediba Road, Chief Obot Street, etc. can only wonder why they are seemingly cut short
of the service
5.0 Conclusion
The goal of this study was to spatially investigate sustainability in terms of equity in the
distribution of pipe-borne water in Calabar metropolis. This is believed to provide decision
support for efficient pipe-borne water supply in the city.GIS modeling techniques aided in the
display of locations in each of the four pipe-borne water distribution zones of the metropolis
where water pressure and flow rate was low, normal or high at different times of the day.
Noticeable from the simulation results is the fact that areas with low water pressure had very
high elevations, with cases around Ikot Effanga zone where some pipe junctions were laid on
elevations higher than the total height of the EWT. In a gravity fed water distribution system,
areas with such elevations within the network would most likely experience intermittent
water supply. Also areas with the potential of pipe network infrastructure damage from water
hammer induced by very high pressure were identified. The EPS also mapped the flow
situation of the water network within the metropolis. Observations from the results also
showed that there were significantly much more pipes with flow rates lower than 0.15 LPS at
noon time in all the distribution zones, when water use is supposedly minimal.
6.0 Recommendations
Recommendations were made as blueprints for improving overall access to pipe-borne water
in the study area. There is need for CRSWBL to re-assess the pipe-borne water distribution
network of the metropolis. This is in light of the recent discovery of the behavior of the
distribution system at different times of the day and locations of the city. It is necessary that
concerned administrators are guided by the simulation results showing pipe-borne water
pressure and flow rate within the network. Also, since the pipe-borne water distribution
system is gravity-fed, the low water pressure and flow rate problem can be curbed through
installation of electric pump stations en-route areas discovered to have low pressures. These
pumps would assist to push water up to locations that experience water cuts and intermittency
due to low pressures and increase the flow rate of the water when necessary. In the same
vein, pressure breaks must also be installed on the revealed high pressure lines. This is to
check damage of pipes from extreme pressures.
There is also need for specific studies on the behavior of water distribution systems not only
in Calabar metropolis, but in other Nigerian cities that have operational systems and beyond.
More importantly, water pressure and flow rate simulations should be executed even before
2666 Chukwudi G. Njoku, Inah Okon, Francis Okpiliya, Emmanuel A. Agbor and Innocent Ekwok
installation of pipes, junctions and tanks in areas where new distribution systems are planned.
This is to ensure proper placement of the objects to avoid eventual distribution problems that
may arise, especially in pressure-fed systems which are usually most suitable for regions with
electricity problems.
References
[1] Abaje, I.B., Ati, O.F. &Ishaya, S. (2009). Nature of potable water supply and demand in
Jema’a Local Government Area of Kaduna State, Nigeria. Research Journal of
Environmental and Earth Sciences 1(1), 16-21
[2] Akintoye, O.A., Okon, A.E., Ekanem, E.E. &Idoko, M.A. (2013). Mapping the risk
mitigation of flood occurrence in Calabar.Nigeria. Journal of Environmental and Earth
Science. 3(4), 8-14.
[3] Almasri, M.N. (2012). Optimal design of water distribution networks, An-Najah National
University.
[4] American Water Works Association (1956), Recommended Practice for Distribution
System Records, C900, New York.
[5] Amori, A. & Makinde, A. (2012).Evaluation of access to public water supply in two
major cities in Nigeria. American Journal of Environmental Engineering, 2(6): 148-151.
[6] Arunkumar M. & Mariappan, N.V.E. (2011). Water demand analysis of municipal water
supply using EPANET software. International Journal on Applied Bioengineering, 5 (1), 9-
18.
[7] Ayanshola, A.M. & Sule, B.F. (2006). Assessment of flow pressure in selected zones of
Ilorin township water supply network. Journal of Research Information in Civil Engineering.
3(1), 83-101.
[8] Bhardwaj, V. (2001). Reservoirs, Towers, and Tanks: Drinking Water Storage Facilities,
Tech Brief; National Drinking Water Clearinghouse, Tap Magazine.
[9] Bwire, C., Onchiri, R., Mburu, N. (2015). Simulation of pressure variations within
Kimilili water supply system using EPANET.International Journal of Civil Engineering and
Technology. 6 (4), 28-38.
[10] Cromley, E.K. & McLafferty, S.L. (2002), GIS and Public Health, Guilford Press, New
York.
[11] CRSTU (2009). Cross River State Water Supply and Sanitation Policy Report. Final
Draft. Retrieved December, 2015 from
http://www.crswaterboard.com/documents/crs_final_draft_wss_policy.doc.

Epanet Spatial Modeling for Equitable Pipe-Borne Water …. 2667
[12] CRSWBL (2015). Volume of water distributed monthly in Calabar Metropolis.
Retrieved January, 2016 from Monthly Water Production and Distribution Report, CRSWBL,
Calabar.
[13] Harding, M.P. (2008). GIS representation and assessment of water distribution system
for Mae La Temporary Shelter, Thailand. Thesis submitted to the Department of Civil and
Environmental Engineering in Partial Fulfillment of the Requirements of the Degree of
Master of Engineering in Civil and Environmental Engineering at the Massachusetts Institute
of Technology.
[14] Ikelegbe & Okoruwa (2007).Meeting the demand for pipe borne water supply in an
urban environment: the case of Benin City. Research Gate. Retrieved November, 2015 from:
http://www.researchgate.net/publication/245869609
[15] Matthew, R.M., (2012), Spatial accessibility of primary health care utilizing the two step
floating catchment area method: an assessment of recent improvements. International
Journal of Health Geographics, 11(50), 2-12, Retrieved November, 2015 from http://www.ij-
healthgeographics.com/content/11/1/50.
[16] National Population Commission (2016). Nigeria Over 167 Million Population:
Implications and Challenges. Retrieved May 2016 from
http://www.population.gov.ng/index.php/84-news/latest/106-nigeria-over-167-million-
population-implications-and-challenges
[17] OFWAT (1999). July return — reporting requirements and definitions manual.Office of
Water Services, Birmingham, UK.
[18] Ostfield A. Kogan, D & Shamir, U. (2002).Reliability simulation of water distribution
systems- single and multi-quality.Elseveir Urban Water 4, 53-61.
[19] Rossman, L.A. (1999) “Computer Models/EPANET”, in L. Mays, ed., Water
Distribution Systems Handbook, Chapter 12, McGrawHill Companies Inc., New York.
[20] Rossman, L.A. (2000). EPANET 2 User’s Manual. United States Environmental
Protection Agency, Water Supply and Water Resources Division,EPA/600/R-00/057.
[21] Sonaje, N. P. (2015). A review of modeling and applications of water distribution
network softwares.International Journal of Technical Research and Applications. 3 (5), 174-
178
[22] Tang, T. & Keyser, G. (2007).Spatial analysis of household water supply and demand in
a distributed geographic network in the towns of Amherst and Clarence, New York.Middle
States Geographer. 40:133-135

2668 Chukwudi G. Njoku, Inah Okon, Francis Okpiliya, Emmanuel A. Agbor and Innocent Ekwok
[23] Uneke, C.J., Ogbonna, A., Ezeoha, A., Oyibo, P., Onwe, F., & Ngwu, B. (2008). The
Nigeria health sector and human resource challenges. The Internet Journal of Health, 8(1), 1-
5.
[24] United Nations Sustainable Development Plan.(2015). Retrieved October, 2015 from
http//www.un.org/sustainabledevelopment/water-aid-sanation/#6604b7b1968a53ffg.
[25] Vanguard News (2015) Water’s Like Electricity in Calabar: No Service, Huge Bills, by
Ike Uchechukwu. Retrieved July, 2016 from http://www.vanguardngr.com/2015/04/waters-
like-electricity-in-calabar-no-service-huge-bills/
[26] Washington State University Uniform Design Standards (1998), Water Distribution
Systems, Part C, Section 02660-4.
[27] Water Project Report (2014). Retrieved November, 2015 from
http//thewaterproject.org/water_stats.
[28] WHO/UNICEF (2014).Joint monitoring programme for water supply and sanitation
report. Retrieved December, 2015 fromhttp://www.wssinfo.org/.
[29] Fitaye, S.M. (2015). Hydraulic Modeling and Improvement of Addis Ababa Water
Supply System (The Case of Bole Bulbula). A thesis Submitted to the School of Graduate
Studies of Addis Ababa University in Partial Fulfillment of the Degree of Master of Science
in Civil Engineering.
Appendices
Appendix 1: Eta Agbor pressure and flow rate at 6am (Source: Author’s field work, 2016)

Epanet Spatial Modeling for Equitable Pipe-Borne Water …. 2669
Appendix 1: Eta Agbor pressure and flow rate at 6am (Source: Author’s field work, 2016)
Appendix 2: Eta Agbor pressure and flow rate at 12 noon (Source: Author’s field work, 2016)

2670 Chukwudi G. Njoku, Inah Okon, Francis Okpiliya, Emmanuel A. Agbor and Innocent Ekwok
Appendix 3: Eta Agbor pressure and flow rate at 6pm (Source: Author’s field work, 2016)
Appendix 4: Ikot Effanga pressure and flow rate at 6am (Source: Author’s field work, 2016)

Epanet Spatial Modeling for Equitable Pipe-Borne Water …. 2671
Appendix 5: Ikot Effanga flow rate at 12 noon and 6pm (Source: Author’s field work, 2016)
Appendix 6: Ediba Qua pressure and flow rate at 6am (Source: Author’s field work, 2016)
Appendix 7: Ediba Qua pressure and flow rate at 12 noon (Source: Author’s field work,
2016)

2672 Chukwudi G. Njoku, Inah Okon, Francis Okpiliya, Emmanuel A. Agbor and Innocent Ekwok
Appendix 8: Diamond Hill pressure and flow rate at 6am (Source: Author’s field work, 2016)
Appendix 9: Diamond Hill pressure and flow rate at 12 noon
(Source: Author’s field work, 2016)

Epanet Spatial Modeling for Equitable Pipe-Borne Water …. 2673
Appendix 10: Diamond Hill pressure and flow rate at 6pm
(Source: Author’s field work, 2016)