
EPA238 OALL OALL TR 0MOD Chapters 1-12 and Accountability...Linking the 2011 Operational Test to the...
466
TECHNICAL REPORT for the 2012 Modified Pennsylvania System of School Assessment Provided by Data Recognition Corporation
Transcript of EPA238 OALL OALL TR 0MOD Chapters 1-12 and Accountability...Linking the 2011 Operational Test to the...

TECHNICAL REPORT
for the 2012 Modified Pennsylvania System of School Assessment
Provided by Data Recognition Corporation


Table of Contents
2012 PSSA-M Technical Report
Glossary of Common Terms ................................................................................................................ i
Preface: An Overview of Modified Assessments from 2008 to the Present ..................................... ix
Assessment Activities Occurring in the 2008–09 School Year .................................................................. ix Assessment Activities Occurring in the 2009–10 School Year ................................................................... x Assessment Activities Occurring in the 2010–11 School Year .................................................................. xi Assessment Activities Occurring in the 2011–12 School Year ................................................................. xii Assessment Activities Planned for the 2012–13 School Year ................................................................. xiii
Chapter One: Background of the Modified Pennsylvania System of School Assessment (PSSA-M) .......................................................................................................................................... 1
State and Federal Regulations Affecting the PSSA ..................................................................................... 1 Purposes of the PSSA .................................................................................................................................. 1 Changes in 2005 and Beyond ...................................................................................................................... 2 Students with Complex Support Needs: Alternate Assessment .................................................................. 2 Students with Disabilities Needing a Modified Approach: Modified Assessment ..................................... 3
Chapter Two: Test Development Overview of the Modified PSSA ................................................... 5
Overview of the Development Process ....................................................................................................... 5 Academic Standards, Assessment Anchor Content Standards, and Eligible Content ................................. 5
Chapter Three: Item Development Process ..................................................................................... 13
Steps in the Development Process ............................................................................................................. 13 Summary of Revision and/or Enhancement Guidelines ............................................................................ 19 Item Authoring and Tracking .................................................................................................................... 21 Internal Reviews and PDE Reviews .......................................................................................................... 21 Reading Pilot ............................................................................................................................................. 24 Cognitive Interviews ................................................................................................................................. 26 Test Content Blueprint for 2012 PSSA-M Assessments ........................................................................... 28 Test Development Considerations for the PSSA-M .................................................................................. 37 Test Development Process ........................................................................................................................ 39
Chapter Four: Universal Design Procedures Applied in the Modified PSSA Test Development Process .............................................................................................................. 41
Elements of Universally Designed Assessments ....................................................................................... 41 Guidelines for Universally Designed Items .............................................................................................. 43 Item Development ..................................................................................................................................... 44 Item Formatting ......................................................................................................................................... 45 Assessment Accommodations ................................................................................................................... 46
Chapter Five: Field Test Leading to the 2012 Core ........................................................................ 47
Standalone Field-Test Items ...................................................................................................................... 47 Statistical Analysis of Item Data ............................................................................................................... 48 Review of Items with Data ........................................................................................................................ 48
Chapter Six: Operational Forms Construction for 2012 ................................................................ 51
Final Selection of Items and 2012 PSSA-M Forms Construction ............................................................. 51 Linking the 2011 Operational Test to the 2012 Operational Test ............................................................. 52 Special Forms Used in the 2012 PSSA-M ................................................................................................ 52

Table of Contents
2012 PSSA-M Technical Report
Chapter Seven: Test Administration Procedures ............................................................................. 55
Test Sessions, Test Sections, and Test Timing .......................................................................................... 55 Testing Window ........................................................................................................................................ 58 Shipping, Packaging, and Delivery of Materials ....................................................................................... 58 Materials Returned .................................................................................................................................... 59 Test Security Measures ............................................................................................................................. 59 Sample Manuals ........................................................................................................................................ 59 Testing Window Assessment Accommodations ....................................................................................... 59
Chapter Eight: Processing and Scoring ........................................................................................... 61
Receipt of Materials .................................................................................................................................. 61 Scanning of Materials ................................................................................................................................ 62 Materials Storage ....................................................................................................................................... 65 Scoring Multiple-Choice Items ................................................................................................................. 66 Rangefinding ............................................................................................................................................. 66 Rater Recruitment/Qualifications .............................................................................................................. 67 Leadership Recruitment/Qualifications ..................................................................................................... 67 Training ..................................................................................................................................................... 68 Handscoring Process ................................................................................................................................. 69 Handscoring Validity Process ................................................................................................................... 69 Quality Control .......................................................................................................................................... 71
Chapter Nine: Description of Data Sources and Sampling Adequacy ........................................... 75
Primary Student Filtering Criteria ............................................................................................................. 75 Key Validation Data .................................................................................................................................. 75 Final Data .................................................................................................................................................. 76 Final N-Counts for all Data Sources .......................................................................................................... 76
Chapter Ten: Summary Demographic, Program, and Accommodation Data for the 2012 PSSA-Modified .......................................................................................................... 77
Assessed Students ...................................................................................................................................... 77 Composition of Sample Used in Subsequent Tables ................................................................................. 80 Collection of Student Demographic Information ...................................................................................... 80 Demographic Characteristics ..................................................................................................................... 80 Test Accommodations Provided ................................................................................................................ 86 Presentation Accommodations Received .................................................................................................. 86 Response Accommodations Received ....................................................................................................... 87 Setting Accommodations Received ........................................................................................................... 87 Timing Accommodations Received .......................................................................................................... 87 Accommodation Rate ................................................................................................................................ 94 The Incidence of Accommodations and ELL Status ................................................................................. 95 Glossary of Accommodations Terms ...................................................................................................... 102

Table of Contents
2012 PSSA-M Technical Report
Chapter Eleven: Classical Item Statistics ...................................................................................... 107
Item-Level Statistics ................................................................................................................................ 107 Item Difficulty ......................................................................................................................................... 107 Item Discrimination ................................................................................................................................. 108 Discrimination on Difficulty Scatterplots ............................................................................................... 108 Observations and Interpretations ............................................................................................................. 109
Chapter Twelve: Rasch Item Calibration ....................................................................................... 115
Description of the Rasch Model .............................................................................................................. 115 Checking Rasch Assumptions ................................................................................................................. 116 Rasch Item Statistics ............................................................................................................................... 122
Chapter Thirteen: Performance-Level Setting .............................................................................. 133 Summary ................................................................................................................................................. 133 PSSA-M Cut Scores ................................................................................................................................ 135
Chapter Fourteen: Scaling ............................................................................................................. 137 Scaled Scores ........................................................................................................................................... 137 Raw-Score to Scaled-Score Tables ......................................................................................................... 138 Strand (Reporting Category) Score Strength Profile ............................................................................... 140
Chapter Fifteen: Linking ................................................................................................................ 141 Forward ................................................................................................................................................... 141 Introduction ............................................................................................................................................. 141 Brief Summary of the PSSA-M Linking Procedure ................................................................................ 141 PSSA-M Reading and Science ................................................................................................................ 143 Linking Method for PSSA-M Reading and Science ............................................................................... 144 Results Summary ..................................................................................................................................... 144 Visualization Supplement ........................................................................................................................ 145
Chapter Sixteen: Scores and Score Reports................................................................................... 155 Scoring the PSSA-M ............................................................................................................................... 155 Description of Total Test Scores ............................................................................................................. 155 Description of Strand (Reporting Category) Scores ................................................................................ 158 Appropriate Score Uses ........................................................................................................................... 159 Cautions for Score Use ............................................................................................................................ 159 Reports..................................................................................................................................................... 161
Chapter Seventeen: Operational Test Statistics ............................................................................. 169 Performance-Level Statistics ................................................................................................................... 169 Scaled Scores ........................................................................................................................................... 169 Raw Scores .............................................................................................................................................. 170

Table of Contents
2012 PSSA-M Technical Report
Chapter Eighteen: Reliability ......................................................................................................... 175 Reliability Indices .................................................................................................................................... 176 Coefficient Alpha .................................................................................................................................... 176 Further Interpretations ............................................................................................................................. 178 Standard Error of Measurement .............................................................................................................. 181 Rasch Conditional Standard Errors of Measurement .............................................................................. 184 Decision Consistency .............................................................................................................................. 190 Rater Agreement ...................................................................................................................................... 193
Chapter Nineteen: Validity ............................................................................................................. 195 Purposes and Intended Uses of the PSSA-M ........................................................................................... 195 Evidence Based on Test Content ............................................................................................................. 196 Evidence Based on Response Processes .................................................................................................. 198 Evidence Based on Internal Structure ..................................................................................................... 198 Evidence Based on Consequences of Testing ......................................................................................... 209 Evidence Related to the Use of the Rasch Model ................................................................................... 209 Validity Evidence Summary.................................................................................................................... 210
References ....................................................................................................................................... 211
Appendix A. Assessment Anchor Explanations Appendix B. PSSA and PSSA-M General Scoring Guidelines Appendix C. 2012 Modified PSSA Tally Sheets Appendix D. Item and Test Development Process Appendix E. PSSA-M Item Review Cards Appendix F. Item Rating Sheet and Item Review Criteria Guidelines Appendix G. 2012 Test Book Section Layout Plans Appendix H. Mean Raw Scores by Form Appendix I. Item Statistics Appendix J. Linking Item Statistics Appendix K. Reliabilities Appendix L. Cut Scores and Transformations Appendix M. Historical Statistics Appendix N. Raw-to-Scaled Score Conversion Tables Appendix O. PSSA and PSSA-M Demographics Comparison

Glossary of Common Terms
2012 PSSA-M Technical Report Page i
Glossary of Common Terms The following table contains some terms used in this technical report and their meanings. Some of these terms are used universally in the assessment community, and some of these terms are used commonly by psychometric professionals. A glossary of accommodation terms as applied to the PSSA is provided in Chapter Ten.
Table G–1. Glossary of Terms
Term Common Definition
Ability In Rasch scaling, ability is a generic term indicating the level of an individual on the construct measured by an exam. As an example for the PSSA, a student’s reading ability is measured by how the student performed on the PSSA Reading test. A student who answered more items correctly has a higher ability than a student who answered fewer items correctly.
Adjacent Agreement
A score/rating difference of one (1) point in value usually assigned by two different raters under the same conditions (e.g., two independent raters give the same paper scores that differ by one point).
Alternate Forms
Two or more versions of a test that are considered exchangeable (i.e., they measure the same constructs in the same ways, are intended for the same purposes, and are administered using the same directions). More specific terminology applies depending on the degree of statistical similarity between the test forms (e.g., parallel forms, equivalent forms, and comparable forms) where parallel forms refers to the situation in which the test forms have the highest degree of similarity to each other.
Average A measure of central tendency in a score distribution that usually refers to the arithmetic mean of a set of scores. In this case, it is determined by adding all the scores in a distribution and then dividing the obtained value by the total number of scores. Sometimes people use the word average to refer to other measures of central tendency such as the median (the score in the middle of a distribution) or mode (the score value with the greatest frequency).
Bias In a statistical context, bias refers to any source of systematic error in the measurement of a test score. In discussing test fairness, bias may refer to construct-irrelevant components of test scores that differentially affect the performance of different groups of test takers (e.g., gender, ethnicity, etc.). Attempts are made to reduce bias by conducting item fairness reviews and various differential item functioning (DIF) analyses, detecting potential areas of concern, and either removing or revising the flagged test items prior to the development of the final operational form of the test (see also Differential Item Functioning).
Constructed-Response Item
See Open-Ended Item.
Content Validity Evidence
Evidence regarding the extent to which a test provides an appropriate sampling of a content domain of interest (e.g., assessable portions of a state’s Grade 6 mathematics curriculum in terms of the knowledge, skills, objectives, and processes sampled.)

Glossary of Common Terms
2012 PSSA-M Technical Report Page ii
Table G–1 (continued). Glossary of Terms
Term Common Definition
Core-Linking Item
Items that are utilized during the linking process (see also Linking). They are a subset of the PSSA operational items and so they 1) are the same on all test forms for any grade/subject area test and 2) contribute to student total raw scores and scaled scores.
Criterion- Referenced Interpretation
When a score is interpreted as a measure of a student’s performance with respect to an expected level of mastery, educational objective, or standard. The types of resulting score interpretations provide information about what a student knows or can do with respect to a given content area.
Cut Score A specified point on a score scale such that scores at or above that point are interpreted or acted upon differently from scores below that point (e.g., a score designated as the minimum level of performance needed to pass a competency test). One or more cut scores can be set for a test, resulting in division of the score range into various proficiency level ranges. Methods for establishing cut scores vary. For the PSSA, three cut scores are used to place students into one of four performance levels (see also Performance Level Setting).
Decision Consistency
The extent to which classifications based on test scores would match the decisions based on scores from a second, parallel form of the same test. It is often expressed as the proportion of examinees who are classified the same way from the two test administrations.
Differential Item Functioning (DIF)
A statistical property of a test item in which different groups of test takers (who have the same total test score) have different average item scores. In other words, students with the same ability level but different group memberships do not have the same probability of answering the item correctly (see also Bias).
Distractor An incorrect option in a multiple-choice item (also called a foil).
Equating The strongest of several linking methods used to establish comparability between scores from multiple tests. Equated test scores should be considered exchangeable. Consequently, the criteria needed to refer to a linkage as equating are strong and somewhat complex (equal construct and precision, equity, and invariance). In practical terms, it is often stated that it should be a matter of indifference to a student if he/she takes any of the equated tests (see also Linking).
Equating Block (EB) Items
The PSSA uses multiple test forms for each grade/subject area test. Each form is composed of operational (OP) items, equating block (EB) items, and field test (FT) items. EB items are utilized during the linking process (see also Linking). Each test form includes a set of EB items. EB items are not part of any student scores.
Error of Measurement
The amount by which the score actually received (an observed score) differs from a hypothetical true score (see also Standard Error of Measurement).
Exact Agreement When identical scores/ratings are assigned by two different raters under the same conditions (e.g., two independent raters give a paper the same score).
Glossary of Common Terms
2012 PSSA-M Technical Report Page iii
Table G–1 (continued). Glossary of Terms
Term Common Definition
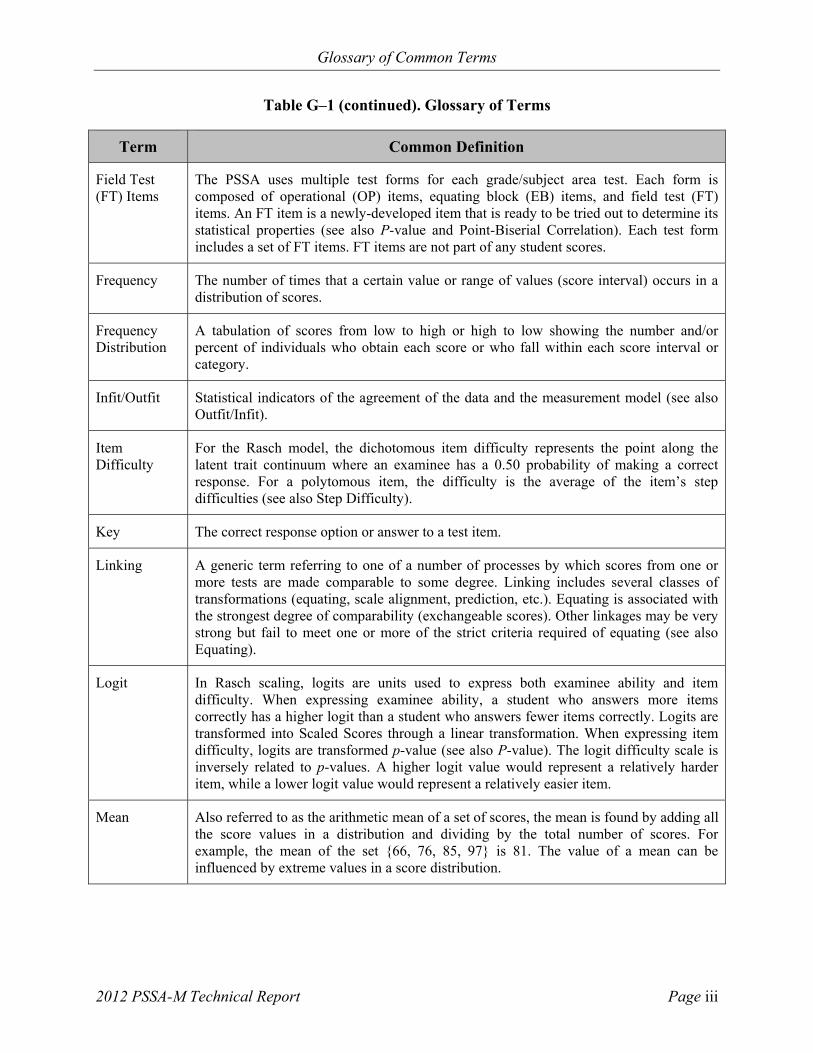
Field Test (FT) Items
The PSSA uses multiple test forms for each grade/subject area test. Each form is composed of operational (OP) items, equating block (EB) items, and field test (FT) items. An FT item is a newly-developed item that is ready to be tried out to determine its statistical properties (see also P-value and Point-Biserial Correlation). Each test form includes a set of FT items. FT items are not part of any student scores.
Frequency The number of times that a certain value or range of values (score interval) occurs in a distribution of scores.
Frequency Distribution
A tabulation of scores from low to high or high to low showing the number and/or percent of individuals who obtain each score or who fall within each score interval or category.
Infit/Outfit Statistical indicators of the agreement of the data and the measurement model (see also Outfit/Infit).
Item Difficulty
For the Rasch model, the dichotomous item difficulty represents the point along the latent trait continuum where an examinee has a 0.50 probability of making a correct response. For a polytomous item, the difficulty is the average of the item’s step difficulties (see also Step Difficulty).
Key The correct response option or answer to a test item.
Linking A generic term referring to one of a number of processes by which scores from one or more tests are made comparable to some degree. Linking includes several classes of transformations (equating, scale alignment, prediction, etc.). Equating is associated with the strongest degree of comparability (exchangeable scores). Other linkages may be very strong but fail to meet one or more of the strict criteria required of equating (see also Equating).
Logit In Rasch scaling, logits are units used to express both examinee ability and item difficulty. When expressing examinee ability, a student who answers more items correctly has a higher logit than a student who answers fewer items correctly. Logits are transformed into Scaled Scores through a linear transformation. When expressing item difficulty, logits are transformed p-value (see also P-value). The logit difficulty scale is inversely related to p-values. A higher logit value would represent a relatively harder item, while a lower logit value would represent a relatively easier item.
Mean Also referred to as the arithmetic mean of a set of scores, the mean is found by adding all the score values in a distribution and dividing by the total number of scores. For example, the mean of the set {66, 76, 85, 97} is 81. The value of a mean can be influenced by extreme values in a score distribution.

Glossary of Common Terms
2012 PSSA-M Technical Report Page iv
Table G–1 (continued). Glossary of Terms
Term Common Definition
Measure In Rasch scaling, measure generally refers to a specific estimate of an examinee’s ability (often expressed as logits) or an item’s difficulty (again, often expressed as logits). As an example for the PSSA, a student’s reading measure might be equal to 0.525 logits. Or, a PSSA Reading test item might have logit equal to -0.905.
Median The middle point or score in a set of rank-ordered observations that divides the distribution into two equal parts such that each part contains 50 percent of the total data set. More simply put, half of the scores are below the median value and half of the scores are above the median value. As an example, the median for the following ranked set of scores {2, 3, 6, 8, 9} is 6.
Multiple-Choice Item
A type of item format that requires the test taker to select a response from a group of possible choices, one of which is the correct answer (or key) to the question posed (see also Open-Ended Item).
N-count Sometimes designated as N or n, it is the number of observations (usually individuals or students) in a particular group. Some examples include the number of students tested, the number of students tested from a specific subpopulation (e.g., females), the number of students who attained a specific score, etc. In the follow set {23, 32, 56, 65, 78, 87}, n = 6.
Open-Ended Item
An open-ended (OE) item—referred to by some as a constructed-response (CR) item—is an item format that requires examinees to create their own responses, which can be expressed in various forms (e.g., written paragraph, created table/graph, formulated calculation, etc.). Such items are frequently scored using more than two score categories, that is, polytomously (e.g., 0, 1, 2, and 3). This format is in contrast to one in which students make a choice from a supplied set of answer options (e.g., multiple-choice (MC) items, which are typically dichotomously scored as right = 1 or wrong = 0). When interpreting item difficulty and discrimination indices, it is important to consider whether an item is polytomously or dichotomously scored.
Operational Item
The PSSA uses multiple test forms for each grade/subject area test. Each form is composed of operational (OP) items, equating block (EB) items, and field test (FT) items. OP items are the same on all forms for any grade/subject area test. Student total raw scores and scaled scores are based exclusively on the OP items.
Outfit/Infit Statistical indicators of the agreement of the data and the measurement model. Infit and Outfit are highly correlated, and both are highly correlated with the point-biserial correlation. Underfit can be caused when low-ability students correctly answer difficult items (perhaps by guessing or atypical experience) or high-ability students incorrectly answer easy items (perhaps because of carelessness or gaps in instruction). Any model expects some level of variability, so overfit can occur when nearly all low-ability students miss an item while nearly all high-ability students get the item correct.

Glossary of Common Terms
2012 PSSA-M Technical Report Page v
Table G–1 (continued). Glossary of Terms
Term Common Definition
Percent Correct When referring to an individual item, the percent correct is the item’s p-value expressed as a percent (instead of a proportion). When referring to a total test score, it is the percentage of the total number of points that a student received. The percent correct score is obtained by dividing the student’s raw score by the total number of possible points and multiplying the result by 100. Percent Correct scores are often used in criterion-referenced interpretations and are generally more helpful if the overall difficulty of a test is known. Sometimes Percent Correct scores are incorrectly interpreted as Percentile Ranks.
Percentile The score or point in a score distribution at or below which a given percentage of scores fall. It should be emphasized that it is a value on the score scale, not the associated percentage (although sometimes in casual usage this misinterpretation is made). For example, if 72 percent of the students score at or below a Scaled Score of 1500 on a given test, then the Scaled Score of 1500 would be considered the 72nd percentile. As another example, the median is the 50th percentile.
Percentile Rank The percentage of scores in a specified distribution falling at/below a certain point on a score distribution. Percentile Ranks range in value from 1 to 99, and indicate the status or relative standing of an individual within a specified group, by indicating the percent of individuals in that group who obtained equal or lower scores. An individual’s percentile rank can vary depending on which group is used to determine the ranking. As suggested above, Percentiles and Percentile Rank are sometimes used interchangeably; however strictly speaking, a percentile is a value on the score scale.
Performance Level Descriptors
Descriptions of an individual’s competency in a particular content area, usually defined as ordered categories on a continuum, often labeled from Below Basic to Advanced, that constitute broad ranges for classifying performance. The exact labeling of these categories, and narrative descriptions, may vary from one assessment or testing program to another.
Performance Level Setting
Also referred to as standard setting, a procedure used in the determination of the cut scores for a given assessment that is used to measure students’ progress toward certain performance standards. Standard setting methods vary (e.g., modified Angoff, Bookmark Method, etc.), but most use a panel of educators and expert judgments to operationalize the level of achievement students must demonstrate in order to be categorized within each performance level.
Point-Biserial Correlation
In classical test theory, this is an item discrimination index. It is the correlation between a dichotomously scored item and a continuous criterion, usually represented by the total test score (or the corrected total test score with the reference item removed). It reflects the extent to which an item differentiates between high-scoring and low-scoring examinees. This discrimination index ranges from –1.00 to +1.00. The higher the discrimination index (the closer to +1.00), the better the item is considered to be performing. For multiple-choice items scored as 0 or 1, it is rare for the value of this index to exceed 0.5.

Glossary of Common Terms
2012 PSSA-M Technical Report Page vi
Table G–1 (continued). Glossary of Terms
Term Common Definition
P-value An index indicating an item’s difficulty for some specified group (perhaps grade). It is calculated as the proportion (sometimes percent) of students in the group who answer an item correctly. P-values range from 0.0 to 1.0 on the proportion scale. Lower values correspond to more difficult items and higher values correspond to easier items. P-values are usually provided for multiple-choice items or other items worth one point. For open-ended items or items worth more than one point, difficulty on a p-value-like scale can be estimated by dividing the item mean score by the maximum number of points possible for the item (see also Logit).
Raw Score Sometimes abbreviated as RS, it is an unadjusted score usually determined by tallying the number of questions answered correctly, or by the sum of item scores (i.e., points). (Some rarer situations might include formula scoring, the amount of time required to perform a task, the number of errors, application of basal/ceiling rules, etc.) Raw scores typically have little or no meaning by themselves and require additional information—like the number of items on the test, the difficulty of the test items, norm-referenced information, or criterion-referenced information.
Reliability The expected degree to which test scores for a group of examinees are consistent over exchangeable replications of an assessment procedure, and therefore are considered dependable and repeatable for an individual examinee. A test that produces highly consistent, stable results (i.e., relatively free from random error) is said to be highly reliable. The reliability of a test is typically expressed as a reliability coefficient or by the standard error of measurement derived by that coefficient.
Reliability Coefficient
A statistical index that reflects the degree to which scores are free from random measurement error. Theoretically, it expresses the consistency of test scores as the ratio of true score variance to total score variance (true score variance plus error variance). This statistic is often expressed as correlation coefficient (e.g., correlation between two forms of a test) or with an index that resembles a correlation coefficient (e.g., calculation of a test’s internal consistency using Coefficient Alpha). Expressed this way, the reliability coefficient is a unitless index. The higher the value of the index (closer to 1.0), the greater the reliability of the test (see also Standard Error of Measurement).
Scaled Score A mathematical transformation of a raw score developed through a process called scaling. Scaled scores are most useful when comparing test results over time. Several different methods of scaling exist, but each is intended to provide a continuous and meaningful score scale across different forms of a test.
Selected-Response Item
See Multiple-Choice Item.

Glossary of Common Terms
2012 PSSA-M Technical Report Page vii
Table G–1 (continued). Glossary of Terms
Term Common Definition
Spiraling A packaging process used when multiple forms of a test exist and it is desired that each form be tested in all classrooms (or other grouping unit—e.g., schools) participating in the testing process. This process allows for the random distribution of test booklets to students. For example, if a package has four test forms labeled A, B, C, and D, the order of the test booklets in the package would be A, B, C, D, A, B, C, D, A, B, C, D, etc.
Standard Deviation (SD)
A statistic that measures the degree of spread or dispersion of a set of scores. The value of this statistic is always greater than or equal to zero. If all of the scores in a distribution are identical, the standard deviation is equal to zero. The further the scores are away from each other in value, the greater the standard deviation. This statistic is calculated using the information about the deviations (distances) between each score and the distribution’s mean. It is equivalent to the square root of the variance statistic. The standard deviation is a commonly used method of examining a distribution’s variability since the standard deviation is expressed in the same units as the data.
Standard Error of Measurement (SEM)
The amount an observed score is expected to fluctuate around the true score. As an example, across replications of a measurement procedure, the true score will not differ by more than plus or minus one standard error from the observed score about 68 percent of the time (assuming normally distributed errors). The SEM is frequently used to obtain an idea of the consistency of a person’s score in actual score units, or to set a confidence band around a score in terms of the error of measurement. Often a single SEM value is calculated for all test scores. On other occasions, however, the value of the SEM can vary along a score scale. Conditional standard errors of measurement (CSEMs) provide an SEM for each possible scaled score.
Step Difficulty Step difficulty is a parameter estimate in Master’s partial credit model (PCM) that represents the relative difficulty of each score step (e.g., going from a score of 1 to a score of 2). The higher the value of a particular step difficulty, the more difficult a particular step is relative to other score steps (e.g., is it harder to go from a 1 to a 2, or to go from a 2 to a 3?).
Strand On score reports, a strand often refers to a set of items on a test measuring the same contextual area (e.g., Number Sense in Mathematics). Items developed to measure the same reporting category would be used to determine the strand score (sometimes called “subscale” score).
Technical Advisory Committee (TAC)
A group of individuals, most often professionals in the field of testing, who are either appointed or selected to make recommendations for and to guide the technical development of a given testing program.
Validity The degree to which accumulated evidence and theory support specific interpretations of test scores entailed by the purposed uses of a test. There are various ways of gathering validity evidence.

Glossary of Common Terms
2012 PSSA-M Technical Report Page viii

Preface: An Overview of Modified Assessments from 2008 to the Present
2012 PSSA-M Technical Report Page ix
Preface: An Overview of Modified Assessments from 2008 to the Present
The Pennsylvania System of School Assessment with Modified Academic Achievement Standards (PSSA-M) is a statewide system designed to meet the No Child Left Behind Act of 2001 (NCLB) requirement that all students be included in state assessment and accountability systems. The target population consists of those students who function above the one percent of students with the most severe cognitive impairments who are eligible to take the Pennsylvania Alternate System of Assessment (PASA), but whose disabilities inhibit their ability to respond to the standard PSSA, even with accommodations. The Pennsylvania Academic Assessment Anchor Content Standards, further delineated by the Eligible Content for Mathematics, Reading and Science, are the basis for test development. To facilitate students’ ability to demonstrate their grade-level content knowledge and skills, revisions were made to assessment tasks, (e.g., items, passages, graphics/stimuli, scenarios) with the goal of minimizing or removing processing effects (e.g., cognitive, linguistic) or physical challenges related to students’ disabilities without significant alteration of the assessed construct.
The introduction of an operational mathematics modified assessment in 2010 moved closer to reality with a major standalone field test at Grades 48 and 11 in May of 2009. Operational modified assessments for reading and science, implemented in spring 2011, underwent item development in 2009 and field testing in 2010.
To assist the reader in navigating through the year-to-year developmental activity of the PSSA-M, tables are presented along with explanatory text. Provided is an overview of the subject areas assessed, time of year the testing activity took place, and the type of testing that occurred (e.g., operational, field testing, Grade 12 retest).
ASSESSMENT ACTIVITIES OCCURRING IN THE 2008–09 SCHOOL YEAR
Table P–1 provides information about the field testing of modified assessments for mathematics during the 2008–09 school year. Following the spring operational assessment of the PSSA, a separate, standalone field test of items developed for Pennsylvania Assessment Anchors and Eligible Content in mathematics was conducted at Grades 48 and 11. Item development for these new assessments took place during 2008.
Major assessment activities included the following:
Spring standalone field test for mathematics at Grades 48 and 11
Table P–1. Field Testing of Modified Assessments During the 2008–09 School Year
Subject OP/FT Grades Assessment Schedule Mathematics FT (sa) 48, 11 April/May 2009
Note. FT (sa) refers to a standalone field test

Preface: An Overview of Modified Assessments from 2008 to the Present
2012 PSSA-M Technical Report Page x
ASSESSMENT ACTIVITIES OCCURRING IN THE 2009–10 SCHOOL YEAR
Table P–2 provides information about modified assessments during the 2009–10 school year. The mathematics modified assessments became operational for Grades 48 and 11 and were incorporated into the administration of the PSSA as a test version for eligible students with disabilities. There was an April testing window with a make-up period extending through the first week of May for all assessments. Field testing for mathematics was embedded as part of the operational assessments at each grade level. Consistent with the regular PSSA, a fall retest opportunity at Grade 12 was offered to students taking the mathematics modified assessment starting with the 2010 Fall Retest.
Standalone field tests in reading modified and science modified were conducted following the administration of the spring PSSA. Item development for these new assessments took place during 2009. Full implementation was scheduled to begin in 2011.
Major assessment activities included the following:
Spring operational assessment in mathematics for Grades 4–8 and 11 with embedded field testing
Spring standalone field test for reading at Grades 4–8 and 11 and for science at Grades 8 and 11
Table P–2. Operational Assessment and Field Testing During the 2009–10 School Year
Subject OP/FT Grades Assessment Schedule Mathematics OP (eft) 48, 11 April/May 2010 Reading FT (sa) 48, 11 May 2010 Science FT (sa) 8, 11 May 2010
Note. OP (eft) refers to operational test with embedded field test FT (sa) refers to standalone field test

Preface: An Overview of Modified Assessments from 2008 to the Present
2012 PSSA-M Technical Report Page xi
ASSESSMENT ACTIVITIES OCCURRING IN THE 2010–11 SCHOOL YEAR
Table P–3 provides information about modified assessments during the 2010–11 school year. This was the second year for which the mathematics modified assessment was operational and the first year of implementation for the reading modified and science modified. Embedded field testing did not occur as part of the 2011 modified assessments.
A fall retest opportunity at Grade 12 was implemented for students taking the 2010 mathematics modified assessment. A retest opportunity was scheduled to become available in the fall of 2011 for students failing to reach the Proficient level on the reading and/or science modified assessments.
Major assessment activities included the following:
Spring operational assessment in mathematics and reading modified for Grades 48 and 11, and in science modified at Grades 8 and 11
A retest opportunity for Grade 12 students who as 11th graders in the spring of 2010 failed to attain at least the Proficient level in mathematics modified
Table P–3. Operational Assessment During the 2010–11 School Year
Subject OP Grades Assessment Schedule Mathematics OP 48, 11 March 2011 Reading OP 48, 11 March 2011 Science OP 8, 11 May 2011 Retest for 2010 Mathematics
OP 12 October/November 2010

Preface: An Overview of Modified Assessments from 2008 to the Present
2012 PSSA-M Technical Report Page xii
ASSESSMENT ACTIVITIES OCCURRING IN THE 2011–12 SCHOOL YEAR
Table P–4 provides information about modified assessments during the 2011–12 school year. Assessment began in mid-March for mathematics and reading and late April for science. The make-up period for mathematics and reading concluded in March; science was complete in early May. This was the third year of operational assessment for the mathematics modified and the second year of implementation for the reading and science modified. There was no embedded field testing as part of the operational modified assessments. The PSSA-M has been discontinued, so the fall retest opportunity at Grade 12 will not be available in the fall of 2012.
Major assessment activities include the following:
Spring operational assessment in mathematics and reading modified for Grades 4–8 and 11, and in science modified at Grades 8 and 11
A retest opportunity for Grade 12 students who as 11th graders in the spring of 2011 failed to attain at least the Proficient level in any of the subject areas
Table P–4. Operational Assessment and Field Testing During the 2011–12 School Year
Subject OP Grades Assessment Schedule Mathematics OP 48, 11 March 2012 Reading OP 48, 11 March 2012 Science OP 8, 11 April/May 2012 Retest for 2011 Mathematics, Reading, Science
OP 12 October/November 2011
ASSESSMENT ACTIVITIES PLANNED FOR THE 2012–13 SCHOOL YEAR
The modified assessments have been discontinued, so no activities are scheduled to take place for mathematics, reading, or science during the 2012–13 school year. This includes that a fall retest opportunity will not be available for students who as 11th graders in the spring of 2012 failed to attain at least the Proficient level in any of the subject areas.

Chapter One: Background of the Modified Pennsylvania System of School Assessment (PSSA-M)
2012 PSSA-M Technical Report Page 1
Chapter One: Background of the Modified Pennsylvania System of School Assessment (PSSA-M)
This brief overview of a decade of change in Pennsylvania’s assessment program summarizes the state and federal regulations that have continued to shape the design and development of the program. Among the changes are those involving content structure for reading, mathematics, and writing, the addition of science to the subject areas assessed, the expansion of grade levels assessed for reading and mathematics, the implementation of an alternate assessment for students with very severe disabilities, and the implementation of a modified assessment for a group of IEP students whose disabilities inhibit their ability to respond to a regular assessment.
STATE AND FEDERAL REGULATIONS AFFECTING THE PSSA
The Pennsylvania System of School Assessment (PSSA) program underwent major structural changes in test content with the State Board of Education’s adoption of the Pennsylvania Academic Standards for Reading, Writing, Speaking and Listening, and Mathematics in January 1999 (Pennsylvania State Board of Education, 1999). The Academic Standards, which are part of Chapter Four Regulations on Academic Standards and Assessment, detailed what students should know (knowledge) and be able to do (skills) at various grade levels. Subsequently, the State Board approved a set of criteria defining Advanced, Proficient, Basic, and Below Basic levels of performance. Reading and mathematics performance level results were reported at both the student and school levels for the 2000 PSSA. At that point, the PSSA became a standards-based, criterion-referenced assessment measuring student attainment of the Academic Standards at Grades 5, 8, and 11. In 2003, a reading and mathematics assessment at Grade 3 was added. Act 16 of Pennsylvania Senate Bill 652 in 2000 redefined the PSSA to include science. Combined with the State Board adoption of Science and Technology Standards on July 12, 2001, and the Environment and Ecology Standards on January 5, 2002, the groundwork was laid for a future science assessment. At the federal level, PL 107110, the No Child Left Behind Act of 2001 (NCLB) stipulated that states must develop reading and mathematics assessments in Grades 38 and at least once between Grades 10 and 12 and science assessments at least once in each of the grade bands: Grades 3–5, Grades 6–9, and Grades 10–12.
PURPOSES OF THE PSSA
Chapter Four regulations stipulated that the purposes of the PSSA are to:
Provide students, parents, educators, and citizens with an understanding of student and school performance.
Determine the degree to which programs enable students to attain proficiency of academic standards.
Provide results to school districts, including charter schools and Career and Technical Centers (CTCs), for consideration in the development of strategic plans.
Provide information to state policymakers, including the General Assembly, and the State Board, on how effective schools are in promoting and demonstrating student proficiency of the Academic Standards.
Provide information to the general public on school performance.

Chapter One: Background of the Modified Pennsylvania System of School Assessment (PSSA-M)
2012 PSSA-M Technical Report Page 2
Provide results to school districts, including charter schools and CTCs, based on the aggregate performance of all students and for relevant subgroups, such as students with an IEP and for those without an IEP.
CHANGES IN 2005 AND BEYOND
Assessment in 2005 was marked by implementation of Assessment Anchor Content Standards, developed for reading and mathematics during the previous school year to clarify content structure, improve articulation between assessment and instruction, and improve test design and reporting. To meet the conditions of NCLB, assessment of reading and mathematics at Grades 4, 6, and 7 became operational in 2006, enabling Pennsylvania to more completely determine adequate yearly progress (AYP) at the state, district, and school level.
Although NCLB does not require states to conduct a writing assessment, Chapter Four does include one, aligned to the Academic Standards and reported in terms of performance levels, for all students at three grade levels. The 2006 PSSA operational writing assessment involved a shift from Grades 6, 9, and 11 to Grades 5, 8, and 11 to provide better alignment to the end of elementary school and middle school. Also incorporated were mode-specific scoring guides for essay responses and stimulus-based revising/editing multiple-choice items.
In accordance with the NCLB requirement to implement an operational science assessment in 2008, a major test development effort took place during 2006, followed by a large-scale, standalone field test in April/May of 2007. Full implementation of an operational science assessment at Grades 4, 8, and 11 first occurred in AprilMay 2008, aligned to the Pennsylvania Science Assessment Anchor Content Standards and Eligible Content.
More information regarding the 2011 PSSA may be found in the 2011 PSSA Technical Report. This report can be accessed by going to www.education.state.pa.us. On the left, click on “Programs,” then “Programs OR,” then “Pennsylvania System of School Assessment (PSSA).” In the “Most Requested Content…” section, select “PSSA Technical Reports.”
STUDENTS WITH COMPLEX SUPPORT NEEDS: ALTERNATE ASSESSMENT
Although NCLB recommended that the same achievement standards be applied to all students, the U.S. Department of Education acknowledged that the same assessments are not universally appropriate. To better accommodate students with significant cognitive disabilities, intended for the lowest functioning 1% of the student population, the Department issued regulations permitting states to develop alternate achievement standards along with aligned assessments. In 2004 the Pennsylvania Alternate System of Assessment (PASA) was implemented to address the needs of these students. To be eligible for participation in the PASA, a student must meet each of the following criteria for reading, mathematics, and science, and a school-administered alternate assessment for writing: 1) enrolled in the assessed grade level for the subject area, 2) had a very severe cognitive disability, 3) required very intensive instruction, 4) required very extensive adaptation and support to perform or participate meaningfully, 5) required very substantial modification of the general education curriculum, and 6) participation in the general education curriculum differed very substantially in form and substance from that of other students. For more information, see the 2011–2012 PSSA Handbook for Assessment Coordinators (All Subjects), PDE, 2012, p.9), which may be accessed by going to www.education.state.pa.us. On the left side of the navigation bar, click on “Programs,” then “Programs OR,” then “Pennsylvania System of School Assessment (PSSA)” and then “Test Administration.”

Chapter One: Background of the Modified Pennsylvania System of School Assessment (PSSA-M)
2012 PSSA-M Technical Report Page 3
STUDENTS WITH DISABILITIES NEEDING A MODIFIED APPROACH: MODIFIED ASSESSMENT
Following the issuance of regulations permitting states to develop alternate assessments for the students with the most severe cognitive disabilities, further research along with the experience of state assessment programs identified a need to address the difficulties encountered by a small group of IEP students in responding optimally to the regular assessment instruments. The U.S. Department of Education responded to this recognition by issuing additional regulations in April 2007 permitting states to develop assessments for the approximately 2% of students with disabilities based on modified achievement standards. Students targeted are those whose disabilities are not severe enough to warrant taking an alternate assessment and yet interfere significantly with their ability to respond optimally on the regular state assessment. This modified assessment must be aligned to a set of modified achievement standards designed to measure the same grade-level content as the state’s general assessment. To be eligible to take a modified assessment, a student must meet a rigorous set of criteria, such as the IEP addressing educational goals reflecting grade-level content standards along with provisions for monitoring student progress.
Originally, PDE planned to develop modified assessments in reading for grades 3–8 and 11 and in science for grades 4, 8, and 11. However, the Pennsylvania PSSA-M Advisory Task Force met in January 2009 to discuss the criteria for the students for whom this test would be developed. The Task Force advised PDE to exclude third graders from the reading assessment and fourth graders from the science assessment, as the majority of these students could be properly assessed either with the general PSSA assessment at those grades or with the PASA (Pennsylvania Alternate System of Assessment).
To address the unique needs of these students, and to be in closer compliance with the NCLB intent that all students be included in state assessment and accountability systems, the Pennsylvania System of School Assessment Modified (PSSA-M) became operational in 2010 with a mathematics modified assessment at Grades 48 and 11. It was joined by operational modified assessments in reading at Grades 48 and 11 and science at Grades 8 and 11 in the spring of 2011.
More information regarding the development and composition of the 2010 PSSA-M Mathematics test may be found in Chapter Two of this report. Information may also be found in the Pennsylvania Department of Education publication, 2011–2012 PSSA Assessment Handbook, (see Part Six: PSSA–M). This handbook can be accessed by going to www.education.state.pa.us. On the left, click on “Programs,” then “Programs OR,” then “Pennsylvania System of School Assessment (PSSA)” and then “Resource Materials.”
Eligibility for the PSSA-M requires that a student 1) is not eligible for the PASA, 2) has a grade-level standards aligned IEP that clearly documents that the student requires significant instructional accommodations to successfully access grade level content, 3) demonstrates persistent academic difficulties, and 4) lacks academic progress. More detailed information on the PSSA-M eligibility criteria may be accessed by going to www.education.state.pa.us. On the left side of the navigation bar, click on “Programs,” then “Programs SZ,” then “Special Education.” From the “Special Education” page click on “Assessment” to access the relevant documents.

Chapter One: Background of the Modified Pennsylvania System of School Assessment (PSSA-M)
2012 PSSA-M Technical Report Page 4

Chapter Two: Test Development Overview of the Modified PSSA
2012 PSSA-M Technical Report Page 5
Chapter Two: Test Development Overview of the Modified PSSA
OVERVIEW OF THE DEVELOPMENT PROCESS
The Modified assessments were developed under the direction of the Pennsylvania Department of Education (PDE). The PSSA-M assessments were developed using the same rigorous and technically sound development steps as what is used to develop the general education assessment, Pennsylvania Student Assessment System (PSSA). These technically sound development steps involve Pennsylvania educators in all stages of the process. The Pennsylvania educators from school districts throughout the Commonwealth of Pennsylvania selected to participate in the development process were those with both content-area teaching expertise (e.g., mathematics, reading, and science) as well as those with expertise in teaching students with disabilities. The key development steps the PDE followed when developing the PSSA-M assessments included the following:
Development of guidelines for revising and/or enhancing assessment questions
Interviewing students and surveying teachers
Revising and/or enhancing items to be more accessible to the given population of students
Reviewing items by committees of Pennsylvania educators, including reviewing items for content alignment; rigor alignment; adherence to the principles of universal design; bias, fairness, and sensitivity; and adherence to technical quality or the standards for high-quality items
Developing field test forms
Field testing of the items to determine whether or not the items did, in fact, lend themselves to being more accessible to the given population
Scoring of the open-ended or constructed-response items
Reviewing of the items to determine which items should be placed in the pool of items to be considered acceptable for operational testing
Reviewing the final operational forms prior to being administered to students
Defining the expectation of mastery on the PSSA-M assessments or what it means for a student to be Proficient as determined by the standard-setting process
Developing Modified Achievement Standards
ACADEMIC STANDARDS, ASSESSMENT ANCHOR CONTENT STANDARDS, AND
ELIGIBLE CONTENT
PSSA-M Mathematics, Reading, and Science
The PSSA-M assessment follows the guidelines of the PSSA Assessment Anchor Content Standards and Eligible Content, which are based on the Pennsylvania Academic Standards. Although the Academic Standards indicate what students should know and be able to do, educator concerns regarding the number and breadth of Academic Standards led to an initiative by the Pennsylvania Department of Education (PDE) to develop Assessment Anchor Content Standards (Assessment Anchors) to indicate which parts of the Academic Standards

Chapter Two: Test Development Overview of the Modified PSSA
2012 PSSA-M Technical Report Page 6
(Instructional Standards) would be assessed on the PSSA and PSSA-M. Based on recommendations from Pennsylvania educators, the Assessment Anchors were designed as a tool to improve the articulation of curricular, instructional, and assessment practices. The Assessment Anchors clarify what is expected across each grade span and focus the content of the standards into what is assessable on a large-scale test. The Assessment Anchor documents also serve to communicate Eligible Content, also called “assessment limits,” or the range of knowledge and skills from which the PSSA and PSSA-M would be designed.
The Assessment Anchor’s coding is read like an outline. The code includes the content, grade level, Reporting Category, Assessment Anchor, descriptor (Sub-Assessment Anchor), and Eligible Content. Thus, M4.A.1.1.1 would be: Math, Grade 4, Reporting Category A, Assessment Anchor 1, descriptor (Sub-Assessment Anchor) 1, and Eligible Content 1.
Each of the Assessment Anchors has one or more descriptors (Sub-Assessment Anchors) and Eligible Content varying to reflect grade-level appropriateness. The Assessment Anchors form the basis of the test design for the grades undergoing new test development. In turn, this hierarchy is the basis for organizing the total content scores (based on the core [common] sections).
A draft version of the Assessment Anchors and Eligible Content for mathematics and reading was submitted to Achieve, Inc., Washington, D.C., to conduct a special analysis to evaluate the degree of alignment with the Academic Standards. Preliminary feedback enabled PDE to make adjustments to improve the alignment as the Assessment Anchors took final form. These adjustments were reflected operationally starting with the 2007 PSSA.
The Assessment Anchor Content Standards as defined by the Eligible Content are the same for the PSSA-M as they are for the general PSSA. However, in the PSSA-M, items measuring the Assessment Anchors as defined by the Eligible Content have been modified (revised and/or enhanced) when appropriate. Modifications, such as reduced text, easier vocabulary, simplified tasks, and the addition of hint boxes, allow for items to be more accessible to the given population of students while still in line with measuring the Assessment Anchors as defined by the Eligible Content. In so doing, the PSSA-M reflects the same emphasis and patterns as the general PSSA while utilizing a similar style and format. However, the PSSA-M does contain fewer items. These modifications, including fewer items and revisions and enhancements to items, are designed to allow students with disabilities a better assessment opportunity in which to demonstrate proficiency.
The complete set of Assessment Anchors and Eligible Content can be referenced at PDE’s website: http://www.education.pa.us. From the menu in the left-hand column, select “Programs,” “Programs O–R,” “Pennsylvania System of School Assessment (PSSA),”and then “Assessment Anchors.” In addition, see Appendix A: Assessment Anchor Explanations for more information about how the Academic Standards are linked to the Reporting Categories, Assessment Anchors, and Eligible Content.
Mathematics Assessment Measures
In keeping with the alignment of the PSSA, the PSSA-M mathematics assessments at grades 4–8 and 11 have five major reporting categories: Numbers and Operations, Algebraic Concepts, Geometry, Measurement, and Data Analysis and Probability. By organizing the Assessment Anchors into a five-category reporting structure, there is a similarity to the categories used by the National Council of Teachers of Mathematics (NCTM) and the National Assessment of Educational Progress (NAEP). See Appendix A: Assessment Anchor Explanations for more

Chapter Two: Test Development Overview of the Modified PSSA
2012 PSSA-M Technical Report Page 7
information about how the Academic Standards are linked to the Reporting Categories, Assessment Anchors, and Eligible Content.
In keeping with the PSSA, the PSSA-M mathematics assessment also employs two types of test items: multiple-choice and open-ended. These item types assess different levels of knowledge and provide different kinds of information about mathematics achievement. Psychometrically, multiple-choice items are very useful and efficient tools for collecting information about a student’s academic achievement. Open-ended performance tasks are less efficient in the sense that they generally generate fewer scoreable points in the same amount of testing time. They do, however, provide tasks that are more realistic and better sample higher-level thinking skills. The design of the PSSA-M attempts to achieve a reasonable balance between the two item types. Furthermore, well-constructed scoring guides have made it possible to include open-ended tasks in large-scale assessments such as the PSSA-M. Trained scorers can apply the scoring guides to efficiently score large numbers of student papers in a highly reliable way.
MATHEMATICS MULTIPLE-CHOICE ITEMS
The majority of the mathematics items included on the PSSA-M, much like the PSSA, are multiple-choice (selected-response) items. This item type is especially efficient for measuring a broad range of content. In the PSSA and PSSA-M mathematics assessments, each multiple-choice item has four response options, only one of which is correct. The student is awarded one point for choosing the correct response. Distractors typically represent incorrect concepts, incorrect logic, incorrect application of an algorithm, or computation errors. It is important to note that for the PSSA-M, dropping an answer option is not an allowable modification.
Multiple-choice items are used to assess a variety of skill levels, from short-term recall of facts to problem solving. PSSA and PSSA-M items involving application emphasize the requirement to carry out some mathematical process to find an answer, rather than simply recalling information from memory.
OPEN-ENDED TASKS FOR MATHEMATICS
For both the PSSA and the PSSA-M, open-ended, or constructed-response, tasks require students to read a problem description and to develop an appropriate solution. The PSSA-M open-ended items are designed to be scaffolded, which means that they have several components to the overall task that may enable students to enter or begin the problem at different places. In some items, each successive component is designed to assess progressively more difficult skills or higher knowledge levels. Certain components ask students to explain their reasoning for engaging in particular mathematical operations or for arriving at certain conclusions. The types of tasks utilized do not necessarily require computations. Students may also be asked to perform such tasks as constructing a graph, shading some portion of a figure, or listing object combinations that meet specified criteria.
Open-ended tasks are especially useful for measuring students’ problem-solving skills in mathematics. They offer the opportunity to present real-life situations that require students to solve problems using mathematics abilities learned in the classroom. Students must read the task carefully, identify the necessary information, devise a method of solution, perform the calculations, enter the solution directly in the answer document, and when required, offer an explanation. This provides insight into the students’ mathematical knowledge, abilities, and reasoning processes.

Chapter Two: Test Development Overview of the Modified PSSA
2012 PSSA-M Technical Report Page 8
For both the PSSA and the PSSA-M, open-ended mathematics items are scored on a 0–4 point scale with an item-specific scoring guideline. The item-specific scoring guideline outlines the requirements at each score point. Item-specific scoring guidelines are based on the General Description of Mathematics Scoring Guidelines for Open-Ended Items. The general guidelines describe a hierarchy of responses which represent the five score levels. See Appendix B: PSSA General Scoring Guidelines or the PSSA-M Mathematics Item and Scoring Samplers available on the PDE website.
The tables below provide a high-level overview of the operational mathematics PSSA-M test plan as compared to the general education mathematics PSSA. In addition, a comparison of the reporting categories for the mathematics PSSA-M and the general education mathematics PSSA is also provided. The PSSA-M content test blueprints show the same emphasis and patterns as the PSSA. The test content blueprints also show the extent to which the same or consistent categories of content appear in the PSSA-M and the PSSA. The PSSA-M, however, as noted in Table 2–1, has fewer items.
Table 2–1. Mathematics Operational Test Plan Summary: PSSA and PSSA-M
Mat
hem
atic
s
Program Grades Number of MC Items per PSSA
Number of 4-point OE Items per PSSA
Total Number of Points (MC + OE)
per PSSA
PSSA 4, 5, 6, 7, 8, and 11
60 3 72
PSSA-M 4, 5, 6, 7, 8, and 11
30 2 38
Table 2–2. Mathematics Blueprint (percentage of total test points): PSSA and PSSA-M
Reporting Category
Program Grade
4 5 6 7 8 11
Numbers and Operations
PSSA 43%–47% 41%–45% 28%–32% 20%–24% 18%–22% 12%–15%
PSSA-M 43%–47% 41%–45% 28%–32% 20%–24% 18%–22% 12%–15%
Measurement PSSA 12%–15% 12%–15% 12%–15% 12%–15% 12%–15% 12%–15%
PSSA-M 12%–15% 12%–15% 12%–15% 12%–15% 12%–15% 12%–15%
Geometry PSSA 12%–15% 12%–15% 15%–20% 15%–20% 15%–20% 12%–18%
PSSA-M 12%–15% 12%–15% 15%–20% 15%–20% 15%–20% 12%–18%
Algebraic Concepts
PSSA 12%–15% 13%–17% 15%–20% 20%–27% 25%–30% 38%–42%
PSSA-M 12%–15% 13%–17% 15%–20% 20%–27% 25%–30% 38%–42%
Data Analysis & Probability
PSSA 12%–15% 12%–15% 15%–20% 15%–20% 15%–20% 12%–18%
PSSA-M 12%–15% 12%–15% 15%–20% 15%–20% 15%–20% 12%–18%

Chapter Two: Test Development Overview of the Modified PSSA
2012 PSSA-M Technical Report Page 9
Reading Assessment Measures In keeping with the alignment of the PSSA, the PSSA-M reading assessment has two major reporting categories, Comprehension and Reading Skills and Interpretation and Analysis of Fictional and Nonfictional Text. These two reporting categories are derived from Reading Academic Standards 1.1, 1.2, and 1.3. Like on the PSSA, Standards 1.6, 1.7, and 1.8 are not addressed on the PSSA-M because they are not specific to reading comprehension and can be more accurately evaluated at the school level. Standards 1.4 and 1.5 are addressed on the PSSA writing assessment. See Appendix A: Assessment Anchor Explanations for more information about how the Academic Standards are linked to the Reporting Categories, Assessment Anchors, and Eligible Content.
The PSSA-M reading assessment, like the PSSA reading assessment, employs two types of test items: multiple-choice and open-ended. They are designed to measure students’ comprehension of the information contained in the reading passages.
READING MULTIPLE-CHOICE ITEMS
Multiple-choice (selected-response) items measure such concepts as how well students comprehend the overall meaning of a passage or make basic inferences about it. At times, asking students to choose a preferred answer is the best way to determine whether they have gleaned certain important information from a story. Such information may include setting, central idea, or main events and their sequence.
Each reading multiple-choice item has four response options, only one of which is correct. The student is awarded one point for choosing the correct response. Incorrect response choices, or distractors, typically represent some kind of misinterpretation, predisposition, unsound reasoning, or casual reading. It is important to note that for the PSSA-M, dropping an answer option is not an allowable modification.
OPEN-ENDED TASKS FOR READING
Open-ended, or constructed-response, tasks are designed to address comprehension of text in ways that multiple-choice items cannot. A short written response, requiring about ten minutes per item, allows students to prepare an answer and summarize using supporting details or examples derived from the text.
The PSSA-M reading open-ended items, like the PSSA reading open-ended items, are scored on a 0–3 point scale with an item-specific scoring guideline. This scale is consistent with the scale used on the National Assessment of Educational Progress (NAEP). The change from the former 0–4 point scale improves the alignment with the types of tasks required. Each task is text-dependent and is carefully constructed with the scoring guide reflecting the task requirements. All item-specific scoring guidelines are based on the General Scoring Guidelines for Open-Ended Reading Items. The general guidelines describe a hierarchy of responses, which represent the four score levels. See Appendix B: PSSA General Scoring Guidelines or the PSSA-M Reading Item and Scoring Samplers available on the PDE website.
The following tables provide a high-level overview of the operational reading PSSA-M test plan as compared to the general education reading PSSA. In addition, a comparison of the reporting categories for the reading PSSA-M and the general education reading PSSA is also provided. The PSSA-M content test blueprints show the same emphasis and patterns as the PSSA. The test content blueprints also show the extent to which the same or consistent categories of content appear in the PSSA-M and the PSSA. The PSSA-M, however, as noted in Table 2–3, has fewer items.

Chapter Two: Test Development Overview of the Modified PSSA
2012 PSSA-M Technical Report Page 10
Table 2–3. Reading Operational Test Plan Summary: PSSA and PSSA-M R
ead
ing Program Grades
Number of MC Items per PSSA
Number of 3-point OE Items per PSSA
Total Number of Points (MC + OE) per PSSA
PSSA 4, 5, 6, 7, 8, and 11
40 4 52
PSSA-M 4, 5, 6, 7, 8, and 11
30 2 36
Table 2–4. Reading Blueprint (percentage of total test points): PSSA and PSSA-M
Reporting Category
Program Grade
4 5 6 7 8 11
Comprehension and Reading Skills
PSSA 60%–80% 60%–80% 50%–70% 50%–70% 40%–60% 40%–60%
PSSA-M 60%–80% 60%–80% 50%–70% 50%–70% 40%–60% 40%–60%
Interpretation and Analysis of
Fictional and Nonfictional Text
PSSA 20%–40% 20%–40% 30%–50% 30%–50% 40%–60% 40%–60%
PSSA-M 20%–40% 20%–40% 30%–50% 30%–50% 40%–60% 40%–60%
Science Assessment Measures
The PSSA and the PSSA-M science assessments have four major reporting categories: The Nature of Science, Biological Sciences, Physical Sciences, and Earth and Space Sciences. These categories are similar to those used by the National Assessment of Educational Progress (NAEP) and The Third International Mathematics and Science Study (TIMSS). [However, the PSSA and the PSSA-M organize the categories differently.] The science assessment anchors cover seventeen major categories from two sets of standards: Science and Technology Standards (3.1, 3.2, 3.3, 3.4, 3.5, 3.6, 3.7, and 3.8) and Environment and Ecology Standards (4.1, 4.2, 4.3, 4.4, 4.5, 4.6, 4.7, 4.8, and 4.9). See Appendix A: Assessment Anchor Explanations for more information about how the Academic Standards are linked to the Reporting Categories, Assessment Anchors, and Eligible Content.
The science assessment employs two types of test items: multiple-choice and open-ended. These item types assess different levels of knowledge and provide different kinds of information about science achievement. The design of the operational 2012 PSSA-M for science achieves a reasonable balance between the two item types.

Chapter Two: Test Development Overview of the Modified PSSA
2012 PSSA-M Technical Report Page 11
SCIENCE MULTIPLE-CHOICE ITEMS
The majority of the science items included on the PSSA-M are multiple-choice (selected-response) items. This item type is especially efficient for measuring a broad range of content. In the PSSA-M science assessment, each multiple-choice item has four response options, only one of which is correct. The student is awarded one point for choosing the correct response. Distractors typically represent incorrect concepts, incorrect logic, or incorrect application of a scientific principle. It is important to note that for the PSSA-M, dropping an answer option is not an allowable modification.
Multiple-choice items are used to assess a variety of skill levels, from short-term recall of facts to the application of science content. PSSA items involving application emphasize the requirement to utilize science content to find an answer, rather than simply recalling information from memory.
OPEN-ENDED ITEMS FOR SCIENCE
At all grades, standalone science open-ended items (constructed-response tasks) require students to read a description of a scientific problem and to develop an appropriate solution. Open-ended items require about five minutes per task.
Open-ended tasks are especially useful for measuring students’ skills in science. They offer the opportunity to present real-life situations that require students to solve problems using science abilities learned in the classroom. Students must read the task carefully, identify the necessary information, devise a method of solution, enter the solution directly in the answer document, and when required, offer an explanation. This provides insight into the students’ science knowledge, abilities, and reasoning processes.
The open-ended science items are scored on a 0–2-point scale with an item-specific scoring guideline, and each task is carefully constructed with a scoring guide reflecting the task requirements. The general guidelines describe a hierarchy of responses which represent the three score levels. Each item-specific scoring guideline outlines the requirements at each score point, and each item-specific scoring guideline is based on the Science Scoring Guidelines for Open-Ended Items. See Appendix B: PSSA General Scoring Guidelines or the PSSA-M Science Item and Scoring Samplers available on the PDE website.
The following tables provide a high-level overview of the operational science PSSA-M test plan as compared to the general education science PSSA. In addition, a comparison of the reporting categories for the science PSSA-M and the general education science PSSA is also provided. The PSSA-M content test blueprints show the same emphasis and patterns as the PSSA. The test content blueprints also show the extent to which the same or consistent categories of content appear in the PSSA-M and the PSSA. The PSSA-M, however, as noted in Table 2–5, has fewer items.

Chapter Two: Test Development Overview of the Modified PSSA
2012 PSSA-M Technical Report Page 12
Table 2–5. Science Operational Test Plan Summary: PSSA and PSSA-M
Sci
ence
Program Grades
Number of stand-alone MC Items per PSSA
Number of Scenario-based MC Items per
PSSA
Number of 2-point OE Items per
PSSA
Number of Scenario-based 4-point OE Items per
PSSA
Total Number of
Points (MC + OE) per PSSA
PSSA 8 54 4 5 0 68
PSSA-M 8 30 0 2 0 34
PSSA 11 38 12 6 3 74
PSSA-M 11 30 0 2 0 34
Table 2–6. Science Blueprint (percentage of total test points): PSSA and PSSA-M
Reporting Category
Program Grade
8 11
Nature of SciencePSSA ~50% ~50%
PSSA-M ~50% ~50%
Biological SciencesPSSA ~17% ~17%
PSSA-M ~17% ~17%
Physical SciencesPSSA ~17% ~17%
PSSA-M ~17% ~17%
Earth and Space Sciences
PSSA ~17% ~17%
PSSA-M ~17% ~17%

Chapter Three: Item Development Process
2012 PSSA-M Technical Report Page 13
Chapter Three: Item Development Process The core portion of the 2012 PSSA-M mathematics operational administration is made up of items that were field tested in the 2009 PSSA-M standalone field test and used operationally for the first time in the 2010 PSSA-M mathematics operational administration. The items used as core-to-core linking items in the 2012 PSSA-M mathematics operational administration were selected from items that were developed for the 2009 PSSA-M standalone field test and used operationally on the 2011 PSSA-M mathematics operational administration. Therefore the activities that led to the 2012 PSSA-M operational mathematics administration began with the development of the draft test items that appeared in the 2009 PSSA-M standalone field test. The core portions of the 2012 PSSA-M reading and science operational administrations are made up of items that were field tested in the 2010 PSSA-M standalone field test. Therefore the activities that led to the 2012 PSSA-M operational reading and science administrations began with the development of draft test items that appeared in the 2010 PSSA-M standalone field test.
STEPS IN THE DEVELOPMENT PROCESS
A series of major activities took place in the development of the PSSA-M for mathematics. These key activities included the initial development of the guidelines for item revision and/or enhancement; cognitive interviews; item revision and/or enhancement of items; content review; bias, fairness, and sensitivity review; field test of items in spring 2009; item review with data; and final selection of items to compose the 2012 PSSA-M mathematics assessment for Grades 4–8 and 11. These activities are summarized in Table 3‒1 below, and they are further described in the paragraphs that follow.
Table 3–1. PSSA-M Mathematics Development Timeline
Time Frame
Assessment Activity
September 2008–January 2009
’09 FT for ’10 OP Item modifications implemented in preparation for 2009 standalone field test
January 2009 ’09 FT for ’10 OP Item review and bias, fairness, and sensitivity review for candidate items for the 2009 standalone field test
February–March 2009
’09 FT for ’10 OP Forms construction for the 2009 standalone field test
May 2009 Cognitive Interviews
Cognitive Interviews conducted in Pennsylvania schools
May 2009 ’09 FT for ’10 OP PSSA-M Mathematics Standalone Field Test
June–July 2009
’10 FT for ’11 OP Item modifications (revisions and/or enhancements) implemented in preparation for 2010 embedded field test
July–August 2009
’10 FT for ’11 OP Item review and bias, fairness, and sensitivity review for candidate items of the 2010 embedded field test
August 2009 ’09 FT for ’10 OP Statistical review of the 2009 field tested items

Chapter Three: Item Development Process
2012 PSSA-M Technical Report Page 14
Table 3–1 (continued). PSSA-M Mathematics Development Timeline
Time Frame
Assessment Activity
September 2009–January 2010
’10 OP & ’10 FT for ’11 OP
Forms construction for the 2010 operational assessment with embedded field test
April 2010 ’10 OP & ’10 FT for ’11 OP
2010 operational assessment with embedded field test
August 2010 ’10 FT for ’11 OP Statistical review of the 2010 field tested items
August-September 2010
’10 OP & ’10 FT for ’11 OP
Forms construction for the 2011 operational assessment
March 2011 ’11 OP 2011 operational assessment
August-September 2011
’12 OP Forms construction for the 2012 operational assessment reusing the 2010 core items
March 2012 ’12 OP 2012 operational assessment
A series of major activities took place in the development of the PSSA-M for reading. These key activities included the initial development of the guidelines for item revision and/or enhancement; cognitive interviews; item revision and/or enhancement of items; content review; bias, fairness, and sensitivity review; pilot testing of items in spring 2009; field testing of items in spring 2010; item review with data; and final selection of items to compose the 2012 PSSA-M reading assessments. These activities are summarized in Table 3‒2 below, and they are further described in the paragraphs that follow.
Table 3–2. PSSA-M Reading Development Timeline
Time Frame
Assessment Activity
Sept 2008–Jan 2009
’09 Pilot Test and ’10 FT
Item modifications implemented in preparation for 2009 Reading Pilot Test and 2010 Reading Standalone Field Tests
Jan 2009 ’09 Pilot Test and ’10 FT
Item review and bias, fairness, and sensitivity review for candidate items for the 2009 Reading Pilot Test and 2010 Reading Standalone Field Tests
Jan–March 2009
’09 Pilot Test Forms construction for the 2009 Reading Pilot Test
May 2009 Cognitive Interviews
Cognitive Interviews conducted in Pennsylvania schools
May 2009 ’09 Pilot Test PSSA-M Reading Pilot Test

Chapter Three: Item Development Process
2012 PSSA-M Technical Report Page 15
Table 3–2 (continued). PSSA-M Reading Development Timeline
Time Frame
Assessment Activity
May–July 2009
’10 FT for ’11 OP Item modifications (revisions and/or enhancements) implemented in preparation for 2010 Reading Standalone Field Tests
July–Aug 2009
’10 FT for ’11 OP Item review and bias, fairness, and sensitivity review for candidate items of the 2010 Reading Standalone Field Tests
Aug–Oct 2009
’10 FT for ’11 OP Forms construction for the 2010 Reading Standalone Field Tests
April–May 2010
’10 FT for ’11 OP PSSA-M Reading Standalone Field Tests
Aug 2010 ’10 FT for ’11 OP Statistical review of the 2010 field-tested items
Aug–Sept 2011
’10 FT for ’12 OP Forms construction for the 2012 operational assessments for Reading
March 2012 ’12 OP 2012 operational assessments for Reading
A series of major activities took place in the development of the PSSA-M for science. These key activities included the initial development of the guidelines for item revision and/or enhancement; cognitive interviews; item revision and/or enhancement of items; content review; bias, fairness, and sensitivity review; field test of items in spring 2010; item review with data; and final selection of items to compose the 2012 PSSA-M science assessments. These activities are summarized in Table 3‒3 below, and they are further described in the paragraphs that follow.
Table 3–3. PSSA-M Science Development Timeline
Time Frame
Assessment Activity
Sept 2008–Jan 2009
’10 FT Item modifications implemented in preparation for 2010 Science Standalone Field Tests
Jan 2009 ’10 FT Item review and bias, fairness, and sensitivity review for candidate items for the 2010 Science Standalone Field Tests
May 2009 Cognitive Interviews
Cognitive Interviews conducted in Pennsylvania schools
May–July 2009
’10 FT for ’11 OP Item modifications (revisions and/or enhancements) implemented in preparation for 2010 Science Standalone Field Tests
July–Aug 2009
’10 FT for ’11 OP Item review and bias, fairness, and sensitivity review for candidate items of the 2010 Science Standalone Field Tests
Aug– Oct 2009
’10 FT for ’11 OP Forms construction for the 2010 Science Standalone Field Tests
April–May 2010
’10 FT for ’11 OP PSSA-M Science Standalone Field Tests

Chapter Three: Item Development Process
2012 PSSA-M Technical Report Page 16
Table 3–3 (continued). PSSA-M Science Development Timeline
Time Frame
Assessment Activity
Aug 2010 ’10 FT for ’12 OP Statistical review of the 2010 field-tested items
Aug–Sept 2011
’10 FT for ’12 OP Forms construction for the 2012 operational assessments for Science
April–May 2012
’12 OP 2012 operational assessments for Science
Item Development Planning Meeting
Prior to the start of any item development work, DRC’s test development staff meets with PDE’s assessment office to discuss the test development plans for the next PSSA administration, including the test blueprint, the field test plan (including development counts), procedures, timelines, etc. With a complete development cycle lasting several years (from item authoring through field test, data review, and operational usage), the initial planning begins well in advance of the anticipated administration. For the 2012 PSSA-M operational administration, the initial planning meetings for the item modifying process for the 2009 and 2010 field tests occurred throughout 2008. Item modifying began in fall 2008, with the item review meetings occurring in 2009. See Tables 3–1, 3–2, and 3–3 for additional details.
Review of the Items
In September 2008, a pool of mathematics items from grades 4–8 and 11 was reviewed. In September 2008 and again in May 2009, pools of PSSA reading items from grades 4–8 and 11 and PSSA science items for grades 8 and 11 were reviewed. The review of the items focused upon whether each item might lend itself well to revision and/or enhancement for possible field testing of PSSA-M items in spring 2009 or spring 2010. The pool of candidate items was comprised of PSSA items that had been field tested in earlier administrations.
Training
To begin the process, WestEd and DRC selected and trained mathematics, reading, and science staff to review PSSA items for possible revising and/or enhancement. Qualified content experts were college graduates with teaching experience and a demonstrated base of knowledge in the content area. Many of these writers were content assessment specialists and curriculum specialists. The writers were trained individually and had previous experience in writing and modifying multiple-choice and open-ended items. Prior to modifying items for the PSSA-M, the cadre of item writers was trained with regard to the following:
Pennsylvania Academic Standards, Assessment Anchors, and Eligible Content
Webb’s Four Levels of Cognitive Complexity: Recall, Basic Application of Skill/Concept, Strategic Thinking, and Extended Thinking
General Scoring Guidelines for each content area
Specific and General Guidelines for Item Writing
Bias, Fairness, and Sensitivity

Chapter Three: Item Development Process
2012 PSSA-M Technical Report Page 17
Principles of Universal Design
Item Quality Technical Style Guidelines
Reference Information
Sample Items
In addition, staff with a background in special education (e.g., those certified in special education and/or those with teaching experience in working with students with disabilities) and/or those with a background in developing assessments for the given population were also members of the team.
Training of content staff at WestEd and DRC began with the study and discussion of the information presented in the Pennsylvania System of School Assessment-Modified (PSSA-M) Alternate Assessment Based on Modified Achievement Standards Item Revision and/or Enhancement Guidelines. These guidelines were developed by WestEd with support from DRC. They were reviewed and approved by PDE prior to item revision and/or item enhancement. The guidelines served as the basis for all item revision and/or enhancement. A summary of the guidelines are given in the next section. The full guidelines are found in Appendix D of this document. It is important to note that these guidelines do adhere to the Principles of Universal Design (Center for Universal Design, 1997). NCEO has produced seven elements of Universal Design as they apply to assessments (Johnstone, Altman, & Thurlow, 2006).
These elements of the Principles of Universal Design served to guide PSSA-M item revision and/or enhancement and are clearly noted in the Guidelines for Item Revision and Enhancement, found in Appendix D. Further discussion related to universal design considerations can be found in Chapter Four: “Universal Design Procedures Applied in the PSSA-M Test Development Process.”
Table 3‒4 shows the number of mathematics multiple-choice (MC) and open-ended (OE) items revised and/or enhanced for field testing in spring 2009. In some cases, during the review of the items, the reviewers determined that an existing item did not lend itself to revision and/or enhancement. In Table 3‒4, these are noted “As Is” with no modifications made to the item.
Table 3–4. Number of Mathematics Items (MC and OE) Revised and/or Enhanced for Field Testing in Spring 2009
Grade MC
Modified MC As Is
Total MC
OE Modified
Total Items per Grade
4 78 3 81 11 92
5 66 9 75 10 85
6 52 8 60 7 67
7 52 8 60 8 68
8 54 8 62 7 69
11 52 10 62 7 69
Total 354 46 400 50 450
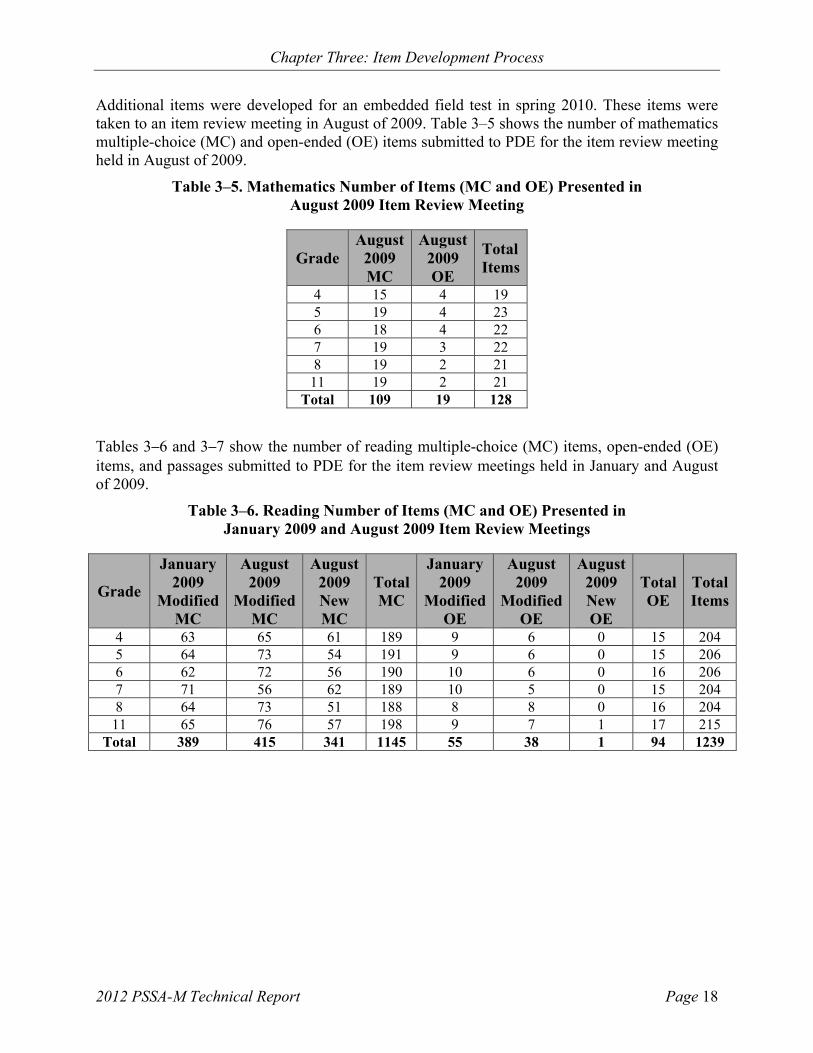
Chapter Three: Item Development Process
2012 PSSA-M Technical Report Page 18
Additional items were developed for an embedded field test in spring 2010. These items were taken to an item review meeting in August of 2009. Table 3–5 shows the number of mathematics multiple-choice (MC) and open-ended (OE) items submitted to PDE for the item review meeting held in August of 2009.
Table 3–5. Mathematics Number of Items (MC and OE) Presented in August 2009 Item Review Meeting
Grade August
2009 MC
August 2009 OE
Total Items
4 15 4 19 5 19 4 23 6 18 4 22 7 19 3 22 8 19 2 21
11 19 2 21 Total 109 19 128
Tables 3‒6 and 3‒7 show the number of reading multiple-choice (MC) items, open-ended (OE) items, and passages submitted to PDE for the item review meetings held in January and August of 2009.
Table 3–6. Reading Number of Items (MC and OE) Presented in January 2009 and August 2009 Item Review Meetings
Grade
January 2009
Modified MC
August 2009
Modified MC
August 2009 New MC
Total MC
January 2009
Modified OE
August 2009
Modified OE
August 2009 New OE
Total OE
Total Items
4 63 65 61 189 9 6 0 15 204 5 64 73 54 191 9 6 0 15 206 6 62 72 56 190 10 6 0 16 206 7 71 56 62 189 10 5 0 15 204 8 64 73 51 188 8 8 0 16 204
11 65 76 57 198 9 7 1 17 215 Total 389 415 341 1145 55 38 1 94 1239

Chapter Three: Item Development Process
2012 PSSA-M Technical Report Page 19
Table 3–7. Reading Number of Passages Presented in January 2009 and August 2009 Item Review Meetings
Grade January 2009
Passages August 2009
Passages Total
Passages 4 9 6 15 5 9 6 15 6 9 6 15 7 10 5 15 8 8 7 15
11 8 7 15 Total 53 37 90
Table 3‒8 shows the number of science multiple-choice (MC) and open-ended (OE) items submitted to PDE for the item review meetings held in January and August of 2009.
Table 3–8. Science Number of Items (MC and OE) Presented in January 2009 and August 2009 Item Review Meetings
Grade
January 2009
Modified MC
August 2009
Modified MC
Total MC
January 2009
Modified OE
August 2009
Modified OE
Total OE
Total Items
8 67 71 138 11 9 20 158
11 69 64 133 11 6 17 150
Total 136 135 271 22 15 37 308
SUMMARY OF REVISION AND/OR ENHANCEMENT GUIDELINES
Under the direction of the Pennsylvania Department of Education (PDE), the revisions and/or enhancements to PSSA items for mathematics, reading, and science were purposefully and necessarily made in order to address the eligible students’ need for accessibility when taking the PSSA-M. The initial phases of PSSA-M item revisions and/or enhancements relied on expert judgment (e.g., PDE content-area experts and special educators; Pennsylvania educators, including both content-area educators and those special education educators with expertise in teaching the target population of students with disabilities). In addition, all revised and/or enhanced items were field tested in spring 2009 or spring 2010 for mathematics and in spring 2010 for reading and science. The additional data collected on item performance of each field test item further served to validate the design and the revisions and/or enhancements of the PSSA-M items. The data also offered PDE guidance in the selection of revised and/or enhanced items for the PSSA-M operational assessments. The types of revisions and/or enhancements to items are provided below.

Chapter Three: Item Development Process
2012 PSSA-M Technical Report Page 20
Revisions
Students who will be eligible for the PSSA-M generally have difficulty processing information. As a result, revisions to items included the following:
Simplifying the language in order to reduce the cognitive load or the amount of complex information without changing the construct, or what the item was intended to measure.
Simplifying the language in order to remove any words that might be irrelevant.
Enhancements: Providing Supports
Enhancements to items involved embedding a type of support (e.g., adding graphics or artwork, providing definitions or context clues, providing scaffolds, and/or other permissible ways students might need to access and demonstrate understanding of the assessed content). Enhancement supports to items included the following:
Providing helpful hints designed to support students’ processing of information
Providing additional graphics and/or artwork to support understanding
Segmenting passages/prompts, when appropriate: When passages are segmented, items follow an order that parallels how information generally appears in the passage and/or prompt. (For example, for the reading PSSA-M, when appropriate, students will be provided the same passage/prompt as the general education PSSA at a given grade level, but the passage will be “segmented” or divided into meaningful parts. Those items that apply directly to each segment will appear directly after or adjacent to the referenced section of the text.)
Providing scaffolds such as adding hints or thought boxes (visual cues) to provide a further definition of a word or words and terminology and/or to support the text or emphasize main ideas
Providing supports for a number of steps and/or operations: For example, in a multi-step mathematics item, as appropriate, sub-questions or steps to break up or help students think through multi-step problems/item are provided.
Adding additional directions to explain a process or activity
Adding pre-reading information to clarify the purpose of a passage or prompt
Embedding a formula (as appropriate for intention of the assessed standard)
Enhancements: Visual Display
Enhancements to items also involve the degree to which the item format can be altered (e.g., introducing bolding, underlining, and other text changes, as well as changes in font size) and still provide a reliable measure of the student’s knowledge/skill. Enhancements involving item format included the following:
Adding more space between letters and words if item validity was not affected
Having fewer items per page, when appropriate
Increasing the width of an item or line length (from two columns to one, single-column layout so that the text of the item spans the entire width of the page), when appropriate

Chapter Three: Item Development Process
2012 PSSA-M Technical Report Page 21
Restructuring the stem of an item into a “stacked” format (Facts or details related to the item were indented and placed into a stacked format as well.)
Inserting bullets to organize complex information or inserting bullets to break complex text within an item stem into smaller parts
ITEM AUTHORING AND TRACKING
Initially, items are generated with software-prepared PSSA-M Item Cards and used for preliminary sorting and reviewing. Although very similar, the PSSA-M Item Card for Multiple-Choice Items differs from the PSSA-M Item Card for Open-Ended Items in that the former has a location at the bottom of the card for comments regarding the distractors. Blank examples of these two cards are shown in Appendix E: PSSA-M Item Review Cards. In both instances a column against the right margin provides for codes to identify the subject area, grade, content categories, passage information (in the case of reading), item type, depth of knowledge (cognitive complexity), estimated difficulty, answer key (MC items), and calculator use (mathematics).
All items undergoing field-testing in 2009 or 2010 were entered into the DRC Item Development and Educational Assessment System (IDEAS), which is a comprehensive, secure, online item banking system. It accommodates item writing, item viewing and reviewing, and item tracking and versioning. IDEAS manages the transition of an item from its developmental stage to its approval for use within a test form. The system supports an extensive item history that includes item usage within a form, item-level notes, content categories and subcategories, item statistics from both classical and Rasch item analyses, and classifications derived from analyses of differential item functioning (DIF). Sample IDEAS Item Cards are presented in Appendix E: PSSA-M Item Review Cards.
INTERNAL REVIEWS AND PDE REVIEWS
To ensure that the items revised and/or enhanced were sufficient in number and adequately distributed across subcategories and levels of difficulty, content specialists, editors, and special education experts were informed of the required quantities of items needed for the external review by committees of Pennsylvania educators. Based upon the training received, content experts and special education experts began the process of revising and/or enhancing items. As items were revised and/or enhanced, they were entered into the item banking system along with important information (e.g., grade level, Assessment Anchor, Eligible Content, depth of knowledge, source item ID for modified items). Subsequently, as an integral part of the internal item revision and/or enhancement process, each item was reviewed by a team of content specialists, editors, and special education experts both at WestEd and DRC. Content specialists, editors, and special education experts evaluated each item to make sure that the construct had not changed and that it still measured the intended Eligible Content and/or Assessment Anchor Content Standard. They also assessed each item to make certain that the item revisions and/or enhancements were appropriate to the intended grade and that they provided and cued only one correct answer. In addition, the difficulty level, depth of knowledge, graphics, language demand, and distractors were also evaluated. Other elements considered in this process included, but were not limited to, Universal Design considerations, adherence to the PDE-approved item revision and enhancement guidelines, bias, source of challenge, grammar/punctuation, and PSSA-M style.
Following this internal process, revised and/or enhanced items were submitted to content specialists at the Pennsylvania Department of Education for review. PDE staff then consulted with

Chapter Three: Item Development Process
2012 PSSA-M Technical Report Page 22
WestEd and DRC about any general issues (style, format, interpretation of Assessment Anchors and Eligible Content) and about the revisions and/or enhancements to specific items. Following PDE’s review, the revised and/or enhanced items were prepared for the content review meetings and the bias, fairness, and sensitivity meetings conducted with Pennsylvania educators. Information concerning these external reviews by Pennsylvania educators is provided below.
Review by Committees of Pennsylvania Educators Before the PSSA-M items were field tested, the items were reviewed by two separate committees at different stages. The first meeting was the Bias, Fairness, and Sensitivity Committee, and the second was the Item Content Meeting Committee. The first Bias, Fairness, and Sensitivity Meeting was held in Harrisburg, PA, on January 12–13 of 2009, and the first Item Content Meeting also held in Harrisburg, PA, took place on January 14–16 of 2009. A second set of meetings was held to review additional modified items. The second Bias, Fairness, and Sensitivity Meeting was held in Harrisburg, PA, on July 28–29 of 2009, and the second Item Content Meeting also held in Harrisburg, PA, took place on August 5–6 of 2009. Summaries, guidelines, and procedures for each meeting are presented below.
BIAS, FAIRNESS, AND SENSITIVITY REVIEW
Prior to 2009 or 2010 field testing, all revised and/or enhanced PSSA-M items were submitted to a Bias, Fairness, and Sensitivity Committee for review. The committee members consisted of a cross-representation of ethnic groups. Members of the committee also had expertise with special needs students and English Language Learners. All members had served on previous Pennsylvania Bias, Fairness, and Sensitivity Committees. The committee’s primary responsibility was to evaluate items as to acceptability with regard to bias, fairness, and sensitivity issues. They also made recommendations for changes or deletion of items in order to remove the potential for issues of bias, fairness, and/or sensitivity.
The expert, multi-ethnic committee composed of men and women was trained by DRC and WestEd staff to review items for bias, fairness, and sensitivity issues. Training materials included a PDE-approved manual developed by DRC (DRC, 2003–2009). The focus of the training was on security and confidentiality; fairness in testing ensuring balanced treatment; definition of bias; and types of bias including stereotyping, gender, regional or geographical, ethnic or cultural, socioeconomic or class, religious, ageism, persons with disabilities, experiential, and sensitivity.
PDE staff members also attended the review and served as reviewers of the process. All PSSA-M items were read by a cross-section of committee members. Each member noted bias, fairness, and/or sensitivity comments on tracking sheets and on the item, if needed, for clarification. Committee members individually categorized any concerns as related to ageism, disability, ethnicity/culture, gender, regional, religious, socioeconomic, or stereotyping. These categories then formed the framework through which recommendations for modification or rejection of items occurred during the subsequent committee consensus process. The committee then discussed each of the issues as a group and came to consensus as to which issues should represent the view of the committee. All consensus comments were then compiled, and the suggested actions on these items were recorded and submitted to PDE. This review followed security procedures. Items in binders were distributed for committee review by number and signed for by each member on a daily basis. All attendees, with the exception of PDE staff, were required to sign a confidentiality agreement. All materials not in use at any time were stored in a locked room at the DRC offices in Harrisburg, PA. Secure materials that did not need to be retained after the meeting were deposited in secure barrels, the contents of which were shredded.

Chapter Three: Item Development Process
2012 PSSA-M Technical Report Page 23
ITEM CONTENT REVIEW
Prior to the 2009 or 2010 field testing, all revised and/or enhanced items were also submitted to content committees for review. The content committees consisted of Pennsylvania educators from school districts throughout the Commonwealth of Pennsylvania. The committee members were selected to have both content expertise as well as expertise in teaching students with disabilities and/or those students who may be administered the PSSA-M assessment. The primary responsibility of the content committees was to evaluate the revised and/or enhanced items with regard to the quality of the revision and/or enhancement, the content classification or whether or not the construct had changed, including grade-level appropriateness of the revision and/or enhancement, estimated difficulty, depth of knowledge, and source of challenge. With source of challenge (Webb, 2002; 2007), items were identified where the cognitive demand is focused on an unintended content, concept, or skill. In addition, source of challenge was considered if the reason that an answer could be given resulted from a cultural bias, an inappropriate reading level, or a flawed graphic in an item revision and/or enhancement, or if the item still required specialized, non-content related knowledge to answer. Source of challenge could result in the student answering—either correctly or incorrectly—without actually demonstrating the intended content or skill. Committee members were asked to note any items with a source of challenge and to suggest additional revisions and/or enhancements to remove the source of challenge. They also suggested additional and/or other revisions to items and/or other enhancements to the items. In some cases when the committee suggested that an item be deleted, the committee members reviewed a suggested replacement item provided by the facilitators. The committee also reviewed the items for adherence to the guidelines for item revision and/or enhancement and the Principles of Universal Design, including language demand and issues of bias, fairness, and sensitivity.
Committee members were approved by PDE, and PDE-approved invitations were sent to them by DRC. PDE also selected internal PDE staff members for attendance. The meeting commenced with a welcome by PDE and DRC. This was followed by a PowerPoint presentation by DRC and WestEd. The PowerPoint presentation introduced the goals of the meeting, security and confidentiality, overview of the PSSA-M, and PSSA-M strategies for revising and/or enhancing items, including what could not be considered. The life of a PSSA item, the life of a PSSA-M item, the item review process, content alignment, rigor-level alignment, technical design, universal design, roles and responsibilities, and an opportunity to ask questions were also included in the PowerPoint training. In addition, the training also included procedures and forms to be used for item content review. Unique to this item review training was the presentation of sample items which included presenting each parent item along with the modified “child” item. These parent items were shown so the committee could see how the item originated as a PSSA item. Parent items were also included for the revised and/or enhanced items during the item review.
After the training, committee members were divided into groups. WestEd content assessment specialists facilitated the reviews and were assisted by representatives from DRC and PDE. The members reviewed each item and then came to consensus and assigned a status to each item as a group: Approved, Accepted with Revision, Move to Another Assessment Anchor or Grade, or Rejected. All comments were recorded, and a master rating sheet was completed. Committee facilitators recorded the committee consensus on the Item Review Rating Sheet. The consensus suggestions for acceptance, revision, or rejection were reviewed by PDE, and accepted suggestions or alternate decisions were implemented by DRC.

Chapter Three: Item Development Process
2012 PSSA-M Technical Report Page 24
Security was addressed by adhering to a strict set of procedures. Items in binders were distributed for committee review by number and signed for by each member on a daily basis. All attendees, with the exception of PDE staff, were required to sign a confidentiality agreement. All materials not in use at any time were stored in a locked room. Secure materials that did not need to be retained were deposited in secure barrels, the contents of which were shredded.
As the committee members reviewed the items and completed the Item Rating Sheets, they used the PSSA-M Item Review Criteria Guidelines produced by DRC and approved by PDE. These guidelines are found in Appendix F of this report. All committees had between 8 and 15 participants. Committees included a mixture of veteran item reviewers, new reviewers, and special education teachers. In general, all participants had been exposed to special needs students and they paid close attention to what the special education teacher had to say about the items. There were good discussions among the members of the committees, and overall, they liked the modifications that were made to the items.
All committee-recommended edits were reviewed by PDE. Approved edits were provided to DRC. All PDE approved edits were made. The revised and/or enhanced items were then made available for the Cognitive Interviews.
READING PILOT
As a result of feedback from both the TAC and the PSSA-M Advisory Task Force, PDE and DRC proposed a small pilot test in Reading, grades 5 and 8 only. The chart that follows shows the major deliverables and deadlines for the 2009 Reading pilot test pull lists.
Table 3–9. 2009 PSSA-M Reading Pilot Test Schedule
Date/Timeframe Task
February 17, 2009 Reading pilot test pull list delivered to DRC from WestEd.
February 27 Pilot DFA template provided to WestEd.
March 5 DRC provided initial draft of reading pilots to WestEd.
March 10 WestEd provided initial reading pilot feedback to DRC.
March 13 DRC received pilot DFA from WestEd.
March 13 Reading pilot test forms provided to PDE/WestEd for review.
March 18 PDE and WestEd provided final approval to print PSSA-M pilot test.
March 23 PDE received pilot DFA for review.
March 23 Reading Pilot test approved for printer's proof production.
March 27 Reading Pilot test DFA approved by PDE.
April 8 Reading Pilot test admin materials approved for printer's proof production.

Chapter Three: Item Development Process
2012 PSSA-M Technical Report Page 25
The specifications required three pilot test forms per grade. There were two passages, ten multiple-choice items, and one open-ended item per form. The following forms layout was used:
Table 3–10. 2009 PSSA-M Reading Pilot Forms Layout
Enhancement Form 1 Form 2 Form 3
Passage Segmentation
Passage A: No segmentation Passage B: Segmentation (version 1)
Passage A: Segmentation (version 1) Passage B: No segmentation
Passage A: Segmentation (version 2) Passage B: Segmentation (version 2)
Passage Columns
Both passages: One column (usual margins)
Both passages: Two columns
Passage A: One column (wider margins) Passage B: Two columns
OE Items Three points, scaffolded into parts a, b, c with single answer space
Three points, scaffolded with answer space following each part
Two points; scaffolded with answer space following each part
Glossing At least one passage: Footnote style glossing
At least one passage: Bolded-word, glossing at bottom of page
At least one passage: Bolded-word, glossing in margin
Helpful Hints In Items
Both passages: Helpful hint above the item
Both passages: Helpful hint below the item
Passage A: Helpful hint as a first statement in the stem Passage B: Helpful hint in parentheses in the stem
Item Placement Both passages: Two items per page
Passage A: All items on facing page with each passage segment; the “whole passage” (with explanation that it is the parts put together) placed before questions that cut across segments Passage B: Two items per page
Both passages: All items on facing page with each passage segment; direction telling students to use “all segments” to answer the questions placed before questions that cut across segments
The Reading pilot tests were administered from May 18, 2009, through May 22, 2009. The pilot tests were scored and the results were shared by DRC with PDE in October 2009.
Chapter Three: Item Development Process
2012 PSSA-M Technical Report Page 26
COGNITIVE INTERVIEWS
As a part of the development process for the PSSA-M, Cognitive Interviews were also conducted. In order for the results of the Cognitive Interviews to help inform the item revision and/or enhancement process for the PSSA-M assessments, the interviews were conducted prior to the final development and field testing of the items. In addition to mathematics items, the Cognitive Interviews involved reading and science items. The following information summarizes the process used for the Cognitive Interviews. The introduction, study overview, and rationale for the PSSA-M cognitive interviews is based upon the report titled Cognitive Interviews in Pennsylvania: Report on Data Collection for the Pennsylvania System of School Assessment Alternate Assessment with Modified Achievement Standards (PSSA-M) Study. This report is available upon request from PDE. Additional details found in this report include the method used to conduct the interviews; target sample size; characteristics of the districts selected to participate; the process of school and student recruitment; informed consent; interview process; item booklets; teacher survey; findings; frequency of responses; findings by cluster, linguistic enhancements, test design enhancements, typographic feature enhancements; challenges with terminology and vocabulary, and findings by item enhancement type.
In order to provide help in identifying the need for an additional alternate assessment, PDE requested additional information from the Cognitive Interviews including information concerning accommodations used during instruction; effective tasks/task types that might help students with disabilities demonstrate their knowledge and ability; corroboration of enhancement strategies employed on PSSA-M; preparing students with disabilities for the PSSA-M; and application of PSSA-M results.
1. Introduction
Data Recognition Corporation (DRC), in collaboration with WestEd, proposed to the Commonwealth of Pennsylvania a study intended to provide PDE with information the Department might want to consider when making decisions concerning the development of the PSSA-M. More specifically, DRC’s subcontractor, WestEd, designed and conducted Cognitive Interviews with general education students and students with disabilities to examine the degree to which revision and/or enhancement strategies applied to PSSA-M items facilitated student access (their ability to understand and demonstrate their grade-level content understanding) to tested content. The Cognitive Interviews were conducted in Pennsylvania schools between May 11 and May 29, 2009. The sections below present an overview of the study, the Cognitive Interview methodology, and findings. Implications for future development of the PSSA-M also are presented.
2. Study Overview
The study systematically evaluated the strategies used to develop items to be field tested and the degree to which these strategies facilitated students’ abilities to demonstrate what they knew and could do. More specifically, this Cognitive Interview study intended to address the following question: What are the cognitive processes by which test items (or item types) are understood by students?
Chapter Three: Item Development Process
2012 PSSA-M Technical Report Page 27
Data were collected from 252 students in grades 4, 5, 6, 7, 8, and 11 enrolled in Pennsylvania public schools in five districts across the Commonwealth, and from teachers in those schools who work primarily with PSSA-M-eligible students. This process is further described below.
3. Rationale for Cognitive Interviews
In the study, Cognitive Interviews were conducted to examine the effectiveness of the item enhancement strategies currently used during development of the PSSA-M reading and science field test items. Mathematics items were also included in the study. The results provided information concerning the degree to which current enhancement strategies—which consist primarily of changes to item structure or format—increase access to test items for students with disabilities (SWDs) and general education students.
Cognitive interviewing strategies were drawn from the family of process-tracing or verbal protocol models that can be used to confirm or verify hypotheses about access to tested content. They provided a forum for the researchers to test assumptions about the intent of an item or question. By microanalyzing the items (Solano-Flores & Trumbull, 2003), the researchers could simultaneously gather information about students’ understandings of task expectations; their levels of mastery of the content; and the reasoning processes, problem solving strategies, and adaptive skills students use when answering test questions (Ericsson & Simon, 1980, 1993; Paulsen & Levine, 1999).
During each Cognitive Interview, researchers observe students individually as they respond to test questions. As students attempt to answer each item or solve each problem, they are encouraged to articulate, or say out loud their interpretation of the task required and the steps or processes needed to complete the task (concurrent data collection). Student comments, observations, insights, and responses about directions, item stem, response choices, and graphics or stimuli help the researchers check assumptions about whether a test item is functioning as intended; that is, that the assessment task actually taps the cognitive processes that are intended to be assessed (National Research Council, 2001).
The Cognitive Interview process used in Pennsylvania was conducted in three steps (adapted from Sato, Rabinowitz, Gallagher & Huang, in press). In the first step, the student was introduced to the interview process and allowed to practice thinking aloud. In the second step, data was collected concurrently as the student spoke out loud as he/she attempted to answer each test question. Via prompts, the researcher interacted with the student to elicit verbal responses that described his/her understanding of the test question and strategies for answering it. In the third step, the retrospective stage of data collection, students were asked specific questions about the test item (probes) immediately after answering it. At this point, most students could look back, recall, and discuss what they did to answer the question or solve the problem; in this way, they could verify or clarify their earlier comments. Once the student responded to all test items, the researcher asked each student a set of follow-up questions to clarify or verify comments collected earlier and/or to probe deeper into the student’s thinking processes about that item.

Chapter Three: Item Development Process
2012 PSSA-M Technical Report Page 28
This multi-step process helped reveal the types of prior/background knowledge and/or requisite skills that may have supported students’ abilities to respond to the item and to assess the consequences of their decisions (Kopriva, 2001). Data collected through the Cognitive Interview contributed to information that helped to validate the interpretations of test performance outcomes by indicating the degree to which students’ demonstrated understanding concurred with the construct intended to be measured by the item. From these interviews, specific, richly descriptive data were collected. This data was then used to help inform decision-making about the strategies currently used to revise and/or enhance items for the PSSA-M so that these enhancements would appropriately facilitate student access to the assessed content.
Summary of Cognitive Interviews
As stated above, the purpose of the Cognitive Interview study was to systematically evaluate the strategies used to develop (revise and/or enhance) items for the PSSA-M and the degree to which these strategies facilitated students’ ability to demonstrate what they know and can do. The study addressed the following question: What are the cognitive processes by which test items (or item types) are understood by students?
Test items used in this study reflected a range of revision and enhancement strategies intended to facilitate the access to assessed content of students eligible for the PSSA-M. Results of the study suggested that a number of the revision and enhancement strategies, such as those related to linguistic enhancements or test design enhancements, helped students with their performance on the items included in this study.
TEST CONTENT BLUEPRINT FOR 2012 PSSA-M ASSESSMENTS
The PSSA-M, like the PSSA, is based on the Pennsylvania Academic Standards. The 2012 PSSA and PSSA-M reflect the new Assessment Anchors (PDE 2004), which were designed as a means of improving the articulation of curricular, instructional, and assessment practices. The Assessment Anchors serve to clarify the Academic Standards assessed on the PSSA and to communicate “assessment limits,” or the range of knowledge and skills from which the PSSA would be designed. Relevant to item development are the refinement and clarification embodied in the Assessment Anchors.
Table 3–11. Mathematics Blueprint (Percentage of Total Test Points): PSSA and PSSA-M
Reporting Category
Program Grade
4 5 6 7 8 11 Numbers and
Operations PSSA 43%–47% 41%–45% 28%-32% 20%–24% 18%-22% 12%–15%
PSSA-M 43%–47% 41%–45% 28%-32% 20%–24% 18%-22% 12%–15%
Measurement PSSA 12%–15% 12%–15% 12%–15% 12%–15% 12%–15% 12%–15%
PSSA-M 12%–15% 12%–15% 12%–15% 12%–15% 12%–15% 12%–15%
Geometry PSSA 12%–15% 12%–15% 15%–20% 15%–20% 15%–20% 12%–18%
PSSA-M 12%–15% 12%–15% 15%–20% 15%–20% 15%–20% 12%–18%
Algebraic Concepts
PSSA 12%–15% 13%–17% 15%–20% 20%–27% 25%–30% 38%–42%PSSA-M 12%–15% 13%–17% 15%–20% 20%–27% 25%–30% 38%–42%
Data Analysis & Probability
PSSA 12%–15% 12%–15% 15%–20% 15%–20% 15%–20% 12%–18%PSSA-M 12%–15% 12%–15% 15%–20% 15%–20% 15%–20% 12%–18%

Chapter Three: Item Development Process
2012 PSSA-M Technical Report Page 29
Table 3–12. Reading Blueprint (Percentage of Total Test Points): PSSA and PSSA-M
Reporting Category
Program Grade
4 5 6 7 8 11 Comprehension
and Reading Skills
PSSA 60%– 80% 60%–80% 50%–70% 50%–70% 40%–60% 40%–60%
PSSA-M 60%–80% 60%–80% 50%–70% 50%–70% 40%–60% 40%–60%
Interpretation and Analysis of Fictional and
Nonfictional Text
PSSA 20%–40% 20%–40% 30%–50% 30%–50% 40%–60% 40%–60%
PSSA-M 20%–40% 20%–40% 30%–50% 30%–50% 40%–60% 40%–60%
Table 3–13. Science Blueprint (Percentage of Total Test Points): PSSA and PSSA-M
Reporting Category
Program Grade
8 11
Nature of Science PSSA ~50% ~50%
PSSA-M ~50% ~50%
Biological Science PSSA ~17% ~17%
PSSA-M ~17% ~17%
Physical Science PSSA ~17% ~17%
PSSA-M ~17% ~17%
Earth and Space Science
PSSA ~17% ~17%
PSSA-M ~17% ~17%
Operational Layout for 2012 PSSA-M
The PSSA-M mathematics assessments for Grades 4–8 and 11 are combined into one integrated test/answer booklet test booklet for each grade. (This differs from the PSSA mathematics assessments in Grades 4–8 and 11 which use separate test and answer booklets and combine the mathematics and reading assessments in the same set of materials.) The modified booklets contain scannable pages for multiple-choice (MC) responses, open-ended (OE) items with response spaces, and demographic data collection areas. All MC items are worth 1 point. OE items receive a maximum of 4 points (scale of 0–4).
The PSSA-M reading assessments for Grades 4–8 and 11 are combined into one integrated test/answer booklet test booklet for each grade. (This differs from the PSSA reading assessments in Grades 4–8 and 11 which use separate test and answer booklets and combine the mathematics and reading assessments in the same set of materials.) The modified booklets contain scannable pages for multiple-choice (MC) responses, open-ended (OE) items with response spaces, and demographic data collection areas. All MC items are worth 1 point. OE items receive a maximum of 3 points (scale of 0–3).
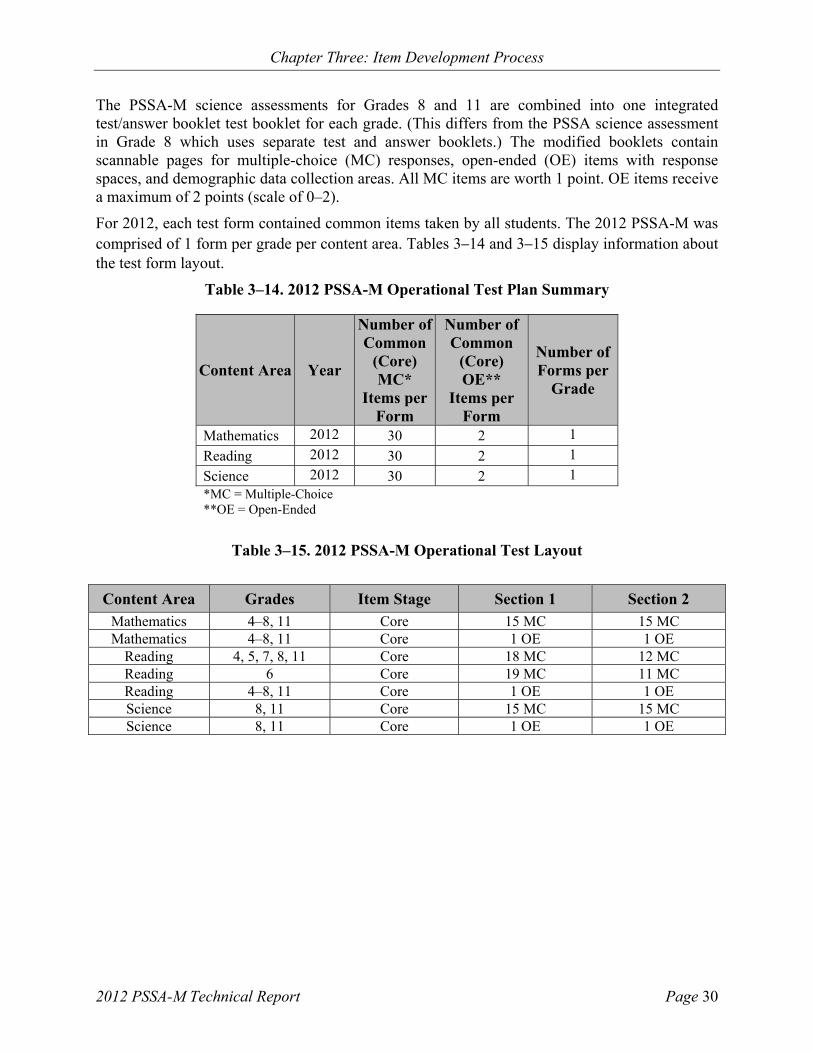
Chapter Three: Item Development Process
2012 PSSA-M Technical Report Page 30
The PSSA-M science assessments for Grades 8 and 11 are combined into one integrated test/answer booklet test booklet for each grade. (This differs from the PSSA science assessment in Grade 8 which uses separate test and answer booklets.) The modified booklets contain scannable pages for multiple-choice (MC) responses, open-ended (OE) items with response spaces, and demographic data collection areas. All MC items are worth 1 point. OE items receive a maximum of 2 points (scale of 0–2).
For 2012, each test form contained common items taken by all students. The 2012 PSSA-M was comprised of 1 form per grade per content area. Tables 3‒14 and 3‒15 display information about the test form layout.
Table 3–14. 2012 PSSA-M Operational Test Plan Summary
Content Area Year
Number of Common
(Core) MC*
Items per Form
Number of Common
(Core) OE**
Items per Form
Number of Forms per
Grade
Mathematics 2012 30 2 1
Reading 2012 30 2 1
Science 2012 30 2 1 *MC = Multiple-Choice **OE = Open-Ended
Table 3–15. 2012 PSSA-M Operational Test Layout
Content Area Grades Item Stage Section 1 Section 2 Mathematics 4–8, 11 Core 15 MC 15 MC Mathematics 4–8, 11 Core 1 OE 1 OE
Reading 4, 5, 7, 8, 11 Core 18 MC 12 MC Reading 6 Core 19 MC 11 MC Reading 4–8, 11 Core 1 OE 1 OE Science 8, 11 Core 15 MC 15 MC Science 8, 11 Core 1 OE 1 OE

Chapter Three: Item Development Process
2012 PSSA-M Technical Report Page 31
An individual student’s score is obtained by combining the points from the core MC and OE portions of the test as follows:
Table 3–16. 2012 PSSA-M Core Points
Student’s Score
Grades MC
Items OE Items Total Points
Possible
Mathematics 4–8, 11 30 2 items X 4-points=8 points 38
Reading 4–8, 11 30 2 items X 3 points=6 points 36
Science 8, 11 30 2 items X 2 points=4 points 34
For more information concerning the process used to convert the operational layout into forms (form construction), see Chapter Six.
Linking for 2011 and 2012 PSSA-M Mathematics Assessments
Linking provides a statistical bridge between assessment administrations. The 2012 administration was linked back to the 2011 administration through the use of linking items in the core (core-to-core link). In the PSSA-M, only multiple-choice items were used for linking purposes. Open-ended items were not repeated as linking items across cores. Approximately 20‒50% of the multiple-choice items for each grade were repeated as linking items.
The matter of linking will be treated more fully in Chapter Fifteen.
Test Sessions and Timing for 2012 PSSA-M Mathematics Assessments
The testing window for the 2012 operational assessment, including make-ups, extended from March 12 through March 30, 2012. The mathematics assessments consisted of two sections. Test administration recommendations called for each section to be scheduled as one assessment session, and schools were not permitted to combine both sections into a single session. Administration guidelines stipulated that the sections be administered in the sequence in which they are printed in the test booklets. The following tables outline the assessment schedule and estimated times for each section (“MC” refers to multiple-choice and “OE” refers to open-ended items). The estimated “Student Testing” times shown on the next page do not include time for administrative tasks that occur during the pre- and post-administration activities. These times are estimated separately. Times are approximate and are supplied to test administrators for scheduling purposes only.
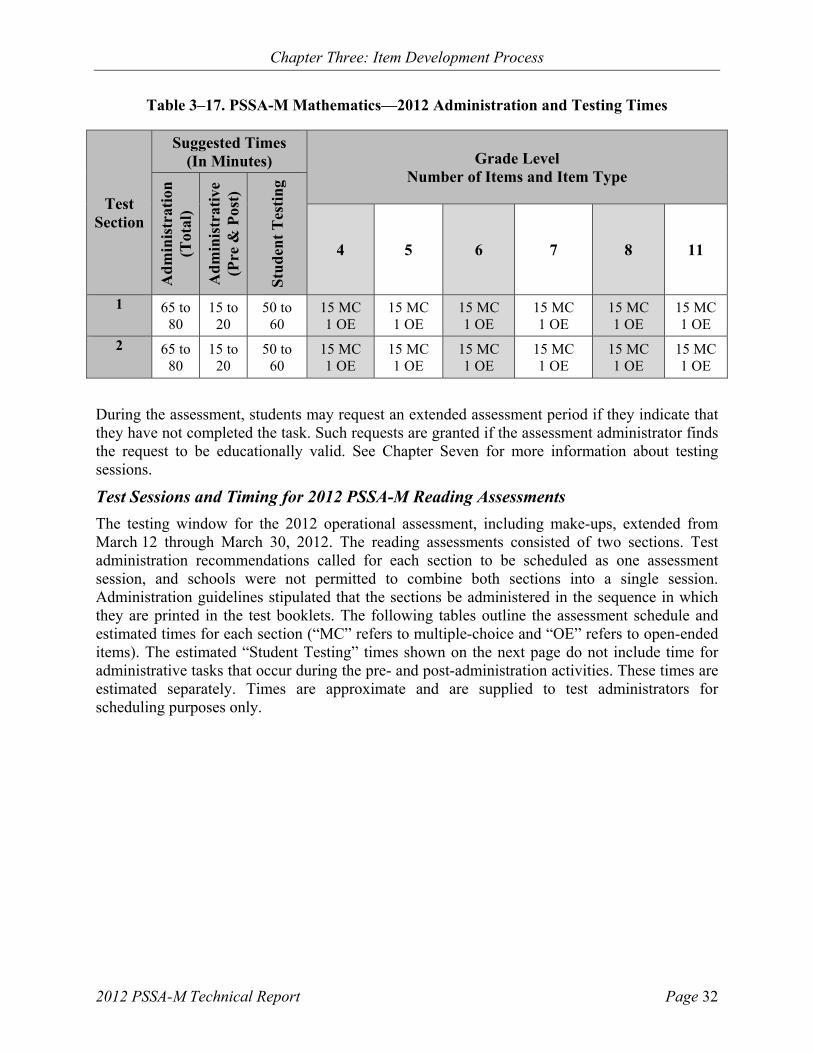
Chapter Three: Item Development Process
2012 PSSA-M Technical Report Page 32
Table 3–17. PSSA-M Mathematics—2012 Administration and Testing Times
Test Section
Suggested Times (In Minutes) Grade Level
Number of Items and Item Type A
dm
inis
trat
ion
(T
otal
)
Ad
min
istr
ativ
e (P
re &
Pos
t)
Stu
den
t T
esti
ng
4 5 6 7 8 11
1 65 to 80
15 to 20
50 to 60
15 MC 1 OE
15 MC 1 OE
15 MC 1 OE
15 MC 1 OE
15 MC 1 OE
15 MC 1 OE
2 65 to 80
15 to 20
50 to 60
15 MC 1 OE
15 MC 1 OE
15 MC 1 OE
15 MC 1 OE
15 MC 1 OE
15 MC 1 OE
During the assessment, students may request an extended assessment period if they indicate that they have not completed the task. Such requests are granted if the assessment administrator finds the request to be educationally valid. See Chapter Seven for more information about testing sessions.
Test Sessions and Timing for 2012 PSSA-M Reading Assessments
The testing window for the 2012 operational assessment, including make-ups, extended from March 12 through March 30, 2012. The reading assessments consisted of two sections. Test administration recommendations called for each section to be scheduled as one assessment session, and schools were not permitted to combine both sections into a single session. Administration guidelines stipulated that the sections be administered in the sequence in which they are printed in the test booklets. The following tables outline the assessment schedule and estimated times for each section (“MC” refers to multiple-choice and “OE” refers to open-ended items). The estimated “Student Testing” times shown on the next page do not include time for administrative tasks that occur during the pre- and post-administration activities. These times are estimated separately. Times are approximate and are supplied to test administrators for scheduling purposes only.

Chapter Three: Item Development Process
2012 PSSA-M Technical Report Page 33
Table 3–18. PSSA-M Reading—2012 Administration and Testing Times
Test Section
Suggested Times (In Minutes) Grade Level
Number of Items and Item Type A
dm
inis
trat
ion
(T
otal
)
Ad
min
istr
ativ
e (P
re &
Pos
t)
Stu
den
t T
esti
ng
4 5 6 7 8 11
1 75 to 90
15 to 20
60 to 70
18 MC 1 OE
18 MC 1 OE
19 MC 1 OE
18 MC 1 OE
18 MC 1 OE
18 MC 1 OE
2 55 to 70
15 to 20
40 to 50
12 MC 1 OE
12 MC 1 OE
11 MC 1 OE
12 MC 1 OE
12 MC 1 OE
12 MC 1 OE
During the assessment, students may request an extended assessment period if they indicate that they have not completed the task. Such requests are granted if the assessment administrator finds the request to be educationally valid. See Chapter Seven for more information about testing sessions.
Test Sessions and Timing for 2012 PSSA-M Science Assessments The testing window for the 2012 operational assessment, including make-ups, extended from April 23 through May 4, 2012. The science assessments consisted of two sections. Test administration recommendations called for each section to be scheduled as one assessment session, and schools were not permitted to combine both sections into a single session. Administration guidelines stipulated that the sections be administered in the sequence in which they are printed in the test booklets. The following tables outline the assessment schedule and estimated times for each section (“MC” refers to multiple-choice and “OE” refers to open-ended items). The estimated “Student Testing” times shown on the next page do not include time for administrative tasks that occur during the pre- and post-administration activities. These times are estimated separately. Times are approximate and are supplied to test administrators for scheduling purposes only.
Table 3–19. PSSA-M Science—2012 Administration and Testing Times
Test Section
Suggested Times (In Minutes)
Grade Level Number of Items and Item Type
Ad
min
istr
atio
n
(Tot
al)
Ad
min
istr
ativ
e (P
re &
Pos
t)
Stu
den
t T
esti
ng
8 11
1 45 to 60
15 to 20
30 to 40
15 MC 1 OE
15 MC 1 OE
2 45 to 60
15 to 20
30 to 40
15 MC 1 OE
15 MC 1 OE

Chapter Three: Item Development Process
2012 PSSA-M Technical Report Page 34
During the assessment, students may request an extended assessment period if they indicate that they have not completed the task. Such requests are granted if the assessment administrator finds the request to be educationally valid. See Chapter Seven for more information about testing sessions.
Reporting Categories and Points Distributions for 2012 PSSA and PSSA-M Mathematics Assessments
The mathematics assessment results are reported in five categories that approximately correspond to those advocated by the National Council of Teachers of Mathematics (NCTM). The code letters for these Assessment Anchor categories are A–E and correspond to the following:
A. Numbers and Operations
B. Measurement
C. Geometry
D. Algebraic Concepts
E. Data Analysis and Probability
The distribution of test points into these five categories and their percentages of the total number of test points are shown in the following table.
Table 3–20. Mathematics Reporting Categories and Point Distributions
Grade
Reporting Categories Total Points
A: Numbers and Operations
B: Measurement C: Geometry D: Algebraic
Concepts
E: Data Analysis & Probability
4 43%–47%
16–18 points 12%–15% 5–6 points
12%–15% 5–6 points
12%–15% 5–6 points
12%–15% 5–6 points
38
5 41%–45%
16–17 points 12%–15% 5–6 points
12%–15% 5–6 points
13%–17% 5–6 points
12%–15% 5–6 points
38
6 28%–32%
11–12 points 12%–15% 5–6 points
15%–20% 6–8 points
15%–20% 6–8 points
15%–20% 6–8 points
38
7 20%–24% 8–9 points
12%–15% 5–6 points
15%–20% 6–8 points
20%–27% 8–10 points
15%–20% 6–8 points
38
8 18%–22% 7–8 points
12%–15% 5–6 points
15%–20% 6–8 points
25%–30% 10–11 points
15%–20% 6–8 points
38
11 12%–15% 5–6 points
12%–15% 5–6 points
12%–18% 5–7 points
38%–42% 14–16 points
12%–18% 5–7 points
38
The mathematics reporting categories are further subdivided for specificity and Eligible Content or limits. Each subdivision is coded by adding an additional numeral, such as A.1. These subdivisions are called “Assessment Anchors” and “Eligible Content.”

Chapter Three: Item Development Process
2012 PSSA-M Technical Report Page 35
Reporting Categories and Points Distributions for 2012 PSSA and PSSA-M Reading Assessments
The Reading assessment results are reported in two broad categories:
A. Comprehension and Reading Skills
B. Interpretation and Analysis of Fictional and Nonfictional Text
Assessment Anchors associated with Comprehension and Reading Skills are coded with an initial letter “A,” and those related to Interpretation and Analysis of Fictional and Nonfictional Text are coded with an initial letter “B.” The distribution of items into these two categories across genres and their percentages of the total number of test points are shown on the following table.
Table 3–21. Reading Reporting Categories and Genre and Point Distributions
Grade
Reporting Categories
A: Comprehension and Reading
Skills % Range
B: Interpretation and Analysis of Fictional and
Nonfictional Text % Range
Total Points
% of Passages (Genre) Fiction
% Passages (Genre)
Nonfiction
Grade 4 60%–80%
22–29 points 20%–40% 7–14 points
36 50%–70% 30%–50%
Grade 5 60%–80%
22–29 points 20%–40% 7–14 points
36 50%–70% 30%–50%
Grade 6 50%–70%
18–25 points 30%–50%
11–18 points 36 40%–60% 40%–60%
Grade 7 50%–70%
18–25 points 30%–50%
11–18 points 36 40%–60% 40%–60%
Grade 8 40%–60%
14–22 points 40%–60%
14–22 points 36 40%–60% 40%–60%
Grade 11 40%–60%
14–22 points 40%–60%
14–22 points 36 30%–50% 50%–70%
Like the mathematics reporting categories, reading reporting categories are further subdivided for specificity and Eligible Content or limits. Each subdivision is coded by adding an additional numeral, such as A.1. These subdivisions are called “Assessment Anchors” and “Eligible Content.”

Chapter Three: Item Development Process
2012 PSSA-M Technical Report Page 36
Reporting Categories and Points Distributions for 2012 PSSA and PSSA-M Science Assessments
The science assessment results are reported in four categories, coded as A through D:
A. The Nature of Science
B. Biological Science
C. Physical Science
D. Earth and Space Science
The distribution of test points into these five categories and their percentages of the total number of test points are shown in the following table.
Table 3–22. Science Reporting Categories and Point Distributions
Grade Reporting Categories
A: Nature of Science
B: Biological Sciences
C: Physical Sciences
D: Earth & Space Sciences
Total Points
Grade 8 ~50%
~17 points ~17%
~5–6 points ~17%
~5–6 points ~17%
~5–6 points 34
Grade 11 ~50%
~17 points ~17%
~5–6 points ~17%
~5–6 points ~17%
~5–6 points 34
The science reporting categories are further subdivided for specificity and Eligible Content or limits. Each subdivision is coded by adding an additional numeral, such as A.1. These subdivisions are called “Assessment Anchors,” “Descriptors (Sub-Assessment Anchors),” and “Eligible Content.”
Assessment Anchor Content Standards Subsumed within Reporting Categories for 2012 Modified Assessments
For mathematics, there are 16 Assessment Anchor Content Standards (Assessment Anchors) that occur at all grade levels (Grades 4–8 and 11), although they are not all assessed at each grade level. More specifically, the number targeted for assessment by grade level are 12 at Grade 4; 13 at Grade 5; 12 at Grade 6; 14 at Grade 7; 13 at Grade 8; and 13 at Grade 11.
For reading, there are five Assessment Anchors that vary to reflect grade-level appropriateness. Within the Comprehension and Reading Skills Reporting Category, two Assessment Anchors pertain to understanding fiction text and understanding nonfiction text. Within the Interpretation and Analysis of Fiction and Nonfiction Text Reporting Category, three Assessment Anchors pertain to Components of Text, Literary Devices and Concepts, and Organization of Nonfiction Text.
For science, there are 12 Assessment Anchors that exist at each grade. Within The Nature of Science Reporting Category, three Assessment Anchors pertain to Reasoning and Analysis; Processes, Procedures, and Tools of Scientific Investigations; and Systems, Models, and Patterns. Within the Biological Sciences Reporting Category, three Assessment Anchors pertain to Structure and Function of Organisms, Continuity of Life, and Ecological Behavior and Systems. Within the Physical Sciences Reporting Category, three Assessment Anchors pertain to

Chapter Three: Item Development Process
2012 PSSA-M Technical Report Page 37
Structure, Properties, and Interaction of Matter and Energy; Forms, Sources, Conversion, and Transfer of Energy; and Principles of Motion and Force. Within the Earth and Space Sciences Reporting Category, three Assessment Anchors pertain to Earth Features and Processes that Change Earth and Its Resources; Weather, Climate, and Atmospheric Processes; and Composition and Structure of the Universe.
Mathematics, reading, and science scores are based on the core (common) sections. Also reported are the student’s mathematics and reading performance levels. See Appendix C: 2012 Modified PSSA Tally Sheets for a summary by grade.
TEST DEVELOPMENT CONSIDERATIONS FOR THE PSSA-M
Alignment to the PSSA Assessment Anchors and Eligible Content, grade-level appropriateness (reading/interest level, etc.), depth of knowledge, cognitive level, item/task level of complexity, estimated difficulty level, relevancy of context, rationale for distractors, style, accuracy, and correct terminology were major considerations in the item development process. The Standards for Educational and Psychological Testing (AERA, APA, NCME, 1999) and the Principles of Universal Design (Thompson, Johnstone, & Thurlow, 2002) guided the development process. In addition, DRC’s Bias, Fairness, and Sensitivity Guidelines were used for developing items. All items were reviewed for fairness by bias, fairness, and sensitivity committees and for content by Pennsylvania educators and field-specialists. Items were also reviewed for adherence to the Principles of Universal Design by representatives from the National Center for Educational Outcomes (NCEO) as well as adherence to the guidelines outlined in the Pennsylvania publication Principles, Guidelines and Procedures for Developing Fair Assessment Systems: Pennsylvania Assessment Through Themes (PATT).
Bias, Fairness, and Sensitivity
At every stage of the item and test development process, DRC employs procedures that are designed to ensure that items and tests meet Standard 7.4 of the Standards for Educational and Psychological Testing (AERA, APA, NCME, 1999).
Standard 7.4: Test developers should strive to identify and eliminate language, symbols, words, phrases, and content that are generally regarded as offensive by members of racial, ethnic, gender, or other groups, except when judged to be necessary for adequate representation of the domain.
To meet Standard 7.4, DRC employs a series of internal quality steps. DRC provides specific training for test developers, item writers, and reviewers on how to write, review, revise, and edit items for issues of bias, fairness, and sensitivity (as well as for technical quality). Training also includes an awareness of and sensitivity to issues of cultural diversity. In addition to providing internal training in reviewing items in order to eliminate potential bias, DRC also provides external training to the review panels of minority experts, teachers, and other stakeholders.
DRC’s guidelines for bias, fairness, and sensitivity includes instruction concerning how to eliminate language, symbols, words, phrases, and content that might be considered offensive by members of racial, ethnic, gender, or other groups. Areas of bias that are specifically targeted include, but are not limited to: stereotyping, gender, regional/geographic, ethnic/cultural, socioeconomic/class, religious, experiential, and biases against a particular age group (ageism) and against persons with disabilities. DRC catalogues topics that should be avoided, and maintains balance in gender and ethnic emphasis within the pool of available items.

Chapter Three: Item Development Process
2012 PSSA-M Technical Report Page 38
Universal Design
As stated above, the Principles of Universal Design were incorporated throughout the item development process to allow participation of the widest possible range of students in the PSSA-M. The following checklist was used as a guideline:
Items measure what they are intended to measure.
Items respect the diversity of the assessment population.
Items have a clear format for text.
Stimuli and items have clear pictures and graphics.
Items have concise and readable text.
Items allow changes to other formats, such as Braille, without changing meaning or difficulty.
The arrangement of the items on the test has an overall appearance that is clean and well organized.
A more extensive description of the application of Principles of Universal Design is described in Chapter Four.
Depth of Knowledge
An important element in statewide assessment is the alignment between the overall assessment system and the state’s standards. A methodology developed by Norman Webb (1999) offers a comprehensive model that can be applied to a wide variety of contexts. With regard to the alignment between standards statements and the assessment instruments, Webb’s criteria include five categories, one of which deals with content. Within the content category is a useful set of levels for evaluating depth of knowledge (DOK). According to Webb (1999, p.7–8) “depth-of-knowledge consistency between standards and assessments indicates alignment if what is elicited from students on the assessment is as demanding cognitively as what students are expected to know and do as stated in the standards.” The four levels of cognitive complexity (depth of knowledge) are as follows:
Level 1: Recall
Level 2: Skill/Concept
Level 3: Strategic Thinking
Level 4: Extended Thinking
Depth-of-knowledge levels were incorporated in the item writing and review process, and items were coded with respect to the level they represented. Generally, multiple-choice items are written to DOK levels 1 and 2, and open-ended items are written to DOK level 3.
Test Item Readability
Careful attention was given to the readability of the items to make certain that the assessment focus of the item did not shift based on the difficulty of reading the item. Subject areas such as mathematics or science contain many content-specific vocabulary terms. As a result, readability formulas were not used. However, wherever it was practical and reasonable, every effort was made to keep the vocabulary one grade level below the tested grade level for non-reading tests.

Chapter Three: Item Development Process
2012 PSSA-M Technical Report Page 39
There was a conscious consideration made to ensure that each test question was evaluating a student’s ability to build toward mastery of the mathematics standards or the science standards versus the student’s reading ability. Resources used to verify the vocabulary level were the EDL Core Vocabularies and the Children’s Writer’s Word Book.
In addition, every test question is brought before several different committees comprised of grade-level experts in the field of mathematics education and science education. They review each question from the perspective of the students they teach, and they determine the validity of the vocabulary used and work to minimize the level of reading required.
Vocabulary was also addressed at the Bias, Fairness, and Sensitivity Review, although the focus was on how certain words or phrases may represent a possible source of bias or issues of fairness or sensitivity.
TEST DEVELOPMENT PROCESS
The item development process follows a logical timeline, which is outlined below in Figure 3–1. On the front-end of the schedule, tasks are generally completed with the goal of presenting field test candidate items to committees of Pennsylvania educators. On the back-end of the schedule, all tasks lead to the field test data review.
Figure 3–1. Item and Test Development Cycle and Timeline
Steps in Development Cycle Timeline to/from New Item Review
Development planning Fall -12 to -4 months
Initial item modifying Fall -3 to -2 months
Internal reviews and PDE reviews Fall/Winter -3 to -1 months
Bias, Fairness, and Sensitivity Review Winter +/- 0 months
Newly Modified Item Content Review Winter +/- 0 months
Post-review resolution and clean-up Winter +/- 0 months
Build test forms Spring +0 to +1 months
Internal form reviews and PDE reviews Spring +1 to +2 months
Form printing, packaging, and shipping Spring +2 to +3 months
Test administration Spring +4 months
Material/data processing, rangefinding, and scoring Spring/Summer +4 to +7 months
Field Test Item Data Review Summer +7 months
Select operational items Summer/Fall +8 to +10 months
A process flowchart that illustrates the interrelationship among the steps in the process is shown in Figure 3–2. In addition, a detailed process table describing the item and test development processes also appears in Appendix D: Item and Test Development Process.
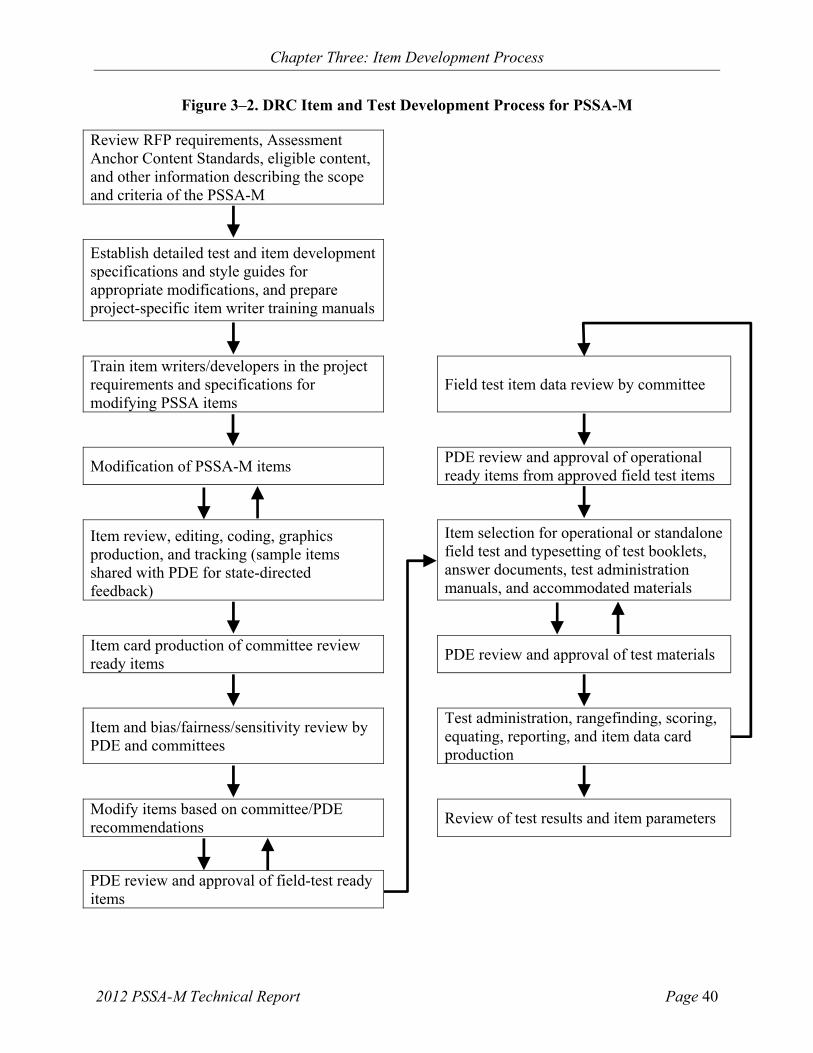
Chapter Three: Item Development Process
2012 PSSA-M Technical Report Page 40
Figure 3–2. DRC Item and Test Development Process for PSSA-M
Review RFP requirements, Assessment Anchor Content Standards, eligible content, and other information describing the scope and criteria of the PSSA-M
Establish detailed test and item development specifications and style guides for appropriate modifications, and prepare project-specific item writer training manuals
Train item writers/developers in the project requirements and specifications for modifying PSSA items
Field test item data review by committee
Modification of PSSA-M items
PDE review and approval of operational ready items from approved field test items
Item review, editing, coding, graphics production, and tracking (sample items shared with PDE for state-directed feedback)
Item selection for operational or standalone field test and typesetting of test booklets, answer documents, test administration manuals, and accommodated materials
Item card production of committee review ready items
PDE review and approval of test materials
Item and bias/fairness/sensitivity review by PDE and committees
Test administration, rangefinding, scoring, equating, reporting, and item data card production
Modify items based on committee/PDE recommendations
Review of test results and item parameters
PDE review and approval of field-test ready items

Chapter Four: Universal Design Procedures Applied in the Modified PSSA Test Development Process
2012 PSSA-M Technical Report Page 41
Chapter Four: Universal Design Procedures Applied in the Modified PSSA Test Development Process
Universally designed assessments allow participation of the widest possible range of students and contribute to valid inferences about participating students. Principles of Universal Design are based on the premise that each child in school is a part of the population to be tested and that testing results should not be affected by disability, gender, race, or English language ability (Thompson, Johnstone & Thurlow, 2002). At every stage of the item and test development process, including the 2010 field test, procedures were employed to ensure that items and subsequent tests were designed and developed using the elements of universally designed assessments developed by the National Center for Educational Outcomes (NCEO).
Federal legislation addresses the need for universally designed assessments. The No Child Left Behind Act (Elementary and Secondary Education Act) requires that each state must “provide for the participation in [statewide] assessments of all students” [Section 1111(b)(3)(C)(ix)(l)]. Both Title 1 and IDEA regulations call for universally designed assessments that are accessible and valid for all students, including students with disabilities and English Language Learners. The benefits of universally designed assessments not only apply to these groups of students, but to all individuals with wide-ranging characteristics.
DRC’s test development team was trained in the elements of Universal Design as it relates to developing large-scale statewide assessments. Team leaders were trained directly by NCEO, and other team members were subsequently trained by team leaders. Committees involved in content review included some members who were familiar with the unique needs of students with disabilities and English Language Learners. Likewise some members of the Bias, Fairness, and Sensitivity Committee were conversant with these issues. What follows are the Universal Design guidelines followed during all stages of the item development process for the PSSA-M.
ELEMENTS OF UNIVERSALLY DESIGNED ASSESSMENTS
After a review of research relevant to the assessment development process and the principles of Universal Design, NCEO has produced seven elements of Universal Design as they apply to assessments (Thompson, Johnstone & Thurlow, 2002). These elements served to guide PSSA-M item development.
Inclusive Assessment Population
The PSSA-M is intended for students with disabilities functioning above the lowest 1% of the population, but not at a level that allows them to access the general Pennsylvania System of School Assessment (PSSA). The PSSA-M utilizes modified items designed to allow students with disabilities to demonstrate proficiency on the assessment.
Precisely Defined Constructs
An important function of well-designed assessments is that they actually measure what they are intended to measure. The Pennsylvania Assessment Anchor Content Standards (Assessment Anchors) provided clear descriptions of the constructs to be measured by the PSSA-M at the assessed grade levels. Universally designed assessments must remove all non-construct-oriented cognitive, sensory, emotional, and physical barriers.

Chapter Four: Universal Design Procedures Applied in the Modified PSSA Test Development Process
2012 PSSA-M Technical Report Page 42
Accessible, Non-biased Items
DRC conducted both internal and external reviews of items and test specifications to ensure that they did not create barriers because of lack of sensitivity to disability, culture, or other subgroups. Items and test specifications were developed by a team of individuals who understand the varied characteristics of items that might create difficulties for any group of students. Accessibility is incorporated as a primary dimension of test specifications, so that accessibility was woven into the fabric of the test rather than being added after the fact.
Amenable to Accommodations
Even though items on universally designed assessments are accessible for most students, there are some students who continue to need accommodations. This essential element of universally designed assessment requires that the test is compatible with accommodations and a variety of widely-used adaptive equipment and assistive technology. (See the section on Assessment Accommodations later in Chapter Four.)
Simple, Clear, and Intuitive Instructions and Procedures
Assessment instructions should be easy to understand, regardless of a student’s experience, knowledge, language skills, or current concentration level. Knowledge questions that are posed within complex language can invalidate the test if students cannot understand how they are expected to respond to a question. To meet this guideline, directions and questions were prepared in simple, clear, and understandable language that underwent multiple reviews.
Maximum Readability and Comprehensibility
A variety of guidelines exist to ensure that text is maximally readable and comprehensible. These features go beyond what is measured by readability formulas. Readability and comprehensibility are affected by many characteristics, including student background, sentence difficulty, text organization, and others. All of these features were considered as item text was developed.
Plain language is a concept now being highlighted in research on assessments. Plain language has been defined as language that is straightforward and concise. The following strategies for editing text to produce plain language were used during the editing process of the newly modified PSSA-M items:
o Reduction of excessive length
o Use of common words
o Avoidance of ambiguous words
o Avoidance of irregularly spelled words
o Avoidance of proper names
o Avoidance of inconsistent naming and graphic conventions
o Avoidance of unclear signals about how to direct attention

Chapter Four: Universal Design Procedures Applied in the Modified PSSA Test Development Process
2012 PSSA-M Technical Report Page 43
Maximum Legibility
Legibility is the physical appearance of text, the way that the shapes of letters and numbers enable people to read text easily. Bias results when tests contain physical features that interfere with a student’s focus on or understanding of the constructs that test items are intended to assess. A style guide developed and updated annually (DRC, 2004–2010) was utilized, with PDE approval, which included dimensions of style consistent with universal design.
GUIDELINES FOR UNIVERSALLY DESIGNED ITEMS
All test items written and reviewed adhered closely to the following guidelines for Universal Design. Item writers and reviewers used a checklist during the item development process to ensure that each aspect was attended to. For more information on the checklist, see the Universal Design section in Chapter Three of this report.
1. Items measure what they are intended to measure. Item writing training included assuring that writers and reviewers had a clear understanding of Pennsylvania’s Academic Standards and the Assessment Anchors. During all phases of test development, items were presented with content-standard information to ensure that each item reflected the intended Assessment Anchor. Careful consideration of the content standards was important in determining which skills involved in responding to an item were extraneous and which were relevant to what was being tested. In certain types of items an additional skill is necessary, such as the mathematics test, which requires the student to read.
2. Items respect the diversity of the assessment population. To develop items that avoid content that might unfairly advantage or disadvantage any student subgroup, item writers, test developers, and reviewers were trained to write and review items for issues of bias, fairness, and sensitivity. Training also included an awareness of, and sensitivity to, issues of cultural and regional diversity.
3. Items have a clear format for text. Decisions about how items are presented to students must allow for maximum readability for all students. Appropriate fonts and point sizes were employed with minimal use of italics, which is far less legible and is read considerably more slowly than standard typeface. Captions, footnotes, keys, and legends were at least a 13-point size. Legibility was enhanced by sufficient spacing between letters, words, and lines. Blank space around paragraphs and between columns and staggered right margins were used.
4. Stimuli and items have clear pictures and graphics. When pictures and graphics were used, they were designed to provide essential information in a clear and uncluttered manner. Illustrations were placed directly next to the information to which they referred, and labels were used where possible. Sufficient contrast between background and text, with minimal use of shading, increased readability for students with visual difficulties. Color was not used to convey important information.

Chapter Four: Universal Design Procedures Applied in the Modified PSSA Test Development Process
2012 PSSA-M Technical Report Page 44
5. Items have concise and readable text. Linguistic demands of stimuli and items can interfere with a student’s ability to demonstrate knowledge of the construct being assessed. During item writing and review, the following guidelines were used.
o Simple, clear, commonly used words were used whenever possible.
o Extraneous text was omitted.
o Vocabulary and sentence complexity were appropriate for the grade level assessed.
o Technical terms and abbreviations were used only if related to the content being measured.
o Definitions and examples were clear and understandable.
o Idioms were avoided unless idiomatic speech was being assessed.
o The questions to be answered were clearly identifiable.
6. Items allow changes to format without changing meaning or difficulty. A Braille version of the PSSA-M was available at each assessed grade. Attention was given to using items that allow for Braille. Specific accommodations were permitted such as signing to a student, the use of oral presentation under specified conditions, and the use of various assistive technologies. Spanish versions for the PSSA-M mathematics and the PSSA-M science were available for use by English Language Learners who would benefit from this accommodation.
7. The test has an overall appearance that is clean and organized. Images, pictures, and text that may not be necessary (e.g., sidebars, overlays, callout boxes, visual crowding, shading) and that could be potentially distracting to students were avoided. Also avoided were purely decorative features that did not serve a purpose. Information was organized in a manner consistent with an academic English framework with a left-right, top-bottom flow.
ITEM DEVELOPMENT
DRC and WestEd work closely with the Pennsylvania Department of Education (PDE) to help ensure that PSSA-M tests comply with nationally recognized Principles of Universal Design. We support the implementation of accommodations on large-scale statewide assessments for students with disabilities. In addition to the Principles of Universal Design as described in the Pennsylvania Technical Report, DRC and WestEd apply to each content area assessment the standards for test accessibility as described in Test Access: Making Tests Accessible for Students with Visual Impairments: A Guide for Test Publishers, Test Developers, and State Assessment Personnel (Allman, 2004). To this end, we embrace the following precepts:
Test directions are carefully worded to allow for alternate responses to open-ended questions.
During item and bias reviews, test committee members are made aware of the Principles of Universal Design and of issues that may adversely affect students with disabilities with the goal of ensuring that PSSA-M tests are bias free for all students.

Chapter Four: Universal Design Procedures Applied in the Modified PSSA Test Development Process
2012 PSSA-M Technical Report Page 45
With the goal of ensuring that the PSSA-M tests are accessible to the widest range of diverse student populations, PDE instructs DRC and WestEd to limit item types that are difficult to format in Braille, and that may become distorted when published in large print. DRC and WestEd are instructed to limit the following on the PSSA-M:
o Mathematics: complicated tessellations, a chart or graph that extends beyond one page.
o Reading: graphics and illustrations that are not germane to the content presented.
o All content areas: unnecessary boxes and framing of text, unless enclosing the text provides necessary context for the student; use of italics (limited to only when it is absolutely necessary, such as with variables).
ITEM FORMATTING
For all content areas, DRC formats PSSA-M tests to maximize accessibility for all students by using text that is in a 13-point size and a font style that is easily readable. DRC limits shading, spacing, graphics, charts, and the number of items per page so that there is sufficient white space on each page. Whenever possible, we ensure that graphics, pictures, diagrams, charts, and tables are positioned on the page with the associated test items. We use high contrast for text and background where possible to convey pertinent information. Tests are published on dull-finish paper to avoid the glare encountered on glossy paper. DRC pays close attention to the binding of the PSSA-M test booklets to ensure that they lie flat for two-page viewing and ease of reading and handling.
DRC ensures consistency across PSSA and PSSA-M assessments by following these Principles of Universal Design:
High contrast and clarity is used to convey detailed information.
Typically, shading is avoided; when necessary for content purposes, 10 percent screens are used as the standard.
Overlaid print on diagrams, charts, and graphs is avoided.
Charts, graphs, diagrams, and tables are clearly labeled with titles and with short descriptions where applicable.
Only relevant information is included in diagrams, pictures, and graphics.
Symbols used in keys and legends are meaningful and provide reasonable representations of the topic they depict.
Pictures that require physical measurement are true to size.

Chapter Four: Universal Design Procedures Applied in the Modified PSSA Test Development Process
2012 PSSA-M Technical Report Page 46
ASSESSMENT ACCOMMODATIONS
While universally designed assessments provide for participation of the widest range of students, many students require accommodations in order to participate in the regular assessment. Clearly, the intent of providing accommodations for students is to ensure that students are not unfairly disadvantaged during testing and that the accommodations used during instruction, if appropriate, are made available as students take the test. The literature related to assessment accommodations is still evolving and often focuses on state policies regulating accommodations rather than on providing empirical data that supports the reliability and validity of the use of accommodations. On a yearly basis, the PDE examines accommodations policies and current research to ensure that valid, acceptable accommodations are available for students. An accommodations manual for the PSSA and PSSA-M entitled PSSA & PSSA-M Accommodations Guidelines for Students with IEPs and Students with 504 Plans (PDE, January 2011) was developed for use with the 2011 PSSA and PSSA-M.
The manual can be accessed by going to www.education.state.pa.us. On the left, click on “Programs,” then “Programs O–R,” then select “Pennsylvania System of School Assessment (PSSA)” and then “Testing Accommodations & Security.”
In addition, Spanish-language versions, translated from the original English versions, were made available for PSSA-M mathematics and PSSA-M science. The Spanish-translation versions are discussed in Chapter Six.

Chapter Five: Field Test Leading to the 2012 Core
2012 PSSA-M Technical Report Page 47
Chapter Five: Field Test Leading to the 2012 Core
STANDALONE FIELD-TEST ITEMS
All core items appearing on the 2012 reading and science assessments came from the Spring 2010 standalone field test. The purpose of administering field-test items is to obtain statistics for them so they can be reviewed before becoming operational. Based on the statistical review, many of the field-test items tested in the 2010 PSSA-M standalone field test were selected for use as common core items in the 2012 PSSA-M.
Table 5–1. 2010 Spring PSSA-M Reading Field Test
Grade
No. of Passages per FT Form
No. of FT MC
per FT Form
No. of FT OE per FT Form
Total No. of Forms
Total No. of
Passages
Total No. of
FT MC Items per Passage
Total No. of FT OE Items per
Passage
Total No. of
FT MC Items
Total No. of FT OE Items
4 5 30 3 6 15 12 1 180 15
5 5 30 3 6 15 12 1 180 15
6 5 30 3 6 15 12 1 180 15
7 5 30 3 6 15 12 1 180 15
8 5 30 3 6 15 12 1 180 15
11 5 30 3 6 15 12 1 180 15
Table 5–2. 2010 Spring PSSA-M Science Field Test
Grades No. of
FT MC per Form
No. of FT OE per Op. Form
Total No. of Forms
Total No. of FT MC
Total No. of FT OE
Total No. of Field Test
Items 8 24 3 5 120 15 135
11 24 3 5 120 15 135
Core items appearing on the 2012 mathematics assessment came from the Spring 2010 mathematics embedded field test and also from the 2009 standalone field test. More information on the 2010 field test designs can be found in specific portions of Chapter Three. Additional information about the 2009 standalone mathematics field test can be found in the Technical Report for the 2010 Modified Pennsylvania System of School Assessment.

Chapter Five: Field Test Leading to the 2012 Core
2012 PSSA-M Technical Report Page 48
STATISTICAL ANALYSIS OF ITEM DATA
All field-tested items were analyzed statistically following conventional item analysis methods. For MC items, traditional or classical item statistics included the corrected point-biserial correlation (Pt. Bis.) for the correct and incorrect responses (distractors), percent correct (p-value), and the percent responding to incorrect responses. For OE items the statistical indices included the item-test correlation, the point-biserial correlation for each score level, percent in each score category or level, and the percent of non-scoreable responses.
In general, more capable students are expected to respond correctly to easy items and less capable students are expected to respond incorrectly to difficult items. If either of these situations does not occur, the item will be reviewed by DRC test development staff and committees of Pennsylvania educators to determine the nature of the problem and the characteristics of the students affected. The primary way of detecting such conditions is through the point-biserial correlation coefficient for dichotomous (MC) items and the item-total correlation for polytomous (OE) items. In each case the statistic will be positive if the total test mean score is higher for the students who respond correctly to MC items (or attain a higher OE item score) and negative when the reverse is true.
Item statistics are used as a means of detecting items that deserve closer scrutiny, rather than being a mechanism for automatic retention or rejection. Toward this end, a set of criteria was used as a screening tool to identify items that needed a closer review by committees of Pennsylvania educators. For a MC item to be flagged, the criteria included any of the following:
Point-biserial correlation for the correct response of less than 0.25
Point-biserial correlation for any incorrect response greater than 0.0
Percent correct less than 0.3 or greater than 0.9
Percent responding to any incorrect responses greater than the percent correct
Gender DIF code of either C- or C+
Any ethnic DIF code of C-
For an OE item to be flagged, the criteria included any of the following:
Gender DIF code of B-, B+, C- or C+
Any ethnic DIF code of B- or C-
Item analysis results for MC and OE field-test items are presented in Appendix I.
REVIEW OF ITEMS WITH DATA
In the preceding section on Statistical Analysis of Item Data, it was stated that test development content-area specialists used certain statistics from item and DIF analyses of the 2010 field test to identify items for further review. Specific flagging criteria for this purpose were specified in the previous section. Due to the PSSA-M program for reading and science being in its initial stages, however, it was determined that all PSSA-M reading and science items necessary for the building of two equivalent core forms, both multiple-choice and open-ended, be brought to the data review for approval. Additionally, all mathematics items, both multiple-choice and open-ended, used in the 2010 embedded mathematics field test were brought to the data review, regardless of statistical performance.
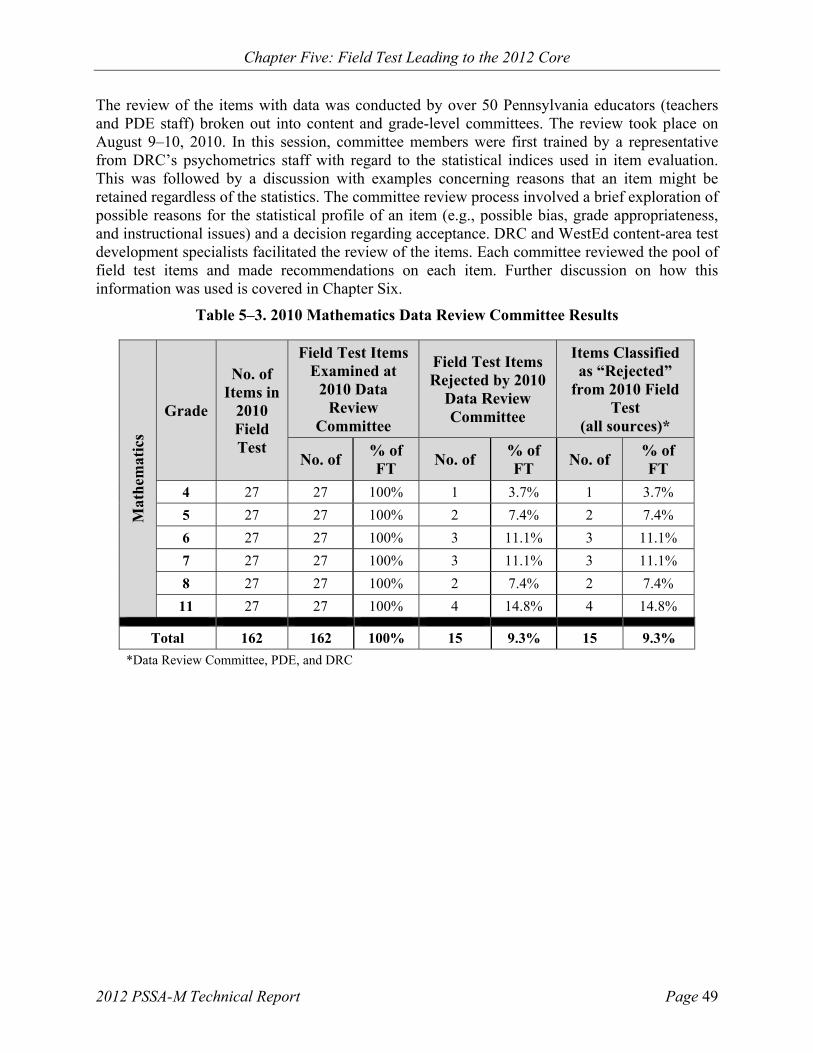
Chapter Five: Field Test Leading to the 2012 Core
2012 PSSA-M Technical Report Page 49
The review of the items with data was conducted by over 50 Pennsylvania educators (teachers and PDE staff) broken out into content and grade-level committees. The review took place on August 9–10, 2010. In this session, committee members were first trained by a representative from DRC’s psychometrics staff with regard to the statistical indices used in item evaluation. This was followed by a discussion with examples concerning reasons that an item might be retained regardless of the statistics. The committee review process involved a brief exploration of possible reasons for the statistical profile of an item (e.g., possible bias, grade appropriateness, and instructional issues) and a decision regarding acceptance. DRC and WestEd content-area test development specialists facilitated the review of the items. Each committee reviewed the pool of field test items and made recommendations on each item. Further discussion on how this information was used is covered in Chapter Six.
Table 5–3. 2010 Mathematics Data Review Committee Results
Mat
hem
atic
s
Grade
No. of Items in
2010 Field Test
Field Test Items Examined at
2010 Data Review
Committee
Field Test Items Rejected by 2010
Data Review Committee
Items Classified as “Rejected”
from 2010 Field Test
(all sources)*
No. of % of FT
No. of % of FT
No. of % of FT
4 27 27 100% 1 3.7% 1 3.7%
5 27 27 100% 2 7.4% 2 7.4%
6 27 27 100% 3 11.1% 3 11.1%
7 27 27 100% 3 11.1% 3 11.1%
8 27 27 100% 2 7.4% 2 7.4%
11 27 27 100% 4 14.8% 4 14.8%
Total 162 162 100% 15 9.3% 15 9.3%
*Data Review Committee, PDE, and DRC

Chapter Five: Field Test Leading to the 2012 Core
2012 PSSA-M Technical Report Page 50
Table 5–4. 2010 Reading Data Review Committee Results
Rea
din
g
Grade
No. of Items in
2010 Field Test
Field Test Items Examined at
2010 Data Review
Committee
Field Test Items Rejected by 2010
Data Review Committee
Items Classified as “Rejected”
from 2010 Field Test
(all sources)*
No. of % of FT
No. of % of FT
No. of % of FT
4 195 51 26.2% 0 0.0% 0 0.0%
5 195 55 28.2% 0 0.0% 0 0.0%
6 195 54 27.7% 1 0.5% 1 0.5%
7 195 52 26.7% 0 0.0% 0 0.0%
8 195 59 30.3% 0 0.0% 0 0.0%
11 195 52 26.7% 0 0.0% 0 0.0%
Total 1,170 323 27.6% 1 0.001% 1 0.001%
*Data Review Committee, PDE, and DRC
Table 5–5. 2010 Science Data Review Committee Results
Sci
ence
Grade
No. of Items in
2010 Field Test
Field Test Items Examined at
2010 Data Review
Committee
Field Test Items Rejected by 2010
Data Review Committee
Items Classified as “Rejected”
from 2010 Field Test
(all sources)*
No. of % of FT
No. of % of FT
No. of % of FT
8 135 51 37.8% 0 0.0% 0 0.0%
11 135 53 39.3% 0 0.0% 0 0.0%
Total 270 104 38.5% 0 0.0% 0 0.0%
*Data Review Committee, PDE, and DRC
Chapter Six: Operational Forms Construction for 2012
2012 PSSA-M Technical Report Page 51
Chapter Six: Operational Forms Construction for 2012
FINAL SELECTION OF ITEMS AND 2012 PSSA-M FORMS CONSTRUCTION
When the final selection of items for the operational 2012 test was ready to begin, the candidate items that emerged from the spring 2010 field test had undergone multiple reviews, including:
Reviews by DRC and WestEd content-area test development specialists and curriculum specialists
Formal bias, fairness, and sensitivity review by the Bias, Fairness, and Sensitivity Committee consisting of an expert, multi-ethnic group of men and women with members also having expertise with special needs students and English Language Learners
Formal review by the content committees consisting of Pennsylvania educators, including teachers as well as district personnel
PDE review
Item data review by members of the PDE subject-area teacher committees
The end product of the above process was an “item status” designation for each field tested item. All items having an item status code of “Acceptable/Active” were candidates to be selected for the 2012 PSSA-M. To have an item status code of “Acceptable/Active” meant that the item met the following criteria:
Appropriately aligned with its designated Assessment Anchor Content Standard (Assessment Anchor) and sub-classifications
Acceptable in terms of bias/fairness/sensitivity issues, including differential item functioning (for gender and ethnicity)
Free of psychometric flaws, including a special review of flagged items
Next, all relevant information regarding the acceptable items, including associated graphics, was entered into the item banking system known as IDEAS (Item Development and Education Assessment System). From IDEAS and other database sources, Excel files were created for each content area at each grade. These files contained all relevant content codes and statistical characteristics. IDEAS also created a card displaying each acceptable item, any associated graphic, and all relevant content codes and item statistics for use by the content-area test development specialists and psychometric services staff.
DRC test development specialists reviewed the test design blueprint, including the number of items per strand for each content-area test.
Psychometricians provided content-area test development specialists with an overview of the psychometric guidelines for forms construction, including guidelines for selecting linking items to link to previous test forms.
Senior DRC content-area test development specialists reviewed all items in the operational pool to make an initial selection for common (core) positions according to test blueprint requirements and psychometric guidelines. Changes to items were not encouraged since alterations could affect how an item performs on subsequent testing.

Chapter Six: Operational Forms Construction for 2012
2012 PSSA-M Technical Report Page 52
For the common items, this meant that the combination of MC and OE items would yield the appropriate range of points while tapping an appropriate variety of the Assessment Anchors and related Eligible Content within each Reporting Category. Items selected in the first round were examined with regard to how well they functioned as a set. Of particular concern were the following:
One item providing cues as to the correct answer to another item
Context redundancy (e.g., mathematics items with a sports context)
Presence of “clang” (distractors not unique from one another)
Diversity of names and artwork for gender and ethnicity
The first round of items was then evaluated for statistical features such as an acceptable point bi-serial correlation and whether correct answers were distributed equally—that is, whether approximately 25 percent of correct answers appeared in each of the four possible positions (A, B, C, or D). Selected items that were deemed psychometrically less advantageous in contrast to the overall psychometric characteristics of the core resulted in a search by the senior reviewer for suitable replacements. At this point, the second round of items was analyzed. If necessary, this iterative process between content-based selections and statistical properties continued in an effort to reach the best possible balance.
Once the recommendations were finalized for the common/core items, they were submitted to PDE for review. Department staff provided feedback, which could be in the form of approval or recommendations for replacing certain items. Any item replacement was accomplished by the collective effort of the test development specialists, psychometricians, and PDE staff until final PDE approval.
LINKING THE 2011 OPERATIONAL TEST TO THE 2012 OPERATIONAL TEST
The 2011 Operational PSSA-M Mathematics, Reading, and Science tests were linked with the 2012 Operational PSSA-M Mathematics test using core-to-core linking items (items that are repeated from operational form to the next).
In the selection of the core-to-core linking items (part of the overall core pull), content considerations remained relevant, together with statistical features, such as an acceptable point-biserial correlation and whether the items, as a collection, had an average logit value and a test characteristic curve approximating that of the previous administration.
SPECIAL FORMS USED IN THE 2012 PSSA-M
Braille and Large Print
Students with visual impairments were able to respond to test materials that were available in either Braille or large print. At each grade level assessed, one form was selected for the creation of a Braille and a large-print edition. School district personnel ordered Braille or large-print assessment materials directly from the Pennsylvania Training and Technical Assistance Network (PaTTAN) in Harrisburg. They could also contact PaTTAN for technical assistance regarding students with visual impairments.

Chapter Six: Operational Forms Construction for 2012
2012 PSSA-M Technical Report Page 53
School personnel were directed to transcribe all student answers (MC and OE) into scannable answer documents exactly as the student responded. No alterations or corrections of student work were permitted, and the answer document had to have the same form designation as the form used for Braille or large print.
Spanish Translation of the Mathematics and Science Assessments
School personnel had the option of having Spanish-speaking students who had been enrolled in schools in the United States for less than three years respond to a Spanish version of the PSSA-M for mathematics and/or science only. The original translation of the items and the Directions for Administration Manuals was initiated by Second Language Testing, Incorporated and completed by DRC. After discussions with PDE and Second Language Testing, Incorporated, the mathematics booklets for Grades 4–8 and 11 and the science booklets for Grades 8 and 11 were designed with a modified “over/under” format, with the Spanish presented directly above or to the left of the English. To assist the presentation of the two languages on the same page, the English portion was presented in italics and in a smaller font. Those students using this accommodated version of the mathematics and/or science assessments could write their answers in English, Spanish, or a combination of both English and Spanish, with the highest possible score from those combinations recorded for the student.
Spanish-translated versions of the PSSA-M mathematics assessment were used by a total of 23 students at Grades 4, 6, 7, 8, and 11 in 2012. Spanish-translated versions of the 2012 PSSA-M science assessment were used by a total of 11 students at Grades 8 and 11.
Instructions for the appropriate use of these special forms are detailed in the PSSA & PSSA-M Accommodations Guidelines for Students with IEPs and Students with 504 Plans (PDE, January 2010).

Chapter Six: Operational Forms Construction for 2012
2012 PSSA-M Technical Report Page 54

Chapter Seven: Test Administration Procedures
2012 PSSA-M Technical Report Page 55
Chapter Seven: Test Administration Procedures
TEST SESSIONS, TEST SECTIONS, AND TEST TIMING
The PSSA-M Mathematics test utilizes a single consumable booklet. When a single scannable answer booklet is used, the contents of the answer booklet and the test booklet are combined into one integrated booklet. This organization allows the students who are taking the modified tests to maintain the flow and directions of the test without having to manage two separate booklets.
The PSSA-M tests consist of two untimed sections. Testing-time recommendations are given, but the estimated times are meant to provide general guidelines for scheduling purposes rather than absolute testing times.
Table 7–1. PSSA-M Mathematics Test Section Information
Grade No. of
Sections per Test
No. of MC items Section 1
No. of OE items Section 1
No. of MC items Section 2
No. of OE items Section 2
Primary Testing Window
Make-up Testing Window
4 2 15 1 15 1 March 12–23 March 26–30
5 2 15 1 15 1 March 12–23 March 26–30
6 2 15 1 15 1 March 12–23 March 26–30
7 2 15 1 15 1 March 12–23 March 26–30
8 2 15 1 15 1 March 12–23 March 26–30
11 2 15 1 15 1 March 12–23 March 26–30
Table 7–2. PSSA-M Mathematics Duration and Testing Load by Grade
Assessment Grade Total No. of MC Items per Form
per Admin
Total No. of OE Items per Form
per Admin
Total Estimated Administration Time per
Form (in Minutes)
Mathematics
4 30 2 130 to 160
5 30 2 130 to 160
6 30 2 130 to 160
7 30 2 130 to 160
8 30 2 130 to 160
11 30 2 130 to 160

Chapter Seven: Test Administration Procedures
2012 PSSA-M Technical Report Page 56
Table 7–3. PSSA-M Reading Test Section Information
Grade No. of
Sections per Test
No. of MC items Section 1
No. of OE items Section 1
No. of MC items Section 2
No. of OE items Section 2
Primary Testing Window
Make-up Testing Window
4 2 18 1 12 1 March 12–23 March 26–30
5 2 18 1 12 1 March 12–23 March 26–30
6 2 19 1 11 1 March 12–23 March 26–30
7 2 18 1 12 1 March 12–23 March 26–30
8 2 19 1 11 1 March 12–23 March 26–30
11 2 18 1 12 1 March 12–23 March 26–30
Table 7–4. PSSA-M Reading Duration and Testing Load by Grade
Assessment Grade Total No. of MC Items per Form
per Admin
Total No. of OE Items per Form
per Admin
Total Estimated Administration Time per
Form (in Minutes)
Reading
4 30 2 130 to 160
5 30 2 130 to 160
6 30 2 130 to 160
7 30 2 130 to 160
8 30 2 130 to 160
11 30 2 130 to 160
Table 7–5. PSSA-M Science Test Section Information
Grade No. of
Sections per Test
No. of MC items Section 1
No. of OE items Section 1
No. of MC items Section 2
No. of OE items Section 2
Primary Testing Window
Make-up Testing Window
8 2 15 1 15 1 April 23–27 April 30–May 4
11 2 15 1 15 1 April 23–27 April 30–May 4
Table 7–6. PSSA-M Science Duration and Testing Load by Grade
Assessment Grade Total No. of MC Items per Form
per Admin
Total No. of OE Items per Form
per Admin
Total Estimated Administration Time per
Form (in Minutes)
Science 8 30 2 90 to 120
11 30 2 90 to 120

Chapter Seven: Test Administration Procedures
2012 PSSA-M Technical Report Page 57
Test administrators are instructed that each section in a form should be scheduled as one assessment session. In addition, they are also told to not combine multiple sections into a single session. Test administrators are also instructed to administer the sections in the sequence in which they were printed in the booklets. In all cases, individual assessment sections must be completed within one school day.
Test administrators are advised to use a testing location that is separate from the administration of the general PSSA assessment. For 2012, students who participated in the PSSA-M mathematics assessment may have participated in the general PSSA reading assessment. These students were allowed to complete both sections of the PSSA-M mathematics before completing the three general PSSA reading sections. Alternating the PSSA-M math sections with the PSSA reading sections was also an option for the test administrators, as long as the subject sections were administered in sequence of the booklet. Likewise, students who participated in the PSSA-M reading assessment may have participated in the general PSSA mathematics assessment. Test administrators would have the option of completing both sections of the PSSA-M reading before completing the three general PSSA mathematics sections or alternating the PSSA-M reading sections with the PSSA mathematics sections, as long as the subject sections were administered in sequence of the booklet.
Since not all students will finish the assessment sections at the same time, test administrators are advised to use the flexibility of the time limits to the students’ advantage. For example, test administrators manage the testing time so that students do not feel rushed while they are taking any assessment section, and no student is penalized because he or she works slowly. It is equally stressed to test administrators that a student should not be given an opportunity to waste time. Students are told to close their booklets when they have finished the section of the assessment in which they had been working. Students who finish early are allowed to sit quietly or read for pleasure until all students have finished. Students with special requirements and/or abilities (i.e., physical, visual, auditory, or learning disabilities as defined by their IEP or service contracts) and students who just work slowly may require extended time. Special assessment situations are arranged for these students. When all students in a testing session have indicated that they have finished an assessment section, test administrators end the section.
Scheduled extended time can be provided by a test administrator, and students may request extended time if they indicate that they have not completed the task. Such requests are granted if the test administrator finds the request to be educationally valid. Test administrators are advised that not permitting ample time for students to complete the assessment may impact the students’ and schools’ performance.
As a general guideline, however, when all students indicate that they have finished a section, that section is closed. Students requiring time beyond the majority of the student population are allowed to continue immediately following the regularly scheduled session in another setting. When such accommodations are made, school personnel ensure that students are monitored at all times to prevent sharing of information. Students are not permitted to continue a section of the assessment after a significant lapse of time from the original session.
For PSSA-M Mathematics at grades 7, 8, and 11, test administrators are asked to print out and distribute a copy of the individual grade’s formula sheets. The formula sheets are posted at www.education.state.pa.us. [First click on “Programs” in the left navigation bar, select “Programs O–R,” select “Pennsylvania System of School Assessment (PSSA),” and finally click on “Resource Materials.” The formula sheets are listed under “Mathematics Resources.”]

Chapter Seven: Test Administration Procedures
2012 PSSA-M Technical Report Page 58
Additional information concerning testing time and test layouts can be found in Chapter Three.
TESTING WINDOW
The testing windows for the 2012 PSSA-M operational assessments were as follows:
Mathematics and Reading:
Primary testing window – March 12 through 23, 2012
Make-up testing window – March 26 through 30, 2012
Science:
Primary testing window – April 23 through 27, 2012
Make-up testing window – April 30 through May 4, 2012
Additional information concerning testing time and test layouts can be found in Chapter Three.
SHIPPING, PACKAGING, AND DELIVERY OF MATERIALS
DRC sent two shipments for the 2012 PSSA-M operational assessment:
Shipment one contained the Handbook for Assessment Coordinators and the Directions for Administration Manuals for each grade tested at a school participating in the mathematics, reading, and science assessments. Shipment one was delivered by February 13, 2012.
Shipment two contained the administrative materials (e.g., Return Shipping labels, District/School labels, Do Not Score labels, and Student Precode labels) and secure materials (e.g., consumable test/answer booklets) for each grade tested at a school participating in the mathematics, reading, and science assessments. Shipment two was delivered by February 27, 2012.
DRC ensured that all assessment materials were assembled correctly prior to shipping. DRC operations staff used the automated Operations Materials Management System (Ops MMS) to assign secure materials to a school at the time of ship out. This system used barcode technology to provide an automated quality check between items requested for a site and items shipped to a site. A shipment box manifest was produced for and placed in each box shipped. DRC operations staff double-checked all box contents with the box manifest prior to the box being sealed for shipment to ensure accurate delivery of materials. DRC operations staff performed lot acceptance sampling on both shipments. Districts and schools were selected at random and examined for correct and complete packaging and labeling. This sampling represented a minimum of 10 percent of all shipping sites.
DRC’s materials management system, along with the systems of shippers, allowed DRC to track materials from DRC’s warehouse facility to receipt at the district, school, or testing site. All DRC shipping facilities, materials processing facilities, and storage facilities are secure. Access is restricted by security code. Non-DRC personnel are escorted by a DRC employee at all times. Only DRC inventory control personnel have access to stored secure materials. DRC employees are trained in and made aware of the high level of security that is required.
DRC packed 108,306 modified assessment booklets and 32,061 modified Directions for Administration Manuals for 3,994 testing sites. DRC used United Parcel Service (UPS) and Advanced Shipping Technologies (AST) to deliver the secure materials to the testing sites.

Chapter Seven: Test Administration Procedures
2012 PSSA-M Technical Report Page 59
MATERIALS RETURNED
DRC used UPS for all returns. The materials return windows for the PSSA-M were as follows:
Primary return window—March 14 through March 23, 2012
Make-up return window—March 26 through March 30, 2012
TEST SECURITY MEASURES
Test security is essential to obtaining reliable and valid scores for accountability purposes. Test Security Certifications were required to be signed by each building Principal, School Assessment Coordinator, District Assessment Coordinator, Test Administrator, and Proctor prior to the assessment being administered. All signed Certifications were returned to the Chief School Administrator who must retain the Certifications for three years. The purpose of the Certifications was to serve as a tool to document that the individuals responsible for administering the assessments both understood and acknowledged the importance of test security and accountability. The Certifications attested that all security measures were followed concerning the handling of secure materials.
SAMPLE MANUALS
Copies of the Handbook for Assessment Coordinators and the Directions for Administration Manuals can be found on the PDE website at www.education.state.pa.us. On the left, select “Programs,” “Programs O–R,” “Pennsylvania System of School Assessment (PSSA),” and then “Test Administration.”
TESTING WINDOW ASSESSMENT ACCOMMODATIONS
Three accommodations manuals, PSSA, PSSA-M, and Keystone (paper pencil) Accommodations Guidelines for Students with IEPs and Students with 504 Plans, Accommodations for English Language Learners, and Accommodations Guidelines for All Students, were developed for use with the 2012 PSSA-M. Additional information regarding assessment accommodations can be found in Chapter Four of this report. These manuals can be found at www.education.state.pa.us. On the left, select “Programs,” “Programs O–R,” “Pennsylvania System of School Assessment (PSSA),” and then “Testing Accommodations & Security.”

Chapter Seven: Test Administration Procedures
2012 PSSA-M Technical Report Page 60

Chapter Eight: Processing and Scoring
2012 PSSA-M Technical Report Page 61
Chapter Eight: Processing and Scoring
RECEIPT OF MATERIALS
Receipt of PSSA-M test materials began on March 19, 2012, and concluded with all make-up tests on May 4, 2012. DRC’s Operations Materials Management System (Ops MMS) was utilized to receive assessment materials securely, accurately, and efficiently. This system features innovative automation and advanced barcode scanners. Captured data were organized into reports, which provided timely information with respect to suspected missing material.
The first step in the Ops MMS was the Box Receipt System. When a shipment arrived at DRC, the boxes were removed from the carrier’s truck and passed under a barcode reader, which read the barcode printed on the return label and identified the district and school. If the label could not be read automatically, a floor operator entered the information into the system manually. The data collected in this process were stored in the Ops MMS database. After the barcode data were captured, the boxes were placed on a pallet and assigned a corresponding pallet number.
Once the box receipt process was completed, the materials separation phase began. Warehouse personnel opened the boxes and sorted materials by grade and status (used or unused answer booklet) into new boxes. Once filled, a sorted box’s documents were loaded into an automated counter, which recorded a booklet count for each box. An on-demand DRC box label was produced that contained a description of each box’s contents and quantity in both barcode and human-readable formats. This count remained correlated to the box as an essential quality-control step throughout secure booklet processing and provided a target number for all steps of the check-in process.
Once labeled, the sorted and counted boxes proceeded to booklet check-in. This system used streamfeeder automation to carry documents past oscillating scanners that captured data from up to two representative barcodes and stored it in the Ops MMS database.
The secure booklet check-in operator used a hand scanner to scan the counted box label. This procedure identified the material type and quantity parameters for what the Ops MMS should expect within a box. The box’s contents were then loaded into the streamfeeder.
The documents were fed past oscillating scanners that captured both the security code and precode from the booklets. A human operator monitored an Ops MMS screen, which displayed scan errors, an ordered accounting of what was successfully scanned, and the document count for each box.
When all materials were scanned and the correct document count was reached, the box was sealed and placed on a pallet. If the correct document count was not reached, or if the operator encountered difficulties with material scanning, the box and its contents were delivered to an exception handling station for resolution.
This check-in process occurred immediately upon receipt of materials; therefore, DRC provided feedback to districts and schools regarding any missing materials based on actual receipt versus expected receipt. Sites that had 100 percent of their materials missing after the date they were due to DRC were contacted, and any issues were resolved.

Chapter Eight: Processing and Scoring
2012 PSSA-M Technical Report Page 62
Throughout the process of secure booklet check-in, DRC project management ran a daily missing materials report. Every site that was missing any number of booklets was contacted by DRC. Results of these correspondences were recorded for inclusion in a final Missing Materials Report if the missing booklets were not returned by the testing site. DRC produced the Missing Materials Report for PDE upon completion of secure booklet check-in. The report listed all schools in each participating district along with security barcodes for any booklets not returned to DRC.
After scannable materials (used booklets) were processed through booklet check-in, the materials became available to the DRC Document Processing Center Log-in staff for document log-in. The booklets were logged-in using the following process:
A DRC scannable barcode batch header was scanned, and a batch number was assigned to each box of booklets.
The DRC box label barcode was scanned into the system to link the box and booklets to the newly created batch and to create a Batch Control Sheet.
The DRC box label barcode number, along with the number of booklets in the box, was printed on the Batch Control Sheet for document tracking purposes. All documents that were linked to the box barcode were assigned to the batch number and tracked through all processing steps. As documents were processed, DRC staff dated and initialed the Batch Control Sheet to indicate that proper processing and controls were observed.
Before the booklets were scanned, all batches went through a quality inspection to ensure batch integrity and correct document placement.
After a quality check in the DRC Document Processing Center log-in area, the spines were cut off the scannable documents, and the pages were sent to DRC’s Imaging and Scoring System.
SCANNING OF MATERIALS
Customized scanning programs for all scannable documents were prepared to read the booklets and to format the scanned information electronically. Before materials arrived, all image scanning programs went through a quality review process that included scanning of mock data from production booklets to ensure proper data collection.
DRC’s image scanners were calibrated using a standard deck of scannable pages with 16 known levels of gray. On a predefined page location, the average pixel darkness was compared to the standard calibration to determine the level of gray. Marks with an average darkness level of 4 or above on a scale of 16 (0 through F) were determined to be valid responses, per industry standards. If multiple marks were read for a single item and the difference of the grayscale reads was greater than four levels, the lighter mark was discarded. If the multiple marks had fewer than four levels of grayscale difference, the response was flagged systematically and forwarded to an editor for resolution.
DRC’s image scanners read selected-response, demographic, and identification information. The image scanners also used barcode readers to read pre-printed barcodes from a label on the booklets.

Chapter Eight: Processing and Scoring
2012 PSSA-M Technical Report Page 63
The scannable documents were automatically fed into the image scanners where predefined processing criteria determined which fields were to be captured electronically. Open-ended item images were separated out for image-based scoring.
During scanning, a unique serial number was printed on each sheet of paper. This serial number was used for document integrity and to maintain sequencing within a batch of answer documents.
A monitor randomly displayed images, and the human operator adjusted or cleaned the scanner when the scanned image did not meet DRC’s strict quality standards for image clarity.
All images passed through a software clean-up program that despeckled, deskewed, and desmeared the images. A random sample of images was reviewed for image quality approval. If any document failed to meet image quality standards, the document was returned for rescanning.
Page scan verification was performed to ensure that all predefined portions of the booklets were represented in their entirety in the image files. If a page was missing, the entire booklet was flagged for resolution.
After each batch was scanned, booklets were processed through a computer-based editing program to detect potential errors as a result of smudges, multiple marks, and omits in predetermined fields. Marks that did not meet the predefined editing standards were routed to editors for resolution.
Experienced DRC Document Processing Center editing staff reviewed all potential errors detected during scanning and made necessary corrections to the data files. The imaging system displayed each suspected error. The editing staff then inspected the image and made any needed corrections using the unique serial number printed on the document during scanning.
Upon completion of editing, quality control reports were run to ensure that all detected potential errors were reviewed again and a final disposition was determined.
Before batches of booklets were extracted for scoring, a final edit was performed to ensure that all requirements for final processing were met. If a batch contained errors, it was flagged for further review before being extracted for scoring and reporting.
During this processing step, the actual number of documents scanned was compared to the number of booklets assigned to the box during book receipt. Count discrepancies between book receipt and booklets scanned were resolved at this time.
Once all requirements for final processing were met, the batch was released for scoring and student level processing.
Table 8–1 shows the number of modified booklets received through booklet check-in and the number of modified booklets that contained student responses that were scanned and scored.

Chapter Eight: Processing and Scoring
2012 PSSA-M Technical Report Page 64
Table 8–1. Counts of 2012 PSSA-M Materials Received – Grades 4–8 and 11
Material Description Booklets Received Used Booklets
Scanned Total Booklets
Shipped
Grade 4 Modified Math 7,114 2,766 7,116
Grade 4 Modified Reading 7,890 3,788 7,892
Grade 5 Modified Math 7,972 3,802 7,973
Grade 5 Modified Reading 8,726 4,750 8,728
Grade 6 Modified Math 7,658 4,142 7,660
Grade 6 Modified Reading 8,109 4,644 8,110
Grade 7 Modified Math 7,597 4,404 7,600
Grade 7 Modified Reading 7,920 4,704 7,920
Grade 8 Modified Math 7,891 4,575 7,896
Grade 8 Modified Reading 7,779 4,446 7,782
Grade 8 Modified Science 6,796 3,691 6,812
Grade 11 Modified Math 7,882 4,761 7,885
Grade 11 Modified Reading 7,602 4,419 7,603
Grade 11 Modified Science 7,303 4,004 7,329

Chapter Eight: Processing and Scoring
2012 PSSA-M Technical Report Page 65
Figure 8–1 illustrates the production workflow for DRC’s Ops MMS and Image Scanning and Scoring System from receipt of materials through all processing of materials and the presentation of scanned images for scoring.
Figure 8–1. Workflow System
MATERIALS STORAGE
Upon completion of processing, student response documents were boxed for security purposes and final storage:
Project-specific box labels were created containing unique customer and project information, material type, batch number, pallet/box number, and the number of boxes for a given batch.
Boxes were stacked on pallets that were labeled with the project information and a list of the pallet’s contents before delivery to the Materials Distribution Center for final secure storage.
Materials will be destroyed one year after contract year ends with PDE written approval.
EditingValidate/OpsDone
Image Scoring atPerformance
Assessment Sites
ImageScanner
HewlettPackard
Box Receipt
InventoryLog-InCutting
DocumentStorage
Student LevelProcessing
ImageArchive
Sort Book Receipt

Chapter Eight: Processing and Scoring
2012 PSSA-M Technical Report Page 66
SCORING MULTIPLE-CHOICE ITEMS
The scoring process included the scoring of multiple-choice items against the answer key and the aggregation of raw scores from the constructed responses. A student’s raw score is the actual number of points achieved by the student for tested elements of an assessment. From the raw scores, the scaled scores were calculated.
Student answers were scored against the finalized and approved multiple-choice answer key. Items were scored as right, wrong, omitted, or double-gridded (more than one answer was bubbled for an item). Sections of the test were evaluated as a whole, and an attempt status was determined for each student for each subject. The score program defined all data elements at the student level for reporting.
RANGEFINDING
The reading and science items that were part of the 2012 PSSA-M were field tested in 2010. The mathematics items that were part of the 2012 PSSA-M were field tested in either 2009 or 2010. Rangefinding took place after each field-test administration. What follows is a description of DRC’s rangefinding process for the 2012 PSSA-M items (though those items underwent rangefinding in previous years).
After student answer documents were received and processed, DRC’s Performance Assessment Services (PAS) staff assembled groups of responses that exemplified the different score points represented in the 0–4 item-specific scoring guidelines for modified math, the 0–3 item-specific scoring guidelines for modified reading, and the 0–2 item-specific scoring guidelines for modified science.
Reading and science responses were pulled from the 2010 modified field tests. Mathematics responses were pulled from the 2009 and 2010 modified field tests. Once examples of responses representing all the score points were selected for each item, sets were assembled for rangefinding. Copies were made for each rangefinding participant. Rangefinding committees consisted of Pennsylvania educators, PDE staff members, DRC Test Development staff, and DRC Performance Assessment Services staff. The Modified Reading Rangefinding Meeting was held July 7 and 8, 2010, at the Hilton, Harrisburg. Modified Math Rangefinding Meetings were held on July 7, 2010, at the Hilton, Harrisburg, and from June 30 through July 2, 2009, at the Holiday Inn, New Cumberland. The Modified Science Rangefinding Meeting was held July 7 and 8, 2010, at the Hilton, Harrisburg.
Each rangefinding meeting began in a joint session with a review of the history of the assessment and then broke into subject/grade-specific groups. Sets of student responses were presented to the committees one item at a time. Each committee initially reviewed and scored student samples as a group to ensure that everyone was interpreting the scoring guidelines consistently. Committee members then went on to score responses independently. For each student response, committee members’ scores were discussed until a consensus was reached. Only those responses for which there was strong agreement among committee members were chosen for inclusion in training materials for DRC raters.
Discussions of student responses included the mandatory use of scoring guideline language. This ensured that committee members remained focused on the specific requirements of each score level. DRC PAS staff took notes addressing how and why the committees arrived at score point decisions, and this information was used by the scoring directors in rater training.
Chapter Eight: Processing and Scoring
2012 PSSA-M Technical Report Page 67
DRC and PDE discussed scoring guideline edits suggested by the rangefinding committees. Changes approved by PDE were then incorporated into the scoring guidelines by DRC Test Development staff. The edited scoring guidelines were used in the preparation of materials and the training of raters.
RATER RECRUITMENT/QUALIFICATIONS
DRC retains a number of raters from year to year. This pool of experienced raters was drawn from to staff the scoring of the 2012 PSSA (including the modified assessment). To complete the rater staffing for this project, DRC placed advertisements in local newspapers and utilized a variety of websites. Open houses were held and applications for rater positions were screened by DRC’s recruiting staff. Next, candidates were personally interviewed by DRC staff. In addition, each candidate was required to provide an on-demand writing sample, an on-demand math sample, references, and proof of a four-year college degree. In this screening process, preference was given to candidates with previous experience scoring large-scale assessments and degrees emphasizing expertise in mathematics, reading, or science. Thus, the rater pool consisted of educators and other professionals with content-specific backgrounds. These individuals were valued for their content-specific knowledge, but they were required to set aside their own biases about student performance and accept the scoring standards outlined in the PSSA and PSSA-M.
LEADERSHIP RECRUITMENT/QUALIFICATIONS
Scoring directors and team leaders were selected by content specialists from a pool of employees who displayed expertise as raters and leaders on previous DRC projects. These individuals had strong backgrounds in mathematics, reading, or science and demonstrated organizational, leadership, and management skills. A majority of scoring directors and team leaders had at least five years of leadership experience working on large-scale assessments, including the PSSA. All scoring directors, team leaders, and raters were required to sign confidentiality agreements before handling secure materials.
Each room of raters was assigned a scoring director. This individual led all handscoring activities for the duration of the project. Scoring directors assisted in rangefinding, worked with supervisors to create training materials, conducted team leader training, and were responsible for training the raters. The scoring director made sure that reports were available and interpreted those reports for the raters. The scoring director also supervised the team leaders. All scoring directors were monitored by the project director and the content specialists.
Team leaders assisted the scoring director with rater training by leading their teams in small group discussions and answering individual questions that raters may not have felt comfortable asking in a large group. Once raters were qualified, team leaders were responsible for maintaining the accuracy and workload of each team member. Ongoing monitoring identified those individuals having difficulty scoring accurately. These raters received one-on-one retraining from the team leader. Any rater who could not be successfully retrained had his/her scores purged and was released from the project.

Chapter Eight: Processing and Scoring
2012 PSSA-M Technical Report Page 68
TRAINING
As part of preparation for the 2012 modified mathematics, reading, and science assessments, DRC’s PAS staff assembled the PDE-approved scoring guidelines and scored student responses approved by rangefinding committees into sets used for training raters. The item-specific scoring guidelines served as the raters’ constant reference. Responses that were relevant in terms of the scoring concepts they illustrated were annotated and included in an anchor set. The full range of each score point was clearly represented and annotated in the anchor set, which was used for reference by raters throughout the project.
Training sets and qualifying sets contained student responses reviewed by rangefinding committee members. Raters were instructed on how to apply the scoring guidelines and were required to demonstrate a clear comprehension of each anchor set by performing well on the associated training materials. Responses were selected for training to show raters the range of each score point (e.g., high, mid, and low 2s). Examples of 0s were included in all subjects. This process helped raters recognize the various ways that a student could respond in order to earn each score point outlined and defined in the item-specific scoring guidelines.
The scoring director conducted a team leader training session before training the raters. This session followed the same procedures as rater training, but qualifying standards were more stringent due to the extra responsibilities required of team leaders. During team leader training, all PSSA-M materials were reviewed and discussed. Team leaders were required to annotate all of their training materials with committee justifications from the rangefinding meetings. To facilitate scoring consistency, it was imperative that all team leaders imparted the same rationale for each response. Once the team leaders were qualified, leadership responsibilities were reviewed and team assignments were given. A ratio of one team leader for every 8–10 raters ensured a sufficient monitoring rate for each team member.
The 2012 assessment included the opportunity for students to respond in Spanish to modified math and science items. The scoring director responsible for this component of the assessment is a Spanish speaker who has a strong mathematics and science background and who has worked closely with the PSSA for three years. All Spanish raters were bilingual and hired specifically to score the Spanish portion of the assessment. They were required to meet the same training and scoring standards set for the raters of the English version of the assessment.
Rater training began with the scoring director providing an intensive review of the scoring guidelines and anchor papers. Next, raters practiced by independently scoring the responses in the training sets. After each training set, the scoring director or team leaders led a thorough discussion of the responses, either in a large-group or small-group setting.
Once the scoring guidelines, anchor sets, and training sets were thoroughly discussed, each rater was required to demonstrate understanding of the scoring criteria by qualifying (i.e., scoring with acceptable agreement to the true scores) on at least one of the qualifying sets. Raters who failed to achieve 70 percent exact agreement on the first qualifying set were given additional individual training. Raters who did not perform at the required level of agreement by the end of the qualifying process were not allowed to score any student responses. These individuals were removed from the pool of potential raters in DRC’s imaging system and released from the project.

Chapter Eight: Processing and Scoring
2012 PSSA-M Technical Report Page 69
HANDSCORING PROCESS
Student responses were scored independently. All responses were scored once, and ten percent of the responses were scored a second time. The data collected from the ten percent double read portion was used to calculate the exact and adjacent agreement rates in the Scoring Summary Reports. The responses that were used for the ten percent read behind were randomly chosen by the imaging system at the item level. Additional read behinds by the team leaders and scoring directors were done to further ensure reliability.
Raters scored the imaged student responses on PC monitors at DRC Scoring Centers in Sharonville and Columbus, Ohio; Plymouth and Woodbury, Minnesota; Pittsburgh, Pennsylvania; and Austin, Texas. Raters were seated at tables with two imaging stations at each table. Image distribution was controlled, ensuring that student responses were sent only to designated groups of raters qualified to score those items. Imaged student responses were electronically separated for routing to individual raters by item. Raters were only provided with student responses that they were qualified to score. Scores were keyed into DRC’s imaging system.
To handle possible alerts (i.e., student responses indicating potential issues related to students’ safety and well-being that sometimes require attention at the state or local level), DRC’s imaging system allows raters to forward responses needing attention to the scoring director. These alerts are reviewed by the project director, who then notifies the students’ schools and PDE of the occurrences. However, PDE does not receive students’ responses or any other identifying information about the students. At no time in the alerts process do raters acquire any knowledge concerning a student’s personal identity. There were no student response alerts during the scoring of the 2012 modified assessment.
HANDSCORING VALIDITY PROCESS
One of the training tools PAS utilized to ensure rater accuracy was the validity process. The goal of the validity process is to ensure that scoring standards are maintained. Specifically, the objective is to make sure that raters score student responses in a manner consistent with statewide standards both within a single administration of the PSSA-M and across consecutive administrations. In scoring the 2012 PSSA-M, this scoring consistency was maintained, in part, through the validity process.
The validity process began with the selection of scored responses from the initial field test. The content specialist for each modified subject selected 40 validity papers for each core open-ended (OE) item. These 40 papers were drawn from a pool of exemplars (responses that are representative of a particular score point and have been verified by the scoring director and the content specialist). The scores on validity papers are considered true scores.
The validity papers were then implemented to test rater accuracy. The responses were scanned into the imaging system and dispersed intermittently to the raters. By the end of the project, raters had scored all 40 validity papers for any items they were qualified to score. Raters were unaware that they were being dealt pre-scored responses and assumed that they were scoring live student responses. This helped bolster the internal validity of the process. It is important to note that all raters who received validity papers had already successfully completed the training/qualifying process.

Chapter Eight: Processing and Scoring
2012 PSSA-M Technical Report Page 70
Next, the scores that the raters assigned to the validity papers were compared to the true scores in order to determine the validity of the raters’ scores. For each item, the percentage of exact agreement as well as the percentage of high and low scores was computed. This data was accessed through the Validity Item Detail Report. The same sort of data was also computed for each specific rater. This data was accessed through the Validity Reader Detail Report. Both of these may be run as daily or cumulative reports.
The Validity Reader Detail Report was used to identify particular raters for retraining. If a rater on a certain day generated a lower rate of agreement on a group of validity papers, it was immediately apparent in the Validity Reader Detail Report. A lower rate of agreement was defined as anything below 70 percent exact agreement with the true scores. Any time a rater’s validity agreement rate fell below 70 percent, the scoring director was cued to examine that rater’s scoring. First, the scoring director attempted to ascertain what kind of validity papers the rater was scoring incorrectly. This was done to determine whether there was any sort of a trend (e.g., trending low on the 1–2 line). Once the source of the low agreement was determined, the rater was retrained. If it was determined that the rater had been scoring live papers inaccurately, then his/her scores were purged for that day, and the responses were re-circulated and scored by other raters.
The cumulative Validity Item Detail Report was utilized to identify potential room-wide trends in need of correction. For instance, if a particular validity response with a true score of 3 was given a score of 2 by a significant number of raters within the room, that trend would be revealed in the Validity Item Detail Report. To correct a trend of this sort, the scoring director would look for student responses similar to the validity paper being scored incorrectly. Once located, these responses would be used in room-wide retraining, usually in the form of an annotated handout or a short set of papers without printed scores that was given to raters as a recalibration test.
Validity was employed on all core modified reading, math, and science OE items. Each 40-paper validity set was formulated to mirror the score point distribution that the item generated during its previous administration. Each validity set included at least five examples of each score point. Examples of different types of responses were included to ensure that raters were tested on the full spectrum of response types.
The exact rater agreement rate generated during the validity process was often higher than the inter-rater agreement rate for the same item. The reason for this discrepancy has to do with how validity sets are formulated. The 40 validity papers for each item, chosen by the content specialist, are intended to cover the full breadth of each score point. For example, each validity set contains examples of high, mid, and low 2s. This scope ensures that the validity process is truly valid in terms of addressing the complete spectrum of response types. However, certain types of responses are generally not included in validity sets. These include line papers (i.e., examples of score points that are so close to the adjacent score point that raters are instructed to consult with a supervisor before assigning a score) and responses that, because of poor word choice/writing, are difficult to understand. The reason for these exclusions is that confusing/line/illegible papers often do not impart a teachable lesson. Since these types of papers are usually unique, any potential lesson the response might teach would apply only to that particular paper. Conversely, the papers in validity sets are chosen because they represent common response-types and teach lessons that can be applied to other similar papers. Due to this distinction, validity sets generate a slightly higher agreement rate than is normally generated during operational scoring.

Chapter Eight: Processing and Scoring
2012 PSSA-M Technical Report Page 71
QUALITY CONTROL
Rater accuracy was monitored throughout the scoring session by means of daily and on-demand reports. These reports ensured that an acceptable level of scoring accuracy was maintained throughout the project. Inter-rater reliability was tracked and monitored with multiple quality control reports that were reviewed by quality assurance analysts. These reports and other quality control documents were generated at the scoring centers, where they were reviewed by the scoring directors, team leaders, content specialists, and project directors. The following reports and documents were used during the scoring of the modified open-ended items responses:
The Scoring Summary Report (includes two related reports)
1. The Reader Monitor Report monitored how often raters were in exact agreement with one another and ensured that an acceptable agreement rate was maintained. This report provided daily and cumulative exact and adjacent inter-rater agreement on the ten percent of responses that was double read.
2. The Score Point Distribution Report monitored the percentage of responses given each of the score points. For example, the mathematics daily and cumulative reports showed what percentage of 0s, 1s, 2s, 3s, and 4s a rater had given to all the responses scored at the time the report was produced. It also indicated the number of responses read by each rater so that production rates could be monitored.
The Item Status Report monitored the progress of handscoring. This report tracked each response and indicated the status (e.g., not read, complete, awaiting supervisor review). This report ensured that all responses were scored by the end of the project.
The Read-Behind Report identified all responses scored by an individual rater. This report was useful if any responses needed rescoring because of possible rater drift.
The Validity Reports (addressed on previous page) tracked how raters performed by comparing pre-scored responses to raters’ scores for the same responses. If a rater’s scoring fell below the 70 percent determined agreement rate, remediation occurred. Raters who did not retrain to the required level of agreement were released from the project.
The Read-Behind Log was used by the team leader/scoring director to monitor individual rater reliability. Team leaders read randomly-selected scored items from each team member. If the team leader disagreed with a rater’s score, remediation occurred. This proved to be a very effective type of feedback because it was done with live items scored by a particular rater.
Recalibration Sets were used throughout the scoring sessions to ensure accuracy by comparing each rater’s scores with the true scores on a pre-selected set of responses. Recalibration sets helped to refocus raters on Pennsylvania scoring standards. This check made sure there was no change in the scoring pattern as the project progressed. Raters failing to achieve 70 percent agreement with the recalibration true scores were given additional training to achieve the highest degree of accuracy possible. Raters who were unable to recalibrate were released from the project. The procedure for creating and administering recalibration sets was similar to the one used for training sets.
Table 8–2 shows exact and adjacent agreement rates of raters on the core open-ended responses for the modified mathematics items in the 2012 PSSA. All student responses were read once, and ten percent of responses were read a second time. The data collected from this ten-percent double read were used to calculate the exact and adjacent agreement rates.

Chapter Eight: Processing and Scoring
2012 PSSA-M Technical Report Page 72
Table 8–2. Inter-rater Agreement for 2012 PSSA Modified Mathematics Grades 4–8 and 11
Open-Ended Response Items and Validity
Grade Common
Item % Exact
Agreement % Adjacent Agreement
% Exact + Adjacent
Agreement
% Exact Validity
Agreement
4 1 97 3 100 87 2 98 2 100 93
5 1 93 7 100 85 2 96 3 99 97
6 1 93 7 100 95 2 94 6 100 94
7 1 94 6 100 95 2 96 4 100 89
8 1 90 10 100 94 2 94 6 100 94
11 1 97 3 100 94 2 95 5 100 94
Note. 0–4 possible score points
Table 8–3 shows the distribution of scores for the modified mathematics items. All modified mathematics items are scored with a 0–4 score point range.
Table 8–3. Percentages Awarded for Each Possible Score Point 2012 PSSA Modified Mathematics Grades 4–8 and 11
Grade Common Item %0 %1 %2 %3 %4 %B/NS*
4 1 46 31 8 7 8 1 2 42 30 18 5 4 1
5 1 68 20 7 3 1 1 2 39 27 10 10 14 1
6 1 48 41 7 2 1 0 2 19 57 19 4 1 1
7 1 29 34 14 15 7 1 2 77 4 4 7 5 1
8 1 32 41 20 4 2 1 2 38 39 13 8 1 1
11 1 52 34 6 1 3 4 2 43 46 3 3 0 4
*B=blank and NS=non-scoreable

Chapter Eight: Processing and Scoring
2012 PSSA-M Technical Report Page 73
Table 8–4 shows exact and adjacent agreement rates of raters on the core open-ended responses for the modified reading items in the 2012 PSSA. All student responses were read once, and ten percent of responses were read a second time. The data collected from this ten-percent double read were used to calculate the exact and adjacent agreement rates.
Table 8–4. Inter-rater Agreement for 2012 PSSA Modified Reading Grades 4–8 and 11
Open-Ended Response Items and Validity
Grade Common
Item % Exact
Agreement % Adjacent Agreement
% Exact + Adjacent
Agreement
% Exact Validity
Agreement
4 1 74 26 100 72 2 81 19 100 68
5 1 89 11 100 85 2 77 23 100 73
6 1 78 22 100 84 2 79 21 100 77
7 1 80 19 99 70 2 77 22 99 70
8 1 79 21 100 82 2 82 18 100 62
11 1 75 25 100 65 2 81 19 100 83
Note. 0–3 possible score points
Table 8–5 shows the distribution of scores for the modified reading items. All modified reading items are scored with a 0–3 score-point range.
Table 8–5. Percentages Awarded for Each Possible Score Point 2012 PSSA Modified Reading Grades 4–8 and 11
Grade Common Item %0 %1 %2 %3 %B/NS*
4 1 16 35 36 10 1 2 26 29 20 24 2
5 1 20 26 28 25 2 2 6 41 38 11 1
6 1 18 47 28 6 2 2 13 33 36 15 2
7 1 16 31 31 20 2 2 20 50 22 6 2
8 1 14 30 40 15 2 2 6 26 40 24 2
11 1 9 41 29 17 4 2 6 36 35 18 4
*B=blank and NS=non-scoreable

Chapter Eight: Processing and Scoring
2012 PSSA-M Technical Report Page 74
Table 8–6 shows exact and adjacent agreement rates of raters on the core open-ended responses for the modified science items in the 2012 PSSA. All student responses were read once, and ten percent of responses were read a second time. The data collected from this ten-percent double read were used to calculate the exact and adjacent agreement rates.
Table 8–6. Inter-rater Agreement for 2012 PSSA Modified Science Grades 8 and 11
Open-Ended Response Items and Validity
Grade Common
Item % Exact
Agreement % Adjacent Agreement
% Exact + Adjacent
Agreement
% Exact Validity
Agreement
8 1 88 12 100 96 2 85 15 100 95
11 1 81 19 100 82 2 88 12 100 90
Note. 0–2 possible score points
Table 8–7 shows the distribution of scores for the modified science items. All modified science items are scored with a 0–2 score point range.
Table 8–7. Percentages Awarded for Each Possible Score Point 2012 PSSA Modified Science Grades 8 and 11
Grade Common Item %0 %1 %2 %B/NS*
8 1 29 45 24 2 2 25 54 19 2
11 1 16 41 32 11 2 61 25 5 8
*B=blank and NS=non-scoreable

Chapter Nine: Description of Data Sources and Sampling Adequacy
2012 PSSA-M Technical Report Page 75
Chapter Nine: Description of Data Sources and Sampling Adequacy This chapter describes the data sources (e.g., n-counts, characteristics of students) used for the various analysis procedures discussed in the remaining chapters of this technical report. Statistical analysis is conducted at several points for the PSSA-M: 1) an early analysis for quality control purposes and 2) analyses for the technical report and item banking. Detailed information regarding the attributes of students used for Adequate Yearly Progress (AYP) reporting is provided in Chapter Ten.
PRIMARY STUDENT FILTERING CRITERIA
For many data files, the primary means of filtering students for inclusion/exclusion from any data analysis are based on the state reporting criteria, which are outlined below. Within the state reporting rules are separate attempt criteria for individual subject areas. The attempt criteria are discussed more fully below.
State Reporting Criteria
The state reporting criteria are as follows:
Student must be enrolled for the full academic year.
Student must be attributed to a public district/school (state).
Student must receive a score (i.e., met the subject attempt logic—see additional information below).
Student is not a home school student.
Student is not a foreign exchange student.
Student is not a first year ELL student.
PSSA-M ATTEMPT CRITERIA
For all data sources, only students who meet the attempt criteria are included. The attempt criteria required students to complete a minimum of four items (multiple-choice or open-ended items) in each subject area section of the test booklets. Counts were based on operational items only.
KEY VALIDATION DATA
These data are only mentioned for the sake of completeness, as no formal results from these data are provided in this technical document. An analysis on all MC items is conducted early in the scoring process to ensure that the items are performing as expected. This is an important quality check that is always done for the PSSA-M. This analysis is usually (but not always) done using all students from early-return schools. The sample does not need to be representative of the entire state for these quality checks. Available student data typically suffices as long as there is reasonable variability in the total test scores of students.
For 2012 this data included all public school students who 1) had their MC items scanned and scored by May 20 and 2) met preliminary attempt criteria (i.e., attempt was determined based on MC items only). Note that the full state reporting criteria were not in effect for this file (only attribution to a public school based on tested site and preliminary attempt criteria were used to filter students).

Chapter Nine: Description of Data Sources and Sampling Adequacy
2012 PSSA-M Technical Report Page 76
FINAL DATA
This file included all students who met state reporting criteria and post-AYP appeals (including attempt criteria) by August 29 for all subject areas. The final data was post-appeals data, meaning that schools had an opportunity to correct certain fields within the data during the AYP appeals process (e.g., student ethnicity). All other files contained pre-appeals data. The data banked for this administration and the majority of the results included in this technical report were derived using the final data file.
FINAL N-COUNTS FOR ALL DATA SOURCES
The n-counts for all data sources are provided in Table 9–1.
Table 9–1. Data Source N-Counts
Key
Validation Final
Mat
hem
atic
s 4 2647 2708 5 3632 3726 6 3950 4061 7 4161 4283 8 4302 4444
11 4466 4606
Rea
din
g
4 3646 3711 5 4574 4672 6 4438 4543 7 4453 4570 8 4177 4308
11 4125 4255
Sci
. 8 3452 3554 11 3632 3742

Chapter Ten: Summary Demographic, Program, and Accommodation Data for the 2012 PSSA-Modified
2012 PSSA-M Technical Report Page 77
Chapter Ten: Summary Demographic, Program, and Accommodation Data for the 2012 PSSA-Modified
ASSESSED STUDENTS
As stated in earlier chapters, the target population for the PSSA-M consists of public school students with an IEP and history of low academic achievement whose disabilities inhibit their capacity to respond to the standard PSSA, even with accommodations. However, they function above the one percent of students with the most severe cognitive impairments who qualify for the Pennsylvania Alternate System of Assessment (PASA).
Eligibility for the PSSA-M requires that a student 1) is not eligible for the PASA, 2) has a grade-level standards-aligned IEP that clearly documents that the student requires significant instructional accommodations to successfully access grade-level content, and 3) demonstrates persistent academic difficulties with 4) a lack of academic progress. More detailed information on the PSSA-M eligibility criteria may be accessed at www.education.state.pa.us. On the left, select “Programs,” “Programs S–Z,” and then “Special Education.” From the “Special Education” page select “Assessment” to access the relevant documents regarding eligibility.
Results in this chapter are presented in sets of tables for the three PSSA-M subject areas (mathematics, reading, and science). Accompanying each numbered table is a letter (M, R, or S) to designate the subject area. Table set 10–1M, 10–1R, and 10–1S provides a summary of the assessed students for each subject. Presented on the first line is the total number of non-blank answer documents processed by grade level for the 2012 PSSA-M. This number pertains to the total number of records on file and is typically less than the “Used Booklets Scanned” column shown in Table 8–1. The reason for the difference is that completely blank answer booklets (no student name and no items responded to) get removed from the initial batch of materials scanned. See Chapter Eight for more details on processing. The second line shows the number and percentage of students with a PSSA-M score in the subject area, followed by the number and percentage not receiving a score. The final line gives the number of students contributing to state summary statistics, which is especially relevant for all tables following 10–2 (M, R, and S). (See the section of this chapter entitled “Composition of Sample Used in Subsequent Tables” for an additional explanation.)
Table 10–1M. Students Assessed on the 2012 PSSA-M: Mathematics
Gr. 4 Gr. 5 Gr. 6 Gr. 7 Gr. 8 Gr. 11
N / Pct N / Pct N / Pct N / Pct N / Pct N / Pct Number of non-blank answer documents processed
2,765 3,799 4,144 4,405 4,575 4,759
Students with a mathematics score 2,756 99.7
3,783 99.6
4,133 99.7
4,372 99.3
4,543 99.3
4,69398.6
Number processed but not assessed (without a total score)
9 0.3
16 0.4
11 0.3
33 0.7
32 0.7
661.4
Students with a mathematics score used in state summaries
2,708 3,726 4,061 4,283 4,444 4,606
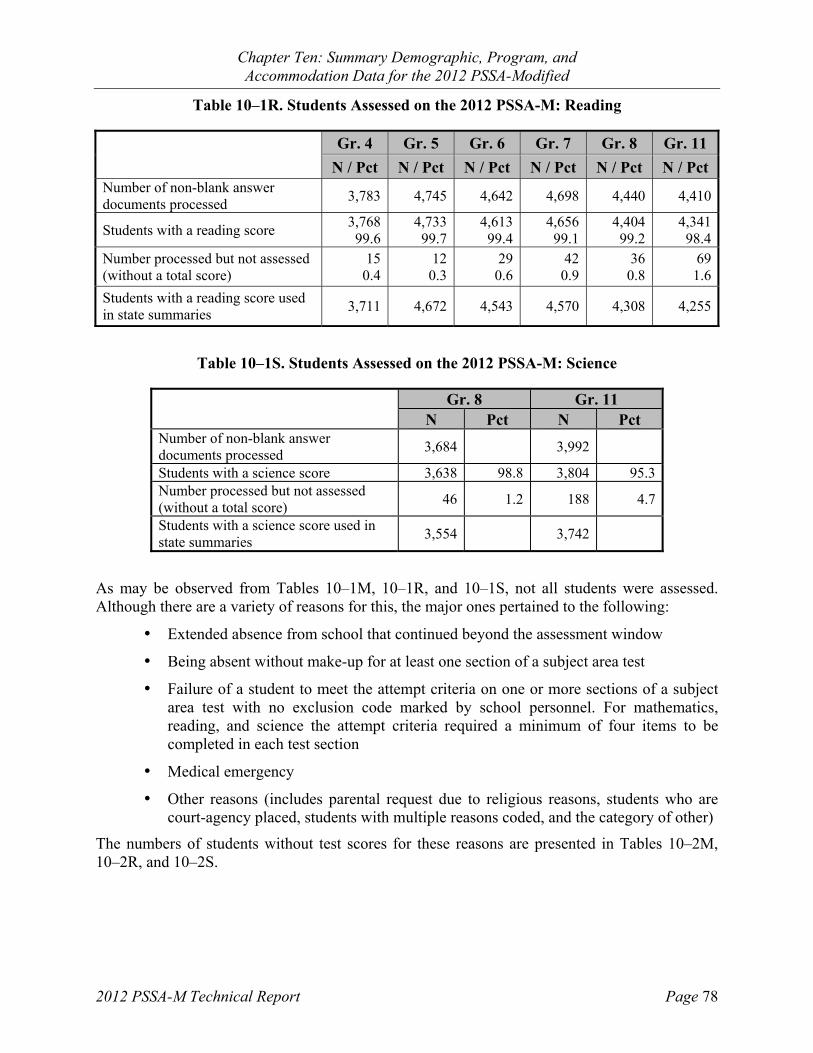
Chapter Ten: Summary Demographic, Program, and Accommodation Data for the 2012 PSSA-Modified
2012 PSSA-M Technical Report Page 78
Table 10–1R. Students Assessed on the 2012 PSSA-M: Reading
Gr. 4 Gr. 5 Gr. 6 Gr. 7 Gr. 8 Gr. 11
N / Pct N / Pct N / Pct N / Pct N / Pct N / Pct Number of non-blank answer documents processed
3,783 4,745 4,642 4,698 4,440 4,410
Students with a reading score 3,768 99.6
4,733 99.7
4,613 99.4
4,656 99.1
4,404 99.2
4,34198.4
Number processed but not assessed (without a total score)
15 0.4
12 0.3
29 0.6
42 0.9
36 0.8
691.6
Students with a reading score used in state summaries
3,711 4,672 4,543 4,570 4,308 4,255
Table 10–1S. Students Assessed on the 2012 PSSA-M: Science
Gr. 8 Gr. 11
N Pct N Pct Number of non-blank answer documents processed
3,684 3,992
Students with a science score 3,638 98.8 3,804 95.3Number processed but not assessed (without a total score)
46 1.2 188 4.7
Students with a science score used in state summaries
3,554 3,742
As may be observed from Tables 10–1M, 10–1R, and 10–1S, not all students were assessed. Although there are a variety of reasons for this, the major ones pertained to the following:
Extended absence from school that continued beyond the assessment window
Being absent without make-up for at least one section of a subject area test
Failure of a student to meet the attempt criteria on one or more sections of a subject area test with no exclusion code marked by school personnel. For mathematics, reading, and science the attempt criteria required a minimum of four items to be completed in each test section
Medical emergency
Other reasons (includes parental request due to religious reasons, students who are court-agency placed, students with multiple reasons coded, and the category of other)
The numbers of students without test scores for these reasons are presented in Tables 10–2M, 10–2R, and 10–2S.

Chapter Ten: Summary Demographic, Program, and Accommodation Data for the 2012 PSSA-Modified
2012 PSSA-M Technical Report Page 79
Table 10–2M. Counts of Students without Scores on the 2012 PSSA-M: Mathematics
Reason for Non-Assessment Gr. 4 Gr. 5 Gr. 6 Gr. 7 Gr. 8 Gr. 11
N / Pct N / Pct N / Pct N / Pct N / Pct N / Pct
Extended Absence from School 1
11.12
12.52
18.25
15.2 5
15.6 15
22.7
Absent Without Make-up 0
0.01
6.32
18.22
6.1 2
6.3 9
13.6
Non-Attempt 5
55.69
56.34
36.413
39.4 13
40.6 16
24.2
Medical Emergency 1
11.12
12.52
18.28
24.2 6
18.8 11
16.7
Other Reasons 2
22.22
12.51
9.15
15.2 6
18.8 15
22.7Total Not Assessed 9 16 11 33 32 66
Table 10–2R. Counts of Students without Scores on the 2012 PSSA-M: Reading
Reason for Non-Assessment Gr. 4 Gr. 5 Gr. 6 Gr. 7 Gr. 8 Gr. 11
N / Pct N / Pct N / Pct N / Pct N / Pct N / Pct
Extended Absence from School 2
13.33
25.03
10.34
9.5 4
11.1 12
17.4
Absent Without Make-up 0
0.00
0.05
17.22
4.8 3
8.3 12
17.4
Non-Attempt 11
73.34
33.316
55.225
59.5 18
50.0 22
31.9
Medical emergency 0
0.03
25.03
10.38
19.0 4
11.1 9
13.0
Other Reasons 2
13.32
16.72
6.93
7.1 7
19.4 14
20.3Total Not Assessed 15 12 29 42 36 69
Table 10–2S. Counts of Students without Scores on the 2012 PSSA-M: Science
Reason for Non-Assessment Gr. 8 Gr. 11
N Pct N Pct
Extended Absence from School 12 26.1 43 22.9
Absent Without Make-up 3 6.5 38 20.2
Non-Attempt 10 21.7 56 29.8
Medical Emergency 10 21.7 14 7.4
Other Reasons 11 23.9 37 19.7
Total Not Assessed 46 188

Chapter Ten: Summary Demographic, Program, and Accommodation Data for the 2012 PSSA-Modified
2012 PSSA-M Technical Report Page 80
COMPOSITION OF SAMPLE USED IN SUBSEQUENT TABLES
Students included in the following demographic analyses were those who contributed to state summary statistics, using the post-appeals Adequate Yearly Progress (AYP) individual student data file provided to the Pennsylvania Department of Education on August 27, 2012. Students not included in the present state summary data were those who 1) were enrolled in a Pennsylvania school after October 1, 2011; 2) were coded as ELL and enrolled after April 15, 2011; 3) were a foreign exchange student; 4) were home schooled; 5) were enrolled in a non-public school; or 6) do not have a subject area test score.
Demographic data for students taking the PSSA-M is presented separately for each subject area in Tables 10–3M, 10–3R, and 10–3S. Results for accommodations received were collected separately by subject area and are presented in separate tables as well. For example, tables involving accommodations for reading (Tables 10–4R, 10–5R, 10–6R, and 10–7R) were calculated for those students having a reading score.
COLLECTION OF STUDENT DEMOGRAPHIC INFORMATION
Data for analyses involving demographic characteristics were obtained primarily from information supplied by school district personnel through the Pennsylvania Information Management System (PIMS) and subsequently transmitted to DRC. Updates of attribution data for AYP were carried out through the DRC Attribution System. Some data, such as accommodation information, is marked directly on the student answer document at the time the PSSA-M is administered.
DEMOGRAPHIC CHARACTERISTICS
Frequency data for each category is presented in Tables 10–3M, 10–3R, and 10–3S. Percentages are based on students with scores in a subject area, which are shown at the bottom of the appropriate table. Included are students receiving education in a non-traditional setting, such as court-agency placement.
Beginning in 2011, PSSA-M was based on post-appeals files rather than on the pre-appeals file as in 2010, making it more comparable with the PSSA. A comparison between selected demographic characteristics of PSSA-M and PSSA data was thereby improved. The assessment of 2012 is the first year in which a two-year comparison was available for reading and science. Comparisons involving gender and ethnicity revealed more male and minority (Black/African American, Latino/Hispanic) students responded to the PSSA-M than those receiving the standard PSSA, regardless of subject area. A detailed account of these comparisons may be found in Appendix O of this report.

Chapter Ten: Summary Demographic, Program, and Accommodation Data for the 2012 PSSA-Modified
2012 PSSA-M Technical Report Page 81
Table 10–3M. Demographic Characteristics of Students Taking the 2012 PSSA-M: Mathematics
Demographic or Educational Characteristic
Gr. 4 Gr. 5 Gr. 6 Gr. 7 Gr. 8 Gr. 11
N / Pct N / Pct N / Pct N / Pct N / Pct N / Pct
Gender
Female 1,081 39.9
1,484 39.8
1,667 41.0
1,719 40.1
1,693 38.1
1,85140.2
Male 1,625 60.0
2,240 60.1
2,391 58.9
2,562 59.8
2,746 61.8
2,75059.7
Race/Ethnicity
American Indian or Alaskan Native
5 0.2
6 0.2
11 0.3
8 0.2
10 0.2
80.2
Asian or Pacific Islander 30
1.133
0.948
1.249
1.141
0.9 51
1.1
Black/African American non-Hispanic
645 23.8
890 23.9
962 23.7
896 20.9
934 21.0
1,03122.4
Latino/Hispanic 298
11.0397
10.7419
10.3448
10.5434 9.8
3978.6
White non-Hispanic 1,655 61.1
2,317 62.2
2,549 62.8
2,808 65.6
2,944 66.2
3,07466.7
Multi-Racial/Ethnic 71
2.680
2.168
1.768
1.676
1.7 37
0.8
Educational Category and Other Demographic Groups
IEP (not gifted) 2,708 100.0
3,726 100.0
4,061 100.0
4,283 100.0
4,444 100.0
4,606100.0
Student exited IEP in last 2 years 0
0.00
0.00
0.00
0.00
0.0 0
0.0
Title I 1,124 41.5
1,402 37.6
1,219 30.0
984 23.0
933 21.0
93620.3
Title III Served 127 4.7
162 4.3
146 3.6
159 3.7
134 3.0
902.0
Title III Not Served 12
0.416
0.417
0.419
0.410
0.2 11
0.2
Migrant Student 1
0.02
0.12
0.02
0.01
0.0 1
0.0
ELL (enrolled after 4-15-11) 0
0.00
0.00
0.00
0.00
0.0 0
0.0
ELL (enrolled before 4-15-11) 140 5.2
180 4.8
163 4.0
178 4.2
144 3.2
1022.2

Chapter Ten: Summary Demographic, Program, and Accommodation Data for the 2012 PSSA-Modified
2012 PSSA-M Technical Report Page 82
Table 10–3M (continued). Demographic Characteristics of Students Taking the 2012 PSSA-M: Mathematics
Demographic or Educational Characteristic
Gr. 4 Gr. 5 Gr. 6 Gr. 7 Gr. 8 Gr. 11
N / Pct N / Pct N / Pct N / Pct N / Pct N / Pct
Educational Category and Other Demographic Groups (continued)
Exited ESL/bilingual program and in first year of monitoring
5 0.2
17 0.5
18 0.4
8 0.2
9 0.2
50.1
Exited ESL/bilingual program and in second year of monitoring
7 0.3
7 0.2
9 0.2
9 0.2
10 0.2
90.2
Former ELL no longer monitored 8
0.311
0.336
0.941
1.048
1.1 67
1.5
Economically Disadvantaged 1,747 64.5
2,421 65.0
2,542 62.6
2,595 60.6
2,610 58.7
2,39752.0
Enrollment
Current Enrollment in school of residence after 10-1-11
84 3.1
94 2.5
116 2.9
110 2.6
113 2.5
1242.7
Current Enrollment in district of residence after 10-1-11
32 1.2
47 1.3
55 1.4
60 1.4
70 1.6
691.5
Current Enrollment as PA resident after 10-1-11
0 0.0
0 0.0
0 0.0
0 0.0
0 0.0
00.0
Enrolled in school of residence after 10-1-10 but on/before 10-1-11
675 24.9
822 22.1
1,064 26.2
937 21.9
794 17.9
82317.9
Enrolled in district of residence after 10-1-10 but on/before 10-1-11
235 8.7
319 8.6
361 8.9
408 9.5
396 8.9
3457.5
Education in Non-Traditional Settings
Court/agency placed 4
0.17
0.27
0.219
0.425
0.6 54
1.2
Students with mathematics scores used in state summaries
2,708 3,726 4,061 4,283 4,444 4,606

Chapter Ten: Summary Demographic, Program, and Accommodation Data for the 2012 PSSA-Modified
2012 PSSA-M Technical Report Page 83
Table 10–3R. Demographic Characteristics of Students Taking the 2012 PSSA-M: Reading
Demographic or Educational Characteristic
Gr. 4 Gr. 5 Gr. 6 Gr. 7 Gr. 8 Gr. 11
N / Pct N / Pct N / Pct N / Pct N / Pct N / Pct
Gender
Female 1,328 35.8
1,645 35.2
1,714 37.7
1,728 37.8
1,529 35.5
1,57737.1
Male 2,379 64.1
3,024 64.7
2,827 62.2
2,840 62.1
2,777 64.5
2,67462.8
Race/Ethnicity
American Indian or Alaskan Native
7 0.2
6 0.1
15 0.3
8 0.2
9 0.2
60.1
Asian or Pacific Islander 43
1.254
1.254
1.247
1.048
1.1 50
1.2
Black/African American non-Hispanic
773 20.8
993 21.3
993 21.9
900 19.7
881 20.5
98923.2
Latino/Hispanic 372
10.0471
10.1436 9.6
495 10.8
429 10.0
3859.0
White non-Hispanic 2,427 65.4
3,069 65.7
2,970 65.4
3,051 66.8
2,867 66.6
2,78265.4
Multi-Racial/Ethnic 85
2.375
1.673
1.663
1.471
1.6 38
0.9
Educational Category and Other Demographic Groups
IEP (not gifted) 3,711 100.0
4,672 100.0
4,543 100.0
4,570 100.0
4,308 100.0
4,255100.0
Student exited IEP in last 2 years 0
0.00
0.00
0.00
0.00
0.0 0
0.0
Title I 1,441 38.8
1,666 35.7
1,329 29.3
1,023 22.4
931 21.6
87320.5
Title III Served 174 4.7
188 4.0
162 3.6
184 4.0
149 3.5
872.0
Title III Not Served 10
0.319
0.416
0.422
0.513
0.3 12
0.3
Migrant Student 1
0.02
0.03
0.12
0.00
0.0 1
0.0
ELL (enrolled after 4-15-11) 0
0.00
0.00
0.00
0.00
0.0 0
0.0
ELL (enrolled before 4-15-11) 184 5.0
209 4.5
179 3.9
206 4.5
163 3.8
1022.4
Exited ESL/bilingual program and in first year of monitoring
10 0.3
22 0.5
21 0.5
13 0.3
12 0.3
70.2
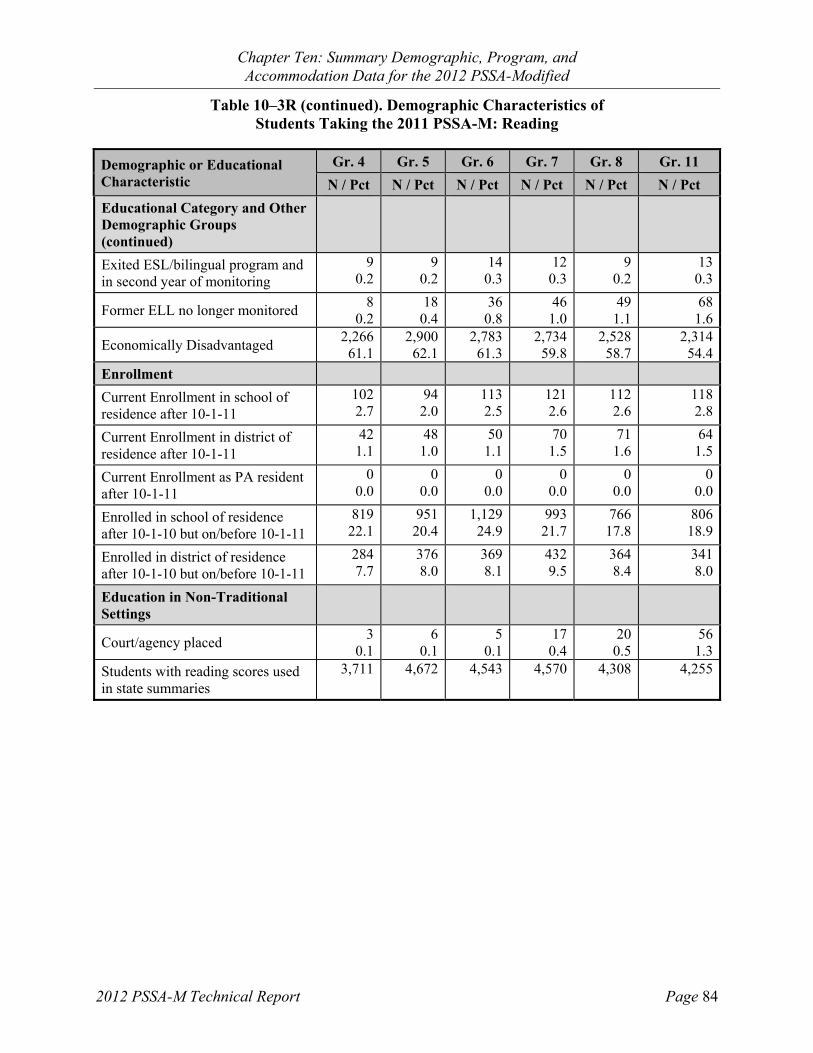
Chapter Ten: Summary Demographic, Program, and Accommodation Data for the 2012 PSSA-Modified
2012 PSSA-M Technical Report Page 84
Table 10–3R (continued). Demographic Characteristics of Students Taking the 2011 PSSA-M: Reading
Demographic or Educational Characteristic
Gr. 4 Gr. 5 Gr. 6 Gr. 7 Gr. 8 Gr. 11
N / Pct N / Pct N / Pct N / Pct N / Pct N / Pct
Educational Category and Other Demographic Groups (continued)
Exited ESL/bilingual program and in second year of monitoring
9 0.2
9 0.2
14 0.3
12 0.3
9 0.2
130.3
Former ELL no longer monitored 8
0.218
0.436
0.846
1.049
1.1 68
1.6
Economically Disadvantaged 2,266 61.1
2,900 62.1
2,783 61.3
2,734 59.8
2,528 58.7
2,31454.4
Enrollment
Current Enrollment in school of residence after 10-1-11
102 2.7
94 2.0
113 2.5
121 2.6
112 2.6
1182.8
Current Enrollment in district of residence after 10-1-11
42 1.1
48 1.0
50 1.1
70 1.5
71 1.6
641.5
Current Enrollment as PA resident after 10-1-11
0 0.0
0 0.0
0 0.0
0 0.0
0 0.0
00.0
Enrolled in school of residence after 10-1-10 but on/before 10-1-11
819 22.1
951 20.4
1,129 24.9
993 21.7
766 17.8
80618.9
Enrolled in district of residence after 10-1-10 but on/before 10-1-11
284 7.7
376 8.0
369 8.1
432 9.5
364 8.4
3418.0
Education in Non-Traditional Settings
Court/agency placed 3
0.16
0.15
0.117
0.420
0.5 56
1.3
Students with reading scores used in state summaries
3,711 4,672 4,543 4,570 4,308 4,255

Chapter Ten: Summary Demographic, Program, and Accommodation Data for the 2012 PSSA-Modified
2012 PSSA-M Technical Report Page 85
Table 10–3S. Demographic Characteristics of Students Taking the 2012 PSSA-M: Science
Demographic or Educational Characteristic
Gr. 8 Gr. 11
N Pct N Pct
Gender
Female 1,310 36.9 1,412 37.7
Male 2,243 63.1 2,327 62.2
Race/Ethnicity
American Indian or Alaskan Native 7 0.2 6 0.2
Asian or Pacific Islander 33 0.9 39 1.0
Black/African American non-Hispanic 697 19.6 847 22.6
Latino/Hispanic 356 10.0 331 8.8
White non-Hispanic 2,400 67.5 2,478 66.2
Multi-Racial/Ethnic 61 1.7 37 1.0
Educational Category and Other Demographic Groups
IEP (not gifted) 3,554 100.0 3,742 100.0
Student exited IEP in last 2 years 0 0.0 0 0.0
Title I 643 18.1 770 20.6
Title III - Served 135 3.8 70 1.9
Title III - Not Served 8 0.2 13 0.3
Migrant Student 0 0.0 1 0.0
ELL (enrolled after 4-15-11) 7 0.2 3 0.1
ELL (enrolled before 4-15-11) 136 3.8 82 2.2
Exited ESL/bilingual program and in first year of monitoring
8 0.2 5 0.1
Exited ESL/bilingual program and in second year of monitoring
10 0.3 9 0.2
Former ELL no longer monitored 38 1.1 59 1.6
Economically Disadvantaged 2,074 58.4 1,999 53.4
Enrollment
Current Enrollment in school of residence after 10-1-11
81 2.3 91 2.4
Current Enrollment in district of residence after 10-1-11
53 1.5 47 1.3

Chapter Ten: Summary Demographic, Program, and Accommodation Data for the 2012 PSSA-Modified
2012 PSSA-M Technical Report Page 86
Table 10–3S (continued). Demographic Characteristics of Students Taking the 2012 PSSA-M: Science
Demographic or Educational Characteristic
Gr. 8 Gr. 11
N Pct N Pct
Enrollment (continued)
Current Enrollment as PA resident after 10-1-11
0 0.0 0 0.0
Enrolled in school of residence after 10-1-10 but on/before 10-1-11
575 16.2 660 17.6
Enrolled in district of residence after 10-1-10 but on/before 10-1-11
304 8.6 285 7.6
Education in Non-Traditional Settings
Court/agency placed 20 0.6 41 1.1
Students with science scores used in state summaries
3,554 3,742
TEST ACCOMMODATIONS PROVIDED
School personnel supplied information regarding accommodations that a student may have received while taking the PSSA-M. Accommodations, classified in terms of presentation, response, setting, and timing, enable students to better manage disabilities that hinder their ability to learn and respond to assessments. An accommodations manual entitled PSSA, PSSA-M, and Keystone (paper/pencil) Accommodations Guidelines for Students with IEPs and Students with 504 Plans was updated for use with the 2012 PSSA and PSSA-M. The manual can be accessed at www.education.state.pa.us. On the left side, select “Programs,” “Programs O–R,” “Pennsylvania System of School Assessment (PSSA),” and then “Testing Accommodations & Security.”
The frequency with which these accommodations were utilized is summarized separately by subject area for each accommodation category in Tables 10–4M through 10–7S. Table values are based on all scored students who contributed to state summary statistics. Note that a glossary of accommodation terms as applied to the PSSA is provided in Table 10–10.
PRESENTATION ACCOMMODATIONS RECEIVED
Presentation Accommodations are those that provide alternate ways for students to access and process printed instructional material and assessments. These include auditory, tactile, visual, and combined auditory/visual modes of presentation. The number of presentation accommodations provided in the 2012 PSSA-M varied by subject as follows: mathematics and science, 13, and reading, 9. As depicted in Tables 10–4M, 10–4R, and 10–4S, the actual frequencies were quite low, generally representing less than five-tenths of one percent of assessed students statewide. The most notable exceptions were test directions read aloud (each subject), and test items/questions read aloud (mathematics and science only).

Chapter Ten: Summary Demographic, Program, and Accommodation Data for the 2012 PSSA-Modified
2012 PSSA-M Technical Report Page 87
RESPONSE ACCOMMODATIONS RECEIVED
Response Accommodations permit students to complete assignments, tests, and activities in different ways to solve or organize problems using some type of assistive device or organizer. The number of response accommodations provided in the 2012 PSSA-M varied by subject as follows: mathematics and science, 12, and reading, 9. Tables 10–5M, 10–5R, and 10–5S summarize the frequency with which these accommodations were utilized, most of which are quite low, typically representing less than five-tenths of one percent of assessed students statewide.
SETTING ACCOMMODATIONS RECEIVED
Setting Accommodations permit a change in location in which a student receives instruction or participates in an assessment. There were four categories of setting accommodations in 2012. As depicted in Tables 10–6M, 10–6R, and 10–6S, small group testing and testing in a separate setting were the most commonly used accommodations for each subject, and in fact were the most heavily used of all accommodations provided to students.
TIMING ACCOMMODATIONS RECEIVED
Timing Accommodations involve a change in the allowable length of time to complete assignments or assessments, including the way in which time is organized. There were three categories of timing accommodations in 2012. As depicted in Tables 10–7M, 10–7R, and 10–7S, the most common accommodations were extended time and frequent breaks.
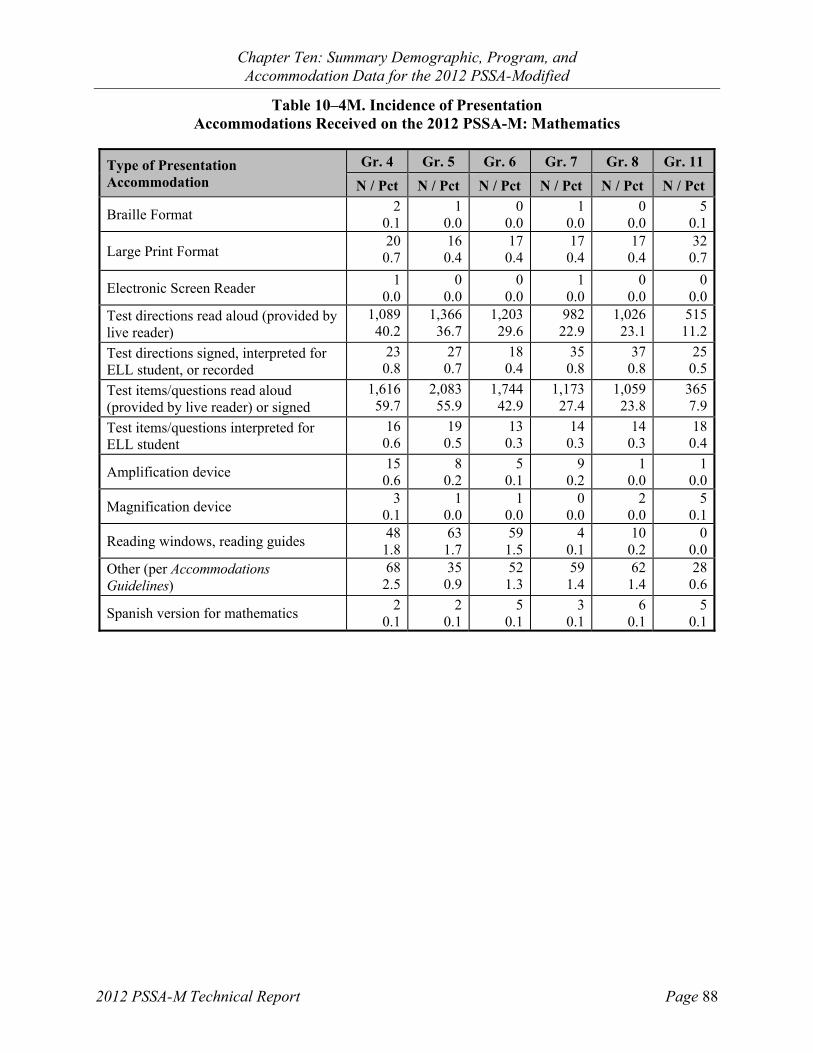
Chapter Ten: Summary Demographic, Program, and Accommodation Data for the 2012 PSSA-Modified
2012 PSSA-M Technical Report Page 88
Table 10–4M. Incidence of Presentation Accommodations Received on the 2012 PSSA-M: Mathematics
Type of Presentation Accommodation
Gr. 4 Gr. 5 Gr. 6 Gr. 7 Gr. 8 Gr. 11
N / Pct N / Pct N / Pct N / Pct N / Pct N / Pct
Braille Format 2
0.11
0.00
0.01
0.0 0
0.0 5
0.1
Large Print Format 20
0.716
0.417
0.417
0.4 17
0.4 32
0.7
Electronic Screen Reader 1
0.00
0.00
0.01
0.0 0
0.0 0
0.0Test directions read aloud (provided by live reader)
1,089 40.2
1,366 36.7
1,203 29.6
982 22.9
1,026 23.1
51511.2
Test directions signed, interpreted for ELL student, or recorded
23 0.8
27 0.7
18 0.4
35 0.8
37 0.8
250.5
Test items/questions read aloud (provided by live reader) or signed
1,616 59.7
2,083 55.9
1,744 42.9
1,173 27.4
1,059 23.8
3657.9
Test items/questions interpreted for ELL student
16 0.6
19 0.5
13 0.3
14 0.3
14 0.3
180.4
Amplification device 15
0.68
0.25
0.19
0.2 1
0.0 1
0.0
Magnification device 3
0.11
0.01
0.00
0.0 2
0.0 5
0.1
Reading windows, reading guides 48
1.863
1.759
1.54
0.1 10
0.2 0
0.0Other (per Accommodations Guidelines)
68 2.5
35 0.9
52 1.3
59 1.4
62 1.4
280.6
Spanish version for mathematics 2
0.12
0.15
0.13
0.1 6
0.1 5
0.1

Chapter Ten: Summary Demographic, Program, and Accommodation Data for the 2012 PSSA-Modified
2012 PSSA-M Technical Report Page 89
Table 10–4R. Incidence of Presentation Accommodations Received on the 2012 PSSA-M: Reading
Type of Presentation Accommodation
Gr. 4 Gr. 5 Gr. 6 Gr. 7 Gr. 8 Gr. 11
N / Pct N / Pct N / Pct N / Pct N / Pct N / Pct
Braille Format 1
0.03
0.10
0.01
0.0 2
0.0 3
0.1
Large Print Format 19
0.516
0.322
0.521
0.5 21
0.5 31
0.7
Electronic Screen Reader 0
0.00
0.00
0.02
0.0 0
0.0 1
0.0Test directions read aloud (provided by live reader)
1,443 38.9
1,693 36.2
1,238 27.3
1,008 22.1
938 21.8
45110.6
Test directions signed, interpreted for ELL student, or recorded
29 0.8
24 0.5
17 0.4
34 0.7
28 0.7
250.6
Amplification device 19
0.525
0.56
0.16
0.1 0
0.0 3
0.1
Magnification device 2
0.12
0.01
0.00
0.0 2
0.0 4
0.1
Reading windows, reading guides 253 6.8
244 5.2
150 3.3
29 0.6
19 0.4
30.1
Other (per Accommodations Guidelines)
78 2.1
58 1.2
62 1.4
75 1.6
64 1.5
400.9
Table 10–4S. Incidence of Presentation Accommodations Received on the 2012 PSSA-M: Science
Type of Presentation Accommodation
Gr. 8 Gr. 11
N Pct N Pct
Braille Format 1 0.0 3 0.1Large Print Format 21 0.6 15 0.4Electronic Screen Reader 0 0.0 0 0.0Test directions read aloud (provided by live reader)
652 18.3 320 8.6
Test directions signed, interpreted for ELL student, or recorded
23 0.6 17 0.5
Test items/questions read aloud (provided by live reader) or signed
733 20.6 280 7.5
Test items/questions interpreted for ELL student
8 0.2 8 0.2
Amplification device 1 0.0 5 0.1Magnification device 1 0.0 2 0.1Reading windows, reading guides 3 0.1 0 0.0Other (per Accommodations Guidelines) 30 0.8 24 0.6Spanish version for science 5 0.1 6 0.2

Chapter Ten: Summary Demographic, Program, and Accommodation Data for the 2012 PSSA-Modified
2012 PSSA-M Technical Report Page 90
Table 10–5M. Incidence of Response Accommodations Received on the 2012 PSSA-M: Mathematics
Type of Response Accommodation
Gr. 4 Gr. 5 Gr. 6 Gr. 7 Gr. 8 Gr. 11
N /Pct N / Pct N / Pct N / Pct N / Pct N / PctTest administrator marked multiple-choice responses at student’s direction
34 1.3
46 1.2
41 1.0
26 0.6
24 0.5
120.3
Test administrator scribed open-ended responses at student’s direction
100 3.7
120 3.2
71 1.7
23 0.5
47 1.1
130.3
Test administrator transcribed student responses
38 1.4
42 1.1
36 0.9
30 0.7
22 0.5
300.7
Qualified interpreter for ELL 1
0.01
0.01
0.00
0.0 1
0.0 1
0.0Keyboard, word processor, or computer
0 0.0
2 0.1
2 0.0
2 0.0
4 0.1
40.1
Brailler/Notetaker 1
0.00
0.00
0.00
0.0 1
0.0 4
0.1
Augmentative communication device 0
0.00
0.00
0.01
0.0 0
0.0 0
0.0
Audio recording of student responses 0
0.00
0.00
0.00
0.0 0
0.0 0
0.0
Electronic Screen Reader 0
0.00
0.00
0.01
0.0 1
0.0 0
0.0
Manipulative 69
2.523
0.620
0.50
0.0 1
0.0 1
0.0
Translation dictionary for ELL student 0
0.01
0.00
0.0 2
0.0 2
0.0 0
0.0
Other (approved by PDE) 15
0.611
0.328
0.723
0.5 29
0.7 5
0.1
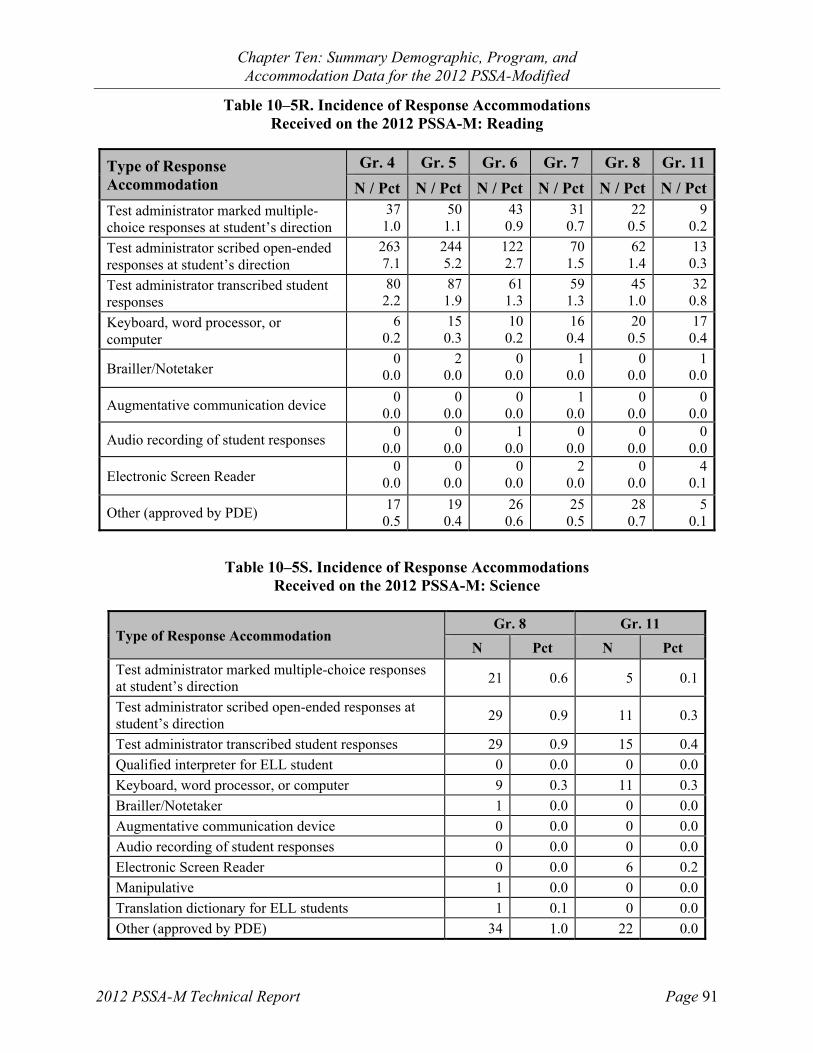
Chapter Ten: Summary Demographic, Program, and Accommodation Data for the 2012 PSSA-Modified
2012 PSSA-M Technical Report Page 91
Table 10–5R. Incidence of Response Accommodations Received on the 2012 PSSA-M: Reading
Type of Response Accommodation
Gr. 4 Gr. 5 Gr. 6 Gr. 7 Gr. 8 Gr. 11
N / Pct N / Pct N / Pct N / Pct N / Pct N / PctTest administrator marked multiple-choice responses at student’s direction
37 1.0
50 1.1
43 0.9
31 0.7
22 0.5
90.2
Test administrator scribed open-ended responses at student’s direction
263 7.1
244 5.2
122 2.7
70 1.5
62 1.4
130.3
Test administrator transcribed student responses
80 2.2
87 1.9
61 1.3
59 1.3
45 1.0
320.8
Keyboard, word processor, or computer
6 0.2
15 0.3
10 0.2
16 0.4
20 0.5
170.4
Brailler/Notetaker 0
0.02
0.00
0.01
0.0 0
0.0 1
0.0
Augmentative communication device 0
0.00
0.00
0.01
0.0 0
0.0 0
0.0
Audio recording of student responses 0
0.00
0.01
0.00
0.0 0
0.0 0
0.0
Electronic Screen Reader 0
0.00
0.00
0.02
0.0 0
0.0 4
0.1
Other (approved by PDE) 17
0.519
0.426
0.625
0.5 28
0.7 5
0.1
Table 10–5S. Incidence of Response Accommodations Received on the 2012 PSSA-M: Science
Type of Response Accommodation Gr. 8 Gr. 11
N Pct N Pct
Test administrator marked multiple-choice responses at student’s direction
21 0.6 5 0.1
Test administrator scribed open-ended responses at student’s direction
29 0.9 11 0.3
Test administrator transcribed student responses 29 0.9 15 0.4
Qualified interpreter for ELL student 0 0.0 0 0.0
Keyboard, word processor, or computer 9 0.3 11 0.3
Brailler/Notetaker 1 0.0 0 0.0
Augmentative communication device 0 0.0 0 0.0
Audio recording of student responses 0 0.0 0 0.0
Electronic Screen Reader 0 0.0 6 0.2
Manipulative 1 0.0 0 0.0
Translation dictionary for ELL students 1 0.1 0 0.0
Other (approved by PDE) 34 1.0 22 0.0

Chapter Ten: Summary Demographic, Program, and Accommodation Data for the 2012 PSSA-Modified
2012 PSSA-M Technical Report Page 92
Table 10–6M. Incidence of Setting Accommodations Received on the 2012 PSSA-M: Mathematics
Type of Setting Accommodation
Gr. 4 Gr. 5 Gr. 6 Gr. 7 Gr. 8 Gr. 11
N / Pct N / Pct N / Pct N / Pct N / Pct N / Pct
Hospital/Home Testing 4
0.14
0.12
0.012
0.3 11
0.2 13
0.3
Separate Setting 1,771 65.4
2,324 62.4
1,986 48.9
1,764 41.2
1,832 41.2
1,39230.2
Small Group Testing 2,047 75.6
2,831 76.0
2,918 71.9
2,719 63.5
2,720 61.2
2,36451.3
Other (PDE Approved) 17
0.612
0.324
0.614
0.3 23
0.5 10
0.2
Table 10–6R. Incidence of Setting Accommodations Received on the 2012 PSSA-M: Reading
Type of Setting Accommodation
Gr. 4 Gr. 5 Gr. 6 Gr. 7 Gr. 8 Gr. 11
N / Pct N / Pct N / Pct N / Pct N / Pct N / Pct
Hospital/Home Testing 8
0.24
0.12
0.010
0.2 13
0.3 12
0.3
Separate Setting 2,484 66.9
2,961 63.4
2,194 48.3
1,908 41.8
1,800 41.8
1,28730.2
Small Group Testing 2,834 76.4
3,550 76.0
3,265 71.9
2,895 63.3
2,666 61.9
2,20651.8
Other (PDE Approved) 14
0.422
0.524
0.513
0.3 23
0.5 13
0.3
Table 10–6S. Incidence of Setting Accommodations Received on the 2012 PSSA-M: Science
Type of Setting Accommodation Gr. 8 Gr. 11
N Pct N Pct
Hospital/Home Testing 7 0.2 8 0.2
Separate Setting 1,268 35.7 927 24.8
Small Group Testing 1,883 53.0 1,640 43.8
Other (PDE Approved) 10 0.3 5 0.1
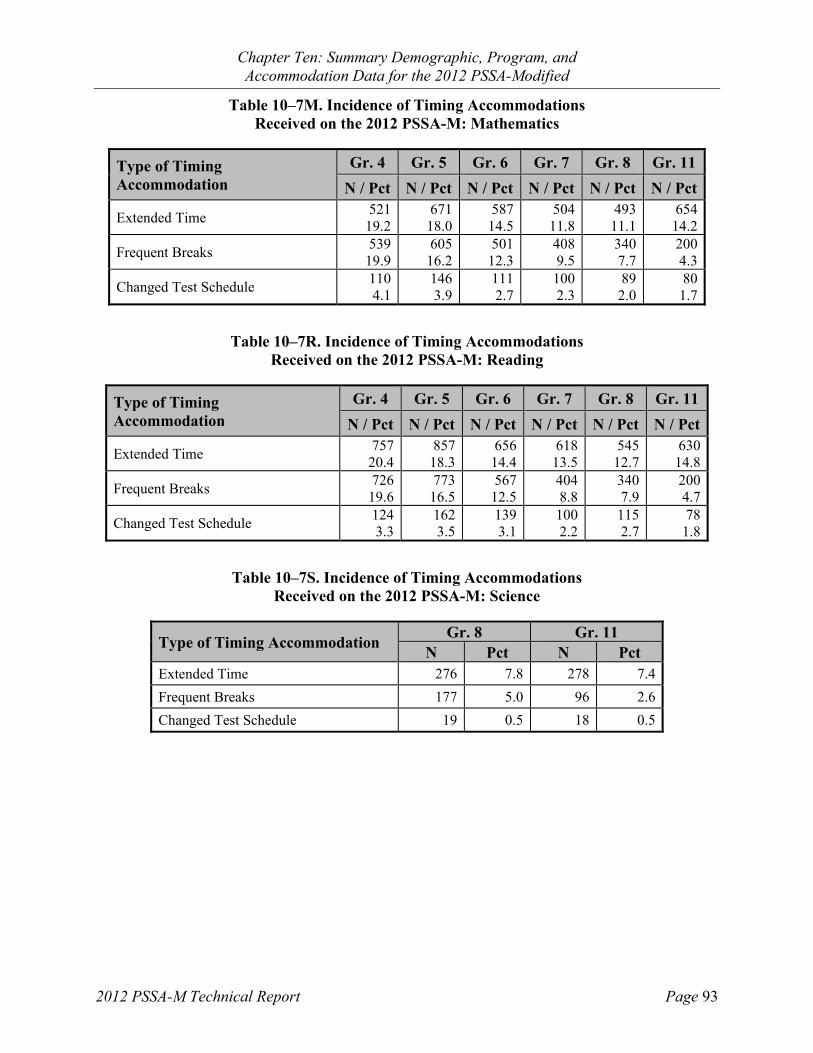
Chapter Ten: Summary Demographic, Program, and Accommodation Data for the 2012 PSSA-Modified
2012 PSSA-M Technical Report Page 93
Table 10–7M. Incidence of Timing Accommodations Received on the 2012 PSSA-M: Mathematics
Type of Timing Accommodation
Gr. 4 Gr. 5 Gr. 6 Gr. 7 Gr. 8 Gr. 11
N / Pct N / Pct N / Pct N / Pct N / Pct N / Pct
Extended Time 521
19.2671
18.0587
14.5504
11.8 493
11.1 654
14.2
Frequent Breaks 539
19.9605
16.2501
12.3408 9.5
340 7.7
2004.3
Changed Test Schedule 110 4.1
146 3.9
111 2.7
100 2.3
89 2.0
801.7
Table 10–7R. Incidence of Timing Accommodations Received on the 2012 PSSA-M: Reading
Type of Timing Accommodation
Gr. 4 Gr. 5 Gr. 6 Gr. 7 Gr. 8 Gr. 11
N / Pct N / Pct N / Pct N / Pct N / Pct N / Pct
Extended Time 757
20.4857
18.3656
14.4618
13.5 545
12.7 630
14.8
Frequent Breaks 726
19.6773
16.5567
12.5404 8.8
340 7.9
2004.7
Changed Test Schedule 124 3.3
162 3.5
139 3.1
100 2.2
115 2.7
781.8
Table 10–7S. Incidence of Timing Accommodations Received on the 2012 PSSA-M: Science
Type of Timing Accommodation Gr. 8 Gr. 11
N Pct N Pct Extended Time 276 7.8 278 7.4
Frequent Breaks 177 5.0 96 2.6
Changed Test Schedule 19 0.5 18 0.5

Chapter Ten: Summary Demographic, Program, and Accommodation Data for the 2012 PSSA-Modified
2012 PSSA-M Technical Report Page 94
ACCOMMODATION RATE
The number of possible accommodations available to a student ranged from 32 for mathematics and science to 25 for reading. The incidence of students receiving one or more of the available accommodations by subject area is provided in Tables 10–8M, 10–8R, and 10–8S. The category of Non-Accommodated refers to students who did not receive any accommodations during the testing.
The general pattern of findings for mathematics and reading reveals a consistently high percentage of students receiving an accommodation, which diminished across grade levels. Science also displayed a high incidence of students receiving an accommodation at grades 8 and 11, although slightly lower than for the other two subject areas.
Table 10–8M. Accommodation Rate on the 2012 PSSA-M: Mathematics
Student Subgroup Gr. 4 Gr. 5 Gr. 6 Gr. 7 Gr. 8 Gr. 11
N / Pct N / Pct N / Pct N / Pct N / Pct N / Pct
Non-Accommodated 411
15.2 570
15.3811
20.01,103 25.8
1,250 28.1
1,89141.1
Accommodated 2,297 84.8
3,156 84.7
3,250 80.0
3,180 74.2
3,194 71.9
2,71558.9
2,708 3,726 4,061 4,283 4,444 4,606
Table 10–8R. Accommodation Rate on the 2012 PSSA-M: Reading
Student Subgroup Gr. 4 Gr. 5 Gr. 6 Gr. 7 Gr. 8 Gr. 11
N / Pct N / Pct N / Pct N / Pct N / Pct N / Pct
Non-Accommodated 538
14.5 730
15.6971
21.41,171 25.6
1,184 27.5
1,72140.4
Accommodated 3,173 85.5
3,942 84.4
3,572 78.6
3,399 74.4
3,124 72.5
2,53459.6
3,711 4,672 4,543 4,570 4,308 4,255
Table 10–8S. Accommodation Rate on the 2012 PSSA-M: Science
Student Subgroup Gr. 8 Gr. 11
N Pct N Pct
Non-Accommodated 1,305 36.7 1,868 49.9
Accommodated 2,249 63.3 1,874 50.1
3,554 3,742

Chapter Ten: Summary Demographic, Program, and Accommodation Data for the 2012 PSSA-Modified
2012 PSSA-M Technical Report Page 95
THE INCIDENCE OF ACCOMMODATIONS AND ELL STATUS
By definition, students qualifying to take the PSSA-M assessment have an IEP along with a history of very low achievement. These students often receive various accommodations to assist them in accessing and responding optimally in assessment situations. As observed in Tables 10–4M through 10–7S, the most frequently occurring accommodations for assessed students were the following:
Test directions read aloud
Test items/questions read aloud or signed (mathematics and science only)
Tested in separate setting
Small group testing
Extended time
Frequent breaks
Because the accommodations with the largest frequencies can potentially supply the most stable data when broken out for subgroup analysis, these were selected for display in Tables 10–9M, 10–9R, and 10–9S. For purposes of this analysis, an English Language Learner (ELL) was a student classified as ELL and enrolled in a U.S. school on or before April 15, 2011. All other assessed students, including those who exited an ESL/bilingual program and in the first or second year of monitoring, were regarded as non-ELL. Students coded as ELL and enrolled in a U.S. school after April 15, 2011, are excluded from state summary statistics as stated earlier in this chapter.
Because the combination of accommodations listed in the tables and grades assessed differs somewhat by subject area, it is useful to reference the number of instances of accommodations for which the results in the tables apply. For example, mathematics with six accommodations displayed and six assessed grade levels results in 36 possible instances. There are 30 instances for reading and 12 for science. The total number of instances across the three subjects is 78.
To evaluate the two groups with respect to frequency rate, a choice was made to use a difference of 5 or more percentage points as a criterion. In many instances the percentage difference was of little practical significance (from zero to only several percentage points). The largest difference between the two groups was observed for small group testing, which reached as high as 20 percent for grade 8 mathematics and grade 7 reading.
Of the 78 possible comparisons overall, the non-ELL students received a larger percentage of accommodations (by a margin of at least five percent) in 32 instances, ELL students in three instances, and in the 43 remaining instances the difference between Non-ELL and ELL was less than 5 percent.

Chapter Ten: Summary Demographic, Program, and Accommodation Data for the 2012 PSSA-Modified
2012 PSSA-M Technical Report Page 96
The tendency for accommodations to occur more frequently for a particular group of students is summarized below for each of the accommodations evaluated in this analysis.
Directions read aloud occurred more frequently for the Non-ELL group in five of 14 instances: mathematics (Grades 6, 8), reading (Grades 6–8), science (none).
Test items/questions read aloud or signed, an accommodation available only for mathematics and science, occurred more frequently for the non-ELL group in four of eight instances: mathematics (Grades 5–7) and science (Grade 8). A higher frequency for ELL students occurred in only one of the eight instances: mathematics (Grade 4).
Students tested in a separate setting occurred more frequently for the non-ELL group than for the ELL group in six of 14 instances: mathematics and reading (Grades 6–7) and science (Grades 8, 11). A higher frequency for ELL students only occurred in two of 14 instances: mathematics and reading (Grade 4).
Students tested in a small group setting occurred more frequently for the non-ELL group than for the ELL group in 10 of 14 instances: mathematics and reading (Grades 6–8, 11) and science (Grades 8, 11).
Extended time occurred more frequently for the Non-ELL group in five of 14 instances: mathematics (Grades 6–8), reading (Grades 6–7), science (none).
Frequent breaks occurred more frequently for the non-ELL group than for the ELL group in two of 14 instances: mathematics and reading (Grade 4), science (none).
Tables 10–9M, 10–9R, and 10–9S present the number and percentage of non-ELL and ELL students who received the selected accommodations for each of the assessed grade levels.

Chapter Ten: Summary Demographic, Program, and Accommodation Data for the 2012 PSSA-Modified
2012 PSSA-M Technical Report Page 97
Table 10–9M. Incidence of Non-ELL and ELL Students Receiving Selected Accommodations: Mathematics
Accommodation Received Non-ELL Students
ELL Students
G.4 N Pct N Pct
Test directions read aloud 1,035 40.3 54 38.6
Test items/ questions read aloud or signed
1,524 59.3 92 65.7
Tested in separate setting 1,670 65.0 101 72.1
Small group testing 1,936 75.4 111 79.3
Extended time 492 19.2 29 20.7
Frequent breaks 514 20.0 25 17.9
Column N for Gr. 4 2,568 140
Gr. 5 N Pct N Pct
Test directions read aloud 1,299 36.6 67 37.2
Test items/ questions read aloud or signed
1,993 56.2 90 50.0
Tested in separate setting 2,218 62.5 106 58.9
Small group testing 2,698 76.1 133 73.9
Extended time 638 18.0 33 18.3
Frequent breaks 580 16.4 25 13.9
Column N for Gr. 5 3,546 180
Gr. 6 N Pct N Pct
Test directions read aloud 1,168 30.0 35 21.5
Test items/ questions read aloud or signed
1,682 43.2 62 38.0
Tested in separate setting 1,919 49.2 67 41.1
Small group testing 2,829 72.6 89 54.6
Extended time 572 14.7 15 9.2
Frequent breaks 489 12.5 12 7.4
Column N for Gr. 6 3,898 163
Gr. 7 N Pct N Pct
Test directions read aloud 946 23.0 36 20.2
Test items/ questions read aloud or signed
1,134 27.6 39 21.9
Tested in separate setting 1,705 41.5 59 33.1
Small group testing 2,631 64.1 88 49.4
Extended time 494 12.0 10 5.6
Frequent breaks 397 9.7 11 6.2
Column N for Gr. 7 4,105 178

Chapter Ten: Summary Demographic, Program, and Accommodation Data for the 2012 PSSA-Modified
2012 PSSA-M Technical Report Page 98
Table 10–9M (continued). Incidence of Non-ELL and ELL Students Receiving Selected Accommodations: Mathematics
Accommodation Received Non-ELL Students
ELL Students
Gr. 8 N Pct N Pct
Test directions read aloud 1,002 23.3 24 16.7
Test items/ questions read aloud or signed
1,025 23.8 34 23.6
Tested in separate setting 1,777 41.3 55 38.2
Small group testing 2,660 61.9 60 41.7
Extended time 484 11.3 9 6.3
Frequent breaks 335 7.8 5 3.5
Column N for Gr. 8 4,300 144
Gr. 11 N Pct N Pct
Test directions read aloud 505 11.2 10 9.8
Test items/ questions read aloud or signed
358 7.9 7 6.9
Tested in separate setting 1,366 30.3 26 25.5
Small group testing 2,324 51.6 40 39.2
Extended time 643 14.3 11 10.8
Frequent breaks 196 4.4 4 3.9
Column N for Gr. 11 4,504 102

Chapter Ten: Summary Demographic, Program, and Accommodation Data for the 2012 PSSA-Modified
2012 PSSA-M Technical Report Page 99
Table 10–9R. Incidence of Non-ELL and ELL Students Receiving Selected Accommodations: Reading
Accommodation Received Non-ELL Students
ELL Students
Gr. 4 N Pct N Pct
Test directions read aloud 1,369 38.8 74 40.2
Tested in separate setting 2,350 66.6 134 72.8
Small group testing 2,689 76.2 145 78.8
Extended time 717 20.3 40 21.7
Frequent breaks 698 19.8 28 15.2
Column N for Gr. 4 3,527 184
Gr. 5 N Pct N Pct
Test directions read aloud 1,611 36.1 82 39.2
Tested in separate setting 2,828 63.4 133 63.6
Small group testing 3,393 76.0 157 75.1
Extended time 816 18.3 41 19.6
Frequent breaks 739 16.6 34 16.3
Column N for Gr. 5 4,463 209
Gr. 6 N Pct N Pct
Test directions read aloud 1,198 27.5 40 22.3
Tested in separate setting 2,120 48.6 74 41.3
Small group testing 3,160 72.4 105 58.7
Extended time 641 14.7 15 8.4
Frequent breaks 556 12.7 11 6.1
Column N for Gr. 6 4,364 179
Gr. 7 N Pct N Pct
Test directions read aloud 977 22.4 31 15.0
Tested in separate setting 1,833 42.0 75 36.4
Small group testing 2,804 64.3 91 44.2
Extended time 601 13.8 17 8.3
Frequent breaks 392 9.0 12 5.8
Column N for Gr. 7 4,364 206

Chapter Ten: Summary Demographic, Program, and Accommodation Data for the 2012 PSSA-Modified
2012 PSSA-M Technical Report Page 100
Table 10–9R (continued). Incidence of Non-ELL and ELL Students Receiving Selected Accommodations: Reading
Accommodation Received Non-ELL Students
ELL Students
Gr. 8 N Pct N Pct
Test directions read aloud 914 22.1 24 14.7
Tested in separate setting 1,737 41.9 63 38.7
Small group testing 2,591 62.5 75 46.0
Extended time 529 12.8 16 9.8
Frequent breaks 333 8.0 7 4.3
Column N for Gr. 8 4,145 163
Gr. 11 N Pct N Pct
Test directions read aloud 438 10.5 13 12.7
Tested in separate setting 1,254 30.2 33 32.4
Small group testing 2,159 52.0 47 46.1
Extended time 616 14.8 14 13.7
Frequent breaks 197 4.7 3 2.9
Column N for Gr. 11 4,153 102

Chapter Ten: Summary Demographic, Program, and Accommodation Data for the 2012 PSSA-Modified
2012 PSSA-M Technical Report Page 101
Table 10–9S. Incidence of Non-ELL and ELL Students Receiving Selected Accommodations: Science
Accommodation Received Non-ELL Students ELL Students
Gr. 8 N Pct N Pct
Test directions read aloud 627 18.4 25 17.5
Test items/ questions read aloud or signed
711 20.8 22 15.4
Tested in separate setting 1,226 35.9 42 29.4
Small group testing 1,823 53.4 60 42.0
Extended time 266 7.8 10 7.0
Frequent breaks 168 4.9 9 6.3
Column N for Gr. 8 3,411 143
Gr. 11 N Pct N Pct
Test directions read aloud 312 8.5 8 9.4
Test items/ questions read aloud or signed
277 7.6 3 3.5
Tested in separate setting 911 24.9 16 18.8
Small group testing 1,613 44.1 27 31.8
Extended time 274 7.5 4 4.7
Frequent breaks 95 2.6 1 1.2
Column N for Gr. 11 3,657 85

Chapter Ten: Summary Demographic, Program, and Accommodation Data for the 2012 PSSA-Modified
2012 PSSA-M Technical Report Page 102
GLOSSARY OF ACCOMMODATIONS TERMS
Table 10–10 provides brief descriptions of accommodations terms as they are used in the PSSA and PSSA-M. School personnel identified the accommodations that a student received by marking the relevant bubble(s) in the student answer document as noted in the left column. The right column contains an explanation of each accommodation abstracted from the PSSA, PSSA-M, and Keystone (paper/pencil) Accommodations Guidelines for Students with IEPs and Students with 504 Plans. This manual can be found at www.education.state.pa.us. On the left side, select “Programs,” “Programs O–R,” “Pennsylvania System of School Assessment (PSSA),” and then “Testing Accommodations & Security.”
Table 10–10. Glossary of Accommodations Terms as Applied in the PSSA and PSSA-M
Type of Testing Accommodation Explanation
Student used the following Presentation Accommodations
Braille format Students may use a Braille format of the test. Answers must then be transcribed into the answer booklet without alteration.
Large print format Students with visual impairments may use a large print format. Answers must then be transcribed into the answer booklet without alteration.
Magnification device Devices to magnify print may be used for students with visual impairments and/or print disabilities.
Reading windows, reading guides Students with visual impairments may use reading windows and reading guides in all assessments.
Electronic screen reader (PDE approval required)
Students with a severe visual disability may use an electronic screen reader; however, PDE must approve the program and functions prior to the test window.
Sign language interpreter Deaf/hearing impaired students may receive test directions from a qualified interpreter. Signing is also permitted for essay prompts in writing and all items in mathematics and science.
Qualified interpreter for ELL student An interpreter may translate directions or clarify instructions for the assessments. The interpreter may translate, not define, specific words or test questions on the mathematics and science tests. On the reading, the interpreter may only translate directions and may not translate or define words in the passages or test questions.
Test directions read aloud, signed, or recorded (provided by live reader)
Directions for all PSSA tests may be read aloud, signed, or presented by audio recording.

Chapter Ten: Summary Demographic, Program, and Accommodation Data for the 2012 PSSA-Modified
2012 PSSA-M Technical Report Page 103
Table 10–10 (continued). Glossary of Accommodations Terms as Applied in the PSSA and PSSA-M
Type of Testing Accommodation Explanation
Test items/questions read aloud or signed (provided by live reader)
Students unable to decode text visually may have items/questions read aloud for mathematics and science only; however, words may not be defined.
Test prompts recorded Writing essay prompts may be presented by audio recording.
Amplification device In addition to hearing aids, students may require an amplification device to enhance clarity.
Audio CD Format An audio CD version of mathematics and science test items/questions may be taken by students with severe hearing disabilities as documented by their IEP.
Other (PDE approval required) Other presentation accommodations indicated in the Accommodation Guidelines may be provided; however, PDE approval is required prior to the test window.
Spanish version for mathematics and science
Students whose first language is Spanish and who have been enrolled in U.S. schools for fewer than 3 years may take this version.
Student used the following Response Accommodations
Brailler/Note taker (per Accommodations Guidelines)
Students using this device as part of their regular instructional program may use it on the PSSA; however, it may only be used without a thesaurus, spelling or grammar checker, etc.
Test administrator scribed open-ended responses at student’s direction
A test administrator may record word-for-word what a student dictates directly into the PSSA test booklet. This includes MC and OE responses for reading, mathematics, and science. For writing, this includes MC items only.
Test administrator marked multiple-choice responses at student’s direction
A test administrator may mark an answer booklet at the direction of a student (e.g., a student may point to a multiple-choice answer and the test administrator will mark the response in the answer booklet).
Test administrator transcribed (copied) student responses (per Accommodations Guidelines)
For writing prompts, the test administrator may transcribe handwriting that is extremely difficult to read. On reading, mathematics, or science assessments, illegible handwriting may be transcribed for open-ended items only.
Qualified Interpreter for ELL student (translated, transcribed, and/or scribed student responses)
A qualified interpreter may interpret a student’s non-English oral responses into written English for mathematics and science assessments. Interpreters are not permitted to make corrections or change the meaning of the response.

Chapter Ten: Summary Demographic, Program, and Accommodation Data for the 2012 PSSA-Modified
2012 PSSA-M Technical Report Page 104
Table 10–10 (continued). Glossary of Accommodations Terms as Applied in the PSSA and PSSA-M
Type of Testing Accommodation Explanation
Augmentative communication device Students with severe communication difficulties may use a special device to convey responses, which must be transcribed into the test booklet by the test administrator.
Keyboard, word processor, or computer (per Accommodations Guidelines)
This is an allowable accommodation as a typing function only for students with the identified need. Supports such as dictionaries, thesauri, spell checkers, and grammar checkers must be turned off. Answers must then be transcribed into the answer booklet without alteration.
Audio recording of student responses (per Accommodations Guidelines)
An electronic recording device may be used to record responses, which must be transcribed into the test booklet by the test administrator. (Students who are unable to use a pencil or have illegible handwriting may answer reading, mathematics, and writing multiple-choice questions orally. Answers must be recorded in the answer booklet without alteration during the testing period.)
Manipulative (Cranmer Abacus, number line)
An adaptive calculator or a Cranmer Abacus may be used for the calculator portion of the test only. Eligible students are only those with blindness, low vision, or partial sight.
Translation dictionary for ELL student A word-to-word dictionary that translates native language to English (or vice versa) without word definitions or pictures is allowed on any portion of the mathematics test and open-ended section of the reading test (but not for the reading passage or multiple-choice items). It cannot be used on any section of the writing test.
Electronic screen reader (PDE approval required)
Students with blindness or extremely low vision may use computer software that converts text to synthesized speech or Braille.
Other (per Accommodations Guidelines or PDE approval)
Other accommodations may be appropriate and available if they do not compromise the integrity of the assessment. Documentation must be provided to PDE.
Student used the following Setting Accommodations
Hospital/home testing A student who is confined to a hospital or to home during the testing window may be tested in that environment.
Tested in a separate setting A separate room may be used to reduce distraction.
Small group testing Some students may require a test setting with fewer students or a setting apart from all other students.
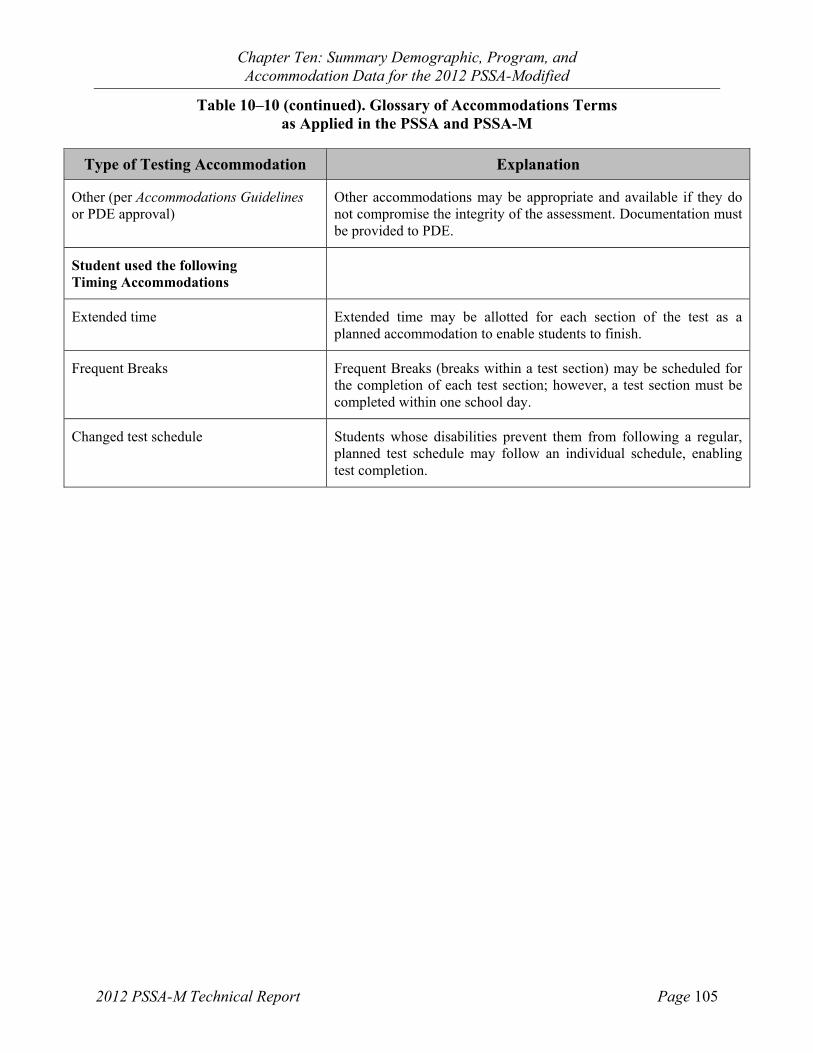
Chapter Ten: Summary Demographic, Program, and Accommodation Data for the 2012 PSSA-Modified
2012 PSSA-M Technical Report Page 105
Table 10–10 (continued). Glossary of Accommodations Terms as Applied in the PSSA and PSSA-M
Type of Testing Accommodation Explanation
Other (per Accommodations Guidelines or PDE approval)
Other accommodations may be appropriate and available if they do not compromise the integrity of the assessment. Documentation must be provided to PDE.
Student used the following Timing Accommodations
Extended time Extended time may be allotted for each section of the test as a planned accommodation to enable students to finish.
Frequent Breaks Frequent Breaks (breaks within a test section) may be scheduled for the completion of each test section; however, a test section must be completed within one school day.
Changed test schedule Students whose disabilities prevent them from following a regular, planned test schedule may follow an individual schedule, enabling test completion.

Chapter Ten: Summary Demographic, Program, and Accommodation Data for the 2012 PSSA-Modified
2012 PSSA-M Technical Report Page 106

Chapter Eleven: Classical Item Statistics
2012 PSSA-M Technical Report Page 107
Chapter Eleven: Classical Item Statistics This chapter provides an overview of the two most familiar item-level statistics obtained from any classical (traditional) item analysis: item difficulty and item discrimination. The following results pertain only to operational PSSA-M items (i.e., those that contributed to a student’s total test score). Related information is discussed elsewhere in this document. Specifically, Rasch item statistics are discussed in Chapter Twelve and test-level statistics in Chapter Seventeen. An analysis of item omit rates is also provided.
ITEM-LEVEL STATISTICS
Appendix I provides classical item statistics for all PSSA-M items. Results are organized by subject and grade. These statistics represent the item characteristics most often used to determine whether an item functioned properly and/or how a group of students performed on a particular item. The item statistics in the appendices include p-values for multiple-choice (MC) items and item means for open-ended (OE) items (indicators of item difficulty); point-biserial correlations for MC items and item-test correlations for OE items (indicators of item discrimination); and the proportion of students selecting each MC item option or earning each OE item score point.
ITEM DIFFICULTY
Item difficulty is an important consideration for the PSSA-M tests because of the ranging achievement levels of students in Pennsylvania (Below Basic-M, Basic-M, Proficient-M, and Advanced-M). At the most general level, an item’s difficulty is indicated by its mean score in some specified group (e.g., grade level).
n
iix
nx
1
1
In the mean score formula above, the individual item scores (xi) are summed and then divided by the total number of students (n). For multiple-choice items, student scores are represented by 0s and 1s (0 = wrong, 1 = right). With 0–1 scoring, the equation above also represents the number of students correctly answering the item divided by the total number of students. Therefore, this is also the proportion correct for the item, or as it is better known, the p-value. In theory, p-values can range from 0.0 to 1.0 on the proportion-correct scale. For example, if an item has a p-value of 0.89, it means 89 percent of the students answered the item correctly. Additionally, this value might also suggest that the item was relatively easy and/or the students who attempted the item were relatively high achievers. In other words, item difficulty and student ability are somewhat confounded.
For OE items, mean scores can range from the minimum possible score (usually zero) to the maximum possible score (four points in the case of mathematics). Sometimes a pseudo p-value is provided for an OE item. This is done by dividing the mean item score by the maximum possible item score.
The minimum and maximum extremes of the difficulty scale are never seen in applied practice. However, understanding what those values are helps illustrate that relatively lower values correspond to more difficult items and that relatively higher values correspond to easier items. (As a result of this, some assert that this index would be more accurately referred to as the item’s easiness.)

Chapter Eleven: Classical Item Statistics
2012 PSSA-M Technical Report Page 108
ITEM DISCRIMINATION
Discrimination is an important consideration for the PSSA-M because the use of more discriminating items on a test is associated with more reliable test scores. This means that score estimates will be more precise (i.e., there will be smaller confidence intervals around the scores) and that more accurate performance level placements will be made. The issues of reliability, confidence intervals, and performance level classifications are further discussed in Chapter Eighteen.
At the most general level, item discrimination indicates an item’s ability to differentiate between high achievers and low achievers. It is expected that students with high ability (i.e., those who perform well on the PSSA-M overall) would be more likely to answer any given PSSA-M item correctly, while students with low ability (i.e., those who perform poorly on the PSSA-M overall) would be more likely to answer the same item incorrectly. For the PSSA-M tests, Pearson’s product-moment correlation coefficient between item scores and test scores is used to indicate discrimination. (As commonly practiced, DRC removes the item score from the total score so that the resulting correlations will not be spuriously high.) The correlation coefficient can range from -1.0 to +1.0. If the aforementioned expectation is met (high-scoring students tend to get the item right while low-scoring students do not), the correlation between the item score and the total test score will be both positive and noticeably large in its magnitude (i.e., well above zero), meaning the item is a good discriminator between high- and low-ability students. This should be the case for all PSSA-M operational test items.
In summary, the correlation will be positive in value when the mean test score of the students answering the item correctly is higher than the mean test score of the students answering the item incorrectly.1 In other words, this indicates that students who did well on the total test tended to do well on the item as well. However, an interaction can exist between item discrimination and item difficulty. Items answered correctly (or incorrectly) by a large proportion of examinees (i.e., the items have extreme p-values) can have reduced power to discriminate, and thus, can have lower correlations.
Finally, discrimination for dichotomous MC items is typically referred to as the point-biserial correlation coefficient. For OE items, the term item-test correlation is sometimes used.
DISCRIMINATION ON DIFFICULTY SCATTERPLOTS
Figure 11–1 contains a series of scatterplots showing item discrimination values (y-axis) and item difficulty (x-axis) for each grade. Note that pseudo p-values (described above) are used to measure the difficulty of the OE items. These plots provide maximum information about item discrimination and difficulty in a single visual image for each PSSA-M test. This is because the x- and y-axes visually represent many important univariate distributional indices, including the following:
The minimum and maximum values are listed.
Mean scores are indicated by the red dot.
1 It is legitimate to view the point-biserial correlation as a standardized mean difference. A positive value indicates students who chose that response had a higher mean score than the average student; a negative value indicates students who chose that response had a lower than average mean score.

Chapter Eleven: Classical Item Statistics
2012 PSSA-M Technical Report Page 109
P25, P50, and P75 are indicated by the red lines.
Marginal “rugs” indicate the density of the individual data points.
The bivariate relationship between item discrimination (item-test correlations) and difficulty (item mean scores) is reflected by the scatterplots in these figures. However, it is often the case that items with extreme difficulties can have lower discrimination values, as can be revealed in these scatterplots.
OBSERVATIONS AND INTERPRETATIONS
From the difficulty distributions illustrated in the scatterplots, it can be seen that a wide range of item difficulties appeared on each PSSA-M test, which was a desired goal. To support the visuals, Table 11–1 provides break-out results for the MC and OE items. Additional summary statistics (for the MC items only) are provided in Table 11–2. The mean p-values for the MC items ranged from about 0.49–0.63, while the mean proportion-correct values for the OE items ranged from about 0.16–0.57. These means were generally lower than 0.65 (a typical mean p-value on the general PSSA tests). Relatively speaking, this suggests that the PSSA-M items were somewhat challenging for most students taking the PSSA-M, particularly at the higher grade levels. As noted earlier, lower p-values can reflect that the items are more difficult or that the achievement level of the students is lower (or both).
A small number of items had lower item discriminations (e.g., below 0.20). Some of these were observed on items that were very easy or very hard. The mean point-biserial correlations ranged from 0.27–0.37 and 0.36–0.53 for the MC and OE items, respectively. While these values are somewhat lower than those observed on the general PSSA tests (which is not surprising given the PSSA is a longer, more reliable test), most would probably consider these values acceptable. The OE correlations tended to be higher than the MC correlations, which again is not surprising because the OE items include more score points.
It is difficult to make global conclusions about overall test quality from the item statistics alone. With that caveat in mind, the results presented in this chapter suggest overall adequacy with respect to the PSSA-M items’ difficulty and discrimination. This in turn implies that the items generally functioned as expected for the population of students who took the PSSA-M.

Chapter Eleven: Classical Item Statistics
2012 PSSA-M Technical Report Page 110
Figure 11–1. Discrimination on Difficulty Scatterplots

Chapter Eleven: Classical Item Statistics
2012 PSSA-M Technical Report Page 111

Chapter Eleven: Classical Item Statistics
2012 PSSA-M Technical Report Page 112

Chapter Eleven: Classical Item Statistics
2012 PSSA-M Technical Report Page 113

Chapter Eleven: Classical Item Statistics
2012 PSSA-M Technical Report Page 114
Table 11–1. Sum and Mean Statistics for MC and OE Items
Multiple-Choice Items Open-Ended Items
Points Sum Mean
(%/100)
Mean
Points Sum Mean
(%/100)
Mean I-T
Corr. I-T
Corr.
Mat
hem
atic
s 4 30 19.005 0.634 0.320 8 1.990 0.249 0.514 5 30 18.396 0.613 0.297 8 1.819 0.227 0.457 6 30 15.387 0.513 0.268 8 1.772 0.222 0.466 7 30 16.059 0.535 0.301 8 1.942 0.243 0.524 8 30 16.382 0.546 0.295 8 1.958 0.245 0.520
11 30 15.323 0.511 0.299 8 1.244 0.155 0.532
Rea
din
g
4 30 14.581 0.486 0.311 6 2.806 0.468 0.502 5 30 16.697 0.557 0.373 6 3.090 0.515 0.525 6 30 17.609 0.587 0.354 6 2.743 0.457 0.457 7 30 16.568 0.552 0.332 6 2.689 0.448 0.490 8 30 16.625 0.554 0.286 6 3.400 0.567 0.527
11 30 19.046 0.635 0.329 6 3.183 0.530 0.499
Sci
. 8 30 18.279 0.609 0.298 4 1.861 0.465 0.356 11 30 15.611 0.520 0.342 4 1.499 0.375 0.417
Note. I-T Corr. is the item-test score correlation. The means for the I-T correlations were not computed using Fisher’s Z transformation. However, this is not expected to affect any conclusions based on these result.
Table 11–2. Additional Summary Statistics for MC Items Only
P-Value Point Biserial Min Max Mean Med Min Max Mean Med
Mat
hem
atic
s 4 0.33 0.92 0.63 0.64 0.18 0.47 0.32 0.32 5 0.24 0.97 0.61 0.62 0.06 0.46 0.30 0.31 6 0.26 0.93 0.51 0.48 0.06 0.46 0.27 0.27 7 0.21 0.85 0.54 0.53 0.14 0.45 0.30 0.30 8 0.27 0.85 0.55 0.52 0.16 0.41 0.29 0.29
11 0.27 0.84 0.51 0.47 0.07 0.46 0.30 0.31
Rea
din
g
4 0.31 0.71 0.49 0.46 0.13 0.50 0.31 0.30 5 0.37 0.79 0.56 0.56 0.22 0.51 0.37 0.37 6 0.33 0.79 0.59 0.59 0.13 0.50 0.35 0.35 7 0.39 0.84 0.55 0.54 0.17 0.45 0.33 0.34 8 0.30 0.83 0.55 0.54 0.14 0.46 0.29 0.30
11 0.30 0.91 0.63 0.63 0.17 0.50 0.33 0.32
Sci
. 8 0.29 0.86 0.61 0.63 -0.19 0.45 0.30 0.33
11 0.27 0.76 0.52 0.55 0.12 0.50 0.34 0.34
Note. Point biserials for operational items were positive when field tested.

Chapter Twelve: Rasch Item Calibration
2012 PSSA-M Technical Report Page 115
Chapter Twelve: Rasch Item Calibration The particular item response theory (IRT) model used for the PSSA-M is based on the work of Georg Rasch. Rasch models have had a long-standing presence in applied testing programs, and it has been the methodology continually used to calibrate PSSA-M items in recent history. IRT has several advantages over classical test theory, so it has become the standard procedure for analyzing item response data in large-scale assessments. However, IRT models make a number of strong assumptions related to dimensionality, local independence, and model-data fit. Resulting inferences derived from any application of IRT rests strongly on the degree to which the underlying assumptions are met.
This chapter outlines the procedures used for calibrating the operational PSSA-M items. Generally, item calibration is the process of assigning a difficulty-parameter estimate to each item on an assessment so that all items are placed onto a common scale. This chapter briefly introduces the Rasch model, reports the results from evaluations of the adequacy of the Rasch assumptions, and summarizes the Rasch item statistics for the PSSA-M tests. Additional Rasch procedures are discussed with respect to scale linking in Chapter Fifteen.
DESCRIPTION OF THE RASCH MODEL
The Rasch partial credit model (RPCM; Wright and Masters, 1982) was used to calibrate PSSA-M items because both multiple-choice (MC) and open-ended (OE) items were part of the assessment. The RPCM extends the Rasch model (Rasch, 1960) for dichotomous (0, 1) items so that it accommodates the polytomous OE item data. Under the RPCM, for a given item i with mi score categories, the probability of person n scoring x (x = 0, 1, 2,... mi) is given by:
,
)D(
)D(
=xXPim
=k
k
=jijn
x
=jijn
ni
0 0
0
exp
exp
where θn represents a student’s proficiency (ability) level, and Dij is the step difficulty of the jth step on item i. For dichotomous MC items, the RPCM reduces to the standard Rasch model and the single step difficulty is referred to as the item’s difficulty. The Rasch model predicts the probability of person n getting item i correct as follows:
. exp 1
exp1
ijn
ijnni D
D=XP
The Rasch model places both student ability and item difficulty (estimated in terms of log-odds or logits) on the same continuum. When the model assumptions are met, the Rasch model provides estimates of a person’s ability that are independent of the items employed in the assessment, and conversely, estimates item difficulty independently of the sample of examinees. (As noted in Chapter Eleven, interpretation of item p-values confounds item difficulty and student ability.)

Chapter Twelve: Rasch Item Calibration
2012 PSSA-M Technical Report Page 116
Software and Estimation Algorithm
Item calibration was implemented via WINSTEPS 3.54 computer program (Wright and Linacre, 2003), which employs unconditional (UCON), joint-maximum-likelihood estimation (JMLE).
Sample Characteristics
The characteristics of calibration samples are reported in Chapter Nine. These samples only include the students who attempted the tests. All omits (no response) and multiple responses (more than one response selected) were scored as incorrect answers (coded as 0s) for calibration.
CHECKING RASCH ASSUMPTIONS
Since the Rasch model was the basis of all calibration, scoring, and scaling analyses associated with the PSSA-M, the validity of the inferences from these results depends on the degree to which the assumptions of the model were met and how well the model fits the test data. Therefore, it is important to check these assumptions. This section evaluates the dimensionality of the data, local item independence, and item fit. Though a variety of methods are available for assessing these issues, the Rasch analyses and criteria available from WINSTEPS were used here. It should be noted that only operational items were analyzed since they are the basis of student scores.
Unidimensionality
Rasch models assume that one dominant dimension determines the difference among students’ performances. WINSTEPS provides results from a Principal Components Analysis (PCA) that can be used to assess the unidimensionality assumption. Different from standard applications of PCA, WINSTEPS conducts its PCA on the response residuals, not the original observations. That is, the primary dimension from the Rasch model is removed first and then the residual variance is analyzed. The purpose of the analysis is to verify whether any other dominant component(s) exist among the residuals (i.e., they account for a practically significant amount of residual variance). If any other dimensions are found, the unidimensionality assumption would be violated.
WINSTEPS provides three PCA residuals: raw, standardized, and logit. All three should yield similar results. The standardized residual setting was used for the PCA because standardized residuals are better for decomposing the unexplained variance into contrasts (Linacre, 2009).
Table 12–1 presents the PCA results for the PSSA-M tests. The results include the total raw variance, raw variance explained by the model, unexplained total variance, and unexplained variance in the first component. (Both eigenvalue units and percentage values are tabled.) In addition, the modeled column provides variance components that would be explained if the data complied with the Rasch definition of unidimensionality.
As can been seen in Table 12–1, the primary dimension in the Rasch model explained about 28–65 percent of the total variance across Grades 4–8 and 11. If the data fit the model in such a way that only random noise was present, about 28–65 percent of the variance would be explained. The empirical and model-based percentages were quite close, suggesting that the estimation of a primary Rasch dimension was successful. According to Reckase (1979), the variance explained by the primary dimension should be greater than 20 percent to indicate unidimensionality. The variance explained for all subjects and grades exceeded this threshold, demonstrating a unidimensional trait of the data.
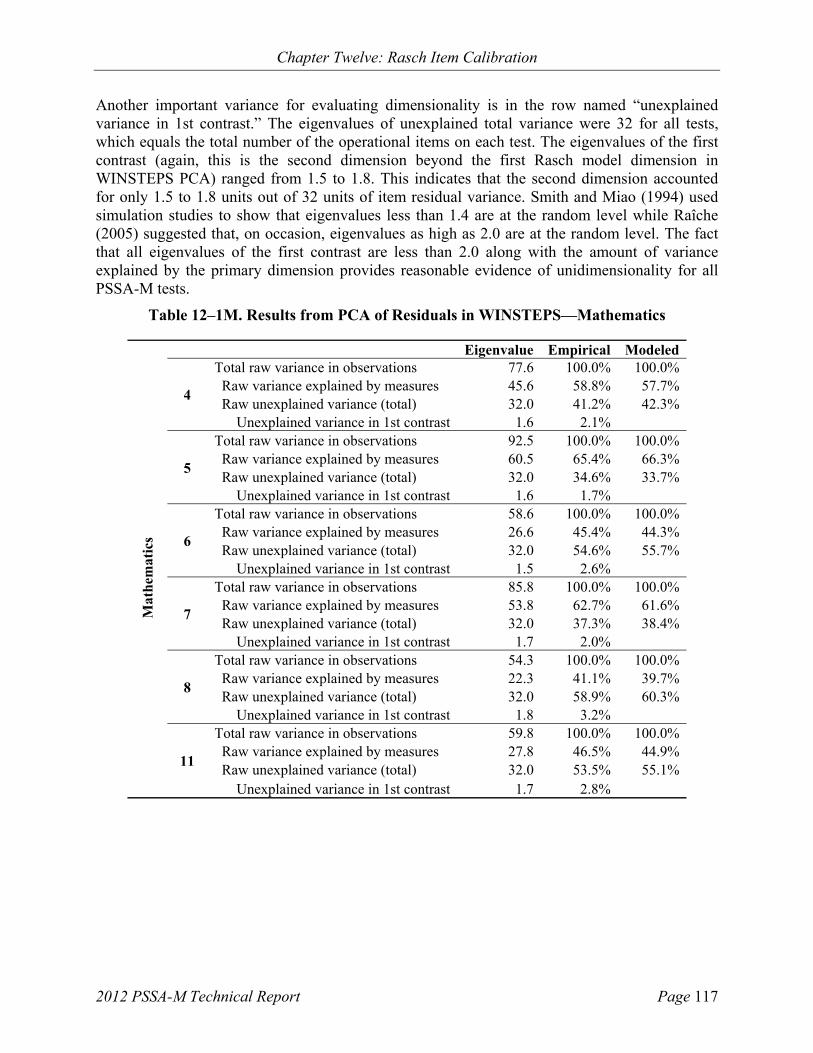
Chapter Twelve: Rasch Item Calibration
2012 PSSA-M Technical Report Page 117
Another important variance for evaluating dimensionality is in the row named “unexplained variance in 1st contrast.” The eigenvalues of unexplained total variance were 32 for all tests, which equals the total number of the operational items on each test. The eigenvalues of the first contrast (again, this is the second dimension beyond the first Rasch model dimension in WINSTEPS PCA) ranged from 1.5 to 1.8. This indicates that the second dimension accounted for only 1.5 to 1.8 units out of 32 units of item residual variance. Smith and Miao (1994) used simulation studies to show that eigenvalues less than 1.4 are at the random level while Raîche (2005) suggested that, on occasion, eigenvalues as high as 2.0 are at the random level. The fact that all eigenvalues of the first contrast are less than 2.0 along with the amount of variance explained by the primary dimension provides reasonable evidence of unidimensionality for all PSSA-M tests.
Table 12–1M. Results from PCA of Residuals in WINSTEPS—Mathematics
Eigenvalue Empirical Modeled
Mat
hem
atic
s
4
Total raw variance in observations 77.6 100.0% 100.0% Raw variance explained by measures 45.6 58.8% 57.7% Raw unexplained variance (total) 32.0 41.2% 42.3% Unexplained variance in 1st contrast 1.6 2.1%
5
Total raw variance in observations 92.5 100.0% 100.0% Raw variance explained by measures 60.5 65.4% 66.3% Raw unexplained variance (total) 32.0 34.6% 33.7% Unexplained variance in 1st contrast 1.6 1.7%
6
Total raw variance in observations 58.6 100.0% 100.0% Raw variance explained by measures 26.6 45.4% 44.3% Raw unexplained variance (total) 32.0 54.6% 55.7% Unexplained variance in 1st contrast 1.5 2.6%
7
Total raw variance in observations 85.8 100.0% 100.0% Raw variance explained by measures 53.8 62.7% 61.6% Raw unexplained variance (total) 32.0 37.3% 38.4% Unexplained variance in 1st contrast 1.7 2.0%
8
Total raw variance in observations 54.3 100.0% 100.0% Raw variance explained by measures 22.3 41.1% 39.7% Raw unexplained variance (total) 32.0 58.9% 60.3% Unexplained variance in 1st contrast 1.8 3.2%
11
Total raw variance in observations 59.8 100.0% 100.0% Raw variance explained by measures 27.8 46.5% 44.9% Raw unexplained variance (total) 32.0 53.5% 55.1% Unexplained variance in 1st contrast 1.7 2.8%

Chapter Twelve: Rasch Item Calibration
2012 PSSA-M Technical Report Page 118
Table 12–1R. Results from PCA of Residuals in WINSTEPS—Reading
Eigenvalue Empirical ModeledR
ead
ing
4
Total raw variance in observations 44.6 100.0% 100.0% Raw variance explained by measures 12.6 28.3% 28.4% Raw unexplained variance (total) 32.0 71.7% 71.6% Unexplained variance in 1st contrast 1.6 3.6%
5
Total raw variance in observations 49.8 100.0% 100.0% Raw variance explained by measures 17.8 35.7% 35.6% Raw unexplained variance (total) 32.0 64.3% 64.4% Unexplained variance in 1st contrast 1.5 3.0%
6
Total raw variance in observations 50.0 100.0% 100.0% Raw variance explained by measures 18.0 36.0% 35.3% Raw unexplained variance (total) 32.0 64.0% 64.7% Unexplained variance in 1st contrast 1.5 3.0%
7
Total raw variance in observations 46.5 100.0% 100.0% Raw variance explained by measures 14.5 31.1% 30.6% Raw unexplained variance (total) 32.0 68.9% 69.4% Unexplained variance in 1st contrast 1.5 3.1%
8
Total raw variance in observations 45.4 100.0% 100.0% Raw variance explained by measures 13.4 29.5% 29.2% Raw unexplained variance (total) 32.0 70.5% 70.8% Unexplained variance in 1st contrast 1.5 3.3%
11
Total raw variance in observations 51.0 100.0% 100.0% Raw variance explained by measures 19.0 37.2% 36.2% Raw unexplained variance (total) 32.0 62.8% 63.8% Unexplained variance in 1st contrast 1.5 3.0%
Table 12–1S. Results from PCA of Residuals in WINSTEPS—Science
Eigenvalue Empirical Modeled
Sci
ence
8
Total raw variance in observations 48.1 100.0% 100.0% Raw variance explained by measures 16.1 33.5% 32.9% Raw unexplained variance (total) 32.0 66.5% 67.1% Unexplained variance in 1st contrast 1.6 3.3%
11
Total raw variance in observations 52.9 100.0% 100.0% Raw variance explained by measures 20.9 39.5% 39.6% Raw unexplained variance (total) 32.0 60.5% 60.4% Unexplained variance in 1st contrast 1.7 3.1%

Chapter Twelve: Rasch Item Calibration
2012 PSSA-M Technical Report Page 119
Local Independence
Local independence (LI) is a fundamental assumption of IRT. No relationship should exist between examinees’ responses to different items after accounting for the abilities measured by a test. In formal statistical terms, a test X that is comprised of items X1, X2,…Xn is locally independent with respect the latent variable θ if, for all x = (x1, x2,…xn) and θ,
I
iii xXPP
1
|| xX .
This formula essentially states that the probability of any pattern of responses across all items (x), after conditioning on the abilities ( ) measured by the test, should be equal to the product of the conditional probabilities across each item (cf. the multiplication rule for independent events where the joint probabilities are equal to the product of the associated marginal probabilities).
The equation above shows the condition after satisfying the strong form of local independence. A weak form of local independence (WLI) was proposed by McDonald (1979). The distinction is important as many indicators of local dependency are actually framed by WLI. The requirement would be for the conditional covariances of all pairs of item responses, conditioned on the abilities, to be equal to zero. When this assumption is met, the joint probability of responses to an item pair, conditioned on abilities, is the product of the probabilities of responses to these two items, as shown below. (This is a weaker form because higher-order dependencies among items are allowed.) Based on the WLI, the following expression can be derived:
|||, jjiijjii xXPxXPxXxXP .
Marais and Andrich (2008) pointed out that local item dependence in the Rasch model can occur in two ways that some may not distinguish. The first way occurs when the assumption of unidimensionality is violated. Here, other nuisance dimensions besides a dominant dimension determine student performance (this can be called trait dependence). The second violation occurs when responses to an item depend on responses to another. This is a violation of statistical independence and can be called response dependence. Many people treat the assumptions of unidimensionality and local independence as one phenomenon and believe that once unidimensionality holds, that local independence also holds. By distinguishing the two sources of local dependence, one can see that while local independence can be related to unidimensionality, the two are different assumptions and therefore require different tests.
Residual item correlations provided in WINSTEPS for each item pair were used to assess the local dependence among the PSSA-M items. In general, these residuals are computed as follows. First, expected item performance based on the Rasch model is determined using ability and item parameter estimates. Next, deviations (residuals) between the examinees’ expected and observed performance is determined for each item. Finally, for each item pair, a correlation between the respective deviations is computed.
As mentioned before, three types of residual correlations are available in WINSTEPS: raw, standardized, and logit. It should be noted that the raw score residual correlation essentially corresponds to Yen’s Q3 index, a popular LI statistic. The expected value for the Q3 statistic is approximately -1/(k-1) when no local dependence exists, where k is test length (Yen, 1993). Thus, the expected Q3 values should be approximately -0.03 for the PSSA-M tests since the PSSA-M tests had 32 core items. Index values that are greater than 0.20 indicate a degree of local dependence that probably should be examined by test developers (Chen & Thissen, 1997).

Chapter Twelve: Rasch Item Calibration
2012 PSSA-M Technical Report Page 120
Since the three residual correlations are very similar, the default standardized residual correlation in WINSTEPS was used for these analyses. Table 12–2 shows the summary statistics—mean, SD, minimum, maximum, and several percentiles (P10, P25, P50, P75, P90)—for all the residual correlations for each test. The total number of item pairs (N) and the number of pairs with the residual correlations greater than 0.20 are also reported in this table. The mean residual correlations were slightly negative, and the values were close to -0.03. The vast majority of the correlations were very small, suggesting local item independence generally holds for the PSSA-M tests.
Table 12–2M. Summary of Item Residual Correlations for PSSA-M Mathematics
Mathematics
Statistic 4 5 6 7 8 11 N Pairs 496 496 496 496 496 496
Mean -0.03 -0.03 -0.03 -0.03 -0.03 -0.03 SD 0.04 0.04 0.04 0.04 0.04 0.04 Minimum -0.12 -0.15 -0.11 -0.15 -0.11 -0.16
P10 -0.07 -0.07 -0.07 -0.07 -0.07 -0.07
P25 -0.05 -0.05 -0.05 -0.05 -0.06 -0.05
P50 -0.03 -0.03 -0.03 -0.03 -0.04 -0.04
P75 -0.01 -0.01 -0.01 -0.01 -0.01 -0.01
P90 0.01 0.01 0.01 0.01 0.02 0.01 Maximum 0.19 0.40 0.20 0.20 0.19 0.15
>0.20 0 1 0 0 0 0
Table 12–2R. Summary of Item Residual Correlations for PSSA-M Reading
Reading
Statistic 4 5 6 7 8 11 N Pairs 496 496 496 496 496 496
Mean -0.03 -0.03 -0.03 -0.03 -0.03 -0.03 SD 0.03 0.03 0.04 0.03 0.03 0.03 Minimum -0.12 -0.11 -0.11 -0.11 -0.12 -0.10
P10 -0.07 -0.07 -0.07 -0.07 -0.07 -0.06
P25 -0.05 -0.05 -0.05 -0.05 -0.05 -0.05
P50 -0.03 -0.03 -0.03 -0.03 -0.03 -0.03
P75 -0.01 -0.01 -0.01 -0.01 -0.01 -0.01
P90 0.01 0.01 0.01 0.01 0.01 0.00 Maximum 0.10 0.09 0.23 0.16 0.09 0.10
>0.20 0 0 1 0 0 0

Chapter Twelve: Rasch Item Calibration
2012 PSSA-M Technical Report Page 121
Table 12–2S. Summary of Item Residual Correlations for PSSA-M Science
Science Statistic 8 11
N Pairs 496 496Mean -0.03 -0.03SD 0.03 0.03Minimum -0.15 -0.12
P10 -0.07 -0.07P25 -0.05 -0.05P50 -0.03 -0.03P75 -0.01 -0.01P90 0.00 0.01
Maximum 0.07 0.10>0.20 0 0
Item Fit
WINSTEPS provides two item fit statistics (infit and outfit) for evaluating the degree to which the Rasch model predicts the observed item responses. Each fit statistic can be expressed as a mean square (MnSq) statistic or on a standardized metric (Zstd with mean = 0 and variance = 1). MnSq values are more oriented toward practical significance, while Zstd values are more oriented toward statistical significance. Though both are informative, the Zstd values are very likely too sensitive to the large sample sizes observed on the PSSA-M. In this situation it is recommended that the Zstd values be ignored if the MnSq values are acceptable (Linacre, 2009).
Both infit and outfit MnSq are the average of standardized residual variance (the difference between the observed score and the Rasch estimated score divided by the square root of the Rasch model variance). The difference is that the outfit statistic gives all examinees equal weight in computing the fit and tends to be affected more by unexpected responses far from the person, item, or rating scale category measure (i.e., it is more sensitive to outlying, off-target, low-information responses). The infit statistic is weighted by the examinee locations relative to item difficulty and tends to be affected more by unexpected responses close to the person, item, or rating scale category measure (i.e., informative, on-target responses). Some feel that extreme infit values are a greater threat to the measurement process than extreme outfit since most tests intend to measure the on-target population rather than extreme outliers.
The expected MnSq value is 1.0 and can range from 0 to infinity. Deviation in excess of the expected value can be interpreted as noise or lack of fit between the items and the model. Values lower than the expected value can be interpreted as item redundancy or overfitting items (too predictable, too much redundancy), and values greater than the expected value indicate underfitting items (too unpredictable, too much noise). Rules of thumb regarding practically significant MnSq values vary. More conservative users might prefer items with MnSq values that range from 0.8 to 1.2. Others believe reasonable test results can be achieved with values from 0.5 to 1.5. In the results below, values outside of 0.7 to 1.3 are given practical importance.

Chapter Twelve: Rasch Item Calibration
2012 PSSA-M Technical Report Page 122
Table 12–3 presents the summary statistics of infit and outfit mean square statistics for the PSSA-M tests including the mean, SD, and minimum and maximum values. The number of items within the range of [0.7, 1.3] is also reported in Table 12–3. As can be seen, the mean values for both fit statistics were close to 1.00 for all tests. All the items had infit values falling in the range of [0.7, 1.3]. Though more outfit values fell outside this range than infit values, most of the extreme values were just barely above 1.3 or below 0.7. Overall, these results indicate that the Rasch model fits the PSSA-M item data well.
Table 12–3. Summary of Infit and Outfit Mean Square Statistics for PSSA-M
Infit Mean Square Outfit Mean Square
Mean SD Min Max [0.7, 1.3] Mean SD Min Max
[0.7, 1.3]
Mat
hem
atic
s 4 1.00 0.07 0.86 1.13 32/32 0.99 0.15 0.58 1.25 31/32 5 1.00 0.06 0.86 1.18 32/32 1.00 0.16 0.53 1.50 30/32 6 1.00 0.07 0.86 1.16 32/32 1.00 0.11 0.69 1.21 31/32 7 1.00 0.07 0.88 1.21 32/32 1.02 0.13 0.84 1.58 31/32 8 1.00 0.05 0.89 1.10 32/32 1.01 0.10 0.81 1.21 32/32
11 1.00 0.07 0.88 1.12 32/32 1.01 0.12 0.74 1.42 31/32
Rea
din
g
4 1.00 0.09 0.83 1.16 32/32 1.00 0.12 0.76 1.23 32/32 5 0.99 0.09 0.85 1.15 32/32 0.99 0.13 0.77 1.26 32/32 6 0.99 0.10 0.85 1.23 32/32 0.98 0.15 0.76 1.31 31/32 7 1.00 0.08 0.85 1.16 32/32 0.99 0.12 0.75 1.23 32/32 8 0.99 0.07 0.85 1.14 32/32 0.99 0.11 0.75 1.18 32/32
11 0.99 0.09 0.81 1.15 32/32 0.97 0.16 0.59 1.24 30/32
Sci
. 8 0.99 0.10 0.85 1.44 31/32 0.98 0.16 0.74 1.59 31/32 11 0.99 0.09 0.85 1.21 32/32 1.00 0.13 0.75 1.33 31/32
RASCH ITEM STATISTICS
As noted earlier, the Rasch model expresses item difficulty (and student ability) in units referred to as logits, rather than on the percent-correct metric. In the simplest case, a logit is a transformed p-value with the average p-value becoming a logit of zero. In this form, logits resemble z-scores or standard normal deviates; a very difficult item might have a logit of +4.0 and a very easy item might have a logit of -4.0. However, they have no formal relationship to the normal distribution.
The logit metric has several mathematical advantages over p-values. Logits have an interval scale, meaning that two items with logits of 0.0 and +1.0 (respectively) are the same distance apart as two items with logits of +3.0 and +4.0. Logits are not dependent on the ability level of the students. For example, a test form can have a mean logit of zero, whether the average item p-value for the student sample is 0.8 or 0.3.
The standard Rasch calibration procedure arbitrarily fixes the mean difficulty of the items on any form at zero. Under normal circumstances where all students are administered the same set of items, any item with a p-value lower than the average item on the form receives a positive logit difficulty and any item with a p-value higher than the average receives a negative logit. Consequently, the logits for any calibration relate to an arbitrary origin defined by the center of items on that form. Logits for both item difficulties and student abilities are placed on the same scale and relate to the same mean item difficulty.

Chapter Twelve: Rasch Item Calibration
2012 PSSA-M Technical Report Page 123
There are a number of other arbitrary choices that could be made for centering the item difficulties. Rather than using all the items, the origin could be defined by a subset. For the PSSA-M, all test forms in a particular grade and content area share the same operational item set. All items on each form can then be easily adjusted to a single (but still arbitrary) origin by defining the origin as the mean of the operational items. With this done, the origins for all the forms will be statistically equal. For example, items on any two forms that are equally difficult will now have statistically equal logit difficulties. This is partly how PSSA-M items can be placed on the same logit difficulty scale across years. Chapter Fifteen has more detailed information about the PSSA-M scale linking procedures.
Appendix I reports the item statistics, including classical and Rasch logit difficulties for all the operational items. Table 12–4 summarizes the Rasch logit difficulties of the operational items on each test. Within each content area, most grades had similar mean logits. The minimum and maximum values and standard deviations suggest that the PSSA-M items covered a relatively wide range of difficulties.
Table 12–4. Summary of Rasch Item Difficulties for PSSA-M
N Mean SD Min Max
Mat
hem
atic
s 4 32 0.10 1.13 -1.86 1.795 32 0.11 1.18 -3.48 2.466 32 0.09 0.95 -2.73 1.467 32 0.07 0.76 -1.74 1.458 32 0.08 0.83 -1.84 1.55
11 32 0.11 0.82 -1.90 2.04
Rea
din
g
4 32 0.13 0.53 -0.93 0.995 32 0.21 0.57 -1.08 1.116 32 0.21 0.68 -0.91 1.437 32 0.11 0.53 -1.53 0.978 32 0.11 0.65 -1.41 1.36
11 32 0.05 0.74 -1.89 1.71
Sci
. 8 32 0.09 0.75 -1.47 1.6511 32 0.08 0.77 -1.24 1.82
Note. The mean logit values for are not necessarily 0.0 because the items have been placed on a scale that was developed in prior years.

Chapter Twelve: Rasch Item Calibration
2012 PSSA-M Technical Report Page 124
Item Difficulty-Student Ability Maps
The distributions of the Rasch item logits (item difficulty estimates) are shown on the item difficulty-student ability maps presented in Figure 12–1. In each item-student map, markers on the right-hand side represent student ability values, whereas markers on the left-hand side represent item difficulty parameter estimates. As noted earlier, the Rasch model enables placement of both items and students on the same scale. Consequently, one can easily visualize information about how the difficulty of the test items related to the ability distribution of students who took the test. The students located in the upper-right quadrant of any given plot have relatively more ability. Items in the lower-left quadrant are relatively easier. High-ability students have higher probabilities of correctly answering easier items. Similarly, low-ability students (in lower-left quadrant of any given plot) have lower probabilities of answering harder items (in upper-right quadrant).
Overall, the distribution of student ability was roughly comparable to the distribution of item difficulties. The mean ability of the students was comparable to the mean item difficulty. The range of student ability and item logit was also comparable. It is also important to understand where the items are providing more accurate measurement (e.g., near the cut scores or away from the cut scores). This issue is addressed more fully in Chapter Eighteen (see Figure 18–2). The OE items (Xs) were relatively more difficult than the MC items (Ds). However, the OEs provide more information for higher-ability students.

Chapter Twelve: Rasch Item Calibration
2012 PSSA-M Technical Report Page 125
Figure 12–1. Item-Student Maps

Chapter Twelve: Rasch Item Calibration
2012 PSSA-M Technical Report Page 126
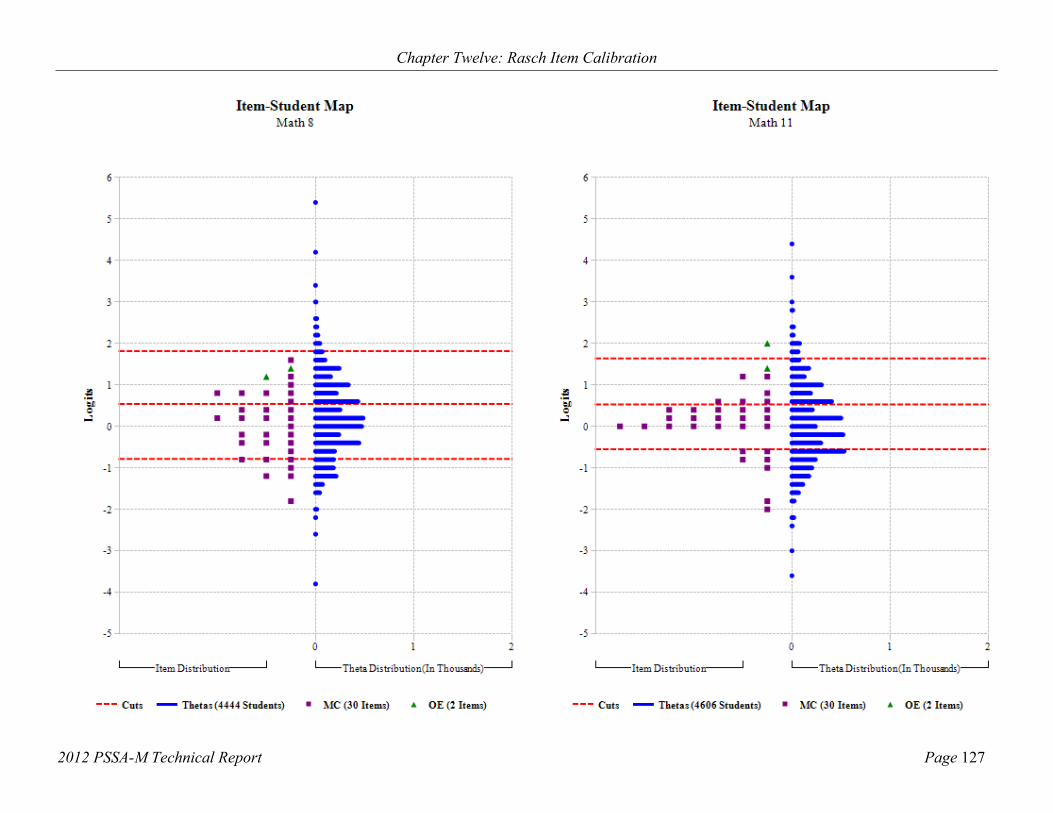
Chapter Twelve: Rasch Item Calibration
2012 PSSA-M Technical Report Page 127

Chapter Twelve: Rasch Item Calibration
2012 PSSA-M Technical Report Page 128

Chapter Twelve: Rasch Item Calibration
2012 PSSA-M Technical Report Page 129

Chapter Twelve: Rasch Item Calibration
2012 PSSA-M Technical Report Page 130

Chapter Twelve: Rasch Item Calibration
2012 PSSA-M Technical Report Page 131

Chapter Twelve: Rasch Item Calibration
2012 PSSA-M Technical Report Page 132

Chapter Thirteen: Performance-Level Setting
2012 PSSA-M Technical Report Page 133
Chapter Thirteen: Performance-Level Setting The performance-level setting for the PSSA-M reading and science tests was conducted by Data Recognition Corporation (DRC) using the Ordered-Item Booklet (OIB) Angoff (Yes/No) method during a workshop held in Harrisburg, Pennsylvania, on May 17–20, 2011. A brief summary of the methodology and results is provided below. Full details of the performance-level-setting event can be found in the following technical report:
Standard Setting Technical Report for the 2011 Pennsylvania System of School Assessment-Modified Reading and Science Assessments (Data Recognition, 2011)2
A history (dates and methodology) of prior performance-level-setting events are provided in Table 13–1. For additional details about any given event, refer to the technical report for the year that the event occurred (Data Recognition Corporation, 2010, 2011).
Table 13–1. Performance Level Setting/Validation Event Dates and Methodology
Subject Grade Methodology Event Date Mathematics-M 4–8, 11 OIB Angoff Spring 2010 Reading-M 4–8 11 OIB Angoff Spring 2011 Science-M 8, 11 OIB Angoff Spring 2011
SUMMARY
Figure 13–1 presents general information about the performance-level-setting event. The purpose of the event was to establish three cut scores for the modified reading assessment at Grades 4–8 and 11 and for the modified science assessment at Grades 8 and 11. The three cut scores place students into four performance levels: Below Basic-M, Basic-M, Proficient-M, and Advanced-M.
The Pennsylvania Department of Education (PDE) recruited panelists from across the state and targeted educators who had experience in reading or science at a specific grade level and were knowledgeable about modified content standards. A total of 33 educators (22 general educators and 11 special educators) attended the reading performance-level-setting event, and a total of 21 educators (14 general educators and 7 special educators) attended the science performance-level-setting event. For reading, the 33 panelists were assigned to one or two grade-level panels based on their experience. For science, the 21 panelists were assigned to either the Grade 8 or Grade 11 panel. The numbers of panelists in each grade panel ranged from 8 to 13. The ratio of special educators to general educators ranged from 1:3 to 5:7 across the panels.
2 This report is available upon request from PDE at 1-717-705-2343.

Chapter Thirteen: Performance-Level Setting
2012 PSSA-M Technical Report Page 134
Figure 13–1. General Information about PSSA-M Performance Level Setting
Official Title Performance-Level Setting for PSSA-M Reading and Science
Event Dates May 17–20, 2011
Methodology Ordered-Item Booklet Angoff (Yes/No)
Number of Performance Levels
Four Performance Level Names
Below Basic-M Basic-M Proficient-M Advanced-M
Content Area(s)
Modified Reading & Modified Science
Grades 4, 5, 6, 7, 8, and 11 for Reading, 8 and 11 for Science
Panelists Reading: 33 Total Science: 21 Total at least 8 per Group
Tables 1 Table per Group
Rounds Three (3) plus Articulation
Impact Groups Total Group
The entire PSSA-M performance-level-setting event included the following components:
1. A training session.
2. Phase I: three rounds of the OIB Angoff Yes/No procedure for each grade level.
Panelists were asked to review the items, one by one, in order of item difficulty. For each item, the panelists were instructed to think about whether the borderline student at each given performance level would answer an item correctly. Only a dichotomous “Yes” or “No” response was required for each item. Since the items were rank ordered in difficulty from the easiest to hardest, panelists were expected to make more “Yes” judgments at the beginning of the OIB (easier items) and more “No” judgments at the end of OIB (more difficult items). Ideally, each panelist might have come to a point where all “Yes” answers would change to “No” answers. However, the actual pattern of ratings could differ as the item ordering only provided useful information to the panelists, not an absolute rule about answering “Yes” or “No.”
3. An evaluation form was used to collect validity evidence from the panelists. The results were positive and suggested that the event processes went efficiently. In addition, the panelists had high confidence about the final recommended cut scores.
4. Phase II: vertical articulation across six reading grades (Grades 4–8 and 11).
Table 13–2 summarizes the final recommended raw, theta, and scaled-score cuts and their associated conditional standard errors of measurement (CSEMs) for each grade. On May 26, 2011, the Pennsylvania State Board of Education approved the panelists’ recommendations at all grades. For more information on scaled scores see Chapter 14.

Chapter Thirteen: Performance-Level Setting
2012 PSSA-M Technical Report Page 135
Table 13–2. Final Cut Scores and Conditional Standard Errors of Measurement (CSEM) for Scale Score Cuts
Below Basic-M/Basic-M Basic-M/Proficient-M Proficient-M/Advanced-M
Raw Theta Scaled CSEM Raw Theta Scaled CSEM Raw Theta Scaled CSEM
Rea
din
g
4 8 -1.2893 1150 43 17 -0.1101 1275 36 24 0.7217 1363 38
5 10 -1.0125 1150 41 19 0.1898 1275 37 27 1.3018 1391 42
6 12 -0.6956 1150 36 22 0.6103 1275 35 29 1.7201 1381 43
7 12 -0.6788 1150 40 21 0.4809 1275 39 28 1.5026 1385 45
8 14 -0.4859 1150 40 23 0.6508 1275 40 30 1.7754 1399 51
11 17 -0.0445 1150 42 25 1.0155 1275 45 32 2.3512 1433 63
Sci
. 8 14 -0.3288 1150 43 22 0.7473 1275 44 29 1.9833 1419 58
11 9 -1.0555 1150 37 19 0.331 1275 33 28 1.7325 1401 42
PSSA-M CUT SCORES
Appendix L provides the Rasch ability and scaled-score cuts for each PSSA-M test. For reader convenience, these are documented in the next table in a different format. Table 13–3 documents the Rasch ability (theta) cut scores for each grade and subject-area test. Table 13–4 documents the same data but provides the cut scores on the scaled-score metric. PSSA-M scaling procedures are discussed further in Chapter Fourteen.
Table 13–3. PSSA-M Theta (θ) Metric Cut Scores by Grade and Subject Area
Ѳ Cuts BB/B B/P P/A
Mat
hem
atic
s 4 -0.5891 0.8935 1.85405 -0.5352 0.8640 1.97346 -0.9606 0.3441 1.45437 -0.8442 0.5878 1.60868 -0.7858 0.5407 1.8139
11 -0.5492 0.5317 1.6389
Rea
din
g
4 -1.2893 -0.1101 0.72175 -1.0125 0.1898 1.30186 -0.6956 0.6103 1.72017 -0.6788 0.4809 1.50268 -0.4859 0.6508 1.7754
11 -0.0445 1.0155 2.3512
Sci
. 8 -0.3288 0.7473 1.983311 -1.0555 0.3310 1.7325
Note. BB = Below Basic; B = Basic; P = Proficient; and A = Advanced.

Chapter Thirteen: Performance-Level Setting
2012 PSSA-M Technical Report Page 136
Table 13–4. PSSA-M Scaled-Score Metric Cut Scores by Grade and Subject Area
Scaled-Score Cuts BB/B B/P P/A
Mat
hem
atic
s 4 1150 1275 1356 5 1150 1275 1374 6 1150 1275 1381 7 1150 1275 1364 8 1150 1275 1395
11 1150 1275 1403 R
ead
ing
4 1150 1275 1363 5 1150 1275 1391 6 1150 1275 1381 7 1150 1275 1385 8 1150 1275 1399
11 1150 1275 1433
Sci
. 8 1150 1275 1419 11 1150 1275 1401
Note. BB = Below Basic; B = Basic; P = Proficient; and A = Advanced.
Chapter Fourteen: Scaling
2012 PSSA-M Technical Report Page 137
Chapter Fourteen: Scaling The purpose of a scaling analysis is to create a score scale. Scaling is used to transform test-score values onto a scale that can be more easily interpreted by users. For the PSSA-M, the resulting scaled scores will be used for score reporting and performance-level classification. The PSSA-M classifies students into four achievement levels: Below Basic-M, Basic-M, Proficient-M, and Advanced-M.
SCALED SCORES
Individual student scores are reported as scaled scores. However, they are initially estimated as Rasch abilities (more information on the Rasch model is given in Chapter Twelve). Generally, scaled scores are preferred over Rasch ability values for reporting purposes. One issue is that Rasch ability values are on a scale that includes negative and decimal values. By transforming the Rasch ability values to scaled scores, all reported values can become positive integers. Scaled scores are usually obtained through some linear transformation of the Rasch ability values. The linear transformations used for the PSSA-M produce numeric values with three or four digits that are unit-interval scaled scores. Each grade and subject has its own unique PSSA-M scaled score. Having positive scores with no decimals makes more sense to parents and students. Since Rasch ability values are comparative after linking to the base year, the transformed scaled scores have a common scale across years, even though the corresponding raw scores may differ. (Linking is discussed further in Chapter Fifteen.)
Essentially, PSSA-M scaled scores are derived through a two-step process. First, there is a nonlinear transformation that converts number-correct scores to Rasch ability logits. Next, a linear transformation is used to convert logits to scaled scores. These, and some additional considerations (e.g., rounding rules), are discussed further below.
Definition of Scoreability
Answer documents are considered scoreable if they meet the criteria for inclusion in the data files (see Chapter Nine). All omit (i.e., no response) and multiple marks (i.e., more than one response selected without machine-discernable erasures) are scored as zeroes.
WINSTEPS Scaling
Parameter estimates are derived using the WINSTEPS 3.54 computer program (Wright and Linacre, 2003), which employs unconditional (UCON), joint maximum likelihood estimation (JMLE). WINSTEPS provides a conversion table that maps raw scores to logits (Rasch ability estimates). The logits are transformed to scaled scores as discussed below. Every year, each test is scaled separately, then linked (see Chapter Fifteen).
ZERO AND PERFECT SCORES
WINSTEPS does not provide a direct ability estimate for zero (i.e., no points earned) or perfect (i.e., all points earned) raw scores. However, WINSTEPS has a default procedure for estimating such extreme scores, and this was used for the PSSA-M. Essentially, a fractional raw score (i.e., a value less than one) was added to zero scores and subtracted from perfect scores to determine the corresponding logit values for these extreme scores.

Chapter Fourteen: Scaling
2012 PSSA-M Technical Report Page 138
Linear Transformation Formulas
PSSA-M scaled scores are obtained through a linear transformation of the Rasch ability
estimates ( ). Specifically,
SS=m +b,
where m is the slope and b is the intercept. The slopes and intercepts for deriving PSSA-M scaled scores are provided in Table 14–1. For reference purposes, the PSSA-M theta cut scores have been reproduced in this table as well.
The linear transformations were chosen such that the Basic and Proficient cut scores were the same across contents and grades. This was possible because the extreme scores after the transformations remained interpretable. Fixing the lower two cut scores was done in an attempt to aid teachers and parents in assessing a student’s performance.
Rounding
The linearly transformed scaled scores are generally rounded to the nearest integer value for reporting purposes. Values greater than or equal to 0.50 are rounded up. Values less than 0.50 are rounded down. However, at each performance-level cut point, scores are rounded up (even if less than 0.50) if this action would put the rounded score into a higher performance level. As an example, the Grade 4 mathematics Proficient-M cut score (in scaled score units) is 1275. If there had been a raw score that converted to an unrounded scaled score of 1274.20, this scaled score would have been rounded up to 1275 for reporting purposes.
Lowest-Obtainable Scaled Scores
All PSSA-M mathematics tests have a lowest-obtainable scaled score (LOSS) of 1075. For PSSA-M reading, the LOSS values have been set to 1075 at Grades 4–8 and 1050 and 1000 for Grades 8 and 11, respectively. For PSSA-M science, the LOSS values have been set to 1050 at Grade 8 and 1000 at Grade 11. LOSS values are documented in Table 14–2. See tables in Appendix N for LOSS n-counts.
Highest-Obtainable Scaled Scores
A highest-obtainable scaled score (HOSS) is not set for the PSSA-M. Thus, the maximum possible scaled-score value is allowed to float for each subject and grade. The upper bound varies from year to year, depending on the difficulty of the test form. Table 14–2 shows the maximum possible observed score for the current year’s test. (Note: It may be that no student actually earned the maximum possible.) See tables in Appendix N for HOSS n-counts.
RAW-SCORE TO SCALED-SCORE TABLES
Raw-to-scaled-score tables can be found in Appendix N.
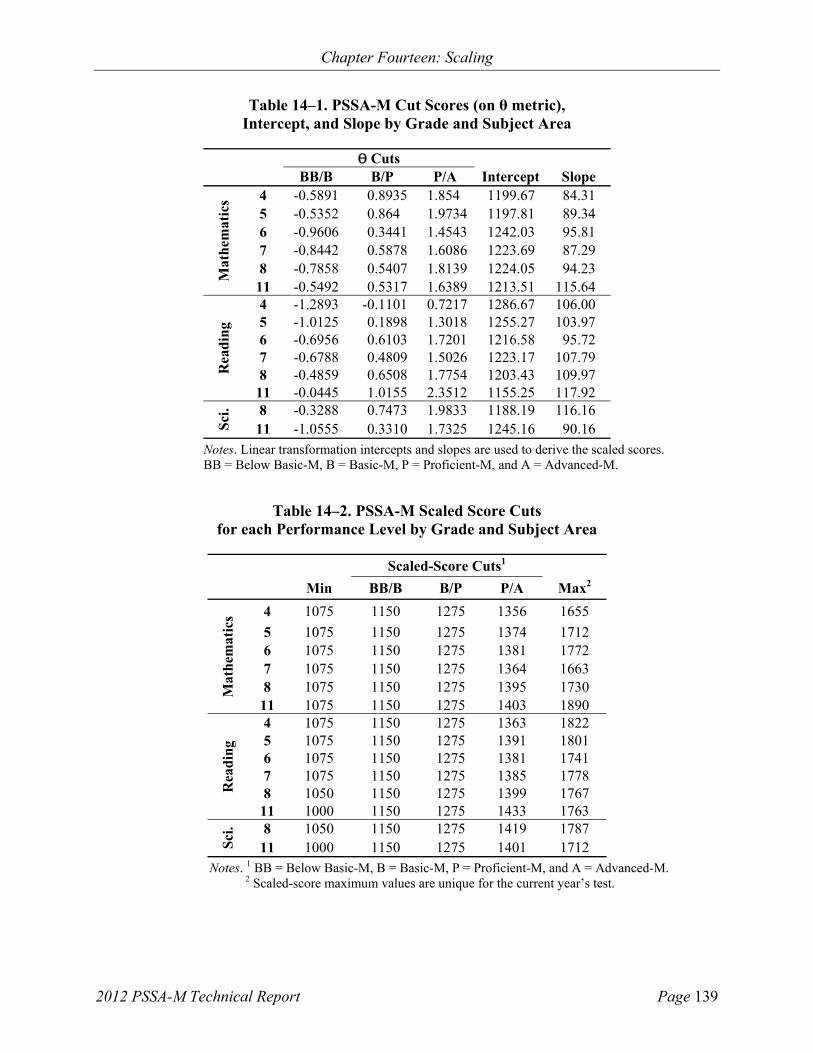
Chapter Fourteen: Scaling
2012 PSSA-M Technical Report Page 139
Table 14–1. PSSA-M Cut Scores (on θ metric), Intercept, and Slope by Grade and Subject Area
Ѳ Cuts BB/B B/P P/A Intercept Slope
Mat
hem
atic
s 4 -0.5891 0.8935 1.854 1199.67 84.31 5 -0.5352 0.864 1.9734 1197.81 89.34 6 -0.9606 0.3441 1.4543 1242.03 95.81 7 -0.8442 0.5878 1.6086 1223.69 87.29 8 -0.7858 0.5407 1.8139 1224.05 94.23
11 -0.5492 0.5317 1.6389 1213.51 115.64
Rea
din
g
4 -1.2893 -0.1101 0.7217 1286.67 106.00 5 -1.0125 0.1898 1.3018 1255.27 103.97 6 -0.6956 0.6103 1.7201 1216.58 95.72 7 -0.6788 0.4809 1.5026 1223.17 107.79 8 -0.4859 0.6508 1.7754 1203.43 109.97
11 -0.0445 1.0155 2.3512 1155.25 117.92
Sci
. 8 -0.3288 0.7473 1.9833 1188.19 116.16 11 -1.0555 0.3310 1.7325 1245.16 90.16
Notes. Linear transformation intercepts and slopes are used to derive the scaled scores. BB = Below Basic-M, B = Basic-M, P = Proficient-M, and A = Advanced-M.
Table 14–2. PSSA-M Scaled Score Cuts for each Performance Level by Grade and Subject Area
Scaled-Score Cuts1
Min BB/B B/P P/A Max2
Mat
hem
atic
s 4 1075 1150 1275 1356 1655
5 1075 1150 1275 1374 1712 6 1075 1150 1275 1381 1772 7 1075 1150 1275 1364 1663 8 1075 1150 1275 1395 1730
11 1075 1150 1275 1403 1890
Rea
din
g
4 1075 1150 1275 1363 1822 5 1075 1150 1275 1391 1801 6 1075 1150 1275 1381 1741 7 1075 1150 1275 1385 1778 8 1050 1150 1275 1399 1767
11 1000 1150 1275 1433 1763
Sci
. 8 1050 1150 1275 1419 1787 11 1000 1150 1275 1401 1712
Notes. 1 BB = Below Basic-M, B = Basic-M, P = Proficient-M, and A = Advanced-M. 2 Scaled-score maximum values are unique for the current year’s test.

Chapter Fourteen: Scaling
2012 PSSA-M Technical Report Page 140
STRAND (REPORTING CATEGORY) SCORE STRENGTH PROFILE
The following process was followed to derive the strand (reporting category) score strength profile:
The items for each strand were identified.
WINSTEPS runs were undertaken that anchored the logit values for each strand’s items to get the raw-to-logit score table for each strand. This is sometimes referred to as fixed item parameter scaling.
The appropriate linear transformations (based on content and grade from Table 14–1) were applied to the logit values to derive strand scaled scores.
The strand scaled scores were categorized as follows: L=Low (equivalent to Below Basic-M and Basic-M); M=Medium (equivalent to Proficient-M); H=High (equivalent to Advanced-M). The maximum possible strand scaled score was converted to H in cases where no strand scaled score equaled or exceeded the Advanced-M scaled-score cut. See Chapter Sixteen for more information on strand scores and how they are used in score reports.

Chapter Fifteen: Linking
2012 PSSA-M Technical Report Page 141
Chapter Fifteen: Linking
FOREWORD
This was the second operational administration of the PSSA-M reading and science tests and the third operational administration of the PSSA-M mathematics test. As such, linking/equating was required only for reading and science.
INTRODUCTION
In large-scale testing programs, it is a common practice to have different item sets appear in test forms within and/or across years. Linking operational scores from the different test forms ensures that all forms for a given grade and subject area provide comparable scores. Consequently, students are not given an unfair advantage or disadvantage because the particular test form they took is easier or harder than a test form taken by other students.
When multiple forms are administered, students who have the same ability could obtain different raw (i.e., number-correct) scores over the different test forms. As discussed further in Chapter Sixteen, raw scores can only be interpreted relative to the particular set of items used. This is because item difficulty distributions are nearly always different across different item sets.
Just as raw scores are not necessarily interchangeable across forms, item response theory (IRT) item parameters and ability estimates are not necessarily interchangeable across separate calibration runs. Application of an IRT scale linking methodology is usually required to place the item parameters and student ability estimates on the same scale as other forms. (As cautioned earlier, the success of these methods depends on how well the IRT assumptions are met.) The IRT model used for the PSSA-M is the Rasch Partial Credit Model (RPCM; Masters, 1982). Further descriptions of the RPCM are given in Chapter Twelve.
A chained linking design was utilized for the PSSA-M operational scores in reading and science. Scores from the new test form were linked to the scale of the old test form. The chain originates from the test’s base form, which is used as the reference for calibrating all items in the item pool. The base form is usually the form upon which the cut scores were established (see Chapter Thirteen). When the item parameters from the new test are placed on the existing scale, the resulting scaled scores for the new test form will be the same as the scaled scores of the base form. In order to compare students’ PSSA-M scaled scores across different years, the new operational items need to be placed on the bank scale via scale linking.
This chapter begins with a brief summary of the expected PSSA-M linking procedures. This summary is followed by a more detailed explanation of selected design elements and processes.
BRIEF SUMMARY OF THE PSSA-M LINKING PROCEDURE
The first two steps in the linking procedure concern calibration of the multiple-choice (MC) and open-ended (OE) items, which is considered as within-year linking in this chapter.
1. Calibrate selected MC items in an unanchored run:
Include all operational (OP) MC items.

Chapter Fifteen: Linking
2012 PSSA-M Technical Report Page 142
2. Calibrate selected OE items in an anchored run by putting them on the MC item scale from step 1:
Include all operational (OP) OE items.
Fix all MC items from step 1.
3. Evaluate the stability of the linking items using Robust Z:
Include all operational (OP) linking (LK) items.
Calculate Robust Z for each item in the linking.
Once the above calculations are made, the following guidelines are used in determining possible sets of LK items used for the equating:
Items with an absolute value of Robust Z exceeding 1.645 may be considered for exclusion.
No more than 20 percent of the pool of LK items may be considered for exclusion.
The ratio of the standard deviations of previous-year and current-year Rasch difficulties should be in the 90- to 110-percent range.
The correlation of previous-year and current-year Rasch difficulties is greater than 0.95.
Final decisions about the LK items follow these rules:
Drop items that DRC identified as having a large Robust Z and were out of sequence because they were pulled from a separate FT form.
If an item has been changed in any way from the previous year, it may no longer be used for linking.
Scatterplots of the LK item difficulties (logits) are constructed (i.e., the current-year values are plotted against those from the prior year). Ideally, these plots should have a strong linear trend. Items straying from the trend line did not perform in the same way in both years. As noted above, items that departed significantly are further evaluated. The scatterplots with final LK item sets are shown in Figure 15–1.
4. Calculate the mean shift over MC linking items using item difficulties:
Include all operational (OP) linking (LK) items.
5. Apply the mean shift to the item parameters calibrated in steps 1 and 2:
Include all operational (OP) MC and OE items.
6. Scale the operational test by fixing all operational items obtained in step 5:
The result from this step is a Raw-to-Logit (Rasch Ability) table.
7. Apply the appropriate linear transformation to the logit values to derive the scaled scores and SEMs:
The result from this step is a raw-to-scaled-score table.

Chapter Fifteen: Linking
2012 PSSA-M Technical Report Page 143
PSSA-M READING AND SCIENCE
Data Collection Design
The item status codes used in the IDEAS item banking system are given in Table 15–1. For brevity, these codes are used for the remainder of this chapter.
The link between years was based on the core linking (LK). These items had been used in previous administrations. The LK items were used in approximately the same context. The same context in this situation means the items are not altered in any way, they appeared in about the same position in the booklet, and they are administered at about the same time of year.
The equivalence of student samples across years cannot be assumed. Further, the same item can have different properties in different years because of changes in the item’s position or changes in the students’ experiences. Consequently, between-year linking requires considerable scrutiny. This chapter focuses more on the linking between years.
The linking design employed for the PSSA-M is often referred to as a common-item nonequivalent groups (CINEG) design. Test forms will contain a set of common items, called core linking (LK) items, which serve as anchors for comparison of test forms across years. LK items are internal anchor items (i.e., they contribute to student test scores).
All LK items were common between years since all came from the prior year’s administration. The proportion of the LK items may be different depending on the subject and grade. These are summarized in Table 15–2.
Table 15–1. Item Status Codes in IDEAS
Item Comments Code in IDEAS
Core Include core linking (i.e., anchor) items and unique core items
OP
Core linking Linking items in the core section which include MC and OE items
LK
Table 15–2. 2012 PSSA-M Linking Designs: Mathematics and Science
Core Core Links MC OE MC OE
Mat
hem
atic
s 4 30 2 12 0 5 30 2 12 0 6 30 2 12 0 7 30 2 12 0 8 30 2 12 0
11 30 2 12 0
Sci
. 8 30 2 12 0 11 30 2 11 0
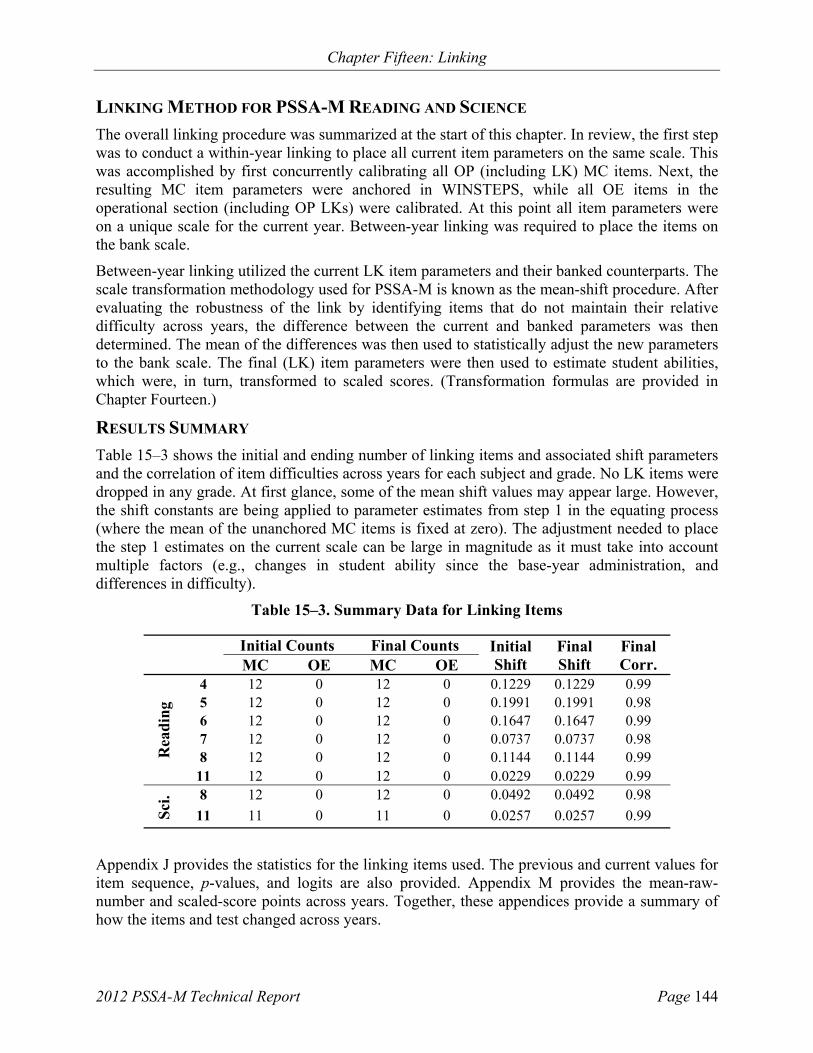
Chapter Fifteen: Linking
2012 PSSA-M Technical Report Page 144
LINKING METHOD FOR PSSA-M READING AND SCIENCE
The overall linking procedure was summarized at the start of this chapter. In review, the first step was to conduct a within-year linking to place all current item parameters on the same scale. This was accomplished by first concurrently calibrating all OP (including LK) MC items. Next, the resulting MC item parameters were anchored in WINSTEPS, while all OE items in the operational section (including OP LKs) were calibrated. At this point all item parameters were on a unique scale for the current year. Between-year linking was required to place the items on the bank scale.
Between-year linking utilized the current LK item parameters and their banked counterparts. The scale transformation methodology used for PSSA-M is known as the mean-shift procedure. After evaluating the robustness of the link by identifying items that do not maintain their relative difficulty across years, the difference between the current and banked parameters was then determined. The mean of the differences was then used to statistically adjust the new parameters to the bank scale. The final (LK) item parameters were then used to estimate student abilities, which were, in turn, transformed to scaled scores. (Transformation formulas are provided in Chapter Fourteen.)
RESULTS SUMMARY
Table 15–3 shows the initial and ending number of linking items and associated shift parameters and the correlation of item difficulties across years for each subject and grade. No LK items were dropped in any grade. At first glance, some of the mean shift values may appear large. However, the shift constants are being applied to parameter estimates from step 1 in the equating process (where the mean of the unanchored MC items is fixed at zero). The adjustment needed to place the step 1 estimates on the current scale can be large in magnitude as it must take into account multiple factors (e.g., changes in student ability since the base-year administration, and differences in difficulty).
Table 15–3. Summary Data for Linking Items
Initial Counts Final Counts Initial Shift
Final Shift
Final Corr. MC OE MC OE
Rea
din
g
4 12 0 12 0 0.1229 0.1229 0.99 5 12 0 12 0 0.1991 0.1991 0.98 6 12 0 12 0 0.1647 0.1647 0.99 7 12 0 12 0 0.0737 0.0737 0.98 8 12 0 12 0 0.1144 0.1144 0.99
11 12 0 12 0 0.0229 0.0229 0.99
Sci
. 8 12 0 12 0 0.0492 0.0492 0.98
11 11 0 11 0 0.0257 0.0257 0.99
Appendix J provides the statistics for the linking items used. The previous and current values for item sequence, p-values, and logits are also provided. Appendix M provides the mean-raw-number and scaled-score points across years. Together, these appendices provide a summary of how the items and test changed across years.

Chapter Fifteen: Linking
2012 PSSA-M Technical Report Page 145
VISUALIZATION SUPPLEMENT
As noted earlier, between-year linking requires considerable scrutiny. This is partly because student samples are not equivalent across years. Additionally, identical items can have different properties in different years because of changes in any given item’s context or changes in the students’ experiences. Since the linking process forces the logit difficulties for the linking items to have the same mean in the new year as they did in the old year, the current-year logit item difficulties will be displaced from the estimates they would have received from an independent calibration. The size of the displacements reflects the difference, if any, in the origins. The variation among the displacements corresponds to the approximate size of the standard errors for the items. The graphs in Figure 15–1 should help visualize this information.
Graphs
This technical report uses figures to help one visualize the across-year differences in linking items for each subject at each grade. This section presents four types of figures, three of which illustrate the stability between the old (i.e., banked) and new item data:
1. Scatterplot of 2012 p-values on 2011 p-values
2. Scatterplot of 2012 logits on 2011 logits
3. Scatterplot of 2011 and 2012 p-values on 2012 logits
4. Test characteristic curves (TCCs) for the linked-score distribution
All four figures will be presented for each reading and science test. Each is described further below.
2012 P-VALUES ON 2011 P-VALUES
The top left-hand plot in Figure 15–1 describes the relationship between the item p-values for the two years. The data points in these plots should have a clear trend where the vertical axis values rise as the horizontal axis values increase (i.e., as one moves from left to right). If the p-values for both years were correlated at 1.0, one would expect the relationship to fall on a straight line. Generally, linking items are not perfectly stable across years, so some scatter is expected. The extent to which the trend does not pass through the origin indicates a change in student performance.
Many test-score users are familiar with the p-value metric, which is why these charts are provided. However, the logit charts discussed below have advantages for visualizing this trend data.
2012 LOGITS ON 2011 LOGITS
The top right-hand plot in Figure 15–1 focuses on the logit difficulties. It shows more clearly the relationship between 2012 and 2011 item difficulties. Logit plots often provide more defined trends but can still present varying degrees of scatter and, in some instances, reveal outlier data points.

Chapter Fifteen: Linking
2012 PSSA-M Technical Report Page 146
2012 AND 2011 P-VALUES ON NEW-YEAR LOGITS
Plotting p-values against logit difficulties across years is not as reliable as it is within a year. Within a year, the p-values-on-logit plot should be a single curved line. (See plots in Chapter Twelve as examples.) The corresponding between-year plots could have separate lines for each year. The difference between the two lines is a reflection of the adjustment (positive or negative) that is required to link the two item sets.
In the bottom right graph in Figure 15–1, the two lines sloping downward toward the right relate item p-values for the two years to the 2012 logit difficulties. This graph illustrates the curvilinear relationship required by the model, with low p-values being translated into high logit difficulties and high p-values being converted into low logit difficulties.
TEST CHARACTERISTIC CURVES
The 2011 and 2012 test characteristic curves (TCCs) by grade and subject are shown in the figures3. TCCs show the similarity between the new- and old-year tests in terms of difficulty in the logit metric (new-year results are for the final, linked values). Assuming equal numbers of items for the two years, curves that are close to being coincident will translate into similar raw-score cut points. With extreme differences in test difficulties, some loss of precision and reliability may result.
3 In the TCC figures, the Y-Axis Probability represents total-test raw score expressed on a proportion-correct metric.

Chapter Fifteen: Linking
2012 PSSA-M Technical Report Page 147
Figure 15–1. Item Stability Plots and Test Characteristic Curves

Chapter Fifteen: Linking
2012 PSSA-M Technical Report Page 148

Chapter Fifteen: Linking
2012 PSSA-M Technical Report Page 149

Chapter Fifteen: Linking
2012 PSSA-M Technical Report Page 150

Chapter Fifteen: Linking
2012 PSSA-M Technical Report Page 151

Chapter Fifteen: Linking
2012 PSSA-M Technical Report Page 152

Chapter Fifteen: Linking
2012 PSSA-M Technical Report Page 153

Chapter Fifteen: Linking
2012 PSSA-M Technical Report Page 154
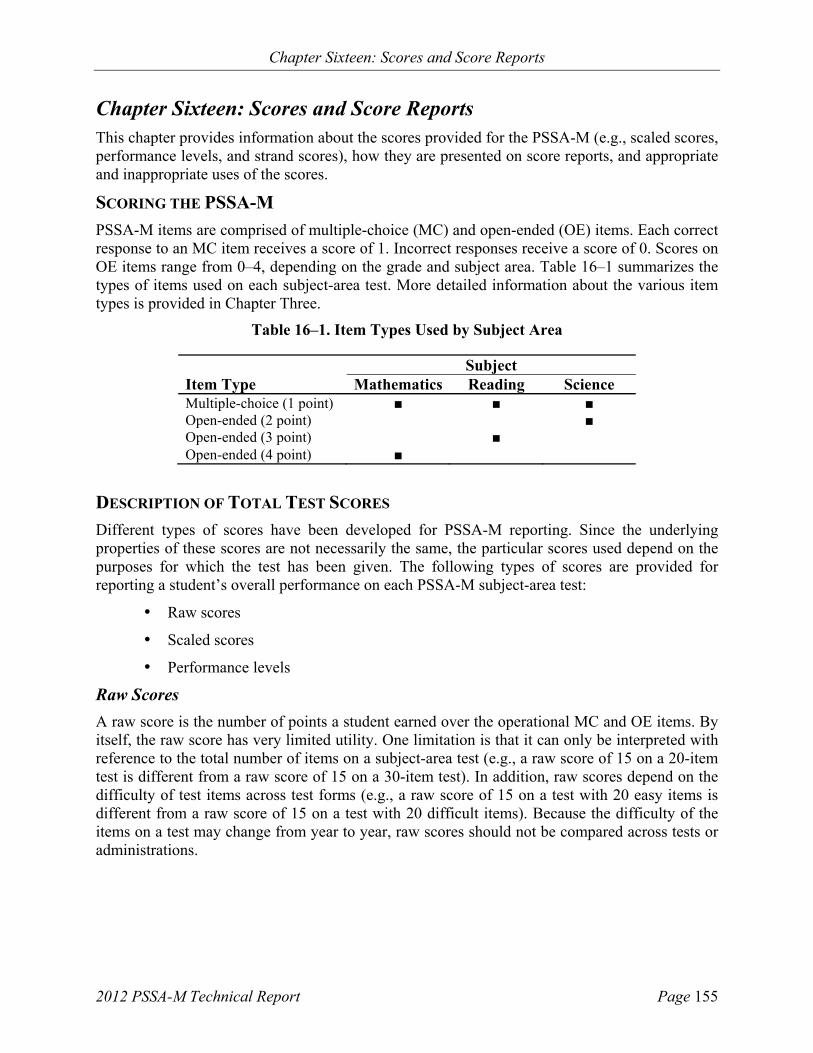
Chapter Sixteen: Scores and Score Reports
2012 PSSA-M Technical Report Page 155
Chapter Sixteen: Scores and Score Reports This chapter provides information about the scores provided for the PSSA-M (e.g., scaled scores, performance levels, and strand scores), how they are presented on score reports, and appropriate and inappropriate uses of the scores.
SCORING THE PSSA-M
PSSA-M items are comprised of multiple-choice (MC) and open-ended (OE) items. Each correct response to an MC item receives a score of 1. Incorrect responses receive a score of 0. Scores on OE items range from 0–4, depending on the grade and subject area. Table 16–1 summarizes the types of items used on each subject-area test. More detailed information about the various item types is provided in Chapter Three.
Table 16–1. Item Types Used by Subject Area
Subject Item Type Mathematics Reading Science Multiple-choice (1 point) ■ ■ ■ Open-ended (2 point) ■ Open-ended (3 point) ■ Open-ended (4 point) ■
DESCRIPTION OF TOTAL TEST SCORES
Different types of scores have been developed for PSSA-M reporting. Since the underlying properties of these scores are not necessarily the same, the particular scores used depend on the purposes for which the test has been given. The following types of scores are provided for reporting a student’s overall performance on each PSSA-M subject-area test:
Raw scores
Scaled scores
Performance levels
Raw Scores
A raw score is the number of points a student earned over the operational MC and OE items. By itself, the raw score has very limited utility. One limitation is that it can only be interpreted with reference to the total number of items on a subject-area test (e.g., a raw score of 15 on a 20-item test is different from a raw score of 15 on a 30-item test). In addition, raw scores depend on the difficulty of test items across test forms (e.g., a raw score of 15 on a test with 20 easy items is different from a raw score of 15 on a test with 20 difficult items). Because the difficulty of the items on a test may change from year to year, raw scores should not be compared across tests or administrations.

Chapter Sixteen: Scores and Score Reports
2012 PSSA-M Technical Report Page 156
Scaled Scores
Scaled scores were introduced in Chapter Fourteen, and additional information is provided there, including information on the development of the PSSA-M scaled-score system. In the simplest sense, a scaled score is a transformed number-correct score. The specifics of the transformation processes for the PSSA-M were also discussed in Chapter Fourteen. When all students take the same items, as with the operational items on the PSSA-M, the more points the student earns, the higher the associated scaled score will be.
The value of switching to the more abstract scaled-score metric is that it produces more general and equitable results. As noted above, a raw score of 30 is meaningless unless the total points possible is known. The difficulty of the test items was also mentioned as an additional challenge to interpreting raw scores. Number-correct scores are transformed to scaled scores to remove the effects of test length and item difficulty. (Strictly speaking, transformation of number-correct scores to percent-correct scores would also remove the effect of test length, but it would do nothing to adjust for the difficulty of the items.)
Another advantage of scaled scores is that they lend themselves to interpretations of what is referred to as an interval level, while raw scores do not. Interval-level scales allow an interpretation of a scaled-score difference of 5 points to be the same whether the scores are 1295 vs. 1300 or 1445 vs. 1450. Raw-score differences in this context cannot be interpreted in this manner and are thus neither generalizable nor equitable.
A scaled score of 1300—or any other value for a particular grade and content-area test, like Grade 4 mathematics—should have the same absolute meaning in the current year as it had in previous years when test scores are properly linked across years. More importantly, an increase in the scaled score for Grade 4 mathematics from last year to the current year means that student performance improved4; it does not say anything about whether this year’s test is easier or harder than last year’s test. To make these interpretations requires no information about the length or the difficulty of the test in either year, although these variables are essential for the process of deriving the scaled scores.
There is considerable auxiliary information presented in this report that might aid in further contextualizing PSSA-M scaled scores. Refer to the following information:
Chapter Fourteen provides information on the development of the PSSA-M scaled-score system, including transformation formulas, rounding rules, and general scale characteristics (e.g., minimum values).
Chapter Seventeen provides total test-score statistics. In particular, Table 17–1 lists the scaled-score means and standard deviations for this year’s test results.
Performance Levels
PSSA-M results are also reported using four performance levels: Below Basic-M, Basic-M, Proficient-M, and Advanced-M. The cut scores on the scaled-score metric (i.e., the lowest possible scaled score to enter the Basic-M, Proficient-M, and Advanced-M levels) were presented earlier in this report. However, the information is repeated in Table 16–2 for convenience.
4 This example is not an endorsement of conducting a trend analysis with just two years of results. Furthermore, small differences may not be statistically or practically significant.

Chapter Sixteen: Scores and Score Reports
2012 PSSA-M Technical Report Page 157
Table 16–2. PSSA-M Scaled Score Cuts for each Performance Level by Grade and Subject Area
Scaled Score Cuts1
Min BB/B B/P P/A Max2
Mat
hem
atic
s 4 1075 1150 1275 1356 1655
5 1075 1150 1275 1374 1712 6 1075 1150 1275 1381 1772 7 1075 1150 1275 1364 1663 8 1075 1150 1275 1395 1730
11 1075 1150 1275 1403 1890
Rea
din
g
4 1075 1150 1275 1363 1822 5 1075 1150 1275 1391 1801 6 1075 1150 1275 1381 1741 7 1075 1150 1275 1385 1778 8 1050 1150 1275 1399 1767
11 1000 1150 1275 1433 1763
Sci
. 8 1050 1150 1275 1419 1787 11 1000 1150 1275 1401 1712
Notes. 1 BB = Below Basic-M, B = Basic-M, P = Proficient-M, and A = Advanced-M. 2 Scaled-score maximum values are unique for the current year’s test.
Performance levels descriptors (PLDs) are another way to attach meaning to the scaled-score metric. They associate precise quantitative ranges of scaled scores with verbal, qualitative descriptions of student status. While much less precise, the qualitative description of the levels is one way for parents and teachers to interpret the student scores. They are also useful in assessing the status of the school. The Pennsylvania General Performance-Level Descriptors (PLDs), as developed by PDE and teacher panels, are given below. These are also included on student score reports.
Advanced-M: More than satisfactory academic performance on grade level standards as measured on an assessment with modifications to the general assessment. Advanced-M work indicates a more-than-adequate understanding of the content and demonstration of the skills included in the Pennsylvania Assessment Anchor Content Standards.
Proficient-M: Satisfactory academic performance on grade-level standards as measured on an assessment with modifications to the general assessment. Proficient-M work indicates an adequate understanding of the content and demonstration of the skills included in the Pennsylvania Assessment Anchor Content Standards.
Basic-M: Academic performance approaching satisfactory on grade-level standards as measured on an assessment with modifications to the general assessment. Basic-M work indicates a less-than-adequate understanding of the content and demonstration of the skills included in the Pennsylvania Assessment Anchor Content Standards.

Chapter Sixteen: Scores and Score Reports
2012 PSSA-M Technical Report Page 158
Below Basic-M: Unsatisfactory academic performance on grade-level skills as measured on an assessment with modifications to the general assessment. Below Basic-M work indicates little understanding of the skills included in the Pennsylvania Assessment Anchor Content Standards.
DESCRIPTION OF STRAND (REPORTING CATEGORY) SCORES
The following types of scores are provided for PSSA-M strand scores:
Strand scores (i.e., reporting category scores)
Strength profile
Strand (Reporting Category) Scores
A strand score describes a student’s or school’s/district’s performance on a particular strand (i.e., a content standard defined in the test). For the PSSA-M, strand scores are raw scores, indicating the points a student or a school/district earned for that strand. (Attributes of raw scores are described earlier in this chapter.)
Strand scores cannot be compared across years because they are not statistically linked. Also, it is not advisable to compare strand raw scores even within the same form because some reporting categories may contain items that are easier or more difficult than other reporting categories; the strength profile, discussed below, mitigates this problem to some degree. A greater concern is the low reliability of many of these scores, especially for strand scores based on a small number of possible points. Chapter Eighteen provides more information about strand-score reliability.
When compared to other results from the same year, strand scores can be somewhat helpful in identifying a group’s strengths and weaknesses on the test. For example, it can be informative to compare the average strand scores of a school against the scores of another reference group (e.g., the state average). Hence, strand scores can suggest group strengths and weaknesses relative to another reference group. (Challenges pertaining to interpreting results for individual students are discussed below.)
Strength Profile
The strength profile provides another indication of a student’s performance within each of the reporting categories. This profile can be used to identify areas in which a student needs to improve and areas in which a student has performed more successfully. Unlike strand scores that are reported as raw scores, strength-profile scores categorize students into one of three levels: Low, Medium, and High. These categories take into account the difficulty of the items and are based on the same scaling techniques used to derive the PSSA-M scaled scores. (Details regarding the creation of the strength profile are provided in Chapter Fourteen. These scaled scores are not printed on score reports. They only exist to determine whether performance in the reporting categories was Low, Medium, or High.) A Low score on the strength profile indicates performance that is below Proficient-M on the overall PSSA-M scale. A Medium score on the strength profile indicates performance that is comparable to Proficient-M on the PSSA-M. A High score on the strength profile indicates performance that is comparable to Advanced-M.

Chapter Sixteen: Scores and Score Reports
2012 PSSA-M Technical Report Page 159
APPROPRIATE SCORE USES
Individual Students
Scaled scores on the PSSA-M indicate a student’s achievement of the PSSA-M assessment anchors and eligible content. Scaled scores are primarily used to determine student performance-level classifications (i.e., a criterion-referenced inference). Scaled scores that are based on item response theory (IRT) models are typically assumed to be of the interval type; so comparisons may be made on differences in the scaled scores. If this assumption holds, then it would be safe to infer for grade 4 mathematics that the ability difference between an 1110 and 1120 represents the same ability difference that separates 1250 and 1260. Scaled scores can also be used to compare the performance of an individual student to the performance of a similar demographic or subgroup at a school or district. Test score standard errors (discussed in Chapter Eighteen) should be considered.
Groups of Students
Test results can be used to evaluate the performance over time. Mean scaled scores can be compared across administrations within the same grade and subject area to indicate whether student performance is improving across years. Generally, such trend analyses benefit from using mean results from as many test administration years as possible. Different cohorts of students are used (i.e., the same student or students are not tracked across grade levels). All scores can be analyzed within the same subject and grade for any single administration to determine which demographic or program group had, for example, the highest average performance or the highest percentage of students beyond the Proficient-M standard.
Strand scores can help evaluate academic areas for relative strengths or weaknesses. These category scores provide information to identify areas where further diagnosis is warranted. Generalizations from test results may be made to the specific content domain represented by the academic standards measured in the PSSA-M. However, all instruction and program evaluations should include as much information from other sources as possible to provide a more complete picture of performance.
CAUTIONS FOR SCORE USE
Extreme Error for Extreme Scores
Student scores toward the minimum or maximum ends of the score range will have very large standard errors of measurement, and such scores should be viewed very cautiously. The maximum scaled score only provides a very rough estimate of a student’s ability. For instance, if the maximum score for the PSSA-M Grade 6 mathematics test were 1800 (though it is not for this year) and a student achieved this score, it could not be determined whether the student could have achieved an even higher scaled score. If the test were 10 items longer, a different estimate might have been obtained. Similarly, if the items in a new test were more difficult than the items on a previous administration, the maximum scaled score would likely be higher on the new test because it would take a greater level of achievement to answer the items correctly. In this manner, extreme scaled scores may vary from one administration to the next even if the number of test items does not change. The fluctuation of extreme scaled scores complicates the comparisons of students with scaled scores at the extreme ends of the score distribution. To minimize confusion and potential misinterpretation, the minimum scaled scores possible on the PSSA-M tests have been fixed (see Table 16–2) so they do not change between administrations.

Chapter Sixteen: Scores and Score Reports
2012 PSSA-M Technical Report Page 160
However, the maximum scaled score values have not been fixed. Therefore, caution must be taken when comparing scores at the maximum end of the scale.
Each Test Has a Unique Scale
Scaling was conducted for each grade and subject-area test separately. Therefore, PSSA-M scale scores should be interpreted only within each content area. PSSA-M scaled scores are not status indicators in the same sense as percentile ranks (or scales that are essentially transformations of percentile ranks) and therefore cannot be used to profile relative strengths and weaknesses across subject areas. As an example, a student with scaled scores of 1300 in Grade 4 reading and 1250 in Grade 4 mathematics do not necessarily imply that the student performed better in reading than in mathematics. The PSSA-M scaled scores do not represent a developmental or vertical scale either. This means that no across-grade comparisons or growth statements for a student are appropriate. For example, a 1250 in Grade 4 mathematics and a 1250 in Grade 5 mathematics do not indicate a student had no achievement growth from Grade 4 to Grade 5 in mathematics.
Strength Profile Caveats
The category labels of Low, Medium, and High are deliberately used instead of the PSSA-M performance level names—Below Basic-M, Basic-M, Proficient-M, and Advanced-M—to acknowledge that the PSSA-M cut scores were established on the basis of the total test score. Therefore, the domain categories should not be interpreted in the same way as PSSA-M performance levels because they likely do not carry the same meaning.
While the strength profile might facilitate comparisons of a student’s strengths and weaknesses across reporting categories in some cases, several factors merit caution. As noted earlier, many of the strand scores are very unreliable. The scaling underlying the strength profile does not mitigate this problem.
Additionally, the categories reflect more absolute comparisons. Relative comparisons are more difficult to make. As an example, if one scored High in both strand A and B, we know the student did very well in both strands compared to overall performance in the state (i.e., absolute status). However, we do not know whether the student’s performance in strand A was better or worse relative to the performance in strand B (relative status).
Finally, some seemingly unusual results might occur that may be difficult for users to understand. As one example, it may be possible for a student to earn Medium in all reporting categories but have an Advanced-M performance level. This can happen because the strand scores are correlated, meaning the distributional properties of the total score depend not only on the variances of the strand scores but also on the covariances among the strand scores. (An analogy would be when a school track team places first overall in a competition although they did not win a single event.)
Using PSSA-M Results for Other Purposes
Should PSSA-M results be used for placement decisions or for other special programs or services? Frequently asked questions about the PSSA-M pertain to the maximum possible PSSA-M scaled scores for various subjects or the PSSA-M score that represents the 90th percentile. The motivation behind many of these questions may be associated with special program eligibility.

Chapter Sixteen: Scores and Score Reports
2012 PSSA-M Technical Report Page 161
Other uses or inferences based on PSSA-M results may or may not be valid as the validity evidence and arguments provided in Chapter Nineteen may not necessarily support other score uses and interpretations. According to the Standards (i.e., Standard 1.4), if a test is used in a way that has not been validated, it is incumbent on the user to justify the new use, collecting new evidence if necessary. Finally, a universal caveat for any test’s result is that it not be used for placement and educational planning alone. Instead, other information about the student (e.g., other test performance data) should be considered.
REPORTS
The following score reports are provided to students, parents, schools, and districts for the PSSA-M tests in mathematics:
Parent letter
Individual student report
School summary report
District summary report
Interpretive guide
Parent Letter
Parent letters were delivered to Pennsylvania districts on June 10, 2012. This score report provided parents and students with their first glimpse of performance on the spring 2012 PSSA-M tests. This report provides results at the student level. A sample of the report is provided in Figure 16–1.

Chapter Sixteen: Scores and Score Reports
2012 PSSA-M Technical Report Page 162
Figure 16–1. Sample of Parent Letter

Chapter Sixteen: Scores and Score Reports
2012 PSSA-M Technical Report Page 163
Individual Student Report
An individual student report is provided for all students who took the PSSA-M. This report was delivered to Pennsylvania school districts in September 2012. Districts were responsible for sending the reports home to the individual students. This report is a four-page color document that provides the types of scores explained earlier in this chapter. Screen shots of the four pages from a sample individual student report are provided in Figures 16–2 to 16–5.

Chapter Sixteen: Scores and Score Reports
2012 PSSA-M Technical Report Page 164
Figure 16–2. Page 1 of the Individual Student Report

Chapter Sixteen: Scores and Score Reports
2012 PSSA-M Technical Report Page 165
Figure 16–3. Page 2 of the Individual Student Report

Chapter Sixteen: Scores and Score Reports
2012 PSSA-M Technical Report Page 166
Figure 16–4. Page 3 of the Individual Student Report

Chapter Sixteen: Scores and Score Reports
2012 PSSA-M Technical Report Page 167
Figure 16–5. Page 4 of the Individual Student Report

Chapter Sixteen: Scores and Score Reports
2012 PSSA-M Technical Report Page 168
School and District Summary Reports
Summary reports are provided at the school and district level. These reports contain summary information about the percentage of students in each of the four performance levels. Raw scores are also provided by assessment anchor to allow schools or districts to identify content strands of strength or weakness.
Interpretative Guide
An interpretative guide is provided to help parents and other PSSA-M stakeholders better understand the test-result information presented in the individual student report. The interpretative guide can be found on the PDE website.

Chapter Seventeen: Operational Test Statistics
2012 PSSA-M Technical Report Page 169
Chapter Seventeen: Operational Test Statistics This chapter presents various summary statistics for the PSSA-M total test scores based on the final data file described in Chapter Nine. Related information covered elsewhere in this report includes the item-level statistics presented in Chapter Eleven (classical item statistics) and Chapter Twelve (Rasch item statistics). Refer to these chapters for additional consideration as item-difficulty distributions can affect total score distributions.
PERFORMANCE-LEVEL STATISTICS
Table 17–1 presents performance-level percentages by grade and content. Appendix M provides performance-level percentages for prior years.
Table 17–1. Performance-Level Percentages for the 2012 PSSA-M
Percentage in Each Performance Level
Subject Grade Below Basic
Basic Proficient Advanced
Mathematics 4
8.3 44.1 34.9 12.8 Reading 5.7 36.5 33.3 24.5
Mathematics 5
9.0 48.7 34.9 7.4 Reading 7.2 31.7 39.5 21.6
Mathematics 6
8.4 52.3 33.0 6.2 Reading 10.1 37.9 40.4 11.6
Mathematics 7
10.6 54.5 29.2 5.7 Reading 15.4 40.2 31.4 13.0
Mathematics 8
11.9 51.0 33.1 4.0 Reading 16.8 46.0 31.5 5.7 Science 14.6 41.4 37.8 6.1
Mathematics 11
24.0 44.3 26.0 5.7 Reading 19.8 38.4 37.3 4.5 Science 9.3 49.5 34.9 6.3
SCALED SCORES
Summary Statistics
Table 17–2 provides the scaled-score means and standard deviations. (See the section “Every Test Has a Unique Scale” in Chapter Sixteen for caveats regarding interpretation of scaled scores.) The difference in standard deviations among tests is a byproduct of fixing the Basic and Proficient cut points during the scaling process.
Table 17–2. Means and Standard Deviations for the 2012 PSSA-M Scaled Scores
Mathematics Reading Science Grade Mean SD Mean SD Mean SD
4 1262.1 81.7 1293.4 94.6 5 1253.5 81.7 1307.3 109.7 6 1249.4 79.6 1275.2 95.8 7 1240.2 76.5 1260.6 101.2 8 1242.7 82.1 1246.5 95.0 1260.1 103.0

Chapter Seventeen: Operational Test Statistics
2012 PSSA-M Technical Report Page 170
11 1222.1 99.8 1242.2 112.4 1258.6 89.6
Scaled Score Distributions
Scaled scores are based on a linear transformation of the Rasch ability estimates. Distributions of the Rasch abilities are provided at the end of Chapter Twelve.
RAW SCORES
Summary Statistics
Appendix H provides summary statistics for the operational raw scores. The statistics reported include the number of students tested (N), number of items (L), number of points possible (Pts), minimum score points received (Min), maximum points received (Max), mean score points received (Mean), median score points received (Med), and standard deviation of test scores (SD). These statistics are based on the total test using both multiple-choice (MC) and open-ended (OE) items for the operational sections of each form. (For those interested in information disaggregated by item type, Chapter Eleven provides breakout statistics for MC and OE items.)
Score Distributions
Raw-score relative-frequency (rf) distributions are provided in Figure 17–1. Most distributions are unimodial and slightly positively skewed in mathematics and slightly negatively skewed in reading.

Chapter Seventeen: Operational Test Statistics
2012 PSSA-M Technical Report Page 171
Figure 17–1. Raw Score Distributions

Chapter Seventeen: Operational Test Statistics
2012 PSSA-M Technical Report Page 172

Chapter Seventeen: Operational Test Statistics
2012 PSSA-M Technical Report Page 173

Chapter Seventeen: Operational Test Statistics
2012 PSSA-M Technical Report Page 174

Chapter Eighteen: Reliability
2012 PSSA-M Technical Report Page 175
Chapter Eighteen: Reliability According to the Standards for Educational and Psychological Testing (AERA, APA, & NCME, 1999), reliability refers to
the degree to which test scores for a group of test takers are consistent over repeated applications of a measurement procedure and hence are inferred to be dependable and repeatable for an individual test taker; the degree to which scores are free of errors of measurement for a given group (p. 25).
Frisbie (2005) highlighted several elements of this definition. First, reliability is a property of the test scores, not of the test itself. Many may appreciate this distinction, but in casual usage, individuals frequently make reference to a reliable test. While reliability concerns test scores (and not the test specifically), it is important to appreciate the fact that test scores can be affected by characteristics of the instrument. For example, all other things being equal, tests with more items/points tend to be more reliable than tests with fewer items/points. Second, reliability coefficients are group specific. Reliabilities tend to be higher in populations that are more heterogeneous and lower in populations that are more homogeneous. Consequently, both test length and population heterogeneity should be considered when evaluating reliability.
There are other reliability considerations that may be less evident from the Standards definition, yet are still important for test users to understand. While freedom from measurement error is highlighted in the definition above, reliability is specifically concerned with random sources of error. Indeed, the degree of inconsistency due to random error sources is what determines reliability: less consistency is associated with lower reliability and more consistency is associated with higher reliability. Of course, systematic error sources also exist. These can artificially increase reliability and decrease validity. (Validity is further discussed in Chapter Nineteen.)
Another noteworthy issue is that multiple sources of error exist (e.g., the day of testing, the items used, the raters who score the items). However, most widely used reliability indices only reflect a single type of error. Consequently, it is important for test users to understand what specific type of error is being considered in a reliability study, and equally, if not more important, what types are not.
Understanding the distinction between relative error and absolute error is also important as many reliability indices only reflect relative error. Relative error is of interest whenever the relative ordering of individuals with respect to their test performance is of interest. Understanding examinee rank-order stability is important; however, such stability might be well achieved even when the specific score values are considerably different. When specific score values are considered important (e.g., if cut scores are used), then one should be interested in absolute error too. Generally, there is more error variance when considering the absolute scores of examinees, which in turn suggests lower reliability.

Chapter Eighteen: Reliability
2012 PSSA-M Technical Report Page 176
As suggested above, reliability is a complex, nonunitary notion that cannot be adequately represented by a single number. There are several reliability indices available and these may not provide the same results (Frisbie, 2005). The remainder of this chapter covers the following:
Reliability coefficients and their interpretation
Unconditional and conditional standard errors of measurement (SEMs and CSEMs)
Decision consistency
Rater agreement
RELIABILITY INDICES
As shown below, the reliability coefficient expresses the consistency of test scores as the ratio of true score variance to total score variance. The total variance contains two components: 1) the variance in true scores and 2) the variance due to the imperfections in the measurement process. Put differently, total variance equals true-score variance plus error variance:5
Reliability coefficients indicate the degree to which differences in test scores reflect true differences in the attribute being tested rather than random fluctuations. Total test score variance (i.e., individual differences) is partly due to real differences in the attribute (i.e., true variance) and partly due to random error in the measurement process (i.e., error variance).
Reliability coefficients range from 0.0 to 1.0. If all test score variance were true, the index would equal 1.0. The index would be 0.0 if none of the test score variance were true. Such scores would be pure random noise (i.e., all measurement error). If the index achieved a value of 1.0, scores would be perfectly consistent (i.e., contain no measurement error). Although values of 1.0 are never achieved in practice, it is clear that larger coefficients are more desirable, as that indicates test scores less influenced by random error. (How big is big enough and how small is too small are issues considered in a later section.)
As noted in the introduction, there are several different indices that can be used to estimate this ratio. One approach is referred to as internal consistency, which is derived from analyzing the performance consistency of individuals over the items within a test. As discussed below, these internal consistency indices do not take into account other sources of error—for example, variations due to random errors associated with the linking process; day-to-day variations (student health, testing environment, etc.); or rater inconsistency.
COEFFICIENT ALPHA
Although a number of reliability indices exist, perhaps the one most frequently reported for achievement tests is coefficient alpha. Consequently, this index is the one reported for the PSSA-M. Alpha indicates the internal consistency over the responses to a set of items measuring an underlying trait, in this case, academic achievement in subject areas such as mathematics.
5 A covariance term is not required as true scores and error are assumed to be uncorrelated in classical test theory.
22
2
2
22
ET
T
X
TX

Chapter Eighteen: Reliability
2012 PSSA-M Technical Report Page 177
Alpha is an internal consistency index. It can be conceptualized as the extent to which an exchangeable set of items from the same domain would result in a similar rank ordering of students. Note that relative error is reflected in this index. Variation in student performance from one sample of items to the next should be of particular concern for any achievement test user. Consider two hypothetical vocabulary tests intended for the same group of students. Each test contains different sets of unique words that are believed to be randomly equivalent, perhaps like the ones shown below.
Table 18–1. Two Hypothetical Vocabulary Tests
Test One Test TwoAbase Abate Boon Bilk Capricious Circuitous Deface Debase ···· ···· Zealous Zenith
If a representative group of students could take both of these tests, and the correlation between the scores could be obtained, then that result would represent the parallel forms reliability of the test scores. However, such data-collection designs are impractical in large-scale settings and experimental confounding factors like fatigue and practice effects are likely to affect the results. Internal-consistency reliability indices arose in part to provide reliability measures using the data from just a single test administration. So, if students only took Test One and the coefficient alpha index for those test scores was high, then this would suggest that Test Two would provide a very similar rank ordering of the students if they took it instead. If coefficient alpha were low, dissimilar rank orderings would likely be observed—again, relative-error variance is reflected in alpha. (It should also be noted that coefficient alpha is algebraically identical to a p × I design under generalizability theory when relative error variance is assumed.)
Formula
Consider the following data matrix representing the scores of persons (rows) on items (columns).
Table 18–2. Person × Item Score (Xpi) Infinite (Population-Universe) Matrix
Item
Person 1 2 . . . I . . . k
1 Y11 Y12 . . . Y1i . . . X1k 2 Y21 Y22 . . . Y2i . . . X2k . . . . . . . . . . . .
P Yp1 Yp2 . . . Ypi . . . Xpk . . . . . . . . . . . .
N YN1 YN2 . . . YNi . . . XNk
Note. Adapted from Cronbach and Shavelson (2004).

Chapter Eighteen: Reliability
2012 PSSA-M Technical Report Page 178
Then, a general computational formula for alpha is as follows:
,
where N is the number of parts (items or testlets), is the variance of the observed total test
scores, and is the variance of part i.
FURTHER INTERPRETATIONS
Rules of Thumb
What reliability value is considered high enough? What values are considered too low? Although frequently asked for, any rules of thumb for interpreting the magnitude of reliability indices are mostly arbitrary. Another approach is to research the reliabilities from similar testing instruments to see what values are commonly observed. For the PSSA-M, comparisons to tests of similar lengths that were administered to similar student populations from other large-scale assessment programs would be relevant. For many other state assessment programs, reliabilities in the low 0.90s are usually the highest ever observed, and reliabilities in the high 0.80s are very common.
The lower a given reliability coefficient, the greater the potential for overinterpretation of the associated results. As suggested above, there is no firm guideline regarding how low is too low. However, as an informative point of reference, a reliability coefficient of 0.50 would suggest that there is as much error variance as true-score variance in the scores.
Is Alpha a Lower Limit to Reliability?
According to Brennan (1998), “the conventional wisdom that Coefficient Alpha is a lower limit to reliability is based largely on a misunderstanding.” In reflecting on the 50th anniversary of his seminal 1951 article, Cronbach—in Cronbach and Shavelson (2004)—expressed similar misgivings about this conventional wisdom:
one could argue that alpha was almost an unbiased estimate of the desired reliability … the almost in the preceding sentence refers to a small mathematical detail that causes the alpha coefficient to run a trifle lower than the desired value. This detail is of no consequence and does not support the statement made frequently in textbooks or in articles that alpha is a lower value to the reliability coefficient. That statement is justified by reasoning that starts with the definition of the desired coefficient as the expected consistency among measurements that had a higher degree of parallelism than the random parallel concept implied.
The assumptions for three common parallelism models are presented in Table 18–3. Alpha’s assumptions come from the essentially tau-equivalent model, which does not require equal means or equal variances across test parts. Based on this, Brennan (1998) asserts that the lower-limit issue, as conceptualized by many, provides an answer to a question that is of minimal importance. Reframed differently, the goal of selecting a reliability coefficient is not to find the one that provides the highest coefficient, but the one that most accurately reflects the test data under study.
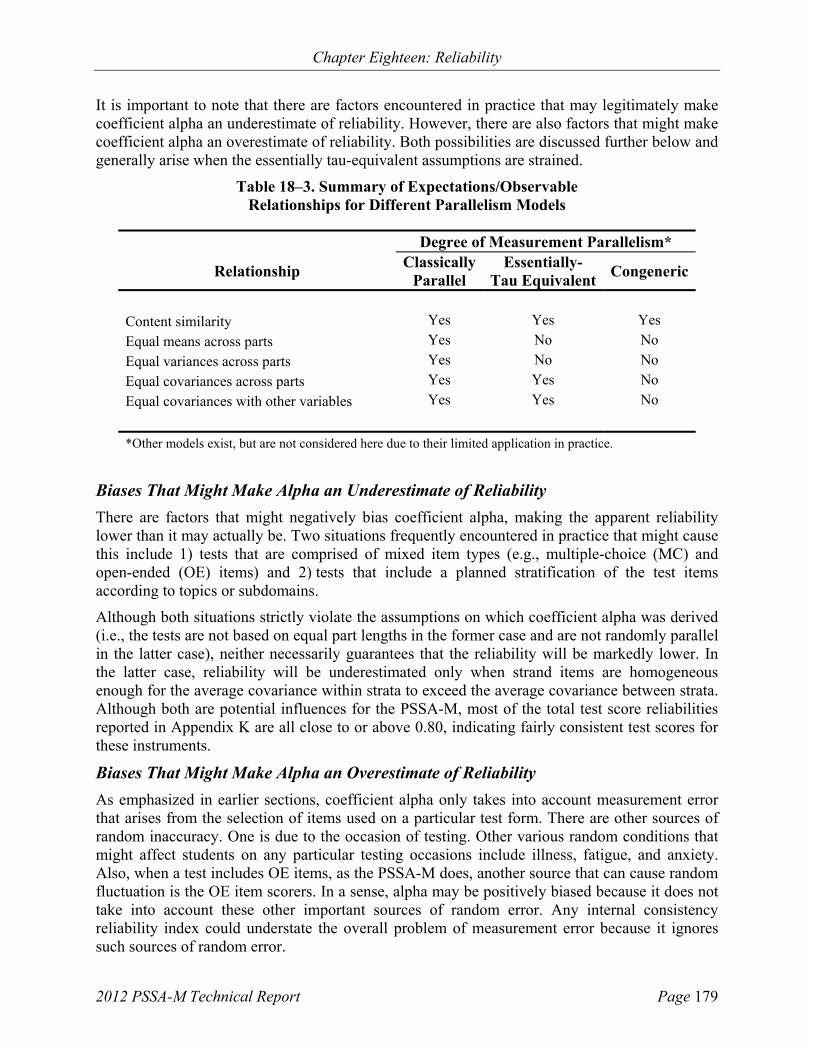
Chapter Eighteen: Reliability
2012 PSSA-M Technical Report Page 179
It is important to note that there are factors encountered in practice that may legitimately make coefficient alpha an underestimate of reliability. However, there are also factors that might make coefficient alpha an overestimate of reliability. Both possibilities are discussed further below and generally arise when the essentially tau-equivalent assumptions are strained.
Table 18–3. Summary of Expectations/Observable Relationships for Different Parallelism Models
Degree of Measurement Parallelism*
Relationship Classically
Parallel Essentially-
Tau Equivalent Congeneric
Content similarity Yes Yes Yes
Equal means across parts Yes No No
Equal variances across parts Yes No No
Equal covariances across parts Yes Yes No
Equal covariances with other variables Yes Yes No
*Other models exist, but are not considered here due to their limited application in practice.
Biases That Might Make Alpha an Underestimate of Reliability
There are factors that might negatively bias coefficient alpha, making the apparent reliability lower than it may actually be. Two situations frequently encountered in practice that might cause this include 1) tests that are comprised of mixed item types (e.g., multiple-choice (MC) and open-ended (OE) items) and 2) tests that include a planned stratification of the test items according to topics or subdomains.
Although both situations strictly violate the assumptions on which coefficient alpha was derived (i.e., the tests are not based on equal part lengths in the former case and are not randomly parallel in the latter case), neither necessarily guarantees that the reliability will be markedly lower. In the latter case, reliability will be underestimated only when strand items are homogeneous enough for the average covariance within strata to exceed the average covariance between strata. Although both are potential influences for the PSSA-M, most of the total test score reliabilities reported in Appendix K are all close to or above 0.80, indicating fairly consistent test scores for these instruments.
Biases That Might Make Alpha an Overestimate of Reliability
As emphasized in earlier sections, coefficient alpha only takes into account measurement error that arises from the selection of items used on a particular test form. There are other sources of random inaccuracy. One is due to the occasion of testing. Other various random conditions that might affect students on any particular testing occasions include illness, fatigue, and anxiety. Also, when a test includes OE items, as the PSSA-M does, another source that can cause random fluctuation is the OE item scorers. In a sense, alpha may be positively biased because it does not take into account these other important sources of random error. Any internal consistency reliability index could understate the overall problem of measurement error because it ignores such sources of random error.

Chapter Eighteen: Reliability
2012 PSSA-M Technical Report Page 180
Another positive bias can occur when items are associated (clustered) with a common stimulus. “Item bundles” and “testlets” are other frequently used terms for this situation. One concrete example is when multiple reading comprehension items are associated with a common passage selection. Again, such a situation does not guarantee that the reliability estimate will be markedly affected, but the potential exists.
Strand (Reporting Category) Scores
As noted in the introduction, reliabilities tend to go up in value with an increase in test length and go down in value with a decrease in test length. Figure 18–1 illustrates this relationship for a hypothetical 45-point test with three total score reliabilities: 0.95, 0.90, and 0.85. As an example, with the curve for reliability equal to 0.90, a 10-item strand would be expected to have a score reliability of just over 0.65. The use of the Spearman-Brown prophecy formula assumes all items are exchangeable, which in practice they may not be. While such a chart may not perfectly model actual strand correlations, the intent is only to illustrate the substantial impact that limited numbers of strand items can have on strand-score reliability. It is not surprising that strand scores with more points tend to show higher reliability coefficients and those with fewer points tend to show lower reliability coefficients. Further, what is most important for PSSA-M users to note is that some strand score reliabilities may be too low to warrant interpretation at the individual student level.
Figure 18–1. Example of the Relationship between Test Length and Reliability
Note. Tabled values derived using the Spearman-Brown formula.
Reliability Curves
00.05
0.10.150.2
0.250.3
0.350.4
0.450.5
0.550.6
0.650.7
0.750.8
0.850.9
0.951
0 5 10 15 20 25 30 35 40 45
Number of Items
Est
imat
ed
Rel
iab
ilit
y
Rel. = 0.95 Rel. = 0.90 Rel. = 0.85

Chapter Eighteen: Reliability
2012 PSSA-M Technical Report Page 181
Individual-Level versus Group-Level Scores
The results presented in this chapter pertain to the reliability of individual scores. Group results (e.g., state and district levels) are also provided on PSSA-M score reports, but the reliability of those scores is not specifically calculated here. However, as a general rule the reliabilities of group mean scores are almost always higher (sometimes substantially) than the corresponding reliabilities for individual scores. This is especially important to remember for strand scores because those scores can be quite reliable at the group level, even though their individual reliabilities may be too low. Because the reliability of group mean scores (e.g., school or district means) tends to be higher than that of individual scores, the interpretation of strand scores at these aggregate levels is likely very reasonable in most instances. Even though the reliability for mean scores based on only a few items might be adequate, the validity of those same scores might be suspect because use of only a few items may not adequately cover the construct of interest. Validity is further discussed in Chapter Nineteen.
STANDARD ERROR OF MEASUREMENT
The reliability coefficient is a unit-free indicator that reflects the degree to which scores are free of measurement error. It always ranges between 0.0 and 1.0 regardless of the test’s scale. Reliability coefficients best reflect the extent to which measurement inconsistencies may be present or absent in a group. However, they are not that useful for helping users interpret test scores. The standard error of measurement (SEM) is another indicator of test score precision that is better suited for determining the effect of measurement inconsistencies for the scores obtained by individual examinees. This is particularly so for conditional SEMs (CSEM) discussed further below.
Traditional Standard Error of Measurement
A precise, theoretical interpretation of the SEM is somewhat unwieldy. A beginning point for understanding the concept is as follows. If everyone being tested had the same true score6, there would still be some variation in observed scores due to imperfections in the measurement process, such as random differences in attention during instruction, concentration during testing, or the sampling of test items. The standard error is defined as the standard deviation7 of the distribution of observed scores for students with identical true scores. Because the SEM is an index of the random variability in test scores in actual score units, it represents very important information for test score users.
The SEM formula is provided below:
SEM SD 1 reliability
This formula indicates that the value of the SEM depends on both the reliability coefficient and the standard deviation of test scores. If the reliability were equal to 0.00 (the lowest possible value), the SEM would be equal to the standard deviation of the test scores. If test reliability were equal to 1.00 (the highest possible value), the SEM would be 0.0. In other words, a perfectly reliable test has no measurement error (Harvill, 1991). Additionally, the value of the SEM takes the group variation (i.e., score standard deviation) into account. Consider that an SEM of 3 on a 10-point test would be very different from an SEM of 3 on a 100-point test.
6 True score is the score the person would receive if the measurement process were perfect. 7 The standard deviation of a distribution is a measure of the dispersion of the observations. For the normal distribution, about 16 percent of the observations are more than one standard deviation above the mean.

Chapter Eighteen: Reliability
2012 PSSA-M Technical Report Page 182
Traditional SEM Confidence Intervals
The SEM is an index of the random variability in test scores in actual score units, which is why it has such great utility for test score users. SEMs allow statements regarding the precision of individual test scores. SEMs help place “reasonable limits” (Gulliksen, 1950) around observed scores through construction of an approximate score band. Often referred to as confidence intervals, these bands are constructed by taking the observed scores, X, and adding and subtracting a multiplicative factor of the SEM. As an example, students with a given true score will have observed scores that fall between +/– 1 SEM about two-thirds of the time.8 For +/– 2 SEM confidence intervals, this increases to about 95 percent.
Further Interpretations
ONE SEM FOR ALL TEST SCORES
The SEM approach described above only provides a single numerical estimate for constructing the confidence intervals for examinees regardless of their score level. In reality however, such confidence intervals vary according to one’s score. Consequently, care should be taken using the SEM for students with extreme scores. (In the next sections, an alternate approach is described that conditions the SEM on a student’s score estimate.)
GROUP SPECIFIC
As noted in the introduction, reliabilities are group specific. The same is true for SEMs because both score reliabilities and score standard deviations vary across groups.
RAW SCORE METRIC
The SEM approach is calculated using raw scores, and as such, the resulting confidence interval bands are on the raw score metric. Error bands on the scaled score metric are considered in the next section.
TYPE OF ERROR REFLECTED
The interpretation of the SEM should be driven by the type of score reliability that underpins it; so, the PSSA-M SEMs involve the same source of error relevant to internal consistency indices. As noted earlier, a precise technical explanation of the SEM (and resulting confidence intervals) can be unwieldy. Because of this, score users are often provided less complex interpretations.
One simpler description is that a confidence interval represents the possible score range one would observe if a student could be tested twice with the same instrument. Taking the same test on a different day implies the only source of random error being considered is related to the occasion of testing, such as a student might be sleepier one day than another, might be sick, or maybe did not get a good breakfast. The reliability index that captures this source of random error is referred to as the test-retest reliability coefficient. This is not the type of reliability computed for the PSSA-M. When internal consistency reliability estimates are used, such an explanation blurs the fact that random error based on the occasion of testing is not considered.
8 Some prefer the following interpretation: if a student were tested an infinite number of times, the +/– 1 SEM confidence intervals constructed for each score would capture the student’s true score 68 percent of the time.

Chapter Eighteen: Reliability
2012 PSSA-M Technical Report Page 183
When SEMs are derived from internal consistency reliability estimates, a better approach is to describe the confidence interval as providing reasonable bounds for the range of scores that a student might receive if he or she took an equivalent version of the test. (That is, the student took a test that covered exactly the same content but included a different set of items.) As an example, if the PSSA-M score was 1750 and the SEM band was 1700 to 1800, then a student would be likely to receive a score somewhere between 1700 and 1800 if a different version of the test were taken. (cf. “If an infinite number of tests with equivalent content were taken, the student’s true score will lie within the constructed confidence intervals 68 percent of the time.” The prior version may be more adequate for lay persons.)
Results and Observations
Coefficient alpha results and associated (traditional) SEMs for various PSSA-M scores are documented in Appendix K. Values were derived using the PSSA-M final data file (see Chapter Nine). The results are organized by subject area and grade. Each table also breaks out the various reporting strands and groups of interest (i.e., the total student population), gender and ethnic groups, English language learners (ELL), and the economically disadvantaged (ED). The statistics reported include the number of points possible (Pts.), number of items (Len.), number of students tested (N), mean number of score points received (Mean), standard deviation of test scores (SD), reliability (r), traditional standard error of measurement (SEM), and item types (Items) used to determine each score.
Note that these tables report the standard deviations of observed scores. Assuming normally distributed scores, one would expect about two-thirds of the observations to be within one standard deviation of the mean. An estimate of the standard deviation of the true scores can be computed as )ˆ1(ˆˆˆ 22
xxxxT .
The overall test score reliability values are at what many would consider to be the lower end of the adequate range for making decisions about individual students (with many in the low 0.80s). Earlier it was noted that reliabilities tend to go up in value with an increase in test length9 and population heterogeneity, and go down in value with a decrease in test length and more homogeneous populations. Across the grades and subjects tabled in Appendix K, reliabilities for the substrands tended to follow these same trends; that is, strands with more items tended to show higher reliability coefficients. Also, groups exhibiting more variability in test scores tended to have higher reliability coefficients. Perhaps the most significant result pertains to an earlier caution (i.e., that some strand score reliabilities are too low to warrant interpretation at the individual student level).10 Once again, there is no firm guideline regarding how low is too low. The lower a given reliability coefficient, the greater the potential for overinterpretation. As a point of reference, a reliability coefficient of 0.50 would suggest that there is as much error variance as true-score variance in the scores. It should be noted that the reliability of group mean scores (e.g., school or district means) tends to be higher than that of individual scores, suggesting that interpretation of strand scores at these aggregate levels might be reasonable in some cases. 9 Using the Spearman-Brown formula, if the PSSA-M mathematics test was the same length as the general PSSA mathematics test, the projected reliability would be in the high 0.80s. Coefficient alpha estimates from the PSSA test are generally in the low 0.90s. The reduced test length largely accounts for the difference. Homogeneity in the testing population may be responsible for the remainder. 10 In fact, a few reliability values in the appendix are negative. Theoretically, reliability values should be nonnegative. However, the computational formula for alpha can yield negative results on rare occasions (when sample sizes are small). This likely indicates that the true score variance is in reality extremely small and sampling error resulted in the negative alpha estimate.

Chapter Eighteen: Reliability
2012 PSSA-M Technical Report Page 184
RASCH CONDITIONAL STANDARD ERRORS OF MEASUREMENT
The conditional standard error of measurement (CSEM) also indicates the degree of measurement error but does so in scaled-score units and varies as a function of one’s actual scaled score. Therefore, the CSEM may be especially useful in characterizing measurement precision in the neighborhood of a score level used for decision-making, such as cut scores for identifying students who meet a performance standard.
Technically, when a Rasch model is applied, the CSEM at any given point on the ability continuum is defined as the reciprocal of the square root of the test information function derived from the Rasch scaling model:
)(
1)ˆ(
ICSEM
where, CSEM = conditional standard error of measurement and I(θ) = test information
function. Test information depends on the sum of the corresponding information functions for the test items. Item information depends on each item’s difficulty and conditional item score variance. The formula above utilizes the Rasch ability (θ) metric. The conditional standard error
on the scaled score (SS) metric is determined by multiplying the CSEM by the slope
(multiplicative constant, m) of the linear transformation equation used to convert the Rasch ability estimates to scaled scores:
CSEM(SS) = CSEM * m
Chapter Fourteen provides the linear transformation formulas for each PSSA-M test.
Rasch CSEM Confidence Intervals
CSEMs also allow statements regarding the precision of individual test scores. And like SEMs, they help place reasonable limits around observed scaled scores through construction of an approximate score band. The confidence intervals are constructed by adding and subtracting a multiplicative factor of the CSEM and may be interpreted as described in the earlier section.
Further Interpretations
DIFFERENT CSEMS FOR DIFFERENT TEST SCORES
The CSEM approach provides different numerical estimates for constructing the confidence intervals for examinees depending on their specific score level. The magnitude of the CSEM values is “U” shaped with larger CSEM values associated with lower and higher scores.
GROUP SPECIFIC
Assuming reasonable model-data fit—as explored in Chapter Twelve—the Rasch based CSEMs (conditioned on score level) should not vary across groups.

Chapter Eighteen: Reliability
2012 PSSA-M Technical Report Page 185
SCALED SCORE METRIC
The CSEM and associated confidence interval bands are on the scaled score metric.
TYPE OF ERROR REFLECTED
The SEMs documented on the PSSA-M score reports are the Rasch-based conditional standard errors of measurement described above. These are provided by the WINSTEPS scaling program described in Chapter Twelve. As noted earlier, these CSEMs are based on the concept of statistical information. For the purpose of providing a simpler explanation of SEMs to test score users, the PSSA-M score report interpretive documents provided the earlier description of SEMs framed using the idea of internal consistency reliability.11 Score report content is considered in greater detail in Chapter Sixteen.
Results and Observations
Figure 18–2 shows the Rasch CSEMs associated with each scaled score level. (This information is also provided in tabular form in Appendix N.) Values were derived using the final data file described in Chapter Nine. The values are fairly consistent across a noticeably large range of the scaled scores, as demonstrated by the relatively flat bottoms of most plots. The values increase at both extremes (i.e., at smaller and larger scaled scores), giving these figures their typical U-shaped pattern. (Only the SEMs for scores greater than the lowest observable scaled scores (LOSS) are shown in the figures; consequently, the complete U-shape does not appear in most plots.) The three red-dashed lines represent the Basic-M, Proficient-M, and Advanced-M scaled score cuts, respectively, moving from lower to higher scaled score values. SEM values at the cut score lines were generally associated with smaller SEM values, indicating more precise measurement occurs at these cuts. This was particularly true for the Proficient-M and Advanced-M cuts.
11 Because IRT CSEMs are based on statistical information, it is questionable if they account for error variance due to items. However, it seems difficult to construct a simple explanation of IRT CSEMs for the general public.

Chapter Eighteen: Reliability
2012 PSSA-M Technical Report Page 186
Figure 18–2. Conditional Standard Error Plots for Each Grade and Subject

Chapter Eighteen: Reliability
2012 PSSA-M Technical Report Page 187

Chapter Eighteen: Reliability
2012 PSSA-M Technical Report Page 188

Chapter Eighteen: Reliability
2012 PSSA-M Technical Report Page 189

Chapter Eighteen: Reliability
2012 PSSA-M Technical Report Page 190
DECISION CONSISTENCY
Classification consistency refers to the degree to which the achievement level for each student can be replicated upon retesting using an equivalent form (Huynh, 1976). In a standards-based testing program there should be great interest in knowing how accurately students are classified into performance categories. In contrast to coefficient alpha, which is concerned with the relative rank-ordering of students, it is the absolute values of student scores that are important in decision consistency.
Decision consistency answers the question What is the agreement between the classifications based on two nonoverlapping, equally difficult forms of the test? If two parallel forms of the test were given to the same students, the consistency of the measurement would be reflected by the extent to which the classification decisions made from the first set of test scores matched the decisions based on the second set of test scores. Consider Tables 18–4 and 18–5 below.
Table 18–4. Pseudo-Decision Table for Two Hypothetical Categories
TEST ONE LEVEL I LEVEL II MARGINAL
TE
ST
TW
O LEVEL I
11
12
1●
LEVEL II 21
22
2●
MARGINAL ●1
●2
1
Table 18–5. Pseudo-Decision Table for Four Hypothetical Categories
TEST ONE LEVEL I LEVEL II LEVEL III LEVEL IV MARGINAL
TE
ST
TW
O LEVEL I
11
12
13
14
1●
LEVEL II 21
22
23
24
2●
LEVEL III 31
32
33
34
3●
LEVEL IV 41
42
43
44
4●
MARGINAL ●1
●2
●3
●4
1
If a student is classified as being in one category based on Test One’s score, how probable would it be that the student would be reclassified as being in the same category if he or she took Test Two (a nonoverlapping, equally difficult form of the test)?

Chapter Eighteen: Reliability
2012 PSSA-M Technical Report Page 191
The proportions of correct decisions, , for two and four categories are computed by the following two formulas, respectively:
= 11
+ 22
= 11
+ 22
+ 33
+ 44.
It is the sum of the diagonal entries—that is, the proportion of students classified by the two forms into exactly the same achievement level—that signifies the overall consistency.
Since it is not feasible to repeat PSSA-M testing in order to estimate the proportion of students who would be reclassified in the same performance levels, a statistical model needs to be imposed on the data in order to project the consistency of classifications solely using data from the available administration (Hambleton and Novick, 1973). Although a number of procedures are available, two well-known methods were developed by Hanson and Brennan (1990) and Livingston and Lewis (1995) utilizing specific true-score models. These approaches are fairly complex, and the cited sources contain details regarding the statistical models used to calculate decision consistency from the single PSSA-M administration.
Further Interpretations
Several factors might affect decision consistency. One important factor is the reliability of the scores. All other things being equal, more reliable test scores tend to result in more similar reclassifications. Another factor is the location of the cut score in the score distribution. More consistent classifications are observed when the cut scores are located away from the mass of the score distribution. For example, when scores are close to being normally distributed, the mass is concentrated in the middle of the distribution, and thus classifications tend to become more consistent when cut scores go up from 70 percent to 80 percent to 90 percent, or alternatively go down from 30 percent to 20 percent to 10 percent. The number of performance levels is also a consideration. Consistency indices for four performance levels should be lower than those based on two categories. This is not surprising since classification using four levels would allow more opportunity to change achievement levels; hence, there would be more classification errors with four achievement levels, resulting in lower consistency indices. Lastly, some research has found that results from the Hanson and Brennan (1990) method on a dichotomized version of a complex assessment yields similar results to the Livingston and Lewis (1995) method (Stearns and Smith, 2007).
Results and Observations
The results for the overall consistency across all four performance levels as well as for the dichotomies created by the three cut scores are presented in Table 18–6. The tabled values—derived using the program BB-Class (Brennan, 2004)—showed that consistency values across the two methods were generally very similar. The Hanson and Brennan values were equal to or just slightly higher than the Livingston and Lewis values (by about 0.01) in most cases.
The overall decision consistency was generally in the mid-0.60s. It should be noted that the overall consistency indices (across all four performance levels) should logically be lower than those based on two categories (as discussed above).
Regarding dichotomous decisions, the Basic-M cuts generally had the highest consistency values at the lower grade levels, where most exceeded 0.90. The Advanced-M cuts had the highest consistency values at the higher grade levels, where most exceeded 0.90. Proficient-M cut decision consistency values were in the low to mid-0.80s at all grade levels.

Chapter Eighteen: Reliability
2012 PSSA-M Technical Report Page 192
As a point of comparison, recent general PSSA decision consistency values typically ranged from the high 0.90s to mid-0.80s with the Basic cut generally yielding the highest values and the Advanced cut yielding the lowest values. Overall consistency values were generally in the low to mid-0.70s. Thus, for the PSSA-M, some individual cut consistencies were as high as the general PSSA, while the overall and Proficient-M cut consistencies were lower. The PSSA-M’s shorter test length and lower reliabilities may have been contributing factors in these cases.
Table 18–6. Decision Consistency Results
Grade Method Overall BBas/Bas Bas/Prof Prof/Adv
Mat
hem
atic
s
4 HB 0.64 0.92 0.82 0.90 LL 0.64 0.92 0.81 0.90
5 HB 0.65 0.91 0.81 0.93 LL 0.65 0.91 0.81 0.93
6 HB 0.65 0.90 0.81 0.94 LL 0.66 0.89 0.81 0.95
7 HB 0.68 0.89 0.84 0.95 LL 0.67 0.88 0.84 0.95
8 HB 0.67 0.89 0.83 0.95 LL 0.67 0.88 0.83 0.96
11 HB 0.63 0.83 0.85 0.95 LL 0.63 0.83 0.85 0.95
Rea
din
g
4 HB 0.63 0.92 0.83 0.87 LL 0.62 0.91 0.83 0.87
5 HB 0.66 0.93 0.86 0.87 LL 0.66 0.92 0.86 0.87
6 HB 0.65 0.92 0.85 0.88 LL 0.65 0.92 0.85 0.88
7 HB 0.62 0.88 0.84 0.89 LL 0.62 0.88 0.84 0.90
8 HB 0.63 0.88 0.82 0.93 LL 0.63 0.87 0.82 0.93
11 HB 0.65 0.89 0.82 0.93 LL 0.65 0.88 0.82 0.94
Sci
ence
8 HB 0.63 0.89 0.81 0.92 LL 0.63 0.89 0.81 0.93
11 HB 0.68 0.89 0.85 0.94 LL 0.68 0.89 0.85 0.94

Chapter Eighteen: Reliability
2012 PSSA-M Technical Report Page 193
RATER AGREEMENT
Because open-ended items are included on the PSSA-M, another source of random error is related to the scorers of those items. Frisbie (2005) noted that “test score reliability differs from scorer reliability” and that “the need for one kind of estimate cannot be satisfied by the other.” Additionally, the data most easily obtainable that captures this information comes from the “10 percent read behinds” collected during the scoring process (see Chapter Eight for a description). Partly because of the way this data is obtained and reported (i.e., it is not a ratio of true-score variance over observed-score variance), the term “rater agreement” is used here, not “rater reliability” or “inter-rater reliability,” because these terms are somewhat misleading, as explained above.
Further Interpretations
For the PSSA-M, only within-year consistency is available. In future administrations, across-year rater consistency may be available for consideration as well.
Results and Observations
Within-year rater agreement information is provided in Chapter Eight. This information is reformatted in Table 18–7 for PSSA-M mathematics OE items. In addition, the percentages awarded to each score point are also presented in this table. The exact inter-rater agreement percentages generally ranged from the low 80s to high 90s for mathematics and science and from the mid-70s to high 80s for reading. Validity indices generally were nearly 100 for all subjects. The tabled values are similar to results historically obtained for the general PSSA.
Table 18–7. Inter-Rater Agreement and Percentage Awarded for Each Score Point for OE Items—Mathematics
Inter-Rater Agreement Percentage
Percentage Awarded for Each Score Point
Grade Item Exact Adjacent Validity 0 1 2 3 4 B/NS
4 1 97 3 100 87 46 31 8 7 8 2 98 2 100 93 42 30 18 5 4
5 1 93 7 100 85 68 20 7 3 1 2 96 3 99 97 39 27 10 10 14
6 1 93 7 100 95 48 41 7 2 1 2 94 6 100 94 19 57 19 4 1
7 1 94 6 100 95 29 34 14 15 7 2 96 4 100 89 77 4 4 7 5
8 1 90 10 100 94 32 41 20 4 2 2 94 6 100 94 38 39 13 8 1
11 1 97 3 100 94 52 34 6 1 3 2 95 5 100 94 43 46 3 3 0
Note. B = blank; NS=non-scoreable. For more information regarding validity, see the section on handscoring validity process in Chapter Eight.

Chapter Eighteen: Reliability
2012 PSSA-M Technical Report Page 194
Table 18–8. Inter-Rater Agreement and Percentage Awarded for Each Score Point for OE Items—Reading
Inter-Rater Agreement Percentage
Percentage Awarded for Each Score Point
Grade Item Exact Adjacent Validity 0 1 2 3 B/NS
4 1 74 26 100 72 16 35 36 10 2 81 19 100 68 26 29 20 24
5 1 89 11 100 85 20 26 28 25 2 77 23 100 73 6 41 38 11
6 1 78 22 100 84 18 47 28 6 2 79 21 100 77 13 33 36 15
7 1 80 19 99 70 16 31 31 20 2 77 22 99 70 20 50 22 6
8 1 79 21 100 82 14 30 40 15 2 82 18 100 62 6 26 40 24
11 1 75 25 100 65 9 41 29 17 2 81 19 100 83 6 36 35 18
Note. B = blank; NS=non-scoreable. For more information regarding validity, see the section on handscoring validity process in Chapter Eight.
Table 18–9. Inter-Rater Agreement and Percentage Awarded for Each Score Point for OE Items—Science
Inter-Rater Agreement Percentage
Percentage Awarded for Each Score Point
Grade Item Exact Adjacent Validity 0 1 2 B/NS
8 1 88 12 100 96 29 45 24 2 85 15 100 95 25 54 19
11 1 81 19 100 82 16 41 32 2 88 12 100 90 61 25 5
Note. B = blank; NS=non-scoreable. For more information regarding validity, see the section on handscoring validity process in Chapter Eight.

Chapter Nineteen: Validity
2012 PSSA-M Technical Report Page 195
Chapter Nineteen: Validity As defined in the Standards for Educational and Psychological Testing (AERA, APA, & NCME, 1999), validity refers to “the degree to which evidence and theory support the interpretation of test scores entailed by proposed uses of tests” (p.9). The Standards provides a framework for describing the sources of evidence that should be considered when evaluating validity. These sources include evidence based on 1) test content, 2) response processes, 3) the internal structure of the test, 4) the relationships between test scores and other variables, and 5) the consequences of testing. In addition, when item response theory (IRT) models are used to analyze assessment data, validity considerations related to those processes should also be explored.
The validity process involves the collection of a variety of evidence to support the proposed test score interpretations and uses. This technical report describes the technical aspects of the PSSA-M tests in support of their score interpretations and uses. Each of the previous chapters contributes important evidence components that pertain to score validation: test development; test administration; test scoring; item analysis; Rasch calibration, scaling, and linking; score reporting; and reliability. This chapter summarizes and synthesizes the evidence based on the Standards framework. The purposes and intended uses of PSSA-M test scores are reviewed first, then each type of validity evidence is addressed in turn.
PURPOSES AND INTENDED USES OF THE PSSA-M
The Standards emphasizes that validity pertains to how test scores are used. To help contextualize the evidence that will be presented below, the purposes of the PSSA-M will be reviewed first. As stated in Chapter One, the main purposes of the PSSA-M (as with the general PSSA) are to
Provide students, parents, educators, and citizens with an understanding of student and school performance.
Determine the degree to which programs enable students to attain proficiency of academic standards.
Provide results to school districts, including charter schools, and Career and Technical Centers (CTCs) for consideration in the development of strategic plans.
Provide information to state policymakers, including the General Assembly, and the State Board, on how effective schools are in promoting and demonstrating student proficiency in meeting the academic standards.
Provide information to the general public on school performance.
Provide results to school districts, including charter schools, and CTCs based on the aggregate performance of all students and for relevant subgroups, such as students with an Individualized Education Program (IEP) and for those without an IEP.

Chapter Nineteen: Validity
2012 PSSA-M Technical Report Page 196
EVIDENCE BASED ON TEST CONTENT
Test content validity evidence for the PSSA-M rests greatly on establishing a link between each piece of the assessment (i.e., the items) and what the students should know and be able to do as required by the Assessment Anchors, Eligible Content, and/or the Academic Content Standards. The PSSA-M tests are intended to measure students’ knowledge and skills described in the Assessment Anchors, as defined by the Eligible Content for mathematics, and thus the evidence supporting the alignment among the PSSA-M tasks and the Assessment Anchors, as defined by the Eligible Content.
Lane (1999) suggests taking the following steps to support the validity of an assessment, such as the PSSA-M:
Evaluate the degree to which the PSSA-M test specifications represent and align with the knowledge and skills described in the Assessment Anchors, as defined by the Eligible Content, in terms of both content and cognitive processes.
Evaluate the alignment between the PSSA-M items and test specifications to ensure representativeness.
Evaluate the extent to which the curriculum aligns with the Assessment Anchors. If some contents are not included in the curriculum, then low scores on the PSSA-M should not be interpreted as meaning that instruction was ineffective.
Conduct content reviews of the PSSA-M items using a panel of content experts to see whether they measure the intended constructs or are the sources of construct-irrelevant variance.
Conduct fairness reviews of the items to avoid issues related to a specific subpopulation.
Evaluate procedures for administration and scoring, such as the appropriateness of instructions to examinees, time limit for the assessment, and training of raters.
Submit operational tests to third-party independent reviews.
Chapters Two–Eight of this report present a considerable amount of evidence related to test content. As described in these chapters, all the PSSA-M items were developed and aligned with the Assessment Anchors and Eligible Content following well-established procedures. After the items were developed, they underwent multiple rounds of content and bias reviews. After they were field tested, they were reviewed with respect to their statistical properties. Items selected for the operational assessment had to pass content, psychometric, and PDE reviews. Finally, the tests were administered according to standardized procedures with allowable accommodations.
Some efforts made to ensure content validity are summarized below:
DRC used Webb’s (1999) DOK model to ensure the PSSA-M items aligned with the Assessment Anchors, as defined by the Eligible Content, and the Academic Content Standards in terms of both content and cognitive levels.
DRC established detailed test and item/passage development specifications and ensured the items were sufficient in number and adequately distributed across content, levels of cognitive complexity, and difficulty.

Chapter Nineteen: Validity
2012 PSSA-M Technical Report Page 197
DRC and WestEd selected qualified item writers and provided training to help ensure they wrote high-quality items.
Each newly developed item was first reviewed by content specialists and editors at DRC or/and WestEd to ensure all items measured the intended Assessment Anchors, as defined by the Eligible Content for mathematics. Appropriateness for the intended grade was also considered, as well as depth of knowledge, graphics, grammar and punctuation, language demand, and distractor reasonableness.
Prior to field testing, the test items were submitted to content committees (composed of Pennsylvania educators) for review using, but not limited to, the following categories:
o Overall quality and clarity
o Anchor, eligible content, and/or standard alignment
o Grade-level appropriateness
o Difficulty level
o Depth of knowledge
o Appropriate sources of challenge (e.g., unintended content and skills)
o Correct answer
o Quality of distractors
o Graphics
o Appropriate language demand
o Freedom from bias
The items were also submitted to a Bias, Fairness, and Sensitivity Committee for review. This committee reviewed items for issues related to diversity, gender, and other pertinent factors.
Items passing all the prior hurdles were tried out in a field test event. Several statistical analyses were conducted on the field test data, including classical item analyses and distractor analyses. Items were once again carefully reviewed by DRC staff and a committee of Pennsylvania teachers with respect to their statistical characteristics.
The PSSA-M tests were administered according to standardized procedures with allowable accommodations. Students were given ample time to complete the tests (i.e., there were no speededness issues).
As shown in Chapter Eight, the raters for open-ended (OE) items were carefully recruited and well trained. Their scoring was monitored throughout the scoring session to ensure that an acceptable level of scoring accuracy was maintained.

Chapter Nineteen: Validity
2012 PSSA-M Technical Report Page 198
EVIDENCE BASED ON RESPONSE PROCESSES
Response-process evidence is used to examine the extent to which the cognitive skills and processes employed by students match that identified in the test developer’s defined construct domains for all students and for each subgroup. Think-aloud procedures or cognitive interviews can be used to collect this type of evidence. In addition, when an assessment includes OE items, an examination of the extent to which the raters interpret and apply the scoring criteria for these items accurately when assigning scores to students’ responses also provides validity of the response-processes evidence.
Cognitive interviews were conducted in Pennsylvania schools between May 11 and May 19, 2009. Information collected from these interviews was then used to aid decision making in the strategies currently used to revise and/or enhance items for the PSSA-M to ensure that these enhancements would appropriately facilitate student access to the assessed content. See Chapter Three for information about the results of the cognitive interviews. For all the PSSA-M tests, well-organized scorer training and subsequent monitoring of rating accuracy helped ensure that raters strictly followed the scoring criteria and that no rubric-unrelated features significantly affected their scoring.
EVIDENCE BASED ON INTERNAL STRUCTURE
As described in the Standards (1999), internal-structure evidence refers to the degree to which the relationships among test items and test components conform to the construct on which the proposed test interpretations are based. For each PSSA-M test, one total test score as well as strand scores are reported (see Chapter Sixteen for more information about PSSA-M scores). Several dimensionality studies were conducted in order to provide internal-structure evidence relating to the use of both types of scores.
Item-Test Correlations
Item-test correlations were reviewed in Chapter Eleven. All values were positive. Although a few items had low correlations, the average correlation over all items appeared reasonable in magnitude.
Item Response Theory Dimensionality
Results from principle components analyses conducted using WINSTEPS were presented in Chapter Twelve. The PSSA-M tests were essentially unidimensional, providing evidence supporting interpretations based on the total scores for the respective PSSA-M tests.
Strand (Reporting Category) Correlations
Correlations and disattenuated correlations among strand (reporting category) scores within each subject area are presented below. Values were derived from the PSSA-M final data file (see Chapter Nine). This data can also provide information on score dimensionality that is part of internal-structure evidence. As noted in Chapter Three, the PSSA-M mathematics tests have five strands (denoted by M.A, M.B, M.C, M.D, and M.E), the PSSA-M reading tests have two strands (denoted by R.A and R.B), and the PSSA science tests have four strands (denoted by S.A, S.B, S.C, and S.D).
For each grade, Pearson’s correlation coefficients among these strands are reported in Tables 19–1a through 19–1f, with reliabilities listed on the diagonal. The intercorrelations among the strands within the content areas were positive and generally moderate in value.

Chapter Nineteen: Validity
2012 PSSA-M Technical Report Page 199
Table 19–1a. Correlations among Strands for Grade 4
M.A - M.B 0.51 - M.C 0.41 0.27 - M.D 0.48 0.40 0.34 - M.E 0.52 0.39 0.43 0.45 - R.A 0.41 0.30 0.31 0.30 0.41 - R.B 0.41 0.30 0.30 0.27 0.37 0.67 - M.A M.B M.C M.D M.E R.A R.B
Table 19–1b. Correlations among Strands for Grade 5
M.A - M.B 0.49 - M.C 0.41 0.36 - M.D 0.52 0.47 0.38 - M.E 0.44 0.41 0.41 0.41 - R.A 0.41 0.39 0.40 0.36 0.40 - R.B 0.43 0.38 0.44 0.37 0.41 0.74 - M.A M.B M.C M.D M.E R.A R.B
Table 19–1c. Correlations among Strands for Grade 6
M.A - M.B 0.40 - M.C 0.41 0.34 - M.D 0.48 0.29 0.32 - M.E 0.47 0.32 0.38 0.39 - R.A 0.36 0.26 0.34 0.33 0.36 - R.B 0.39 0.25 0.33 0.31 0.37 0.70 - M.A M.B M.C M.D M.E R.A R.B

Chapter Nineteen: Validity
2012 PSSA-M Technical Report Page 200
Table 19–1d. Correlations among Strands for Grade 7
M.A - M.B 0.47 - M.C 0.53 0.43 - M.D 0.51 0.40 0.42 - M.E 0.45 0.34 0.41 0.40 - R.A 0.37 0.25 0.29 0.33 0.34 - R.B 0.40 0.25 0.30 0.35 0.36 0.74 - M.A M.B M.C M.D M.E R.A R.B
Table 19–1e. Correlations among Strands for Grade 8
M.A - M.B 0.43 - M.C 0.37 0.35 - M.D 0.48 0.47 0.44 - M.E 0.44 0.41 0.40 0.53 - R.A 0.34 0.34 0.26 0.42 0.45 - R.B 0.29 0.31 0.22 0.38 0.39 0.67 - S.A 0.35 0.36 0.30 0.42 0.46 0.58 0.52 - S.B 0.27 0.27 0.23 0.34 0.33 0.45 0.41 0.52 - S.C 0.24 0.24 0.21 0.28 0.33 0.42 0.38 0.49 0.44 - S.D 0.26 0.26 0.25 0.30 0.32 0.45 0.40 0.50 0.45 0.45 - M.A M.B M.C M.D M.E R.A R.B S.A S.B S.C S.D
Table 19–1f. Correlations among Strands for Grade 11
M.A - M.B 0.36 - M.C 0.40 0.39 - M.D 0.49 0.49 0.46 - M.E 0.39 0.39 0.39 0.51 - R.A 0.35 0.32 0.34 0.42 0.36 - R.B 0.35 0.32 0.35 0.44 0.37 0.72 - S.A 0.38 0.36 0.38 0.43 0.38 0.58 0.57 - S.B 0.27 0.28 0.28 0.30 0.30 0.41 0.40 0.53 - S.C 0.25 0.26 0.26 0.28 0.25 0.41 0.39 0.51 0.41 - S.D 0.27 0.29 0.29 0.30 0.30 0.44 0.42 0.59 0.53 0.48 - M.A M.B M.C M.D M.E R.A R.B S.A S.B S.C S.D
The correlations in Tables 19–1a through 19–1f are for the observed strand scores. These observed-score correlations are weakened by existing measurement error contained within each strand. As a result, disattenuating the observed correlations can provide an estimate of the relationships among strands if there were no measurement error. (An important caveat is provided below.) The disattenuated correlation coefficients ( xyR ) can be computed by using the
formula (Spearman 1904, 1910) below:

Chapter Nineteen: Validity
2012 PSSA-M Technical Report Page 201
yyxx
xyxy
rr
rR
,
where xyr is the observed correlation, and xxr and yyr are the reliabilities for strand X and strand Y.
Tables 19–2a through 19–2f show the corresponding disattenuated correlations.
Disattenuated correlations very near 1.0 might suggest that the same or very similar constructs are being measured. Values somewhat less than 1.0 might suggest that different strands are measuring slightly different aspects of the same construct. Values markedly less than 1.0 might suggest the strands reflect different constructs.
Given that none of these strands have perfect reliabilities (see Chapter Eighteen), the disattenuated strand correlations are higher than their observed-score counterparts. Within-subject strand correlations varied considerably in value. Some within-subject correlations were very high (e.g., above 0.95). As noted above, extremely high disattenuated correlations suggest that the within-subject strands might be measuring essentially the same construct. This, in turn, suggests that some strand scores might not provide unique information about the strengths or weaknesses of students.
On the other hand, there were some within-subject strand correlations that were somewhat lower than 1.0. For such strands, partial evidence is provided regarding the multidimensional structure of some tests and further supporting the validity of those specific strand scores.
Table 19–2a. Disattenuated Strand Correlations: Grade 4
M.A - M.B 1.29 - M.C 0.75 0.86 - M.D 0.87 1.29 0.78 - M.E 0.81 1.06 0.84 0.88 - R.A 0.56 0.74 0.54 0.53 0.60 - R.B 0.63 0.80 0.57 0.52 0.60 0.98 - M.A M.B M.C M.D M.E R.A R.B
Table 19–2b. Disattenuated Strand Correlations: Grade 5
M.A - M.B 0.99 - M.C 0.76 0.82 - M.D 1.17 1.29 0.93 - M.E 0.82 0.95 0.86 1.05 - R.A 0.58 0.68 0.64 0.70 0.65 - R.B 0.66 0.72 0.75 0.77 0.71 0.99 - M.A M.B M.C M.D M.E R.A R.B

Chapter Nineteen: Validity
2012 PSSA-M Technical Report Page 202
Table 19–2c. Disattenuated Strand Correlations: Grade 6
M.A - M.B 0.96 - M.C 0.84 1.00 - M.D 0.97 0.85 0.81 - M.E 0.89 0.86 0.89 0.90 - R.A 0.53 0.55 0.62 0.58 0.60 - R.B 0.62 0.56 0.65 0.60 0.68 0.97 - M.A M.B M.C M.D M.E R.A R.B
Table 19–2d. Disattenuated Strand Correlations: Grade 7
M.A - M.B 1.01 - M.C 1.02 0.94 - M.D 0.98 0.87 0.82 - M.E 0.87 0.76 0.82 0.79 - R.A 0.59 0.46 0.48 0.54 0.56 - R.B 0.66 0.47 0.50 0.57 0.61 1.03 -
M.A M.B M.C M.D M.E R.A R.B
Table 19–2e. Disattenuated Strand Correlations: Grade 8
M.A - M.B 1.00 - M.C 0.76 0.81 - M.D 0.93 1.04 0.84 - M.E 0.86 0.90 0.77 0.97 - R.A 0.58 0.65 0.43 0.67 0.72 - R.B 0.54 0.65 0.40 0.67 0.70 1.01 - S.A 0.64 0.74 0.54 0.72 0.80 0.85 0.85 - S.B 0.57 0.66 0.49 0.68 0.67 0.78 0.79 0.97 - S.C 0.52 0.61 0.45 0.58 0.69 0.75 0.76 0.95 1.01 - S.D 0.53 0.60 0.52 0.59 0.64 0.76 0.74 0.91 0.96 1.00 - M.A M.B M.C M.D M.E R.A R.B S.A S.B S.C S.D

Chapter Nineteen: Validity
2012 PSSA-M Technical Report Page 203
Table 19–2f. Disattenuated Strand Correlations: Grade 11
M.A - M.B 1.19 - M.C 0.99 1.37 - M.D 0.90 1.28 0.90 - M.E 0.90 1.25 0.94 0.92 - R.A 0.65 0.82 0.66 0.60 0.64 - R.B 0.65 0.83 0.68 0.63 0.66 1.01 - S.A 0.68 0.91 0.72 0.60 0.67 0.80 0.79 - S.B 0.63 0.88 0.67 0.53 0.66 0.72 0.71 0.92 - S.C 0.62 0.93 0.70 0.55 0.62 0.79 0.76 0.98 1.01 - S.D 0.55 0.81 0.61 0.47 0.59 0.69 0.65 0.90 1.03 1.02 - M.A M.B M.C M.D M.E R.A R.B S.A S.B S.C S.D
Much caution is needed in interpreting the disattenuated results because the reliabilities used to calculate the disattenuated correlations are subject to both upward and downward biases. (These are discussed in some detail in Chapter Eighteen.) Consequently, some of the values tabled above may be higher or lower than they should be, depending on which bias prevails for any given pair of strand scores. When the reliabilities are lower than they should be, the disattenuated correlations will be inflated (and in many instances will appear larger than the theoretical correlation maximum value of 1.0).
Exploratory Factor Analysis
In order to further explore the internal structure of the PSSA-M, an exploratory factor analysis (EFA) of the strand scores was conducted. The PSSA-M final data file (see Chapter Nine) was used to create the observed correlation matrices shown in Tables 19–1a through 19–1f, which in turn were used in the EFAs. In SPSS, Principal Axis Factor extraction was utilized with an oblique rotation (Promax) of the initial factor solution to improve interpretability. Oblique rotations allow for correlated factors, which seemed more appropriate for the PSSA-M tests because of a priori expectations that academic achievement across subject areas should be correlated.
Table 19–3 presents the eigenvalues and the explained variance for the extracted factors for the Grade 4 PSSA-M test. The scree plot graphing the eigenvalues against the factor number is shown in Figure 19–1. The first factor accounted for about 48 percent of the total variance, while the second factor explained about 14 percent of the total variance. The first two factors had an eigenvalue greater than 1.0, typically suggesting a two-factor solution using the Kaiser criterion. Based on this finding and the prior belief that there should be two distinct factors at Grade 4 (one for mathematics and another for reading), a two-factor solution was further explored.

Chapter Nineteen: Validity
2012 PSSA-M Technical Report Page 204
Table 19–3. Eigenvalues and Explained Variance for Grade 4
Figure 19–1. Scree Plot for Grade 4
Factor Eigenvalue %
1 3.37 48.13
2 1.01 14.43
3 0.75 10.72
4 0.59 8.50
5 0.51 7.36
6 0.44 6.24
7 0.32 4.62
The pattern loadings resulting from the two-factor solution are presented in Table 19–4a. The pattern loadings have simple structure which show that the five mathematics domains clearly loaded on the first factor, while the two reading domains clearly loaded on the second factor. The respective factor loadings are quite high. The factor correlation matrix shows that the correlation between the two latent factors is 0.61, which is equal to the disattenuated correlation between mathematics and reading.
Table 19–4a. Factor Loadings for Grade 4
Factor Domain 1 2
Mathematics M.A 0.75 0.04 M.B 0.60 -0.01 M.C 0.49 0.07 M.D 0.68 -0.07 M.E 0.66 0.07
Reading R.A 0.02 0.81 R.B -0.01 0.82
Correlation (F1, F2) = 0.61
Similar results were found for the other grades. The eigenvalue scree plots consistently indicated a multi-factor solution. The eigenvalues and explained variances are not shown for the other grades due to space considerations. Factor loadings are reported in Tables 19–4b through 19–4f for the remaining grades. The pattern loadings clearly suggested that the PSSA tests measured different but correlated constructs.

Chapter Nineteen: Validity
2012 PSSA-M Technical Report Page 205
Table 19–4b. Factor Loadings for Grade 5
Factor Domain 1 2
Mathematics M.A 0.73 0.01 M.B 0.65 0.01 M.C 0.43 0.21 M.D 0.74 -0.06 M.E 0.54 0.12
Reading R.A 0.04 0.81 R.B -0.01 0.90
Correlation (F1, F2) = 0.65
Table 19–4c. Factor Loadings for Grade 6
Factor Domain 1 2
Mathematics M.A 0.78 -0.03 M.B 0.55 -0.03 M.C 0.52 0.08 M.D 0.59 0.01 M.E 0.58 0.08
Reading R.A 0.01 0.83 R.B 0.01 0.83
Correlation (F1, F2) = 0.61
Table 19–4d. Factor Loadings for Grade 7
Factor Domain 1 2
Mathematics M.A 0.76 0.03 M.B 0.65 -0.07 M.C 0.71 -0.05 M.D 0.62 0.06 M.E 0.52 0.12
Reading R.A 0.00 0.83 R.B 0.00 0.89
Correlation (F1, F2) = 0.55

Chapter Nineteen: Validity
2012 PSSA-M Technical Report Page 206
Table 19–4e. Factor Loadings for Grade 8
Factor Domain 1 2 3
Mathematics M.A 0.68 -0.03 -0.01 M.B 0.62 -0.01 0.02 M.C 0.64 0.07 -0.16 M.D 0.75 -0.05 0.06 M.E 0.57 0.06 0.11
Reading R.A 0.00 0.06 0.79 R.B -0.05 0.02 0.81
Science S.A 0.11 0.55 0.18 S.B 0.02 0.64 0.03 S.C -0.04 0.72 -0.04 S.D -0.01 0.69 -0.01
Correlation (F1, F2) = 0.63 Correlation (F1, F3) = 0.64 Correlation (F2, F3) = 0.76
Table 19–4f. Factor Loadings for Grade 11
Factor Domain 1 2 3
Mathematics M.A 0.59 0.01 0.03 M.B 0.62 0.08 -0.08 M.C 0.58 0.06 -0.01 M.D 0.82 -0.11 0.05 M.E 0.61 0.03 0.01
Reading R.A -0.02 0.05 0.82 R.B 0.02 -0.01 0.84
Science S.A 0.10 0.59 0.19 S.B 0.03 0.68 -0.03 S.C 0.00 0.59 0.05 S.D -0.03 0.84 -0.07
Correlation (F1, F2) = 0.61 Correlation (F1, F3) = 0.65 Correlation (F2, F3) = 0.70

Chapter Nineteen: Validity
2012 PSSA-M Technical Report Page 207
Taken as a whole, all the internal structure evidence presented above generally indicates that related elements of each of the PSSA-M tests correlate in the intended manner. Different PSSA-M subject area tests seem to measure different constructs. Additionally, the strands within each subject area have stronger relationships than those across subject strands. This further supports using a total score to report student performance in the different subject areas.
The strand scores present more of a mixed message. Since the strands in each subject area were designed to measure distinct components of the subject area, it is reasonable to expect that the intersubject strand correlations should be positive and strong, but ideally not extremely high. However, the disattenuated correlations imply that some strands are essentially measuring the same constructs. Consequently, there may be less support for providing results for some strand scores beyond the total score. While there is content rationale underlying the creation of the strand scores, the empirical correlations illustrate that caution is required when using the strand scores as a way to identify an individual student’s strengths and weaknesses. Certainly, instructional programs should be based not on strand score information alone, but in conjunction with other sources of evidence available (e.g., teacher observations, other exam performance).
Differential Item Functioning
Differential item functioning (DIF) occurs when examinees with the same ability level but different group memberships do not have the same probability of answering the item correctly. This pattern of results may suggest the presence of item bias. As a statistical concept, however, DIF can be differentiated from item bias, which is a content issue that can arise when an item presents negative group stereotypes, uses language that is more familiar to one subpopulation than to another, or is presented in a format that disadvantages certain learning styles. While the source of item bias is often apparent to trained judges, DIF may have no clear cause. However, studying how DIF arises and how it presents itself has an effect on how to detect and correct it.
LIMITATIONS OF STATISTICAL DETECTION
No statistical procedure should be used as a substitute for rigorous, hands-on review by content and bias specialists. The statistical results can help organize the review so effort is concentrated on the most problematic cases. Further, no items should be automatically rejected simply because a statistical method flagged them or accepted because they were not flagged.
Statistical detection of DIF is an inexact science. There have been a variety of methods proposed for detecting DIF, but no one statistic can be considered either necessary or sufficient. Different methods are more or less successful depending on the situation. No analysis can guarantee that a test is free of bias, but a thoughtful analysis will uncover the most flagrant problems.
A fundamental shortcoming of all statistical methods used in DIF evaluation is that all are intrinsic to the test being evaluated. If a test is unbiased overall but contains one or two DIF items, any method will locate the problems. If, however, all items on the test show consistent DIF to the disadvantage of a given subpopulation, a statistical analysis of the items will not be able to separate DIF effects from true differences in achievement.
MANTEL-HAENSZEL PROCEDURE FOR DIFFERENTIAL ITEM FUNCTIONING
The Mantel-Haenszel procedure for detecting differential item functioning is a commonly used technique in educational testing. It does not depend on the application or the fit of any specific measurement model. However, it does have significant philosophical overlap with the Rasch model since it uses a test’s total score to organize the analysis.

Chapter Nineteen: Validity
2012 PSSA-M Technical Report Page 208
The procedure as implemented by DRC contrasts a focal group with a reference group. While it makes no practical difference in the analysis which group is defined as the focal group, the group most apt to be disadvantaged by a biased measurement is typically defined as the focal group. In these analyses, the focal group was female for gender-based DIF and black for ethnicity-based DIF; reference groups were male and white, respectively. The Mantel-Haenszel (MH) statistic (Mantel & Haenszel, 1959) for each item is computed from a contingency table. It has two groups (focal and reference) and two outcomes (right and wrong). The ability groups are defined by the test’s score distribution for the total examinee population.
The basic MH statistic is a single degree of freedom chi-square that compares the observed number in each cell to the expected number. The expected counts are computed to ensure that the analysis is not confounded with differences in the achievement level of the two groups.
For OE items, a comparable statistic is computed based on the standardized mean difference (SMD) (Dorans, Schmitt and Bleistein, 1992), computed as the differences in mean scores for the focal and reference groups if both groups had the same score distribution.
To assist the review committees in interpreting the analyses, the items are assigned a severity code based on the magnitude of the MH statistic. Items classified as A+ or A- have little or no statistical indication of DIF. Items classified as B+ or B- have a moderate indication of DIF, but may be judged to be acceptable for future use. Items classified as C+ or C- have strong evidence of DIF. The plus sign indicates that the item favors the focal group, and a minus sign indicates that the item favors the reference group.
Counts of the number of items from each grade and content area that were assigned to each severity code are shown below in Tables 19–5a (MC items) and 19–5b (OE items). DIF analyses were conducted only on operational items. Only a handful of items reached the C magnitude.12
Table 19–5a. DIF Summary—MC Items
Male/Female White/Black A+ A- B+ B- C+ C- Tot A+ A- B+ B- C+ C- Tot
Mat
hem
atic
s 4 16 11 1 2 0 0 30 14 14 0 1 0 1 305 16 11 1 2 0 0 30 14 14 0 1 0 1 306 13 16 1 0 0 0 30 13 17 0 0 0 0 307 18 9 0 1 0 2 30 11 18 0 1 0 0 308 16 13 0 1 0 0 30 13 17 0 0 0 0 30
11 17 10 0 3 0 0 30 13 16 1 0 0 0 30
Rea
din
g
4 15 15 0 0 0 0 30 11 18 1 0 0 0 305 17 13 0 0 0 0 30 14 16 0 0 0 0 306 14 16 0 0 0 0 30 13 17 0 0 0 0 307 17 13 0 0 0 0 30 12 17 0 1 0 0 308 15 15 0 0 0 0 30 14 14 0 2 0 0 30
11 16 14 0 0 0 0 30 8 20 1 1 0 0 30
Sci
. 8 14 14 1 0 0 1 30 13 16 0 1 0 0 3011 9 16 1 3 1 0 30 14 13 0 3 0 0 30
12 These results are based on the final data set as described in Chapter Nine. Nearly all PSSA-M items are modified versions of general PSSA items that were previously screened for DIF and approved for use on the general assessment.

Chapter Nineteen: Validity
2012 PSSA-M Technical Report Page 209
Table 19–5b. DIF Summary—OE Items
Male/Female White/Black A+ A- B+ B- C+ C- Tot A+ A- B+ B- C+ C- Tot
Mat
hem
atic
s 4 2 0 0 0 0 0 2 2 0 0 0 0 0 25 2 0 0 0 0 0 2 2 0 0 0 0 0 26 1 1 0 0 0 0 2 0 2 0 0 0 0 27 2 0 0 0 0 0 2 1 1 0 0 0 0 28 0 2 0 0 0 0 2 0 2 0 0 0 0 2
11 1 1 0 0 0 0 2 1 1 0 0 0 0 2
Rea
din
g
4 2 0 0 0 0 0 2 0 2 0 0 0 0 25 1 1 0 0 0 0 2 0 2 0 0 0 0 26 1 1 0 0 0 0 2 0 2 0 0 0 0 27 1 1 0 0 0 0 2 1 1 0 0 0 0 28 1 1 0 0 0 0 2 0 2 0 0 0 0 2
11 0 1 1 0 0 0 2 1 1 0 0 0 0 2
Sci
. 8 1 1 0 0 0 0 2 0 2 0 0 0 0 211 1 0 0 1 0 0 2 0 1 0 1 0 0 2
EVIDENCE BASED ON CONSEQUENCES OF TESTING
Based on the Standards (1999), evidence of the consequences of implementing an assessment program is an additional source of validity information. Both positive and negative (intended and unintended) consequences of score-based inferences must be investigated to fully evaluate the pool of validity evidence. It is important to note that the consequences of the assessment program themselves do not serve as indicators of validity. That is, the investigation and evaluation of the consequences provides a richer context for establishing the validity of an assessment program.
Given that the evaluation of consequential validity is broadly defined, it is difficult to specifically measure aspects of consequential validity. Test data only provide one small insight into this type of validation evidence. Chapter Sixteen includes several different types of scores and score reports used for the PSSA-M. This chapter also provides accurate and clear test score and report information to help users avoid unintended uses and interpretations of the PSSA-M results. The extent to which various groups of users (e.g., students, teachers, and parents) interpret these scores and reports appropriately affects the validity of subsequent uses of these results. PDE continues to gather evidence to improve or guide decisions pertaining to all aspects of intended and unintended consequences of the PSSA-M program.
EVIDENCE RELATED TO THE USE OF THE RASCH MODEL
Since the Rasch model is the basis of all calibration, scaling, and linking analyses associated with the PSSA-M, the validity of the inferences from these results depends on the degree to which the assumptions of the model are met, as well as the fit between the model and test data. As discussed at length in Chapter Twelve, the underlying assumptions of Rasch models were essentially met for all the PSSA-M data, indicating the appropriateness of using the Rasch models to analyze the PSSA-M data.

Chapter Nineteen: Validity
2012 PSSA-M Technical Report Page 210
VALIDITY EVIDENCE SUMMARY
Validity evidence related to test content was reviewed earlier in this chapter. On the whole, the early chapters of this technical report show that a strong link can be established between each PSSA-M item and its associated eligible content. Details regarding how the PSSA-M operational assessments were assembled to reflect the state content standards and detailed information regarding educator reviews (including content, bias, and sensitivity reviews) are presented in Chapter Three.
Validity of score inferences is bolstered when test scores are consistent. Here, the reliabilities of the total test scores (see Chapter Eighteen) were on the low end of the adequate range. Considering the length of the tests and the relatively homogeneous achievement level of test takers, the reported values are reasonable.
As reported above, differential item functioning (DIF) with respect to gender and ethnicity helps address construct-irrelevant variance, which represents an important threat to the validity of inferences made from achievement test scores. Only a very small percentage of items were flagged for severe DIF.

References
2012 PSSA-M Technical Report Page 211
References Achieve, Inc. (2005). Measuring up 2005: A report on assessment anchors and tests in reading
and mathematics for Pennsylvania. Washington, DC: Achieve, Inc.
American Educational Research Association, American Psychological Association, & National Council on Measurement in Education [AERA, APA, NCME]. (1999). Standards for educational and psychological testing. Washington, DC: American Educational Research Association.
Allman, C. (2004). Test access: Making tests accessible for students with visual impairments – A guide for test publishers, test developers, and state assessment personnel (2nd ed.). Louisville, KY: American Printing House for the Blind. Available from http://www.aph.org.
Brennan, R. L. (1998). Misconceptions at the intersection of measurement theory and practice. Educational Measurement: Issues and Practice, 17(1), 5–9.
Brennan, R. (2004). BB-Class (Version 1.0). [Computer Software] Iowa City, IA: University of Iowa, Center for Advanced Studies in Measurement & Assessment. CASMA: education.uiowa.edu/casma.
Chen, W., & Thissen, D. (1997). Local dependence indexes for item pairs using item response theory. Journal of Educational and Behavioral Statistics, 22(3), 265–289.
Cook, L. L., & Eignor, D. R. (1991). NCME instructional module: IRT equating methods. Educational Measurement: Issues and Practice, 17(1), 5–9.
Cronbach, L. (1951). Coefficient alpha and the internal structure of tests. Psychometrika, 16, 297–334.
Cronbach, L. J. (1971). Test validation. In R. L. Thorndike (Ed.), Educational Measurement (2nd ed., pp. 443–507). Washington, DC: American Council on Education. Educational Measurement: Issues and Practice, 10, 37–45.
Cronbach, L., & Shavelson R. L. (2004). My current thoughts on coefficient alpha and successor procedures. Educational and Psychological Measurement, 64(3), 391–418.
Data Recognition Corporation. (2000). Item viewer and authoring network (IVAN): informational guide. Maple Grove, MN: DRC.
Data Recognition Corporation. (2003–2007). Fairness in testing: Training manual for issues of bias, fairness, and sensitivity. Maple Grove, MN: DRC.
Data Recognition Corporation. (2004–2007). Pennsylvania System of School Assessment (PSSA) style guide. Maple Grove, MN: DRC.
Data Recognition Corporation. (2005, December). Technical report for the PSSA 2005 reading and mathematics. Maple Grove, MN: DRC.
Data Recognition Corporation. (2007, May). Technical report for the PSSA 2006 reading and mathematics: Grades 4, 6, and 7. Maple Grove, MN: DRC.
Data Recognition Corporation. (2007, May). Technical report for the PSSA 2006 writing: Grades 5, 8, and 11. Maple Grove, MN: DRC.
Data Recognition Corporation. (2010). Technical report for the 2010 Pennsylvania System of School Assessment. Maple Grove, MN: DRC.

References
2012 PSSA-M Technical Report Page 212
Data Recognition Corporation. (2007, July). PSSA writing test score reliability: some available approaches and possible alternatives. (PSSA TAC Document 071907_5). Maple Grove, MN: Bishop, N.
Data Recognition Corporation. (2007). Preliminary technical report for 2008 PSSA science. Maple Grove, MN: DRC.
Data Recognition Corporation. (2008, February). Technical report for the PSSA 2007 writing: Grades 5, 8, and 11. Maple Grove, MN: DRC.
Data Recognition Corporation. (2008, February). Technical report for the PSSA 2007 reading and mathematics: Grades 3, 4, 5, 6, 7, 8, and 11. Maple Grove, MN: DRC.
Data Recognition Corporation. (2008, February). Preliminary technical report for 2008 PSSA science. Maple Grove, MN: DRC.
Data Recognition Corporation. (2009, June). Rater effect study results. (PSSA TAC Document 06.03.09 E). Maple Grove, MN: Stearns, M.
Dorans, N., Schmitt, Al, & Bleistein, C. (1992). The standardization approach to assessing comprehensive differential item functioning. Journal of Educational Measurement, 29, 309–319.
Ericsson, K., & Simon, H. (1980). Verbal reports as data. Psychological Review, 87, 215–250.
Ericsson, K., & Simon, H. (1993). Protocol analysis: Verbal reports as data. Cambridge: MIT.
Feldt, L. S., & Brennan, R. L. (1989). Reliability. In R. L. Linn (Ed.), Educational Measurement, (3rd ed., pp. 105–146). New York, NY: ACE/Macmillan.
Frisbie, D. A. (2005). Measurement 101: Some fundamentals revisited. Educational Measurement: Issues and Practice, 24(3), 21–28.
Gulliksen, H. (1950). Theory of mental tests. New York: John Wiley and Sons.
Haertel, E. H. (2006). Reliability. In Brennan, R. L. (Ed.). Educational Measurement (4th ed., pp. 65–110). Westport, CT: Praeger.
Hambleton, R. & Novick, M. (1973). Toward an integration of theory and method for criterion-referenced tests. Journal of Educational Measurement, 10, 159–170.
Hanson, B. A., & Brennan, R. L. (1990). An investigation of classification consistency indexes estimated under alternative strong true score theory models. Journal of Educational Measurement, 27(4), 345–359.
Harvill, L. M. (1991). Standard error of measurement. Educational Measurement: Issues and Practices, 10(2), 33–41.
Huynh, H. (1976). On the reliability of decisions in domain-referenced testing. Journal of Educational Measurement, 13, 253–264.
Johnstone, C., Altman, J., & Thurlow, M. (2006). A state guide to the development of universally designed assessments. Minneapolis, MN: University of Minnesota. National Center on Educational Outcomes.
Koger, M. E., Thacker, A. A., & Dickinson, E. R. (2004). Relationships among the Pennsylvania System of School Assessment (PSSA) scores, SAT scores, and self-reported high school grades for the classes of 2002 and 2003 (HumRRO Report FR-04-26). Louisville, KY: Human Resources Research Organization.
References
2012 PSSA-M Technical Report Page 213
Kopriva, R. (2001). ELL validity research designs for state academic assessments: An outline of five research designs evaluating the validity of large-scale assessments for English language learners and other test takers. Paper presented at the CCSSO Annual Conference on Large Scale Assessment, Houston, TX.
Lane, S. (1999). Validity evidence for assessments. Paper presented at the 1999 Edward F. Reidy Interactive Lecture Series, Providence, RI.
Lane, S., & Stone, C. A. (2002). Strategies for examining the consequences of assessment and accountability programs. Educational Measurement: Issues and Practice, 21(1), 23–30.
Lewis, D. M., Mitzel, H. C., & Green, D. R. (1996). Standard setting: A bookmark approach. Symposium presented at the Council of Chief State School Officers National Conference on Large-Scale Assessment, Phoenix, AZ.
Linacre, J. M. (2009). A user’s guide to WINSTEPS MININSTEP Rasch-model computer programs. Chicago, IL: Winsteps.
Linacre, J. M., & Wright, B. D. (2003). WINSTEPS 3.54: Multiple-choice, rating scale, and partial credit Rasch analysis [Computer software]. Chicago: MESA Press.
Livingston, S. & Lewis, C. (1995). Estimating the consistency and accuracy of classifications based on test scores. Journal of Educational Measurement 32, 179–197.
Mantel, N., & Haenszel, W. (1959). Statistical aspects of the analysis of data from retrospective studies of disease. Journal of the National Cancer Institute, 22, 719–748.
Marais, I., & Andrich, D. (2008). Formalizing dimension and response violations of local independence in the unidimensional Rasch model. Journal of Applied Measurement, 9(3), 200–215.
McDonald, R. P. (1979). The structural analysis of multivariate data: A sketch of general theory. Multivariate Behavioral Research, 14, 21–38.
Messick, S. (1989). Validity. In R. L. (Ed.), Educational Measurement (3rd ed., pp.3–104). New York: American Council on Education.
National Research Council. (2001). Knowing what students know. Washington, DC: National Academy of Sciences.
No Child Left Behind Act of 2001, Pub. L. No. 107–110, 115 Stat. 1425 (2002).
Paulsen & Levine, R. (1999). The applicability of the cognitive laboratory method to the development of achievement test items. Paper presented at the Annual Meeting of the American Educational Research Association, Montreal, Canada.
Pennsylvania State Board of Education. (1999, January). Chapter 4. Academic standards and assessment. Harrisburg, PA: Pennsylvania State Board of Education. Retrieved November 8, 2004, from http://www.education.state.pa.us. Also available from http://www.pacode.com/secure/data/022/Chapter4/s4.51.html.
Pennsylvania Department of Education. (2004). Mathematics item and scoring sampler. Retrieved December 13, 2004, from http://www.education.state.pa.us.us
Pennsylvania Department of Education. (2004). Reading item and scoring sampler. Retrieved December 13, 2004, from http://www.education.state.pa.us.us

References
2012 PSSA-M Technical Report Page 214
Pennsylvania Department of Education. (2004, April). Assessment anchors and eligible content. Retrieved December 13, 2004, from http://www.education.state.pa.us.us
Pennsylvania Department of Education. (2004, November). Mathematics assessment handbook. Retrieved December 13, 2004, from http://www.education.state.pa.us.us
Pennsylvania Department of Education. (2004, November). Reading assessment handbook. Retrieved December 13, 2004, from http://www.education.state.pa.us.us
Pennsylvania Department of Education. (2005, December). 2005–2006 Mathematics assessment handbook. Retrieved January 30, 2006, from http://www.education.state.pa.us.us
Pennsylvania Department of Education. (2005, December). 2005–2006 Reading assessment handbook. Retrieved January 30, 2006, from http://www.education.state.pa.us.us
Pennsylvania Department of Education. (2005). 2005–2006 Mathematics item and scoring sampler. Retrieved January 30, 2006, from http://www.education.state.pa.us.us
Pennsylvania Department of Education. (2005). 2005–2006 Reading item and scoring sampler. Retrieved January 30, 2006, from http://www.education.state.pa.us.us
Pennsylvania Department of Education. (2005, December). 2005–2006 Writing assessment handbook. Retrieved January 30, 2006, from http://www.education.state.pa.us.us
Pennsylvania Department of Education. (2005). 2005–2006 Writing item and scoring sampler. Retrieved September 14, 2005, from http://www.education.state.pa.us.us
Pennsylvania Department of Education. (2006). 2006–2007 Mathematics item and scoring sampler. Retrieved January 30, 2007, from http://www.education.state.pa.us.us
Pennsylvania Department of Education. (2006). 2006–2007 Reading item and scoring sampler. Retrieved January 30, 2007, from http://www.education.state.pa.us.us
Pennsylvania Department of Education. (2006). 2006–2007 Writing item and scoring sampler. Retrieved January 30, 2007, from http://www.education.state.pa.us.us
Pennsylvania Department of Education. (2006, December). 2006–2007 Writing assessment handbook. Retrieved January 30, 2006, from http://www.education.state.pa.us.us
Pennsylvania Department of Education. (2006). 2006–2007 Science item and scoring sampler. Retrieved March 15, 2007, from http://www.education.state.pa.us.us
Pennsylvania Department of Education. (2006, November). Science assessment handbook. Retrieved March 15, 2007, from http://www.education.state.pa.us.us
Pennsylvania Department of Education. (2007, January). 2006–2007 Mathematics assessment handbook. Retrieved January 30, 2007, from http://www.education.state.pa.us.us
Pennsylvania Department of Education. (2007, January). 2006–2007 Reading assessment handbook. Retrieved January 30, 2007, from http://www.education.state.pa.us.us
Pennsylvania Department of Education. (2007, January). 2007 Accommodations guidelines for students with IEPs, students with 504 plans, English language learners, and all students. Retrieved January 30, 2007, from http://www.education.state.pa.us.us
Pennsylvania Department of Education. (2007). Assessment anchors and eligible content. Retrieved May 27, 2010 from http://www.pdesas.org/standard/AnchorsDownloads

References
2012 PSSA-M Technical Report Page 215
Pennsylvania Department of Education. (2007). PSSA 2007 Handbook for assessment coordinators and administrators: Grades 3–8 and 11 reading and mathematics. Retrieved January 30, 2007, from http://www.education.state.pa.us.us
Pennsylvania Department of Education. (2007, March). PSSA reading and mathematics directions for administration manual. Retrieved April 2, 2007, from http://www.education.state.pa.us.us.
Pennsylvania Department of Education. (2007). 2008 PSSA accommodations guidelines for students with IEPs and students with 504 plans. Retrieved March 4, 2008, from http://www.education.state.pa.us.us.
Pennsylvania Department of Education. (2008). PSSA 2008 Handbook for assessment coordinators and administrators: Grades 3–8 and 11 reading and mathematics. Retrieved March 4, 2008, from http://www.education.state.pa.us.us.
Pennsylvania Department of Education. (2008). 2008–2009 Mathematics item and scoring sampler. Retrieved February 10, 2009, from http://www.education.state.pa.us.us
Pennsylvania Department of Education. (2008). 2008–2009 Reading item and scoring sampler. Retrieved February 10, 2009, from http://www.education.state.pa.us.us
Pennsylvania Department of Education. (2008). 2008–2009 Science item and scoring sampler. Retrieved February 10, 2009, from http://www.education.state.pa.us.us
Pennsylvania Department of Education. (2008). 2008–2009 Writing item and scoring sampler. Retrieved February 10, 2009, from http://www.education.state.pa.us.us
Pennsylvania Department of Education. (2009). PSSA accommodations guidelines for students with IEPs and students with 504 plans. Retrieved February 10, 2009, from http://www.education.state.pa.us.us
Pennsylvania Department of Education. (2009). Cognitive interviews in Pennsylvania: Report on data collection for the Pennsylvania System of School Assessment Alternate Assessment with modified achievement standards (PSSA-M) study. Harrisburg, PA: PDE
Pennsylvania Department of Education. (2009). 2008–2009 Assessment handbook. Retrieved February 10, 2009, from http://www.education.state.pa.us.us
Pennsylvania Department of Education. (2009). The 2008–2009 PSSA handbook for assessment coordinators: Writing, reading and mathematics, science. Retrieved February 10, 2009, from http://www.education.state.pa.us.us
Pennsylvania Department of Education. (2010). 2009–2010 Assessment handbook. Retrieved February 24, 2010 from http://www.education.state.pa.us
Pennsylvania Department of Education. (2010). PSSA and PSSA-M Accommodations guidelines for students with IEPs and students with 504 plans, revised 1-11-2010. Retrieved February 24, 2010, from http://www.education.state.pa.us.us
Pennsylvania Department of Education. (2010). The 2009-2010 PSSA handbook for assessment coordinators: Writing, reading and mathematics, science. Retrieved February 24, 2010, from http://www.education.state.pa.us.us
Pennsylvania Department of Education. (2011). PSSA, PSSA-M, Keystone (paper/pencil) accommodations guidelines for students with IEPs and students with 504 plans, revised 1-12-2011. Retrieved February 25, 2011 from http://www.education.state.pa.us.us

References
2012 PSSA-M Technical Report Page 216
Pennsylvania Department of Education. (2011). 2010-2011 PSSA handbook for assessment coordinators: Reading and mathematics, writing, science. Retrieved February 25, 2011, from http://www.education.state.pa.us.us
Qualls, A. L. (1995). Estimating the reliability of a test containing multiple item formats. Applied Measurement in Education, 8(2), 111–120.
Raîche, G. (2005). Critical eigenvalue sizes in standardized residual principal components analysis. Rasch Measurement Transactions, 19:1, 1012.
Rasch, G. (1960). Probabilistic models for some intelligence and attainment tests. Copenhagen: Danish Institute for Educational Research.
Reckase, M.D. (1979). Unifactor latent trait models applied to multifactor tests: Results and implications. Journal of Educational Statistics, 4, 207–230.
Sato, E., Rabinowitz, S., Gallagher, C., & Huang, C. W. (in press). Accommodations for English Language Learners. San Francisco, CA: WestEd.
Sinclair, A. L., & Thacker, A. A. (2005). Relationships among Pennsylvania System of School Assessment (PSSA) scores, university proficiency exam scores, and college course grades in English and math (HumRRO Report FR-05-55). Louisville, KY: Human Resources Research Organization.
Smith, R. & Miao, C. (1994). Assessing unidimensionality for Rasch measurement. Chapter 18 in M. Wilson (Ed.) Objective Measurement: Theory into Practice. Vol. 2. Norwood NJ: Ablex.
Solano-Flores, G., & Trumbull, E. (2003). Examining language in context: The need for new research and practice paradigms in the testing of English language learners. Educational Researcher, 32(2), 3–13.
Spearman C. (1904). The proof and measurement of association between two things. American Journal of Psychology, 15, 72–101.
Spearman C. (1910). Correlation calculated from faulty data. British Journal of Psychology, 3, 271–295.
Stearns, M., & Smith R. M. (2007). Estimation of classification consistency indices for complex assessments: Model based approaches. Paper presented at the 2007 Annual Convention of the American Educational Research Association, Chicago, IL.
Swineford, F. (1956). Technical manual for users of test analysis. (Statistical Report 56–42). Princeton, NJ: Educational Testing Service.
Thacker, A. A., & Dickinson, E. R. (2004). Item content and difficulty mapping by form and item type for the 2001–2003 Pennsylvania System of School Assessment (PSSA). Alexandria, VA: Human Resources Research Organization.
Thacker, A. A., Dickinson, E. R., & Koger, M. E. (2004). Relationships among the Pennsylvania System of School Assessment (PSSA) and other commonly administered assessments (HumRRO Report FR-04-33). Louisville, KY: Human Resources Research Organization.
Thompson, S., Johnstone, C. J., & Thurlow, M. L. (2002). Universal design applied to large scale assessments (Synthesis Report 44). Minneapolis, MN: University of Minnesota, National Center on Educational Outcomes.

References
2012 PSSA-M Technical Report Page 217
Traub, R. E. (1994). Reliability for the social sciences: Theory and application. Thousand Oaks: Sage.
Webb, N. L. (1997). Criteria for alignment of expectations and tests in mathematics and science education (NISE Research Monograph No. 6). Madison: University of Wisconsin–Madison, National Institute for Science Education. Washington, DC: Council of Chief State School Officers.
Webb, N. L. (1999). Alignment of science and mathematics standards and assessments in four states (NISE Research Monograph No. 18). Madison, WI: University of Wisconsin–Madison, National Institute for Science Education.
Webb, N.L. (2002). Alignment study in language arts, mathematics, science, and social studies of state standards and tests for four states: State collaborative on test and state standards (SCASS). Madison, WI: University of Wisconsin–Madison, Wisconsin Center for Education Research.
WINSTEPS (2000). WINSTEPS® Rasch measurement. Copyright John M. Linacre.
Wright, B., & Masters, G. (1982). Rating scale analysis. Chicago, IL: MESA Press.
Yen, W. M. (1993). Scaling performance assessments: strategies for managing local item dependence. Journal of Educational Measurement, 30(3), 187–213.

References
2012 PSSA-M Technical Report Page 218

Appendix A:
Assessment Anchor Explanations


PENNSYLVANIA DEPARTMENT OF EDUCATION
About the Mathematics Assessment Anchors Introduction This is a brief introduction to the Mathematics Assessment Anchors for the PSSA-M. The Assessment Anchors for the PSSA-M are exactly the same as the Assessment Anchors for the PSSA. For more information on the Assessment Anchors and how they were developed, please read the General Introduction provided on the website and the Frequently Asked Questions. How the Assessment Anchors Connect to the Standards The PA Academic Standards for Mathematics are: 2.1 Numbers, Number Systems and Number Relationships 2.2 Computation and Estimation 2.3 Measurement and Estimation 2.4 Mathematical Reasoning and Connections 2.5 Mathematical Problem Solving and Communication 2.6 Statistics and Data Analysis 2.7 Probability and Predictions 2.8 Algebra and Functions 2.9 Geometry 2.10 Trigonometry 2.11 Concepts of Calculus All of the Mathematics Standards categories are still included on the PSSA and PSSA-M but the Assessment Anchors tighten the focus of what is assessed. The Assessment Anchors also clarify what is expected from grade level to grade level. There is a clear vertical alignment in the Assessment Anchors that did not exist in the standards. Teachers will be able to see how concepts build on one another from year to year. In addition, the Assessment Anchors have fewer Reporting Categories to help create more valid scores (there are more items per reporting category). Rather than report student results in all 11 standards, the reports will be organized into five major categories.
Appendix A: Assessment Anchor Explanations
2012 PSSA-M Technical Report A-1
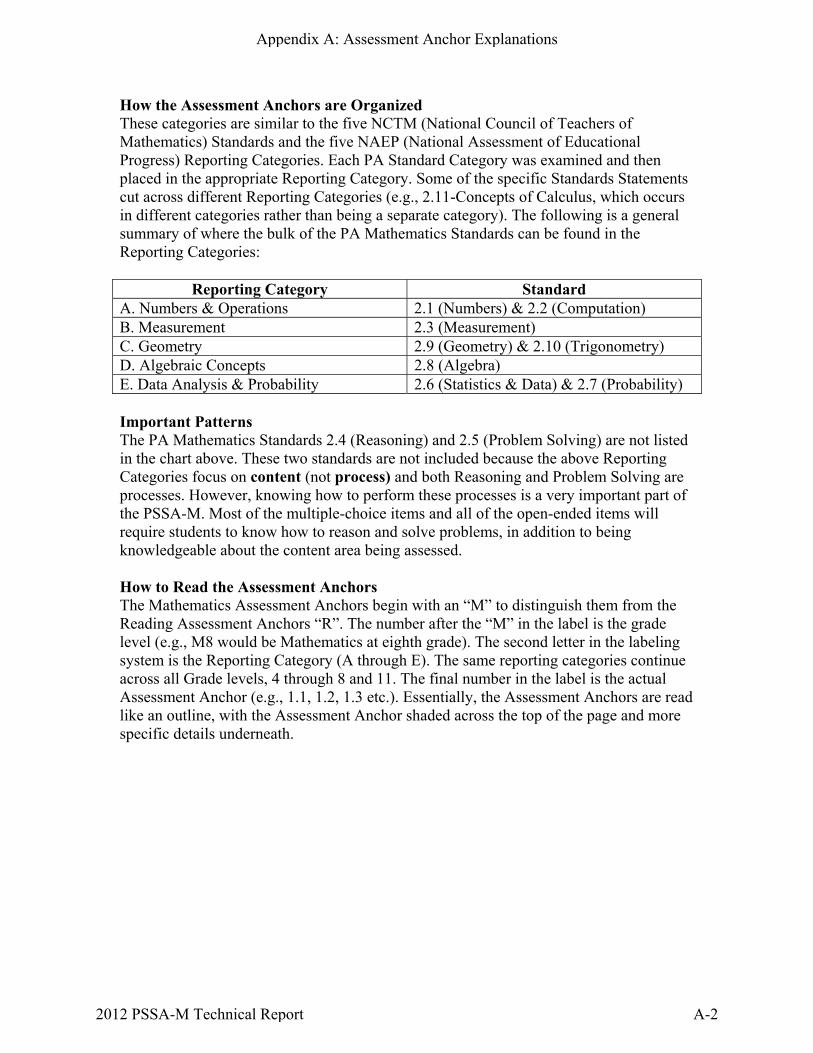
How the Assessment Anchors are Organized These categories are similar to the five NCTM (National Council of Teachers of Mathematics) Standards and the five NAEP (National Assessment of Educational Progress) Reporting Categories. Each PA Standard Category was examined and then placed in the appropriate Reporting Category. Some of the specific Standards Statements cut across different Reporting Categories (e.g., 2.11-Concepts of Calculus, which occurs in different categories rather than being a separate category). The following is a general summary of where the bulk of the PA Mathematics Standards can be found in the Reporting Categories:
Reporting Category Standard A. Numbers & Operations 2.1 (Numbers) & 2.2 (Computation) B. Measurement 2.3 (Measurement) C. Geometry 2.9 (Geometry) & 2.10 (Trigonometry) D. Algebraic Concepts 2.8 (Algebra) E. Data Analysis & Probability 2.6 (Statistics & Data) & 2.7 (Probability) Important Patterns The PA Mathematics Standards 2.4 (Reasoning) and 2.5 (Problem Solving) are not listed in the chart above. These two standards are not included because the above Reporting Categories focus on content (not process) and both Reasoning and Problem Solving are processes. However, knowing how to perform these processes is a very important part of the PSSA-M. Most of the multiple-choice items and all of the open-ended items will require students to know how to reason and solve problems, in addition to being knowledgeable about the content area being assessed. How to Read the Assessment Anchors The Mathematics Assessment Anchors begin with an “M” to distinguish them from the Reading Assessment Anchors “R”. The number after the “M” in the label is the grade level (e.g., M8 would be Mathematics at eighth grade). The second letter in the labeling system is the Reporting Category (A through E). The same reporting categories continue across all Grade levels, 4 through 8 and 11. The final number in the label is the actual Assessment Anchor (e.g., 1.1, 1.2, 1.3 etc.). Essentially, the Assessment Anchors are read like an outline, with the Assessment Anchor shaded across the top of the page and more specific details underneath.
Appendix A: Assessment Anchor Explanations
2012 PSSA-M Technical Report A-2

For example, M8.E.1.1 is a Mathematics Assessment Anchor (M stands for Math) at 8th Grade (8). The E indicates that this Anchor is in the Data Analysis and Probability Reporting Category and the 1.1 means that it is the first Assessment Anchor in the Data Analysis and Probability Reporting Category (1.1). (See below)
NOTE: Below each specific descriptor of the Assessment Anchor is a reference in italics. This reference relates to the Pennsylvania Academic Standards and helps you cross-walk the Anchors to the Standards.
Appendix A: Assessment Anchor Explanations
2012 PSSA-M Technical Report A-3

PENNSYLVANIA DEPARTMENT OF EDUCATION
Overview of Mathematics Assessment Anchors *Note that on this overview document, the grade level does not appear because these anchors occur at all Grade levels 4 through 8 and 11. MA. Numbers and Operations
MA.1 Demonstrate an understanding of numbers, ways of representing numbers, relationships among numbers and number systems.
MA.2 Understand the meanings of operations, use operations and understand
how they relate to each other. MA.3 Compute accurately and fluently and make reasonable estimates.
MB. Measurement
MB.1 Demonstrate an understanding of measurable attributes of objects and figures, and the units, systems and processes of measurement (not assessed at Grade 11).
MB.2 Apply appropriate techniques, tools and formulas to determine
measurements. MC. Geometry
MC.1 Analyze characteristics and properties of two- and three- dimensional geometric shapes and demonstrate understanding of geometric relationships.
MC.2 Identify and/or apply concepts of transformations or symmetry (not
assessed at Grades 6, 7 or 11). MC.3 Locate points or describe relationships using the coordinate plane.
MD. Algebraic Concepts
MD.1 Demonstrate an understanding of patterns, relations and functions. MD.2 Represent and/or analyze mathematical situations using
numbers, symbols, words, tables and/or graphs. MD.3 Analyze change in various contexts (not assessed at Grades 4 or 8). MD.4 Describe or use models to represent quantitative relationships (not
assessed at Grade 4, 5, 6 or 7).
Appendix A: Assessment Anchor Explanations
2012 PSSA-M Technical Report A-4

ME. Data Analysis and Probability ME.1 Formulate or answer questions that can be addressed with data and/or
organize, display, interpret or analyze data. ME.2 Select and/or use appropriate statistical methods to analyze data. ME.3 Understand and/or apply basic concepts of probability or outcomes. ME.4 Develop and/or evaluate inferences and predictions or draw conclusions
based on data or data displays (not assessed at Grades 4, 5 or 6).
Appendix A: Assessment Anchor Explanations
2012 PSSA-M Technical Report A-5
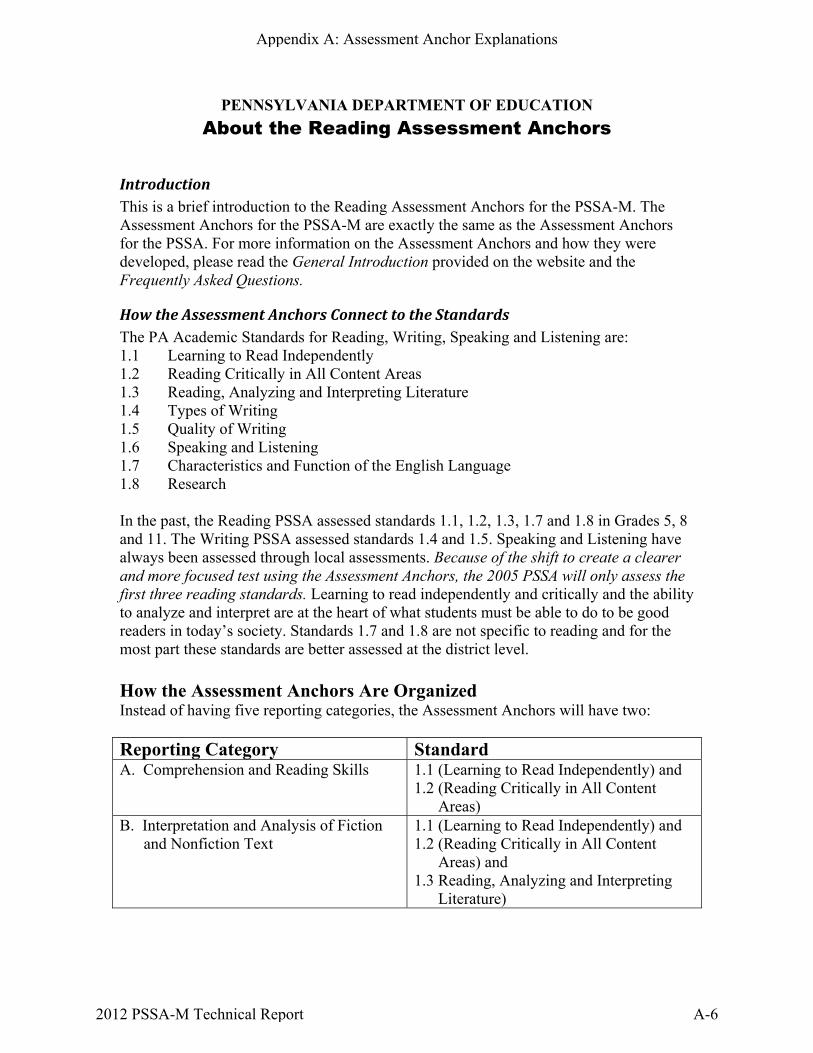
PENNSYLVANIA DEPARTMENT OF EDUCATION
About the Reading Assessment Anchors
Introduction This is a brief introduction to the Reading Assessment Anchors for the PSSA-M. The Assessment Anchors for the PSSA-M are exactly the same as the Assessment Anchors for the PSSA. For more information on the Assessment Anchors and how they were developed, please read the General Introduction provided on the website and the Frequently Asked Questions.
How the Assessment Anchors Connect to the Standards The PA Academic Standards for Reading, Writing, Speaking and Listening are: 1.1 Learning to Read Independently 1.2 Reading Critically in All Content Areas 1.3 Reading, Analyzing and Interpreting Literature 1.4 Types of Writing 1.5 Quality of Writing 1.6 Speaking and Listening 1.7 Characteristics and Function of the English Language 1.8 Research In the past, the Reading PSSA assessed standards 1.1, 1.2, 1.3, 1.7 and 1.8 in Grades 5, 8 and 11. The Writing PSSA assessed standards 1.4 and 1.5. Speaking and Listening have always been assessed through local assessments. Because of the shift to create a clearer and more focused test using the Assessment Anchors, the 2005 PSSA will only assess the first three reading standards. Learning to read independently and critically and the ability to analyze and interpret are at the heart of what students must be able to do to be good readers in today’s society. Standards 1.7 and 1.8 are not specific to reading and for the most part these standards are better assessed at the district level. How the Assessment Anchors Are Organized Instead of having five reporting categories, the Assessment Anchors will have two: Reporting Category Standard A. Comprehension and Reading Skills 1.1 (Learning to Read Independently) and
1.2 (Reading Critically in All Content Areas)
B. Interpretation and Analysis of Fiction and Nonfiction Text
1.1 (Learning to Read Independently) and 1.2 (Reading Critically in All Content
Areas) and 1.3 Reading, Analyzing and Interpreting
Literature)
Appendix A: Assessment Anchor Explanations
2012 PSSA-M Technical Report A-6

Important Patterns There are additional patterns within each Reporting Category. Each Reporting Category includes some basic elements that are consistent across all of the grade levels.
A. Comprehension and Reading Skills
Comprehension and Reading Skills has two basic elements: A.1 Fiction A.2 Nonfiction
B. Interpretation and Analysis of Fiction and Nonfiction Text
Interpretation and Analysis of Fiction and Nonfiction Text has three basic elements: B.1 Components within text or components within and across texts B.2 Literary Devices B.3 Concepts and Organization of Nonfiction Text The Anchors generally target the same comprehension skills from Grades 4 through 8 and 11, although the depth of knowledge required to comprehend the text grows in complexity over the years. In addition, the expectation is that the level of texts themselves will grow in complexity. How to Read the Assessment Anchors The Reading Assessment Anchors begin with “R” to distinguish them from the Mathematics Assessment Anchors, which begin with “M”. The number after the “R” in the label is the grade level (e.g., R4 would be Reading at fourth grade). The second letter in the labeling system is the Reporting Category (A or B). The same reporting categories continue across all Grades 4 through 8 and 11. The final number in the label is the actual Assessment Anchor (e.g., 1.1, 1.2, 1.3, etc.). Essentially, you read the Assessment Anchors like an outline, with the Assessment Anchor shaded across the top of the page and more specific details underneath.
Appendix A: Assessment Anchor Explanations
2012 PSSA-M Technical Report A-7

For example, R4.A.1.1 is a Reading Assessment Anchor (R stands for Reading) at 4th grade (4). The A indicates that this Anchor is in the Comprehension and Reading Skills Reporting Category and the 1.1 means that it is the first Assessment Anchor in that Reporting Category. (See below)
NOTE: Below each specific descriptor of the Assessment Anchor is a reference in italics. This reference relates to the Pennsylvania Academic Standards and helps you crosswalk the Anchors to the Standards.
R4.A.1.1
Appendix A: Assessment Anchor Explanations
2012 PSSA-M Technical Report A-8

PENNSYLVANIA DEPARTMENT OF EDUCATION Overview of Reading Assessment Anchors
GRADE 4
R4.A. Comprehension and Reading Skills
R4A.1 Understand Fiction Appropriate to Grade level R4A.2 Understand Nonfiction Appropriate to Grade Level
R4.B. Interpretation and Analysis of Fictional and Nonfictional Text
R4.B.1 Understand Components Within and Between Texts R4.B.2 Understand Literary Devices in Fictional and Nonfictional Text R4.B.3 Understand Concepts and Organization of Nonfictional Text
GRADE 5
R5.A. Comprehension and Reading Skills
R5.A.1 Understand Fiction Appropriate to Grade level R5.A.2 Understand Nonfiction Appropriate to Grade Level
R5.B. Interpretation and Analysis of Fictional and Nonfictional Text
R5.B.1 Understand Components Within and Between Texts R5.B.2 Understand Literary Devices in Fictional and Nonfictional Text R5.B.3 Understand Concepts and Organization of Nonfictional Text GRADE 6
R6.A. Comprehension and Reading Skills
R6.A.1 Understand Fiction Appropriate to Grade level R6.A.2 Understand Nonfiction Appropriate to Grade Level
R6.B. Interpretation and Analysis of Fictional and Nonfictional Text
R6.B.1 Understand Components Within and Between Texts R6.B.2 Understand Literary Devices in Fictional and Nonfictional Text R6.B.3 Understand Concepts and Organization of Nonfictional Text
Appendix A: Assessment Anchor Explanations
2012 PSSA-M Technical Report A-9

GRADE 7
R7.A. Comprehension and Reading Skills
R7.A.1 Understand Fiction Appropriate to Grade level R7.A.2 Understand Nonfiction Appropriate to Grade Level
R7.B. Interpretation and Analysis of Fictional and Nonfictional Text
R7.B.1 Understand Components Within and Between Texts R7.B.2 Understand Literary Devices in Fictional and Nonfictional Text R7.B.3 Understand Concepts and Organization of Nonfictional Text
GRADE 8
R8.A. Comprehension and Reading Skills
R8.A.1 Understand Fiction Appropriate to Grade level R8.A.2 Understand Nonfiction Appropriate to Grade Level
R8.B. Interpretation and Analysis of Fictional and Nonfictional Text
R8.B.1 Understand Components Within and Between Texts R8.B.2 Understand Literary Devices in Fictional and Nonfictional Text R8.B.3 Understand Concepts and Organization of Nonfictional Text
GRADE 11
R11.A. Comprehension and Reading Skills
R11.A.1 Understand Fiction Appropriate to Grade level R11.A.2 Understand Nonfiction Appropriate to Grade Level
R11.B. Interpretation and Analysis of Fictional and Nonfictional Text
R11.B.1 Understand Components Within and Between Texts R11.B.2 Understand Literary Devices in Fictional and Nonfictional Text
R11.B.3 Understand Concepts and Organization of Nonfictional Text
Appendix A: Assessment Anchor Explanations
2012 PSSA-M Technical Report A-10

PPeennnnssyyllvvaanniiaa SScciieennccee
About the Science Assessment Anchors
Introduction The Pennsylvania Science Assessment is based on the Academic Standards adopted by the State Board of Education in January of 2002. The standards are comprised of two documents: Science and Technology Standards and Environment and Ecology Standards. These documents contain seventeen important categories that describe what students need to know. The purpose of the Assessment Anchors is to articulate essential and assessable elements, and to provide clarity for instruction and for the focus of the state assessment in grades 8 and 11. How the Assessment Anchors Connect to the Standards The Pennsylvania Academic Standards for Science are: 3.1 Unifying Themes 4.1 Watersheds and Wetlands 3.2 Inquiry and Design 4.2 Renewable and Nonrenewable Resources 3.3 Biological Sciences 4.3 Environmental Health 3.4 Physical Science, Chemistry, 4.4 Agriculture and Society and Physics 3.5 Earth Sciences 4.5 Integrated Pest Management 3.6 Technology Education 4.6 Ecosystems and their Interactions 3.7 Technological Devises 4.7 Threatened, Endangered and Extinct Species 3.8 Science, Technology and 4.8 Humans and the Environment Human Endeavors 4.9 Environmental Laws and Regulations All of the Science Standards categories are included in the Assessment Anchors, but the anchors tighten the focus of what is assessed. The Assessment Anchors clarify what is expected from grade span to grade span (K-4, 5-7, and 8-10). In addition, the Assessment Anchors have fewer Reporting Categories to help create more reliable scores (meaning that there are more items per reporting category making interpretations about what students actually know more reliable). Rather than reporting student results in all 17 standards, the reports will be organized into four reporting categories. How the Assessment Anchors are Organized The four reporting categories are similar to those used by the National Assessment of Educational Progress (NEAP) and The Third International Mathematics and Science Study (TIMSS). The four categories for the assessment anchors are included in these major assessments, but are organized differently. Below are the four student reporting categories for the assessment anchors for the PSSA and the PSSA-M in Science and the related standards.
Appendix A: Assessment Anchor Explanations
2012 PSSA-M Technical Report A-11

Reporting Categories Connections to the Standards
A. The Nature of Science 3.1 Unifying Themes of Science 3.2 Inquiry and Design 3.6 Technology Education 3.7 Technological Devices 3.8 Science, Technology, and Human Endeavors 4.4 Agriculture and Society 4.6 Ecosystems and their Interactions 4.7 Threatened, Endangered, and Extinct Species 4.8 Humans and the Environment
B. Biological Sciences 3.1 Unifying Themes of Science 3.3 Biological Sciences 4.2 Renewable and Nonrenewable Resources 4.3 Environmental Health 4.6 Ecosystems and Their Interactions 4.7 Threatened, Endangered, and Extinct Species
C. Physical Sciences 3.2 Inquiry and Design 3.4 Physical Science, Chemistry, and Physics 3.6 Earth Sciences
D. Earth and Space Sciences 3.2 Inquiry and Design 3.4 Physical Science, Chemistry, and Physics 3.5 Earth Sciences 3.7 Technological Devices 4.1 Watersheds and Wetlands 4.2 Renewable and Nonrenewable Resources 4.8 Humans and the Environment
Appendix A: Assessment Anchor Explanations
2012 PSSA-M Technical Report A-12
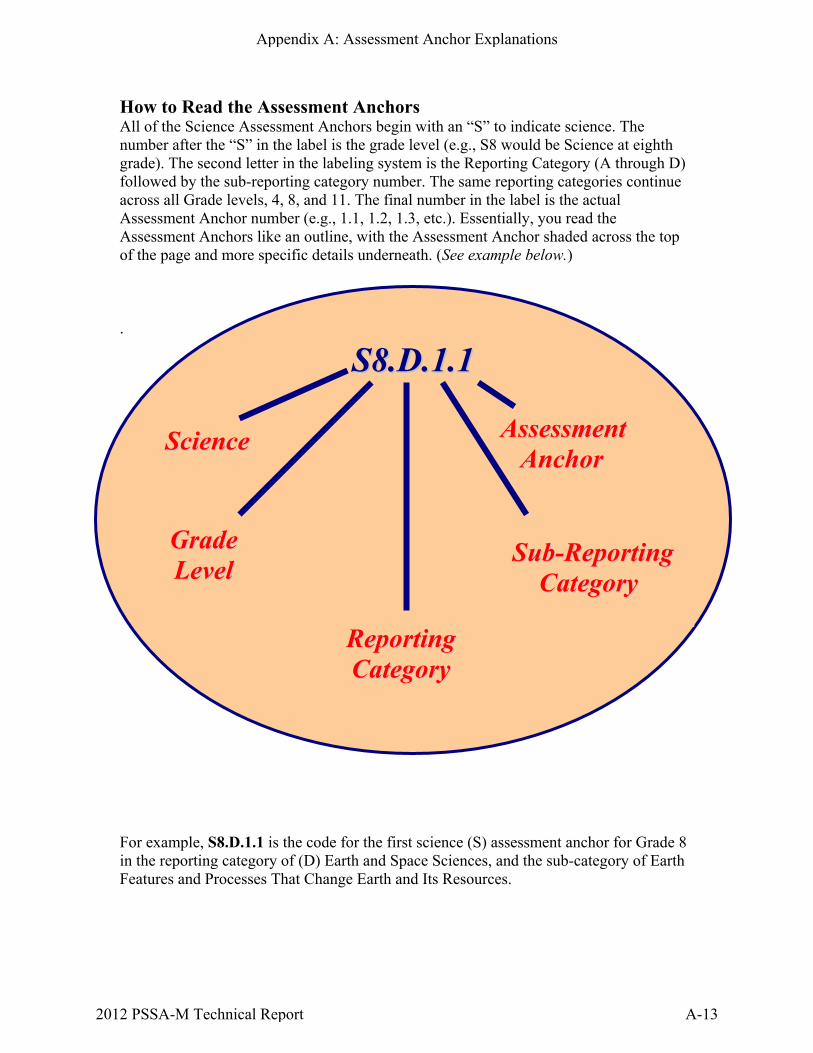
How to Read the Assessment Anchors All of the Science Assessment Anchors begin with an “S” to indicate science. The number after the “S” in the label is the grade level (e.g., S8 would be Science at eighth grade). The second letter in the labeling system is the Reporting Category (A through D) followed by the sub-reporting category number. The same reporting categories continue across all Grade levels, 4, 8, and 11. The final number in the label is the actual Assessment Anchor number (e.g., 1.1, 1.2, 1.3, etc.). Essentially, you read the Assessment Anchors like an outline, with the Assessment Anchor shaded across the top of the page and more specific details underneath. (See example below.) . For example, S8.D.1.1 is the code for the first science (S) assessment anchor for Grade 8 in the reporting category of (D) Earth and Space Sciences, and the sub-category of Earth Features and Processes That Change Earth and Its Resources.
SSuubb--RReeppoorrttiinngg CCaatteeggoorryy
AAsssseessssmmeenntt AAnncchhoorr
SScciieennccee
GGrraaddee LLeevveell
RReeppoorrttiinngg CCaatteeggoorryy
SS88..DD..11..11
Appendix A: Assessment Anchor Explanations
2012 PSSA-M Technical Report A-13

Overview of Science Assessment Anchors *Note that on this overview document, the grade level does not appear in the reporting categories because these occur at all grade levels (8 and 11). SA. The Nature of Science
SA.1 Reasoning and Analysis SA.2 Processes, Procedures, and Tools of Scientific Investigations SA.3 Systems, Models, and Patterns
SB. Biological Sciences
SB.1 Structure and Function of Organisms SB.2 Continuity of Life SB.3 Ecological Behavior and Systems
SC. Physical Sciences
SC.1 Structure, Properties, and Interaction of Matter and Energy SC.2 Forms, Sources, Conversion, and Transfer of Energy SC.3 Principles of Motion and Force
SD. Earth and Space Sciences
SD.1 Earth Features and Processes that Change Earth and Its Resources SD.2 Weather, Climate, and Atmospheric Processes SD.3 Composition and Structure of the Universe
Appendix A: Assessment Anchor Explanations
2012 PSSA-M Technical Report A-14

Appendix B:
PSSA and PSSA-M General Scoring Guidelines


PENNSYLVANIA DEPARTMENT OF EDUCATION
PSSA
General Description of Mathematics Scoring Guidelines
4 – The response demonstrates a thorough understanding of the mathematical concepts and procedures required by the task.
The response provides correct answer(s) with clear and complete mathematical procedures shown and a correct explanation, as required by the task. Response may contain a minor “blemish” or omission in work or explanation that does not detract from demonstrating a thorough understanding.
3 – The response demonstrates a general understanding of the mathematical concepts and procedures required by the task.
The response and explanation (as required by the task) are mostly complete and correct. The response may have minor errors or omissions that do not detract from demonstrating a general understanding.
2 – The response demonstrates a partial understanding of the mathematical concepts and procedures required by the task.
The response is somewhat correct with partial understanding of the required mathematical concepts and/or procedures demonstrated and/or explained. The response may contain some work that is incomplete or unclear.
1 – The response demonstrates a minimal understanding of the mathematical concepts and procedures required by the task.
0 – The response has no correct answer and insufficient evidence to demonstrate any understanding of the mathematical concepts and procedures required by the task for that grade level.
Response may show only information copied from the question.
Special Categories within zero reported separately: BLK (blank) ...Blank, entirely erased, or written refusal to respond OT ..................Off task IL ....................Illegible LOE ................Response in a language other than English This document is available on the PDE website. Note: The PSSA General Description of Mathematics Scoring Guidelines also applies to the PSSA-M mathematics assessments.
Appendix B: PSSA and PSSA-M General Scoring Guidelines
2012 PSSA-M Technical Report B-1

PENNSYLVANIA DEPARTMENT OF EDUCATION PSSA General Scoring Guidelines for Open-Ended Reading Items 3 Points • The response provides a complete answer to the task (e.g., a statement that offers a correct answer as well as text-based support). • The response provides specific, appropriate and accurate details (e.g., naming, describing, explaining, or comparing) or examples. 2 Points • The response provides a partial answer to the task (e.g., indicates some awareness of the task and at least one text-based detail). • The response attempts to provide sufficient, appropriate details (e.g., naming, describing, explaining, or comparing) or examples; may contain minor inaccuracies. 1 Point • The response provides an incomplete answer to the task (e.g., indicating either a misunderstanding of the task or no text-based details). • The response provides insufficient or inappropriate details or examples that have a major effect on accuracy. • The response consists entirely of relevant copied text. 0 Points • The response provides insufficient material for scoring. • The response is inaccurate in all aspects. Categories within zero reported separately: • BLK (blank) = no response or written refusal to respond or too brief to determine response. • OT = off task/topic. • LOE = response in a language other than English. • IL = illegible.
Note: The PSSA General Scoring Guidelines for Open-Ended Reading Items also apply to the PSSA-M reading assessments.
Appendix B: PSSA and PSSA-M General Scoring Guidelines
2012 PSSA-M Technical Report B-2

PENNSYLVANIA DEPARTMENT OF EDUCATION PSSA SCIENCE DESCRIPTION OF SCORING GUIDELINES FOR 2-POINT OPEN-ENDED ITEMS: General Description of Science Scoring Guidelines: 2 – The response demonstrates a thorough understanding of the scientific content, concepts, and procedures required by the task(s). The response provides a clear, complete, and correct response as required by the task/s. Response may contain a minor blemish or omission in work or explanation that does not detract from demonstrating a thorough understanding. 1 – The response demonstrates a partial understanding of the scientific content, concepts, and procedures required by the task(s). The response is somewhat correct with partial understanding of the required scientific content, concepts, and/or procedures demonstrated and/or explained. The response may contain some work that is incomplete or unclear. 0 – The response provides insufficient evidence to demonstrate any understanding of the scientific content, concepts, and procedures as required by the task(s) for that grade level. Response may show only information copied or rephrased from the question or insufficient correct information to receive a score of 1. Special Categories within zero reported separately: BLK – Blank, entirely erased or written refusal to respond OT – Off Task IL – Illegible LOE – Response in a language other than English Note: The PSSA Description of Scoring Guidelines for 2-Point Open-Ended Items for Science also applies to the PSSA-M science assessments.
Appendix B: PSSA and PSSA-M General Scoring Guidelines
2012 PSSA-M Technical Report B-3

Appendix B: PSSA and PSSA-M General Scoring Guidelines
2012 PSSA-M Technical Report B-4

Appendix C:
2012 PSSA-M Tally Sheets


MC OE MC OE MC OE Total MC OE MC OE MC OE Total
1 Understand relationships and representations of numbers and number systems
1 1 1 Match word to number
1 1 2 Differentiate between even & odd
1 1 3 Compare two whole numbers1 1 4 Order a set of whole numbers1 1 5 Match symbolic representation
1 2 1 Write fraction that corresponds to drawing
1 2 2 Draw representation of a fraction
1 3 1 Count a collection of bills & coins
1 3 2 Compare total values of combinations of coins
1 3 3 Make change up to $5.00
2 Understand meanings, uses and relations of operations
2 1 1 Represent multiplication as repeated addition
2 1 2 Demonstrate inverse relationships
2 1 3 Identify correct operation(s)
3 Compute accurately/fluently and make reasonable estimates
3 1 1Solve single- & double-digit addition & subtraction problems
3 1 2 Solve multiplication problems
3 1 3 Solve triple digit addition & subtraction problems
3 2 1 Estimate sums and differences
Number of Items
Core EB
Total For Assessment Anchor A.1Understand relationships among and representations of numbers and number systems
StudentScores
(CorePoints)
Total Points
(Core &EB)
Total For Assessment Anchor A.2Understand meanings, uses of operations and how they relate to each other
Total For Assessment Anchor A.3Compute accurately and fluently and make reasonable estimates
Total For Reporting Category A
A:
Nu
mbe
rs a
nd
Ope
rati
ons
Grade 03 MathematicsRep
ortin
gCa
tego
ry
Asse
ssm
ent
Anch
or
Des
crip
tor
(Sub
-anc
hor)
Elig
ible
Cont
ent
Focus
Points Items
Equating Block (EB)
Total Numberof Items
(Core &EB)
Appendix C: 2012 PSSA-M Tally Sheets
2012 PSSA-M Technical Report C-1

MC OE MC OE MC OE Total MC OE MC OE MC OE Total
1 Understand measurable attributes and units, systems, processes of measurement
1 1 1 Tell/show analog time to the minute
1 1 2 Find elapsed time1 1 3 Identify times as AM or PM
1 2 1 Select appropriate unit for measurement
1 2 2Compare and/or order objects by length, area, or weight
2 Apply techniques, tools & formulas to determine measurements
2 1 1 Use a ruler to nearest 1/2 inch
2 2 1 Match object with measurement
Total For Assessment Anchor B.1Understand measurable attributes and units, systems, processes of measurement
Total For Assessment Anchor B.2Apply appropriate techniques, tools and formulas to determine measurements
Total For Reporting Category B
B:
Mea
sure
men
t
Total Points
(Core &EB)
Number of Items
Core EB
Grade 03 MathematicsRep
ortin
gCa
tego
ry
Asse
ssm
ent
Anch
or
Des
crip
tor
(Sub
-anc
hor)
Elig
ible
Cont
ent
Focus
Points Items
StudentScores
(CorePoints)
Equating Block (EB)
Total Numberof Items
(Core &EB)
Appendix C: 2012 PSSA-M Tally Sheets
2012 PSSA-M Technical Report C-2

MC OE MC OE MC OE Total MC OE MC OE MC OE Total
1 Analyze characteristics & properties of 2-D & 3-D shapes
1 1 1 Name/identify/describe 2-D shapes
1 1 2 Name/identify 3-D shapes
2 Identify and/or apply concepts of transformations or symmetry
2 1 1 Identify/draw line of symmetry
2 1 2 Identify symmetrical 2-D shapes
Total For Assessment Anchor C.2Identify and/or apply concepts of transformations or symmetry
Total For Reporting Category C
C:
Geo
met
ry
Number of Items
Core EB
Total Numberof Items
(Core &EB)
Total For Assessment Anchor C.1Analyze characteristics and properties of two- and three-dimensional geometric shapes
StudentScores
(CorePoints)
Total Points
(Core &EB)
Grade 03 MathematicsRep
ortin
gCa
tego
ry
Asse
ssm
ent
Anch
or
Des
crip
tor
(Sub
-anc
hor)
Elig
ible
Cont
ent
Focus
Points Items
Equating Block (EB)
Appendix C: 2012 PSSA-M Tally Sheets
2012 PSSA-M Technical Report C-3

MC OE MC OE MC OE Total MC OE MC OE MC OE Total
1 Understand patterns, relations and functions
1 1 1 Extend or find a missing element in a pattern
1 1 2 Identify/describe rule for a pattern
2 Represent/analyze mathematical situations
2 1 1 Create or match a story
2 1 2 Match number sentence to story
2 2 1 Find a missing number2 2 2 Identify the missing symbol
Total Numberof Items
(Core &EB)
Total For Assessment Anchor D.1Understand patterns, relations and functions
Total For Assessment Anchor D.2Represent/analyze mathematical situations using numbers, symbols, words, tables and/or graphs
Total For Reporting Category D
D:
Alg
ebra
ic C
once
pts
Items
StudentScores
(CorePoints)
Total Points
(Core &EB)
Number of Items
Core EBRep
ortin
gCa
tego
ry
Asse
ssm
ent
Anch
or
Des
crip
tor
(Sub
-anc
hor)
Elig
ible
Cont
ent
Focus
Points
Equating Block (EB)
Grade 03 Mathematics
Appendix C: 2012 PSSA-M Tally Sheets
2012 PSSA-M Technical Report C-4

MC OE MC OE MC OE Total MC OE MC OE MC OE Total
1 Formulate/answer questions; organize, display, interpret or analyze data
1 1 1 Analyze data shown on tables, charts, or bar graphs
1 1 2Describe, interpret and/or answer questions based on data
1 2 1 Graph data
1 2 2Translate information from one type of display to another
Total For Reporting Category E
E: D
ata
An
alys
is a
nd
Pro
bab
ility
Number of Items
Core EB
Total Numberof Items
(Core &EB)
Total For Assessment Anchor E.1Formulate or answer questions about data and/or organize, display, interpret or analyze data
StudentScores
(CorePoints)
Total Points
(Core &EB)
Grade 03 MathematicsRep
ortin
gCa
tego
ry
Asse
ssm
ent
Anch
or
Des
crip
tor
(Sub
-anc
hor)
Elig
ible
Cont
ent
Focus
Points Items
Equating Block (EB)
Appendix C: 2012 PSSA-M Tally Sheets
2012 PSSA-M Technical Report C-5

MC OE MC OE MC OE Total MC OE MC OE MC OE Total
1 Understand relationships and representations of numbers and number systems
1 1 1 Match drawing to fraction, decimal, mixed number
1 1 1 1 1 1
1 1 2 Create a drawing or set to represent a fraction
2 2 2 2 2 2
1 1 3 Match standard form to word form (decimals)
1 1 1 1 1 1
1 1 4 Write in expanded, standard or word form (whole numbers)
1 1 1 1 1 1
1 2 1 Locate/identify fractions or decimals on number line
1 1 1 1 1 1
1 2 2 Compare/order whole numbers 1 1 1 1 1 11 3 1 Find/identify/list factors 1 1 1 1 1 11 3 2 Find/identify/list multiples 1 1 1 1 1 1
9 9 9 9 9 9
2 Understand meanings, uses and relations of operations
4 4 4 1 1 1
2 1 1 Solve problems involving all operations (whole numbers)
2 1 2 Solve problems with decimals 2 2 2 2 2 2
2 4 2 4 6 2 1 2 1 3
3 Compute accurately/fluently and make reasonable estimates
3 1 1 Round whole numbers 1 1 1 1 1 13 1 2 Round to nearest dollar 1 1 1 1 1 1
3 1 3 Estimate answers with whole numbers
3 2 1 Solve addition/subtraction problems involving decimals
3 2 2Solve addition/subtraction problems involving fractions
1 1 1 1 1 1
3 3 3 3 3 3
14 4 14 4 18 14 1 14 1 15
Number of Items
Core EB
Total For Assessment Anchor A.1Understand relationships among and representations of numbers and number systems
StudentScores
(CorePoints)
Total Points
(Core &EB)
Total For Assessment Anchor A.2Understand meanings, uses of operations and how they relate to each other
Total For Assessment Anchor A.3Compute accurately and fluently and make reasonable estimates
Total For Reporting Category A
A:
Nu
mbe
rs a
nd
Ope
rati
ons
Grade 04 MathematicsR
epor
ting
Cate
gory
Asse
ssm
ent
Anch
or
Des
crip
tor
(Sub
-anc
hor)
Elig
ible
Cont
ent
Focus
Points Items
Equating Block (EB)
Total Numberof Items
(Core &EB)
Appendix C: 2012 PSSA-M Tally Sheets
2012 PSSA-M Technical Report C-6

MC OE MC OE MC OE Total MC OE MC OE MC OE Total
1 Understand measurable attributes and units, systems, processes of measurement
4 4 4 1 1 1
1 1 1 Match analog time to digital time
1 1 2 Identify time1 1 3 Calculate elapsed time
1 1 4Determine beginning or ending time
4 4 4 1 1 1
2 Apply techniques, tools & formulas to determine measurements
2 1 1 Use/read ruler to nearest 1/4 inch
2 2 1Make reasonable estimates of measurement
1 1 1 1 1 1
1 1 1 1 1 1
1 4 1 4 5 1 1 1 1 2
Total For Assessment Anchor B.1Understand measurable attributes and units, systems, processes of measurement
Total For Assessment Anchor B.2Apply appropriate techniques, tools and formulas to determine measurements
Total For Reporting Category B
B:
Mea
sure
men
t
Total Points
(Core &EB)
Number of Items
Core EB
Grade 04 MathematicsR
epor
ting
Cate
gory
Asse
ssm
ent
Anch
or
Des
crip
tor
(Sub
-anc
hor)
Elig
ible
Cont
ent
Focus
Points Items
StudentScores
(CorePoints)
Equating Block (EB)
Total Numberof Items
(Core &EB)
Appendix C: 2012 PSSA-M Tally Sheets
2012 PSSA-M Technical Report C-7

MC OE MC OE MC OE Total MC OE MC OE MC OE Total
1 Analyze characteristics & properties of 2-D & 3-D shapes
1 1 1 Identify/classify/compare 2-D figures
1 1 1 1 1 1
1 1 2 Classify 3-D figures, identify characteristics
1 2 1 Identify points/lines/segments/rays
1 1 1 1 1 1
1 2 2Identify parallel/perpendicular lines
1 1 1 1 1 1
3 3 3 3 3 3
2 Identify and/or apply concepts of transformations and symmetry
2 1 1Identify/draw figures having one, two, or no lines of symmetry
1 1 1 1 1 1
1 1 1 1 1 1
3 Locate points/describe relationships using the coordinate plane
3 1 1 Match or plot ordered pair 1 1 1 1 1 1
1 1 1 1 1 1
5 5 5 5 5 5
Number of Items
Core EB
Total For Assessment Anchor C.1Analyze characteristics and properties of two- and three-dimensional geometric shapes
StudentScores
(CorePoints)
Total Points
(Core &EB)
Total For Assessment Anchor C.2Identify and/or apply concepts of transformations and symmetry
Total For Assessment Anchor C.3Locate points or describe relationships using the coordinate plane
Total For Reporting Category C
C:
Geo
met
ryGrade 04 Mathematics
Rep
ortin
gCa
tego
ry
Asse
ssm
ent
Anch
or
Des
crip
tor
(Sub
-anc
hor)
Elig
ible
Cont
ent
Focus
Points Items
Equating Block (EB)
Total Numberof Items
(Core &EB)
Appendix C: 2012 PSSA-M Tally Sheets
2012 PSSA-M Technical Report C-8

MC OE MC OE MC OE Total MC OE MC OE MC OE Total
1 Understand patterns, relations and functions
1 1 1Extend or find a missing element in a numerical or geometric pattern
1 1 1 1 1 1
1 1 2 Identify/describe rule for numerical or geometric pattern
1 1 1 1 1 1
1 1 3 Create or replicate numerical or geometric pattern
1 1 1 1 1 1
1 2 1 Determine missing elements in function table given the rule
1 2 2 Determine rule given a table
3 3 3 3 3 3
2 Represent/analyze mathematical situations
2 1 1 Correlate story with expression or equation
2 2 1 Solve for missing number in equation
1 1 1 1 1 1
2 2 2 Identify the missing symbol 1 1 1 1 1 1
2 2 2 2 2 2
5 5 5 5 5 5
Total For Assessment Anchor D.1Understand patterns, relations and functions
Total For Assessment Anchor D.2Represent/analyze mathematical situations using numbers, symbols, words, tables and/or graphs
Total For Reporting Category D
D:
Alg
ebra
ic C
once
pts
Total Points
(Core &EB)
Number of Items
Core EB
Grade 04 MathematicsR
epor
ting
Cate
gory
Asse
ssm
ent
Anch
or
Des
crip
tor
(Sub
-anc
hor)
Elig
ible
Cont
ent
Focus
Points Items
StudentScores
(CorePoints)
Equating Block (EB)
Total Numberof Items
(Core &EB)
Appendix C: 2012 PSSA-M Tally Sheets
2012 PSSA-M Technical Report C-9

MC OE MC OE MC OE Total MC OE MC OE MC OE Total
1 Formulate questions; organize, display, interpret or analyze data
1 1 1Describe/interpret/answer questions based on data shown
2 2 2 2 2 2
1 2 1 Graph data or complete a graph 1 1 1 1 1 1
1 2 2Translate data from one type of display to another
1 1 1 1 1 1
4 4 4 4 4 4
3 Understand and apply basic concepts of probability
3 1 1Make a prediction based on data or chance
1 1 1 1 1 1
1 1 1 1 1 1
5 5 5 5 5 5
Total For Assessment Anchor E.3Understand and apply basic concepts of probability
Total For Reporting Category E
E: D
ata
An
alys
is a
nd
Pro
babi
lity
Number of Items
Core EB
Total Numberof Items
(Core &EB)
Total For Assessment Anchor E.1Formulate or answer questions about data and/or organize, display, interpret or analyze data
StudentScores
(CorePoints)
Total Points
(Core &EB)
Grade 04 MathematicsR
epor
ting
Cate
gory
Asse
ssm
ent
Anch
or
Des
crip
tor
(Sub
-anc
hor)
Elig
ible
Cont
ent
Focus
Points Items
Equating Block (EB)
Appendix C: 2012 PSSA-M Tally Sheets
2012 PSSA-M Technical Report C-10

MC OE MC OE MC OE Total MC OE MC OE MC OE Total
1 Understand relationships and representations of numbers and number systems
1 1 1 Use expanded notation 1 1 1 1 1 11 2 1 Read/write decimals 1 1 1 1 1 1
1 2 2 Identify number with place value 1 1 1 1 1 1
1 3 1 Compare whole numbers 1 1 1 1 1 1
1 3 2 Compare and/or order decimals
1 3 3 Compare proper fractions 1 1 1 1 1 1
1 4 1 Identify negative numbers on number line
1 1 1 1 1 1
1 4 2 Identify negative numbers on thermometer
1 1 1 1 1 1
1 5 1 Model fractions/mixed numbers 2 2 2 2 2 2
1 6 1 Name/identify prime and composite numbers
1 1 1 1 1 1
1 6 2 List/identify factors, multiples 1 1 1 1 1 1
11 11 11 11 11 11
2 Understand meanings, uses and relations of operations
4 4 4 1 1 1
2 1 1Solve problems involving all operations (whole numbers & decimals)
2 1 2 Solve problems involving addition/subtraction (fractions)
2 1 3 Choose correct operation
4 4 4 1 1 1
3 Compute accurately/fluently and make reasonable estimates
3 1 1 Round whole numbers & decimals 1 1 1 1 1 1
3 1 2 Estimate to solve 1 1 1 1 1 13 2 1 Compute without calculator
2 2 2 2 2 2
13 4 13 4 17 13 1 13 1 14
Number of Items
Core EB
Total For Assessment Anchor A.1Understand relationships among and representations of numbers and number systems
StudentScores
(CorePoints)
Total Points
(Core &EB)
Total For Assessment Anchor A.2Understand meanings, uses of operations and how they relate to each other
Total For Assessment Anchor A.3Compute accurately and fluently and make reasonable estimates
Total For Reporting Category A
A:
Nu
mbe
rs a
nd
Ope
rati
ons
Grade 05 MathematicsRep
ortin
gCa
tego
ry
Asse
ssm
ent
Anch
or
Des
crip
tor
(Sub
-anc
hor)
Elig
ible
Cont
ent
Focus
Points Items
Equating Block (EB)
Total Numberof Items
(Core &EB)
Appendix C: 2012 PSSA-M Tally Sheets
2012 PSSA-M Technical Report C-11
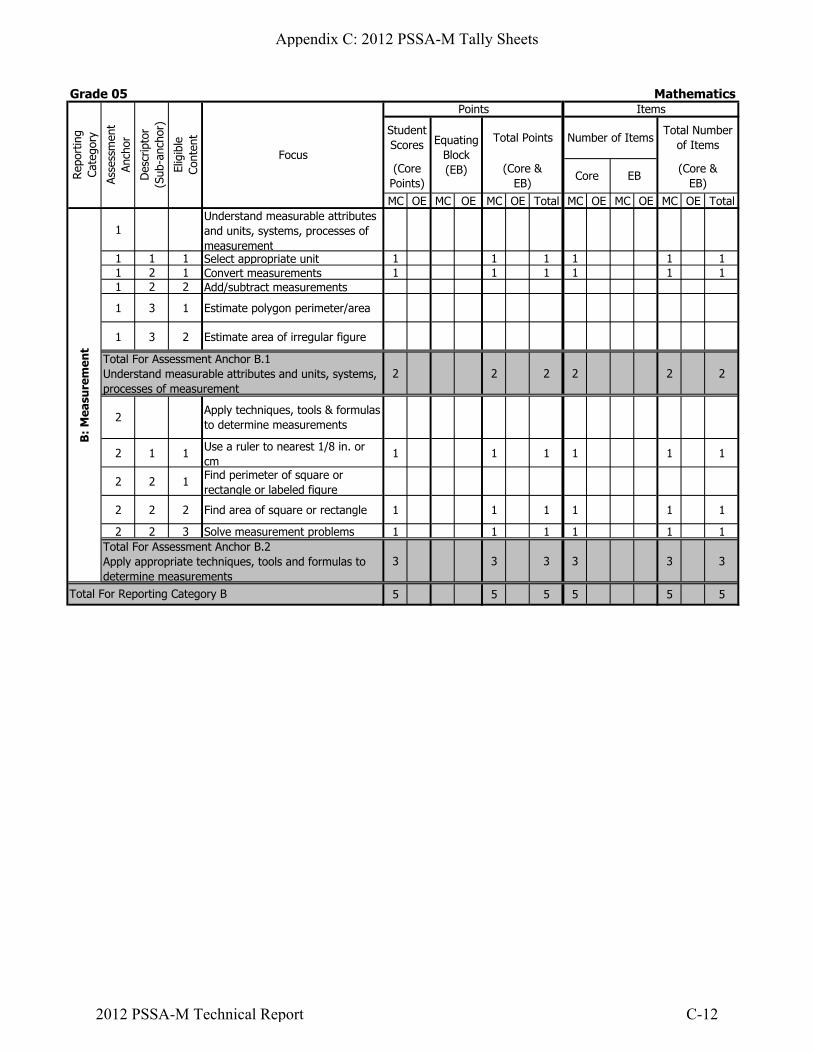
MC OE MC OE MC OE Total MC OE MC OE MC OE Total
1 Understand measurable attributes and units, systems, processes of measurement
1 1 1 Select appropriate unit 1 1 1 1 1 11 2 1 Convert measurements 1 1 1 1 1 11 2 2 Add/subtract measurements
1 3 1 Estimate polygon perimeter/area
1 3 2 Estimate area of irregular figure
2 2 2 2 2 2
2 Apply techniques, tools & formulas to determine measurements
2 1 1 Use a ruler to nearest 1/8 in. or cm
1 1 1 1 1 1
2 2 1 Find perimeter of square or rectangle or labeled figure
2 2 2 Find area of square or rectangle 1 1 1 1 1 1
2 2 3 Solve measurement problems 1 1 1 1 1 1
3 3 3 3 3 3
5 5 5 5 5 5
Total For Assessment Anchor B.1Understand measurable attributes and units, systems, processes of measurement
Total For Assessment Anchor B.2Apply appropriate techniques, tools and formulas to determine measurements
Total For Reporting Category B
B:
Mea
sure
men
t
Total Points
(Core &EB)
Number of Items
Core EB
Grade 05 MathematicsRep
ortin
gCa
tego
ry
Asse
ssm
ent
Anch
or
Des
crip
tor
(Sub
-anc
hor)
Elig
ible
Cont
ent
Focus
Points Items
StudentScores
(CorePoints)
Equating Block (EB)
Total Numberof Items
(Core &EB)
Appendix C: 2012 PSSA-M Tally Sheets
2012 PSSA-M Technical Report C-12
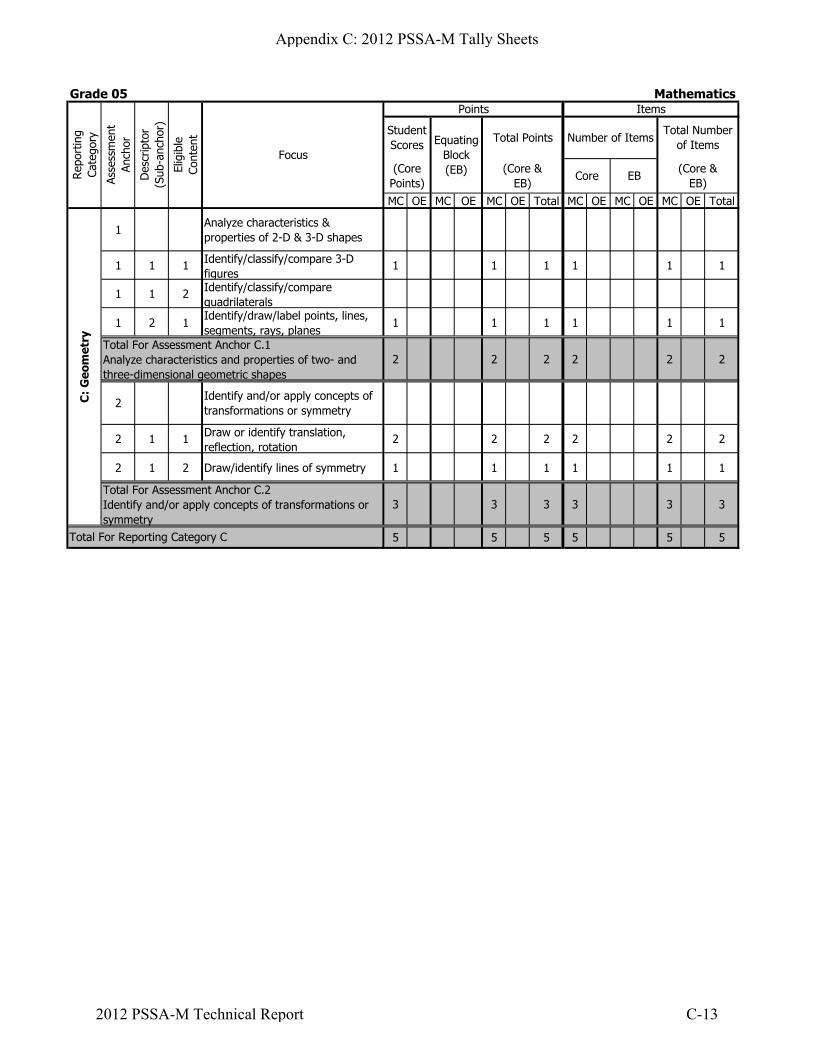
MC OE MC OE MC OE Total MC OE MC OE MC OE Total
1 Analyze characteristics & properties of 2-D & 3-D shapes
1 1 1 Identify/classify/compare 3-D figures
1 1 1 1 1 1
1 1 2 Identify/classify/compare quadrilaterals
1 2 1Identify/draw/label points, lines, segments, rays, planes
1 1 1 1 1 1
2 2 2 2 2 2
2 Identify and/or apply concepts of transformations or symmetry
2 1 1 Draw or identify translation, reflection, rotation
2 2 2 2 2 2
2 1 2 Draw/identify lines of symmetry 1 1 1 1 1 1
3 3 3 3 3 3
5 5 5 5 5 5
Total For Assessment Anchor C.2Identify and/or apply concepts of transformations or symmetry
Total For Reporting Category C
C:
Geo
met
ry
Number of Items
Core EB
Total Numberof Items
(Core &EB)
Total For Assessment Anchor C.1Analyze characteristics and properties of two- and three-dimensional geometric shapes
StudentScores
(CorePoints)
Total Points
(Core &EB)
Grade 05 MathematicsRep
ortin
gCa
tego
ry
Asse
ssm
ent
Anch
or
Des
crip
tor
(Sub
-anc
hor)
Elig
ible
Cont
ent
Focus
Points Items
Equating Block (EB)
Appendix C: 2012 PSSA-M Tally Sheets
2012 PSSA-M Technical Report C-13
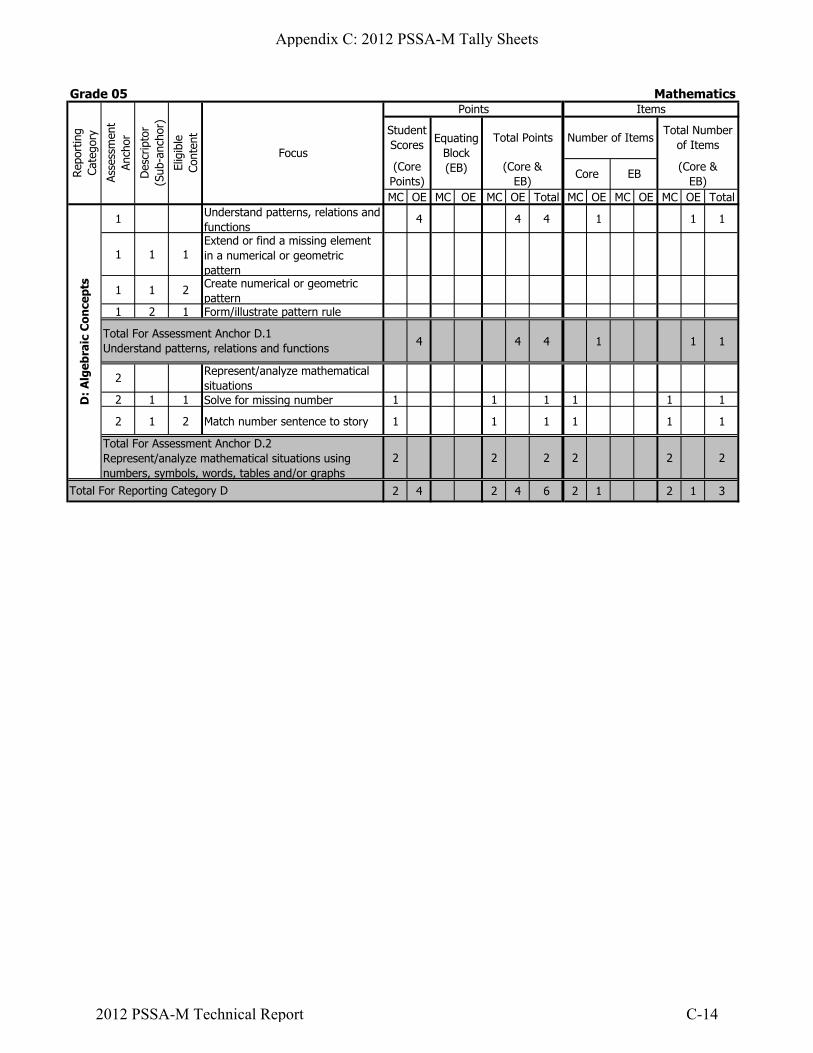
MC OE MC OE MC OE Total MC OE MC OE MC OE Total
1 Understand patterns, relations and functions
4 4 4 1 1 1
1 1 1Extend or find a missing element in a numerical or geometric pattern
1 1 2 Create numerical or geometric pattern
1 2 1 Form/illustrate pattern rule
4 4 4 1 1 1
2 Represent/analyze mathematical situations
2 1 1 Solve for missing number 1 1 1 1 1 1
2 1 2 Match number sentence to story 1 1 1 1 1 1
2 2 2 2 2 2
2 4 2 4 6 2 1 2 1 3
Total Numberof Items
(Core &EB)
Total For Assessment Anchor D.1Understand patterns, relations and functions
Total For Assessment Anchor D.2Represent/analyze mathematical situations using numbers, symbols, words, tables and/or graphs
Total For Reporting Category D
D:
Alg
ebra
ic C
once
pts
Items
StudentScores
(CorePoints)
Total Points
(Core &EB)
Number of Items
Core EBRep
ortin
gCa
tego
ry
Asse
ssm
ent
Anch
or
Des
crip
tor
(Sub
-anc
hor)
Elig
ible
Cont
ent
Focus
Points
Equating Block (EB)
Grade 05 Mathematics
Appendix C: 2012 PSSA-M Tally Sheets
2012 PSSA-M Technical Report C-14

MC OE MC OE MC OE Total MC OE MC OE MC OE Total
1 Formulate/answer questions; organize, display, interpret or analyze data
1 1 1 Interpret/display data 1 1 1 1 1 1
1 1 1 1 1 1
2 Select and/or use appropriate statistical methods to analyze data
2 1 1 Determine the mean, median, range
1 1 1 1 1 1
2 1 2 Identify the mode in set of data 1 1 1 1 1 1
2 2 2 2 2 2
3 Understand/apply basic concepts of probability or outcomes
3 1 1 Predict/determine likelihood of outcomes
1 1 1 1 1 1
3 1 2 Determine probability of outcome 1 1 1 1 1 1
2 2 2 2 2 2
5 5 5 5 5 5
Total For Assessment Anchor E.2Select and/or use appropriate statistical methods to analyze data
Total For Assessment Anchor E.3Understand and/or apply basic concepts of probability or outcomes
Total For Reporting Category E
E: D
ata
An
alys
is a
nd
Pro
bab
ility
Number of Items
Core EB
Total Numberof Items
(Core &EB)
Total For Assessment Anchor E.1Formulate or answer questions about data and/or organize, display, interpret or analyze data
StudentScores
(CorePoints)
Total Points
(Core &EB)
Grade 05 MathematicsRep
ortin
gCa
tego
ry
Asse
ssm
ent
Anch
or
Des
crip
tor
(Sub
-anc
hor)
Elig
ible
Cont
ent
Focus
Points Items
Equating Block (EB)
Appendix C: 2012 PSSA-M Tally Sheets
2012 PSSA-M Technical Report C-15

MC OE MC OE MC OE Total MC OE MC OE MC OE Total
1 Understand relationships and representations of numbers and number systems
1 1 1 Represent percents as fractions and/or decimals
1 1 1 1 1 1
1 1 2Convert between fractions and decimals/differentiate between terminating & repeating decimals
1 1 1 1 1 1
1 1 3 Represent number in exponential form
1 1 1 1 1 1
1 1 4 Represent mixed number as an improper fraction
1 1 1 1 1 1
1 2 1 Compare/order rational numbers except integers
1 3 1 Find GCF of two numbers 1 1 1 1 1 11 3 2 Find LCM of two numbers 1 1 1 1 1 1
1 3 3 Use divisibility rules for 2, 3, 5 & 10 to solve problems
1 4 1 Model percents
6 6 6 6 6 6
2 Understand meanings, uses and relations of operations
2 1 1Complete equations by using properties: associative, commutative, distributive, Identity
2 2 2 2 2 2
2 2 2 2 2 2
3 Compute accurately/fluently and make reasonable estimates
4 4 4 1 1 1
3 1 1 Estimate to solve
3 2 1Solve problems involving operations
4 4 4 1 1 1
8 4 8 4 12 8 1 8 1 9
Number of Items
Core EB
Total For Assessment Anchor A.1Understand relationships among and representations of numbers and number systems
StudentScores
(CorePoints)
Total Points
(Core &EB)
Total For Assessment Anchor A.2Select /use operations to solve problems
Total For Assessment Anchor A.3Compute accurately and fluently and make reasonable estimates
Total For Reporting Category A
A:
Nu
mbe
rs a
nd
Ope
rati
ons
Grade 06 MathematicsRep
ortin
gCa
tego
ryAs
sess
men
tAn
chor
Des
crip
tor
(Sub
-anc
hor)
Elig
ible
Cont
ent
Focus
Points Items
Equating Block (EB)
Total Numberof Items
(Core &EB)
Appendix C: 2012 PSSA-M Tally Sheets
2012 PSSA-M Technical Report C-16

MC OE MC OE MC OE Total MC OE MC OE MC OE Total
1 Understand measurable attributes and units, systems, processes of measurement
1 1 1 Determine/compare elapsed time 1 1 1 1 1 1
1 1 1 1 1 1
2 Apply techniques, tools & formulas to determine measurements
2 1 1 Use ruler to nearest 1/16 in. or mm
1 1 1 1 1 1
2 1 2 Choose precise measurement
2 1 3 Measure angles using protractor 1 1 1 1 1 1
2 2 1 Find perimeter of any polygon 1 1 1 1 1 12 3 1 Define/label/identify angles 1 1 1 1 1 1
4 4 4 4 4 4
5 5 5 5 5 5
Total For Assessment Anchor B.1Understand measurable attributes and units, systems, processes of measurement
Total For Assessment Anchor B.2Apply appropriate techniques, tools and formulas to determine measurements
Total For Reporting Category B
B:
Mea
sure
men
t
Total Points
(Core &EB)
Number of Items
Core EB
Grade 06 MathematicsRep
ortin
gCa
tego
ryAs
sess
men
tAn
chor
Des
crip
tor
(Sub
-anc
hor)
Elig
ible
Cont
ent
Focus
Points Items
StudentScores
(CorePoints)
Equating Block (EB)
Total Numberof Items
(Core &EB)
Appendix C: 2012 PSSA-M Tally Sheets
2012 PSSA-M Technical Report C-17

MC OE MC OE MC OE Total MC OE MC OE MC OE Total
1 Analyze characteristics & properties of 2-D & 3-D shapes
1 1 1 Identify, classify, and compare types of polygons
1 1 1 1 1 1
1 1 2 Identify properties of all types of triangles
2 2 2 2 2 2
1 1 3 Solve radius/diameter problems 1 1 1 1 1 1
1 1 4 Identify/use polygon/circle degrees
1 1 1 1 1 1
1 2 1Identify/describe/label parallel, perpendicular, and intersecting lines
1 1 1 1 1 1
1 2 2Identify points, planes, lines, line segments, rays, angles, and vertices
6 6 6 6 6 6
3 Locate points/describe relationships using the coordinate plane
3 1 1Plot points in Quadrant I & on axes
1 1 1 1 1 1
1 1 1 1 1 1
7 7 7 7 7 7
Total For Assessment Anchor C.3Locate points or describe relationships using the coordinate plane
Total For Reporting Category C
C:
Geo
met
ry
Number of Items
Core EB
Total Numberof Items
(Core &EB)
Total For Assessment Anchor C.1Analyze characteristics and properties of two- and three-dimensional geometric shapes
StudentScores
(CorePoints)
Total Points
(Core &EB)
Grade 06 MathematicsRep
ortin
gCa
tego
ryAs
sess
men
tAn
chor
Des
crip
tor
(Sub
-anc
hor)
Elig
ible
Cont
ent
Focus
Points Items
Equating Block (EB)
Appendix C: 2012 PSSA-M Tally Sheets
2012 PSSA-M Technical Report C-18

MC OE MC OE MC OE Total MC OE MC OE MC OE Total
1 Understand patterns, relations and functions
1 1 1 Create/extend/complete pattern 1 1 1 1 1 1
1 2 1 Determine or illustrate pattern rule 2 2 2 2 2 2
3 3 3 3 3 3
2 Represent/analyze mathematical situations
2 1 1 Identify inverse operation to solve one step equation
1 1 1 1 1 1
2 1 2 Solve one-step equation 2 2 2 2 2 2
2 2 1Match one variable, one-step equation/expression to situation
1 1 1 1 1 1
4 4 4 4 4 4
7 7 7 7 7 7
Total Numberof Items
(Core &EB)
Total For Assessment Anchor D.1Understand patterns, relations and functions
Total For Assessment Anchor D.2Represent/analyze mathematical situations using numbers, symbols, words, tables and/or graphs
Total For Reporting Category D
D:
Alg
ebra
ic C
once
pts
Items
StudentScores
(CorePoints)
Total Points
(Core &EB)
Number of Items
Core EBRep
ortin
gCa
tego
ryAs
sess
men
tAn
chor
Des
crip
tor
(Sub
-anc
hor)
Elig
ible
Cont
ent
Focus
Points
Equating Block (EB)
Grade 06 Mathematics
Appendix C: 2012 PSSA-M Tally Sheets
2012 PSSA-M Technical Report C-19

MC OE MC OE MC OE Total MC OE MC OE MC OE Total
1 Formulate/answer questions; organize, display, interpret or analyze data
1 1 1 Analyze data 1 1 1 1 1 1
1 1 2 Choose appropriate data representation
1 1 3 Display data in graphs, etc.
1 1 1 1 1 1
2 Select/use appropriate statistical methods to analyze data
4 4 4 1 1 1
2 1 1Determine/calculate mean, median, mode, range
1 1 1 1 1 1
1 4 1 4 5 1 1 1 1 2
3 Understand/apply basic concepts of probability or outcomes
3 1 1 Define/find probability3 1 2 Determine/show combinations 1 1 1 1 1 1
1 1 1 1 1 1
3 4 3 4 7 3 1 3 1 4
Total For Assessment Anchor E.2Select and/or use appropriate statistical methods to analyze data
Total For Assessment Anchor E.3Understand and/or apply basic concepts of probability or outcomes
Total For Reporting Category E
E: D
ata
An
alys
is a
nd
Pro
bab
ility
Number of Items
Core EB
Total Numberof Items
(Core &EB)
Total For Assessment Anchor E.1Formulate or answer questions about data and/or organize, display, interpret or analyze data
StudentScores
(CorePoints)
Total Points
(Core &EB)
Grade 06 MathematicsRep
ortin
gCa
tego
ryAs
sess
men
tAn
chor
Des
crip
tor
(Sub
-anc
hor)
Elig
ible
Cont
ent
Focus
Points Items
Equating Block (EB)
Appendix C: 2012 PSSA-M Tally Sheets
2012 PSSA-M Technical Report C-20

MC OE MC OE MC OE Total MC OE MC OE MC OE Total
1 Understand relationships and representations of numbers and number systems
1 1 1 Convert between fractions, decimals, percents
1 1 1 1 1 1
1 2 1 Compare/order rational numbers 2 2 2 2 2 2
1 2 2Locate and identify rational numbers on a number line
3 3 3 3 3 3
2 Understand meanings, uses and relations of operations
4 4 4 1 1 1
2 1 1 Use order of operations
2 2 1 Write ratios to compare quantities
2 2 2 Solve for a variable in proportions
2 2 3 Use proportions to test equivalency
2 2 4 Calculate/apply unit rates or unit prices
2 2 5Select and use ratios/proportions to solve problems
2 2 6Use proportions to find missing lengths in similar figures
1 1 1 1 1 1
1 4 1 4 5 1 1 1 1 2
3 Compute accurately/fluently and make reasonable estimates
3 1 1
Estimate answers involving operations with whole numbers, decimals, fractions and mixed numbers
3 2 1
Solve problems involving operations with whole numbers, decimals, fractions and mixed numbers
3 2 2Solve problems involving addition/subtraction of integers
1 1 1 1 1 1
1 1 1 1 1 1
5 4 5 4 9 5 1 5 1 6
Number of Items
Core EB
Total For Assessment Anchor A.1Understand relationships among and representations of numbers and number systems
StudentScores
(CorePoints)
Total Points
(Core &EB)
Total For Assessment Anchor A.2Understand meanings, uses of operations and how they relate to each other
Total For Assessment Anchor A.3Compute accurately and fluently and make reasonable estimates
Total For Reporting Category A
A:
Nu
mbe
rs a
nd
Ope
rati
ons
Grade 07 MathematicsRep
ortin
gCa
tego
ry
Asse
ssm
ent
Anch
or
Des
crip
tor
(Sub
-anc
hor)
Elig
ible
Cont
ent
Focus
Points Items
Equating Block (EB)
Total Numberof Items
(Core &EB)
Appendix C: 2012 PSSA-M Tally Sheets
2012 PSSA-M Technical Report C-21

MC OE MC OE MC OE Total MC OE MC OE MC OE Total
1 Understand measurable attributes and units, systems, processes of measurement
1 1 1Add/subtract/convert measurements
1 1 1 1 1 1
1 1 1 1 1 1
2 Apply techniques, tools & formulas to determine measurements
2 1 1 Find perimeter and/or area of compound figures
2 1 2 Find circumference/area of circles 1 1 1 1 1 1
2 1 3 Find area of triangles, parallelograms, trapezoids
2 2 2 2 2 2
2 2 1 Interpret and apply scale drawings 1 1 1 1 1 1
2 2 2Determine appropriate scale for reduction and enlargement
4 4 4 4 4 4
5 5 5 5 5 5
Total For Assessment Anchor B.1Understand measurable attributes and units, systems, processes of measurement
Total For Assessment Anchor B.2Apply appropriate techniques, tools and formulas to determine measurements
Total For Reporting Category B
B:
Mea
sure
men
t
Total Points
(Core &EB)
Number of Items
Core EB
Grade 07 MathematicsRep
ortin
gCa
tego
ry
Asse
ssm
ent
Anch
or
Des
crip
tor
(Sub
-anc
hor)
Elig
ible
Cont
ent
Focus
Points Items
StudentScores
(CorePoints)
Equating Block (EB)
Total Numberof Items
(Core &EB)
Appendix C: 2012 PSSA-M Tally Sheets
2012 PSSA-M Technical Report C-22

MC OE MC OE MC OE Total MC OE MC OE MC OE Total
1 Analyze characteristics & properties of 2-D & 3-D shapes
1 1 1 Identify diameter, radius, chord, circumference in circles
1 1 1 1 1 1
1 1 2 Solve problems using radius/diameter relationship
1 1 1 1 1 1
1 1 3Identify parallel, perpendicular, and skew lines in a 3-dimensional figure
1 1 1 1 1 1
1 2 1 Identify similar/congruent polygons
1 1 1 1 1 1
1 2 2Identify corresponding sides/angles
1 1 1 1 1 1
5 5 5 5 5 5
3 Locate points/describe relationships using the coordinate plane
3 1 1 Plot/identify ordered pairs 1 1 1 1 1 1
3 1 2Identify Quadrants I, II, III, IV, x- and y- axes, and the origin on the coordinate plane
1 1 1 1 1 1
2 2 2 2 2 2
7 7 7 7 7 7
Total For Assessment Anchor C.3Locate points or describe relationships using the coordinate plane
Total For Reporting Category C
C:
Geo
met
ry
Number of Items
Core EB
Total Numberof Items
(Core &EB)
Total For Assessment Anchor C.1Analyze characteristics and properties of two- and three-dimensional geometric shapes
StudentScores
(CorePoints)
Total Points
(Core &EB)
Grade 07 MathematicsRep
ortin
gCa
tego
ry
Asse
ssm
ent
Anch
or
Des
crip
tor
(Sub
-anc
hor)
Elig
ible
Cont
ent
Focus
Points Items
Equating Block (EB)
Appendix C: 2012 PSSA-M Tally Sheets
2012 PSSA-M Technical Report C-23

MC OE MC OE MC OE Total MC OE MC OE MC OE Total
1 Understand patterns, relations and functions
1 1 1 Describe/extend/complete pattern 3 3 3 3 3 3
3 3 3 3 3 3
2 Represent/analyze mathematical situations
2 1 1 Solve one-step equations 1 1 1 1 1 1
2 1 2 Use substitution of variables to simplify expression
1 1 1 1 1 1
2 2 1 Identify mathematical models 1 1 1 1 1 1
3 3 3 3 3 3
3 Analyze change in various contexts
4 4 4 1 1 1
3 1 1 Solve problems w/ constant rate of change
1 1 1 1 1 1
3 1 2Describe or use a rate of change shown on a graph
1 4 1 4 5 1 1 1 1 2
7 4 7 4 11 7 1 7 1 8
Total Numberof Items
(Core &EB)
Total For Assessment Anchor D.1Understand patterns, relations and functions
Total For Assessment Anchor D.2Represent/analyze mathematical situations using numbers, symbols, words, tables and/or graphs
Total For Assessment Anchor D.3Analyze change in various contexts
Total For Reporting Category D
D:
Alg
ebra
ic C
once
pts
Items
StudentScores
(CorePoints)
Total Points
(Core &EB)
Number of Items
Core EBRep
ortin
gCa
tego
ry
Asse
ssm
ent
Anch
or
Des
crip
tor
(Sub
-anc
hor)
Elig
ible
Cont
ent
Focus
Points
Equating Block (EB)
Grade 07 Mathematics
Appendix C: 2012 PSSA-M Tally Sheets
2012 PSSA-M Technical Report C-24

MC OE MC OE MC OE Total MC OE MC OE MC OE Total
1 Formulate/answer questions; organize, display, interpret or analyze data
1 1 1 Analyze data 1 1 1 1 1 1
1 1 1 1 1 1
2 Select and/or use appropriate statistical methods to analyze data
2 1 1Identify/calculate mean, median, mode, range for a set of data
2 2 2 2 2 2
2 1 2Choose appropriate measure of central tendency for a situation
1 1 1 1 1 1
3 3 3 3 3 3
3 Understand/apply basic concepts of probability or outcomes
3 1 1 Find theoretical probability of event
1 1 1 1 1 1
3 1 2 Find theoretical probability of event not occurring
3 1 3 Find experimental probability
1 1 1 1 1 1
4 Develop/evaluate inferences and predictions based on data displays
4 1 1Predict/draw conclusions from displays or probability
1 1 1 1 1 1
1 1 1 1 1 1
6 6 6 6 6 6
Total For Assessment Anchor E.2Select and/or use appropriate statistical methods to analyze data
Total For Assessment Anchor E.3Understand and/or apply basic concepts of probability or outcomes
Total For Assessment Anchor E.4Develop/evaluate inferences and predictions based on data displays
Total For Reporting Category E
E: D
ata
An
alys
is a
nd
Pro
bab
ility
Number of Items
Core EB
Total Numberof Items
(Core &EB)
Total For Assessment Anchor E.1Formulate or answer questions about data and/or organize, display, interpret or analyze data
StudentScores
(CorePoints)
Total Points
(Core &EB)
Grade 07 MathematicsRep
ortin
gCa
tego
ry
Asse
ssm
ent
Anch
or
Des
crip
tor
(Sub
-anc
hor)
Elig
ible
Cont
ent
Focus
Points Items
Equating Block (EB)
Appendix C: 2012 PSSA-M Tally Sheets
2012 PSSA-M Technical Report C-25
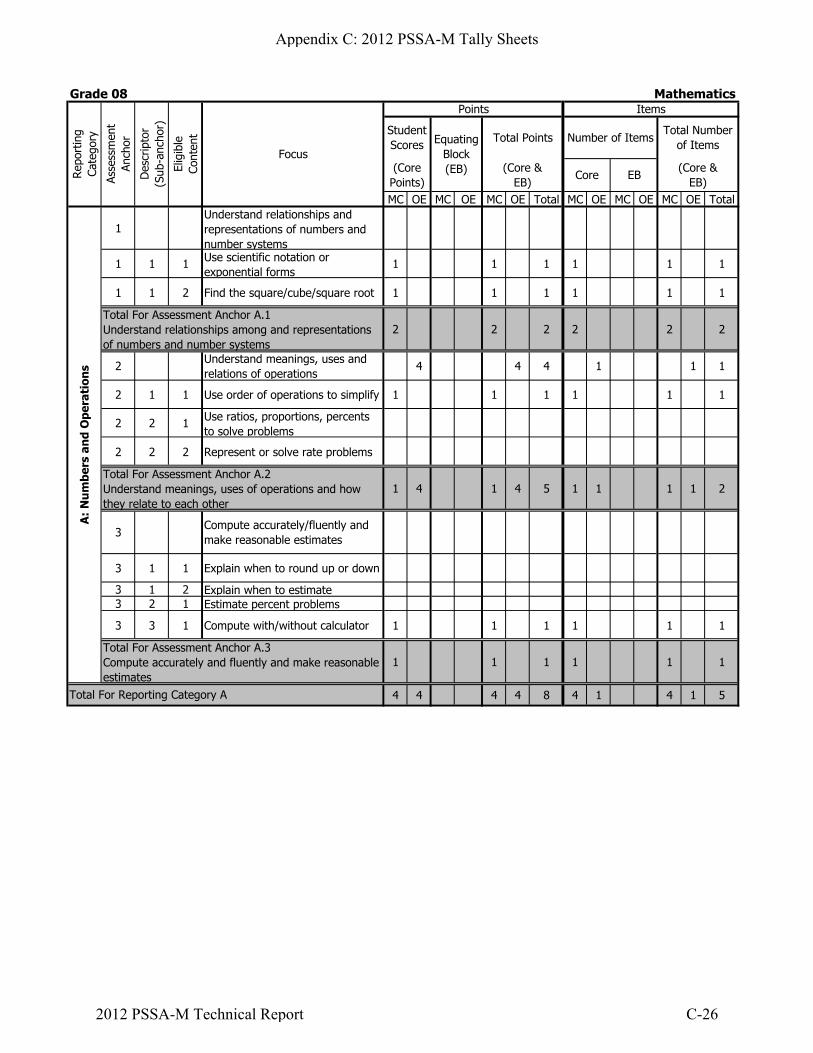
MC OE MC OE MC OE Total MC OE MC OE MC OE Total
1 Understand relationships and representations of numbers and number systems
1 1 1 Use scientific notation or exponential forms
1 1 1 1 1 1
1 1 2 Find the square/cube/square root 1 1 1 1 1 1
2 2 2 2 2 2
2 Understand meanings, uses and relations of operations
4 4 4 1 1 1
2 1 1 Use order of operations to simplify 1 1 1 1 1 1
2 2 1 Use ratios, proportions, percents to solve problems
2 2 2 Represent or solve rate problems
1 4 1 4 5 1 1 1 1 2
3 Compute accurately/fluently and make reasonable estimates
3 1 1 Explain when to round up or down
3 1 2 Explain when to estimate3 2 1 Estimate percent problems
3 3 1 Compute with/without calculator 1 1 1 1 1 1
1 1 1 1 1 1
4 4 4 4 8 4 1 4 1 5
Number of Items
Core EB
Total For Assessment Anchor A.1Understand relationships among and representations of numbers and number systems
StudentScores
(CorePoints)
Total Points
(Core &EB)
Total For Assessment Anchor A.2Understand meanings, uses of operations and how they relate to each other
Total For Assessment Anchor A.3Compute accurately and fluently and make reasonable estimates
Total For Reporting Category A
A:
Nu
mbe
rs a
nd
Ope
rati
ons
Grade 08 MathematicsRep
ortin
gCa
tego
ry
Asse
ssm
ent
Anch
or
Des
crip
tor
(Sub
-anc
hor)
Elig
ible
Cont
ent
Focus
Points Items
Equating Block (EB)
Total Numberof Items
(Core &EB)
Appendix C: 2012 PSSA-M Tally Sheets
2012 PSSA-M Technical Report C-26

MC OE MC OE MC OE Total MC OE MC OE MC OE Total
1 Understand measurable attributes and units, systems, processes of measurement
1 1 1 Convert metric measurements 1 1 1 1 1 1
1 1 2 Convert customary measurements 1 1 1 1 1 1
1 1 3 Convert time1 1 4 Convert temperature
2 2 2 2 2 2
2 Apply techniques, tools & formulas to determine measurements
2 1 1 Determine total degrees of interior angles
1 1 1 1 1 1
2 1 2 Determine the measurement of 1 interior angle of a polygon
1 1 1 1 1 1
2 1 3Determine the number of sides of a polygon given total degrees of interior angles
2 2 1 Calculate surface area of cubes and rectangular prisms
2 2 2 Calculate volume of cubes and rectangular prisms
1 1 1 1 1 1
2 2 3Determine appropriate type of measurement for a given situation
3 3 3 3 3 3
5 5 5 5 5 5
Total For Assessment Anchor B.1Understand measurable attributes and units, systems, processes of measurement
Total For Assessment Anchor B.2Apply appropriate techniques, tools and formulas to determine measurements
Total For Reporting Category B
B:
Mea
sure
men
t
Total Points
(Core &EB)
Number of Items
Core EB
Grade 08 MathematicsRep
ortin
gCa
tego
ry
Asse
ssm
ent
Anch
or
Des
crip
tor
(Sub
-anc
hor)
Elig
ible
Cont
ent
Focus
Points Items
StudentScores
(CorePoints)
Equating Block (EB)
Total Numberof Items
(Core &EB)
Appendix C: 2012 PSSA-M Tally Sheets
2012 PSSA-M Technical Report C-27

MC OE MC OE MC OE Total MC OE MC OE MC OE Total
1 Analyze characteristics & properties of 2-D & 3-D shapes
1 1 1 Match the 3-dimensional figure w/ its net
2 2 2 2 2 2
1 1 2Define, identify, and use properties of angles formed by intersecting lines
1 1 1 1 1 1
1 1 3
Define, identify, and use properties of angles formed when parallel lines are cut by a transversal
1 1 1 1 1 1
1 2 1 Use the Pythagorean Theorem 2 2 2 2 2 2
6 6 6 6 6 6
3 Locate points/describe relationships using the coordinate plane
3 1 1 Plot/locate/identify ordered pairs 1 1 1 1 1 1
1 1 1 1 1 1
7 7 7 7 7 7
Total For Assessment Anchor C.3Locate points or describe relationships using the coordinate plane
Total For Reporting Category C
C:
Geo
met
ry
Number of Items
Core EB
Total Numberof Items
(Core &EB)
Total For Assessment Anchor C.1Analyze characteristics and properties of two- and three-dimensional geometric shapes
StudentScores
(CorePoints)
Total Points
(Core &EB)
Grade 08 MathematicsRep
ortin
gCa
tego
ry
Asse
ssm
ent
Anch
or
Des
crip
tor
(Sub
-anc
hor)
Elig
ible
Cont
ent
Focus
Points Items
Equating Block (EB)
Appendix C: 2012 PSSA-M Tally Sheets
2012 PSSA-M Technical Report C-28

MC OE MC OE MC OE Total MC OE MC OE MC OE Total
1 Understand patterns, relations and functions
1 1 1 Continue numeric/algebraic pattern
2 2 2 2 2 2
1 1 2 Find missing element in pattern1 1 3 Write/state rule of function 1 1 1 1 1 1
3 3 3 3 3 3
2 Represent/analyze mathematical situations
4 4 4 1 1 1
2 1 1 Solve equations/inequalities
2 1 2 Use substitution to check solution
2 1 3 Simplify/substitute for expression 2 2 2 2 2 2
2 2 1Match written situation to expression, equation, or inequality
2 2 2Write/solve equation for a situation
2 4 2 4 6 2 1 2 1 3
4 Describe/use models to represent quantitative relationships
4 1 1 Graph linear function from x/y table
1 1 1 1 1 1
4 1 2 Match linear graph to x/y table 1 1 1 1 1 1
4 1 3 Match linear equation to x/y table
2 2 2 2 2 2
7 4 7 4 11 7 1 7 1 8
Total Numberof Items
(Core &EB)
Total For Assessment Anchor D.1Understand patterns, relations and functions
Total For Assessment Anchor D.2Represent/analyze mathematical situations using numbers, symbols, words, tables and/or graphs
Total For Assessment Anchor D.4Describe/use models to represent quantitative relationships
Total For Reporting Category D
D:
Alg
ebra
ic C
once
pts
Items
StudentScores
(CorePoints)
Total Points
(Core &EB)
Number of Items
Core EBRep
ortin
gCa
tego
ry
Asse
ssm
ent
Anch
or
Des
crip
tor
(Sub
-anc
hor)
Elig
ible
Cont
ent
Focus
Points
Equating Block (EB)
Grade 08 Mathematics
Appendix C: 2012 PSSA-M Tally Sheets
2012 PSSA-M Technical Report C-29

MC OE MC OE MC OE Total MC OE MC OE MC OE Total
1 Formulate/answer questions; organize, display, interpret or analyze data
1 1 1 Choose correct data representation
1 1 1 1 1 1
1 1 2 Display and/or interpret data 1 1 1 1 1 1
1 1 3Interpret stem-and-leaf, box-and-whisker plots
2 2 2 2 2 2
4 4 4 4 4 4
3 Understand/apply basic concepts of probability or outcomes
3 1 1 Find probability 1 1 1 1 1 1
3 2 1Calculate show number of permutations/combinations
1 1 1 1 1 1
4 Develop/evaluate inferences & predictions based on data
4 1 1 Fit line to scatter plot; describe correlation
1 1 1 1 1 1
4 1 2 Make predictions based on data 1 1 1 1 1 1
2 2 2 2 2 2
7 7 7 7 7 7
Total For Assessment Anchor E.3Understand and/or apply basic concepts of probability or outcomes
Total For Assessment Anchor E.4Develop/evaluate inferences & predictions or draw conclusions based on data or data displays
Total For Reporting Category E
E: D
ata
An
alys
is a
nd
Pro
bab
ility
Number of Items
Core EB
Total Numberof Items
(Core &EB)
Total For Assessment Anchor E.1Formulate or answer questions about data and/or organize, display, interpret or analyze data
StudentScores
(CorePoints)
Total Points
(Core &EB)
Grade 08 MathematicsRep
ortin
gCa
tego
ry
Asse
ssm
ent
Anch
or
Des
crip
tor
(Sub
-anc
hor)
Elig
ible
Cont
ent
Focus
Points Items
Equating Block (EB)
Appendix C: 2012 PSSA-M Tally Sheets
2012 PSSA-M Technical Report C-30

MC OE MC OE MC OE Total MC OE MC OE MC OE Total
1 Understand relationships and representations of numbers and number systems
1 1 1 Find square root of an integer 1 1 1 1 1 11 1 2 Use scientific notation1 1 3 Simplify square roots1 2 1 Find/use GCF (monomial)
1 3 1 Identify irrational numbers on a number line
1 1 1 1 1 1
1 3 2Compare and/or order real numbers
2 2 2 2 2 2
2 Understand meanings, uses and relations of operations
2 1 1Solve problems using operations with rational numbers
1 1 1 1 1 1
2 1 2 Solve problems using direct and inverse proportions
1 1 1 1 1 1
2 1 3 Identify/use proportional relationships
2 2 1Simplify expressions with exponents/roots/absolute value
2 2 2Simplify expressions involving operations of powers
2 2 2 2 2 2
3 Compute accurately/fluently and make reasonable estimates
3 1 1 Use order of operations to simplify 1 1 1 1 1 1
3 2 1 Use estimation to solve problems
1 1 1 1 1 1
5 5 5 5 5 5
Number of Items
Core EB
Total For Assessment Anchor A.1Understand relationships among and representations of numbers and number systems
StudentScores
(CorePoints)
Total Points
(Core &EB)
Total For Assessment Anchor A.2Understand meanings, uses of operations and how they relate to each other
Total For Assessment Anchor A.3Compute accurately and fluently and make reasonable estimates
Total For Reporting Category A
A:
Nu
mbe
rs a
nd
Ope
rati
ons
Grade 11 MathematicsRep
ortin
gCa
tego
ry
Asse
ssm
ent
Anch
or
Des
crip
tor
(Sub
-anc
hor)
Elig
ible
Cont
ent
Focus
Points Items
Equating Block (EB)
Total Numberof Items
(Core &EB)
Appendix C: 2012 PSSA-M Tally Sheets
2012 PSSA-M Technical Report C-31

MC OE MC OE MC OE Total MC OE MC OE MC OE Total
2 Apply techniques, tools & formulas to determine measurements
4 4 4 1 1 1
2 1 1 Measure and/or compare angles 1 1 1 1 1 1
2 2 1Calculate surface area of prisms, cylinders, cones, pyramids, and/or spheres
2 2 2Calculate volume of prisms, cylinders, cones, pyramids, and/or spheres
2 2 3Estimate area, perimeter, or circumference of irregular figure
2 2 4 Find missing length measurement
2 3 1Describe effect of linear dimension change
1 4 1 4 5 1 1 1 1 2
1 4 1 4 5 1 1 1 1 2
Total For Assessment Anchor B.2Apply appropriate techniques, tools and formulas to determine measurements
Total For Reporting Category B
B:
Mea
sure
men
t
Total Points
(Core &EB)
Number of Items
Core EB
Grade 11 MathematicsRep
ortin
gCa
tego
ry
Asse
ssm
ent
Anch
or
Des
crip
tor
(Sub
-anc
hor)
Elig
ible
Cont
ent
Focus
Points Items
StudentScores
(CorePoints)
Equating Block (EB)
Total Numberof Items
(Core &EB)
Appendix C: 2012 PSSA-M Tally Sheets
2012 PSSA-M Technical Report C-32
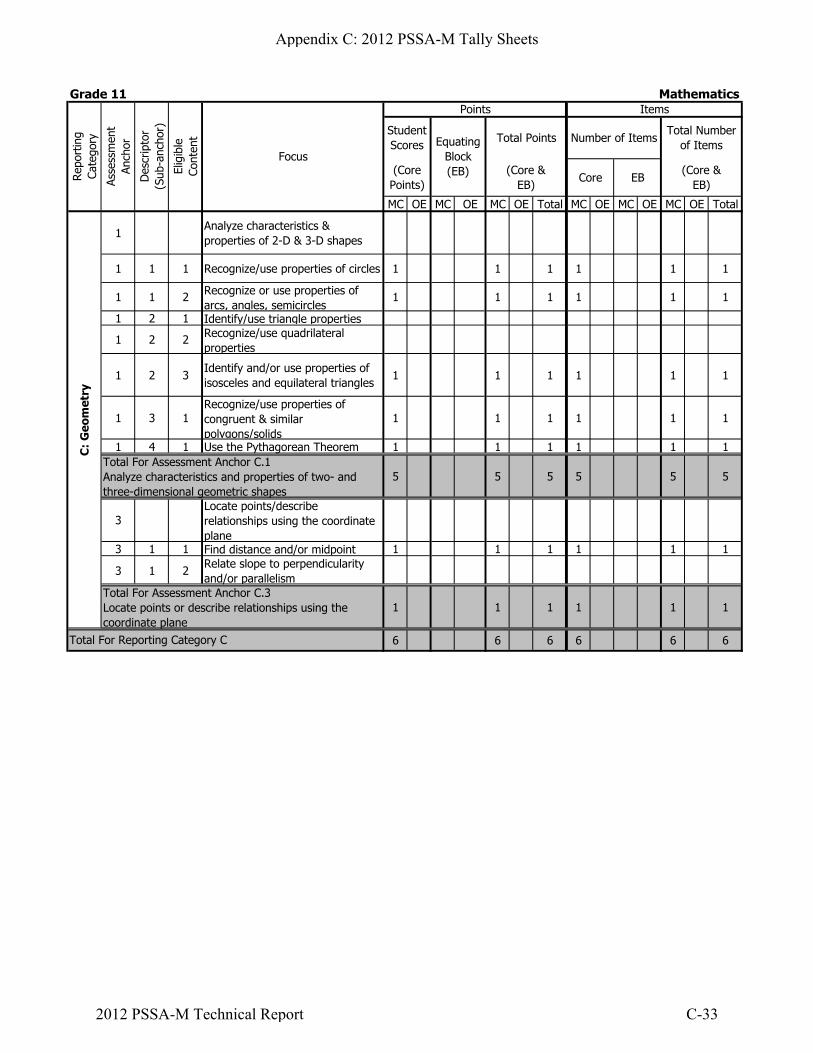
MC OE MC OE MC OE Total MC OE MC OE MC OE Total
1 Analyze characteristics & properties of 2-D & 3-D shapes
1 1 1 Recognize/use properties of circles 1 1 1 1 1 1
1 1 2 Recognize or use properties of arcs, angles, semicircles
1 1 1 1 1 1
1 2 1 Identify/use triangle properties
1 2 2 Recognize/use quadrilateral properties
1 2 3Identify and/or use properties of isosceles and equilateral triangles
1 1 1 1 1 1
1 3 1Recognize/use properties of congruent & similar polygons/solids
1 1 1 1 1 1
1 4 1 Use the Pythagorean Theorem 1 1 1 1 1 1
5 5 5 5 5 5
3 Locate points/describe relationships using the coordinate plane
3 1 1 Find distance and/or midpoint 1 1 1 1 1 1
3 1 2Relate slope to perpendicularity and/or parallelism
1 1 1 1 1 1
6 6 6 6 6 6
Total For Assessment Anchor C.1Analyze characteristics and properties of two- and three-dimensional geometric shapes
Total For Assessment Anchor C.3Locate points or describe relationships using the coordinate plane
Total For Reporting Category C
C:
Geo
met
ry
(CorePoints)
Total Points
(Core &EB)
Number of Items
Core EB
Grade 11 MathematicsRep
ortin
gCa
tego
ry
Asse
ssm
ent
Anch
or
Des
crip
tor
(Sub
-anc
hor)
Elig
ible
Cont
ent
Focus
Points Items
StudentScores Equating
Block (EB)
Total Numberof Items
(Core &EB)
Appendix C: 2012 PSSA-M Tally Sheets
2012 PSSA-M Technical Report C-33

MC OE MC OE MC OE Total MC OE MC OE MC OE Total
1 Understand patterns, relations and functions
4 4 4 1 1 1
1 1 1Analyze data for pattern; represent pattern algebraically/graphically
1 1 1 1 1 1
1 1 2 Determine if relation is a function
1 1 3Identify domain, range, and inverse of a relation
1 4 1 4 5 1 1 1 1 2
2 Represent/analyze mathematical situations
2 1 1Solve compound inequalities and/or graph solution sets on number line
2 1 2 Identify or graph linear inequalities on coordinate plane
2 1 3 Write and/or solve linear equation 1 1 1 1 1 1
2 1 4 Solve systems of equations 1 1 1 1 1 1
2 1 5 Solve quadratic equations using factoring
1 1 1 1 1 1
2 2 1 Add/subtract/multiply polynomials 1 1 1 1 1 1
2 2 2 Factor algebraic expressions 1 1 1 1 1 12 2 3 Simplify algebraic fractions
5 5 5 5 5 5
3 Analyze change in various contexts
3 1 1 Identify/describe rates of change 1 1 1 1 1 1
3 1 2 Determine relations in variable changes
1 1 1 1 1 1
3 2 1 Apply formula for slope of line 1 1 1 1 1 13 2 2 Write/identify linear equation 1 1 1 1 1 1
3 2 3 Compute slope and/or y-intercept
4 4 4 4 4 4
4 Describe/use models to represent quantitative relationships
4 1 1 Match graph to table/equation 2 2 2 2 2 2
2 2 2 2 2 2
12 4 12 4 16 12 1 12 1 13
Number of Items
Core EB
Total For Assessment Anchor D.1Understand patterns, relations and functions
StudentScores
(CorePoints)
Total Points
(Core &EB)
Total For Assessment Anchor D.2Represent/analyze mathematical situations using numbers, symbols, words, tables and/or graphs
Total For Assessment Anchor D.3Analyze change in various contexts
Total For Assessment Anchor D.4Describe or use models to represent quantitative relationships
Total For Reporting Category D
D:
Alg
ebra
ic C
once
pts
Grade 11 MathematicsRep
ortin
gCa
tego
ry
Asse
ssm
ent
Anch
or
Des
crip
tor
(Sub
-anc
hor)
Elig
ible
Cont
ent
Focus
Points Items
Equating Block (EB)
Total Numberof Items
(Core &EB)
Appendix C: 2012 PSSA-M Tally Sheets
2012 PSSA-M Technical Report C-34

MC OE MC OE MC OE Total MC OE MC OE MC OE Total
1 Formulate/answer questions; organize, display, interpret or analyze data
1 1 1 Create and/or use appropriate graphical representations
1 1 2Answer questions based on displayed data
1 1 1 1 1 1
1 1 1 1 1 1
2 Select and/or use appropriate statistical methods to analyze data
2 1 1 Find or select appropriate measure of central tendency
1 1 1 1 1 1
2 1 2Calculate and/or interpret range, quartiles, interquartile range
1 1 1 1 1 1
2 1 3 Describe influence of outliers
2 2 2 2 2 2
3 Understand/apply basic concepts of probability or outcomes
3 1 1 Determine probabilities
3 1 2Determine, convert and/or compare probability and/or odds
3 2 1Determine number of permutations and/or combinations
4 Develop/evaluate inferences, predictions or draw conclusions based on data
4 1 1Estimate or calculate predictions based on circle, line, bar graphs
1 1 1 1 1 1
4 1 2 Use probability to predict outcomes
4 2 1 Draw/write equation for best-fit line
1 1 1 1 1 1
4 2 2Predict using equations of best-fit lines
1 1 1 1 1 1
3 3 3 3 3 3
6 6 6 6 6 6Total For Reporting Category E
E: D
ata
An
alys
is a
nd
Pro
bab
ility
Total Numberof Items
(Core &EB)
Total For Assessment Anchor E.1Formulate or answer questions about data and/or organize, display, interpret or analyze data
Total For Assessment Anchor E.2Select and/or use appropriate statistical methods to analyze data
Total For Assessment Anchor E.3Understand and/or apply basic concepts of probability or outcomes
Total For Assessment Anchor E.4Develop and/or evaluate inferences and predictions or draw conclusions based on data or data displays
(CorePoints)
Total Points
(Core &EB)
Number of Items
Core EB
Grade 11 MathematicsRep
ortin
gCa
tego
ry
Asse
ssm
ent
Anch
or
Des
crip
tor
(Sub
-anc
hor)
Elig
ible
Cont
ent
Focus
Points Items
StudentScores
Equating Block (EB)
Appendix C: 2012 PSSA-M Tally Sheets
2012 PSSA-M Technical Report C-35
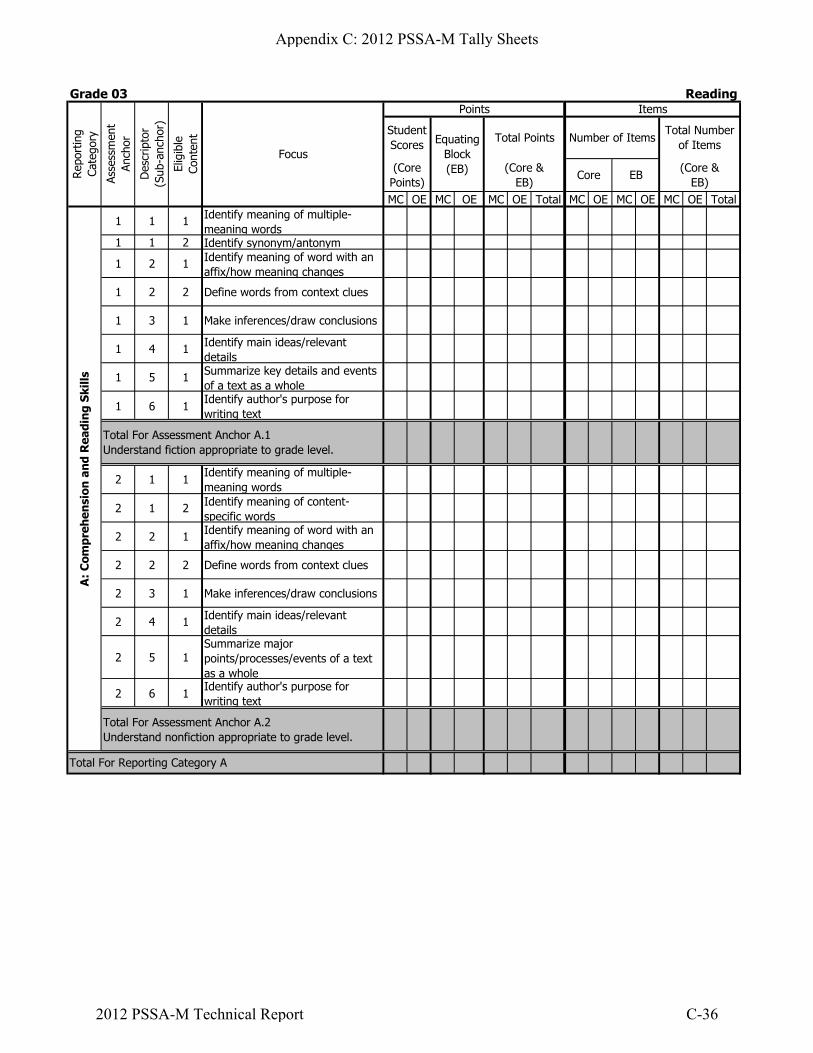
MC OE MC OE MC OE Total MC OE MC OE MC OE Total
1 1 1 Identify meaning of multiple-meaning words
1 1 2 Identify synonym/antonym
1 2 1 Identify meaning of word with an affix/how meaning changes
1 2 2 Define words from context clues
1 3 1 Make inferences/draw conclusions
1 4 1 Identify main ideas/relevant details
1 5 1 Summarize key details and events of a text as a whole
1 6 1Identify author's purpose for writing text
2 1 1Identify meaning of multiple-meaning words
2 1 2 Identify meaning of content-specific words
2 2 1 Identify meaning of word with an affix/how meaning changes
2 2 2 Define words from context clues
2 3 1 Make inferences/draw conclusions
2 4 1 Identify main ideas/relevant details
2 5 1Summarize major points/processes/events of a text as a whole
2 6 1Identify author's purpose for writing text
Total For Assessment Anchor A.2Understand nonfiction appropriate to grade level.
Total For Reporting Category A
A:
Com
preh
ensi
on a
nd
Rea
din
g Sk
ills
Total For Assessment Anchor A.1Understand fiction appropriate to grade level.
Number of Items
Core EB
Total Numberof Items
(Core &EB)
StudentScores
(CorePoints)
Total Points
(Core &EB)
Grade 03 ReadingRep
ortin
gCa
tego
ry
Asse
ssm
ent
Anch
or
Des
crip
tor
(Sub
-anc
hor)
Elig
ible
Cont
ent
Focus
Points Items
Equating Block (EB)
Appendix C: 2012 PSSA-M Tally Sheets
2012 PSSA-M Technical Report C-36
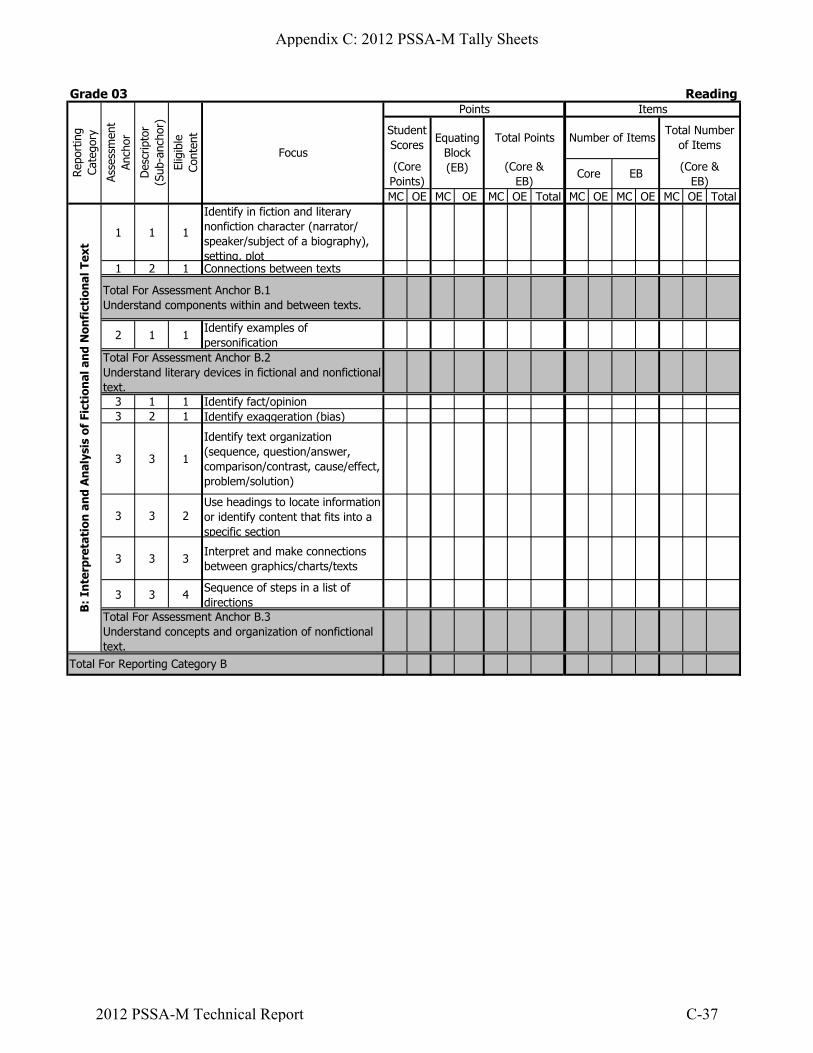
MC OE MC OE MC OE Total MC OE MC OE MC OE Total
1 1 1
Identify in fiction and literary nonfiction character (narrator/ speaker/subject of a biography), setting, plot
1 2 1 Connections between texts
2 1 1Identify examples of personification
3 1 1 Identify fact/opinion3 2 1 Identify exaggeration (bias)
3 3 1
Identify text organization (sequence, question/answer, comparison/contrast, cause/effect, problem/solution)
3 3 2Use headings to locate information or identify content that fits into a specific section
3 3 3Interpret and make connections between graphics/charts/texts
3 3 4Sequence of steps in a list of directions
Total For Assessment Anchor B.1Understand components within and between texts.
Total For Assessment Anchor B.2Understand literary devices in fictional and nonfictional text.
Total For Assessment Anchor B.3Understand concepts and organization of nonfictional text.
Focus
Points
Equating Block (EB)
Total For Reporting Category B
B:
Inte
rpre
tati
on a
nd
An
alys
is o
f Fi
ctio
nal
an
d N
onfi
ctio
nal
Tex
t
Items
StudentScores
(CorePoints)
Total Points
(Core &EB)
Number of Items
Core EBRep
ortin
gCa
tego
ry
Asse
ssm
ent
Anch
or
Des
crip
tor
(Sub
-anc
hor)
Elig
ible
Cont
ent Total Number
of Items
(Core &EB)
Grade 03 Reading
Appendix C: 2012 PSSA-M Tally Sheets
2012 PSSA-M Technical Report C-37
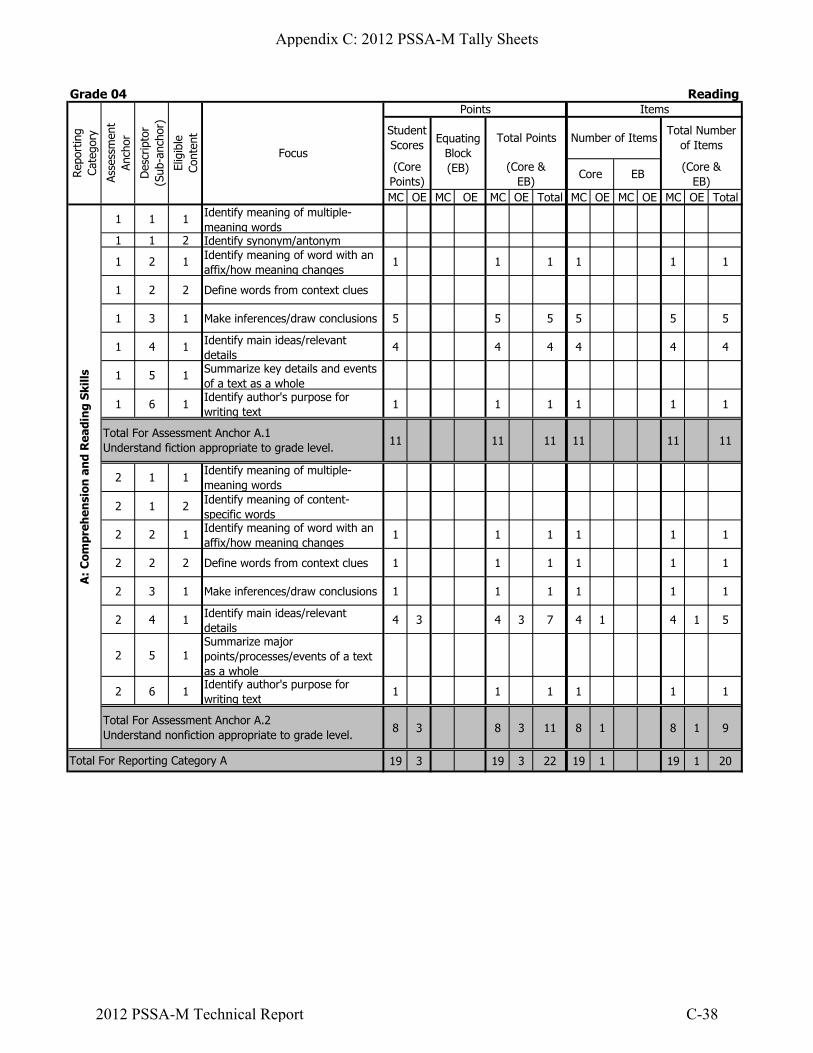
MC OE MC OE MC OE Total MC OE MC OE MC OE Total
1 1 1 Identify meaning of multiple-meaning words
1 1 2 Identify synonym/antonym
1 2 1 Identify meaning of word with an affix/how meaning changes
1 1 1 1 1 1
1 2 2 Define words from context clues
1 3 1 Make inferences/draw conclusions 5 5 5 5 5 5
1 4 1 Identify main ideas/relevant details
4 4 4 4 4 4
1 5 1 Summarize key details and events of a text as a whole
1 6 1Identify author's purpose for writing text
1 1 1 1 1 1
11 11 11 11 11 11
2 1 1Identify meaning of multiple-meaning words
2 1 2 Identify meaning of content-specific words
2 2 1 Identify meaning of word with an affix/how meaning changes
1 1 1 1 1 1
2 2 2 Define words from context clues 1 1 1 1 1 1
2 3 1 Make inferences/draw conclusions 1 1 1 1 1 1
2 4 1 Identify main ideas/relevant details
4 3 4 3 7 4 1 4 1 5
2 5 1Summarize major points/processes/events of a text as a whole
2 6 1Identify author's purpose for writing text
1 1 1 1 1 1
8 3 8 3 11 8 1 8 1 9
19 3 19 3 22 19 1 19 1 20
Total For Assessment Anchor A.2Understand nonfiction appropriate to grade level.
Total For Reporting Category A
A:
Com
preh
ensi
on a
nd
Rea
din
g Sk
ills
Total For Assessment Anchor A.1Understand fiction appropriate to grade level.
Number of Items
Core EB
Total Numberof Items
(Core &EB)
StudentScores
(CorePoints)
Total Points
(Core &EB)
Grade 04 ReadingRep
ortin
gCa
tego
ry
Asse
ssm
ent
Anch
or
Des
crip
tor
(Sub
-anc
hor)
Elig
ible
Cont
ent
Focus
Points Items
Equating Block (EB)
Appendix C: 2012 PSSA-M Tally Sheets
2012 PSSA-M Technical Report C-38

MC OE MC OE MC OE Total MC OE MC OE MC OE Total
1 1 1
Identify in fiction and literary nonfiction character (narrator/ speaker/subject of a biography), setting, plot
5 3 5 3 8 5 1 5 1 6
1 2 1 Connections between texts
5 3 5 3 8 5 1 5 1 6
2 1 1Identify examples of personification
1 1 1 1 1 1
2 1 2 Identify examples of similes 2 2 2 2 2 22 1 3 Identify examples of alliteration 1 1 1 1 1 1
4 4 4 4 4 4
3 1 1 Identify fact/opinion3 2 1 Identify exaggeration (bias)
3 3 1
Identify text organization (sequence, question/answer, comparison/contrast, cause/effect, problem/solution)
3 3 2Use headings to locate information or identify content that fits into a specific section
2 2 2 2 2 2
3 3 3Interpret and make connections between graphics/charts/texts
3 3 4Sequence of steps in a list of directions
2 2 2 2 2 2
11 3 11 3 14 11 1 11 1 12
Total For Assessment Anchor B.1Understand components within and between texts.
Total For Assessment Anchor B.2Understand literary devices in fictional and nonfictional text.
Total For Assessment Anchor B.3Understand concepts and organization of nonfictional text.
Focus
Points
Equating Block (EB)
Total For Reporting Category B
B:
Inte
rpre
tati
on a
nd
An
alys
is o
f Fi
ctio
nal
an
d N
onfi
ctio
nal
Tex
t
Items
StudentScores
(CorePoints)
Total Points
(Core &EB)
Number of Items
Core EBRep
ortin
gCa
tego
ry
Asse
ssm
ent
Anch
or
Des
crip
tor
(Sub
-anc
hor)
Elig
ible
Cont
ent Total Number
of Items
(Core &EB)
Grade 04 Reading
Appendix C: 2012 PSSA-M Tally Sheets
2012 PSSA-M Technical Report C-39

MC OE MC OE MC OE Total MC OE MC OE MC OE Total
1 1 1 Identify meaning of multiple-meaning words
1 1 2 Identify synonym/antonym 1 1 1 1 1 1
1 2 1 Identify meaning of word with an affix/how meaning changes
1 1 1 1 1 1
1 2 2 Define words from context clues 1 1 1 1 1 1
1 3 1 Make inferences/draw conclusions 4 4 4 4 4 4
1 3 2 Cite evidence from text to support generalizations
1 4 1 Identify and/or interpret main ideas/relevant details
2 2 2 2 2 2
1 5 1 Summarize key details and events of a text as a whole
1 6 1 Identify author's purpose for writing text
2 2 2 2 2 2
1 6 2Identify text that supports the author's intended purpose
11 11 11 11 11 11
2 1 1Identify meaning of multiple-meaning words
2 1 2 Identify meaning of content-specific words
1 1 1 1 1 1
2 2 1 Identify meaning of word with an affix/how meaning changes
1 1 1 1 1 1
2 2 2 Define words from context clues
2 3 1 Make inferences/draw conclusions 2 2 2 2 2 2
2 3 2 Cite evidence from text to support generalizations
2 4 1 Identify and/or interpret main ideas/relevant details
5 3 5 3 8 5 1 5 1 6
2 5 1Summarize major points/processes/events of a text as a whole
2 6 1 Identify author's purpose for writing text
1 1 1 1 1 1
2 6 2Identify text that supports the author's intended purpose
10 3 10 3 13 10 1 10 1 11
21 3 21 3 24 21 1 21 1 22
Total For Assessment Anchor A.2Understand nonfiction appropriate to grade level.
Total For Reporting Category A
A:
Com
preh
ensi
on a
nd
Rea
din
g Sk
ills
Total For Assessment Anchor A.1Understand fiction appropriate to grade level.
Number of Items
Core EB
Total Numberof Items
(Core &EB)
StudentScores
(CorePoints)
Total Points
(Core &EB)
Grade 05 ReadingRep
ortin
gCa
tego
ry
Asse
ssm
ent
Anch
or
Des
crip
tor
(Sub
-anc
hor)
Elig
ible
Cont
ent
Focus
Points Items
Equating Block (EB)
Appendix C: 2012 PSSA-M Tally Sheets
2012 PSSA-M Technical Report C-40

MC OE MC OE MC OE Total MC OE MC OE MC OE Total
1 1 1
Identify in fiction and literary nonfiction character (narrator/ speaker/subject of a biography), setting, plot, theme
4 3 4 3 7 4 1 4 1 5
1 2 1 Connections between texts
4 3 4 3 7 4 1 4 1 5
2 1 1Identify examples of personification
2 1 2 Identify examples of similes 2 2 2 2 2 2
2 1 3 Identify/interpret examples of alliteration
2 1 4 Identify/interpret examples of metaphors
1 1 1 1 1 1
2 2 1 Identify point of view of the narrator as first or third person
1 1 1 1 1 1
2 2 2Describe the effectiveness of the point of view used by the author
4 4 4 4 4 4
3 1 1 Identify fact/opinion 1 1 1 1 1 13 2 1 Identify exaggeration (bias)
3 3 1
Identify text organization (sequence, question/answer, comparison/contrast, cause/effect, problem/solution)
3 3 2Use headings to locate information or identify content that fits into a specific section
3 3 3Interpret and make connections between graphics/charts/texts
3 3 4Sequence of steps in a list of directions
1 1 1 1 1 1
9 3 9 3 12 9 1 9 1 10
Total For Assessment Anchor B.1Understand components within and between texts.
Total For Assessment Anchor B.2Understand literary devices in fictional and nonfictional text.
Total For Assessment Anchor B.3Understand concepts and organization of nonfictional text.
Focus
Points
Equating Block (EB)
Total For Reporting Category B
B:
Inte
rpre
tati
on a
nd
An
alys
is o
f Fi
ctio
nal
an
d N
onfi
ctio
nal
Tex
t
Items
StudentScores
(CorePoints)
Total Points
(Core &EB)
Number of Items
Core EBRep
ortin
gCa
tego
ry
Asse
ssm
ent
Anch
or
Des
crip
tor
(Sub
-anc
hor)
Elig
ible
Cont
ent Total Number
of Items
(Core &EB)
Grade 05 Reading
Appendix C: 2012 PSSA-M Tally Sheets
2012 PSSA-M Technical Report C-41

MC OE MC OE MC OE Total MC OE MC OE MC OE Total
1 1 1 Apply meaning of multiple-meaning words in text
1 1 2 Identify synonym/antonym 1 1 1 1 1 1
1 2 1 Identify meaning of word with an affix/how meaning changes
2 2 2 2 2 2
1 2 2 Define words from context clues 1 1 1 1 1 1
1 3 1 Make inferences/draw conclusions 1 1 1 1 1 1
1 3 2 Cite evidence from text to support generalizations
1 4 1 Identify and/or interpret main ideas/relevant details
1 1 1 1 1 1
1 5 1 Summarize key details and events of a text as a whole
1 6 1 Identify author's purpose for writing text
1 6 2Identify text that supports the author's intended purpose
6 6 6 6 6 6
2 1 1Apply meaning of multiple-meaning words in text
2 1 2 Identify meaning of content-specific words
2 2 1 Identify meaning of word with an affix/how meaning changes
2 2 2 Define words from context clues 3 3 3 3 3 3
2 3 1 Make inferences/draw conclusions 1 1 1 1 1 1
2 3 2 Cite evidence from text to support generalizations
1 1 1 1 1 1
2 4 1 Identify and/or interpret main ideas/relevant details
7 3 7 3 10 7 1 7 1 8
2 5 1Summarize major points/processes/events of a text as a whole
2 6 1 Identify author's purpose for writing text
1 1 1 1 1 1
2 6 2Identify text that supports the author's intended purpose
13 3 13 3 16 13 1 13 1 14
19 3 19 3 22 19 1 19 1 20
Total For Assessment Anchor A.2Understand nonfiction appropriate to grade level.
Total For Reporting Category A
A:
Com
preh
ensi
on a
nd
Rea
din
g Sk
ills
Total For Assessment Anchor A.1Understand fiction appropriate to grade level.
Number of Items
Core EB
Total Numberof Items
(Core &EB)
StudentScores
(CorePoints)
Total Points
(Core &EB)
Grade 06 ReadingRep
ortin
gCa
tego
ry
Asse
ssm
ent
Anch
or
Des
crip
tor
(Sub
-anc
hor)
Elig
ible
Cont
ent
Focus
Points Items
Equating Block (EB)
Appendix C: 2012 PSSA-M Tally Sheets
2012 PSSA-M Technical Report C-42

MC OE MC OE MC OE Total MC OE MC OE MC OE Total
1 1 1
Identify in fiction and literary nonfiction character (narrator/ speaker/subject of a biography), setting, plot, theme
3 3 3 3 6 3 1 3 1 4
1 2 1 Connections between texts 1 1 1 1 1 1
4 3 4 3 7 4 1 4 1 5
2 1 1Identify examples of personification
2 1 2 Identify examples of similes 2 2 2 2 2 2
2 1 3 Identify/interpret examples of alliteration
1 1 1 1 1 1
2 1 4 Identify/interpret examples of metaphors
2 2 1 Identify point of view of the narrator as first or third person
2 2 2Describe the effectiveness of the point of view used by the author
3 3 3 3 3 3
3 1 1 Identify fact/opinion 2 2 2 2 2 23 2 1 Identify exaggeration (bias) 1 1 1 1 1 1
3 3 1
Identify text organization (sequence, question/answer, comparison/contrast, cause/effect, problem/solution)
1 1 1 1 1 1
3 3 2Use headings to locate information or identify content that fits into a specific section
3 3 3Interpret and make connections between graphics/charts/texts
3 3 4Sequence of steps in a list of directions
4 4 4 4 4 4
11 3 11 3 14 11 1 11 1 12
Total For Assessment Anchor B.1Understand components within and between texts.
Total For Assessment Anchor B.2Understand literary devices in fictional and nonfictional text.
Total For Assessment Anchor B.3Understand concepts and organization of nonfictional text.
Focus
Points
Equating Block (EB)
Total For Reporting Category B
B:
Inte
rpre
tati
on a
nd
An
alys
is o
f Fi
ctio
nal
an
d N
onfi
ctio
nal
Tex
t
Items
StudentScores
(CorePoints)
Total Points
(Core &EB)
Number of Items
Core EBRep
ortin
gCa
tego
ry
Asse
ssm
ent
Anch
or
Des
crip
tor
(Sub
-anc
hor)
Elig
ible
Cont
ent Total Number
of Items
(Core &EB)
Grade 06 Reading
Appendix C: 2012 PSSA-M Tally Sheets
2012 PSSA-M Technical Report C-43

MC OE MC OE MC OE Total MC OE MC OE MC OE Total
1 1 1 Apply meaning of multiple-meaning words in text
1 1 1 1 1 1
1 1 2 Identify synonym/antonym
1 2 1 Identify meaning of word with an affix/how meaning changes
1 1 1 1 1 1
1 2 2 Define words from context clues
1 3 1 Make inferences/draw conclusions 4 4 4 4 4 4
1 3 2 Cite evidence from text to support generalizations
1 4 1 Identify and/or interpret main ideas/relevant details
2 2 2 2 2 2
1 5 1 Summarize key details and events of a text as a whole
1 6 1 Identify author's purpose for writing text
1 6 2Identify text that supports the author's intended purpose
8 8 8 8 8 8
2 1 1Apply meaning of multiple-meaning words in text
2 1 2 Identify meaning of content-specific words
2 2 1 Identify meaning of word with an affix/how meaning changes
2 2 2 Define words from context clues
2 3 1 Make inferences/draw conclusions 2 3 2 3 5 2 1 2 1 3
2 3 2 Cite evidence from text to support generalizations
2 4 1 Identify and/or interpret main ideas/relevant details
5 5 5 5 5 5
2 5 1Summarize major points/processes/events of a text as a whole
2 6 1 Identify author's purpose for writing text
1 1 1 1 1 1
2 6 2Identify text that supports the author's intended purpose
8 3 8 3 11 8 1 8 1 9
16 3 16 3 19 16 1 16 1 17
Total For Assessment Anchor A.2Understand nonfiction appropriate to grade level.
Total For Reporting Category A
A:
Com
preh
ensi
on a
nd
Rea
din
g Sk
ills
Total For Assessment Anchor A.1Understand fiction appropriate to grade level.
Number of Items
Core EB
Total Numberof Items
(Core &EB)
StudentScores
(CorePoints)
Total Points
(Core &EB)
Grade 07 ReadingRep
ortin
gCa
tego
ry
Asse
ssm
ent
Anch
or
Des
crip
tor
(Sub
-anc
hor)
Elig
ible
Cont
ent
Focus
Points Items
Equating Block (EB)
Appendix C: 2012 PSSA-M Tally Sheets
2012 PSSA-M Technical Report C-44

MC OE MC OE MC OE Total MC OE MC OE MC OE Total
1 1 1
Identify in fiction and literary nonfiction character (narrator/ speaker/subject of a biography), setting, plot, theme
11 3 11 3 14 11 1 11 1 12
1 2 1 Connections between texts
11 3 11 3 14 11 1 11 1 12
2 1 1Interpret/analyze examples of personification, simile, alliteration, metaphor, hyperbole, and imagery
1 1 1 1 1 1
2 1 2Identify author's purpose/effectiveness of figurative language
1 1 1 1 1 1
2 2 1 Identify point of view of the narrator as first or third person
2 2 2Describe the effectiveness of the point of view used by the author
2 2 2 2 2 2
3 1 1Use of facts and opinions to make a point/construct an argument
3 2 1 Identify bias/propaganda techniques
3 3 1
Analyze text organization (sequence, question/answer, comparison/contrast, cause/effect, problem/solution)
3 3 2 Identify content that fits into a specific section
3 3 3Interpret and make connections between graphics/charts/texts
1 1 1 1 1 1
3 3 4Sequence of steps in a list of directions
1 1 1 1 1 1
14 3 14 3 17 14 1 14 1 15
Total For Assessment Anchor B.1Understand components within and between texts.
Total For Assessment Anchor B.2Understand literary devices in fictional and nonfictional text.
Total For Assessment Anchor B.3Understand concepts and organization of nonfictional text.
Focus
Points
Equating Block (EB)
Total For Reporting Category B
B:
Inte
rpre
tati
on a
nd
An
alys
is o
f Fi
ctio
nal
an
d N
onfi
ctio
nal
Tex
t
Items
StudentScores
(CorePoints)
Total Points
(Core &EB)
Number of Items
Core EBRep
ortin
gCa
tego
ry
Asse
ssm
ent
Anch
or
Des
crip
tor
(Sub
-anc
hor)
Elig
ible
Cont
ent Total Number
of Items
(Core &EB)
Grade 07 Reading
Appendix C: 2012 PSSA-M Tally Sheets
2012 PSSA-M Technical Report C-45

MC OE MC OE MC OE Total MC OE MC OE MC OE Total
1 1 1 Apply meaning of multiple-meaning words in text
1 1 1 1 1 1
1 1 2 Identify synonym/antonym 1 1 1 1 1 1
1 2 1 Identify meaning of word with an affix/how meaning changes
1 2 2 Define words from context clues
1 3 1 Make inferences/draw conclusions 3 3 3 3 3 3
1 3 2 Cite evidence from text to support generalizations
1 4 1 Identify and/or interpret main ideas/relevant details
1 1 1 1 1 1
1 5 1 Summarize key details and events of a text as a whole
3 3 3 1 1 1
1 6 1 Identify author's purpose for writing text
1 6 2Identify text that supports the author's intended purpose
6 3 6 3 9 6 1 6 1 7
2 1 1Apply meaning of multiple-meaning words in text
2 1 2 Identify meaning of content-specific words
1 1 1 1 1 1
2 2 1 Identify meaning of word with an affix/how meaning changes
1 1 1 1 1 1
2 2 2 Define words from context clues 1 1 1 1 1 1
2 3 1 Make inferences/draw conclusions 1 1 1 1 1 1
2 3 2 Cite evidence from text to support generalizations
1 1 1 1 1 1
2 4 1 Identify and/or interpret main ideas/relevant details
2 3 2 3 5 2 1 2 1 3
2 5 1Summarize major points/processes/events of a text as a whole
2 6 1 Identify author's purpose for writing text
2 2 2 2 2 2
2 6 2Identify text that supports the author's intended purpose
9 3 9 3 12 9 1 9 1 10
15 6 15 6 21 15 2 15 2 17
Total For Assessment Anchor A.2Understand nonfiction appropriate to grade level.
Total For Reporting Category A
A:
Com
preh
ensi
on a
nd
Rea
din
g Sk
ills
Total For Assessment Anchor A.1Understand fiction appropriate to grade level.
Number of Items
Core EB
Total Numberof Items
(Core &EB)
StudentScores
(CorePoints)
Total Points
(Core &EB)
Grade 08 ReadingRep
ortin
gCa
tego
ry
Asse
ssm
ent
Anch
or
Des
crip
tor
(Sub
-anc
hor)
Elig
ible
Cont
ent
Focus
Points Items
Equating Block (EB)
Appendix C: 2012 PSSA-M Tally Sheets
2012 PSSA-M Technical Report C-46

MC OE MC OE MC OE Total MC OE MC OE MC OE Total
1 1 1
Identify in fiction and literary nonfiction character (narrator/ speaker/subject of a biography), setting, plot, theme
3 3 3 3 3 3
1 2 1 Connections between texts 2 2 2 2 2 2
5 5 5 5 5 5
2 1 1Interpret/analyze examples of personification, simile, metaphor, hyperbole, and imagery
2 2 2 2 2 2
2 1 2Identify author's purpose/effectiveness of figurative language
2 2 2 2 2 2
2 2 1 Identify point of view of the narrator as first or third person
2 2 2Analyze the effectiveness of the point of view used by the author
4 4 4 4 4 4
3 1 1Use of facts and opinions to make a point/construct an argument
3 3 3 3 3 3
3 2 1 Identify bias/propaganda techniques
3 3 1
Analyze text organization (sequence, question/answer, comparison/contrast, cause/effect, problem/solution)
1 1 1 1 1 1
3 3 2 Identify content that fits into a specific section
2 2 2 2 2 2
3 3 3Interpret and make connections between graphics/charts/texts
3 3 4Sequence of steps in a list of directions
6 6 6 6 6 6
15 15 15 15 15 15
Total For Assessment Anchor B.1Understand components within and between texts.
Total For Assessment Anchor B.2Understand literary devices in fictional and nonfictional text.
Total For Assessment Anchor B.3Understand concepts and organization of nonfictional text.
Focus
Points
Equating Block (EB)
Total For Reporting Category B
B:
Inte
rpre
tati
on a
nd
An
alys
is o
f Fi
ctio
nal
an
d N
onfi
ctio
nal
Tex
t
Items
StudentScores
(CorePoints)
Total Points
(Core &EB)
Number of Items
Core EBRep
ortin
gCa
tego
ry
Asse
ssm
ent
Anch
or
Des
crip
tor
(Sub
-anc
hor)
Elig
ible
Cont
ent Total Number
of Items
(Core &EB)
Grade 08 Reading
Appendix C: 2012 PSSA-M Tally Sheets
2012 PSSA-M Technical Report C-47

MC OE MC OE MC OE Total MC OE MC OE MC OE Total
1 1 1 Apply meaning of multiple-meaning words in text
1 1 2 Identify synonym/antonym 1 1 1 1 1 1
1 2 1 Identify meaning of word with an affix/how meaning changes
1 2 2 Define words from context clues
1 3 1 Make inferences/draw conclusions 3 3 3 3 3 3
1 3 2 Cite evidence from text to support generalizations
1 4 1 Identify and/or interpret main ideas/relevant details
1 1 1 1 1 1
1 5 1 Summarize key details and events of a text as a whole
1 6 1 Identify author's purpose for writing text
1 6 2Identify text that supports the author's intended purpose
5 5 5 5 5 5
2 1 1Apply meaning of multiple-meaning words in text
2 1 2 Identify meaning of content-specific words
1 1 1 1 1 1
2 2 1 Identify meaning of word with an affix/how meaning changes
1 1 1 1 1 1
2 2 2 Define words from context clues 1 1 1 1 1 1
2 3 1 Make inferences/draw conclusions 3 3 3 1 1 1
2 3 2 Cite evidence from text to support generalizations
1 1 1 1 1 1
2 4 1 Identify and/or interpret main ideas/relevant details
7 7 7 7 7 7
2 5 1Summarize major points/processes/events of a text as a whole
2 6 1 Identify author's purpose for writing text
1 1 1 1 1 1
2 6 2Identify text that supports the author's intended purpose
12 3 12 3 15 12 1 12 1 13
17 3 17 3 20 17 1 17 1 18
Total For Assessment Anchor A.2Understand nonfiction appropriate to grade level.
Total For Reporting Category A
A:
Com
preh
ensi
on a
nd
Rea
din
g Sk
ills
Total For Assessment Anchor A.1Understand fiction appropriate to grade level.
Number of Items
Core EB
Total Numberof Items
(Core &EB)
StudentScores
(CorePoints)
Total Points
(Core &EB)
Grade 11 ReadingRep
ortin
gCa
tego
ry
Asse
ssm
ent
Anch
or
Des
crip
tor
(Sub
-anc
hor)
Elig
ible
Cont
ent
Focus
Points Items
Equating Block (EB)
Appendix C: 2012 PSSA-M Tally Sheets
2012 PSSA-M Technical Report C-48

MC OE MC OE MC OE Total MC OE MC OE MC OE Total
1 1 1
Identify in fiction and literary nonfiction character (narrator/ speaker/subject of a biography), setting, plot, theme, tone, style, mood, symbolism
3 3 3 3 6 3 1 3 1 4
1 2 1 Connections between texts 2 2 2 2 2 2
5 3 5 3 8 5 1 5 1 6
2 1 1
Analyze examples of personification, simile, metaphor, hyperbole, satire, imagery, foreshadowing, flashbacks, and irony
2 2 2 2 2 2
2 1 2Identify author's purpose/effectiveness of figurative language
2 2 2 2 2 2
2 2 1 Identify point of view of the narrator as first or third person
2 2 2Analyze the effectiveness of the point of view used by the author
4 4 4 4 4 4
3 1 1Use of facts and opinions to make a point/construct an argument
3 2 1 Identify bias/propaganda techniques
3 2 2 Analyze the effectiveness of bias/propaganda techniques
1 1 1 1 1 1
3 3 1Analyze the effect of text organization including use of headers
3 3 2 Analyze author's purpose for text organization and content
1 1 1 1 1 1
3 3 3 Analyze and make connections between graphics/charts/texts
1 1 1 1 1 1
3 3 4Sequence of steps in a list of directions
1 1 1 1 1 1
4 4 4 4 4 4
13 3 13 3 16 13 1 13 1 14
Total For Assessment Anchor B.1Understand components within and between texts.
Total For Assessment Anchor B.2Understand literary devices in fictional and nonfictional text.
Total For Assessment Anchor B.3Understand concepts and organization of nonfictional text.
Focus
Points
Equating Block (EB)
Total For Reporting Category B
B:
Inte
rpre
tati
on a
nd
An
alys
is o
f Fi
ctio
nal
an
d N
onfi
ctio
nal
Tex
t
Items
StudentScores
(CorePoints)
Total Points
(Core &EB)
Number of Items
Core EBRep
ortin
gCa
tego
ry
Asse
ssm
ent
Anch
or
Des
crip
tor
(Sub
-anc
hor)
Elig
ible
Cont
ent Total Number
of Items
(Core &EB)
Grade 11 Reading
Appendix C: 2012 PSSA-M Tally Sheets
2012 PSSA-M Technical Report C-49

MC OE MC OE MC OE Total MC OE MC OE MC OE Total
1 1 1
Distinguish between a scientific fact and an opinion, providing clear explanations that connect observations and results (e.g., a scientific fact can be supported by making observations).
1 1 2
Identify and describe examples of common technological changes past to present in the community (e.g., energy production, transportation, communications, agriculture, packaging materials) that have either positive or negative impacts on society or the environment.
1 3 1 Observe and record change by using time and measurement.
1 3 2 Describe relative size, distance, or motion.
1 3 3Observe and describe the change to objects caused by temperature change or light.
1 3 4
Explain what happens to a living organism when its food supply, access to water, shelter, or space is changed (e.g., it might die, migrate, change behavior, eat something else).
1 3 5
Provide examples, predict, or describe how everyday human activities (e.g., solid waste production, food production and consumption, transportation, water consumption, energy production and use) may change the environment.
2 1 1
Generate questions about objects, organisms, or events that can be answered through scientific investigations.
2 1 2Design and describe an investigation (a fair test) to test one variable.
Number of Items
Core EB
Total For Assessment Anchor A.1Reasoning and Analysis
StudentScores
(CorePoints)
Total Points
(Core &EB)
Grade 04 ScienceRep
ortin
gCa
tego
ry
Asse
ssm
ent
Anch
or
Des
crip
tor
(Sub
-anc
hor)
Elig
ible
Cont
ent
Focus
Points Items
Equating Block (EB)
Total Numberof Items
(Core &EB)
Appendix C: 2012 PSSA-M Tally Sheets
2012 PSSA-M Technical Report C-50

2 1 3
Observe a natural phenomenon (e.g., weather changes, length of daylight/night, movement of shadows, animal migrations, growth of plants), record observations, and then make a prediction based on those observations.
2 1 4State a conclusion that is consistent with the information/data.
2 2 1
Identify appropriate tools or instruments for specific tasks and describe the information they can provide (e.g., measuring: length - ruler, mass - balance scale, volume - beaker, temperature - thermometer; making observations: hand lens, binoculars, telescope).
3 1 1
Categorize systems as either natural or human-made (e.g., ballpoint pens, simple electrical circuits, plant anatomy, water cycle).
3 1 2
Explain a relationship between the living and nonliving components in a system (e.g., food web, terrarium).
3 1 3
Categorize the parts of an ecosystem as either living or nonliving and describe their roles in the system.
3 1 4
Identify the parts of the food and fiber systems as they relate to agricultural products from the source to the consumer.
3 2 1
Identify what different models represent (e.g., maps show physical features, directions, distances; globes represent Earth; drawings of watersheds depict terrain; dioramas show ecosystems; concept maps show relationships of ideas).Identify what different models represent
3 2 2
Use models to make observations to explain how systems work (e.g., water cycle, Sun-Earth-Moon system).
Total For Assessment Anchor A.2Processes, Procedures, and Tools of Scientific Investigations
A:
Nat
ure
of
Sci
ence
Appendix C: 2012 PSSA-M Tally Sheets
2012 PSSA-M Technical Report C-51
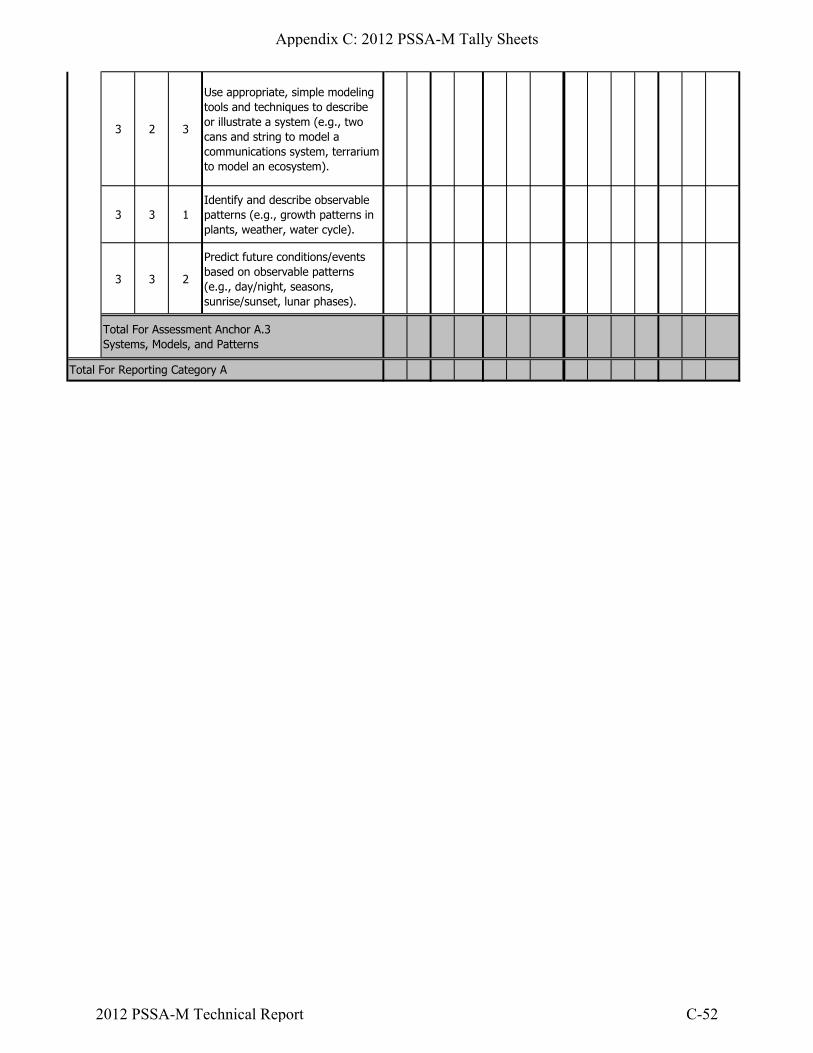
3 2 3
Use appropriate, simple modeling tools and techniques to describe or illustrate a system (e.g., two cans and string to model a communications system, terrarium to model an ecosystem).
3 3 1Identify and describe observable patterns (e.g., growth patterns in plants, weather, water cycle).
3 3 2
Predict future conditions/events based on observable patterns (e.g., day/night, seasons, sunrise/sunset, lunar phases).
Total For Assessment Anchor A.3Systems, Models, and Patterns
Total For Reporting Category A
Appendix C: 2012 PSSA-M Tally Sheets
2012 PSSA-M Technical Report C-52

MC OE MC OE MC OE Total MC OE MC OE MC OE Total
1 1 1Identify life processes of living things (e.g., growth, digestion, respiration).
1 1 2
Compare similar functions of external characteristics of organisms (e.g., anatomical characteristics: appendages, type of covering, body segments).
1 1 3Describe basic needs of plants and animals (e.g., air, water, food).
1 1 4
Describe how different parts of a living thing work together to provide what the organism needs (e.g., parts of plants: roots, stems, leaves).
1 1 5
Describe the life cycles of different organisms (e.g., moth, grasshopper, frog, seed-producing plant).
2 1 1
Identify characteristics for plant and animal survival in different environments (e.g., wetland, tundra, desert, prairie, deep ocean, forest).
2 1 2
Explain how specific adaptations can help a living organism survive (e.g., protective coloration, mimicry, leaf sizes and shapes, ability to catch or retain water).
2 2 1
Identify physical characteristics (e.g., height, hair color, eye color, attached earlobes, ability to roll tongue) that appear in both parents and could be passed on to offspring.
Total For Assessment Anchor B.1Structures and Functions of Organisms
Total For Assessment Anchor B.2Continuity of Life
Points Items
StudentScores
(CorePoints)
Equating Block (EB)
Total Numberof Items
(Core &EB)
Total Points
(Core &EB)
Number of Items
Core EBRep
ortin
gCa
tego
ry
Asse
ssm
ent
Anch
or
Des
crip
tor
(Sub
-anc
hor)
Elig
ible
Cont
ent
Focus
Grade 04 Science
Appendix C: 2012 PSSA-M Tally Sheets
2012 PSSA-M Technical Report C-53

3 1 1
Describe the living and nonliving components of a local ecosystem (e.g., lentic and lotic systems, forest, cornfield, grasslands, city park, playground).
3 1 2
Describe interactions between living and nonliving components (e.g. plants – water, soil, sunlight, carbon dioxide, temperature; animals – food, water, shelter, oxygen, temperature) of a local ecosystem.
3 2 1Describe what happens to a living thing when its habitat is changed.
3 2 2
Describe and predict how changes in the environment (e.g., fire, pollution, flood, building dams) can affect systems.
3 2 3
Explain and predict how changes in seasons affect plants, animals, or daily human life (e.g., food availability, shelter, mobility).
3 3 1
Identify everyday human activities (e.g., driving, washing, eating, manufacturing, farming) within a community that depend on the natural environment.
3 3 2
Describe the human dependence on the food and fiber systems from production to consumption (e.g., food, clothing, shelter, products).
3 3 3
Identify biological pests (e.g., fungi – molds, plants – foxtail, purple loosestrife, Eurasian water milfoil; animals – aphides, ticks, zebra mussels, starlings, mice) that compete with humans for resources
3 3 4
Identify major land uses in the urban, suburban and rural communities (e.g., housing, commercial, recreation).
3 3 5Describe the effects of pollution (e.g., litter) in the community.
Total For Assessment Anchor B.3Ecological Behavior and Systems
Total For Reporting Category B
B:
Bio
logi
cal S
cien
ces
Appendix C: 2012 PSSA-M Tally Sheets
2012 PSSA-M Technical Report C-54

MC OE MC OE MC OE Total MC OE MC OE MC OE Total
1 1 1
Use physical properties [e.g., mass, shape, size, volume, color, texture, magnetism, state to describe matter.
1 1 2Categorize/group objects using physical characteristics.
2 1 1Identify energy forms, energy transfer, and energy examples (e.g., light, heat, electrical).
2 1 2
Describe the flow of energy through an object or system (e.g., feeling radiant heat from a light bulb, eating food to get energy, using a battery to light a bulb or run a fan).
2 1 3
Recognize or illustrate simple direct current series and parallel circuits composed of batteries, light bulbs (or other common loads), wire, and on/off switches.
2 1 4Identify characteristics of sound (e.g., pitch, loudness, reflection).
3 1 1Describe changes in motion caused by forces (e.g., magnetic, pushes or pulls, gravity, friction).
3 1 2
Compare the relative movement of objects or describe types of motion that are evident (e.g., bouncing ball, moving in a straight line, back and forth, merry-go-round).
3 1 3
Describe the position of an object by locating it relative to another object or a stationary background (e.g., geographic direction, left, up).
Number of Items
Core EB
Total For Assessment Anchor C.2Forms, Sources, Conversions, and Transer of Energy
Total For Assessment Anchor C.3Principles of Motion and Force
Total For Reporting Category C
C:
Ph
ysic
al S
cien
ces
Total For Assessment Anchor C.1Structures, Properties, and Interaction of Matter and Energy
StudentScores
(CorePoints)
Total Points
(Core &EB)
Grade 04 ScienceRep
ortin
gCa
tego
ry
Asse
ssm
ent
Anch
or
Des
crip
tor
(Sub
-anc
hor)
Elig
ible
Cont
ent
Focus
Points Items
Equating Block (EB)
Total Numberof Items
(Core &EB)
Appendix C: 2012 PSSA-M Tally Sheets
2012 PSSA-M Technical Report C-55

MC OE MC OE MC OE Total MC OE MC OE MC OE Total
1 1 1
Describe how prominent Earth features in Pennsylvania (e.g., mountains, valleys, caves, sinkholes, lakes, rivers) were formed.
1 1 2
Identify various Earth structures (e.g., mountains, watersheds, peninsulas, lakes, rivers, valleys) through the use of models.
1 1 3Describe the composition of soil as weathered rock and decomposed organic remains.
1 2 1
Identify products and by-products of plants and animals for human use (e.g., food, clothing, building materials, paper products).
1 2 2
Identify the types and uses of Earth materials for renewable, nonrenewable, and reusable products (e.g., human-made products: concrete, paper, plastics, fabrics).
1 2 3
Recognize ways that humans benefit from the use of water resources (e.g., agriculture, energy, recreation).
1 3 1Describe types of freshwater and saltwater bodies (e.g., lakes, rivers, wetlands, oceans).
1 3 2
Explain how water goes through phase changes (i.e., evaporation, condensation, freezing, and melting).
1 3 3
Describe or compare lentic systems (i.e., ponds, lakes, and bays) and lotic systems (i.e., streams, creeks, and rivers).
1 3 4
Explain the role and relationship of a watershed or a wetland on water sources (e.g., water storage, groundwater recharge, water filtration, water source, water cycle).
Total For Assessment Anchor D.1Earth Features and Processes that Change Earth and its Resources
D:
Eart
h a
nd
Spa
ce S
cien
ces
Points Items
StudentScores
(CorePoints)
Equating Block (EB)
Total Numberof Items
(Core &EB)
Total Points
(Core &EB)
Number of Items
Core EBRep
ortin
gCa
tego
ry
Asse
ssm
ent
Anch
or
Des
crip
tor
(Sub
-anc
hor)
Elig
ible
Cont
ent
Focus
Grade 04 Science
Appendix C: 2012 PSSA-M Tally Sheets
2012 PSSA-M Technical Report C-56
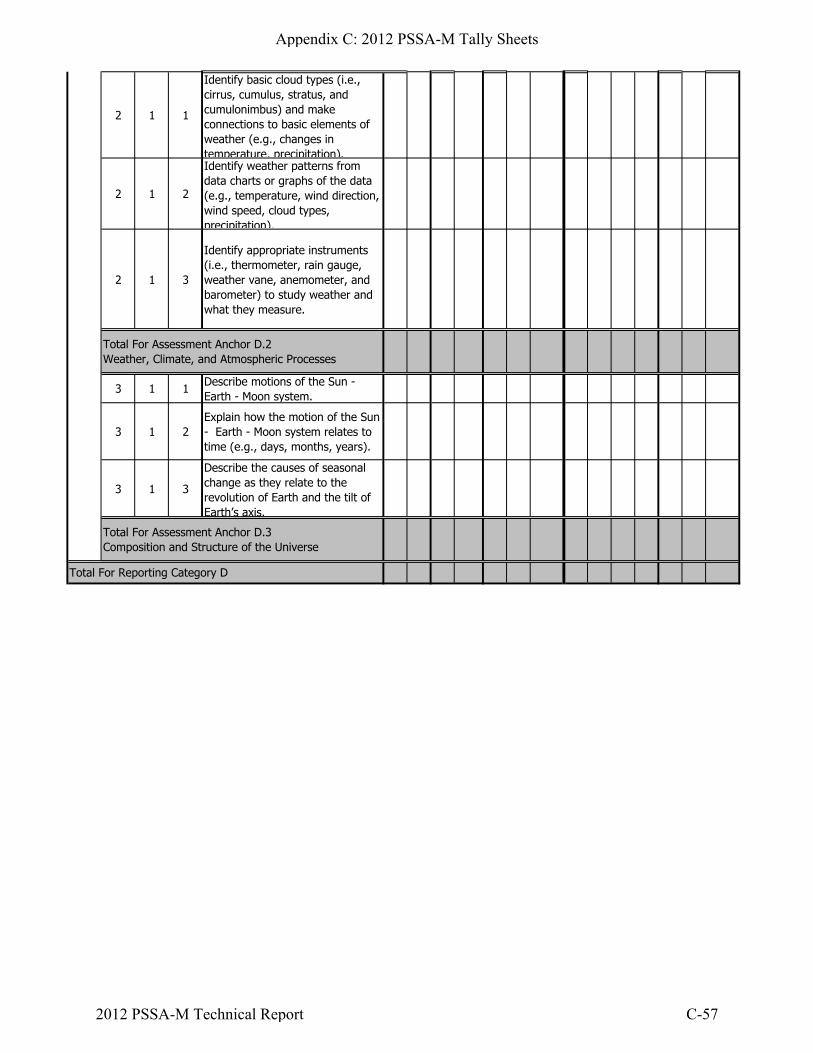
2 1 1
Identify basic cloud types (i.e., cirrus, cumulus, stratus, and cumulonimbus) and make connections to basic elements of weather (e.g., changes in temperature, precipitation).
2 1 2
Identify weather patterns from data charts or graphs of the data (e.g., temperature, wind direction, wind speed, cloud types, precipitation).
2 1 3
Identify appropriate instruments (i.e., thermometer, rain gauge, weather vane, anemometer, and barometer) to study weather and what they measure.
3 1 1Describe motions of the Sun - Earth - Moon system.
3 1 2Explain how the motion of the Sun - Earth - Moon system relates to time (e.g., days, months, years).
3 1 3
Describe the causes of seasonal change as they relate to the revolution of Earth and the tilt of Earth’s axis.
Total For Assessment Anchor D.2Weather, Climate, and Atmospheric Processes
Total For Assessment Anchor D.3Composition and Structure of the Universe
Total For Reporting Category D
Appendix C: 2012 PSSA-M Tally Sheets
2012 PSSA-M Technical Report C-57

MC OE MC OE MC OE Total MC OE MC OE MC OE Total
1 1 1
Distinguish between a scientific theory and an opinion, explaining how a theory is supported with evidence, or how new data/information may change existing theories and practices
1 1 2
Explain how certain questions can be answered through scientific inquiry and/or technological design.
1 1 1 1 1 1
1 1 3
Use evidence, such as observations or experimental results, to support inferences about a relationship.
1 1 4Develop descriptions, explanations, predictions, and models using evidence.
1 1 1 1 1 1
1 2 1
Describe the positive and negative, intended and unintended, effects of specific scientific results or technological developments (e.g., air/space travel, genetic engineering, nuclear fission/fusion, artificial intelligence, lasers, organ transplants).
1 2 2
Identify environmental issues and explain their potential long-term health effects (e.g., pollution, pest controls, vaccinations).
1 1 1 1 1 1
1 2 3
Describe fundamental scientific or technological concepts that could solve practical problems (e.g., Newton’s laws of motion, Mendelian genetics).
1 1 1 1 1 1
1 2 4
Explain society’s standard of living in terms of technological advancements and how these advancements impact on agriculture (e.g., transportation, processing, production, storage).
1 3 1
Use ratio to describe change (e.g., percents, parts per million, grams per cubic centimeter, mechanical advantage).
Number of Items
Core EB
StudentScores
(CorePoints)
Total Points
(Core &EB)
Grade 08 ScienceRep
ortin
gCa
tego
ry
Asse
ssm
ent
Anch
or
Des
crip
tor
(Sub
-anc
hor)
Elig
ible
Cont
ent
Focus
Points Items
Equating Block (EB)
Total Numberof Items
(Core &EB)
Appendix C: 2012 PSSA-M Tally Sheets
2012 PSSA-M Technical Report C-58

1 3 2
Use evidence, observations, or explanations to make inferences about change in systems over time (e.g., carrying capacity, succession, population dynamics, loss of mass in chemical reactions, indicator fossils in geologic time scale) and the variables affecting these changes.
1 1 1 1 1 1
1 3 3
Examine systems changing over time, identifying the possible variables causing this change, and drawing inferences about how these variables affect this change.
1 1 1 1 1 1
1 3 4
Given a scenario, explain how a dynamically changing environment provides for the sustainability of living systems.
1 1 1 1 1 1
7 7 7 7 7 7
2 1 1
Use evidence, observations, or a variety of scales (e.g., mass, distance, volume, temperature) to describe relationships.
2 1 2
Use space/time relationships, define concepts operationally, raise testable questions, or formulate hypotheses.
1 1 1 1 1 1
2 1 3
Design a controlled experiment by specifying how the independent variables will be manipulated, how the dependent variable will be measured, and which variables will be held constant.
2 1 4
Interpret data/observations; develop relationships among variables based on data/observations to design models as solutions.
2 1 5Use evidence from investigations to clearly communicate and support conclusions.
2 1 6 Identify a design flaw in a simple technological system and devise possible working solutions.
2 2 1
Describe the appropriate use of instruments and scales to accurately and safely measure time, mass, distance, volume, or temperature under a variety of conditions.
2 2 2 2 2 2
A:
Nat
ure
of
Sci
ence
Total For Assessment Anchor A.1Reasoning and Analysis
Appendix C: 2012 PSSA-M Tally Sheets
2012 PSSA-M Technical Report C-59

2 2 2
Apply appropriate measurement systems (e.g., time, mass, distance, volume, temperature) to record and interpret observations under varying conditions.
1 1 1 1 1 1
2 2 3
Describe ways technology (e.g., microscope, telescope, micrometer, hydraulics, barometer) extends and enhances human abilities for specific purposes.
4 4 4 4 4 4
3 1 1
Describe a system (e.g., watershed, circulatory system, heating system, agricultural system) as a group of related parts with specific roles that work together to achieve an observed result.
3 1 2
Explain the concept of order in a system [e.g., (first to last: manufacturing steps, trophic levels); (simple to complex: cell, tissue, organ, organ system)].
2 2 2 2 2 2
3 1 3
Distinguish between system inputs, system processes, system outputs, and feedback (e.g., physical, ecological, biological, informational).
1 1 1 1 1 1
3 1 4
Distinguish between open loop (e.g., energy flow, food web) and closed loop (e.g., materials in the nitrogen and carbon cycles, closed-switch) systems.
3 1 5
Explain how components of natural and human-made systems play different roles in a working system.
3 2 1
Describe how scientists use models to explore relationships in natural systems (e.g., an ecosystem, river system, the solar system).
3 2 2
Describe how engineers use models to develop new and improved technologies to solve problems.
3 2 3
Given a model showing simple cause- and-effect relationships in a natural system, predict results that can be used to test the assumptions in the model (e.g., photosynthesis, water cycle, diffusion, infiltration).
Total For Assessment Anchor A.2Processes, Procedures, and Tools of Scientific Investigations
Appendix C: 2012 PSSA-M Tally Sheets
2012 PSSA-M Technical Report C-60
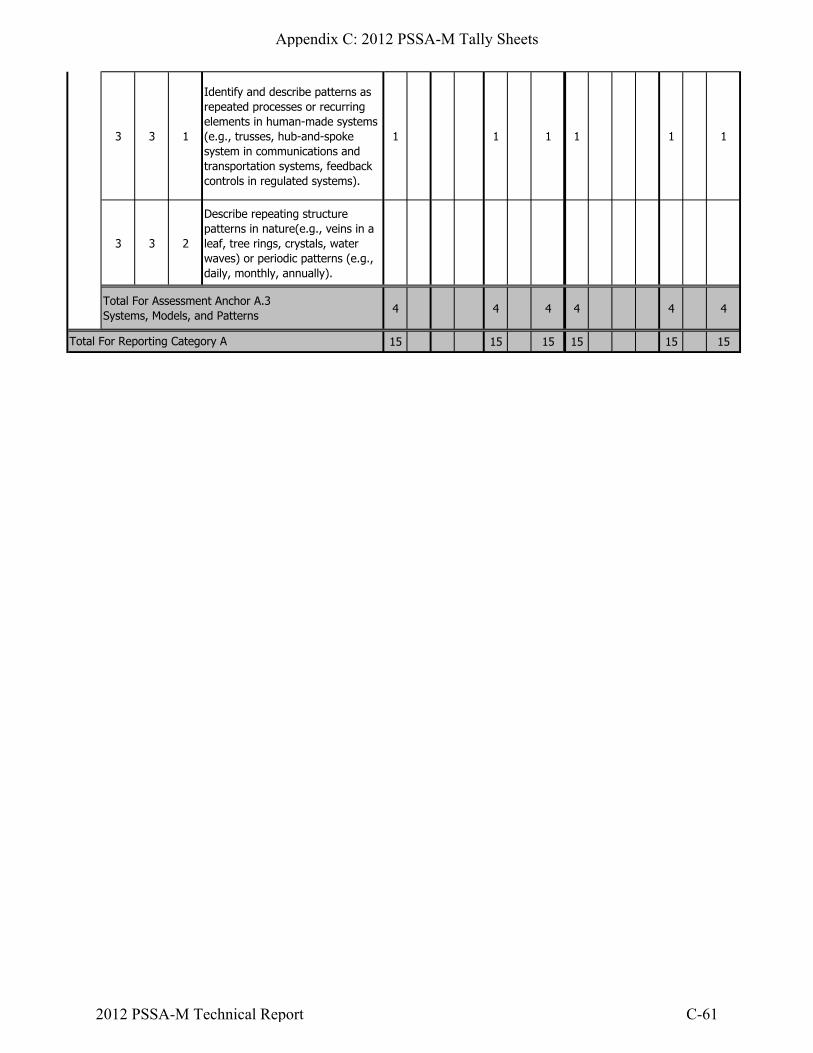
3 3 1
Identify and describe patterns as repeated processes or recurring elements in human-made systems (e.g., trusses, hub-and-spoke system in communications and transportation systems, feedback controls in regulated systems).
1 1 1 1 1 1
3 3 2
Describe repeating structure patterns in nature(e.g., veins in a leaf, tree rings, crystals, water waves) or periodic patterns (e.g., daily, monthly, annually).
4 4 4 4 4 4
15 15 15 15 15 15
Total For Assessment Anchor A.3Systems, Models, and Patterns
Total For Reporting Category A
Appendix C: 2012 PSSA-M Tally Sheets
2012 PSSA-M Technical Report C-61

MC OE MC OE MC OE Total MC OE MC OE MC OE Total
1 1 1
Describe the structures of living things that help them function effectively in specific ways (e.g., adaptations, characteristics).
1 1 2
Compare similarities and differences in internal structures of organisms (e.g., invertebrate/vertebrate, vascular/nonvascular, single-celled/multi-celled) and external structures (e.g., appendages, body segments, type of covering, size shape)
1 1 1 1 1 1
1 1 3
Apply knowledge of characteristic structures to identify or categorize organisms (i.e., plants, animals, fungi, bacteria, and protista).
1 1 4
Identify the levels of organization from cell to organism and describe how specific structures (parts), which underlie larger systems, enable the system to function as a whole.
1 1 1 1 1 1
2 2 2 2 2 2
2 1 1
Explain how inherited structures or behaviors help organisms survive and reproduce in different environments.
2 1 2
Explain how different adaptations in individuals of the same species may affect survivability or reproduction success.
2 1 3Explain that mutations can alter a gene and are the original source of new variations.
2 1 4Describe how selective breeding or biotechnology can change the genetic makeup of organisms.
1 1 1 1 1 1
2 1 5
Explain that adaptations are developed over long periods of time and are passed from one generation to another
Total For Assessment Anchor B.1Structures and Functions of Organisms
Points Items
StudentScores
(CorePoints)
Equating Block (EB)
Total Numberof Items
(Core &EB)
Total Points
(Core &EB)
Number of Items
Core EBRep
ortin
gCa
tego
ry
Asse
ssm
ent
Anch
or
Des
crip
tor
(Sub
-anc
hor)
Elig
ible
Cont
ent
Focus
Grade 08 Science
Appendix C: 2012 PSSA-M Tally Sheets
2012 PSSA-M Technical Report C-62

2 2 1Identify and explain differences between inherited and acquired traits.
1 1 1 1 1 1
2 2 2
Recognize that the gene is the basic unit of inheritance, that there are dominant and recessive genes, and that traits are inherited.
2 2 2 2 2 2
3 1 1Explain the flow of energy through an ecosystem (e.g., food chains, food webs).
3 1 2
Identify major biomes and describe abiotic and biotic components (e.g., abiotic: different soil types, air, water sunlight; biotic: soil microbes, decomposers).
3 1 3
Explain relationships among organisms (e.g., producers/consumers, predator/prey) in an ecosystem.
1 1 1 1 1 1
3 2 1
Use evidence to explain factors that affect changes in populations (e.g., deforestation, disease, land use, natural disaster, invasive species).
3 2 2Use evidence to explain how diversity affects the ecological integrity of natural systems
3 2 3
Describe the response of organisms to environmental changes (e.g., changes in climate, hibernation, migration, coloration) and how those changes affect survival.
3 3 1Explain how human activities may affect local, regional, and global environments.
3 3 2
Explain how renewable and nonrenewable resources provide for human needs (i.e., energy, food, water, clothing, and shelter).
3 3 3
Describe how waste management affects the environment (e.g., recycling, composting, landfills, incineration, sewage treatment).
Total For Assessment Anchor B.2Continuity of Life
B:
Bio
logi
cal S
cien
ces
Appendix C: 2012 PSSA-M Tally Sheets
2012 PSSA-M Technical Report C-63

3 3 4
Explain the long-term effects of using integrated pest management (e.g., herbicides, natural predators, biogenetics) on the environment.
1 1 1 1 1 1
5 5 5 5 5 5
Total For Assessment Anchor B.3Ecological Behavior and Systems
Total For Reporting Category B
Appendix C: 2012 PSSA-M Tally Sheets
2012 PSSA-M Technical Report C-64
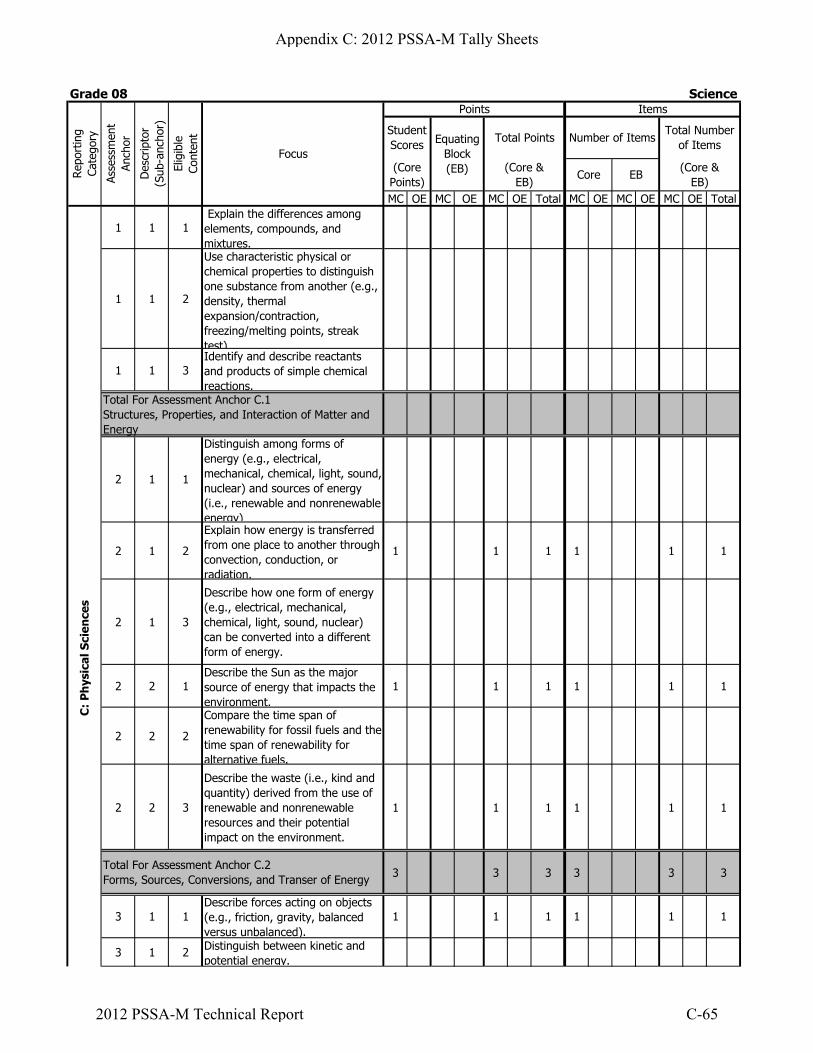
MC OE MC OE MC OE Total MC OE MC OE MC OE Total
1 1 1 Explain the differences among elements, compounds, and mixtures.
1 1 2
Use characteristic physical or chemical properties to distinguish one substance from another (e.g., density, thermal expansion/contraction, freezing/melting points, streak test)
1 1 3Identify and describe reactants and products of simple chemical reactions.
2 1 1
Distinguish among forms of energy (e.g., electrical, mechanical, chemical, light, sound, nuclear) and sources of energy (i.e., renewable and nonrenewable energy)
2 1 2
Explain how energy is transferred from one place to another through convection, conduction, or radiation.
1 1 1 1 1 1
2 1 3
Describe how one form of energy (e.g., electrical, mechanical, chemical, light, sound, nuclear) can be converted into a different form of energy.
2 2 1Describe the Sun as the major source of energy that impacts the environment.
1 1 1 1 1 1
2 2 2
Compare the time span of renewability for fossil fuels and the time span of renewability for alternative fuels.
2 2 3
Describe the waste (i.e., kind and quantity) derived from the use of renewable and nonrenewable resources and their potential impact on the environment.
1 1 1 1 1 1
3 3 3 3 3 3
3 1 1Describe forces acting on objects (e.g., friction, gravity, balanced versus unbalanced).
1 1 1 1 1 1
3 1 2 Distinguish between kinetic and potential energy.
Number of Items
Core EB
Total For Assessment Anchor C.2Forms, Sources, Conversions, and Transer of Energy
C:
Ph
ysic
al S
cien
ces
Total For Assessment Anchor C.1Structures, Properties, and Interaction of Matter and Energy
StudentScores
(CorePoints)
Total Points
(Core &EB)
Grade 08 ScienceRep
ortin
gCa
tego
ry
Asse
ssm
ent
Anch
or
Des
crip
tor
(Sub
-anc
hor)
Elig
ible
Cont
ent
Focus
Points Items
Equating Block (EB)
Total Numberof Items
(Core &EB)
Appendix C: 2012 PSSA-M Tally Sheets
2012 PSSA-M Technical Report C-65

3 1 3
Explain that mechanical advantage helps to do work (physics) by either changing a force or changing the direction of the applied force (e.g., simple machines, hydraulic systems).
1 1 1 1 1 1
2 2 2 2 2 2
5 5 5 5 5 5
Total For Assessment Anchor C.3Principles of Motion and Force
Total For Reporting Category C
Appendix C: 2012 PSSA-M Tally Sheets
2012 PSSA-M Technical Report C-66

MC OE MC OE MC OE Total MC OE MC OE MC OE Total
1 1 1
Explain the rock cycle as changes in the solid earth and rock types found in Pennsylvania (igneous – granite, basalt, pumice; sedimentary – limestone, sandstone, shale, coal; and metamorphic – slate, quartzite, marble, gneiss).
1 1 2
Describe natural processes that change Earth’s surface (e.g., landslides, volcanic eruptions, earthquakes, mountain building, new land being formed, weathering, erosion, sedimentation, soil formation).
1 1 3
Identify soil types (i.e., humus, topsoil, subsoil, loam, loess, and parent material) and their characteristics (i.e., particle size, porosity, and permeability) found in different biomes and in Pennsylvania, and explain how they formed
1 1 4
Explain how fossils provide evidence about plants and animals that once lived throughout Pennsylvania’s history (e.g., fossils provide evidence of different environments).
1 2 1
Describe a product’s transformation process from production to consumption (e.g., prospecting, propagating, growing, maintaining, adapting, treating, converting, distributing, disposing) and explain the process’s potential impact on Earth’s resources.
1 1 1 1 1 1
1 2 2
Describe potential impacts of human-made processes (e.g., manufacturing, agriculture, transportation, mining) on Earth’s resources, both nonliving (i.e., air, water, or earth materials) and living (i.e., plants and animals).
Points Items
StudentScores
(CorePoints)
Equating Block (EB)
Total Numberof Items
(Core &EB)
Total Points
(Core &EB)
Number of Items
Core EBRep
ortin
gCa
tego
ry
Asse
ssm
ent
Anch
or
Des
crip
tor
(Sub
-anc
hor)
Elig
ible
Cont
ent
Focus
Grade 08 Science
Appendix C: 2012 PSSA-M Tally Sheets
2012 PSSA-M Technical Report C-67
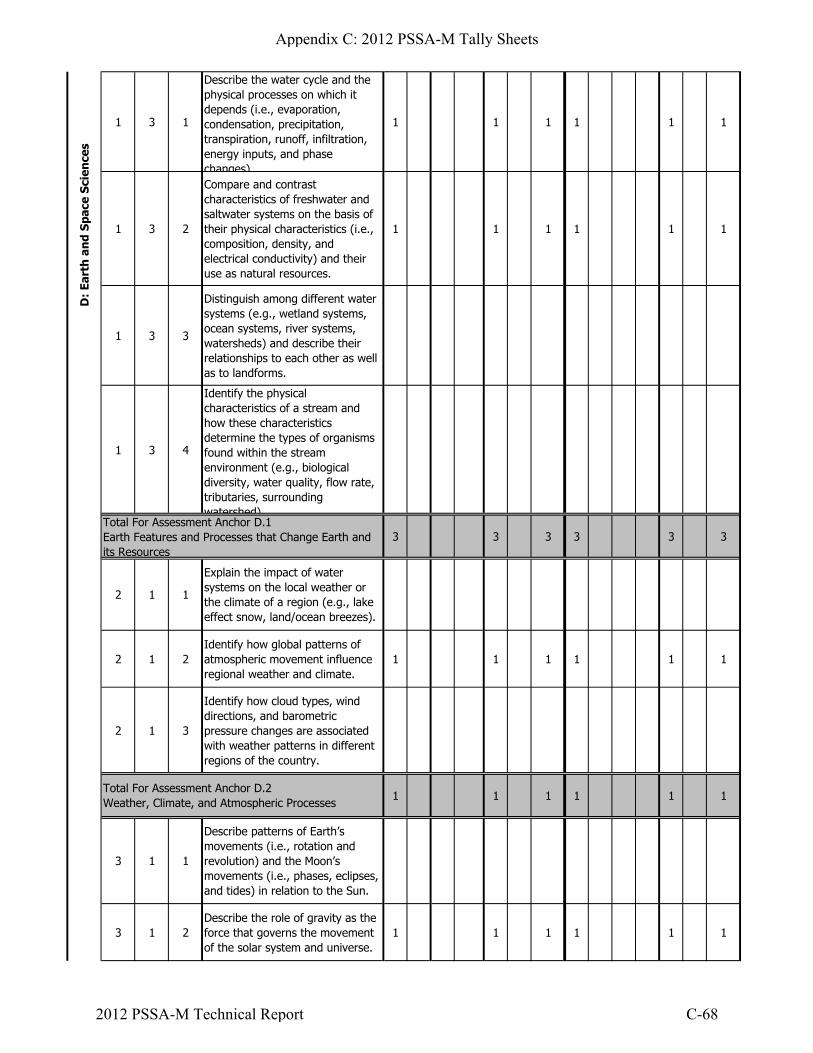
1 3 1
Describe the water cycle and the physical processes on which it depends (i.e., evaporation, condensation, precipitation, transpiration, runoff, infiltration, energy inputs, and phase changes)
1 1 1 1 1 1
1 3 2
Compare and contrast characteristics of freshwater and saltwater systems on the basis of their physical characteristics (i.e., composition, density, and electrical conductivity) and their use as natural resources.
1 1 1 1 1 1
1 3 3
Distinguish among different water systems (e.g., wetland systems, ocean systems, river systems, watersheds) and describe their relationships to each other as well as to landforms.
1 3 4
Identify the physical characteristics of a stream and how these characteristics determine the types of organisms found within the stream environment (e.g., biological diversity, water quality, flow rate, tributaries, surrounding watershed)
3 3 3 3 3 3
2 1 1
Explain the impact of water systems on the local weather or the climate of a region (e.g., lake effect snow, land/ocean breezes).
2 1 2Identify how global patterns of atmospheric movement influence regional weather and climate.
1 1 1 1 1 1
2 1 3
Identify how cloud types, wind directions, and barometric pressure changes are associated with weather patterns in different regions of the country.
1 1 1 1 1 1
3 1 1
Describe patterns of Earth’s movements (i.e., rotation and revolution) and the Moon’s movements (i.e., phases, eclipses, and tides) in relation to the Sun.
3 1 2Describe the role of gravity as the force that governs the movement of the solar system and universe.
1 1 1 1 1 1
Total For Assessment Anchor D.1Earth Features and Processes that Change Earth and its Resources
Total For Assessment Anchor D.2Weather, Climate, and Atmospheric Processes
D:
Eart
h a
nd
Spa
ce S
cien
ces
Appendix C: 2012 PSSA-M Tally Sheets
2012 PSSA-M Technical Report C-68

3 1 3
Compare and contrast characteristics of celestial bodies found in the solar system (e.g., moons, asteroids, comets, meteors, inner and outer planets).
1 1 1 1 1 1
4 4 4 4 4 4
Total For Assessment Anchor D.3Composition and Structure of the Universe
Total For Reporting Category D
Appendix C: 2012 PSSA-M Tally Sheets
2012 PSSA-M Technical Report C-69

MC OE MC OE MC OE Total MC OE MC OE MC OE Total
1 1 1
Compare and contrast scientific theories, scientific laws, and beliefs (e.g., the universal law of gravitation, how light travels, formation of moons, stages of ecological succession).
1 1 1 1 1 1
1 1 2Analyze and explain the accuracy of scientific facts, principles, theories, and laws.
1 1 1 1 1 1
1 1 3Evaluate the appropriateness of research questions (e.g., testable vs. not-testable).
1 1 1 1 1 1
1 1 4
Explain how specific scientific knowledge or technological design concepts solve practical problems (e.g., momentum, Newton’s universal law of gravitation, tectonics, conservation of mass and energy, cell theory, theory of evolution, atomic theory, theory of relativity, Pasteur’s germ theory, relativity, heliocentric theory, ideal gas laws).
2 2 2 1 1 1
1 1 5
Analyze or compare the use of both direct and indirect observation as means to study the world and the universe (e.g., behavior of atoms, functions of cells, birth of stars).
1 2 1
Explain and apply scientific concepts to societal issues using case studies (e.g., spread of HIV, deforestation, environmental health, energy).
1 1 1 1 1 1
1 2 2
Use case studies (e.g., Wright brothers’ flying machine, Tacoma Narrows Bridge, Henry Petroski’s Design Paradigms) to propose possible solutions and analyze economic and environmental implications of solutions for real-world problems.
1 3 1
Use appropriate quantitative data to describe or interpret change in systems (e.g., biological indices, electrical circuit data, automobile diagnostic systems data).
Number of Items
Core EB
StudentScores
(CorePoints)
Total Points
(Core &EB)
Grade 11 ScienceRep
ortin
gCa
tego
ry
Asse
ssm
ent
Anch
or
Des
crip
tor
(Sub
-anc
hor)
Elig
ible
Cont
ent
Focus
Points Items
Equating Block (EB)
Total Numberof Items
(Core &EB)
Appendix C: 2012 PSSA-M Tally Sheets
2012 PSSA-M Technical Report C-70

1 3 2
Describe or interpret dynamic changes to stable systems (e.g., chemical reactions, human body, food webs, tectonics, homeostasis).
1 3 3
Describe how changes in physical and biological indicators (e.g., soil, plants, animals) of water systems reflect changes in these systems (e.g. changes in bloodworm populations reflect changes in pollution levels in streams).
1 3 4Compare the rate of use of natural resources and their impact on sustainability.
4 2 4 2 6 4 1 4 1 5
2 1 1
Critique the elements of an experimental design (e.g., raising questions, formulating hypotheses, developing procedures, identifying variables, manipulating variables, interpreting data, and drawing conclusions) applicable to a specific experimental design.
2 1 2
Critique the elements of the design process (e.g. identify the problem, understand criteria, create solutions, select solution, test/evaluate, communicate results) applicable to a specific technological design.
1 1 1 1 1 1
2 1 3
Use data to make inferences and predictions, or to draw conclusions, demonstrating understanding of experimental limits.
1 1 1 1 1 1
2 1 4Critique the results and conclusions of scientific inquiry for consistency and logic.
2 2 2 2 2 2
2 1 5Communicate results of investigations using multiple representations.
1 1 1 1 1 1
2 2 1
Evaluate appropriate methods, instruments, and scale for precise quantitative and qualitative observations (e.g., to compare properties of materials, water quality).
1 1 1 1 1 1
A:
Nat
ure
of
Sci
ence
Total For Assessment Anchor A.1Reasoning and Analysis
Appendix C: 2012 PSSA-M Tally Sheets
2012 PSSA-M Technical Report C-71

2 2 2
Explain how technology (e.g., GPS, spectroscope, scanning electron microscope, pH meter, probe, interface, imaging technology, telescope) is used to extend human abilities and precision.
6 6 6 6 6 6
3 1 1
Apply systems analysis, showing relationships (e.g., flowcharts, concept maps), input and output, and measurements to explain a system and its parts.
1 1 1 1 1 1
3 1 2Analyze and predict the effect of making a change in one part of a system on the system as a whole.
1 1 1 1 1 1
3 1 3
Use appropriate quantitative data to describe or interpret a system (e.g., biological indices, electrical circuit data, automobile diagnostic systems data).
3 1 4
Apply the universal systems model of inputs, processes, outputs, and feedback to a working system (e.g., heating, motor, food production) and identify the resources necessary for operation of the system.
3 2 1
Compare the accuracy of predictions represented in a model to actual observations and behavior.
3 2 2Describe advantages and disadvantages of using models to simulate processes and outcomes.
3 2 3
Describe how relationships represented in models are used to explain scientific or technological concepts (e.g., dimensions of objects within the solar system, life spans, size of atomic particles, topographic maps).
1 1 1 1 1 1
3 3 1
Describe or interpret recurring patterns that form the basis of biological classification, chemical periodicity, geological order, or astronomical order.
1 1 1 1 1 1
3 3 2
Compare stationary physical patterns (e.g., crystals, layers of rocks, skeletal systems, tree rings, atomic structure) to the object’s properties.
Total For Assessment Anchor A.2Processes, Procedures, and Tools of Scientific Investigations
Appendix C: 2012 PSSA-M Tally Sheets
2012 PSSA-M Technical Report C-72

3 3 3
Analyze physical patterns of motion to make predictions or draw conclusions (e.g., solar system, tectonic plates, weather systems, atomic motion, waves).
1 1 1 1 1 1
5 5 5 5 5 5
15 2 15 2 17 15 1 15 1 16
Total For Assessment Anchor A.3Systems, Models, and Patterns
Total For Reporting Category A
Appendix C: 2012 PSSA-M Tally Sheets
2012 PSSA-M Technical Report C-73

MC OE MC OE MC OE Total MC OE MC OE MC OE Total
1 1 1
Explain how structure determines function at multiple levels of organization (e.g., chemical, cellular, anatomical).
1 1 2
Compare and contrast the structural and functional similarities and differences among living things (e.g., classify organisms into classification groups, compare systems).
1 1 3
Compare and contrast cellular processes (e.g., photosynthesis and respiration, meiosis and mitosis, protein synthesis and DNA replication).
2 1 1
Explain the theory of evolution by interpreting data from fossil records, similarities in anatomy and physiology, or DNA studies that are relevant to the theory of evolution.
2 1 2
Explain the role of mutations, differential reproduction, and gene recombination in changing the genetic makeup of a population.
1 1 1 1 1 1
2 1 3
Explain the role of selective breeding and biotechnology in changing the genetic makeup of a population.
2 1 4 Explain why natural selection can act only on inherited traits.
2 2 1
Describe how genetic information is expressed (i.e., DNA, genes, chromosomes, transcription, translation, and replication).
2 2 2Compare and contrast mitosis and meiosis in passing on genetic information.
2 2 3
Explain how different patterns of inheritance affect population variability (i.e., multiple alleles, co-dominance, dominance, recessiveness, sex-influenced traits, and sex-linked traits).
1 1 1 1 1 1
Total For Assessment Anchor B.1Structures and Functions of Organisms
Total For Assessment Anchor B.2Continuity of Life
Points Items
StudentScores
(CorePoints)
Equating Block (EB)
Total Numberof Items
(Core &EB)
Total Points
(Core &EB)
Number of Items
Core EBRep
ortin
gCa
tego
ry
Asse
ssm
ent
Anch
or
Des
crip
tor
(Sub
-anc
hor)
Elig
ible
Cont
ent
Focus
Grade 11 Science
Appendix C: 2012 PSSA-M Tally Sheets
2012 PSSA-M Technical Report C-74

3 1 1Explain the significance of diversity in ecosystems.
3 1 2
Explain the biotic (i.e., plant, animal, and microbial communities) and abiotic (i.e., soil, air, temperature, and water) components of an ecosystem and their interaction.
3 1 3Describe how living organisms affect the survival of one another.
1 1 1 1 1 1
3 1 4
Compare the similarities and differences in the major biomes (e.g., desert, tropical rain forest, temperate forest, coniferous forest, tundra) and the communities that inhabit them.
3 1 5Predict how limiting factors (e.g., physical, biological, chemical) can affect organisms.
3 2 1Use evidence to explain how cyclical patterns in population dynamics affect natural systems.
3 2 2Explain biological diversity as an indicator of a healthy environment.
1 1 1 1 1 1
3 2 3
Explain how natural processes (e.g., seasonal change, catastrophic events, habitat alterations) impact the environment over time.
1 1 1 1 1 1
3 3 1
Describe different human-made systems and how they use renewable and nonrenewable natural resources (i.e., energy, transportation, distribution, management, and processing).
3 3 2
Compare the impact of management practices (e.g., production, processing, research, development, marketing, distribution, consumption, by-products) in meeting the need for commodities locally and globally.
B:
Bio
logi
cal S
cien
ces
Appendix C: 2012 PSSA-M Tally Sheets
2012 PSSA-M Technical Report C-75

3 3 3
Explain the environmental benefits and risks associated with human-made systems (e.g., integrated pest management, genetically engineered organisms, organic food production).
1 1 1 1 1 1
4 4 4 4 4 4
5 5 5 5 5 5
Total For Assessment Anchor B.3Ecological Behavior and Systems
Total For Reporting Category B
Appendix C: 2012 PSSA-M Tally Sheets
2012 PSSA-M Technical Report C-76

MC OE MC OE MC OE Total MC OE MC OE MC OE Total
1 1 1
Explain that matter is made of particles called atoms and that atoms are composed of even smaller particles (e.g., protons, neutrons, electrons).
1 1 1 1 1 1
1 1 2
Explain the relationship between the physical properties of a substance and its molecular or atomic structure.
1 1 3
Explain the formation of compounds (ionic and covalent) and their resulting properties using bonding theories.
1 1 4
Explain how the relationships of chemical properties of elements are represented in the repeating patterns within the periodic table.
1 1 5
Predict the behavior of gases though the application of laws (e.g., Boyle’s law, Charles’ law, or ideal gas law).
1 1 6
Describe factors that influence the frequency of collisions during chemical reactions that might affect the reaction rates (e.g., surface area, concentration, catalyst, temperature).surface area, concentration, catalyst, temperature).
1 1 1 1 1 1
2 2 2 2 2 2
2 1 1
Compare or analyze waves in the electromagnetic spectrum (e.g., ultraviolet, infrared, visible light, X-rays, microwaves) as well as their properties, energy levels, and motion.
2 1 2 Describe energy changes in chemical reactions.
2 1 3
Apply the knowledge of conservation of energy to explain common systems (e.g., refrigeration, rocket propulsion, heat pump).
2 1 4Use Ohm’s Law to explain relative resistances, currents, and voltage.
Number of Items
Core EB
Sci
ence
s
Total For Assessment Anchor C.1Structures, Properties, and Interaction of Matter and Energy
StudentScores
(CorePoints)
Total Points
(Core &EB)
Grade 11 ScienceRep
ortin
gCa
tego
ry
Asse
ssm
ent
Anch
or
Des
crip
tor
(Sub
-anc
hor)
Elig
ible
Cont
ent
Focus
Points Items
Equating Block (EB)
Total Numberof Items
(Core &EB)
Appendix C: 2012 PSSA-M Tally Sheets
2012 PSSA-M Technical Report C-77
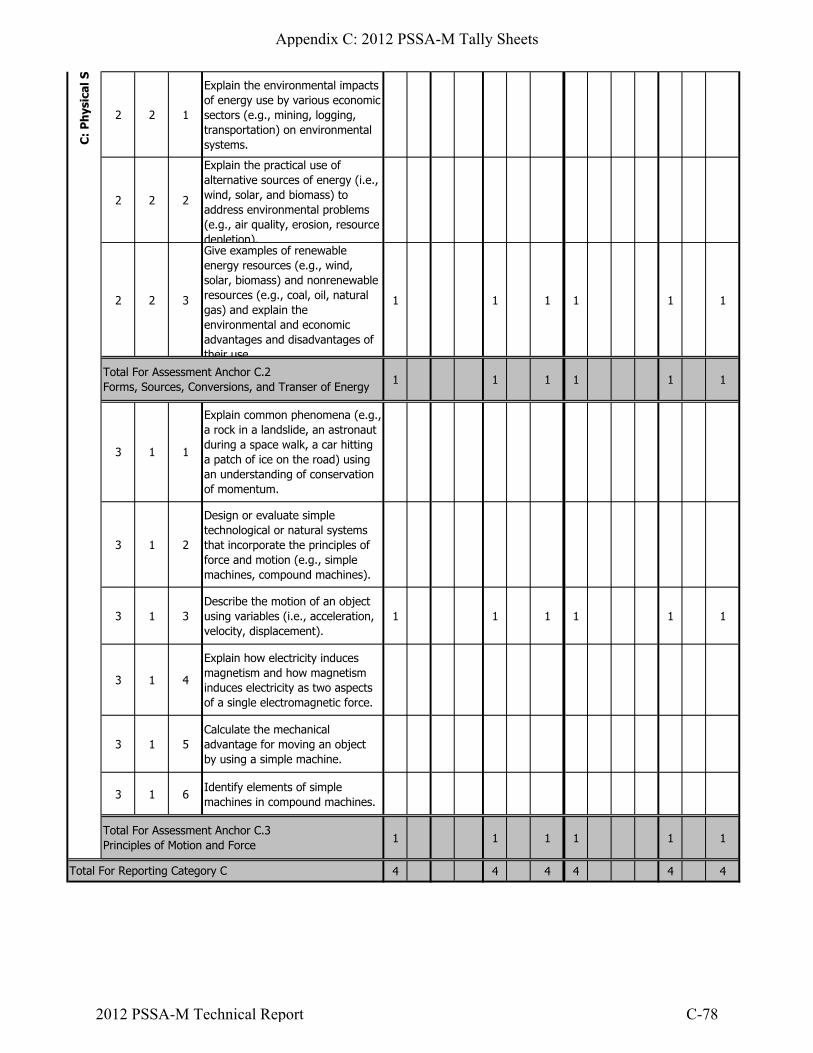
2 2 1
Explain the environmental impacts of energy use by various economic sectors (e.g., mining, logging, transportation) on environmental systems.
2 2 2
Explain the practical use of alternative sources of energy (i.e., wind, solar, and biomass) to address environmental problems (e.g., air quality, erosion, resource depletion).
2 2 3
Give examples of renewable energy resources (e.g., wind, solar, biomass) and nonrenewable resources (e.g., coal, oil, natural gas) and explain the environmental and economic advantages and disadvantages of their use.
1 1 1 1 1 1
1 1 1 1 1 1
3 1 1
Explain common phenomena (e.g., a rock in a landslide, an astronaut during a space walk, a car hitting a patch of ice on the road) using an understanding of conservation of momentum.
3 1 2
Design or evaluate simple technological or natural systems that incorporate the principles of force and motion (e.g., simple machines, compound machines).
3 1 3Describe the motion of an object using variables (i.e., acceleration, velocity, displacement).
1 1 1 1 1 1
3 1 4
Explain how electricity induces magnetism and how magnetism induces electricity as two aspects of a single electromagnetic force.
3 1 5Calculate the mechanical advantage for moving an object by using a simple machine.
3 1 6Identify elements of simple machines in compound machines.
1 1 1 1 1 1
4 4 4 4 4 4
Total For Assessment Anchor C.2Forms, Sources, Conversions, and Transer of Energy
Total For Assessment Anchor C.3Principles of Motion and Force
Total For Reporting Category C
C:
Ph
ysic
al S
Appendix C: 2012 PSSA-M Tally Sheets
2012 PSSA-M Technical Report C-78

MC OE MC OE MC OE Total MC OE MC OE MC OE Total
1 1 1
Classify and describe major types of rocks (i.e., igneous – granite, basalt, obsidian, pumice; sedimentary – limestone, sandstone, shale, coal; and metamorphic – slate, quartzite, marble, gneiss) and minerals (e.g., quartz, calcite, dolomite, clay, feldspar, mica, halite, pyrite) by their origin and formation.
1 1 2
Explain the processes that take place at plate boundaries and how these processes continue to shape Earth (e.g., volcanic activity, earthquakes, mountain building, mid-ocean ridges, deep-sea trenches, new land being formed).
1 1 1 1 1 1
1 1 3
Analyze features caused by the interaction of processes that change Earth’s surface (e.g., wind and moving water help break down rock into soil; plate movement, earthquakes, and volcanic activity help cause mountains and valleys to form; flowing water and deposition of material help form deltas)
2 2 2 1 1 1
1 2 1Evaluate factors affecting availability, location, extraction, and use of natural resources.
1 2 2
Explain the impact of obtaining and using natural resources for the production of energy and materials (e.g., resource renewal, amount of pollution, deforestation).
1 1 1 1 1 1
1 3 1
Explain the multiple functions of different water systems in relation to landforms (e.g., buffer zones, nurseries, food production areas, habitat, water quality control, biological indicators).
1 1 1 1 1 1
Points Items
StudentScores
(CorePoints)
Equating Block (EB)
Total Numberof Items
(Core &EB)
Total Points
(Core &EB)
Number of Items
Core EBRep
ortin
gCa
tego
ry
Asse
ssm
ent
Anch
or
Des
crip
tor
(Sub
-anc
hor)
Elig
ible
Cont
ent
Focus
Grade 11 Science
Appendix C: 2012 PSSA-M Tally Sheets
2012 PSSA-M Technical Report C-79

1 3 2
Explain relationships among physical characteristics, vegetation, topography, and flow as it relates to water systems.
1 3 3
Explain factors (e.g., nutrient loading, turbidity, rate of flow, rate of deposition, biological diversity) that affect water quality and flow through a water system.
3 2 3 2 5 3 1 3 1 4
2 1 1
Describe how changes in concentration of minor components (e.g., O2, CO2, dust, pollution) in Earth's atmosphere may be linked to climate change.
2 1 2
Compare the transmission, reflection, absorption, and radiation of solar energy to and by Earth’s surface under different environmental conditions (e.g., major volcanic eruptions, greenhouse effect, reduction of ozone layer, increased global cloud cover)
1 1 1 1 1 1
2 1 3Explain weather patterns and seasonal changes using the concepts of heat and density.
2 1 4
Analyze weather maps and weather data (e.g., air masses, fronts, temperature, air pressure, wind speed, wind direction, precipitation) to predict regional or global weather events.
1 1 1 1 1 1
3 1 1Describe planetary motion and the physical laws that explain planetary motion.
3 1 2Describe the structure, formation, and life cycle of stars.
1 1 1 1 1 1
3 1 3
Explain the current scientific theories of the origin of the solar system and universe (e.g., big bang theory, solar nebular theory, stellar evolution).
1 1 1 1 1 1
2 2 2 2 2 2
6 2 6 2 8 6 1 6 1 7
Total For Assessment Anchor D.1Earth Features and Processes that Change Earth and its Resources
Total For Assessment Anchor D.2Weather, Climate, and Atmospheric Processes
Total For Assessment Anchor D.3Composition and Structure of the Universe
Total For Reporting Category D
D:
Eart
h a
nd
Spa
ce S
cien
ces
Appendix C: 2012 PSSA-M Tally Sheets
2012 PSSA-M Technical Report C-80

MC OE MC OE MC OE Total MC OE MC OE MC OE Total1 Narrative
2 Informational
3 Persuasive
Total For Assessment Anchor A.3A.S. 1.4 -- Types of Writing
Total For Reporting Category A
A:
Com
posi
tion
Total For Assessment Anchor A.1A.S. 1.4 -- Types of Writing
Core EB
Total Numberof Items
(Core &EB)
Total For Assessment Anchor A.2A.S. 1.4 -- Types of Writing
Grade 05 WritingRep
ortin
gCa
tego
ry
Asse
ssm
ent
Anch
or
Des
crip
tor
(Sub
-anc
hor)
Elig
ible
Cont
ent
Focus
Points Items
Equating Block (EB)
StudentScores
(CorePoints)
Total Points
(Core &EB)
Number of Items
Appendix C: 2012 PSSA-M Tally Sheets
2012 PSSA-M Technical Report C-81

MC OE MC OE MC OE Total MC OE MC OE MC OE Total5 Editing
6 Revising
Total For Assessment Anchor B.5A.S. 1.5 -- Quality of Writing
Total For Assessment Anchor B.6A.S. 1.5 -- Quality of Writing
Total For Reporting Category B
B:
Rev
isin
g an
d Ed
it
Items
StudentScores
(CorePoints)
Grade 05
Equating Block (EB)
Total Numberof Items
(Core &EB)
EB
Number of Items
Core
Total Points
(Core &EB)
WritingRep
ortin
gCa
tego
ry
Asse
ssm
ent
Anch
or
Des
crip
tor
(Sub
-anc
hor)
Elig
ible
Cont
ent
Focus
Points
Appendix C: 2012 PSSA-M Tally Sheets
2012 PSSA-M Technical Report C-82

MC OE MC OE MC OE Total MC OE MC OE MC OE Total1 Narrative
2 Informational
3 Persuasive
Total For Assessment Anchor A.3A.S. 1.4 -- Types of Writing
Total For Reporting Category A
A:
Com
posi
tion
Total For Assessment Anchor A.1A.S. 1.4 -- Types of Writing
Core EB
Total Numberof Items
(Core &EB)
Total For Assessment Anchor A.2A.S. 1.4 -- Types of Writing
Grade 08 WritingRep
ortin
gCa
tego
ry
Asse
ssm
ent
Anch
or
Des
crip
tor
(Sub
-anc
hor)
Elig
ible
Cont
ent
Focus
Points Items
Equating Block (EB)
StudentScores
(CorePoints)
Total Points
(Core &EB)
Number of Items
Appendix C: 2012 PSSA-M Tally Sheets
2012 PSSA-M Technical Report C-83

MC OE MC OE MC OE Total MC OE MC OE MC OE Total5 Editing
6 Revising
Total For Assessment Anchor B.5A.S. 1.5 -- Quality of Writing
Total For Assessment Anchor B.6A.S. 1.5 -- Quality of Writing
Total For Reporting Category B
B:
Rev
isin
g an
d Ed
it
Items
StudentScores
(CorePoints)
Grade 08
Equating Block (EB)
Total Numberof Items
(Core &EB)
EB
Number of Items
Core
Total Points
(Core &EB)
WritingRep
ortin
gCa
tego
ry
Asse
ssm
ent
Anch
or
Des
crip
tor
(Sub
-anc
hor)
Elig
ible
Cont
ent
Focus
Points
Appendix C: 2012 PSSA-M Tally Sheets
2012 PSSA-M Technical Report C-84

MC OE MC OE MC OE Total MC OE MC OE MC OE Total1 Narrative
2 Informational
3 Persuasive
Total For Assessment Anchor A.3A.S. 1.4 -- Types of Writing
Total For Reporting Category A
A:
Com
posi
tion
Total For Assessment Anchor A.1A.S. 1.4 -- Types of Writing
Core EB
Total Numberof Items
(Core &EB)
Total For Assessment Anchor A.2A.S. 1.4 -- Types of Writing
Grade 11 WritingRep
ortin
gCa
tego
ry
Asse
ssm
ent
Anch
or
Des
crip
tor
(Sub
-anc
hor)
Elig
ible
Cont
ent
Focus
Points Items
Equating Block (EB)
StudentScores
(CorePoints)
Total Points
(Core &EB)
Number of Items
Appendix C: 2012 PSSA-M Tally Sheets
2012 PSSA-M Technical Report C-85

MC OE MC OE MC OE Total MC OE MC OE MC OE Total5 Editing
6 Revising
Total For Assessment Anchor B.5A.S. 1.5 -- Quality of Writing
Total For Assessment Anchor B.6A.S. 1.5 -- Quality of Writing
Total For Reporting Category B
B:
Rev
isin
g an
d Ed
it
Items
StudentScores
(CorePoints)
Grade 11
Equating Block (EB)
Total Numberof Items
(Core &EB)
EB
Number of Items
Core
Total Points
(Core &EB)
WritingRep
ortin
gCa
tego
ry
Asse
ssm
ent
Anch
or
Des
crip
tor
(Sub
-anc
hor)
Elig
ible
Cont
ent
Focus
Points
Appendix C: 2012 PSSA-M Tally Sheets
2012 PSSA-M Technical Report C-86

Appendix D:
Item and Test Development Process


Item and Test Development Process for the PSSA-M
Step Description
1. Create and Review Guiding Documentation
Item and test development specialists meet internally to review all guiding documentation related to the PSSA and PSSA-M. Documentation reviewed includes the test design blueprints, the Pennsylvania Assessment Anchors and Eligible Content, the test item specifications, and all test content descriptions. In addition, the test style specifications (style guide) are updated with new styles and formats specifically designed for the PSSA-M assessment.
2. Meet with PDE to Confirm Understanding of Program
The goal of the meeting is to ensure that item and test development teams have a clear understanding of PDE’s vision for test development. A successful development cycle requires a clear understanding of Pennsylvania’s content-area test specifications and of any unique interpretations of the Pennsylvania Assessment Anchors (if any).
3. Create Preliminary Test Item Development Plan
Item and test development specialists generate a preliminary development plan which includes an overview of the program, the internal and external (PDE) review and approval processes, and a projected schedule for the modification of test items—including the number of test items to be modified for review by PDE and subsequent review by the committees of Pennsylvania educators.
4. Meet with PDE to Finalize Test Item Development Plan
Item and test development specialists verify all steps in the development process including timelines and schedules for item modifications and test development.
5. Analyze Item Bank Existing test items in the current PSSA Item Bank are reviewed as potential candidates for modification and enhancement. During this phase, test development specialists also make a tally of the modified item candidates in the PSSA-M item pool by assessment anchor.
6. Refine Modified Test Item Development Plan to Include Reviewers and Subcontractors
Item and test development specialists identify the item reviewers who will modify the test items (test development specialists or other professional item writers, subcontractors, etc.), the estimated number of item reviewers needed, the qualifications of the item reviewers, and the approximate number of modified test items to be submitted by each source.
7. Train Reviewers Item and test development specialists train item reviewers, as needed. Item reviewers who have written for the PSSA in the past receive updated information concerning modification and style guidelines for the PSSA-M as needed.
Appendix D: Item and Test Development Process
2012 PSSA-M Technical Report D-1
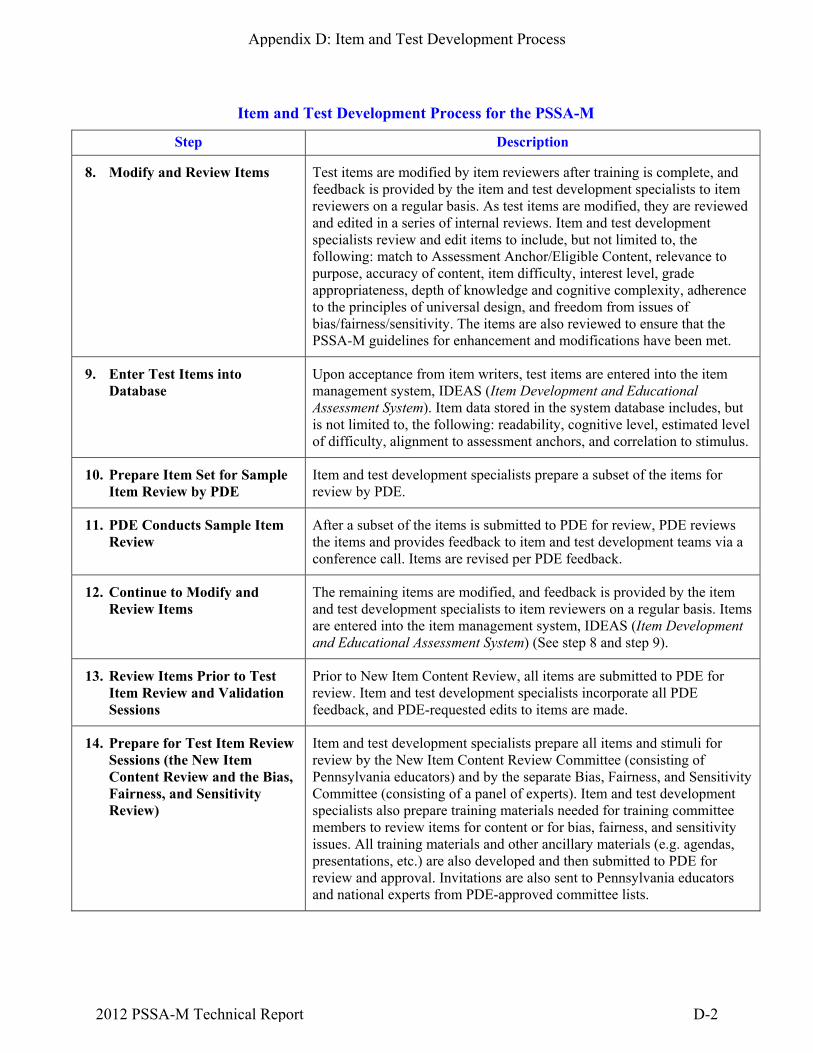
Item and Test Development Process for the PSSA-M
Step Description
8. Modify and Review Items Test items are modified by item reviewers after training is complete, and feedback is provided by the item and test development specialists to item reviewers on a regular basis. As test items are modified, they are reviewed and edited in a series of internal reviews. Item and test development specialists review and edit items to include, but not limited to, the following: match to Assessment Anchor/Eligible Content, relevance to purpose, accuracy of content, item difficulty, interest level, grade appropriateness, depth of knowledge and cognitive complexity, adherence to the principles of universal design, and freedom from issues of bias/fairness/sensitivity. The items are also reviewed to ensure that the PSSA-M guidelines for enhancement and modifications have been met.
9. Enter Test Items into Database
Upon acceptance from item writers, test items are entered into the item management system, IDEAS (Item Development and Educational Assessment System). Item data stored in the system database includes, but is not limited to, the following: readability, cognitive level, estimated level of difficulty, alignment to assessment anchors, and correlation to stimulus.
10. Prepare Item Set for Sample Item Review by PDE
Item and test development specialists prepare a subset of the items for review by PDE.
11. PDE Conducts Sample Item Review
After a subset of the items is submitted to PDE for review, PDE reviews the items and provides feedback to item and test development teams via a conference call. Items are revised per PDE feedback.
12. Continue to Modify and Review Items
The remaining items are modified, and feedback is provided by the item and test development specialists to item reviewers on a regular basis. Items are entered into the item management system, IDEAS (Item Development and Educational Assessment System) (See step 8 and step 9).
13. Review Items Prior to Test Item Review and Validation Sessions
Prior to New Item Content Review, all items are submitted to PDE for review. Item and test development specialists incorporate all PDE feedback, and PDE-requested edits to items are made.
14. Prepare for Test Item Review Sessions (the New Item Content Review and the Bias, Fairness, and Sensitivity Review)
Item and test development specialists prepare all items and stimuli for review by the New Item Content Review Committee (consisting of Pennsylvania educators) and by the separate Bias, Fairness, and Sensitivity Committee (consisting of a panel of experts). Item and test development specialists also prepare training materials needed for training committee members to review items for content or for bias, fairness, and sensitivity issues. All training materials and other ancillary materials (e.g. agendas, presentations, etc.) are also developed and then submitted to PDE for review and approval. Invitations are also sent to Pennsylvania educators and national experts from PDE-approved committee lists.
Appendix D: Item and Test Development Process
2012 PSSA-M Technical Report D-2

Item and Test Development Process for the PSSA-M
Step Description
15. Conduct Test Item Review Sessions (the New Item Content Review and the Bias, Fairness, and Sensitivity Review)
Committees of Pennsylvania educators and national experts review items in two meetings: one addressing item quality, the other addressing bias, fairness, and sensitivity. PDE, with support from item and test development specialists, presents training on how to review new test items for content considerations or bias/fairness/sensitivity issues. At the New Item Content Review, suggested edits to test items are made and/or replacement test items are written during the actual item review so that both the committee and PDE are able to observe changes to the test items and approve the test items during the committee review process. At the Bias, Fairness, and Sensitivity Review, experts in bias, fairness, and sensitivity review all test items and come to a consensus about any issues that are noted. At both meetings, the results are documented.
16. Conduct Item Review Resolution and Cleanup
Following the conclusion of the New Item Content Review Committee meetings, PDE re-examines the consensus changes suggested by the committee members during the New Item Content Review Committee meetings. DRC item and test development specialists then record all of PDE’s follow-up decisions and changes. During this cleanup process, PDE either accepts the changes as requested by the committee, or PDE rejects the decision of the committee. If a committee decision is rejected, PDE provides an alternate decision for DRC to implement. During this cleanup process, PDE also interprets the report from the Bias, Fairness, and Sensitivity Committee meetings and subsequently applies changes to test items. DRC item and test development specialists then apply the changes to the test items per PDE’s decisions.
17. Construct Standalone Field Test Forms
DRC item and test development specialists select test items for inclusion on the standalone field test forms. Selections are based on recommendations from item review committees and their estimations of cognitive and difficulty levels, as well as input and recommendations from PDE.
18. Submit Field Test Forms for Final Sign-Off
PDE-approved changes are applied to the items, stimuli, etc. (Changes reflect PDE’s arbitration of the committee decisions.) Once all revisions to the items and/or to the art used by test items are completed, the field test forms are submitted to PDE for final review and sign-off.
Appendix D: Item and Test Development Process
2012 PSSA-M Technical Report D-3

Item and Test Development Process for the PSSA-M
Step Description
19. Review Results of the Field Test
Following the administration of a field test form and the subsequent rangefinding and field test scoring processes for field test items, performance data for all field test items are analyzed by DRC psychometricians and test development specialists. Test item performance data that meet certain triggering criteria are flagged for additional reviews by test development specialists. Flagged field test items with extreme performance data are considered psychometrically unusable and are removed from future operational consideration. Normally, only field test items with marginal performance data are prepared for the Field Test Item Data Review meeting. However, since the PSSA-M program is in its initial stages, all of the items from the field test are eligible for review.
20. Prepare for Field Test Item Data Review
Test development specialists prepare all items and stimuli for review by the Field Test Item Data Review Committee (which consists of Pennsylvania educators). Psychometricians also prepare training materials needed for training committee members to review items for their performance. All training materials and other ancillary materials (e.g. agendas, presentations, etc.) are submitted to PDE for review and approval. Invitations are also sent to Pennsylvania educators from PDE-approved committee lists.
21. Conduct Field Test Item Data Review
Committees of Pennsylvania educators review the performance data of field test items. Psychometrians present training on how to review field test items based on their performance data. At the Item Data Review, committee members examine the performance of the items and determine whether the field test item is technically sound and appropriate for use on an operational PSSA-M test. Since test items cannot be modified at the Field Test Item Data Review, the committee can either accept an item as is or the committee can reject the item.
22. Conduct Field Test Item Data Review Reconciliation
Following the conclusion of the Field Test Item Data Review Committee meetings, PDE re-examines the consensus decisions (accept or reject) suggested by the committee members during the Field Test Item Data Review Committee meetings. Test development specialists record all of PDE’s follow-up decisions and changes. During this cleanup process, PDE either accepts the decisions of the data review committee, or PDE rejects the decisions of the data review committee. If a committee decision is not accepted, PDE provides an alternate decision for test development specialists to implement. All PDE-approved changes to the test items status (accepted or rejected) are incorporated into the Item Development and Educational Assessment System, IDEAS.
23. Select Core Items for Operational Test Forms
After the results of the prior field test have been finalized following data review, test development specialists collaborate with psychometricians to follow the Test Design Blueprints and build requirements to make the initial selection of items for core positions in all test forms.
Appendix D: Item and Test Development Process
2012 PSSA-M Technical Report D-4

Item and Test Development Process for the PSSA-M
Step Description
24. Review Core Selections After test content and psychometric requirements have been achieved for core positions, the core items are provided to PDE for review and approval. Any changes to the content of the core requested by PDE are balanced with psychometric requirements until all core positions are approved by PDE, test development specialists, and psychometricians.
25. Construct Test Forms Items and test components are assembled into forms using the form construction and typesetting function of DRC’s Item Development and Educational Assessment System, IDEAS. Forms are reviewed internally for style and formatting requirements.
26. Review Typeset Forms After forms are constructed in IDEAS, draft hard copies of the forms are produced and presented to PDE for review and approval. Any changes to the content of the core requested by PDE are balanced with psychometric requirements until all core items are approved by PDE, test development specialists, and psychometricians.
27. Print Test Forms Following PDE’s approval of the test forms, DRC completes a series of final proofing of all test forms. Final forms (along with ancillary materials) are then approved for printing.
28. Assemble Documentation of Test Materials
Metadata for each test item and form is documented and proofed, including: grade, form, session/section, item sequence, reporting category, assessment anchor, descriptor (sub-anchor), eligible content, number of points, item type, number of answer options, item usage, stimulus ID, etc.
Appendix D: Item and Test Development Process
2012 PSSA-M Technical Report D-5

Guidelines for Item Revision and Enhancement
Overview
The PSSA-M will be developed to facilitate students’ ability to demonstrate their grade-level content knowledge and skills, as specified in the Pennsylvania Academic Assessment Anchor Content Standards as defined by the Eligible Content. The assessment tasks (items and graphics/stimuli) will be designed with the goal (revised and/or enhanced) to minimize or remove the effects of processing (e.g., cognitive, linguistic) or physical challenges related to students’ disabilities without significant alteration of the assessed construct. Therefore, the PSSA-M design considers the particular needs of students eligible for this assessment in order to increase their access to the assessed content—appropriate access to test content is necessary to ensure the validity of the assessment results. Lack of access could result in the measurement of sources of variance that are not related to the intended test content (construct irrelevance) or could allow construct-irrelevant factors to interfere with the student’s ability to fully demonstrate what he or she knows and can do, and subsequently the test results could underestimate the student’s actual level of achievement. Therefore, for the initial field tests (spring 2009 for mathematics and 2010 for reading and science), PSSA-M assessment items, tasks, etc. will be revised and/or enhanced to maintain the integrity of the grade-level content; however, revisions and/or enhancements will be purposefully and necessarily made in the operationalization of the grade-level content in order to address the specific access needs of the students who will be eligible for the PSSA-M. Three main areas of consideration will affect the initial revision and/or enhancement process involved in the PSSA-M items: student characteristics, assessed content, and item format. Although each of these areas is discussed separately below, the areas interact and have real implications for item revisions and/or enhancements. Student Characteristics Students who will be eligible for the PSSA-M generally have difficulty processing information (e.g., working memory limitations, attention deficits). Therefore, reflected in the item revisions and/or enhancements will be methods for (1) appropriately reducing the cognitive load (e.g., amount and complexity of information), (2) appropriately reducing language load (i.e., construct-irrelevant language) of the assessed content, and/or (3) supporting students’ processing of information (e.g., by segmenting or chunking information or by providing graphics that support understanding) in order to address their access needs and increase the validity of assessment results for these students.
Appendix D: Item and Test Development Process
2012 PSSA-M Technical Report D-6

Assessed Content Given the capabilities and limitations of students eligible for the PSSA-M, some grade-level content may be less accessible to these students. For example, the ability to infer and to make connections among multiple pieces of information is a common challenge for learning disabled (LD) students in this population. Therefore, reflected in each item will be specific parameters for content that ensure it (1) is appropriate for the student population, (2) is consistent with the intention of the grade-level Assessment Anchor Content Standard as defined by the Eligible Content, and (3) adequately represents the breadth and depth of the Assessment Anchor Content Standard as defined by the Eligible Content (i.e., does not under-represent the targeted construct). This may well mean that some of the Eligible Content may be simplified and/or eliminated. Note: The initial phases of PSSA-M item revisions and/or enhancement of the items will rely primarily on expert judgment (e.g., PDE content-area experts and special educators; Pennsylvania content-area experts and special education experts; and additional content-area experts and special education experts from WestEd and DRC). Expert judgment will be supplemented with PDE’s analyses of the student performance data (e.g., p-values, point biserials, and omission rates). In addition, Cognitive Interviews will also be conducted prior to the field test. Item Format Item formats involve consideration of the degree to which the item format could (1) reliably measure the student’s knowledge/skill, (2) yield an accurate measure of the student’s knowledge/skill, and (3) have embedded the type of support or enhancement (e.g., graphic, context clues, range of permissible ways the student can process—reception and/or production—the assessed content) the student needs to access and demonstrate understanding of the assessed content. Item format considerations are as follows:
Font (Typeface) • Introducing bolding, underlining, and other text changes (font size, italics, etc.) if
item validity and construct alignment are not affected. • Adding more space between letters and words if item validity is not affected.
Item Layout • Adding more white space between items or having fewer items per page, when
appropriate. • Increasing the width of an item or line length (two column to one, single column
layout), when appropriate. • Restructuring the stem of an item into a “stacked” format. (Indenting stacked facts
may be also be used.) • Inserting bullets to organize complex information or inserting bullets to break
complex text within an item stem into smaller parts.
Appendix D: Item and Test Development Process
2012 PSSA-M Technical Report D-7

Scaffolding • For reading, segmenting Passages/Prompts. (For example, students are provided the
same passage/prompt as the general education PSSA at a given grade level, but the passage is “segmented” or divided into meaningful parts. Those items that apply directly to each segment would appear right after or adjacent to the referenced section of the text. In other words, questions would follow an order that parallels how information generally appears in the passage or prompt. For reading, inferential questions, such as author’s purpose or theme, would appear at the end after the entire passage had been read.)
• Other types of scaffolding include, but are not limited to, the following: - Adding helpful hints or thought boxes (visual cues) to provide further
definition of words and terminology and/or to support the text or emphasize main ideas.
- Providing support or scaffolding for the number of steps and/or operations in a multi-step item such as adding sub-questions or steps to break up or help students think through multi-step problems/items.
- Adding additional directions to explain a process or activity. - Adding pre-reading information to clarify the purpose of a passage or prompt. - Embedding a formula (as appropriate for intention of the assessed standard).
General Guidelines for Revising and/or Enhancing PSSA-M Items Guidelines for revising and/or enhancing PSSA- M items will include, but will not be limited to, those listed below. While many of these guidelines are common “best practices” and are included in guidelines for writing, reviewing, and revising items for the PSSA, further revisions and/or enhancements may apply.
Context Context helps make language that is reflective of abstract/highly-generalized situations more concrete and relevant in order to ground the content being tested. Context that facilitates access includes the following: • Concrete language • Illustrative language • Illustration/graphic
Graphics: Best Practices for the PSSA and the PSSA-M (Note: With graphics, the visual discrimination and visual processing challenges of students are considered).
• Graphic and labeling/naming conventions should be consistent. • Graphics should support students’ understanding of assessed content. • Graphics should clarify (1) key aspects of the content/construct assessed and/or (2)
what the student is expected to do (graphics used should be purposeful). • Graphics should support context without requiring additional language (and may
reinforce what is in the text of the item). • Graphics should help students shift from one context to another within an assessment
(e.g., from one type of item to another). • Graphics should allow students to verify understanding of key elements of the text of
the item.
Appendix D: Item and Test Development Process
2012 PSSA-M Technical Report D-8

• Graphics should allow representation of key elements of the problem (necessary information; construct-relevant) so that this information does not need to be presented in words. Consideration: How central is the information in the graphic to the construct? For example, if the graphic helps clarify construct-irrelevant information, then it may not be necessary—perhaps it would be better to alter the construct-irrelevant information. But, if the graphic helps to clarify the context or content that is construct-relevant or an operation related to the construct, then it may be necessary; otherwise, the graphic may be misleading or distracting. Note: Certain graphics are required/assessed in mathematics and science. Consideration: Can the graphic accurately represent the complexity of the problem in its totality? If not, then the graphic may be misleading. If the problem has a number of operations/steps, then it is important to
simplify structures of the item (e.g., bulleted list with context or a graphic/ diagram that accurately reflects the problem in its totality).
Graphics should allow for reduction of language and/or complexity of language.
A graphic needs to be consistent with the key elements of the item. Intervals (e.g., on number lines) should be consistent/equal.
Graphics: Additional Considerations for the PSSA-M
• Adding graphic organizers as enhancements: Graphic organizers (e.g., Venn diagram for compare and contrast, timelines, story maps)
• Altering a graphic or adding or expanding a graphic to duplicate text-described context (e.g., the stem in the unaltered item may refer to the weight of a car; for the altered version, a graphic showing a car with the weight written on or near it may be included. The graphic should reinforce or clarify the text, not replace it. The text should be removed and replaced with a graphic only in exceptionally rare and unique instances.)
• Adding a graphic to illustrate a term • Adding a support that provides a visual representation for helping students determine
a solution to a problem (adding a blank grid or a blank number chart) Item Sentence Structure: Best Practices for the PSSA and the PSSA-M (Note: The closed stem format is preferable to the open-stem format as the closed stem helps to reduce the retention load of content for the student as the student formulates the answer to a given question.)
• Referents should be clear; noun-pronoun relationships should be clear; antecedent references should be clear.
• Grammatical structures should be clear. Typically, - past or future-tense verb forms are changed to present tense, - passive verb forms are changed to active verb forms, - complex structures are changed to subject-verb-object structures, - long nominals/names/phrases are shortened (e.g., “last year’s class vice
president” becomes “a student leader”),
Appendix D: Item and Test Development Process
2012 PSSA-M Technical Report D-9

- compound sentences are replaced with two separate sentences, especially in comparative structures,
- long prepositional phrases are reduced or removed, - conditional clauses are replaced with separate sentences or the ordering of
clauses within a sentence is changed for clarity, and - relative clauses are removed or rephrased for clarity.
• Questions framed in negative terms are rephrased. • Changing tense may help remove passive-voice construction. • Identifying the agent (e.g., proper noun) helps remove passive voice construction. • The verb should follow the subject (subject and verb should be adjacent to each other)
—use common construction. • One sentence per idea for each complex item helps reduce inappropriate complexity
of sentence structure (e.g., could use bulleted lists). • Introductory phrases are removed (e.g., last week)—unless necessary for the item. • Key information is presented up front (first/early in item) and typically in simple
sentence structure. • Proper nouns should be ones that are familiar to students. • Complexity of sentence structure should be at or below grade level (depends on
intention of assessed standard). • Traditional constructions should be used—e.g., _’s for possessive; _s or _es for
plural. Vocabulary/Wording: Best Practices for the PSSA and the PSSA-M
Use words/phrases consistently within the context of the item—(also consider consistency within a strand—e.g., reading, measurement). • Support with context-familiar content-based abbreviations; make explicit connections
between terms/abbreviations. • Avoid words that are both nouns and verbs (e.g., race, value, cost); however, if a
choice needs to be made, then the tendency is to use the word as a noun. • Avoid hyphenated and compound words.
Consideration: Balance the amount and complexity of language with the amount of information necessary for the student to understand/access the item (economy of language with meaning—purposeful use of language).
• Relative pronouns (e.g., which) should have a referent (e.g., which expression, which adjective). Note: This is preferable, but may not always be possible for a given content area or at a given grade level within a content area.
• Use construct-irrelevant vocabulary/phrases that are at or below grade level.
Vocabulary/Wording: Additional Considerations for the PSSA-M • Repeat key words/phrases needed by the student to understand and respond to the
item—providing synonyms for a key word may not always be helpful, given length and/or context of item; sometimes repeating the same key word is more appropriate (keep in mind the difference between instructional and assessment settings).
Appendix D: Item and Test Development Process
2012 PSSA-M Technical Report D-10

Appendix E:
PSSA-M Item Review Cards


Appendix E: PSSA-M Item Review Cards
2011 PSSA-M Technical Report E-1
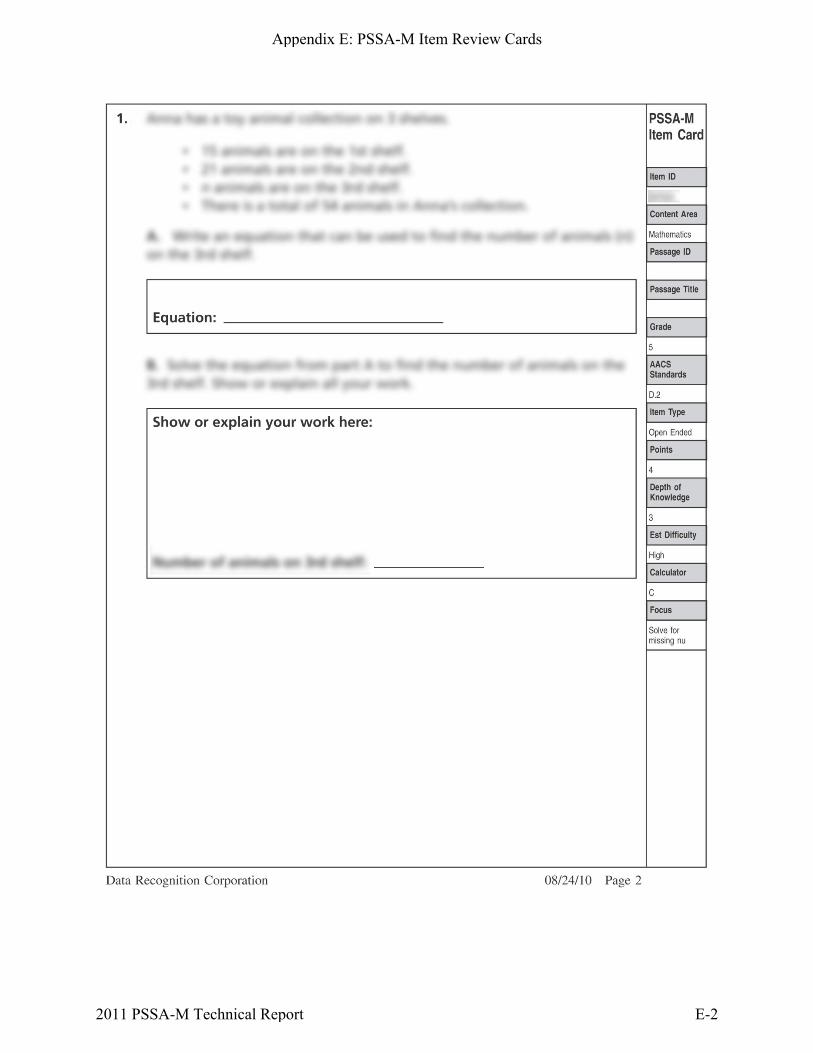
Appendix E: PSSA-M Item Review Cards
2011 PSSA-M Technical Report E-2

Appendix E: PSSA-M Item Review Cards
2011 PSSA-M Technical Report E-3

Appendix E: PSSA-M Item Review Cards
2011 PSSA-M Technical Report E-4

Appendix E: PSSA-M Item Review Cards
2011 PSSA-M Technical Report E-5

Appendix E: PSSA-M Item Review Cards
2011 PSSA-M Technical Report E-6

Appendix F:
Item Rating Sheet and Item Review Criteria Guidelines


Item Rating Sheet Reviewer Signature:
Content Area: Grade:
Content
Alignment Rigor Level Alignment Technical Design Universal Design STATUS
Standards Grade Difficulty
Depth of Knowledge
Source of Challenge
Correct Answer
Distractors GraphicsLanguage Demand
Bias Acceptance Status
Unique ID number
—Higher —Lower —None
—Above —At —Below
—Hard —Medium—Easy
—Recall —Application —Strategic Thinking
—Yes —No
—Yes —No
—Yes —No
—Yes —No
—Yes —No
—Yes —No
— Approved as is — Accepted with suggested revisions — Dissenting View
Appendix F: Item Rating Sheet and Item Review Criteria Guidelines
2012 PSSA-M Technical Report F-1

Item Review Criteria Guidelines
The purpose of this form is to provide guidelines to the item review process in terms of item characteristics that are essential in building a fair and balanced assessment. Use these guidelines in conjunction with the Item Rating Sheet when recording your feedback on individual items.
Content Alignment Options Standards, Anchors, Eligible Content
Does the content of the item align with the Standard/Anchor/Eligible Content? Each item was written to assess a particular Standard/Anchor/ Eligible Content statement which is indicated on the individual Item Card. Consider the degree to which the item is, in fact, aligned with the indicated eligible content. In making this judgment, it is important to consider whether the content is aligned (e.g., do the eligible content and the item both deal with fractions) and whether the required performance is aligned (e.g., if the eligible content calls for a comparison to be made, is this reflected in the item).
HIGHER—Aligns to the higher level of the EC LOWER—Aligns to the lower level of the EC NONE—No alignment with EC
Rigor Level Alignment Options Grade Is the item grade-level appropriate? Is the content consistent with the experiences of a student at the grade
level assessed? Is the challenge level appropriate for the grade? ABOVE Grade Level AT Grade Level BELOW Grade Level
Difficulty Do you agree with the item’s difficulty rating? Item Difficulty is indicated as Easy, Medium, and Hard. Is your rating in agreement with the difficulty rating on the Item Form?
HARD MEDIUM EASY
Depth of Knowledge
Depth of Knowledge is based on the alignment work of Norman Webb. Rate each item based on the cognitive demand, using the following levels:
1. Recall – Recall of a fact, information, or procedure. 2. Basic Application of Skill or Concept – Use of information, conceptual knowledge, procedures, two or
more steps, etc. 3. Strategic Thinking – Requires reasoning, developing a plan or sequence of steps; has some complexity;
more than one possible answer. 4. Extended Thinking – Requires an investigation, time to think and process multiple conditions of the
problem or task, and more than 10 minutes to do non-routine manipulations. (This level is generally not assessed in on-demand assessments.)
4 = Extended Thinking 3 = Strategic Thinking 2 = Basic Application 1 = Recall
Appendix F: Item Rating Sheet and Item Review Criteria Guidelines
2012 PSSA-M Technical Report F-2
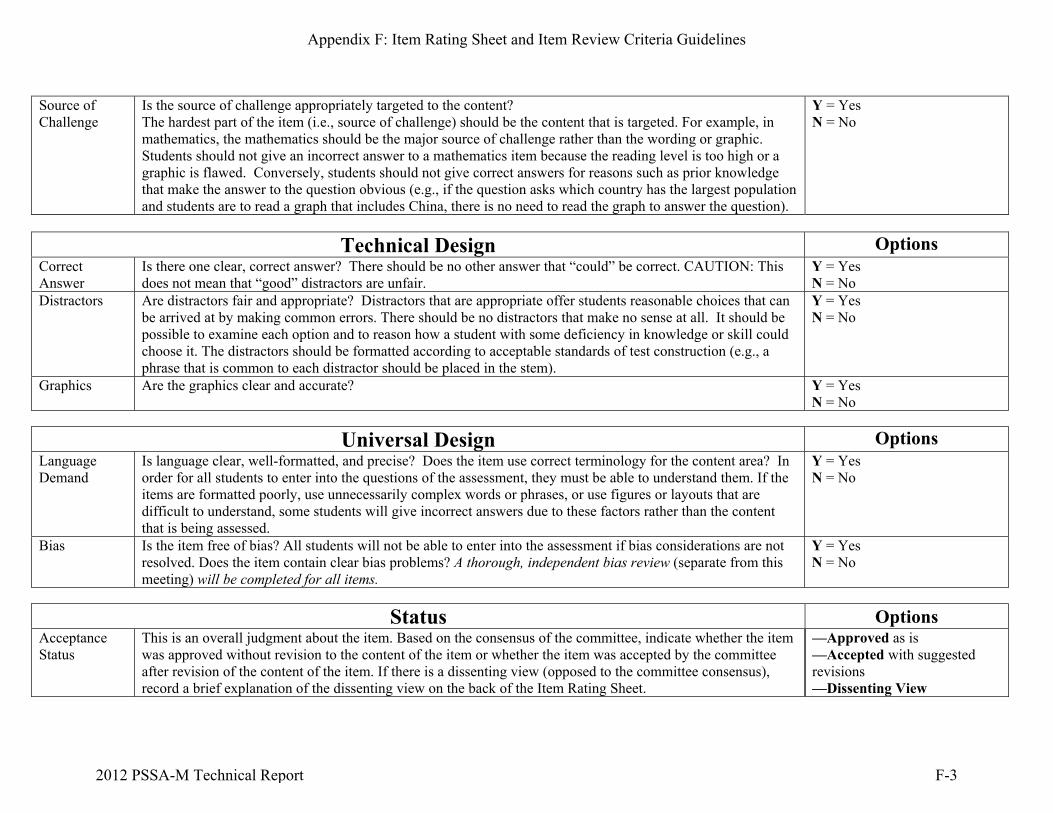
Source of Challenge
Is the source of challenge appropriately targeted to the content? The hardest part of the item (i.e., source of challenge) should be the content that is targeted. For example, in mathematics, the mathematics should be the major source of challenge rather than the wording or graphic. Students should not give an incorrect answer to a mathematics item because the reading level is too high or a graphic is flawed. Conversely, students should not give correct answers for reasons such as prior knowledge that make the answer to the question obvious (e.g., if the question asks which country has the largest population and students are to read a graph that includes China, there is no need to read the graph to answer the question).
Y = Yes N = No
Technical Design Options Correct Answer
Is there one clear, correct answer? There should be no other answer that “could” be correct. CAUTION: This does not mean that “good” distractors are unfair.
Y = Yes N = No
Distractors Are distractors fair and appropriate? Distractors that are appropriate offer students reasonable choices that can be arrived at by making common errors. There should be no distractors that make no sense at all. It should be possible to examine each option and to reason how a student with some deficiency in knowledge or skill could choose it. The distractors should be formatted according to acceptable standards of test construction (e.g., a phrase that is common to each distractor should be placed in the stem).
Y = Yes N = No
Graphics Are the graphics clear and accurate? Y = Yes N = No
Universal Design Options
Language Demand
Is language clear, well-formatted, and precise? Does the item use correct terminology for the content area? In order for all students to enter into the questions of the assessment, they must be able to understand them. If the items are formatted poorly, use unnecessarily complex words or phrases, or use figures or layouts that are difficult to understand, some students will give incorrect answers due to these factors rather than the content that is being assessed.
Y = Yes N = No
Bias Is the item free of bias? All students will not be able to enter into the assessment if bias considerations are not resolved. Does the item contain clear bias problems? A thorough, independent bias review (separate from this meeting) will be completed for all items.
Y = Yes N = No
Status Options Acceptance Status
This is an overall judgment about the item. Based on the consensus of the committee, indicate whether the item was approved without revision to the content of the item or whether the item was accepted by the committee after revision of the content of the item. If there is a dissenting view (opposed to the committee consensus), record a brief explanation of the dissenting view on the back of the Item Rating Sheet.
—Approved as is —Accepted with suggested revisions —Dissenting View
Appendix F: Item Rating Sheet and Item Review Criteria Guidelines
2012 PSSA-M Technical Report F-3

NOTES: - If you leave a box blank on the Item Rating Sheet, it will be recorded to indicate that you did not have any
specific feedback for that item or issue. - If you object to the consensus of the committee, please note this on the item rating sheet and then record a brief
explanation of the dissenting view on the back of the Item Rating Sheet. - Do NOT remove any items from the item binder at any time. - You must sign your Item Rating Sheet.
Appendix F: Item Rating Sheet and Item Review Criteria Guidelines
2012 PSSA-M Technical Report F-4

Appendix G:
2012 Test Book Section Layout Plans


2012 Modified Mathematics Test Book Section Layout for Grades 4 – 8 & 11
Mathematics Core Core/common MC items 30 2 core 4 pt OE items 8 Total 38 points
The estimated testing time for mathematics is approximately 100-120 minutes. [Timing assumes 10 min per OE and 3 min per MC.]
Section Content Number of
MC MC Item Breakdown
Number of OE
OE Item Breakdown Section Time (in minutes)
1 Mathematics 15 15–common (core) items 1 1–common (core) item 50�60
2 Mathematics 15 15–common (core) items 1 1–common (core) item 50�60
Notes: 1) There is 1 form. 2) The ruler items may fall in Sections 1 or 2. 3) All items in the PSSA-M mathematics test allow for calculator use.
Appendix G: 2012 Test Book Section Layout Plans
2012 PSSA-M Technical Report G-1

2012 Modified Reading Test Book Section Layout for Grades 4, 5, 7, 8 & 11
Reading Core Core/common MC items 30 2 core 3 pt OE items 6 Total 36 points
The estimated testing time for reading is approximately 100-120 minutes. [Timing assumes 10 min per OE and 3 min per MC.]
Section Content Number of
MC MC Item Breakdown
Number of OE
OE Item Breakdown Section Time (in minutes)
1 Reading 18 18–common (core) items 1 1–common (core) item 60�70
2 Reading 12 12–common (core) items 1 1–common (core) item 40�50
Appendix G: 2012 Test Book Section Layout Plans
2012 PSSA-M Technical Report G-2

2012 Modified Reading Test Book Section Layout for Grade 6
Reading Core Core/common MC items 30 2 core 3 pt OE items 6 Total 36 points
The estimated testing time for reading is approximately 100-120 minutes. [Timing assumes 10 min per OE and 3 min per MC.]
Section Content Number of
MC MC Item Breakdown
Number of OE
OE Item Breakdown Section Time (in minutes)
1 Reading 19 19–common (core) items 1 1–common (core) item 60�70
2 Reading 11 11–common (core) items 1 1–common (core) item 40�50
Appendix G: 2012 Test Book Section Layout Plans
2012 PSSA-M Technical Report G-3

2012 Modified Science Test Book Section Layout for Grades 8 & 11
Science Core Core/common MC items 30 2 core 2 pt OE items 4 Total 34 points
The estimated testing time for science is approximately 60-80 minutes. [Timing assumes 5 min per OE and 2 min per MC.]
Section Content Number of
MC MC Item Breakdown
Number of OE
OE Item Breakdown Section Time (in minutes)
1 Science 15 15–common (core) items 1 1–common (core) item 30�40
2 Science 15 15–common (core) items 1 1–common (core) item 30�40
Appendix G: 2012 Test Book Section Layout Plans
2012 PSSA-M Technical Report G-4

Appendix H:
Mean Raw Scores by Form
Column Heading Definition
Form Form N N students L Length Pts Points possible Min Minimum Max Maximum Mean Mean Med Median SD Standard deviation


Form N L Pts Min Max Mean Med SD
4 0 2708 32 38 3 38 21.0 21.0 6.515 0 3726 32 38 2 38 20.2 20.0 6.346 0 4061 32 38 2 38 17.2 17.0 5.727 0 4283 32 38 2 37 18.0 18.0 6.788 0 4444 32 38 1 38 18.3 18.0 6.3411 0 4606 32 38 1 37 16.6 16.0 6.294 0 3711 32 36 1 35 17.4 17.0 6.715 0 4672 32 36 2 36 19.8 20.0 7.376 0 4543 32 36 3 36 20.3 21.0 6.827 0 4570 32 36 1 36 19.2 19.0 6.828 0 4308 32 36 3 35 20.0 20.0 6.2111 0 4255 32 36 1 36 22.2 23.0 6.448 0 3554 32 34 4 33 20.1 21.0 5.7811 0 3742 32 34 3 33 17.1 17.0 6.50
Mat
hem
atic
sR
ead
ing
Sci
.
Appendix H: Mean Raw Scores by Form
2012 PSSA-M Technical Report H-1

Appendix H: Mean Raw Scores by Form
2012 PSSA-M Technical Report H-2

Appendix I:
Item Statistics
Column Heading Definition
PubID Public ID Std Standard DOK Depth of knowledge N N PVal P-Value P( ) Proportion selecting given response (-=blank) PtBis Point biserial PT( ) Point biserial of repsonse Meas Rasch item measure MeasSE Rasch item measure standard error t t fit statistic MS Mean square fit statistic


Cont Grade PubID Std DOK N PVal P(A) P(B) P(C) P(D) P(-) PtBis PT(A) PT(B) PT(C) PT(D) Meas MeasSE t MS t MSMath 4 0633 E.3.1.1 2 2707 0.87 0.03 0.02 0.87 0.07 0.00 0.22 -0.17 -0.14 0.22 -0.08 -1.4874 0.0745 1.3 1.1 2.1 1.2Math 4 0688 A.1.2.2 1 2707 0.55 0.24 0.09 0.12 0.55 0.00 0.32 -0.15 -0.17 -0.13 0.32 0.5382 0.0471 0.8 1.0 0.1 1.0Math 4 0767 A.2.1.2 2 2707 0.64 0.07 0.64 0.06 0.23 0.00 0.40 -0.23 0.40 -0.20 -0.20 -0.0594 0.0508 -2.3 0.9 -2.7 0.9Math 4 0914 D.1.1.3 2 2707 0.36 0.20 0.31 0.12 0.36 0.00 0.28 -0.11 -0.13 -0.09 0.28 1.4888 0.0468 0.6 1.0 2.0 1.1Math 4 0988 A.1.3.1 1 2707 0.44 0.10 0.37 0.08 0.44 0.00 0.28 -0.09 -0.22 -0.02 0.28 1.1137 0.0461 1.3 1.0 1.7 1.0Math 4 1114 E.1.2.2 1 2707 0.88 0.07 0.88 0.03 0.02 0.00 0.44 -0.34 0.44 -0.20 -0.15 -1.7097 0.0807 -2.3 0.9 -4.5 0.6Math 4 1567 C.3.1.1 1 2707 0.64 0.07 0.64 0.07 0.22 0.00 0.31 -0.24 0.31 -0.17 -0.10 0.2294 0.0486 5.8 1.1 6.8 1.3Math 4 1586 E.1.1.1 2 2707 0.53 0.53 0.09 0.19 0.19 0.00 0.47 0.47 -0.07 -0.21 -0.33 0.5150 0.0472 -5.0 0.9 -4.7 0.9Math 4 1700 D.1.1.2 2 2707 0.65 0.65 0.09 0.07 0.19 0.00 0.35 0.35 -0.31 -0.08 -0.14 0.1626 0.0491 -1.4 1.0 -2.1 0.9Math 4 2116 E.1.2.1 1 2707 0.84 0.08 0.84 0.05 0.04 0.00 0.44 -0.31 0.44 -0.20 -0.20 -1.3155 0.0702 -2.5 0.9 -3.8 0.7Math 4 2133 E.1.1.1 1 2707 0.83 0.04 0.05 0.83 0.09 0.00 0.39 -0.18 -0.17 0.39 -0.27 -1.3053 0.0700 -2.0 0.9 -2.4 0.8Math 4 2807 A.1.1.2 1 2707 0.65 0.32 0.65 0.01 0.03 0.00 0.33 -0.26 0.33 -0.09 -0.18 0.1173 0.0494 -0.2 1.0 -0.1 1.0Math 4 3099 A.1.1.2 1 2707 0.48 0.03 0.48 0.35 0.13 0.00 0.24 -0.17 0.24 -0.15 -0.06 0.7251 0.0465 6.0 1.1 5.2 1.1Math 4 3232 A.1.3.2 1 2707 0.37 0.32 0.11 0.37 0.20 0.00 0.41 -0.22 -0.08 0.41 -0.18 1.3200 0.0464 -4.9 0.9 -3.5 0.9Math 4 3577 A.1.1.1 1 2707 0.81 0.12 0.01 0.81 0.06 0.00 0.22 -0.15 -0.08 0.22 -0.12 -0.9424 0.0625 1.2 1.1 2.6 1.2Math 4 3981 D.1.1.1 2 2707 0.92 0.05 0.01 0.92 0.02 0.00 0.24 -0.14 -0.11 0.24 -0.15 -1.8584 0.0854 -0.3 1.0 -1.6 0.8Math 4 3993 C.1.2.2 2707 0.78 0.08 0.06 0.07 0.78 0.00 0.30 -0.20 -0.16 -0.12 0.30 -0.5233 0.0559 1.1 1.0 1.3 1.1Math 4 4004 A.1.1.3 1 2707 0.42 0.11 0.42 0.17 0.30 0.00 0.32 -0.10 0.32 -0.03 -0.26 1.2120 0.0462 1.5 1.0 2.4 1.1Math 4 4652 D.2.2.1 1 2707 0.80 0.06 0.80 0.04 0.11 0.00 0.39 -0.21 0.39 -0.14 -0.25 -0.8069 0.0601 -2.5 0.9 -3.4 0.8Math 4 4859 B.2.2.1 1 2707 0.49 0.21 0.19 0.10 0.49 0.00 0.26 -0.06 -0.29 0.02 0.26 0.7319 0.0465 1.2 1.0 1.3 1.0Math 4 5197 C.1.2.1 1 2707 0.83 0.02 0.07 0.83 0.07 0.00 0.23 -0.14 -0.13 0.23 -0.11 -1.0589 0.0647 0.9 1.0 2.0 1.2Math 4 5836 A.3.1.1 1 2707 0.53 0.14 0.20 0.53 0.13 0.01 0.34 -0.09 -0.18 0.34 -0.19 0.7971 0.0463 0.1 1.0 -0.3 1.0Math 4 6052 D.2.2.2 1 2707 0.90 0.02 0.05 0.02 0.90 0.01 0.32 -0.16 -0.21 -0.15 0.32 -1.7437 0.0817 -1.1 0.9 -2.3 0.8Math 4 6320 A.2.1.2 2 2707 0.74 0.07 0.11 0.74 0.08 0.00 0.38 -0.22 -0.14 0.38 -0.24 -0.6429 0.0576 -1.8 0.9 -0.7 1.0Math 4 6706 C.1.1.1 1 2707 0.55 0.08 0.09 0.27 0.55 0.00 0.27 -0.14 -0.15 -0.12 0.27 0.5289 0.0471 2.2 1.0 2.3 1.1Math 4 8463 A.1.2.1 1 2707 0.33 0.28 0.33 0.33 0.06 0.00 0.34 -0.23 -0.04 0.34 -0.15 1.5864 0.0472 1.6 1.0 3.7 1.1Math 4 8841 A.1.1.4 1 2707 0.44 0.30 0.14 0.44 0.11 0.00 0.36 -0.23 -0.05 0.36 -0.17 1.0536 0.0461 -0.3 1.0 0.6 1.0Math 4 9421 C.2.1.1 1 2707 0.78 0.78 0.08 0.09 0.05 0.00 0.26 0.26 -0.17 -0.13 -0.12 -0.7483 0.0592 0.5 1.0 1.3 1.1Math 4 9455 A.3.1.2 1 2707 0.39 0.18 0.21 0.22 0.39 0.00 0.18 -0.07 0.03 -0.17 0.18 1.4911 0.0469 2.8 1.1 3.7 1.1Math 4 9806 A.3.2.2 1 2707 0.56 0.26 0.11 0.56 0.06 0.00 0.30 -0.09 -0.22 0.30 -0.17 0.5910 0.0469 3.1 1.1 2.5 1.1Math 5 0036 A.1.3.3 3724 0.26 0.26 0.09 0.51 0.14 0.00 0.17 0.17 -0.07 0.00 -0.16 1.9581 0.0467 2.2 1.1 4.6 1.2Math 5 0254 C.2.1.1 3724 0.75 0.04 0.12 0.75 0.08 0.00 0.31 -0.13 -0.20 0.31 -0.15 -0.6867 0.0511 -0.2 1.0 0.6 1.0Math 5 0652 A.1.5.1 3724 0.73 0.14 0.73 0.09 0.05 0.00 0.29 -0.15 0.29 -0.17 -0.14 -0.4297 0.0482 0.9 1.0 0.3 1.0Math 5 1106 D.2.1.1 3724 0.77 0.77 0.06 0.07 0.09 0.00 0.41 0.41 -0.18 -0.26 -0.22 -0.9803 0.0553 -2.9 0.9 -4.2 0.8Math 5 1579 A.1.6.1 1 3724 0.27 0.27 0.20 0.25 0.27 0.00 0.06 0.06 -0.07 0.06 -0.06 1.9718 0.0469 7.5 1.2 9.9 1.5Math 5 1844 B.1.1.1 3724 0.68 0.13 0.08 0.11 0.68 0.00 0.19 -0.06 -0.13 -0.10 0.19 -0.3051 0.0470 3.0 1.1 2.1 1.1Math 5 2104 B.2.2.3 3724 0.75 0.05 0.75 0.03 0.17 0.00 0.41 -0.24 0.41 -0.17 -0.26 -0.8497 0.0533 -3.1 0.9 -4.1 0.8Math 5 2152 A.1.4.2 1 3724 0.51 0.15 0.03 0.51 0.31 0.00 0.25 -0.20 -0.10 0.25 -0.08 0.6908 0.0422 2.6 1.0 2.8 1.1Math 5 2185 D.2.1.2 1 3724 0.63 0.22 0.63 0.12 0.03 0.00 0.31 -0.20 0.31 -0.14 -0.10 0.0641 0.0443 -0.7 1.0 -1.3 1.0Math 5 2789 E.2.1.1 1 3724 0.34 0.12 0.40 0.34 0.13 0.00 0.31 -0.16 -0.04 0.31 -0.22 1.4489 0.0435 -0.6 1.0 -0.3 1.0Math 5 3144 A.1.3.1 3724 0.65 0.08 0.21 0.65 0.06 0.00 0.39 -0.23 -0.20 0.39 -0.19 -0.0906 0.0453 -2.9 0.9 -2.5 0.9
Item Information Classical Infit OutfitRasch
Appendix I: Item Statistics Multiple Choice
2012 PSSA-M Technical Report I-1

Cont Grade PubID Std DOK N PVal P(A) P(B) P(C) P(D) P(-) PtBis PT(A) PT(B) PT(C) PT(D) Meas MeasSE t MS t MSItem Information Classical Infit OutfitRasch
Math 5 3303 B.2.2.2 3724 0.52 0.19 0.04 0.26 0.52 0.00 0.30 -0.30 -0.17 0.00 0.30 0.4688 0.0426 -0.9 1.0 -0.9 1.0Math 5 3904 A.1.5.1 3724 0.97 0.01 0.01 0.97 0.01 0.00 0.20 -0.12 -0.11 0.20 -0.13 -3.4765 0.1527 -0.1 1.0 -2.3 0.5Math 5 4144 A.1.6.2 3724 0.60 0.60 0.25 0.09 0.05 0.00 0.34 0.34 -0.22 -0.14 -0.13 0.2367 0.0434 -1.4 1.0 -1.9 1.0Math 5 4523 B.2.1.1 3724 0.61 0.20 0.61 0.10 0.08 0.00 0.22 -0.07 0.22 -0.16 -0.12 0.1008 0.0441 3.8 1.1 3.1 1.1Math 5 6202 A.1.2.1 3724 0.65 0.06 0.27 0.65 0.02 0.00 0.21 -0.15 -0.11 0.21 -0.10 0.1008 0.0441 4.2 1.1 4.7 1.2Math 5 6831 A.1.4.1 3724 0.75 0.75 0.16 0.03 0.06 0.00 0.35 0.35 -0.23 -0.14 -0.18 -0.6598 0.0508 -1.8 1.0 -1.9 0.9Math 5 6877 E.2.1.2 1 3724 0.73 0.73 0.06 0.09 0.13 0.00 0.35 0.35 -0.18 -0.16 -0.21 -0.4081 0.0480 -0.8 1.0 -0.7 1.0Math 5 7018 A.1.1.1 3724 0.69 0.07 0.21 0.69 0.03 0.00 0.39 -0.21 -0.25 0.39 -0.17 -0.2596 0.0466 -2.9 0.9 -3.4 0.9Math 5 7079 A.3.1.1 3724 0.48 0.48 0.24 0.15 0.13 0.00 0.26 0.26 -0.17 -0.07 -0.10 0.8437 0.0421 1.8 1.0 1.8 1.0Math 5 7585 C.1.1.1 3724 0.85 0.05 0.02 0.85 0.08 0.00 0.26 -0.17 -0.11 0.26 -0.15 -1.3173 0.0613 0.0 1.0 0.1 1.0Math 5 7852 B.1.2.1 3724 0.48 0.13 0.27 0.12 0.48 0.00 0.46 -0.24 -0.21 -0.17 0.46 0.5934 0.0423 -9.2 0.9 -7.8 0.8Math 5 8181 A.1.2.2 1 3724 0.59 0.21 0.59 0.09 0.11 0.00 0.40 -0.25 0.40 -0.14 -0.18 0.2170 0.0435 -2.8 1.0 -2.3 0.9Math 5 8366 A.3.1.2 3724 0.24 0.16 0.24 0.19 0.41 0.00 0.15 -0.12 0.15 -0.09 0.02 1.8285 0.0457 1.9 1.0 3.7 1.1Math 5 8555 E.3.1.1 3724 0.78 0.04 0.78 0.13 0.05 0.00 0.32 -0.14 0.32 -0.26 -0.09 -0.8674 0.0536 -0.8 1.0 0.6 1.0Math 5 8795 C.2.1.1 3724 0.61 0.61 0.07 0.20 0.11 0.00 0.35 0.35 -0.15 -0.16 -0.22 0.0374 0.0445 -1.1 1.0 -1.4 1.0Math 5 8871 E.3.1.2 3724 0.56 0.18 0.18 0.56 0.09 0.00 0.29 -0.12 -0.16 0.29 -0.12 0.4402 0.0427 0.2 1.0 -0.1 1.0Math 5 9138 C.1.2.1 1 3724 0.58 0.22 0.03 0.16 0.58 0.00 0.26 -0.20 -0.10 -0.06 0.26 0.3519 0.0430 4.0 1.1 4.5 1.1Math 5 9351 E.1.1.1 3724 0.85 0.02 0.02 0.85 0.11 0.00 0.34 -0.11 -0.10 0.34 -0.29 -1.7559 0.0717 -1.0 1.0 -1.4 0.9Math 5 9595 C.2.1.2 3724 0.48 0.06 0.48 0.21 0.25 0.00 0.34 -0.04 0.34 -0.10 -0.27 0.7338 0.0422 1.1 1.0 1.9 1.0Math 6 1624 A.1.3.1 4052 0.48 0.26 0.09 0.48 0.17 0.00 0.20 0.05 -0.07 0.20 -0.27 0.1428 0.0407 5.2 1.1 4.4 1.1Math 6 1715 A.1.3.2 1 4052 0.45 0.25 0.23 0.45 0.07 0.00 0.23 -0.14 -0.05 0.23 -0.14 0.4502 0.0408 2.7 1.0 2.9 1.1Math 6 2037 D.2.1.2 4052 0.32 0.34 0.23 0.11 0.32 0.00 0.30 0.05 -0.20 -0.25 0.30 1.1078 0.0434 0.4 1.0 1.2 1.0Math 6 2547 C.1.1.2 4052 0.62 0.18 0.62 0.08 0.11 0.00 0.27 -0.19 0.27 -0.18 -0.02 -0.3656 0.0420 0.2 1.0 -0.5 1.0Math 6 3044 B.1.1.1 4052 0.32 0.26 0.32 0.33 0.09 0.00 0.18 -0.12 0.18 -0.03 -0.06 0.8922 0.0422 3.4 1.1 4.0 1.1Math 6 3048 D.1.1.1 4052 0.43 0.33 0.43 0.16 0.09 0.00 0.27 -0.14 0.27 -0.11 -0.10 0.4193 0.0408 -2.1 1.0 -1.6 1.0Math 6 3252 A.1.1.4 4052 0.48 0.12 0.48 0.09 0.32 0.00 0.46 -0.11 0.46 -0.12 -0.35 0.1957 0.0407 -9.8 0.9 -8.4 0.9Math 6 3340 B.2.1.1 1 4052 0.49 0.49 0.25 0.09 0.17 0.00 0.22 0.22 -0.16 -0.09 -0.05 0.2417 0.0407 4.2 1.1 3.8 1.1Math 6 3403 D.1.2.1 1 4052 0.36 0.28 0.36 0.18 0.18 0.00 0.06 0.01 0.06 -0.03 -0.06 0.7526 0.0416 9.6 1.2 8.9 1.2Math 6 3775 E.3.1.2 4052 0.50 0.18 0.23 0.50 0.09 0.00 0.29 -0.14 -0.14 0.29 -0.10 0.0933 0.0407 -0.4 1.0 -0.4 1.0Math 6 4391 C.1.1.3 4052 0.43 0.20 0.43 0.13 0.24 0.00 0.25 -0.08 0.25 -0.23 -0.04 0.2945 0.0407 1.7 1.0 1.2 1.0Math 6 4621 C.1.1.1 1 4052 0.63 0.63 0.23 0.13 0.01 0.00 0.22 0.22 -0.13 -0.12 -0.10 -0.5857 0.0432 0.5 1.0 0.1 1.0Math 6 5517 B.2.1.3 4052 0.52 0.14 0.09 0.52 0.24 0.00 0.21 -0.04 -0.14 0.21 -0.12 -0.0529 0.0410 4.2 1.1 3.3 1.1Math 6 5687 A.1.1.1 4052 0.37 0.03 0.37 0.24 0.36 0.00 0.43 0.00 0.43 -0.26 -0.20 0.6270 0.0412 -9.6 0.9 -8.8 0.8Math 6 6763 D.1.2.1 4052 0.40 0.11 0.24 0.25 0.40 0.00 0.35 -0.16 -0.13 -0.15 0.35 0.4347 0.0408 -5.4 0.9 -4.9 0.9Math 6 7407 D.2.1.1 1 4052 0.46 0.46 0.31 0.15 0.08 0.00 0.28 0.28 -0.14 -0.09 -0.15 0.2928 0.0407 1.3 1.0 1.0 1.0Math 6 7479 E.1.1.1 4052 0.78 0.07 0.08 0.06 0.78 0.00 0.28 -0.15 -0.13 -0.17 0.28 -1.2961 0.0498 -1.0 1.0 -1.6 0.9Math 6 7610 C.1.1.4 4052 0.30 0.19 0.27 0.30 0.24 0.00 0.16 -0.04 -0.07 0.16 -0.06 1.1907 0.0440 2.5 1.1 3.4 1.1Math 6 7851 D.2.2.1 4052 0.26 0.26 0.27 0.40 0.06 0.00 0.13 0.13 -0.03 -0.07 -0.03 1.1947 0.0440 4.1 1.1 6.0 1.2Math 6 7924 A.2.1.1 4052 0.76 0.10 0.76 0.08 0.05 0.00 0.26 -0.15 0.26 -0.14 -0.11 -1.3507 0.0505 -0.3 1.0 0.2 1.0Math 6 8199 C.1.1.2 4052 0.33 0.21 0.32 0.14 0.33 0.00 0.19 0.07 -0.23 -0.03 0.19 0.8995 0.0422 6.5 1.1 6.7 1.2Math 6 8225 A.1.1.2 4052 0.38 0.33 0.38 0.13 0.16 0.00 0.28 -0.18 0.28 -0.10 -0.06 0.7741 0.0417 2.2 1.0 3.4 1.1
Appendix I: Item Statistics Multiple Choice
2012 PSSA-M Technical Report I-2

Cont Grade PubID Std DOK N PVal P(A) P(B) P(C) P(D) P(-) PtBis PT(A) PT(B) PT(C) PT(D) Meas MeasSE t MS t MSItem Information Classical Infit OutfitRasch
Math 6 8585 D.2.1.2 4052 0.75 0.04 0.06 0.75 0.14 0.01 0.36 -0.06 -0.20 0.36 -0.26 -1.2258 0.0489 -3.6 0.9 -3.8 0.8Math 6 8813 C.1.2.1 4052 0.70 0.70 0.11 0.13 0.05 0.00 0.29 0.29 -0.21 -0.05 -0.21 -0.7734 0.0445 -1.1 1.0 0.2 1.0Math 6 8818 A.1.1.3 4052 0.63 0.05 0.15 0.17 0.63 0.00 0.33 -0.20 -0.22 -0.10 0.33 -0.5513 0.0430 -3.4 0.9 -3.1 0.9Math 6 9009 C.3.1.1 4052 0.69 0.02 0.69 0.03 0.25 0.00 0.29 -0.17 0.29 -0.17 -0.18 -0.7856 0.0446 0.0 1.0 -0.4 1.0Math 6 9363 E.2.1.1 2 4052 0.32 0.15 0.32 0.21 0.32 0.00 0.27 -0.03 0.27 0.02 -0.26 0.8959 0.0422 0.4 1.0 1.0 1.0Math 6 9837 B.2.3.1 1 4052 0.70 0.70 0.15 0.12 0.03 0.00 0.35 0.35 -0.18 -0.22 -0.15 -0.8688 0.0453 -2.6 0.9 -1.7 0.9Math 6 9875 A.2.1.1 4052 0.58 0.21 0.13 0.58 0.07 0.00 0.35 -0.09 -0.21 0.35 -0.22 -0.3168 0.0418 -2.5 1.0 -2.0 1.0Math 6 9988 B.2.2.1 4052 0.93 0.03 0.93 0.02 0.02 0.00 0.27 -0.17 0.27 -0.15 -0.14 -2.7267 0.0816 -1.2 0.9 -3.2 0.7Math 7 0057 D.1.1.1 2 4276 0.56 0.02 0.56 0.20 0.21 0.00 0.24 -0.08 0.24 -0.10 -0.18 0.0385 0.0404 3.0 1.0 1.8 1.0Math 7 0073 E.2.1.2 2 4276 0.52 0.15 0.16 0.52 0.16 0.00 0.29 -0.06 -0.17 0.29 -0.16 0.1179 0.0403 2.1 1.0 1.8 1.0Math 7 0140 A.2.2.6 2 4276 0.50 0.13 0.22 0.50 0.14 0.00 0.29 -0.12 -0.20 0.29 -0.06 0.0419 0.0404 0.3 1.0 0.6 1.0Math 7 0944 D.1.1.1 2 4276 0.29 0.38 0.17 0.15 0.29 0.00 0.23 0.01 -0.20 -0.10 0.23 1.0737 0.0421 4.8 1.1 5.4 1.2Math 7 1392 A.1.2.1 4276 0.54 0.27 0.09 0.10 0.54 0.00 0.44 -0.41 -0.04 -0.09 0.44 -0.0175 0.0405 -7.4 0.9 -6.8 0.9Math 7 2025 A.1.2.1 4276 0.48 0.19 0.19 0.14 0.48 0.00 0.45 -0.19 -0.22 -0.17 0.45 0.1868 0.0402 -6.5 0.9 -6.2 0.9Math 7 2055 D.3.1.1 2 4276 0.50 0.14 0.50 0.24 0.11 0.00 0.26 -0.22 0.26 -0.04 -0.12 0.1583 0.0402 2.8 1.0 2.0 1.0Math 7 2229 B.2.1.3 1 4276 0.53 0.16 0.53 0.07 0.23 0.00 0.31 -0.24 0.31 -0.15 -0.06 0.0943 0.0403 0.7 1.0 0.7 1.0Math 7 2395 E.3.1.1 2 4276 0.40 0.40 0.11 0.21 0.27 0.00 0.30 0.30 -0.09 -0.19 -0.10 0.6483 0.0405 0.4 1.0 0.5 1.0Math 7 2485 D.1.1.1 2 4276 0.58 0.13 0.25 0.58 0.04 0.00 0.14 -0.09 -0.03 0.14 -0.13 -0.0448 0.0406 8.2 1.1 6.8 1.2Math 7 2638 D.2.1.2 1 4276 0.53 0.21 0.22 0.53 0.04 0.00 0.43 -0.22 -0.25 0.43 -0.09 0.1801 0.0402 -6.1 0.9 -4.9 0.9Math 7 2708 A.1.1.1 4276 0.85 0.85 0.11 0.02 0.02 0.00 0.21 0.21 -0.20 -0.05 -0.03 -1.6574 0.0553 0.3 1.0 1.4 1.1Math 7 3026 A.3.2.2 1 4276 0.49 0.49 0.25 0.17 0.09 0.00 0.21 0.21 -0.21 0.01 -0.05 0.2706 0.0401 5.1 1.1 4.5 1.1Math 7 3039 E.2.1.1 1 4276 0.76 0.14 0.05 0.76 0.06 0.00 0.28 -0.19 -0.07 0.28 -0.18 -0.9248 0.0458 0.0 1.0 0.3 1.0Math 7 3108 D.2.1.1 1 4276 0.64 0.64 0.16 0.11 0.09 0.00 0.42 0.42 -0.20 -0.28 -0.13 -0.4671 0.0423 -6.9 0.9 -6.1 0.8Math 7 3681 E.4.1.1 1 4276 0.83 0.05 0.04 0.06 0.83 0.00 0.33 -0.17 -0.14 -0.22 0.33 -1.7379 0.0567 -1.9 0.9 -2.7 0.8Math 7 4540 B.2.2.1 2 4276 0.21 0.33 0.29 0.17 0.21 0.00 0.27 -0.26 0.08 -0.06 0.27 1.4522 0.0447 -0.7 1.0 -0.4 1.0Math 7 4589 C.3.1.2 1 4276 0.48 0.48 0.22 0.21 0.09 0.00 0.26 0.26 -0.09 -0.12 -0.15 0.3359 0.0401 2.7 1.0 2.6 1.1Math 7 4599 B.1.1.1 2 4276 0.48 0.09 0.48 0.13 0.30 0.00 0.30 -0.18 0.30 -0.22 -0.06 0.1549 0.0402 -1.0 1.0 -1.5 1.0Math 7 4737 C.1.1.2 1 4276 0.54 0.10 0.54 0.31 0.05 0.00 0.31 -0.08 0.31 -0.24 -0.09 -0.0704 0.0407 -0.4 1.0 -0.8 1.0Math 7 4822 D.2.2.1 2 4276 0.53 0.16 0.53 0.10 0.21 0.00 0.23 -0.13 0.23 -0.16 -0.04 0.0656 0.0403 4.6 1.1 4.4 1.1Math 7 5378 B.2.1.3 1 4276 0.41 0.14 0.41 0.41 0.04 0.00 0.35 -0.22 0.35 -0.16 -0.07 0.5767 0.0403 -1.0 1.0 0.6 1.0Math 7 5570 B.2.1.2 1 4276 0.53 0.31 0.53 0.12 0.04 0.00 0.26 -0.21 0.26 -0.03 -0.10 -0.0311 0.0406 2.8 1.0 2.1 1.0Math 7 5797 C.1.1.1 1 4276 0.47 0.47 0.17 0.19 0.18 0.00 0.36 0.36 -0.15 -0.17 -0.14 0.2119 0.0402 -1.4 1.0 -1.6 1.0Math 7 5844 E.1.1.1 1 4276 0.45 0.18 0.11 0.45 0.26 0.00 0.26 -0.06 -0.12 0.26 -0.15 0.4753 0.0402 1.6 1.0 2.3 1.1Math 7 6485 C.1.2.2 1 4276 0.55 0.55 0.15 0.10 0.19 0.00 0.36 0.36 -0.14 -0.10 -0.25 -0.0824 0.0407 -2.4 1.0 -2.6 0.9Math 7 6543 C.3.1.1 1 4276 0.64 0.64 0.27 0.05 0.05 0.00 0.37 0.37 -0.23 -0.16 -0.20 -0.2933 0.0414 -1.8 1.0 -1.7 1.0Math 7 8806 C.1.1.3 1 4276 0.80 0.09 0.05 0.06 0.80 0.00 0.32 -0.22 -0.15 -0.13 0.32 -1.3639 0.0508 -1.6 1.0 -1.1 1.0Math 7 9678 E.2.1.1 1 4276 0.70 0.15 0.70 0.09 0.05 0.00 0.33 -0.24 0.33 -0.08 -0.17 -0.6902 0.0438 -1.2 1.0 0.5 1.0Math 7 9757 C.1.2.1 1 4276 0.27 0.09 0.27 0.16 0.48 0.00 0.21 -0.06 0.21 -0.14 -0.04 1.2977 0.0435 3.5 1.1 4.8 1.2Math 8 0167 A.1.1.1 1 4440 0.64 0.02 0.64 0.16 0.18 0.00 0.41 -0.08 0.41 -0.20 -0.29 -0.3466 0.0400 -5.5 0.9 -5.3 0.9Math 8 0936 D.1.1.1 2 4440 0.37 0.12 0.12 0.37 0.39 0.00 0.24 -0.05 -0.05 0.24 -0.17 0.7749 0.0395 4.2 1.1 4.8 1.1Math 8 0970 E.1.1.2 2 4440 0.77 0.04 0.77 0.06 0.13 0.00 0.16 -0.03 0.16 -0.05 -0.15 -1.2504 0.0471 2.3 1.1 4.0 1.2
Appendix I: Item Statistics Multiple Choice
2012 PSSA-M Technical Report I-3

Cont Grade PubID Std DOK N PVal P(A) P(B) P(C) P(D) P(-) PtBis PT(A) PT(B) PT(C) PT(D) Meas MeasSE t MS t MSItem Information Classical Infit OutfitRasch
Math 8 1289 D.1.1.3 2 4440 0.42 0.19 0.19 0.42 0.19 0.00 0.33 -0.01 -0.15 0.33 -0.25 0.6720 0.0392 1.1 1.0 1.5 1.0Math 8 2407 B.1.1.1 1 4440 0.52 0.09 0.14 0.52 0.25 0.00 0.30 -0.14 -0.16 0.30 -0.12 0.1542 0.0387 1.8 1.0 1.9 1.0Math 8 2530 E.1.1.3 1 4440 0.78 0.04 0.78 0.11 0.06 0.00 0.29 -0.11 0.29 -0.15 -0.20 -1.2711 0.0473 -0.4 1.0 -1.1 1.0Math 8 2650 D.2.1.3 1 4440 0.27 0.46 0.27 0.13 0.14 0.00 0.19 -0.18 0.19 -0.04 0.07 1.5511 0.0444 2.6 1.1 3.5 1.1Math 8 3129 E.3.1.1 2 4440 0.51 0.12 0.29 0.08 0.51 0.00 0.39 -0.08 -0.29 -0.14 0.39 0.2347 0.0387 -3.3 1.0 -3.0 1.0Math 8 3229 A.3.3.1 2 4440 0.28 0.26 0.19 0.28 0.26 0.01 0.17 -0.06 -0.05 0.17 -0.07 1.2843 0.0422 5.1 1.1 6.5 1.2Math 8 3435 C.1.1.1 2 4440 0.52 0.15 0.05 0.27 0.52 0.00 0.31 -0.17 -0.09 -0.17 0.31 0.0984 0.0388 1.7 1.0 1.2 1.0Math 8 3599 B.2.1.1 1 4440 0.63 0.18 0.63 0.09 0.11 0.00 0.29 -0.23 0.29 -0.10 -0.09 -0.2828 0.0397 -0.7 1.0 -1.6 1.0Math 8 4404 D.2.1.3 1 4440 0.59 0.23 0.13 0.59 0.05 0.00 0.35 -0.20 -0.16 0.35 -0.15 -0.1145 0.0392 -4.3 0.9 -4.2 0.9Math 8 4773 D.1.1.1 2 4440 0.70 0.70 0.12 0.09 0.09 0.00 0.31 0.31 -0.11 -0.14 -0.22 -0.7595 0.0424 -1.7 1.0 -2.2 0.9Math 8 4802 B.2.2.2 1 4440 0.85 0.08 0.85 0.05 0.02 0.00 0.29 -0.22 0.29 -0.14 -0.09 -1.8432 0.0560 -1.0 1.0 -1.9 0.9Math 8 5304 E.4.1.1 1 4440 0.41 0.41 0.23 0.21 0.15 0.00 0.27 0.27 -0.11 -0.15 -0.07 0.7635 0.0395 1.5 1.0 2.5 1.1Math 8 5317 E.1.1.1 2 4440 0.58 0.14 0.58 0.13 0.15 0.00 0.31 -0.20 0.31 -0.18 -0.07 -0.1989 0.0394 0.7 1.0 0.3 1.0Math 8 6780 C.1.1.1 2 4440 0.70 0.02 0.16 0.12 0.70 0.00 0.23 -0.07 -0.16 -0.10 0.23 -0.7082 0.0420 2.3 1.0 3.0 1.1Math 8 7279 A.1.1.2 1 4440 0.74 0.04 0.15 0.07 0.74 0.00 0.41 -0.17 -0.21 -0.28 0.41 -0.9411 0.0439 -5.2 0.9 -5.6 0.8Math 8 7605 C.1.1.3 4440 0.39 0.14 0.36 0.39 0.11 0.00 0.26 -0.15 -0.06 0.26 -0.14 0.7619 0.0395 1.2 1.0 2.3 1.1Math 8 7811 A.2.1.1 1 4440 0.67 0.06 0.25 0.67 0.02 0.00 0.19 -0.15 -0.08 0.19 -0.11 -0.3830 0.0401 5.2 1.1 3.8 1.1Math 8 8214 C.3.1.1 1 4440 0.68 0.05 0.06 0.68 0.21 0.00 0.29 -0.18 -0.21 0.29 -0.11 -0.5749 0.0411 -0.6 1.0 0.5 1.0Math 8 8507 C.1.1.2 2 4440 0.49 0.08 0.13 0.49 0.30 0.00 0.27 -0.15 -0.17 0.27 -0.09 0.1728 0.0387 2.3 1.0 1.7 1.0Math 8 8600 C.1.2.1 2 4440 0.38 0.14 0.09 0.38 0.39 0.00 0.31 -0.14 -0.06 0.31 -0.18 0.7200 0.0393 -1.2 1.0 -0.2 1.0Math 8 8753 D.4.1.2 1 4440 0.51 0.25 0.12 0.11 0.51 0.00 0.24 -0.05 -0.17 -0.12 0.24 0.2316 0.0387 4.9 1.1 4.3 1.1Math 8 8754 E.1.1.3 1 4440 0.68 0.08 0.12 0.68 0.12 0.00 0.38 -0.13 -0.19 0.38 -0.24 -0.7010 0.0420 -4.7 0.9 -5.0 0.9Math 8 8821 B.2.1.2 1 4440 0.47 0.23 0.47 0.20 0.09 0.01 0.28 -0.13 0.28 -0.14 -0.10 0.3538 0.0387 2.7 1.0 2.6 1.1Math 8 8827 C.1.2.1 2 4440 0.32 0.20 0.32 0.12 0.36 0.00 0.27 -0.08 0.27 0.06 -0.23 1.0955 0.0410 2.3 1.0 3.4 1.1Math 8 8917 D.4.1.1 1 4440 0.49 0.49 0.15 0.16 0.19 0.00 0.36 0.36 -0.16 -0.15 -0.17 0.3802 0.0387 -1.2 1.0 -0.6 1.0Math 8 9782 B.1.1.2 1 4440 0.45 0.20 0.17 0.17 0.45 0.00 0.34 -0.15 -0.18 -0.11 0.34 0.4485 0.0388 -2.3 1.0 -1.9 1.0Math 8 9833 E.4.1.2 2 4440 0.59 0.08 0.29 0.59 0.04 0.00 0.41 -0.22 -0.27 0.41 -0.12 -0.3220 0.0399 -5.4 0.9 -4.3 0.9Math 11 0029 D.2.1.4 1 4603 0.48 0.13 0.19 0.20 0.48 0.00 0.33 -0.15 -0.13 -0.16 0.33 0.1646 0.0359 -0.7 1.0 -0.7 1.0Math 11 0990 C.1.1.2 1 4603 0.38 0.27 0.23 0.38 0.11 0.00 0.27 -0.11 -0.10 0.27 -0.13 0.6302 0.0367 1.5 1.0 1.7 1.0Math 11 1459 D.3.1.1 4603 0.34 0.19 0.34 0.20 0.27 0.00 0.23 0.10 0.23 -0.10 -0.24 0.6636 0.0368 2.0 1.0 2.1 1.0Math 11 1527 A.2.1.1 2 4603 0.46 0.16 0.21 0.46 0.17 0.00 0.24 0.06 -0.17 0.24 -0.19 0.1395 0.0359 7.2 1.1 6.4 1.1Math 11 1673 E.4.2.2 4603 0.50 0.10 0.22 0.50 0.18 0.00 0.33 -0.14 -0.25 0.33 -0.04 0.0471 0.0359 0.4 1.0 1.1 1.0Math 11 1859 D.2.2.2 4603 0.42 0.26 0.42 0.24 0.08 0.01 0.22 -0.04 0.22 -0.14 -0.12 0.3932 0.0361 4.6 1.1 4.7 1.1Math 11 1945 A.2.1.2 4603 0.47 0.07 0.24 0.47 0.21 0.00 0.35 -0.18 -0.22 0.35 -0.08 0.1884 0.0359 -1.0 1.0 -1.4 1.0Math 11 3256 A.3.1.1 4603 0.47 0.09 0.47 0.33 0.11 0.00 0.34 -0.19 0.34 -0.12 -0.19 0.2586 0.0359 -1.5 1.0 -1.7 1.0Math 11 3664 C.1.2.3 4603 0.51 0.21 0.20 0.51 0.09 0.00 0.31 -0.19 -0.09 0.31 -0.14 -0.0190 0.0359 2.6 1.0 3.1 1.1Math 11 4126 D.2.2.1 4603 0.39 0.39 0.36 0.13 0.12 0.00 0.38 0.38 -0.13 -0.21 -0.16 0.5626 0.0365 -5.2 0.9 -4.1 0.9Math 11 4131 D.1.1.1 2 4603 0.46 0.20 0.23 0.46 0.11 0.00 0.40 -0.20 -0.19 0.40 -0.12 0.3464 0.0360 -5.3 0.9 -5.2 0.9Math 11 4211 D.2.1.5 4603 0.43 0.19 0.18 0.19 0.43 0.00 0.29 -0.11 -0.13 -0.13 0.29 0.3517 0.0360 0.8 1.0 1.3 1.0Math 11 4475 E.1.1.2 4603 0.44 0.44 0.32 0.14 0.10 0.00 0.35 0.35 -0.27 -0.05 -0.09 0.3157 0.0360 -0.9 1.0 -0.9 1.0Math 11 4570 A.1.3.1 4603 0.68 0.23 0.68 0.04 0.05 0.00 0.31 -0.25 0.31 -0.11 -0.08 -0.6527 0.0377 -1.8 1.0 -1.0 1.0
Appendix I: Item Statistics Multiple Choice
2012 PSSA-M Technical Report I-4

Cont Grade PubID Std DOK N PVal P(A) P(B) P(C) P(D) P(-) PtBis PT(A) PT(B) PT(C) PT(D) Meas MeasSE t MS t MSItem Information Classical Infit OutfitRasch
Math 11 4628 D.4.1.1 4603 0.67 0.10 0.08 0.15 0.67 0.00 0.42 -0.14 -0.18 -0.30 0.42 -0.7397 0.0381 -7.3 0.9 -6.5 0.8Math 11 4844 E.4.1.1 4603 0.63 0.10 0.63 0.21 0.05 0.00 0.30 -0.15 0.30 -0.14 -0.18 -0.5620 0.0372 1.2 1.0 1.5 1.0Math 11 5762 D.3.2.2 1 4603 0.55 0.13 0.22 0.55 0.10 0.01 0.33 -0.13 -0.20 0.33 -0.12 0.0021 0.0359 0.4 1.0 0.4 1.0Math 11 6142 C.1.3.1 4603 0.84 0.84 0.10 0.04 0.03 0.00 0.07 0.07 0.03 -0.11 -0.10 -1.7270 0.0475 3.4 1.1 7.4 1.4Math 11 6232 A.1.1.1 4603 0.84 0.06 0.84 0.05 0.05 0.00 0.30 -0.19 0.30 -0.16 -0.14 -1.9019 0.0502 -2.7 0.9 -5.1 0.7Math 11 6290 E.4.2.1 4603 0.30 0.30 0.18 0.34 0.18 0.01 0.32 0.32 -0.03 -0.19 -0.11 1.1325 0.0392 0.0 1.0 1.5 1.0Math 11 6327 C.3.1.1 1 4603 0.55 0.12 0.27 0.55 0.05 0.00 0.45 -0.16 -0.34 0.45 -0.09 -0.0548 0.0359 -8.7 0.9 -7.5 0.9Math 11 6622 C.1.4.1 1 4603 0.51 0.12 0.51 0.14 0.23 0.00 0.31 -0.16 0.31 0.00 -0.24 -0.0866 0.0360 3.5 1.0 2.9 1.1Math 11 6761 C.1.1.1 2 4603 0.43 0.40 0.43 0.12 0.06 0.00 0.17 -0.05 0.17 -0.13 -0.06 0.2679 0.0359 8.8 1.1 8.5 1.2Math 11 7089 E.2.1.1 4603 0.73 0.06 0.16 0.73 0.05 0.00 0.17 -0.09 -0.09 0.17 -0.09 -0.8878 0.0390 3.3 1.1 2.6 1.1Math 11 7216 D.2.1.3 4603 0.53 0.15 0.53 0.17 0.15 0.00 0.35 -0.19 0.35 -0.19 -0.10 -0.0641 0.0359 -0.8 1.0 -1.2 1.0Math 11 7229 B.2.1.1 4603 0.71 0.12 0.14 0.71 0.03 0.00 0.22 -0.04 -0.19 0.22 -0.11 -0.9624 0.0395 1.5 1.0 0.3 1.0Math 11 8275 D.3.2.1 1 4603 0.53 0.11 0.15 0.21 0.53 0.00 0.46 -0.17 -0.20 -0.24 0.46 -0.0376 0.0359 -9.4 0.9 -8.7 0.9Math 11 8811 E.2.1.2 4603 0.27 0.13 0.41 0.27 0.19 0.00 0.32 0.05 -0.17 0.32 -0.18 1.1182 0.0391 -0.2 1.0 0.7 1.0Math 11 8894 D.4.1.1 4603 0.39 0.30 0.16 0.14 0.39 0.00 0.25 -0.05 -0.15 -0.13 0.25 0.7029 0.0370 4.8 1.1 5.1 1.1Math 11 8908 D.3.1.2 4603 0.44 0.29 0.07 0.19 0.44 0.01 0.19 0.07 -0.19 -0.19 0.19 0.4106 0.0361 7.3 1.1 7.1 1.1Reading 4 0139 A.2.4.1 1 3710 0.58 0.58 0.16 0.09 0.16 0.01 0.25 0.25 -0.03 -0.18 -0.16 -0.2985 0.0362 3.4 1.0 3.8 1.1Reading 4 0941 A.1.3.1 2 3710 0.36 0.21 0.36 0.20 0.22 0.01 0.29 -0.11 0.29 -0.17 -0.05 0.6986 0.0372 0.7 1.0 2.0 1.0Reading 4 0984 A.2.4.1 1 3710 0.45 0.45 0.23 0.14 0.18 0.00 0.32 0.32 -0.15 -0.21 -0.04 0.3086 0.0361 -0.2 1.0 0.9 1.0Reading 4 1373 B.2.1.2 2 3710 0.55 0.28 0.55 0.07 0.09 0.00 0.24 0.00 0.24 -0.22 -0.22 -0.1961 0.0360 5.3 1.1 4.7 1.1Reading 4 1510 B.1.1.1 2 3710 0.37 0.35 0.16 0.37 0.11 0.01 0.34 -0.07 -0.21 0.34 -0.18 0.6476 0.0370 -2.3 1.0 -0.3 1.0Reading 4 1951 A.1.3.1 2 3710 0.31 0.15 0.36 0.19 0.31 0.00 0.18 -0.15 0.08 -0.17 0.18 0.9851 0.0386 5.5 1.1 6.8 1.2Reading 4 2589 A.1.4.1 1 3710 0.58 0.20 0.11 0.58 0.11 0.01 0.46 -0.21 -0.25 0.46 -0.19 -0.3239 0.0363 -9.5 0.9 -9.1 0.8Reading 4 3051 A.2.2.1 1 3710 0.67 0.67 0.13 0.09 0.11 0.00 0.49 0.49 -0.21 -0.26 -0.26 -0.7411 0.0377 -9.9 0.8 -9.9 0.8Reading 4 3445 A.1.2.1 1 3710 0.60 0.13 0.60 0.17 0.10 0.00 0.38 -0.18 0.38 -0.19 -0.17 -0.3918 0.0364 -4.6 0.9 -4.6 0.9Reading 4 3783 B.1.1.1 1 3710 0.54 0.22 0.54 0.12 0.12 0.00 0.50 -0.24 0.50 -0.20 -0.25 -0.1120 0.0359 -9.9 0.8 -9.9 0.8Reading 4 4174 A.2.2.2 2 3710 0.71 0.10 0.09 0.11 0.71 0.00 0.45 -0.27 -0.22 -0.19 0.45 -0.9301 0.0387 -9.0 0.9 -9.4 0.8Reading 4 4622 B.1.1.1 1 3710 0.43 0.23 0.23 0.10 0.43 0.01 0.28 0.05 -0.19 -0.26 0.28 0.3568 0.0362 3.0 1.0 3.2 1.1Reading 4 6028 B.3.3.2 2 3710 0.35 0.15 0.35 0.35 0.14 0.00 0.24 -0.07 -0.09 0.24 -0.12 0.7871 0.0375 3.4 1.1 4.3 1.1Reading 4 6145 A.2.4.1 1 3710 0.31 0.31 0.30 0.14 0.25 0.00 0.28 0.28 -0.07 -0.16 -0.10 0.9575 0.0384 0.5 1.0 1.4 1.0Reading 4 6881 B.1.1.1 1 3710 0.41 0.19 0.41 0.20 0.19 0.00 0.22 -0.20 0.22 -0.03 -0.04 0.4953 0.0365 5.5 1.1 6.8 1.1Reading 4 6898 A.2.4.1 1 3710 0.56 0.56 0.10 0.15 0.18 0.00 0.40 0.40 -0.23 -0.25 -0.09 -0.2150 0.0361 -6.1 0.9 -5.0 0.9Reading 4 6947 A.1.4.1 1 3710 0.70 0.70 0.09 0.12 0.09 0.00 0.38 0.38 -0.24 -0.14 -0.21 -0.8779 0.0384 -6.2 0.9 -5.6 0.9Reading 4 7073 A.1.4.1 1 3710 0.58 0.16 0.11 0.58 0.14 0.01 0.45 -0.23 -0.16 0.45 -0.24 -0.3278 0.0363 -9.2 0.9 -8.3 0.9Reading 4 7455 A.1.3.1 2 3710 0.52 0.52 0.23 0.13 0.11 0.00 0.39 0.39 -0.12 -0.23 -0.21 -0.0508 0.0359 -5.5 0.9 -4.4 0.9Reading 4 7624 A.2.3.1 2 3710 0.46 0.46 0.24 0.12 0.18 0.00 0.36 0.36 -0.15 -0.20 -0.12 0.2405 0.0360 -2.7 1.0 -2.5 1.0Reading 4 7648 B.2.1.3 1 3710 0.42 0.21 0.19 0.42 0.17 0.00 0.29 -0.14 -0.15 0.29 -0.06 0.4231 0.0363 1.9 1.0 2.1 1.0Reading 4 7950 B.2.1.2 1 3710 0.43 0.14 0.43 0.17 0.26 0.00 0.16 -0.15 0.16 -0.08 0.01 0.3593 0.0362 9.9 1.1 8.6 1.2Reading 4 7956 B.2.1.1 1 3710 0.39 0.30 0.39 0.17 0.14 0.00 0.26 -0.11 0.26 -0.11 -0.11 0.5709 0.0367 2.9 1.0 2.7 1.1Reading 4 8101 A.1.3.1 2 3710 0.31 0.14 0.31 0.28 0.27 0.01 0.15 -0.23 0.15 -0.01 0.03 0.9895 0.0386 6.7 1.1 8.5 1.2Reading 4 8262 A.2.6.1 2 3710 0.56 0.56 0.16 0.14 0.14 0.00 0.31 0.31 -0.13 -0.16 -0.14 -0.2112 0.0361 -0.3 1.0 -0.1 1.0
Appendix I: Item Statistics Multiple Choice
2012 PSSA-M Technical Report I-5

Cont Grade PubID Std DOK N PVal P(A) P(B) P(C) P(D) P(-) PtBis PT(A) PT(B) PT(C) PT(D) Meas MeasSE t MS t MSItem Information Classical Infit OutfitRasch
Reading 4 8319 B.1.1.1 2 3710 0.41 0.12 0.22 0.41 0.24 0.01 0.35 -0.15 -0.28 0.35 -0.02 0.4488 0.0364 -2.1 1.0 -1.6 1.0Reading 4 8374 A.1.3.1 2 3710 0.41 0.41 0.16 0.13 0.29 0.00 0.13 0.13 -0.02 -0.15 -0.01 0.4914 0.0365 9.9 1.2 9.9 1.2Reading 4 8780 B.3.3.2 2 3710 0.54 0.12 0.16 0.17 0.54 0.00 0.34 -0.21 -0.17 -0.10 0.34 -0.1446 0.0360 -2.3 1.0 -2.2 1.0Reading 4 8807 A.1.6.1 2 3710 0.45 0.45 0.20 0.18 0.17 0.00 0.23 0.23 -0.10 -0.10 -0.09 0.2669 0.0360 6.1 1.1 6.1 1.1Reading 4 9002 A.1.4.1 2 3710 0.63 0.63 0.20 0.10 0.08 0.00 0.21 0.21 -0.09 -0.15 -0.07 -0.5191 0.0368 5.0 1.1 4.8 1.1Reading 5 0175 A.2.3.1 2 4669 0.42 0.42 0.29 0.19 0.10 0.00 0.38 0.38 -0.26 -0.13 -0.07 0.8920 0.0332 -1.3 1.0 0.0 1.0Reading 5 0650 B.1.1.1 2 4669 0.66 0.13 0.12 0.09 0.66 0.00 0.51 -0.22 -0.28 -0.25 0.51 -0.2958 0.0344 -9.9 0.9 -9.9 0.8Reading 5 0844 B.2.1.4 1 4669 0.37 0.33 0.18 0.37 0.12 0.00 0.22 -0.07 -0.08 0.22 -0.13 1.1077 0.0337 9.6 1.1 9.9 1.3Reading 5 0875 A.1.2.1 1 4669 0.52 0.20 0.10 0.52 0.17 0.01 0.30 -0.09 -0.20 0.30 -0.12 0.4035 0.0329 6.3 1.1 5.3 1.1Reading 5 1831 A.1.1.2 1 4669 0.73 0.73 0.09 0.14 0.04 0.00 0.45 0.45 -0.32 -0.21 -0.17 -0.6822 0.0363 -6.9 0.9 -5.6 0.8Reading 5 2574 A.2.6.1 1 4669 0.45 0.15 0.19 0.21 0.45 0.00 0.28 -0.02 -0.15 -0.18 0.28 0.7550 0.0330 6.6 1.1 6.8 1.1Reading 5 2670 B.2.1.2 1 4669 0.64 0.64 0.12 0.12 0.12 0.00 0.40 0.40 -0.22 -0.22 -0.14 -0.1942 0.0340 -2.2 1.0 -2.2 1.0Reading 5 3334 A.1.6.1 2 4669 0.38 0.38 0.17 0.18 0.26 0.01 0.26 0.26 -0.15 -0.13 -0.03 1.1121 0.0337 6.4 1.1 7.9 1.2Reading 5 3416 A.1.4.1 2 4669 0.58 0.24 0.08 0.58 0.09 0.00 0.32 -0.11 -0.21 0.32 -0.19 0.0844 0.0333 4.0 1.1 4.7 1.1Reading 5 3514 A.2.4.1 1 4669 0.56 0.12 0.14 0.18 0.56 0.00 0.46 -0.21 -0.24 -0.19 0.46 0.1938 0.0331 -6.3 0.9 -5.6 0.9Reading 5 3830 A.2.2.1 1 4669 0.71 0.12 0.10 0.07 0.71 0.01 0.49 -0.30 -0.20 -0.26 0.49 -0.5757 0.0357 -9.6 0.9 -8.8 0.8Reading 5 4468 A.2.1.2 2 4669 0.77 0.77 0.06 0.08 0.09 0.00 0.44 0.44 -0.20 -0.18 -0.31 -0.9434 0.0381 -6.5 0.9 -5.9 0.8Reading 5 4685 B.1.1.1 2 4669 0.79 0.08 0.08 0.06 0.79 0.00 0.41 -0.18 -0.26 -0.20 0.41 -1.0785 0.0392 -5.0 0.9 -4.1 0.9Reading 5 5125 A.1.6.1 2 4669 0.61 0.22 0.11 0.61 0.06 0.00 0.40 -0.12 -0.30 0.40 -0.21 -0.0451 0.0336 -2.2 1.0 -2.0 1.0Reading 5 5697 B.1.1.1 2 4669 0.47 0.25 0.11 0.47 0.17 0.00 0.30 -0.09 -0.23 0.30 -0.10 0.6257 0.0329 6.3 1.1 6.3 1.1Reading 5 5843 B.3.1.1 1 4669 0.52 0.21 0.11 0.52 0.16 0.00 0.36 -0.20 -0.16 0.36 -0.13 0.3929 0.0329 1.6 1.0 1.4 1.0Reading 5 6223 A.2.4.1 2 4669 0.50 0.16 0.50 0.13 0.20 0.00 0.42 -0.26 0.42 -0.21 -0.10 0.4793 0.0329 -3.3 1.0 -2.3 1.0Reading 5 6305 B.2.1.2 1 4669 0.58 0.14 0.12 0.15 0.58 0.01 0.47 -0.24 -0.22 -0.19 0.47 0.0887 0.0333 -7.6 0.9 -7.4 0.9Reading 5 6483 A.2.4.1 1 4669 0.58 0.11 0.14 0.17 0.58 0.00 0.41 -0.30 -0.04 -0.25 0.41 0.0973 0.0333 -2.7 1.0 -2.6 1.0Reading 5 7285 A.1.3.1 2 4669 0.67 0.67 0.08 0.13 0.12 0.01 0.44 0.44 -0.28 -0.23 -0.15 -0.3620 0.0347 -5.7 0.9 -4.3 0.9Reading 5 7329 B.1.1.1 2 4669 0.65 0.08 0.65 0.13 0.13 0.00 0.49 -0.25 0.49 -0.27 -0.21 -0.2808 0.0343 -8.9 0.9 -8.7 0.8Reading 5 7500 A.1.2.2 2 4669 0.48 0.29 0.14 0.48 0.09 0.00 0.35 -0.06 -0.23 0.35 -0.24 0.5983 0.0329 2.1 1.0 2.0 1.0Reading 5 7869 B.2.2.1 2 4669 0.56 0.56 0.10 0.14 0.19 0.01 0.44 0.44 -0.17 -0.23 -0.21 0.1842 0.0331 -5.0 0.9 -4.4 0.9Reading 5 7971 A.1.3.1 2 4669 0.41 0.21 0.30 0.41 0.08 0.00 0.22 -0.19 0.03 0.22 -0.16 0.9352 0.0333 9.9 1.2 9.9 1.2Reading 5 8492 A.2.3.1 2 4669 0.60 0.11 0.14 0.15 0.60 0.00 0.28 -0.07 -0.16 -0.16 0.28 0.0183 0.0334 7.2 1.1 5.8 1.1Reading 5 8573 A.1.4.1 2 4669 0.63 0.63 0.20 0.09 0.08 0.00 0.34 0.34 -0.12 -0.18 -0.23 -0.1538 0.0339 2.0 1.0 3.2 1.1Reading 5 8647 A.2.4.1 1 4669 0.48 0.14 0.19 0.19 0.48 0.00 0.28 -0.12 -0.13 -0.11 0.28 0.5909 0.0329 8.1 1.1 7.0 1.1Reading 5 8988 A.1.3.1 2 4669 0.42 0.24 0.20 0.42 0.13 0.01 0.34 -0.14 -0.10 0.34 -0.18 0.8737 0.0332 1.3 1.0 2.4 1.1Reading 5 9380 A.2.4.1 1 4669 0.50 0.17 0.50 0.17 0.16 0.00 0.37 -0.25 0.37 -0.16 -0.08 0.5025 0.0329 0.7 1.0 1.5 1.0Reading 5 9853 A.1.3.1 2 4669 0.47 0.25 0.13 0.14 0.47 0.01 0.36 -0.10 -0.19 -0.20 0.36 0.6490 0.0329 1.2 1.0 0.8 1.0Reading 6 0030 A.2.4.1 2 4534 0.53 0.27 0.13 0.53 0.07 0.00 0.13 0.06 -0.17 0.13 -0.12 0.4733 0.0332 9.9 1.2 9.9 1.3Reading 6 0080 A.2.3.1 2 4534 0.59 0.19 0.11 0.11 0.59 0.00 0.44 -0.19 -0.20 -0.25 0.44 0.2038 0.0336 -6.7 0.9 -6.3 0.9Reading 6 0250 A.1.2.2 2 4534 0.77 0.14 0.77 0.08 0.01 0.00 0.41 -0.28 0.41 -0.24 -0.14 -0.7711 0.0382 -5.5 0.9 -6.0 0.8Reading 6 0785 B.2.1.3 1 4534 0.55 0.55 0.18 0.19 0.08 0.00 0.32 0.32 -0.16 -0.15 -0.14 0.3686 0.0333 3.0 1.0 2.5 1.0Reading 6 0807 B.1.1.1 2 4534 0.47 0.12 0.16 0.25 0.47 0.00 0.38 -0.14 -0.11 -0.24 0.38 0.7527 0.0331 -2.6 1.0 -1.4 1.0Reading 6 0989 A.2.3.2 2 4534 0.51 0.27 0.51 0.11 0.10 0.01 0.31 -0.15 0.31 -0.18 -0.09 0.5539 0.0331 3.2 1.0 3.4 1.1
Appendix I: Item Statistics Multiple Choice
2012 PSSA-M Technical Report I-6

Cont Grade PubID Std DOK N PVal P(A) P(B) P(C) P(D) P(-) PtBis PT(A) PT(B) PT(C) PT(D) Meas MeasSE t MS t MSItem Information Classical Infit OutfitRasch
Reading 6 1088 A.2.4.1 2 4534 0.40 0.40 0.17 0.34 0.08 0.01 0.26 0.26 -0.12 -0.05 -0.21 1.0920 0.0336 5.9 1.1 6.9 1.1Reading 6 1151 B.2.1.2 1 4534 0.64 0.64 0.11 0.14 0.11 0.01 0.45 0.45 -0.22 -0.24 -0.19 -0.0740 0.0344 -6.6 0.9 -6.6 0.9Reading 6 1306 B.1.2.1 2 4534 0.38 0.14 0.38 0.23 0.23 0.01 0.30 -0.19 0.30 -0.23 0.06 1.1816 0.0338 1.9 1.0 4.6 1.1Reading 6 1797 B.2.1.2 1 4534 0.73 0.09 0.73 0.13 0.05 0.00 0.45 -0.18 0.45 -0.34 -0.16 -0.5834 0.0369 -7.3 0.9 -7.3 0.8Reading 6 2257 B.1.1.1 1 4534 0.58 0.24 0.58 0.09 0.08 0.00 0.34 -0.23 0.34 -0.11 -0.13 0.2170 0.0335 1.8 1.0 0.7 1.0Reading 6 2426 A.2.6.1 1 4534 0.47 0.18 0.17 0.47 0.18 0.00 0.27 -0.18 -0.09 0.27 -0.08 0.7742 0.0331 6.4 1.1 6.5 1.1Reading 6 2570 A.2.2.2 2 4534 0.74 0.74 0.09 0.09 0.08 0.01 0.42 0.42 -0.25 -0.21 -0.18 -0.6197 0.0371 -5.2 0.9 -5.5 0.8Reading 6 2811 B.3.3.1 2 4534 0.33 0.33 0.33 0.17 0.15 0.01 0.28 -0.01 0.28 -0.23 -0.10 1.4265 0.0346 1.9 1.0 5.1 1.1Reading 6 3208 A.1.4.1 1 4534 0.65 0.16 0.07 0.12 0.65 0.00 0.37 -0.16 -0.21 -0.21 0.37 -0.1378 0.0346 -1.1 1.0 -2.3 1.0Reading 6 3499 B.3.1.1 1 4534 0.44 0.44 0.25 0.17 0.14 0.00 0.26 0.26 -0.06 -0.13 -0.15 0.8954 0.0333 6.5 1.1 7.8 1.1Reading 6 3793 B.1.1.1 2 4534 0.59 0.12 0.10 0.59 0.19 0.00 0.33 -0.19 -0.24 0.33 -0.07 0.1928 0.0336 2.0 1.0 1.3 1.0Reading 6 3807 A.1.1.2 1 4534 0.70 0.19 0.05 0.06 0.70 0.00 0.34 -0.14 -0.22 -0.21 0.34 -0.4026 0.0358 -0.2 1.0 0.8 1.0Reading 6 3926 A.2.4.1 1 4534 0.79 0.79 0.07 0.04 0.10 0.00 0.42 0.42 -0.16 -0.24 -0.28 -0.9068 0.0393 -5.7 0.9 -7.0 0.8Reading 6 6745 A.2.4.1 1 4534 0.47 0.24 0.17 0.47 0.11 0.01 0.31 -0.25 -0.04 0.31 -0.09 0.7365 0.0331 3.0 1.0 2.6 1.1Reading 6 6826 B.3.1.1 1 4534 0.66 0.66 0.13 0.12 0.09 0.01 0.47 0.47 -0.27 -0.22 -0.19 -0.1707 0.0347 -8.4 0.9 -7.7 0.8Reading 6 7171 A.2.2.2 2 4534 0.73 0.11 0.73 0.08 0.08 0.00 0.47 -0.30 0.47 -0.23 -0.19 -0.5398 0.0366 -8.1 0.9 -8.7 0.8Reading 6 7305 B.3.2.1 2 4534 0.35 0.17 0.35 0.27 0.20 0.01 0.14 0.07 0.14 -0.15 -0.04 1.3524 0.0344 9.9 1.2 9.9 1.3Reading 6 7535 A.1.2.1 1 4534 0.69 0.69 0.06 0.12 0.13 0.01 0.34 0.34 -0.22 -0.14 -0.17 -0.3330 0.0355 -0.5 1.0 0.5 1.0Reading 6 8139 A.1.3.1 2 4534 0.77 0.07 0.11 0.04 0.77 0.00 0.43 -0.23 -0.24 -0.23 0.43 -0.8115 0.0385 -5.6 0.9 -6.6 0.8Reading 6 8297 A.2.4.1 1 4534 0.55 0.17 0.19 0.08 0.55 0.01 0.32 -0.12 -0.13 -0.21 0.32 0.3707 0.0333 2.9 1.0 1.8 1.0Reading 6 8316 A.2.4.1 1 4534 0.50 0.50 0.11 0.33 0.06 0.00 0.36 0.36 -0.23 -0.13 -0.20 0.5905 0.0331 -1.2 1.0 -1.4 1.0Reading 6 8926 A.2.2.2 2 4534 0.68 0.07 0.14 0.68 0.09 0.01 0.50 -0.21 -0.33 0.50 -0.19 -0.2867 0.0352 -9.9 0.9 -9.9 0.8Reading 6 9402 A.1.2.1 1 4534 0.67 0.67 0.12 0.11 0.09 0.00 0.39 0.39 -0.20 -0.26 -0.12 -0.2300 0.0350 -3.0 1.0 -2.8 0.9Reading 6 9995 A.2.4.1 1 4534 0.69 0.12 0.12 0.69 0.05 0.00 0.37 -0.16 -0.21 0.37 -0.21 -0.3739 0.0357 -2.0 1.0 -1.8 1.0Reading 7 0399 A.1.2.1 1 4558 0.67 0.67 0.07 0.16 0.09 0.00 0.32 0.32 -0.22 -0.17 -0.10 -0.4622 0.0344 -0.6 1.0 -0.3 1.0Reading 7 0848 A.1.3.1 2 4558 0.56 0.18 0.12 0.14 0.56 0.01 0.41 -0.15 -0.17 -0.25 0.41 0.0475 0.0329 -5.5 0.9 -5.5 0.9Reading 7 1064 A.1.3.1 2 4558 0.84 0.04 0.09 0.84 0.03 0.00 0.36 -0.20 -0.21 0.36 -0.19 -1.5302 0.0426 -4.8 0.9 -5.0 0.8Reading 7 1344 A.2.3.1 2 4558 0.56 0.56 0.20 0.15 0.09 0.00 0.29 0.29 -0.02 -0.22 -0.20 0.0528 0.0329 2.8 1.0 3.7 1.1Reading 7 1714 B.1.1.1 2 4558 0.48 0.23 0.13 0.15 0.48 0.00 0.39 -0.06 -0.18 -0.30 0.39 0.4330 0.0328 -4.1 1.0 -3.6 0.9Reading 7 1877 A.1.4.1 2 4558 0.55 0.55 0.12 0.14 0.18 0.01 0.31 0.31 -0.17 -0.16 -0.10 0.0928 0.0329 2.2 1.0 1.8 1.0Reading 7 1993 A.2.4.1 1 4558 0.54 0.21 0.20 0.04 0.54 0.00 0.29 -0.04 -0.22 -0.17 0.29 0.1463 0.0328 4.1 1.1 2.5 1.0Reading 7 1995 B.2.1.1 1 4558 0.53 0.53 0.13 0.17 0.16 0.00 0.23 0.23 -0.16 -0.05 -0.10 0.1557 0.0328 8.6 1.1 7.2 1.1Reading 7 2114 B.1.1.1 2 4558 0.45 0.13 0.07 0.45 0.34 0.00 0.18 -0.20 -0.24 0.18 0.09 0.5608 0.0329 9.9 1.2 9.9 1.2Reading 7 2401 B.1.1.1 2 4558 0.59 0.59 0.16 0.15 0.09 0.00 0.44 0.44 -0.31 -0.21 -0.09 -0.0991 0.0332 -8.1 0.9 -7.6 0.9Reading 7 3096 B.1.1.1 2 4558 0.60 0.09 0.60 0.08 0.22 0.00 0.37 -0.19 0.37 -0.24 -0.14 -0.1142 0.0332 -3.0 1.0 -3.2 0.9Reading 7 3706 B.1.1.1 2 4558 0.47 0.21 0.13 0.19 0.47 0.00 0.20 -0.15 -0.02 -0.08 0.20 0.4571 0.0328 9.9 1.1 9.9 1.2Reading 7 3728 B.1.1.1 2 4558 0.45 0.45 0.25 0.22 0.07 0.00 0.29 0.29 -0.12 -0.09 -0.19 0.5692 0.0329 3.3 1.0 3.2 1.1Reading 7 4439 A.2.3.1 2 4558 0.46 0.46 0.14 0.17 0.22 0.00 0.33 0.33 -0.23 -0.11 -0.09 0.5125 0.0328 0.5 1.0 0.8 1.0Reading 7 4587 B.1.1.1 2 4558 0.63 0.15 0.14 0.63 0.08 0.00 0.45 -0.21 -0.22 0.45 -0.25 -0.2974 0.0337 -8.5 0.9 -8.2 0.8Reading 7 4826 B.2.1.2 2 4558 0.76 0.76 0.08 0.12 0.05 0.00 0.45 0.45 -0.29 -0.23 -0.19 -0.9647 0.0372 -8.5 0.9 -8.7 0.8Reading 7 5498 A.2.4.1 1 4558 0.48 0.12 0.09 0.48 0.31 0.00 0.34 -0.11 -0.24 0.34 -0.13 0.4571 0.0328 -0.5 1.0 0.0 1.0
Appendix I: Item Statistics Multiple Choice
2012 PSSA-M Technical Report I-7

Cont Grade PubID Std DOK N PVal P(A) P(B) P(C) P(D) P(-) PtBis PT(A) PT(B) PT(C) PT(D) Meas MeasSE t MS t MSItem Information Classical Infit OutfitRasch
Reading 7 6110 B.1.1.1 2 4558 0.51 0.12 0.22 0.15 0.51 0.00 0.42 -0.21 -0.19 -0.15 0.42 0.2882 0.0327 -6.4 0.9 -5.7 0.9Reading 7 6143 A.1.3.1 2 4558 0.52 0.25 0.52 0.15 0.08 0.00 0.35 -0.20 0.35 -0.15 -0.14 0.2298 0.0328 -1.2 1.0 -1.2 1.0Reading 7 6981 A.2.4.1 2 4558 0.60 0.12 0.18 0.10 0.60 0.00 0.42 -0.24 -0.13 -0.24 0.42 -0.1367 0.0333 -6.5 0.9 -5.0 0.9Reading 7 7084 A.1.3.1 2 4558 0.51 0.07 0.30 0.11 0.51 0.00 0.42 -0.23 -0.18 -0.21 0.42 0.2694 0.0327 -6.9 0.9 -7.0 0.9Reading 7 7340 A.1.1.1 2 4558 0.45 0.36 0.45 0.11 0.08 0.00 0.37 -0.18 0.37 -0.17 -0.17 0.5787 0.0329 -2.9 1.0 -2.4 1.0Reading 7 7353 B.1.1.1 2 4558 0.54 0.27 0.08 0.54 0.11 0.00 0.35 -0.15 -0.20 0.35 -0.16 0.1347 0.0328 -0.9 1.0 -1.2 1.0Reading 7 7484 A.2.6.1 2 4558 0.39 0.34 0.15 0.12 0.39 0.00 0.24 -0.04 -0.07 -0.23 0.24 0.8601 0.0334 6.0 1.1 6.6 1.1Reading 7 7487 A.1.4.1 2 4558 0.64 0.13 0.64 0.09 0.14 0.00 0.31 -0.19 0.31 -0.19 -0.08 -0.3319 0.0339 1.2 1.0 0.1 1.0Reading 7 7490 A.2.4.1 1 4558 0.40 0.40 0.21 0.16 0.22 0.00 0.19 0.19 -0.07 -0.15 -0.02 0.7971 0.0333 9.5 1.1 8.4 1.2Reading 7 8870 B.1.1.1 2 4558 0.64 0.64 0.17 0.14 0.04 0.00 0.45 0.45 -0.25 -0.23 -0.20 -0.3374 0.0339 -9.2 0.9 -7.9 0.8Reading 7 9503 B.3.3.3 2 4558 0.61 0.61 0.19 0.05 0.15 0.00 0.17 0.17 -0.04 -0.16 -0.09 -0.2007 0.0335 9.9 1.1 9.9 1.2Reading 7 9692 B.1.1.1 2 4558 0.67 0.18 0.67 0.11 0.04 0.00 0.33 -0.18 0.33 -0.18 -0.14 -0.5086 0.0346 -1.3 1.0 -1.6 1.0Reading 7 9831 A.2.4.1 1 4558 0.46 0.29 0.46 0.14 0.12 0.00 0.28 -0.11 0.28 -0.10 -0.18 0.5514 0.0329 3.6 1.0 3.6 1.1Reading 8 0027 A.2.4.1 2 4304 0.75 0.08 0.75 0.05 0.11 0.00 0.33 -0.20 0.33 -0.19 -0.14 -0.8530 0.0379 -3.4 0.9 -3.8 0.9Reading 8 0337 A.2.2.1 1 4304 0.83 0.07 0.83 0.06 0.03 0.00 0.36 -0.17 0.36 -0.25 -0.17 -1.4121 0.0434 -4.7 0.9 -5.8 0.8Reading 8 0577 B.2.1.1 1 4304 0.51 0.24 0.51 0.14 0.11 0.00 0.24 -0.10 0.24 -0.10 -0.12 0.3301 0.0334 4.9 1.1 4.9 1.1Reading 8 0649 B.1.1.1 2 4304 0.39 0.10 0.39 0.40 0.11 0.00 0.21 -0.25 0.21 0.01 -0.10 0.9053 0.0341 4.2 1.1 5.3 1.1Reading 8 0695 A.1.3.1 2 4304 0.49 0.12 0.24 0.15 0.49 0.00 0.31 -0.16 -0.06 -0.21 0.31 0.4010 0.0334 -0.2 1.0 -0.2 1.0Reading 8 0817 B.2.1.2 2 4304 0.56 0.18 0.56 0.13 0.12 0.01 0.17 -0.05 0.17 -0.12 -0.06 0.1121 0.0336 9.4 1.1 8.9 1.2Reading 8 1692 B.1.2.1 3 4304 0.52 0.15 0.52 0.21 0.11 0.01 0.29 -0.08 0.29 -0.15 -0.18 0.2893 0.0334 0.6 1.0 0.2 1.0Reading 8 1710 B.1.2.1 3 4304 0.35 0.16 0.28 0.22 0.35 0.00 0.25 -0.12 -0.12 -0.05 0.25 1.0903 0.0347 1.0 1.0 2.1 1.0Reading 8 1914 A.2.2.2 2 4304 0.66 0.13 0.15 0.66 0.06 0.00 0.39 -0.19 -0.22 0.39 -0.16 -0.3725 0.0350 -5.4 0.9 -5.7 0.9Reading 8 2420 A.1.1.2 1 4304 0.67 0.67 0.14 0.09 0.11 0.00 0.31 0.31 -0.21 -0.14 -0.10 -0.3928 0.0351 -1.6 1.0 -1.5 1.0Reading 8 2539 B.3.1.1 2 4304 0.61 0.61 0.11 0.13 0.15 0.00 0.36 0.36 -0.17 -0.28 -0.08 -0.1321 0.0341 -4.1 1.0 -4.3 0.9Reading 8 2660 A.2.6.1 2 4304 0.46 0.46 0.32 0.10 0.12 0.00 0.26 0.26 0.00 -0.24 -0.18 0.5689 0.0334 1.9 1.0 2.0 1.0Reading 8 3323 B.3.1.1 2 4304 0.44 0.11 0.28 0.17 0.44 0.01 0.32 -0.16 -0.14 -0.12 0.32 0.6664 0.0336 -2.1 1.0 -1.9 1.0Reading 8 4361 A.1.1.1 2 4304 0.49 0.49 0.17 0.25 0.08 0.00 0.14 0.14 -0.03 -0.11 -0.05 0.4096 0.0334 9.9 1.1 9.9 1.2Reading 8 4421 B.2.1.2 2 4304 0.73 0.08 0.05 0.14 0.73 0.00 0.41 -0.21 -0.17 -0.25 0.41 -0.7001 0.0368 -7.2 0.9 -7.1 0.8Reading 8 4917 B.3.1.1 2 4304 0.45 0.11 0.28 0.16 0.45 0.00 0.27 -0.20 -0.02 -0.17 0.27 0.5970 0.0335 1.5 1.0 2.1 1.0Reading 8 5063 B.1.1.1 2 4304 0.70 0.70 0.09 0.06 0.15 0.00 0.31 0.31 -0.20 -0.21 -0.09 -0.5520 0.0359 -1.7 1.0 -1.3 1.0Reading 8 6299 A.1.3.1 2 4304 0.67 0.08 0.09 0.67 0.16 0.00 0.30 -0.16 -0.24 0.30 -0.07 -0.4023 0.0352 -1.2 1.0 -0.2 1.0Reading 8 6316 B.3.3.2 2 4304 0.30 0.23 0.26 0.20 0.30 0.01 0.21 -0.01 -0.06 -0.16 0.21 1.3569 0.0360 2.3 1.0 4.0 1.1Reading 8 6414 B.3.3.2 1 4304 0.50 0.13 0.50 0.16 0.21 0.01 0.22 -0.11 0.22 -0.16 -0.03 0.4053 0.0334 6.1 1.1 6.2 1.1Reading 8 6586 A.2.3.2 2 4304 0.39 0.12 0.24 0.39 0.25 0.01 0.20 -0.09 -0.15 0.20 0.00 0.9121 0.0341 4.7 1.1 6.6 1.1Reading 8 6899 B.1.1.1 1 4304 0.54 0.03 0.07 0.54 0.36 0.00 0.26 -0.18 -0.14 0.26 -0.13 0.1956 0.0335 3.1 1.0 2.2 1.0Reading 8 6905 A.2.4.1 2 4304 0.54 0.21 0.14 0.11 0.54 0.00 0.39 -0.18 -0.21 -0.14 0.39 0.1945 0.0335 -6.2 0.9 -5.3 0.9Reading 8 7212 A.1.3.1 2 4304 0.73 0.73 0.06 0.14 0.07 0.00 0.33 0.33 -0.22 -0.15 -0.16 -0.7308 0.0370 -3.2 1.0 -2.1 0.9Reading 8 7232 A.2.6.1 1 4304 0.41 0.07 0.41 0.21 0.31 0.00 0.16 -0.13 0.16 -0.03 -0.07 0.7904 0.0338 9.0 1.1 9.6 1.2Reading 8 7336 A.1.4.1 1 4304 0.72 0.12 0.72 0.09 0.07 0.00 0.46 -0.28 0.46 -0.23 -0.19 -0.6988 0.0368 -9.4 0.9 -9.9 0.8Reading 8 7600 B.2.1.1 3 4304 0.56 0.21 0.10 0.56 0.14 0.00 0.33 -0.15 -0.19 0.33 -0.14 0.1186 0.0336 -1.7 1.0 -1.7 1.0Reading 8 8117 B.3.3.1 2 4304 0.39 0.16 0.39 0.27 0.17 0.01 0.21 -0.13 0.21 -0.05 -0.09 0.8750 0.0340 4.7 1.1 6.4 1.1
Appendix I: Item Statistics Multiple Choice
2012 PSSA-M Technical Report I-8

Cont Grade PubID Std DOK N PVal P(A) P(B) P(C) P(D) P(-) PtBis PT(A) PT(B) PT(C) PT(D) Meas MeasSE t MS t MSItem Information Classical Infit OutfitRasch
Reading 8 9338 A.2.1.2 1 4304 0.70 0.07 0.70 0.18 0.05 0.00 0.29 -0.22 0.29 -0.07 -0.22 -0.5975 0.0362 -1.0 1.0 -0.8 1.0Reading 8 9551 A.2.3.1 2 4304 0.57 0.16 0.08 0.57 0.19 0.00 0.35 -0.12 -0.23 0.35 -0.16 0.0575 0.0337 -3.2 1.0 -3.8 0.9Reading 11 0168 A.1.3.1 2 4252 0.76 0.07 0.10 0.07 0.76 0.00 0.48 -0.25 -0.28 -0.22 0.48 -0.6007 0.0393 -8.1 0.8 -8.9 0.7Reading 11 1076 A.2.4.1 3 4252 0.30 0.30 0.32 0.22 0.15 0.01 0.18 0.18 -0.02 -0.13 -0.03 1.7059 0.0363 4.3 1.1 8.8 1.2Reading 11 2036 A.2.4.1 1 4252 0.64 0.64 0.09 0.15 0.10 0.01 0.42 0.42 -0.20 -0.20 -0.20 0.0471 0.0355 -5.3 0.9 -5.5 0.9Reading 11 2201 A.1.3.1 2 4252 0.55 0.05 0.29 0.11 0.55 0.00 0.29 -0.20 -0.05 -0.23 0.29 0.5143 0.0342 3.7 1.1 3.3 1.1Reading 11 2850 A.1.1.2 1 4252 0.76 0.76 0.11 0.07 0.06 0.00 0.42 0.42 -0.23 -0.25 -0.17 -0.5826 0.0392 -5.3 0.9 -4.4 0.9Reading 11 2953 A.1.3.1 2 4252 0.68 0.12 0.68 0.11 0.08 0.00 0.39 -0.21 0.39 -0.26 -0.11 -0.1786 0.0366 -3.8 0.9 -3.9 0.9Reading 11 3226 B.3.3.4 2 4252 0.72 0.08 0.10 0.09 0.72 0.00 0.50 -0.23 -0.23 -0.29 0.50 -0.3733 0.0377 -9.2 0.8 -9.2 0.8Reading 11 4009 A.2.4.1 1 4252 0.65 0.06 0.05 0.23 0.65 0.02 0.27 -0.25 -0.31 0.01 0.27 0.0312 0.0356 3.7 1.1 4.4 1.1Reading 11 5110 B.1.1.1 2 4252 0.53 0.05 0.53 0.07 0.35 0.00 0.23 -0.15 0.23 -0.13 -0.10 0.6208 0.0341 7.5 1.1 6.7 1.1Reading 11 5127 B.2.1.1 2 4252 0.68 0.68 0.07 0.13 0.12 0.00 0.31 0.31 -0.26 -0.04 -0.20 -0.1501 0.0364 0.8 1.0 0.5 1.0Reading 11 5271 A.2.2.1 1 4252 0.84 0.04 0.08 0.04 0.84 0.00 0.48 -0.23 -0.29 -0.25 0.48 -1.1539 0.0449 -7.3 0.8 -8.3 0.7Reading 11 5438 A.2.4.1 1 4252 0.57 0.09 0.28 0.57 0.05 0.01 0.28 -0.13 -0.13 0.28 -0.18 0.3930 0.0344 4.0 1.1 2.9 1.1Reading 11 5514 B.1.1.1 2 4252 0.56 0.12 0.56 0.05 0.27 0.00 0.34 -0.20 0.34 -0.17 -0.15 0.4217 0.0344 -0.4 1.0 -0.2 1.0Reading 11 5565 B.2.1.2 2 4252 0.78 0.05 0.08 0.78 0.08 0.00 0.41 -0.19 -0.28 0.41 -0.18 -0.7222 0.0404 -4.5 0.9 -6.5 0.8Reading 11 5696 B.1.2.1 3 4252 0.68 0.12 0.68 0.12 0.08 0.00 0.22 -0.13 0.22 -0.11 -0.07 -0.1346 0.0363 5.7 1.1 6.2 1.2Reading 11 5889 B.1.2.1 3 4252 0.47 0.23 0.47 0.13 0.17 0.00 0.27 -0.17 0.27 -0.20 0.02 0.8630 0.0340 4.6 1.1 4.9 1.1Reading 11 6643 A.2.1.2 2 4252 0.85 0.03 0.85 0.06 0.06 0.00 0.29 -0.15 0.29 -0.20 -0.13 -1.2526 0.0461 -1.0 1.0 -1.6 0.9Reading 11 6677 B.2.1.2 2 4252 0.75 0.06 0.10 0.75 0.10 0.00 0.35 -0.17 -0.19 0.35 -0.20 -0.5438 0.0389 -1.8 1.0 -3.5 0.9Reading 11 7354 A.1.4.1 2 4252 0.91 0.91 0.04 0.03 0.02 0.00 0.38 0.38 -0.25 -0.22 -0.16 -1.8939 0.0565 -4.1 0.8 -7.0 0.6Reading 11 7375 A.2.6.1 2 4252 0.58 0.58 0.14 0.10 0.17 0.01 0.20 0.20 -0.17 -0.14 0.02 0.3618 0.0345 9.6 1.1 9.7 1.2Reading 11 7456 B.3.3.2 2 4252 0.47 0.18 0.16 0.19 0.47 0.00 0.31 -0.09 -0.18 -0.12 0.31 0.8777 0.0340 1.6 1.0 2.2 1.0Reading 11 7522 B.1.1.1 2 4252 0.50 0.17 0.14 0.19 0.50 0.00 0.33 -0.20 -0.25 0.00 0.33 0.7493 0.0340 -0.1 1.0 -0.4 1.0Reading 11 7853 B.3.3.3 2 4252 0.62 0.06 0.27 0.05 0.62 0.01 0.34 -0.24 -0.13 -0.21 0.34 0.1669 0.0351 0.2 1.0 0.7 1.0Reading 11 8427 B.3.2.2 2 4252 0.52 0.52 0.26 0.12 0.10 0.00 0.43 0.43 -0.15 -0.28 -0.19 0.6140 0.0341 -7.7 0.9 -7.3 0.9Reading 11 9077 A.2.2.2 2 4252 0.81 0.81 0.09 0.07 0.02 0.01 0.40 0.40 -0.21 -0.26 -0.14 -0.9573 0.0426 -4.2 0.9 -5.3 0.8Reading 11 9204 A.2.4.1 2 4252 0.52 0.18 0.16 0.52 0.14 0.00 0.17 -0.01 -0.15 0.17 -0.07 0.6547 0.0341 9.9 1.2 9.9 1.2Reading 11 9532 A.2.4.1 1 4252 0.57 0.11 0.57 0.21 0.10 0.00 0.28 -0.25 0.28 -0.08 -0.08 0.3930 0.0344 4.6 1.1 3.7 1.1Reading 11 9575 A.2.4.1 1 4252 0.53 0.53 0.09 0.17 0.21 0.00 0.23 0.23 -0.15 -0.16 -0.02 0.6038 0.0341 7.3 1.1 6.6 1.1Reading 11 9740 A.2.3.2 1 4252 0.60 0.05 0.11 0.23 0.60 0.00 0.23 -0.20 -0.18 -0.03 0.23 0.2698 0.0347 6.9 1.1 7.6 1.2Reading 11 9896 B.2.1.1 2 4252 0.66 0.08 0.19 0.66 0.06 0.00 0.43 -0.17 -0.31 0.43 -0.12 -0.0571 0.0360 -5.3 0.9 -5.4 0.9Science 8 0482 D.1.3.2 2 3554 0.58 0.15 0.58 0.20 0.07 0.00 0.35 -0.25 0.35 -0.13 -0.12 0.1965 0.0374 -2.8 1.0 -3.1 0.9Science 8 1124 A.3.1.2 2 3554 0.49 0.06 0.11 0.33 0.49 0.00 0.33 -0.20 -0.23 -0.09 0.33 0.6386 0.0368 -1.5 1.0 -1.0 1.0Science 8 1516 C.2.1.2 2 3554 0.42 0.11 0.34 0.42 0.12 0.00 0.18 -0.09 -0.01 0.18 -0.17 0.9490 0.0371 7.3 1.1 7.9 1.2Science 8 1850 C.3.1.1 3 3554 0.68 0.15 0.07 0.68 0.09 0.00 0.37 -0.20 -0.23 0.37 -0.12 -0.2698 0.0393 -3.6 0.9 -4.9 0.9Science 8 2117 A.1.1.4 2 3554 0.59 0.59 0.12 0.15 0.14 0.00 0.26 0.26 -0.17 -0.11 -0.09 0.2088 0.0373 2.8 1.0 3.5 1.1Science 8 2346 C.2.2.3 1 3554 0.65 0.05 0.10 0.65 0.20 0.00 0.39 -0.22 -0.24 0.39 -0.16 -0.0728 0.0383 -5.5 0.9 -5.9 0.9Science 8 2382 A.1.2.3 2 3554 0.48 0.18 0.20 0.14 0.48 0.00 0.34 -0.15 -0.15 -0.16 0.34 0.6796 0.0368 -3.2 1.0 -3.1 1.0Science 8 2854 C.3.1.3 2 3554 0.50 0.21 0.17 0.12 0.50 0.00 0.38 -0.11 -0.19 -0.23 0.38 0.6002 0.0368 -5.9 0.9 -5.3 0.9Science 8 2978 A.2.1.2 2 3554 0.75 0.11 0.75 0.04 0.10 0.00 0.38 -0.15 0.38 -0.17 -0.28 -0.6532 0.0420 -4.6 0.9 -3.9 0.9
Appendix I: Item Statistics Multiple Choice
2012 PSSA-M Technical Report I-9

Cont Grade PubID Std DOK N PVal P(A) P(B) P(C) P(D) P(-) PtBis PT(A) PT(B) PT(C) PT(D) Meas MeasSE t MS t MSItem Information Classical Infit OutfitRasch
Science 8 3384 B.1.1.4 1 3554 0.42 0.24 0.23 0.42 0.10 0.00 0.22 -0.08 -0.09 0.22 -0.12 0.9706 0.0372 3.5 1.1 5.0 1.1Science 8 3472 A.1.3.4 2 3554 0.76 0.11 0.76 0.08 0.05 0.00 0.45 -0.25 0.45 -0.25 -0.22 -0.7182 0.0425 -7.3 0.9 -7.9 0.8Science 8 3850 D.1.2.1 1 3554 0.71 0.07 0.13 0.08 0.71 0.01 0.40 -0.25 -0.19 -0.20 0.40 -0.4325 0.0403 -5.2 0.9 -5.9 0.8Science 8 4524 D.2.1.2 2 3554 0.52 0.52 0.14 0.11 0.23 0.00 0.35 0.35 -0.23 -0.22 -0.07 0.5194 0.0369 -3.8 1.0 -3.7 0.9Science 8 4748 D.1.3.1 2 3554 0.68 0.68 0.11 0.11 0.10 0.00 0.41 0.41 -0.16 -0.24 -0.22 -0.2547 0.0392 -5.9 0.9 -5.9 0.9Science 8 5066 A.2.2.1 2 3554 0.70 0.70 0.10 0.06 0.14 0.00 0.20 0.20 -0.05 -0.13 -0.12 -0.3539 0.0398 3.6 1.1 3.5 1.1Science 8 5299 A.3.3.1 1 3554 0.43 0.22 0.43 0.14 0.21 0.01 0.28 -0.11 0.28 -0.19 -0.07 0.9382 0.0371 1.1 1.0 1.8 1.0Science 8 5867 A.1.2.2 2 3554 0.29 0.19 0.29 0.32 0.20 0.00 0.15 0.03 0.15 -0.07 -0.11 1.6469 0.0401 3.7 1.1 6.9 1.2Science 8 6013 A.3.1.3 1 3554 0.38 0.38 0.41 0.13 0.08 0.00 0.29 0.29 -0.02 -0.21 -0.22 1.1933 0.0378 -1.3 1.0 0.5 1.0Science 8 6352 A.2.2.1 2 3554 0.62 0.18 0.13 0.07 0.62 0.00 0.30 -0.13 -0.13 -0.19 0.30 0.0475 0.0378 -0.2 1.0 -0.3 1.0Science 8 6846 A.1.3.3 2 3554 0.67 0.67 0.10 0.13 0.10 0.00 0.40 0.40 -0.12 -0.24 -0.24 -0.1891 0.0389 -6.0 0.9 -4.9 0.9Science 8 7112 A.1.3.2 2 3554 0.52 0.05 0.07 0.52 0.36 0.00 -0.19 -0.13 -0.19 -0.19 0.36 0.5512 0.0368 9.9 1.4 9.9 1.6Science 8 7210 B.2.1.4 2 3554 0.60 0.60 0.15 0.14 0.11 0.00 0.34 0.34 -0.17 -0.17 -0.15 0.1404 0.0375 -2.5 1.0 -2.8 1.0Science 8 7373 C.2.2.1 1 3554 0.85 0.04 0.07 0.85 0.04 0.00 0.28 -0.13 -0.18 0.28 -0.14 -1.3768 0.0503 -1.6 1.0 -2.1 0.9Science 8 7422 B.2.2.1 2 3554 0.53 0.25 0.10 0.12 0.53 0.00 0.25 -0.12 -0.12 -0.11 0.25 0.4783 0.0369 3.1 1.0 2.8 1.1Science 8 7749 D.3.1.2 2 3554 0.66 0.66 0.14 0.05 0.15 0.00 0.18 0.18 -0.09 -0.26 0.01 -0.1641 0.0387 5.8 1.1 5.8 1.2Science 8 8415 B.3.1.3 2 3554 0.73 0.73 0.09 0.10 0.08 0.00 0.34 0.34 -0.25 -0.10 -0.19 -0.5199 0.0409 -2.6 1.0 -2.8 0.9Science 8 8651 A.3.1.2 2 3554 0.71 0.71 0.07 0.15 0.07 0.00 0.33 0.33 -0.22 -0.13 -0.18 -0.4246 0.0403 -2.2 1.0 -2.1 0.9Science 8 8923 B.1.1.2 2 3554 0.86 0.07 0.86 0.04 0.03 0.00 0.33 -0.19 0.33 -0.19 -0.16 -1.4704 0.0518 -3.0 0.9 -4.2 0.8Science 8 9352 A.2.2.2 1 3554 0.83 0.04 0.83 0.09 0.03 0.00 0.38 -0.18 0.38 -0.25 -0.20 -1.1860 0.0477 -4.5 0.9 -6.1 0.7Science 8 9655 A.1.1.2 2 3554 0.67 0.08 0.67 0.17 0.08 0.00 0.29 -0.07 0.29 -0.28 -0.05 -0.1965 0.0389 0.2 1.0 0.4 1.0Science 11 1007 A.2.1.4 2 3739 0.55 0.08 0.55 0.20 0.18 0.00 0.32 -0.12 0.32 -0.20 -0.12 -0.0911 0.0366 1.9 1.0 0.9 1.0Science 11 1335 B.2.1.2 2 3739 0.56 0.17 0.56 0.17 0.11 0.00 0.26 -0.03 0.26 -0.22 -0.10 -0.1408 0.0367 6.2 1.1 6.3 1.1Science 11 1828 D.3.1.2 2 3739 0.32 0.32 0.20 0.32 0.16 0.01 0.24 0.24 -0.14 -0.06 -0.06 1.0077 0.0388 4.9 1.1 5.4 1.2Science 11 2495 D.2.1.2 2 3739 0.33 0.18 0.29 0.19 0.33 0.00 0.29 -0.15 0.01 -0.20 0.29 0.9650 0.0386 2.3 1.0 4.2 1.1Science 11 2745 B.3.3.3 3 3739 0.30 0.30 0.30 0.22 0.19 0.00 0.29 0.29 0.03 -0.21 -0.15 1.1543 0.0396 1.6 1.0 3.2 1.1Science 11 2995 D.1.2.2 2 3739 0.58 0.58 0.12 0.16 0.14 0.00 0.50 0.50 -0.28 -0.22 -0.20 -0.2672 0.0369 -9.9 0.9 -9.9 0.8Science 11 3055 A.2.1.3 2 3739 0.63 0.13 0.09 0.15 0.63 0.00 0.49 -0.22 -0.23 -0.26 0.49 -0.4849 0.0375 -9.9 0.9 -9.5 0.8Science 11 3210 A.2.1.2 2 3739 0.72 0.12 0.10 0.72 0.05 0.00 0.34 -0.15 -0.23 0.34 -0.15 -0.9695 0.0398 -2.5 1.0 -1.7 1.0Science 11 3520 C.2.2.3 1 3739 0.46 0.46 0.15 0.14 0.25 0.00 0.42 0.42 -0.23 -0.24 -0.10 0.3438 0.0367 -5.5 0.9 -4.6 0.9Science 11 3840 A.1.1.1 3739 0.51 0.51 0.06 0.34 0.08 0.00 0.40 0.40 -0.16 -0.20 -0.23 0.0727 0.0365 -2.9 1.0 -3.0 0.9Science 11 3927 B.3.1.3 2 3739 0.49 0.49 0.06 0.15 0.30 0.00 0.37 0.37 -0.24 -0.09 -0.21 0.1884 0.0366 -1.3 1.0 -1.0 1.0Science 11 4137 B.3.2.2 3 3739 0.39 0.17 0.39 0.30 0.13 0.00 0.35 -0.10 0.35 -0.20 -0.12 0.6494 0.0374 -0.5 1.0 0.9 1.0Science 11 4514 C.1.1.1 2 3739 0.68 0.05 0.11 0.68 0.16 0.00 0.32 -0.14 -0.19 0.32 -0.16 -0.7391 0.0385 -1.0 1.0 0.2 1.0Science 11 4743 C.1.1.6 2 3739 0.52 0.09 0.21 0.52 0.18 0.00 0.37 -0.17 -0.16 0.37 -0.17 0.0221 0.0365 -1.3 1.0 -1.4 1.0Science 11 5261 D.1.1.2 2 3739 0.49 0.18 0.49 0.12 0.21 0.00 0.29 -0.09 0.29 -0.24 -0.09 0.1936 0.0366 4.3 1.1 3.5 1.1Science 11 5497 A.1.1.2 2 3739 0.34 0.17 0.10 0.39 0.34 0.00 0.17 -0.04 -0.21 -0.01 0.17 0.9243 0.0384 9.5 1.2 9.2 1.2Science 11 5757 A.3.2.3 2 3739 0.35 0.14 0.35 0.31 0.20 0.00 0.27 -0.01 0.27 -0.21 -0.07 0.8954 0.0383 3.3 1.1 5.4 1.1Science 11 6041 A.1.1.3 2 3739 0.56 0.08 0.08 0.27 0.56 0.00 0.12 -0.01 -0.15 -0.04 0.12 -0.1591 0.0367 9.9 1.2 9.9 1.3Science 11 6229 A.3.3.3 2 3739 0.55 0.18 0.12 0.15 0.55 0.00 0.45 -0.17 -0.25 -0.21 0.45 -0.1199 0.0367 -7.4 0.9 -6.8 0.9Science 11 6402 A.2.1.4 2 3739 0.76 0.06 0.14 0.76 0.04 0.00 0.44 -0.20 -0.29 0.44 -0.20 -1.2384 0.0418 -7.8 0.9 -7.2 0.8
Appendix I: Item Statistics Multiple Choice
2012 PSSA-M Technical Report I-10

Cont Grade PubID Std DOK N PVal P(A) P(B) P(C) P(D) P(-) PtBis PT(A) PT(B) PT(C) PT(D) Meas MeasSE t MS t MSItem Information Classical Infit OutfitRasch
Science 11 7135 A.3.1.2 2 3739 0.56 0.10 0.27 0.56 0.08 0.00 0.43 -0.15 -0.34 0.43 -0.07 -0.1526 0.0367 -6.0 0.9 -4.4 0.9Science 11 7317 D.3.1.3 2 3739 0.68 0.68 0.16 0.05 0.10 0.00 0.33 0.33 -0.22 -0.16 -0.12 -0.7682 0.0386 -0.9 1.0 -0.9 1.0Science 11 8026 A.3.3.1 2 3739 0.58 0.13 0.58 0.15 0.13 0.00 0.29 -0.25 0.29 -0.12 -0.05 -0.2658 0.0369 3.5 1.1 1.9 1.0Science 11 8097 A.2.2.1 2 3739 0.63 0.06 0.13 0.17 0.63 0.00 0.46 -0.17 -0.27 -0.23 0.46 -0.5205 0.0376 -8.6 0.9 -6.9 0.8Science 11 8304 B.3.2.3 2 3739 0.55 0.20 0.12 0.55 0.13 0.00 0.43 -0.19 -0.24 0.43 -0.17 -0.1251 0.0367 -5.7 0.9 -4.9 0.9Science 11 8724 D.1.3.1 2 3739 0.42 0.10 0.14 0.33 0.42 0.00 0.42 -0.24 -0.18 -0.14 0.42 0.4984 0.0370 -4.7 0.9 -4.1 0.9Science 11 8774 A.3.1.1 3 3739 0.73 0.08 0.09 0.10 0.73 0.00 0.39 -0.20 -0.21 -0.21 0.39 -1.0658 0.0404 -5.1 0.9 -4.7 0.9Science 11 9528 C.3.1.3 2 3739 0.36 0.15 0.09 0.36 0.40 0.00 0.22 -0.01 -0.09 0.22 -0.15 0.8157 0.0380 7.3 1.1 7.6 1.2Science 11 9753 A.2.1.5 2 3739 0.76 0.04 0.04 0.76 0.17 0.00 0.29 -0.21 -0.20 0.29 -0.13 -1.1942 0.0414 -0.8 1.0 0.1 1.0Science 11 9919 A.1.2.1 3 3739 0.27 0.27 0.32 0.15 0.25 0.00 0.31 0.31 -0.17 -0.07 -0.08 1.3425 0.0409 -0.7 1.0 1.7 1.1
Appendix I: Item Statistics Multiple Choice
2012 PSSA-M Technical Report I-11

Cont Grade PubID Std DOK N Mean P(0) P(1) P(2) P(3) P(4) P(B) PtBis PT(0) PT(1) PT(2) PT(3) PT(4) Meas MeasSE t MS t MSMath 4 2541 B.1 2 2707 0.99 0.42 0.31 0.19 0.05 0.04 0.00 0.51 -0.45 0.05 0.28 0.21 0.21 1.7937 0.0239 -1.2 1.0 -1.9 0.9Math 4 7961 A.2 3 2707 1.00 0.45 0.32 0.08 0.07 0.08 0.00 0.52 -0.51 0.16 0.18 0.21 0.29 1.5309 0.0209 0.4 1.0 1.0 1.0Math 5 2118 D.1 3724 1.32 0.39 0.27 0.10 0.10 0.14 0.00 0.53 -0.49 0.09 0.07 0.15 0.39 1.0408 0.0180 0.5 1.0 0.4 1.0Math 5 7194 A.2 3724 0.49 0.69 0.20 0.07 0.03 0.01 0.00 0.38 -0.31 0.07 0.24 0.20 0.17 2.4570 0.0252 0.7 1.0 4.6 1.2Math 6 2808 A.3 4052 0.67 0.48 0.41 0.08 0.02 0.01 0.00 0.41 -0.35 0.15 0.23 0.16 0.14 1.4602 0.0243 -1.3 1.0 -1.9 0.9Math 6 5349 E.2 4052 1.10 0.19 0.57 0.19 0.04 0.01 0.00 0.52 -0.35 -0.11 0.33 0.25 0.15 1.3380 0.0270 -3.7 0.9 -4.2 0.9Math 7 9565 D.3 2 4276 0.57 0.78 0.05 0.04 0.07 0.06 0.01 0.44 -0.43 0.10 0.14 0.26 0.27 1.4389 0.0196 5.3 1.2 4.5 1.6Math 7 9637 A.2 2 4276 1.37 0.29 0.34 0.14 0.15 0.08 0.00 0.61 -0.50 -0.05 0.17 0.30 0.32 0.7503 0.0188 -4.5 0.9 -4.6 0.9Math 8 0859 D.2 2 4440 0.94 0.39 0.39 0.13 0.08 0.01 0.01 0.55 -0.53 0.17 0.29 0.24 0.13 1.3549 0.0215 -2.7 0.9 -3.3 0.9Math 8 5551 A.2 2 4440 1.02 0.32 0.42 0.20 0.04 0.02 0.00 0.49 -0.44 0.09 0.24 0.22 0.17 1.1307 0.0221 -0.2 1.0 0.0 1.0Math 11 7244 B.2 4603 0.61 0.55 0.35 0.06 0.01 0.03 0.03 0.54 -0.49 0.24 0.29 0.14 0.26 1.4930 0.0227 -3.8 0.9 -4.2 0.9Math 11 8130 D.1 4603 0.63 0.47 0.47 0.04 0.03 0.00 0.03 0.53 -0.48 0.32 0.21 0.25 0.07 2.0356 0.0254 -3.0 0.9 -3.6 0.9Reading 4 2295 B.1.1.1 3 3710 1.39 0.18 0.35 0.37 0.10 0.02 0.49 -0.36 -0.17 0.29 0.27 0.2830 0.0224 -2.8 0.9 -3.0 0.9Reading 4 7374 A.2.4.1 1 3710 1.41 0.27 0.29 0.20 0.24 0.01 0.51 -0.41 -0.08 0.13 0.39 0.1229 0.0189 0.3 1.0 0.7 1.0Reading 5 0170 A.2.4.1 3 4669 1.56 0.22 0.24 0.29 0.25 0.01 0.62 -0.49 -0.17 0.18 0.45 0.3976 0.0182 -4.7 0.9 -4.4 0.9Reading 5 7637 B.1.1.1 3 4669 1.53 0.08 0.42 0.39 0.11 0.01 0.44 -0.30 -0.23 0.25 0.23 0.3609 0.0227 4.3 1.1 4.4 1.1Reading 6 1061 A.2.4.1 2 4534 1.53 0.14 0.34 0.36 0.16 0.01 0.55 -0.43 -0.19 0.25 0.33 0.5328 0.0205 -3.8 0.9 -3.9 0.9Reading 6 1340 B.1.1.1 3 4534 1.21 0.19 0.48 0.28 0.06 0.01 0.36 -0.34 0.02 0.19 0.16 1.1649 0.0225 8.2 1.2 8.0 1.2Reading 7 6730 B.1.1.1 3 4558 1.56 0.17 0.31 0.31 0.21 0.01 0.55 -0.38 -0.21 0.16 0.41 0.2314 0.0188 -3.5 0.9 -3.8 0.9Reading 7 8855 A.2.3.1 3 4558 1.13 0.21 0.51 0.23 0.06 0.01 0.43 -0.37 0.00 0.24 0.21 0.9717 0.0222 1.4 1.0 1.5 1.0Reading 8 3649 A.2.4.1 3 4304 1.57 0.14 0.30 0.40 0.15 0.01 0.50 -0.37 -0.21 0.24 0.30 0.3076 0.0204 -4.2 0.9 -4.3 0.9Reading 8 9491 A.1.5.1 3 4304 1.83 0.08 0.26 0.41 0.25 0.01 0.55 -0.31 -0.33 0.10 0.42 -0.1832 0.0208 -8.1 0.9 -8.1 0.8Reading 11 2929 B.1.1.1 2 4252 1.65 0.09 0.36 0.36 0.19 0.02 0.51 -0.34 -0.27 0.21 0.32 0.3314 0.0217 -2.4 1.0 -2.4 1.0Reading 11 4644 A.2.3.1 2 4252 1.53 0.12 0.41 0.30 0.18 0.02 0.49 -0.35 -0.22 0.23 0.31 0.5595 0.0209 -1.5 1.0 -1.5 1.0Science 8 0051 B.1.1.2 2 3554 0.92 0.27 0.54 0.19 0.01 0.39 -0.35 0.11 0.26 0.7988 0.0287 -0.2 1.0 -0.3 1.0Science 8 1617 A.2.1.1 3 3554 0.94 0.31 0.45 0.24 0.01 0.32 -0.24 -0.04 0.30 0.7382 0.0266 3.7 1.1 3.7 1.1Science 11 4597 A.1.1.4 3 3739 1.12 0.22 0.44 0.34 0.05 0.38 -0.32 -0.04 0.32 -0.1759 0.0265 4.0 1.1 5.6 1.1Science 11 9301 D.1.1.3 3 3739 0.38 0.67 0.27 0.06 0.04 0.45 -0.45 0.35 0.24 1.8211 0.0319 -3.9 0.9 -3.1 0.9
Item Information Classical Rasch Infit Outfit
Appendix I: Item Statistics Open Ended
2012 PSSA-M Technical Report I-12

Appendix J:
Linking Item Statistics
Column Heading Definition
Type Item type Form Form Seq Sequence Prev Form Previous form Prev Seq Previous sequence Prev P-Val Previous P-Value P-Val P-Value Prev Meas Previous Rasch item measure Meas Rasch item measure


Reading Grade 4
ID Type Form SeqPrevForm
PrevSeq
PrevP-Val P-Val
PrevMeas Meas
598532 MC 0 8 0 8 0.49 0.45 0.1931 0.3086598583 MC 0 9 0 9 0.72 0.71 -0.8839 -0.9301599427 MC 0 10 0 10 0.57 0.54 -0.1695 -0.1120598575 MC 0 11 0 11 0.49 0.46 0.2258 0.2405598373 MC 0 12 0 12 0.59 0.56 -0.2712 -0.2112598574 MC 0 13 0 13 0.36 0.35 0.8112 0.7871598529 MC 0 20 0 20 0.63 0.63 -0.4502 -0.5191598519 MC 0 21 0 21 0.64 0.60 -0.4909 -0.3918598514 MC 0 22 0 22 0.41 0.41 0.5959 0.4914598508 MC 0 23 0 23 0.32 0.31 1.0465 0.9851598412 MC 0 24 0 24 0.41 0.39 0.6058 0.5709598538 MC 0 25 0 25 0.48 0.45 0.2736 0.2669
Mean 0.51 0.49 0.12 0.12
Appendix J: Linking Item Statistics
2012 PSSA-M Technical Report J-1

Reading Grade 5
ID Type Form SeqPrevForm
PrevSeq
PrevP-Val P-Val
PrevMeas Meas
599575 MC 0 1 0 8 0.75 0.77 -0.9049 -0.9434599214 MC 0 2 0 9 0.55 0.60 0.1682 0.0183592371 MC 0 3 0 10 0.47 0.50 0.5718 0.5025599217 MC 0 4 0 11 0.54 0.58 0.2411 0.0973565177 MC 0 5 0 12 0.49 0.52 0.4832 0.3929561547 MC 0 6 0 13 0.41 0.45 0.8913 0.7550598411 MC 0 20 0 20 0.41 0.41 0.8635 0.9352598510 MC 0 21 0 21 0.62 0.64 -0.1852 -0.1942598399 MC 0 22 0 22 0.80 0.79 -1.2316 -1.0785598415 MC 0 23 0 23 0.64 0.63 -0.2647 -0.1538598491 MC 0 24 0 24 0.49 0.47 0.4955 0.6257598423 MC 0 25 0 25 0.61 0.58 -0.0863 0.0844
Mean 0.57 0.58 0.09 0.09
Appendix J: Linking Item Statistics
2012 PSSA-M Technical Report J-2

Reading Grade 6
ID Type Form SeqPrevForm
PrevSeq
PrevP-Val P-Val
PrevMeas Meas
598543 MC 0 8 0 8 0.51 0.51 0.6164 0.5539599244 MC 0 9 0 9 0.73 0.73 -0.5373 -0.5398599248 MC 0 10 0 10 0.77 0.74 -0.7566 -0.6197598545 MC 0 11 0 11 0.42 0.40 1.0743 1.0920599247 MC 0 12 0 12 0.67 0.66 -0.1716 -0.1707598557 MC 0 13 0 13 0.36 0.35 1.3832 1.3524598548 MC 0 14 0 14 0.42 0.38 1.0368 1.1816598444 MC 0 21 0 21 0.67 0.67 -0.2056 -0.2300598464 MC 0 22 0 22 0.71 0.73 -0.4003 -0.5834598443 MC 0 23 0 23 0.72 0.70 -0.4643 -0.4026598452 MC 0 24 0 24 0.48 0.47 0.7803 0.7527598457 MC 0 25 0 25 0.56 0.55 0.3992 0.3686
Mean 0.58 0.57 0.23 0.23
Appendix J: Linking Item Statistics
2012 PSSA-M Technical Report J-3
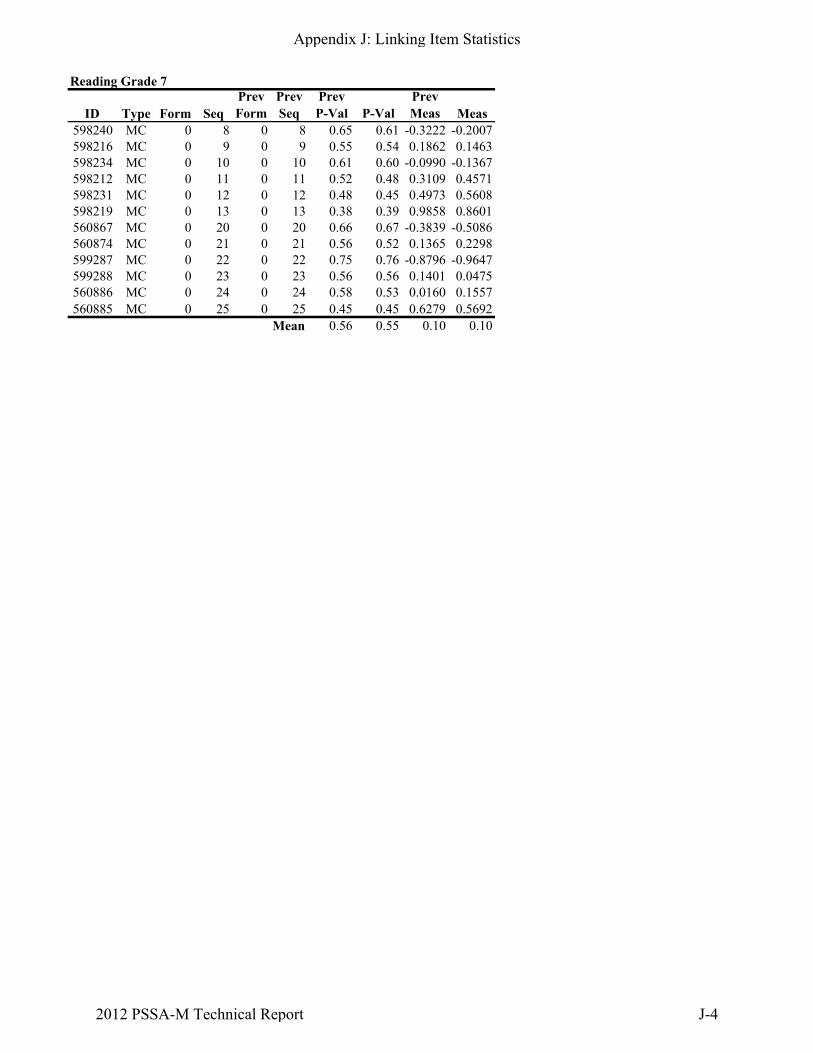
Reading Grade 7
ID Type Form SeqPrevForm
PrevSeq
PrevP-Val P-Val
PrevMeas Meas
598240 MC 0 8 0 8 0.65 0.61 -0.3222 -0.2007598216 MC 0 9 0 9 0.55 0.54 0.1862 0.1463598234 MC 0 10 0 10 0.61 0.60 -0.0990 -0.1367598212 MC 0 11 0 11 0.52 0.48 0.3109 0.4571598231 MC 0 12 0 12 0.48 0.45 0.4973 0.5608598219 MC 0 13 0 13 0.38 0.39 0.9858 0.8601560867 MC 0 20 0 20 0.66 0.67 -0.3839 -0.5086560874 MC 0 21 0 21 0.56 0.52 0.1365 0.2298599287 MC 0 22 0 22 0.75 0.76 -0.8796 -0.9647599288 MC 0 23 0 23 0.56 0.56 0.1401 0.0475560886 MC 0 24 0 24 0.58 0.53 0.0160 0.1557560885 MC 0 25 0 25 0.45 0.45 0.6279 0.5692
Mean 0.56 0.55 0.10 0.10
Appendix J: Linking Item Statistics
2012 PSSA-M Technical Report J-4

Reading Grade 8
ID Type Form SeqPrevForm
PrevSeq
PrevP-Val P-Val
PrevMeas Meas
561421 MC 0 8 0 8 0.76 0.73 -0.8670 -0.7308561416 MC 0 9 0 9 0.75 0.73 -0.7903 -0.7001561424 MC 0 10 0 10 0.50 0.51 0.4811 0.3301599095 MC 0 11 0 11 0.59 0.56 0.0594 0.1121562056 MC 0 12 0 12 0.68 0.67 -0.3766 -0.3928599096 MC 0 13 0 13 0.68 0.67 -0.3866 -0.4023599098 MC 0 14 0 14 0.50 0.52 0.4633 0.2893561470 MC 0 21 0 20 0.85 0.83 -1.4457 -1.4121599111 MC 0 22 0 21 0.47 0.45 0.6245 0.5970599110 MC 0 23 0 22 0.48 0.46 0.5800 0.5689561458 MC 0 24 0 23 0.61 0.57 -0.0390 0.0575561463 MC 0 25 0 24 0.37 0.35 1.1036 1.0903
Mean 0.60 0.59 -0.05 -0.05
Appendix J: Linking Item Statistics
2012 PSSA-M Technical Report J-5

Reading Grade 11
ID Type Form SeqPrevForm
PrevSeq
PrevP-Val P-Val
PrevMeas Meas
599164 MC 0 8 0 8 0.57 0.58 0.4613 0.3618599165 MC 0 9 0 9 0.86 0.84 -1.2596 -1.1539561673 MC 0 10 0 10 0.80 0.78 -0.7839 -0.7222561683 MC 0 11 0 11 0.65 0.65 0.0696 0.0312561687 MC 0 12 0 12 0.52 0.52 0.6744 0.6140561697 MC 0 13 0 13 0.67 0.68 -0.0624 -0.1346561660 MC 0 20 0 20 0.71 0.68 -0.2374 -0.1501599155 MC 0 21 0 21 0.55 0.55 0.5371 0.5143561658 MC 0 22 0 22 0.57 0.53 0.4770 0.6208599152 MC 0 23 0 23 0.77 0.75 -0.6401 -0.5438562079 MC 0 24 0 24 0.91 0.91 -1.8238 -1.8939561669 MC 0 25 0 25 0.45 0.47 0.9947 0.8630
Mean 0.67 0.66 -0.13 -0.13
Appendix J: Linking Item Statistics
2012 PSSA-M Technical Report J-6

Science Grade 8
ID Type Form SeqPrevForm
PrevSeq
PrevP-Val P-Val
PrevMeas Meas
597847 MC 0 4 0 4 0.50 0.48 0.6558 0.6796561623 MC 0 7 0 5 0.76 0.76 -0.6556 -0.7182597794 MC 0 9 0 7 0.62 0.62 0.0779 0.0475597725 MC 0 12 0 10 0.73 0.71 -0.4600 -0.4246561625 MC 0 14 0 13 0.43 0.38 0.9561 1.1933597857 MC 0 17 0 18 0.89 0.86 -1.6581 -1.4704561624 MC 0 19 0 20 0.62 0.60 0.0824 0.1404597874 MC 0 23 0 25 0.82 0.85 -1.0426 -1.3768561633 MC 0 25 0 26 0.49 0.50 0.7084 0.6002597929 MC 0 27 0 27 0.72 0.71 -0.4497 -0.4325560796 MC 0 28 0 28 0.69 0.68 -0.2725 -0.2547597896 MC 0 29 0 29 0.59 0.58 0.2384 0.1965
Mean 0.65 0.65 -0.15 -0.15
Appendix J: Linking Item Statistics
2012 PSSA-M Technical Report J-7

Science Grade 11
ID Type Form SeqPrevForm
PrevSeq
PrevP-Val P-Val
PrevMeas Meas
561202 MC 0 8 0 9 0.53 0.55 0.0485 -0.0911560903 MC 0 10 0 10 0.66 0.63 -0.5841 -0.5205597968 MC 0 11 0 12 0.74 0.73 -0.9900 -1.0658598783 MC 0 12 0 13 0.59 0.56 -0.2141 -0.1526560814 MC 0 13 0 15 0.37 0.35 0.7990 0.8954561246 MC 0 18 0 18 0.49 0.49 0.2314 0.1884598020 MC 0 21 0 22 0.29 0.30 1.1909 1.1543597952 MC 0 22 0 23 0.67 0.68 -0.6325 -0.7391597954 MC 0 24 0 25 0.48 0.46 0.2634 0.3438597972 MC 0 26 0 27 0.50 0.49 0.1956 0.1936597948 MC 0 30 0 31 0.35 0.32 0.9057 1.0077
Mean 0.52 0.50 0.11 0.11
Appendix J: Linking Item Statistics
2012 PSSA-M Technical Report J-8

Appendix K:
Reliabilities
Column Heading Definition
Strand Strand (Tot.=total) Group Subgroup Pts. Points possible Len. Length N N Mean Mean SD Standard deviation r Reliability coefficient SEM Standard error of measurement Items Item types present


Mathematics Grade 4
Strand Group Pts. Len. N Mean SD r SEM ItemsTot. All 38 32 2708 21.0 6.51 0.82 2.7 MC/OEA All 18 15 2708 8.3 3.68 0.70 2.0 MC/OEB All 5 2 2708 1.5 1.26 0.22 1.1 MC/OEC All 5 5 2708 3.6 1.21 0.44 0.9 MCD All 5 5 2708 3.6 1.09 0.43 0.8 MCE All 5 5 2708 4.0 1.20 0.61 0.8 MC
Strand Group Pts. Len. N Mean SD r SEM ItemsMale 38 32 1625 21.2 6.64 0.83 2.8 MC/OEFemale 38 32 1081 20.8 6.31 0.82 2.7 MC/OEMale 18 15 1625 8.4 3.73 0.70 2.0 MC/OEFemale 18 15 1081 8.2 3.59 0.68 2.0 MC/OEMale 5 2 1625 1.6 1.30 0.23 1.1 MC/OEFemale 5 2 1081 1.3 1.19 0.19 1.1 MC/OEMale 5 5 1625 3.5 1.23 0.44 0.9 MCFemale 5 5 1081 3.7 1.18 0.43 0.9 MCMale 5 5 1625 3.7 1.07 0.42 0.8 MCFemale 5 5 1081 3.5 1.11 0.43 0.8 MCMale 5 5 1625 3.9 1.23 0.61 0.8 MCFemale 5 5 1081 4.0 1.16 0.60 0.7 MC
Strand Group Pts. Len. N Mean SD r SEM ItemsWhite 38 32 1655 22.0 6.40 0.82 2.7 MC/OEAf. Amer. 38 32 645 18.8 6.50 0.82 2.7 MC/OEHispanic 38 32 298 20.6 6.00 0.80 2.7 MC/OEAsian 38 32 30 21.2 6.03 0.82 2.5 MC/OEAm. Indian 38 32 5 21.8 8.07 0.90 2.6 MC/OEMulti 38 32 71 19.7 6.38 0.81 2.8 MC/OEWhite 18 15 1655 8.8 3.72 0.70 2.0 MC/OEAf. Amer. 18 15 645 7.3 3.48 0.67 2.0 MC/OEHispanic 18 15 298 8.2 3.35 0.65 2.0 MC/OEAsian 18 15 30 8.5 3.64 0.75 1.8 MC/OEAm. Indian 18 15 5 8.8 4.15 0.83 1.7 MC/OEMulti 18 15 71 7.5 3.69 0.69 2.0 MC/OEWhite 5 2 1655 1.6 1.28 0.21 1.1 MC/OEAf. Amer. 5 2 645 1.2 1.18 0.22 1.0 MC/OEHispanic 5 2 298 1.3 1.21 0.12 1.1 MC/OEAsian 5 2 30 1.3 0.99 0.12 0.9 MC/OEAm. Indian 5 2 5 1.6 1.52 0.43 1.1 MC/OEMulti 5 2 71 1.3 1.25 0.45 0.9 MC/OEWhite 5 5 1655 3.7 1.16 0.42 0.9 MCAf. Amer. 5 5 645 3.3 1.28 0.43 1.0 MCHispanic 5 5 298 3.5 1.22 0.44 0.9 MCAsian 5 5 30 3.5 1.22 0.41 0.9 MCAm. Indian 5 5 5 4.2 0.45 -3.13 0.9 MCMulti 5 5 71 3.4 1.13 0.24 1.0 MC
Ove
rall
Gen
der
Tot.
A
B
C
D
E
Eth
nic
ity
Tot.
A
B
C
Appendix K: Reliabilities
2012 PSSA-M Technical Report K-1

White 5 5 1655 3.7 1.06 0.41 0.8 MCAf. Amer. 5 5 645 3.4 1.16 0.46 0.9 MCHispanic 5 5 298 3.6 1.02 0.37 0.8 MCAsian 5 5 30 3.5 1.07 0.35 0.9 MCAm. Indian 5 5 5 3.4 1.14 0.19 1.0 MCMulti 5 5 71 3.5 1.24 0.50 0.9 MCWhite 5 5 1655 4.1 1.12 0.58 0.7 MCAf. Amer. 5 5 645 3.6 1.33 0.62 0.8 MCHispanic 5 5 298 3.9 1.18 0.57 0.8 MCAsian 5 5 30 4.3 1.01 0.53 0.7 MCAm. Indian 5 5 5 3.8 1.79 0.86 0.7 MCMulti 5 5 71 4.0 1.18 0.63 0.7 MC
Strand Group Pts. Len. N Mean SD r SEM ItemsTot. All 38 32 140 20.1 5.59 0.78 2.6 MC/OEA All 18 15 140 8.0 3.15 0.62 1.9 MC/OEB All 5 2 140 1.1 1.03 0.19 0.9 MC/OEC All 5 5 140 3.5 1.22 0.42 0.9 MCD All 5 5 140 3.6 1.03 0.32 0.8 MCE All 5 5 140 3.9 1.14 0.55 0.8 MC
Strand Group Pts. Len. N Mean SD r SEM ItemsTot. All 38 32 1747 20.6 6.47 0.82 2.7 MC/OEA All 18 15 1747 8.1 3.61 0.69 2.0 MC/OEB All 5 2 1747 1.4 1.25 0.22 1.1 MC/OEC All 5 5 1747 3.5 1.22 0.42 0.9 MCD All 5 5 1747 3.6 1.11 0.44 0.8 MCE All 5 5 1747 3.9 1.22 0.60 0.8 MC
EL
LE
co. D
isad
v.
D
E
Appendix K: Reliabilities
2012 PSSA-M Technical Report K-2

Mathematics Grade 5
Strand Group Pts. Len. N Mean SD r SEM ItemsTot. All 38 32 3726 20.2 6.34 0.80 2.8 MC/OEA All 17 14 3726 7.9 2.79 0.61 1.8 MC/OEB All 5 5 3726 3.0 1.29 0.40 1.0 MCC All 5 5 3726 3.3 1.31 0.49 0.9 MCD All 6 3 3726 2.7 1.78 0.33 1.5 MC/OEE All 5 5 3726 3.3 1.24 0.47 0.9 MC
Strand Group Pts. Len. N Mean SD r SEM ItemsMale 38 32 2240 20.2 6.39 0.81 2.8 MC/OEFemale 38 32 1484 20.2 6.25 0.79 2.8 MC/OEMale 17 14 2240 8.0 2.81 0.62 1.7 MC/OEFemale 17 14 1484 7.8 2.76 0.59 1.8 MC/OEMale 5 5 2240 3.1 1.28 0.39 1.0 MCFemale 5 5 1484 3.0 1.31 0.40 1.0 MCMale 5 5 2240 3.2 1.33 0.51 0.9 MCFemale 5 5 1484 3.4 1.27 0.45 0.9 MCMale 6 3 2240 2.7 1.79 0.35 1.4 MC/OEFemale 6 3 1484 2.7 1.76 0.30 1.5 MC/OEMale 5 5 2240 3.2 1.26 0.47 0.9 MCFemale 5 5 1484 3.4 1.21 0.44 0.9 MC
Strand Group Pts. Len. N Mean SD r SEM ItemsWhite 38 32 2317 21.1 6.12 0.79 2.8 MC/OEAf. Amer. 38 32 890 18.5 6.32 0.80 2.8 MC/OEHispanic 38 32 397 19.1 6.53 0.80 2.9 MC/OEAsian 38 32 33 19.2 7.47 0.84 3.0 MC/OEAm. Indian 38 32 6 22.8 3.92 0.56 2.6 MC/OEMulti 38 32 80 20.9 6.46 0.81 2.8 MC/OEWhite 17 14 2317 8.1 2.78 0.60 1.8 MC/OEAf. Amer. 17 14 890 7.4 2.75 0.59 1.8 MC/OEHispanic 17 14 397 7.6 2.79 0.60 1.8 MC/OEAsian 17 14 33 7.8 3.16 0.67 1.8 MC/OEAm. Indian 17 14 6 8.7 2.42 0.53 1.7 MC/OEMulti 17 14 80 7.9 2.68 0.60 1.7 MC/OEWhite 5 5 2317 3.2 1.26 0.38 1.0 MCAf. Amer. 5 5 890 2.7 1.31 0.38 1.0 MCHispanic 5 5 397 2.9 1.29 0.37 1.0 MCAsian 5 5 33 2.8 1.36 0.43 1.0 MCAm. Indian 5 5 6 3.5 0.55 -3.33 1.1 MCMulti 5 5 80 3.1 1.24 0.31 1.0 MCWhite 5 5 2317 3.4 1.23 0.44 0.9 MCAf. Amer. 5 5 890 3.0 1.36 0.50 1.0 MCHispanic 5 5 397 3.0 1.42 0.55 1.0 MCAsian 5 5 33 2.6 1.52 0.60 1.0 MCAm. Indian 5 5 6 3.3 1.63 0.66 1.0 MCMulti 5 5 80 3.3 1.33 0.52 0.9 MC
Ove
rall
Gen
der
Tot.
A
B
C
D
E
Eth
nic
ity
Tot.
A
B
C
Appendix K: Reliabilities
2012 PSSA-M Technical Report K-3

White 6 3 2317 2.8 1.78 0.32 1.5 MC/OEAf. Amer. 6 3 890 2.4 1.70 0.35 1.4 MC/OEHispanic 6 3 397 2.6 1.83 0.31 1.5 MC/OEAsian 6 3 33 3.1 2.05 0.39 1.6 MC/OEAm. Indian 6 3 6 3.5 1.05 0.36 0.8 MC/OEMulti 6 3 80 3.0 1.81 0.36 1.5 MC/OEWhite 5 5 2317 3.4 1.15 0.42 0.9 MCAf. Amer. 5 5 890 2.9 1.29 0.45 1.0 MCHispanic 5 5 397 3.0 1.34 0.50 0.9 MCAsian 5 5 33 2.9 1.51 0.61 0.9 MCAm. Indian 5 5 6 3.8 0.75 -0.44 0.9 MCMulti 5 5 80 3.5 1.27 0.54 0.9 MC
Strand Group Pts. Len. N Mean SD r SEM ItemsTot. All 38 32 180 18.2 6.63 0.81 2.9 MC/OEA All 17 14 180 7.5 2.75 0.59 1.8 MC/OEB All 5 5 180 2.8 1.28 0.34 1.0 MCC All 5 5 180 2.7 1.45 0.55 1.0 MCD All 6 3 180 2.4 1.79 0.35 1.4 MC/OEE All 5 5 180 2.7 1.39 0.51 1.0 MC
Strand Group Pts. Len. N Mean SD r SEM ItemsTot. All 38 32 2421 19.8 6.35 0.80 2.8 MC/OEA All 17 14 2421 7.7 2.80 0.61 1.8 MC/OEB All 5 5 2421 3.0 1.30 0.39 1.0 MCC All 5 5 2421 3.2 1.31 0.48 0.9 MCD All 6 3 2421 2.6 1.77 0.33 1.4 MC/OEE All 5 5 2421 3.2 1.25 0.45 0.9 MC
EL
LE
co. D
isad
v.
D
E
Appendix K: Reliabilities
2012 PSSA-M Technical Report K-4

Mathematics Grade 6
Strand Group Pts. Len. N Mean SD r SEM ItemsTot. All 38 32 4061 17.2 5.72 0.78 2.7 MC/OEA All 12 9 4061 4.8 2.32 0.60 1.5 MC/OEB All 5 5 4061 3.0 1.14 0.29 1.0 MCC All 7 7 4061 3.7 1.54 0.39 1.2 MCD All 7 7 4061 3.0 1.54 0.40 1.2 MCE All 7 4 4061 2.7 1.38 0.47 1.0 MC/OE
Strand Group Pts. Len. N Mean SD r SEM ItemsMale 38 32 2391 17.1 5.79 0.79 2.7 MC/OEFemale 38 32 1667 17.2 5.63 0.78 2.6 MC/OEMale 12 9 2391 4.8 2.33 0.59 1.5 MC/OEFemale 12 9 1667 4.9 2.31 0.61 1.4 MC/OEMale 5 5 2391 3.0 1.16 0.31 1.0 MCFemale 5 5 1667 2.9 1.10 0.26 0.9 MCMale 7 7 2391 3.7 1.53 0.39 1.2 MCFemale 7 7 1667 3.7 1.54 0.40 1.2 MCMale 7 7 2391 3.0 1.55 0.41 1.2 MCFemale 7 7 1667 3.0 1.53 0.39 1.2 MCMale 7 4 2391 2.6 1.36 0.45 1.0 MC/OEFemale 7 4 1667 2.8 1.40 0.48 1.0 MC/OE
Strand Group Pts. Len. N Mean SD r SEM ItemsWhite 38 32 2549 17.6 5.74 0.79 2.7 MC/OEAf. Amer. 38 32 962 15.9 5.49 0.76 2.7 MC/OEHispanic 38 32 419 17.1 5.82 0.79 2.7 MC/OEAsian 38 32 48 17.7 5.22 0.73 2.7 MC/OEAm. Indian 38 32 11 17.3 3.77 0.52 2.6 MC/OEMulti 38 32 68 17.6 5.98 0.80 2.7 MC/OEWhite 12 9 2549 4.9 2.35 0.60 1.5 MC/OEAf. Amer. 12 9 962 4.5 2.20 0.56 1.5 MC/OEHispanic 12 9 419 4.9 2.32 0.62 1.4 MC/OEAsian 12 9 48 5.0 2.24 0.58 1.4 MC/OEAm. Indian 12 9 11 4.5 1.37 -0.28 1.6 MC/OEMulti 12 9 68 5.0 2.54 0.64 1.5 MC/OEWhite 5 5 2549 3.0 1.13 0.29 0.9 MCAf. Amer. 5 5 962 2.8 1.15 0.28 1.0 MCHispanic 5 5 419 3.0 1.11 0.23 1.0 MCAsian 5 5 48 3.1 1.16 0.38 0.9 MCAm. Indian 5 5 11 3.1 0.70 -0.60 0.9 MCMulti 5 5 68 3.0 1.16 0.34 0.9 MCWhite 7 7 2549 3.9 1.52 0.39 1.2 MCAf. Amer. 7 7 962 3.4 1.52 0.35 1.2 MCHispanic 7 7 419 3.4 1.54 0.38 1.2 MCAsian 7 7 48 3.9 1.49 0.30 1.3 MCAm. Indian 7 7 11 3.9 1.45 0.44 1.1 MCMulti 7 7 68 3.8 1.53 0.40 1.2 MC
Ove
rall
Gen
der
Tot.
A
B
C
D
E
Eth
nic
ity
Tot.
A
B
C
Appendix K: Reliabilities
2012 PSSA-M Technical Report K-5

White 7 7 2549 3.0 1.55 0.40 1.2 MCAf. Amer. 7 7 962 2.9 1.51 0.37 1.2 MCHispanic 7 7 419 3.0 1.60 0.46 1.2 MCAsian 7 7 48 2.8 1.42 0.29 1.2 MCAm. Indian 7 7 11 2.8 1.40 0.23 1.2 MCMulti 7 7 68 3.1 1.59 0.45 1.2 MCWhite 7 4 2549 2.8 1.37 0.47 1.0 MC/OEAf. Amer. 7 4 962 2.4 1.35 0.45 1.0 MC/OEHispanic 7 4 419 2.7 1.44 0.48 1.0 MC/OEAsian 7 4 48 2.9 1.45 0.44 1.1 MC/OEAm. Indian 7 4 11 3.0 0.77 -1.05 1.1 MC/OEMulti 7 4 68 2.8 1.35 0.38 1.1 MC/OE
Strand Group Pts. Len. N Mean SD r SEM ItemsTot. All 38 32 163 16.4 5.67 0.78 2.7 MC/OEA All 12 9 163 4.7 2.20 0.58 1.4 MC/OEB All 5 5 163 2.8 1.10 0.22 1.0 MCC All 7 7 163 3.4 1.63 0.45 1.2 MCD All 7 7 163 3.0 1.65 0.49 1.2 MCE All 7 4 163 2.5 1.48 0.54 1.0 MC/OE
Strand Group Pts. Len. N Mean SD r SEM ItemsTot. All 38 32 2542 16.9 5.73 0.78 2.7 MC/OEA All 12 9 2542 4.7 2.31 0.59 1.5 MC/OEB All 5 5 2542 2.9 1.14 0.30 1.0 MCC All 7 7 2542 3.6 1.55 0.39 1.2 MCD All 7 7 2542 3.0 1.56 0.42 1.2 MCE All 7 4 2542 2.6 1.37 0.47 1.0 MC/OE
EL
LE
co. D
isad
v.
D
E
Appendix K: Reliabilities
2012 PSSA-M Technical Report K-6

Mathematics Grade 7
Strand Group Pts. Len. N Mean SD r SEM ItemsTot. All 38 32 4283 18.0 6.78 0.81 2.9 MC/OEA All 9 6 4283 4.2 2.20 0.53 1.5 MC/OEB All 5 5 4283 2.2 1.31 0.41 1.0 MCC All 7 7 4283 3.8 1.68 0.51 1.2 MCD All 11 8 4283 4.2 2.38 0.52 1.7 MC/OEE All 6 6 4283 3.7 1.47 0.50 1.0 MC
Strand Group Pts. Len. N Mean SD r SEM ItemsMale 38 32 2562 17.9 6.84 0.82 2.9 MC/OEFemale 38 32 1719 18.1 6.70 0.81 2.9 MC/OEMale 9 6 2562 4.3 2.22 0.55 1.5 MC/OEFemale 9 6 1719 4.1 2.16 0.50 1.5 MC/OEMale 5 5 2562 2.1 1.32 0.42 1.0 MCFemale 5 5 1719 2.2 1.29 0.39 1.0 MCMale 7 7 2562 3.8 1.69 0.52 1.2 MCFemale 7 7 1719 3.8 1.66 0.50 1.2 MCMale 11 8 2562 4.1 2.38 0.52 1.6 MC/OEFemale 11 8 1719 4.4 2.37 0.50 1.7 MC/OEMale 6 6 2562 3.6 1.49 0.50 1.1 MCFemale 6 6 1719 3.8 1.43 0.49 1.0 MC
Strand Group Pts. Len. N Mean SD r SEM ItemsWhite 38 32 2808 18.4 6.84 0.82 2.9 MC/OEAf. Amer. 38 32 896 16.7 6.50 0.79 2.9 MC/OEHispanic 38 32 448 17.6 6.61 0.80 2.9 MC/OEAsian 38 32 49 19.0 6.32 0.78 2.9 MC/OEAm. Indian 38 32 8 23.5 6.07 0.74 3.1 MC/OEMulti 38 32 68 18.9 6.66 0.82 2.9 MC/OEWhite 9 6 2808 4.4 2.22 0.54 1.5 MC/OEAf. Amer. 9 6 896 3.9 2.10 0.49 1.5 MC/OEHispanic 9 6 448 4.1 2.20 0.55 1.5 MC/OEAsian 9 6 49 4.2 2.02 0.48 1.5 MC/OEAm. Indian 9 6 8 6.0 1.41 0.19 1.3 MC/OEMulti 9 6 68 4.7 2.11 0.50 1.5 MC/OEWhite 5 5 2808 2.2 1.33 0.42 1.0 MCAf. Amer. 5 5 896 1.9 1.21 0.30 1.0 MCHispanic 5 5 448 2.1 1.28 0.39 1.0 MCAsian 5 5 49 2.2 1.34 0.46 1.0 MCAm. Indian 5 5 8 2.5 1.20 0.19 1.1 MCMulti 5 5 68 2.3 1.41 0.49 1.0 MCWhite 7 7 2808 3.9 1.68 0.52 1.2 MCAf. Amer. 7 7 896 3.4 1.64 0.46 1.2 MCHispanic 7 7 448 3.7 1.67 0.49 1.2 MCAsian 7 7 49 3.9 1.60 0.45 1.2 MCAm. Indian 7 7 8 4.9 1.46 0.45 1.1 MCMulti 7 7 68 3.9 1.70 0.56 1.1 MC
Ove
rall
Gen
der
Tot.
A
B
C
D
E
Eth
nic
ity
Tot.
A
B
C
Appendix K: Reliabilities
2012 PSSA-M Technical Report K-7

White 11 8 2808 4.2 2.39 0.52 1.7 MC/OEAf. Amer. 11 8 896 4.1 2.38 0.53 1.6 MC/OEHispanic 11 8 448 4.2 2.29 0.47 1.7 MC/OEAsian 11 8 49 5.0 2.40 0.51 1.7 MC/OEAm. Indian 11 8 8 5.9 3.27 0.58 2.1 MC/OEMulti 11 8 68 4.3 2.35 0.58 1.5 MC/OEWhite 6 6 2808 3.8 1.45 0.49 1.0 MCAf. Amer. 6 6 896 3.4 1.50 0.48 1.1 MCHispanic 6 6 448 3.6 1.46 0.48 1.1 MCAsian 6 6 49 3.8 1.43 0.46 1.1 MCAm. Indian 6 6 8 4.3 1.49 0.64 0.9 MCMulti 6 6 68 3.8 1.52 0.54 1.0 MC
Strand Group Pts. Len. N Mean SD r SEM ItemsTot. All 38 32 178 18.0 6.45 0.80 2.9 MC/OEA All 9 6 178 4.1 2.08 0.56 1.4 MC/OEB All 5 5 178 2.2 1.29 0.42 1.0 MCC All 7 7 178 3.7 1.67 0.50 1.2 MCD All 11 8 178 4.5 2.37 0.50 1.7 MC/OEE All 6 6 178 3.5 1.52 0.52 1.1 MC
Strand Group Pts. Len. N Mean SD r SEM ItemsTot. All 38 32 2595 17.5 6.70 0.81 2.9 MC/OEA All 9 6 2595 4.1 2.19 0.53 1.5 MC/OEB All 5 5 2595 2.1 1.29 0.39 1.0 MCC All 7 7 2595 3.7 1.66 0.49 1.2 MCD All 11 8 2595 4.1 2.34 0.51 1.6 MC/OEE All 6 6 2595 3.6 1.48 0.49 1.1 MC
EL
LE
co. D
isad
v.
D
E
Appendix K: Reliabilities
2012 PSSA-M Technical Report K-8

Mathematics Grade 8
Strand Group Pts. Len. N Mean SD r SEM ItemsTot. All 38 32 4444 18.3 6.34 0.81 2.7 MC/OEA All 8 5 4444 3.3 1.67 0.48 1.2 MC/OEB All 5 5 4444 2.9 1.26 0.38 1.0 MCC All 7 7 4444 3.5 1.68 0.50 1.2 MCD All 11 8 4444 4.3 2.22 0.55 1.5 MC/OEE All 7 7 4444 4.3 1.69 0.53 1.2 MC
Strand Group Pts. Len. N Mean SD r SEM ItemsMale 38 32 2746 18.3 6.36 0.81 2.7 MC/OEFemale 38 32 1693 18.5 6.31 0.81 2.7 MC/OEMale 8 5 2746 3.3 1.70 0.51 1.2 MC/OEFemale 8 5 1693 3.4 1.61 0.44 1.2 MC/OEMale 5 5 2746 2.9 1.29 0.40 1.0 MCFemale 5 5 1693 2.9 1.23 0.35 1.0 MCMale 7 7 2746 3.5 1.66 0.48 1.2 MCFemale 7 7 1693 3.5 1.71 0.52 1.2 MCMale 11 8 2746 4.3 2.19 0.53 1.5 MC/OEFemale 11 8 1693 4.3 2.28 0.57 1.5 MC/OEMale 7 7 2746 4.3 1.71 0.54 1.2 MCFemale 7 7 1693 4.4 1.64 0.51 1.1 MC
Strand Group Pts. Len. N Mean SD r SEM ItemsWhite 38 32 2944 19.0 6.27 0.81 2.7 MC/OEAf. Amer. 38 32 934 16.4 6.23 0.81 2.7 MC/OEHispanic 38 32 434 17.7 6.14 0.80 2.8 MC/OEAsian 38 32 41 20.3 6.87 0.85 2.7 MC/OEAm. Indian 38 32 10 19.1 4.20 0.60 2.7 MC/OEMulti 38 32 76 18.8 6.25 0.81 2.7 MC/OEWhite 8 5 2944 3.4 1.66 0.48 1.2 MC/OEAf. Amer. 8 5 934 3.0 1.65 0.50 1.2 MC/OEHispanic 8 5 434 3.4 1.64 0.48 1.2 MC/OEAsian 8 5 41 3.6 1.50 0.37 1.2 MC/OEAm. Indian 8 5 10 3.4 1.51 0.55 1.0 MC/OEMulti 8 5 76 3.6 1.68 0.52 1.2 MC/OEWhite 5 5 2944 3.0 1.27 0.39 1.0 MCAf. Amer. 5 5 934 2.7 1.24 0.35 1.0 MCHispanic 5 5 434 2.8 1.21 0.31 1.0 MCAsian 5 5 41 3.2 1.32 0.51 0.9 MCAm. Indian 5 5 10 2.5 1.51 0.71 0.8 MCMulti 5 5 76 2.9 1.23 0.33 1.0 MCWhite 7 7 2944 3.6 1.68 0.50 1.2 MCAf. Amer. 7 7 934 3.1 1.64 0.47 1.2 MCHispanic 7 7 434 3.5 1.58 0.41 1.2 MCAsian 7 7 41 3.7 1.92 0.66 1.1 MCAm. Indian 7 7 10 3.9 1.37 0.06 1.3 MCMulti 7 7 76 3.6 1.76 0.55 1.2 MC
Ove
rall
Gen
der
Tot.
A
B
C
D
E
Eth
nic
ity
Tot.
A
B
C
Appendix K: Reliabilities
2012 PSSA-M Technical Report K-9
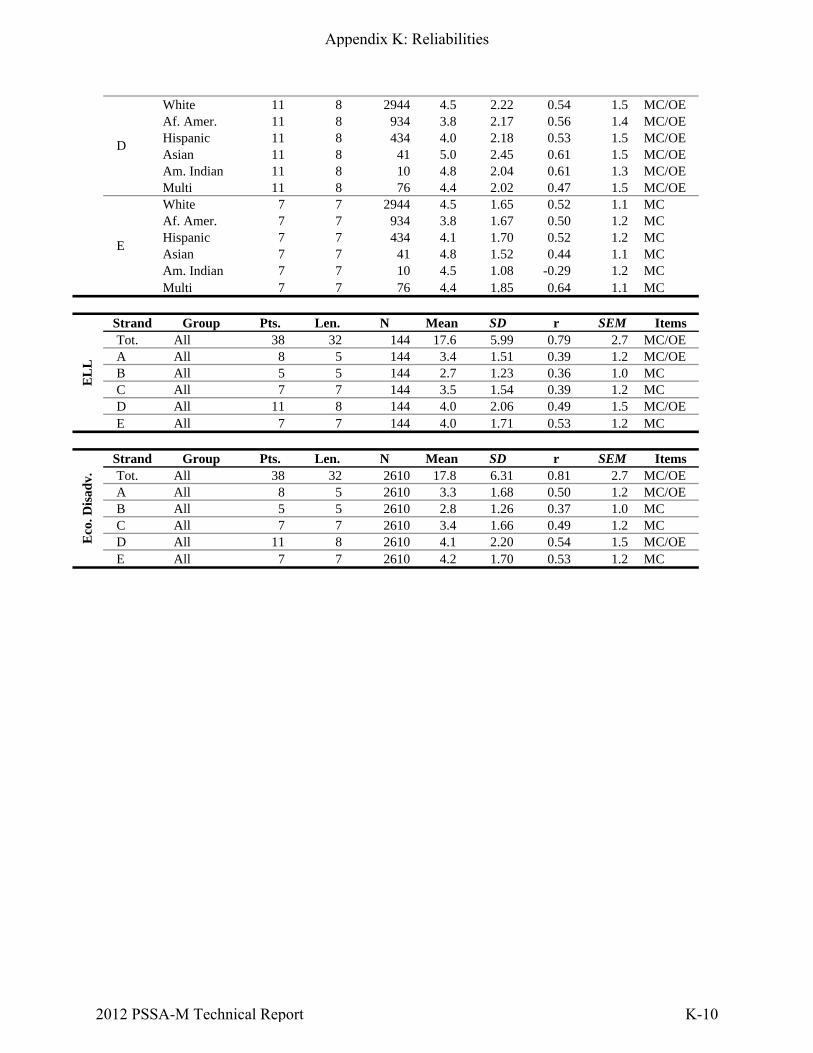
White 11 8 2944 4.5 2.22 0.54 1.5 MC/OEAf. Amer. 11 8 934 3.8 2.17 0.56 1.4 MC/OEHispanic 11 8 434 4.0 2.18 0.53 1.5 MC/OEAsian 11 8 41 5.0 2.45 0.61 1.5 MC/OEAm. Indian 11 8 10 4.8 2.04 0.61 1.3 MC/OEMulti 11 8 76 4.4 2.02 0.47 1.5 MC/OEWhite 7 7 2944 4.5 1.65 0.52 1.1 MCAf. Amer. 7 7 934 3.8 1.67 0.50 1.2 MCHispanic 7 7 434 4.1 1.70 0.52 1.2 MCAsian 7 7 41 4.8 1.52 0.44 1.1 MCAm. Indian 7 7 10 4.5 1.08 -0.29 1.2 MCMulti 7 7 76 4.4 1.85 0.64 1.1 MC
Strand Group Pts. Len. N Mean SD r SEM ItemsTot. All 38 32 144 17.6 5.99 0.79 2.7 MC/OEA All 8 5 144 3.4 1.51 0.39 1.2 MC/OEB All 5 5 144 2.7 1.23 0.36 1.0 MCC All 7 7 144 3.5 1.54 0.39 1.2 MCD All 11 8 144 4.0 2.06 0.49 1.5 MC/OEE All 7 7 144 4.0 1.71 0.53 1.2 MC
Strand Group Pts. Len. N Mean SD r SEM ItemsTot. All 38 32 2610 17.8 6.31 0.81 2.7 MC/OEA All 8 5 2610 3.3 1.68 0.50 1.2 MC/OEB All 5 5 2610 2.8 1.26 0.37 1.0 MCC All 7 7 2610 3.4 1.66 0.49 1.2 MCD All 11 8 2610 4.1 2.20 0.54 1.5 MC/OEE All 7 7 2610 4.2 1.70 0.53 1.2 MC
EL
LE
co. D
isad
v.
D
E
Appendix K: Reliabilities
2012 PSSA-M Technical Report K-10

Mathematics Grade 11
Strand Group Pts. Len. N Mean SD r SEM ItemsTot. All 38 32 4606 16.6 6.29 0.82 2.7 MC/OEA All 5 5 4606 2.9 1.29 0.42 1.0 MCB All 5 2 4606 1.3 1.05 0.22 0.9 MC/OEC All 6 6 4606 3.2 1.41 0.38 1.1 MCD All 16 13 4606 6.2 3.06 0.69 1.7 MC/OEE All 6 6 4606 2.9 1.46 0.45 1.1 MC
Strand Group Pts. Len. N Mean SD r SEM ItemsMale 38 32 2750 16.8 6.32 0.82 2.7 MC/OEFemale 38 32 1851 16.2 6.23 0.82 2.7 MC/OEMale 5 5 2750 3.0 1.30 0.43 1.0 MCFemale 5 5 1851 2.8 1.26 0.41 1.0 MCMale 5 2 2750 1.3 1.06 0.20 1.0 MC/OEFemale 5 2 1851 1.3 1.02 0.25 0.9 MC/OEMale 6 6 2750 3.3 1.42 0.38 1.1 MCFemale 6 6 1851 3.1 1.39 0.37 1.1 MCMale 16 13 2750 6.2 3.04 0.69 1.7 MC/OEFemale 16 13 1851 6.3 3.09 0.70 1.7 MC/OEMale 6 6 2750 3.0 1.45 0.44 1.1 MCFemale 6 6 1851 2.7 1.45 0.45 1.1 MC
Strand Group Pts. Len. N Mean SD r SEM ItemsWhite 38 32 3074 17.3 6.30 0.82 2.7 MC/OEAf. Amer. 38 32 1031 14.6 5.76 0.79 2.6 MC/OEHispanic 38 32 397 16.0 6.39 0.83 2.6 MC/OEAsian 38 32 51 17.6 6.31 0.82 2.7 MC/OEAm. Indian 38 32 8 20.1 6.51 0.83 2.7 MC/OEMulti 38 32 37 16.7 6.09 0.81 2.6 MC/OEWhite 5 5 3074 3.0 1.29 0.44 1.0 MCAf. Amer. 5 5 1031 2.6 1.22 0.31 1.0 MCHispanic 5 5 397 2.8 1.26 0.41 1.0 MCAsian 5 5 51 3.2 1.34 0.51 0.9 MCAm. Indian 5 5 8 3.5 0.93 0.16 0.9 MCMulti 5 5 37 3.2 1.21 0.36 1.0 MCWhite 5 2 3074 1.4 1.10 0.23 1.0 MC/OEAf. Amer. 5 2 1031 1.1 0.87 0.16 0.8 MC/OEHispanic 5 2 397 1.2 0.97 0.21 0.9 MC/OEAsian 5 2 51 1.4 0.94 -0.01 0.9 MC/OEAm. Indian 5 2 8 2.0 1.07 0.25 0.9 MC/OEMulti 5 2 37 1.2 1.06 0.27 0.9 MC/OEWhite 6 6 3074 3.4 1.41 0.38 1.1 MCAf. Amer. 6 6 1031 2.9 1.34 0.29 1.1 MCHispanic 6 6 397 3.0 1.46 0.41 1.1 MCAsian 6 6 51 3.2 1.42 0.35 1.1 MCAm. Indian 6 6 8 2.6 1.06 -0.27 1.2 MCMulti 6 6 37 3.0 1.46 0.40 1.1 MC
Ove
rall
Gen
der
Tot.
A
B
C
D
E
Eth
nic
ity
Tot.
A
B
C
Appendix K: Reliabilities
2012 PSSA-M Technical Report K-11

White 16 13 3074 6.5 3.06 0.69 1.7 MC/OEAf. Amer. 16 13 1031 5.6 2.94 0.67 1.7 MC/OEHispanic 16 13 397 6.2 3.16 0.71 1.7 MC/OEAsian 16 13 51 6.9 3.05 0.68 1.7 MC/OEAm. Indian 16 13 8 8.1 3.83 0.79 1.8 MC/OEMulti 16 13 37 6.1 3.16 0.74 1.6 MC/OEWhite 6 6 3074 3.0 1.45 0.44 1.1 MCAf. Amer. 6 6 1031 2.5 1.39 0.40 1.1 MCHispanic 6 6 397 2.7 1.44 0.44 1.1 MCAsian 6 6 51 2.9 1.59 0.56 1.1 MCAm. Indian 6 6 8 3.9 0.83 -0.86 1.1 MCMulti 6 6 37 3.1 1.31 0.25 1.1 MC
Strand Group Pts. Len. N Mean SD r SEM ItemsTot. All 38 32 102 13.7 5.57 0.78 2.6 MC/OEA All 5 5 102 2.6 1.30 0.47 1.0 MCB All 5 2 102 0.8 0.70 0.08 0.7 MC/OEC All 6 6 102 2.6 1.36 0.34 1.1 MCD All 16 13 102 5.3 2.99 0.68 1.7 MC/OEE All 6 6 102 2.2 1.32 0.31 1.1 MC
Strand Group Pts. Len. N Mean SD r SEM ItemsTot. All 38 32 2397 15.6 6.03 0.81 2.7 MC/OEA All 5 5 2397 2.8 1.29 0.41 1.0 MCB All 5 2 2397 1.2 0.97 0.22 0.9 MC/OEC All 6 6 2397 3.1 1.39 0.35 1.1 MCD All 16 13 2397 5.9 2.94 0.67 1.7 MC/OEE All 6 6 2397 2.7 1.43 0.43 1.1 MC
EL
LE
co. D
isad
v.
D
E
Appendix K: Reliabilities
2012 PSSA-M Technical Report K-12

Reading Grade 4
Strand Group Pts. Len. N Mean SD r SEM ItemsTot. All 36 32 3711 17.4 6.71 0.82 2.8 MC/OEA All 22 20 3711 11.1 4.46 0.75 2.2 MC/OEB All 14 12 3711 6.2 2.84 0.62 1.7 MC/OE
Strand Group Pts. Len. N Mean SD r SEM ItemsMale 36 32 2379 17.1 6.76 0.82 2.8 MC/OEFemale 36 32 1328 17.9 6.61 0.82 2.8 MC/OEMale 22 20 2379 11.0 4.51 0.76 2.2 MC/OEFemale 22 20 1328 11.4 4.37 0.74 2.2 MC/OEMale 14 12 2379 6.1 2.86 0.63 1.7 MC/OEFemale 14 12 1328 6.5 2.80 0.61 1.7 MC/OE
Strand Group Pts. Len. N Mean SD r SEM ItemsWhite 36 32 2427 18.3 6.64 0.82 2.8 MC/OEAf. Amer. 36 32 773 15.5 6.55 0.81 2.8 MC/OEHispanic 36 32 372 15.6 6.32 0.80 2.8 MC/OEAsian 36 32 43 15.6 6.07 0.78 2.9 MC/OEAm. Indian 36 32 7 11.6 2.88 0.08 2.8 MC/OEMulti 36 32 85 16.7 6.95 0.83 2.8 MC/OEWhite 22 20 2427 11.8 4.42 0.75 2.2 MC/OEAf. Amer. 22 20 773 9.9 4.35 0.74 2.2 MC/OEHispanic 22 20 372 10.0 4.21 0.72 2.2 MC/OEAsian 22 20 43 10.0 3.92 0.66 2.3 MC/OEAm. Indian 22 20 7 7.6 1.90 -0.43 2.3 MC/OEMulti 22 20 85 10.9 4.51 0.75 2.3 MC/OEWhite 14 12 2427 6.6 2.81 0.62 1.7 MC/OEAf. Amer. 14 12 773 5.6 2.85 0.63 1.7 MC/OEHispanic 14 12 372 5.6 2.68 0.58 1.7 MC/OEAsian 14 12 43 5.6 2.77 0.62 1.7 MC/OEAm. Indian 14 12 7 4.0 2.45 0.62 1.5 MC/OEMulti 14 12 85 5.8 2.93 0.65 1.7 MC/OE
Strand Group Pts. Len. N Mean SD r SEM ItemsTot. All 36 32 184 14.8 5.74 0.75 2.9 MC/OEA All 22 20 184 9.5 3.88 0.66 2.3 MC/OEB All 14 12 184 5.2 2.52 0.50 1.8 MC/OE
Strand Group Pts. Len. N Mean SD r SEM ItemsTot. All 36 32 2266 16.5 6.62 0.82 2.8 MC/OEA All 22 20 2266 10.6 4.40 0.74 2.2 MC/OEB All 14 12 2266 6.0 2.82 0.62 1.7 MC/OE
Ove
rall
Gen
der
Tot.
A
B
EL
LE
co. D
is.
Eth
nic
ity
Tot.
A
B
Appendix K: Reliabilities
2012 PSSA-M Technical Report K-13

Reading Grade 5
Strand Group Pts. Len. N Mean SD r SEM ItemsTot. All 36 32 4672 19.8 7.37 0.86 2.7 MC/OEA All 24 22 4672 13.0 5.16 0.81 2.3 MC/OEB All 12 10 4672 6.8 2.68 0.69 1.5 MC/OE
Strand Group Pts. Len. N Mean SD r SEM ItemsMale 36 32 3024 19.3 7.43 0.87 2.7 MC/OEFemale 36 32 1645 20.6 7.20 0.86 2.7 MC/OEMale 24 22 3024 12.8 5.20 0.81 2.3 MC/OEFemale 24 22 1645 13.4 5.08 0.80 2.3 MC/OEMale 12 10 3024 6.6 2.70 0.69 1.5 MC/OEFemale 12 10 1645 7.1 2.61 0.68 1.5 MC/OE
Strand Group Pts. Len. N Mean SD r SEM ItemsWhite 36 32 3069 20.7 7.23 0.86 2.7 MC/OEAf. Amer. 36 32 993 17.6 7.22 0.86 2.7 MC/OEHispanic 36 32 471 18.4 7.33 0.86 2.8 MC/OEAsian 36 32 54 19.0 7.71 0.87 2.7 MC/OEAm. Indian 36 32 6 21.2 6.91 0.85 2.7 MC/OEMulti 36 32 75 19.8 7.93 0.88 2.7 MC/OEWhite 24 22 3069 13.7 5.09 0.80 2.3 MC/OEAf. Amer. 24 22 993 11.5 5.03 0.79 2.3 MC/OEHispanic 24 22 471 12.0 5.06 0.79 2.3 MC/OEAsian 24 22 54 12.3 5.18 0.81 2.3 MC/OEAm. Indian 24 22 6 15.0 4.65 0.73 2.4 MC/OEMulti 24 22 75 12.8 5.71 0.85 2.2 MC/OEWhite 12 10 3069 7.1 2.62 0.68 1.5 MC/OEAf. Amer. 12 10 993 6.1 2.70 0.69 1.5 MC/OEHispanic 12 10 471 6.4 2.76 0.70 1.5 MC/OEAsian 12 10 54 6.6 2.91 0.73 1.5 MC/OEAm. Indian 12 10 6 6.2 2.48 0.73 1.3 MC/OEMulti 12 10 75 7.0 2.60 0.67 1.5 MC/OE
Strand Group Pts. Len. N Mean SD r SEM ItemsTot. All 36 32 209 16.3 7.10 0.85 2.8 MC/OEA All 24 22 209 10.5 4.78 0.77 2.3 MC/OEB All 12 10 209 5.8 2.85 0.72 1.5 MC/OE
Strand Group Pts. Len. N Mean SD r SEM ItemsTot. All 36 32 2900 18.8 7.27 0.86 2.7 MC/OEA All 24 22 2900 12.3 5.08 0.80 2.3 MC/OEB All 12 10 2900 6.5 2.68 0.68 1.5 MC/OE
Ove
rall
Gen
der
Tot.
A
B
EL
LE
co. D
is.
Eth
nic
ity
Tot.
A
B
Appendix K: Reliabilities
2012 PSSA-M Technical Report K-14

Reading Grade 6
Strand Group Pts. Len. N Mean SD r SEM ItemsTot. All 36 32 4543 20.3 6.82 0.85 2.7 MC/OEA All 22 20 4543 13.4 4.53 0.79 2.1 MC/OEB All 14 12 4543 6.9 2.84 0.65 1.7 MC/OE
Strand Group Pts. Len. N Mean SD r SEM ItemsMale 36 32 2827 20.0 6.94 0.85 2.7 MC/OEFemale 36 32 1714 20.9 6.58 0.84 2.6 MC/OEMale 22 20 2827 13.3 4.60 0.80 2.1 MC/OEFemale 22 20 1714 13.6 4.41 0.78 2.0 MC/OEMale 14 12 2827 6.7 2.88 0.66 1.7 MC/OEFemale 14 12 1714 7.3 2.74 0.63 1.7 MC/OE
Strand Group Pts. Len. N Mean SD r SEM ItemsWhite 36 32 2970 21.2 6.65 0.84 2.6 MC/OEAf. Amer. 36 32 993 18.4 6.69 0.84 2.7 MC/OEHispanic 36 32 436 19.0 7.17 0.86 2.7 MC/OEAsian 36 32 54 21.5 6.28 0.82 2.7 MC/OEAm. Indian 36 32 15 23.3 6.58 0.84 2.6 MC/OEMulti 36 32 73 19.6 7.15 0.86 2.7 MC/OEWhite 22 20 2970 14.0 4.41 0.79 2.0 MC/OEAf. Amer. 22 20 993 12.2 4.48 0.78 2.1 MC/OEHispanic 22 20 436 12.4 4.78 0.81 2.1 MC/OEAsian 22 20 54 14.1 4.12 0.74 2.1 MC/OEAm. Indian 22 20 15 15.2 4.07 0.76 2.0 MC/OEMulti 22 20 73 12.7 4.57 0.78 2.1 MC/OEWhite 14 12 2970 7.2 2.80 0.65 1.7 MC/OEAf. Amer. 14 12 993 6.2 2.76 0.63 1.7 MC/OEHispanic 14 12 436 6.6 2.90 0.67 1.7 MC/OEAsian 14 12 54 7.3 2.66 0.60 1.7 MC/OEAm. Indian 14 12 15 8.1 3.07 0.71 1.7 MC/OEMulti 14 12 73 7.0 3.05 0.69 1.7 MC/OE
Strand Group Pts. Len. N Mean SD r SEM ItemsTot. All 36 32 179 17.3 6.50 0.82 2.7 MC/OEA All 22 20 179 11.4 4.41 0.77 2.1 MC/OEB All 14 12 179 5.9 2.65 0.59 1.7 MC/OE
Strand Group Pts. Len. N Mean SD r SEM ItemsTot. All 36 32 2783 19.5 6.86 0.85 2.7 MC/OEA All 22 20 2783 12.9 4.58 0.79 2.1 MC/OEB All 14 12 2783 6.6 2.82 0.65 1.7 MC/OE
Ove
rall
Gen
der
Tot.
A
B
EL
LE
co. D
is.
Eth
nic
ity
Tot.
A
B
Appendix K: Reliabilities
2012 PSSA-M Technical Report K-15

Reading Grade 7
Strand Group Pts. Len. N Mean SD r SEM ItemsTot. All 36 32 4570 19.2 6.82 0.84 2.8 MC/OEA All 19 17 4570 9.7 3.71 0.72 2.0 MC/OEB All 17 15 4570 9.5 3.61 0.71 1.9 MC/OE
Strand Group Pts. Len. N Mean SD r SEM ItemsMale 36 32 2840 18.8 6.93 0.84 2.7 MC/OEFemale 36 32 1728 19.9 6.57 0.82 2.8 MC/OEMale 19 17 2840 9.5 3.76 0.73 2.0 MC/OEFemale 19 17 1728 10.1 3.60 0.70 2.0 MC/OEMale 17 15 2840 9.3 3.67 0.72 1.9 MC/OEFemale 17 15 1728 9.8 3.48 0.69 1.9 MC/OE
Strand Group Pts. Len. N Mean SD r SEM ItemsWhite 36 32 3051 20.1 6.74 0.84 2.7 MC/OEAf. Amer. 36 32 900 17.2 6.65 0.82 2.8 MC/OEHispanic 36 32 495 17.4 6.36 0.81 2.8 MC/OEAsian 36 32 47 19.7 6.93 0.85 2.7 MC/OEAm. Indian 36 32 8 21.5 8.59 0.91 2.6 MC/OEMulti 36 32 63 19.9 6.90 0.84 2.8 MC/OEWhite 19 17 3051 10.2 3.69 0.72 2.0 MC/OEAf. Amer. 19 17 900 8.7 3.56 0.68 2.0 MC/OEHispanic 19 17 495 8.7 3.50 0.68 2.0 MC/OEAsian 19 17 47 10.0 3.50 0.69 2.0 MC/OEAm. Indian 19 17 8 10.9 3.98 0.76 1.9 MC/OEMulti 19 17 63 9.6 3.86 0.75 1.9 MC/OEWhite 17 15 3051 9.9 3.56 0.71 1.9 MC/OEAf. Amer. 17 15 900 8.5 3.62 0.71 1.9 MC/OEHispanic 17 15 495 8.7 3.32 0.64 2.0 MC/OEAsian 17 15 47 9.7 3.86 0.76 1.9 MC/OEAm. Indian 17 15 8 10.6 4.75 0.86 1.8 MC/OEMulti 17 15 63 10.2 3.51 0.68 2.0 MC/OE
Strand Group Pts. Len. N Mean SD r SEM ItemsTot. All 36 32 206 16.7 6.42 0.81 2.8 MC/OEA All 19 17 206 8.5 3.45 0.67 2.0 MC/OEB All 17 15 206 8.3 3.41 0.67 2.0 MC/OE
Strand Group Pts. Len. N Mean SD r SEM ItemsTot. All 36 32 2734 18.3 6.67 0.83 2.8 MC/OEA All 19 17 2734 9.3 3.60 0.70 2.0 MC/OEB All 17 15 2734 9.0 3.57 0.70 1.9 MC/OE
Ove
rall
Gen
der
Tot.
A
B
EL
LE
co. D
is.
Eth
nic
ity
Tot.
A
B
Appendix K: Reliabilities
2012 PSSA-M Technical Report K-16

Reading Grade 8
Strand Group Pts. Len. N Mean SD r SEM ItemsTot. All 36 32 4308 20.0 6.21 0.81 2.7 MC/OEA All 21 17 4308 12.5 3.97 0.73 2.1 MC/OEB All 15 15 4308 7.5 2.82 0.59 1.8 MC
Strand Group Pts. Len. N Mean SD r SEM ItemsMale 36 32 2777 19.8 6.34 0.81 2.7 MC/OEFemale 36 32 1529 20.4 5.96 0.79 2.7 MC/OEMale 21 17 2777 12.4 4.08 0.74 2.1 MC/OEFemale 21 17 1529 12.6 3.76 0.70 2.1 MC/OEMale 15 15 2777 7.4 2.83 0.60 1.8 MCFemale 15 15 1529 7.8 2.79 0.58 1.8 MC
Strand Group Pts. Len. N Mean SD r SEM ItemsWhite 36 32 2867 20.9 6.01 0.80 2.7 MC/OEAf. Amer. 36 32 881 18.0 6.14 0.79 2.8 MC/OEHispanic 36 32 429 18.1 6.39 0.81 2.8 MC/OEAsian 36 32 48 22.7 5.68 0.77 2.7 MC/OEAm. Indian 36 32 9 20.6 6.86 0.86 2.6 MC/OEMulti 36 32 71 20.6 6.32 0.82 2.7 MC/OEWhite 21 17 2867 13.0 3.82 0.71 2.0 MC/OEAf. Amer. 21 17 881 11.2 4.03 0.72 2.1 MC/OEHispanic 21 17 429 11.4 4.15 0.74 2.1 MC/OEAsian 21 17 48 14.5 3.25 0.62 2.0 MC/OEAm. Indian 21 17 9 13.6 4.64 0.85 1.8 MC/OEMulti 21 17 71 13.0 3.71 0.70 2.0 MC/OEWhite 15 15 2867 7.9 2.78 0.58 1.8 MCAf. Amer. 15 15 881 6.7 2.66 0.54 1.8 MCHispanic 15 15 429 6.8 2.87 0.61 1.8 MCAsian 15 15 48 8.3 3.01 0.64 1.8 MCAm. Indian 15 15 9 7.0 2.69 0.56 1.8 MCMulti 15 15 71 7.6 3.00 0.65 1.8 MC
Strand Group Pts. Len. N Mean SD r SEM ItemsTot. All 36 32 163 17.2 6.18 0.80 2.8 MC/OEA All 21 17 163 11.0 3.89 0.71 2.1 MC/OEB All 15 15 163 6.2 2.85 0.60 1.8 MC
Strand Group Pts. Len. N Mean SD r SEM ItemsTot. All 36 32 2528 19.2 6.16 0.80 2.8 MC/OEA All 21 17 2528 12.0 3.98 0.72 2.1 MC/OEB All 15 15 2528 7.2 2.77 0.58 1.8 MC
Ove
rall
Gen
der
Tot.
A
B
EL
LE
co. D
is.
Eth
nic
ity
Tot.
A
B
Appendix K: Reliabilities
2012 PSSA-M Technical Report K-17
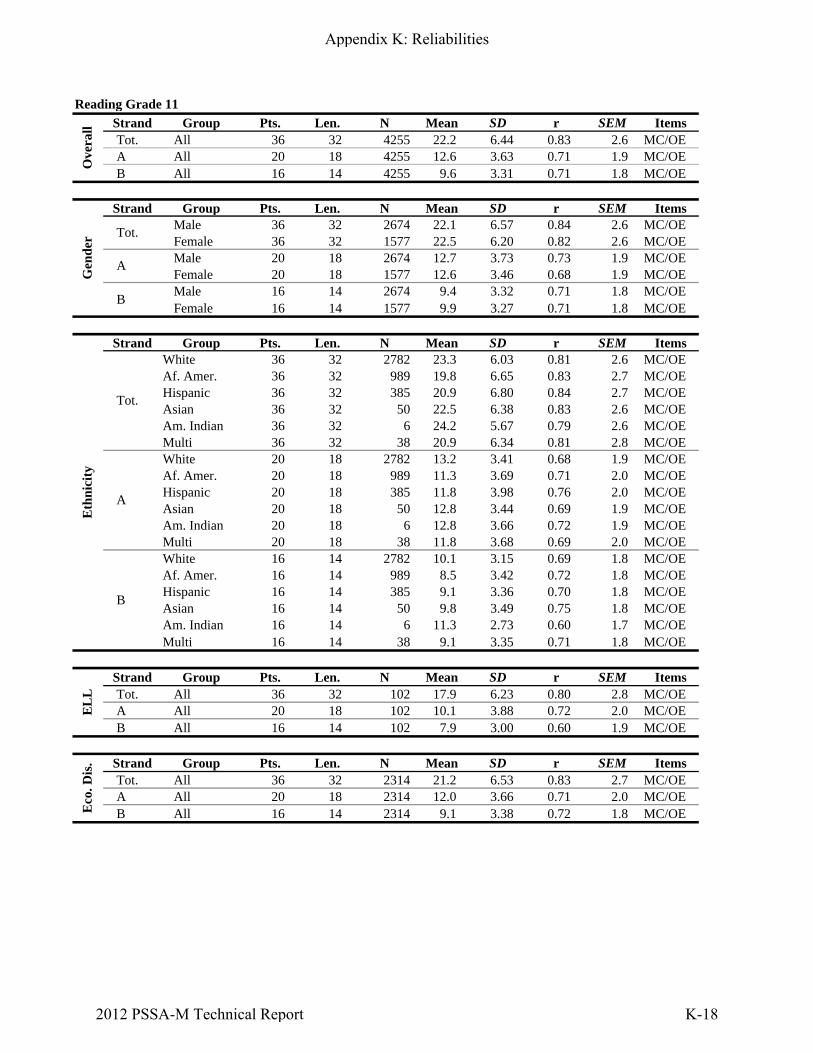
Reading Grade 11
Strand Group Pts. Len. N Mean SD r SEM ItemsTot. All 36 32 4255 22.2 6.44 0.83 2.6 MC/OEA All 20 18 4255 12.6 3.63 0.71 1.9 MC/OEB All 16 14 4255 9.6 3.31 0.71 1.8 MC/OE
Strand Group Pts. Len. N Mean SD r SEM ItemsMale 36 32 2674 22.1 6.57 0.84 2.6 MC/OEFemale 36 32 1577 22.5 6.20 0.82 2.6 MC/OEMale 20 18 2674 12.7 3.73 0.73 1.9 MC/OEFemale 20 18 1577 12.6 3.46 0.68 1.9 MC/OEMale 16 14 2674 9.4 3.32 0.71 1.8 MC/OEFemale 16 14 1577 9.9 3.27 0.71 1.8 MC/OE
Strand Group Pts. Len. N Mean SD r SEM ItemsWhite 36 32 2782 23.3 6.03 0.81 2.6 MC/OEAf. Amer. 36 32 989 19.8 6.65 0.83 2.7 MC/OEHispanic 36 32 385 20.9 6.80 0.84 2.7 MC/OEAsian 36 32 50 22.5 6.38 0.83 2.6 MC/OEAm. Indian 36 32 6 24.2 5.67 0.79 2.6 MC/OEMulti 36 32 38 20.9 6.34 0.81 2.8 MC/OEWhite 20 18 2782 13.2 3.41 0.68 1.9 MC/OEAf. Amer. 20 18 989 11.3 3.69 0.71 2.0 MC/OEHispanic 20 18 385 11.8 3.98 0.76 2.0 MC/OEAsian 20 18 50 12.8 3.44 0.69 1.9 MC/OEAm. Indian 20 18 6 12.8 3.66 0.72 1.9 MC/OEMulti 20 18 38 11.8 3.68 0.69 2.0 MC/OEWhite 16 14 2782 10.1 3.15 0.69 1.8 MC/OEAf. Amer. 16 14 989 8.5 3.42 0.72 1.8 MC/OEHispanic 16 14 385 9.1 3.36 0.70 1.8 MC/OEAsian 16 14 50 9.8 3.49 0.75 1.8 MC/OEAm. Indian 16 14 6 11.3 2.73 0.60 1.7 MC/OEMulti 16 14 38 9.1 3.35 0.71 1.8 MC/OE
Strand Group Pts. Len. N Mean SD r SEM ItemsTot. All 36 32 102 17.9 6.23 0.80 2.8 MC/OEA All 20 18 102 10.1 3.88 0.72 2.0 MC/OEB All 16 14 102 7.9 3.00 0.60 1.9 MC/OE
Strand Group Pts. Len. N Mean SD r SEM ItemsTot. All 36 32 2314 21.2 6.53 0.83 2.7 MC/OEA All 20 18 2314 12.0 3.66 0.71 2.0 MC/OEB All 16 14 2314 9.1 3.38 0.72 1.8 MC/OE
Ove
rall
Gen
der
Tot.
A
B
EL
LE
co. D
is.
Eth
nic
ity
Tot.
A
B
Appendix K: Reliabilities
2012 PSSA-M Technical Report K-18

Science Grade 4
Strand Group Pts. Len. N Mean SD r SEM ItemsTot. All 34 32 3554 20.1 5.78 0.80 2.6 MC/OEA All 17 16 3554 9.8 3.07 0.63 1.9 MC/OEB All 7 6 3554 4.1 1.55 0.45 1.2 MC/OEC All 5 5 3554 3.1 1.27 0.42 1.0 MCD All 5 5 3554 3.1 1.36 0.48 1.0 MC
Strand Group Pts. Len. N Mean SD r SEM ItemsMale 34 32 2243 20.5 5.89 0.81 2.6 MC/OEFemale 34 32 1310 19.6 5.54 0.77 2.6 MC/OEMale 17 16 2243 9.9 3.12 0.65 1.8 MC/OEFemale 17 16 1310 9.7 2.99 0.61 1.9 MC/OEMale 7 6 2243 4.1 1.53 0.45 1.1 MC/OEFemale 7 6 1310 4.0 1.58 0.45 1.2 MC/OEMale 5 5 2243 3.2 1.28 0.46 0.9 MCFemale 5 5 1310 2.9 1.22 0.33 1.0 MCMale 5 5 2243 3.2 1.38 0.51 1.0 MCFemale 5 5 1310 3.0 1.32 0.41 1.0 MC
Strand Group Pts. Len. N Mean SD r SEM ItemsWhite 34 32 2400 21.3 5.44 0.78 2.6 MC/OEAf. Amer. 34 32 697 17.5 5.77 0.79 2.6 MC/OEHispanic 34 32 356 17.6 5.77 0.79 2.7 MC/OEAsian 34 32 33 20.5 3.90 0.52 2.7 MC/OEAm. Indian 34 32 7 19.9 6.09 0.82 2.6 MC/OEMulti 34 32 61 19.7 5.84 0.80 2.6 MC/OEWhite 17 16 2400 10.3 2.91 0.60 1.8 MC/OEAf. Amer. 17 16 697 8.7 3.15 0.64 1.9 MC/OEHispanic 17 16 356 8.7 3.14 0.64 1.9 MC/OEAsian 17 16 33 10.5 2.55 0.43 1.9 MC/OEAm. Indian 17 16 7 9.3 3.20 0.66 1.9 MC/OEMulti 17 16 61 9.6 3.21 0.67 1.9 MC/OEWhite 7 6 2400 4.3 1.50 0.42 1.1 MC/OEAf. Amer. 7 6 697 3.5 1.56 0.45 1.2 MC/OEHispanic 7 6 356 3.6 1.54 0.40 1.2 MC/OEAsian 7 6 33 3.8 1.40 0.32 1.2 MC/OEAm. Indian 7 6 7 4.3 1.80 0.64 1.1 MC/OEMulti 7 6 61 4.0 1.45 0.33 1.2 MC/OEWhite 5 5 2400 3.3 1.22 0.41 0.9 MCAf. Amer. 5 5 697 2.7 1.30 0.40 1.0 MCHispanic 5 5 356 2.6 1.25 0.32 1.0 MCAsian 5 5 33 2.9 1.09 0.16 1.0 MCAm. Indian 5 5 7 2.9 1.35 0.43 1.0 MCMulti 5 5 61 3.0 1.31 0.42 1.0 MCWhite 5 5 2400 3.4 1.30 0.46 1.0 MCAf. Amer. 5 5 697 2.6 1.34 0.40 1.0 MCHispanic 5 5 356 2.6 1.39 0.46 1.0 MCAsian 5 5 33 3.2 1.08 0.06 1.0 MCAm. Indian 5 5 7 3.4 1.27 0.37 1.0 MCMulti 5 5 61 3.0 1.26 0.31 1.1 MC
Ove
rall
Gen
der
Tot.
A
B
C
D
Eth
nic
ity
B
C
D
Tot.
A
Appendix K: Reliabilities
2012 PSSA-M Technical Report K-19

Strand Group Pts. Len. N Mean SD r SEM ItemsTot. All 34 32 143 16.8 5.63 0.77 2.7 MC/OEA All 17 16 143 8.3 3.20 0.65 1.9 MC/OEB All 7 6 143 3.4 1.49 0.30 1.2 MC/OEC All 5 5 143 2.5 1.18 0.21 1.0 MCD All 5 5 143 2.6 1.41 0.48 1.0 MC
Strand Group Pts. Len. N Mean SD r SEM ItemsTot. All 34 32 2074 19.3 5.88 0.80 2.6 MC/OEA All 17 16 2074 9.4 3.13 0.64 1.9 MC/OEB All 7 6 2074 3.9 1.57 0.45 1.2 MC/OEC All 5 5 2074 2.9 1.28 0.40 1.0 MCD All 5 5 2074 3.0 1.39 0.49 1.0 MC
Eco
. Dis
adv.
EL
L
Appendix K: Reliabilities
2012 PSSA-M Technical Report K-20

Science Grade 11
Strand Group Pts. Len. N Mean SD r SEM ItemsTot. All 34 32 3742 17.1 6.50 0.84 2.6 MC/OEA All 17 16 3742 9.6 3.54 0.73 1.8 MC/OEB All 5 5 3742 2.3 1.36 0.45 1.0 MCC All 4 4 3742 2.0 1.15 0.37 0.9 MCD All 8 7 3742 3.2 1.86 0.58 1.2 MC/OE
Strand Group Pts. Len. N Mean SD r SEM ItemsMale 34 32 2327 17.8 6.69 0.85 2.6 MC/OEFemale 34 32 1412 15.9 6.00 0.82 2.6 MC/OEMale 17 16 2327 9.8 3.65 0.75 1.8 MC/OEFemale 17 16 1412 9.3 3.34 0.70 1.8 MC/OEMale 5 5 2327 2.4 1.35 0.43 1.0 MCFemale 5 5 1412 2.0 1.35 0.46 1.0 MCMale 4 4 2327 2.1 1.17 0.41 0.9 MCFemale 4 4 1412 1.9 1.10 0.31 0.9 MCMale 8 7 2327 3.5 1.90 0.59 1.2 MC/OEFemale 8 7 1412 2.7 1.70 0.51 1.2 MC/OE
Strand Group Pts. Len. N Mean SD r SEM ItemsWhite 34 32 2478 18.7 6.25 0.83 2.6 MC/OEAf. Amer. 34 32 847 13.8 5.74 0.80 2.6 MC/OEHispanic 34 32 331 14.5 6.17 0.83 2.6 MC/OEAsian 34 32 39 15.0 5.88 0.81 2.6 MC/OEAm. Indian 34 32 6 16.2 5.91 0.81 2.6 MC/OEMulti 34 32 37 14.7 5.76 0.79 2.6 MC/OEWhite 17 16 2478 10.3 3.38 0.71 1.8 MC/OEAf. Amer. 17 16 847 8.1 3.42 0.70 1.9 MC/OEHispanic 17 16 331 8.5 3.59 0.74 1.8 MC/OEAsian 17 16 39 8.7 3.17 0.65 1.9 MC/OEAm. Indian 17 16 6 8.8 3.06 0.61 1.9 MC/OEMulti 17 16 37 8.4 3.35 0.67 1.9 MC/OEWhite 5 5 2478 2.5 1.36 0.45 1.0 MCAf. Amer. 5 5 847 1.8 1.22 0.33 1.0 MCHispanic 5 5 331 1.8 1.22 0.32 1.0 MCAsian 5 5 39 1.8 1.25 0.34 1.0 MCAm. Indian 5 5 6 2.5 1.22 0.50 0.9 MCMulti 5 5 37 1.9 1.25 0.33 1.0 MCWhite 4 4 2478 2.2 1.13 0.36 0.9 MCAf. Amer. 4 4 847 1.6 1.08 0.30 0.9 MCHispanic 4 4 331 1.7 1.12 0.35 0.9 MCAsian 4 4 39 1.9 1.10 0.33 0.9 MCAm. Indian 4 4 6 2.2 0.98 0.37 0.8 MCMulti 4 4 37 1.9 1.10 0.23 1.0 MCWhite 8 7 2478 3.6 1.84 0.55 1.2 MC/OEAf. Amer. 8 7 847 2.4 1.59 0.48 1.1 MC/OEHispanic 8 7 331 2.5 1.74 0.57 1.1 MC/OEAsian 8 7 39 2.5 1.65 0.48 1.2 MC/OEAm. Indian 8 7 6 2.7 1.03 -0.95 1.4 MC/OEMulti 8 7 37 2.4 1.72 0.59 1.1 MC/OE
Ove
rall
Gen
der
Tot.
A
B
C
D
Eth
nic
ity
B
C
D
Tot.
A
Appendix K: Reliabilities
2012 PSSA-M Technical Report K-21

Strand Group Pts. Len. N Mean SD r SEM ItemsTot. All 34 32 85 11.1 4.68 0.71 2.5 MC/OEA All 17 16 85 7.0 3.10 0.64 1.9 MC/OEB All 5 5 85 1.2 1.15 0.44 0.9 MCC All 4 4 85 1.2 0.90 0.02 0.9 MCD All 8 7 85 1.7 1.56 0.53 1.1 MC/OE
Strand Group Pts. Len. N Mean SD r SEM ItemsTot. All 34 32 1999 15.7 6.29 0.83 2.6 MC/OEA All 17 16 1999 8.9 3.51 0.72 1.8 MC/OEB All 5 5 1999 2.1 1.33 0.43 1.0 MCC All 4 4 1999 1.8 1.13 0.36 0.9 MCD All 8 7 1999 2.9 1.79 0.56 1.2 MC/OE
Eco
. Dis
adv.
EL
L
Appendix K: Reliabilities
2012 PSSA-M Technical Report K-22
Appendix L:
Cut Scores and Scale Transformations
Column Heading Definition
LOSS Lowest Obtainable Scaled Score


Grade LOSS Basic Prof. Adv. Basic Prof. Adv.4 1075 1150 1275 1356 -0.5891 0.8935 1.85405 1075 1150 1275 1374 -0.5352 0.8640 1.97346 1075 1150 1275 1381 -0.9606 0.3441 1.45437 1075 1150 1275 1364 -0.8442 0.5878 1.60868 1075 1150 1275 1395 -0.7858 0.5407 1.8139
11 1075 1150 1275 1403 -0.5492 0.5317 1.63894 1075 1150 1275 1363 -1.2893 -0.1101 0.72175 1075 1150 1275 1391 -1.0125 0.1898 1.30186 1075 1150 1275 1381 -0.6956 0.6103 1.72017 1075 1150 1275 1385 -0.6788 0.4809 1.50268 1050 1150 1275 1399 -0.4859 0.6508 1.7754
11 1000 1150 1275 1433 -0.0445 1.0155 2.35128 1050 1150 1275 1419 -0.3288 0.7473 1.9833
11 1100 1150 1275 1401 -1.0555 0.3310 1.7325Sci
. 116.16X + 1188.1990.16X + 1245.16
115.64X + 1213.51
Rea
din
g
106.00X + 1286.67103.97X + 1255.27
95.72X + 1216.58107.79X + 1223.17109.97X + 1203.43117.92X + 1155.25
True Scaled Score Cuts True Logit CutsScaling
Mat
hem
atic
s 84.31X + 1199.6789.34X + 1197.8195.81X + 1242.0387.29X + 1223.6994.23X + 1224.05
Appendix L: Cut Scores and Scale Transformations
2012 PSSA-M Technical Report L-1
Appendix L: Cut Scores and Scale Transformations
2012 PSSA-M Technical Report L-2

Appendix M:
PSSA-M Historical Statistics


2010 2011 2012 2010 2011 2012 2010 2011 2012Mean 22.89 22.68 21.00 21.89 21.18 20.21 18.27 17.56 17.16SD 6.55 6.95 6.51 6.43 7.12 6.34 6.01 6.54 5.72Max 38 38 38 38 38 38 38 38 38Mean 1286.2 1277.8 1262.1 1275.5 1261.2 1253.5 1264.6 1260.6 1249.4SD 83.8 83.9 81.7 84.7 85.5 81.7 83.5 89.5 79.6Max 1655 1666 1655 1712 1691 1712 1772 1770 1772Bel. Basic/Basic 12 11 12 12 12 12 10 10 10Basic/Prof. 22 23 22 22 23 22 19 19 19Prof./Adv. 29 30 29 30 31 30 27 27 27Bel. Basic/Basic -0.5891 -0.5898 -0.5891 -0.5352 -0.4198 -0.5352 -0.9606 -0.8620 -0.9606Basic/Prof. 0.8935 0.8911 0.8935 0.8640 0.8636 0.8640 0.3441 0.3944 0.3441Prof./Adv. 1.8540 1.8538 1.8540 1.9734 2.0164 1.9734 1.4543 1.4781 1.4543Bel. Basic 4.8 5.8 8.3 5.5 10.4 9.0 7.3 11.4 8.4Basic 35.8 40.5 44.1 43.4 44.4 48.7 44.6 45.8 52.3Proficient 38.3 36.2 34.9 38.0 35.7 34.9 38.9 33.2 33.0Advanced 21.2 17.5 12.8 13.0 9.5 7.4 9.2 9.7 6.2Prof. + Adv. 59.4 53.7 47.7 51.1 45.2 42.2 48.1 42.8 39.3N Count 2169 2375 2708 2552 3366 3726 2700 3600 4061% City 6.4 11.2 15.4 6.0 9.0 13.7 6.9 7.7 11.3% White 68.8 62.2 61.1 69.9 64.1 62.2 69.4 66.7 62.8% Black 18.9 23.7 23.8 18.5 23.0 23.9 18.9 20.7 23.7% Hispanic 9.1 11.1 11.0 8.5 10.5 10.7 8.6 10.2 10.3
2010 2011 2012 2010 2011 2012 2010 2011 2012Mean 19.05 19.88 18.00 18.91 18.49 18.34 16.95 16.41 16.56SD 7.00 6.74 6.78 6.41 6.87 6.34 6.27 7.28 6.29Max 38 38 38 38 38 38 38 38 38Mean 1252.0 1256.0 1240.2 1250.3 1250.8 1242.7 1228.3 1227.8 1222.1SD 79.2 74.5 76.5 83.5 87.0 82.1 99.6 107.2 99.8Max 1663 1662 1663 1730 1722 1730 1890 2041 1890Bel. Basic/Basic 10 10 10 11 11 11 12 11 12Basic/Prof. 21 22 21 21 21 21 20 20 20Prof./Adv. 30 30 30 30 30 30 28 29 28Bel. Basic/Basic -0.8442 -0.8393 -0.8442 -0.7858 -0.6649 -0.7858 -0.5492 -0.5395 -0.5492Basic/Prof. 0.5878 0.5948 0.5878 0.5407 0.5752 0.5407 0.5317 0.5465 0.5317Prof./Adv. 1.6086 1.5970 1.6086 1.8139 1.8116 1.8139 1.6389 1.6829 1.6389Bel. Basic 8.3 5.5 10.6 10.0 13.0 11.9 21.6 24.4 24.0Basic 50.4 53.5 54.5 49.2 48.7 51.0 45.3 43.1 44.3Proficient 33.2 32.5 29.2 35.2 31.7 33.1 27.6 25.4 26.0Advanced 8.1 8.5 5.7 5.6 6.7 4.0 5.6 7.0 5.7Prof. + Adv. 41.2 41.0 34.9 40.8 38.3 37.1 33.2 32.4 31.7N Count 2818 3972 4283 3019 4114 4444 3539 4269 4606% City 7.1 8.8 10.0 6.1 9.2 10.2 6.9 7.8 11.0% White 70.5 66.9 65.6 70.9 67.1 66.2 70.7 70.1 66.7% Black 18.1 21.7 20.9 18.4 21.0 21.0 19.9 20.2 22.4% Hispanic 8.4 8.5 10.5 8.3 9.6 9.8 6.4 7.6 8.6D
emog
rap
hic
sR
awS
core
Sca
led
Sco
reR
awC
uts
Th
eta
Cu
tsIm
pac
t %
Dem
ogra
ph
ics
Raw
Sco
reS
cale
dS
core
Raw
Cu
tsT
het
aC
uts
Imp
act
%
Mat
hem
atic
s-M
Gra
de
4M
ath
emat
ics-
M G
rad
e 7
Mat
hem
atic
s-M
Gra
de
11
Mat
hem
atic
s-M
Gra
de
8
Mat
hem
atic
s-M
Gra
de
6
Mat
hem
atic
s-M
Gra
de
5
Appendix M: PSSA-M Historical Statistics
2012 PSSA-M Technical Report M-1

2011 2012 2011 2012 2011 2012Mean 19.21 17.39 20.50 19.78 21.80 20.33SD 6.87 6.71 7.19 7.37 6.98 6.82Max 36 36 36 36 36 36Mean 1305.6 1293.4 1301.8 1307.3 1281.9 1275.2SD 98.2 94.6 110.8 109.7 101.5 95.8Max 1808 1822 1791 1801 1724 1741Bel. Basic/Basic 8 8 10 9 12 11Basic/Prof. 17 16 19 18 22 21Prof./Adv. 24 23 27 27 29 29Bel. Basic/Basic -1.2893 -1.1753 -1.0125 -0.9651 -0.6956 -0.6795Basic/Prof. -0.1101 -0.0967 0.1898 0.2356 0.6103 0.6419Prof./Adv. 0.7217 0.7305 1.3018 1.4262 1.7201 1.8937Bel. Basic 3.8 5.7 7.9 7.2 10.1 10.1Basic 32.3 36.5 30.7 31.7 33.6 37.9Proficient 33.7 33.3 37.1 39.5 37.8 40.4Advanced 30.2 24.5 24.3 21.6 18.4 11.6Prof. + Adv. 63.9 57.8 61.4 61.1 56.2 52.1N Count 3388 3711 3947 4672 3983 4543% City 9.9 13.6 9.6 12.2 7.9 11.4% White 67.7 65.4 66.8 65.7 68.8 65.4% Black 19.9 20.8 21.0 21.3 19.0 21.9% Hispanic 9.9 10.0 9.5 10.1 9.9 9.6
2011 2012 2011 2012 2011 2012Mean 20.14 19.24 21.27 20.02 22.87 22.22SD 6.54 6.82 6.46 6.21 6.34 6.44Max 36 36 36 36 36 36Mean 1268.3 1260.6 1257.4 1246.5 1249.1 1242.2SD 99.3 101.2 101.5 95.0 110.4 112.4Max 1788 1778 1756 1767 1753 1763Bel. Basic/Basic 12 12 14 14 17 17Basic/Prof. 21 21 23 23 25 25Prof./Adv. 28 28 30 30 32 32Bel. Basic/Basic -0.6788 -0.5921 -0.4859 -0.3991 -0.0445 -0.0157Basic/Prof. 0.4809 0.5248 0.6508 0.7366 1.0155 1.0544Prof./Adv. 1.5026 1.5162 1.7754 1.8690 2.3512 2.4119Bel. Basic 11.7 15.4 13.9 16.8 17.4 19.8Basic 37.7 40.2 40.0 46.0 37.1 38.4Proficient 36.9 31.4 36.3 31.5 40.2 37.3Advanced 13.7 13.0 9.8 5.7 5.3 4.5Prof. + Adv. 50.6 44.4 46.1 37.2 45.5 41.8N Count 3974 4570 3647 4308 3919 4255% City 8.6 10.3 9.0 10.8 8.5 11.5% White 68.2 66.8 67.4 66.6 68.7 65.4% Black 19.4 19.7 20.5 20.5 21.0 23.2% Hispanic 9.4 10.8 9.9 10.0 8.0 9.0
Rea
din
g-M
Gra
de
7
Rea
din
g-M
Gra
de
8
Rea
din
g-M
Gra
de
11
Raw
Sco
reS
cale
dS
core
Raw
Cu
tsT
heta
Cu
tsIm
pac
t %
Dem
ogra
ph
ics
Rea
din
g-M
Gra
de
4
Rea
din
g-M
Gra
de
6
Rea
din
g-M
Gra
de
5
Dem
ogra
ph
ics
Raw
Sco
reS
cale
dS
core
Raw
Cu
tsT
heta
Cu
tsIm
pac
t %
Appendix M: PSSA-M Historical Statistics
2012 PSSA-M Technical Report M-2

2011 2012 2011 2012Mean 20.89 20.14 17.84 17.10SD 5.82 5.78 5.99 6.50Max 34 34 34 34Mean 1266.6 1260.1 1263.5 1258.6SD 107.4 103.0 79.2 89.6Max 1769 1787 1694 1712Bel. Basic/Basic 14 14 9 9Basic/Prof. 22 22 19 19Prof./Adv. 29 29 28 28Bel. Basic/Basic -0.3288 -0.2745 -1.0555 -1.0478Basic/Prof. 0.7473 0.8197 0.3310 0.3790Prof./Adv. 1.9833 2.0973 1.7325 1.8583Bel. Basic 12.0 14.6 5.8 9.3Basic 40.1 41.4 47.7 49.5Proficient 38.2 37.8 40.7 34.9Advanced 9.7 6.1 5.8 6.3Prof. + Adv. 47.8 44.0 46.6 41.2N Count 3252 3554 3540 3742% City 7.4 9.4 7.4 10.7% White 67.9 67.5 69.7 66.2% Black 19.1 19.6 19.7 22.6% Hispanic 10.4 10.0 8.3 8.8
Sci
ence
-M G
rad
e 8
Sci
ence
-M G
rad
e 11
Raw
Sco
reS
cale
dS
core
Raw
Cu
tsT
heta
Cu
tsIm
pac
t %
Dem
ogra
ph
ics
Appendix M: PSSA-M Historical Statistics
2012 PSSA-M Technical Report M-3

Appendix M: PSSA-M Historical Statistics
2012 PSSA-M Technical Report M-4

Appendix N:
Raw-to-Scaled Score Conversion Tables
Column Heading Definition
Raw Raw score Meas Rasch measure MeasSE Rasch measure standard error SS Scaled score SSSE Scaled score standard error Freq Frequency Freq% Frequency percent Cum Cumulative frequency Cum% Cumulative frequency percent Pct Percentile


Mathematics Grade 4
Raw Meas MeasSE SS SSSE Freq Freq% Cum Cum% Pct0 -5.1572 1.8441 1075 155 0 0.0 0 0.0 01 -3.9059 1.0335 1075 87 0 0.0 0 0.0 02 -3.1438 0.7548 1075 64 0 0.0 0 0.0 03 -2.6680 0.6360 1075 54 2 0.1 2 0.1 14 -2.3084 0.5679 1075 48 5 0.2 7 0.3 15 -2.0121 0.5233 1075 44 5 0.2 12 0.4 16 -1.7552 0.4918 1075 41 8 0.3 20 0.7 17 -1.5252 0.4683 1075 39 11 0.4 31 1.1 18 -1.3146 0.4502 1089 38 33 1.2 64 2.4 29 -1.1185 0.4359 1105 37 49 1.8 113 4.2 3
10 -0.9337 0.4243 1121 36 48 1.8 161 5.9 511 -0.7579 0.4148 1136 35 63 2.3 224 8.3 712 -0.5891 0.4069 1150 34 69 2.5 293 10.8 1013 -0.4263 0.4003 1164 34 87 3.2 380 14.0 1214 -0.2684 0.3948 1177 33 95 3.5 475 17.5 1615 -0.1143 0.3902 1190 33 106 3.9 581 21.5 1916 0.0363 0.3863 1203 33 118 4.4 699 25.8 2417 0.1842 0.3829 1215 32 118 4.4 817 30.2 2818 0.3297 0.3801 1227 32 150 5.5 967 35.7 3319 0.4732 0.3776 1240 32 148 5.5 1115 41.2 3820 0.6149 0.3753 1252 32 157 5.8 1272 47.0 4421 0.7550 0.3732 1263 31 145 5.4 1417 52.3 5022 0.8935 0.3712 1275 31 139 5.1 1556 57.5 5523 1.0306 0.3693 1287 31 140 5.2 1696 62.6 6024 1.1664 0.3678 1298 31 174 6.4 1870 69.1 6625 1.3014 0.3671 1309 31 126 4.7 1996 73.7 7126 1.4363 0.3676 1321 31 112 4.1 2108 77.8 7627 1.5721 0.3700 1332 31 129 4.8 2237 82.6 8028 1.7107 0.3749 1344 32 125 4.6 2362 87.2 8529 1.8540 0.3829 1356 32 86 3.2 2448 90.4 8930 2.0050 0.3951 1369 33 63 2.3 2511 92.7 9231 2.1676 0.4122 1382 35 55 2.0 2566 94.8 9432 2.3470 0.4359 1398 37 50 1.8 2616 96.6 9633 2.5508 0.4687 1415 40 27 1.0 2643 97.6 9734 2.7916 0.5154 1435 43 35 1.3 2678 98.9 9835 3.0926 0.5867 1460 49 18 0.7 2696 99.6 9936 3.5062 0.7109 1495 60 6 0.2 2702 99.8 9937 4.2018 0.9998 1554 84 5 0.2 2707 100.0 9938 5.4042 1.8247 1655 154 1 0.0 2708 100.0 99
Appendix N: Raw-to-Scaled Score Conversion Tables
2012 PSSA-M Technical Report N-1

Mathematics Grade 5
Raw Meas MeasSE SS SSSE Freq Freq% Cum Cum% Pct0 -5.3945 1.8838 1075 168 0 0.0 0 0.0 01 -4.0515 1.0871 1075 97 0 0.0 0 0.0 02 -3.1983 0.8004 1075 72 1 0.0 1 0.0 13 -2.6665 0.6689 1075 60 2 0.1 3 0.1 14 -2.2733 0.5901 1075 53 3 0.1 6 0.2 15 -1.9571 0.5372 1075 48 6 0.2 12 0.3 16 -1.6895 0.4993 1075 45 19 0.5 31 0.8 17 -1.4546 0.4711 1075 42 27 0.7 58 1.6 18 -1.2432 0.4493 1087 40 40 1.1 98 2.6 29 -1.0491 0.4323 1104 39 65 1.7 163 4.4 4
10 -0.8683 0.4187 1120 37 81 2.2 244 6.5 511 -0.6977 0.4078 1135 36 92 2.5 336 9.0 812 -0.5352 0.3989 1150 36 138 3.7 474 12.7 1113 -0.3790 0.3917 1164 35 131 3.5 605 16.2 1414 -0.2280 0.3857 1177 34 137 3.7 742 19.9 1815 -0.0813 0.3806 1191 34 175 4.7 917 24.6 2216 0.0619 0.3762 1203 34 183 4.9 1100 29.5 2717 0.2019 0.3722 1216 33 180 4.8 1280 34.4 3218 0.3391 0.3686 1228 33 200 5.4 1480 39.7 3719 0.4737 0.3651 1240 33 203 5.4 1683 45.2 4220 0.6058 0.3619 1252 32 214 5.7 1897 50.9 4821 0.7357 0.3592 1264 32 255 6.8 2152 57.8 5422 0.8640 0.3573 1275 32 224 6.0 2376 63.8 6123 0.9914 0.3567 1286 32 192 5.2 2568 68.9 6624 1.1188 0.3576 1298 32 182 4.9 2750 73.8 7125 1.2476 0.3606 1309 32 177 4.8 2927 78.6 7626 1.3794 0.3658 1321 33 158 4.2 3085 82.8 8127 1.5159 0.3734 1333 33 156 4.2 3241 87.0 8528 1.6589 0.3834 1346 34 100 2.7 3341 89.7 8829 1.8106 0.3960 1360 35 110 3.0 3451 92.6 9130 1.9734 0.4116 1374 37 79 2.1 3530 94.7 9431 2.1508 0.4314 1390 39 65 1.7 3595 96.5 9632 2.3478 0.4575 1408 41 35 0.9 3630 97.4 9733 2.5731 0.4937 1428 44 38 1.0 3668 98.4 9834 2.8419 0.5464 1452 49 23 0.6 3691 99.1 9935 3.1832 0.6274 1482 56 21 0.6 3712 99.6 9936 3.6594 0.7639 1525 68 7 0.2 3719 99.8 9937 4.4539 1.0590 1596 95 6 0.2 3725 100.0 9938 5.7542 1.8676 1712 167 1 0.0 3726 100.0 99
Appendix N: Raw-to-Scaled Score Conversion Tables
2012 PSSA-M Technical Report N-2

Mathematics Grade 6
Raw Meas MeasSE SS SSSE Freq Freq% Cum Cum% Pct0 -5.1975 1.8528 1075 178 0 0.0 0 0.0 01 -3.9264 1.0451 1075 100 0 0.0 0 0.0 02 -3.1453 0.7642 1075 73 2 0.0 2 0.0 13 -2.6589 0.6415 1075 61 2 0.0 4 0.1 14 -2.2952 0.5694 1075 55 7 0.2 11 0.3 15 -1.9992 0.5212 1075 50 20 0.5 31 0.8 16 -1.7462 0.4864 1075 47 38 0.9 69 1.7 17 -1.5227 0.4602 1096 44 50 1.2 119 2.9 28 -1.3205 0.4398 1116 42 92 2.3 211 5.2 49 -1.1344 0.4236 1133 41 131 3.2 342 8.4 7
10 -0.9606 0.4106 1150 39 146 3.6 488 12.0 1011 -0.7964 0.4000 1166 38 200 4.9 688 16.9 1412 -0.6399 0.3915 1181 38 212 5.2 900 22.2 2013 -0.4895 0.3845 1195 37 238 5.9 1138 28.0 2514 -0.3438 0.3789 1209 36 281 6.9 1419 34.9 3115 -0.2020 0.3746 1223 36 274 6.7 1693 41.7 3816 -0.0629 0.3713 1236 36 253 6.2 1946 47.9 4517 0.0740 0.3689 1249 35 255 6.3 2201 54.2 5118 0.2095 0.3674 1262 35 266 6.6 2467 60.7 5719 0.3441 0.3667 1275 35 263 6.5 2730 67.2 6420 0.4785 0.3667 1288 35 221 5.4 2951 72.7 7021 0.6132 0.3674 1301 35 204 5.0 3155 77.7 7522 0.7486 0.3687 1314 35 196 4.8 3351 82.5 8023 0.8852 0.3707 1327 36 136 3.3 3487 85.9 8424 1.0235 0.3733 1340 36 126 3.1 3613 89.0 8725 1.1641 0.3766 1354 36 113 2.8 3726 91.8 9026 1.3074 0.3807 1367 36 83 2.0 3809 93.8 9327 1.4543 0.3860 1381 37 61 1.5 3870 95.3 9528 1.6057 0.3928 1396 38 39 1.0 3909 96.3 9629 1.7634 0.4017 1411 38 52 1.3 3961 97.5 9730 1.9295 0.4139 1427 40 40 1.0 4001 98.5 9831 2.1075 0.4307 1444 41 28 0.7 4029 99.2 9932 2.3026 0.4540 1463 43 14 0.3 4043 99.6 9933 2.5232 0.4872 1484 47 9 0.2 4052 99.8 9934 2.7832 0.5354 1509 51 4 0.1 4056 99.9 9935 3.1080 0.6094 1540 58 2 0.0 4058 99.9 9936 3.5534 0.7364 1582 71 2 0.0 4060 100.0 9937 4.2925 1.0248 1653 98 0 0.0 4060 100.0 9938 5.5343 1.8417 1772 176 1 0.0 4061 100.0 99
Appendix N: Raw-to-Scaled Score Conversion Tables
2012 PSSA-M Technical Report N-3

Mathematics Grade 7
Raw Meas MeasSE SS SSSE Freq Freq% Cum Cum% Pct0 -4.9183 1.8423 1075 161 0 0.0 0 0.0 01 -3.6721 1.0296 1075 90 0 0.0 0 0.0 02 -2.9193 0.7479 1075 65 1 0.0 1 0.0 13 -2.4548 0.6261 1075 55 5 0.1 6 0.1 14 -2.1086 0.5552 1075 48 10 0.2 16 0.4 15 -1.8274 0.5079 1075 44 25 0.6 41 1.0 16 -1.5872 0.4737 1085 41 45 1.1 86 2.0 17 -1.3754 0.4479 1104 39 104 2.4 190 4.4 38 -1.1840 0.4277 1120 37 129 3.0 319 7.4 69 -1.0081 0.4116 1136 36 134 3.1 453 10.6 9
10 -0.8442 0.3985 1150 35 173 4.0 626 14.6 1311 -0.6898 0.3876 1163 34 172 4.0 798 18.6 1712 -0.5431 0.3787 1176 33 219 5.1 1017 23.7 2113 -0.4026 0.3711 1189 32 213 5.0 1230 28.7 2614 -0.2673 0.3648 1200 32 217 5.1 1447 33.8 3115 -0.1363 0.3594 1212 31 244 5.7 1691 39.5 3716 -0.0088 0.3547 1223 31 207 4.8 1898 44.3 4217 0.1155 0.3506 1234 31 230 5.4 2128 49.7 4718 0.2371 0.3469 1244 30 217 5.1 2345 54.8 5219 0.3562 0.3435 1255 30 227 5.3 2572 60.1 5720 0.4731 0.3403 1265 30 215 5.0 2787 65.1 6321 0.5878 0.3372 1275 29 197 4.6 2984 69.7 6722 0.7006 0.3344 1285 29 176 4.1 3160 73.8 7223 0.8115 0.3318 1295 29 199 4.6 3359 78.4 7624 0.9210 0.3300 1304 29 152 3.5 3511 82.0 8025 1.0296 0.3292 1314 29 125 2.9 3636 84.9 8326 1.1381 0.3301 1323 29 120 2.8 3756 87.7 8627 1.2481 0.3335 1333 29 121 2.8 3877 90.5 8928 1.3613 0.3400 1343 30 82 1.9 3959 92.4 9129 1.4803 0.3507 1353 31 79 1.8 4038 94.3 9330 1.6086 0.3666 1364 32 60 1.4 4098 95.7 9531 1.7509 0.3890 1377 34 53 1.2 4151 96.9 9632 1.9138 0.4197 1391 37 45 1.1 4196 98.0 9733 2.1070 0.4610 1408 40 33 0.8 4229 98.7 9834 2.3450 0.5170 1428 45 22 0.5 4251 99.3 9935 2.6528 0.5969 1455 52 15 0.4 4266 99.6 9936 3.0838 0.7267 1493 63 10 0.2 4276 99.8 9937 3.8072 1.0159 1556 89 7 0.2 4283 100.0 9938 5.0341 1.8350 1663 160 0 0.0 4283 100.0 100
Appendix N: Raw-to-Scaled Score Conversion Tables
2012 PSSA-M Technical Report N-4

Mathematics Grade 8
Raw Meas MeasSE SS SSSE Freq Freq% Cum Cum% Pct0 -4.9775 1.8405 1075 173 0 0.0 0 0.0 01 -3.7357 1.0266 1075 97 2 0.0 2 0.0 12 -2.9888 0.7441 1075 70 0 0.0 2 0.0 13 -2.5296 0.6221 1075 59 3 0.1 5 0.1 14 -2.1882 0.5512 1075 52 3 0.1 8 0.2 15 -1.9112 0.5041 1075 48 13 0.3 21 0.5 16 -1.6745 0.4703 1075 44 43 1.0 64 1.4 17 -1.4655 0.4450 1086 42 72 1.6 136 3.1 28 -1.2764 0.4253 1104 40 87 2.0 223 5.0 49 -1.1023 0.4098 1120 39 123 2.8 346 7.8 6
10 -0.9396 0.3973 1136 37 183 4.1 529 11.9 1011 -0.7858 0.3872 1150 36 184 4.1 713 16.0 1412 -0.6391 0.3791 1164 36 195 4.4 908 20.4 1813 -0.4980 0.3725 1177 35 209 4.7 1117 25.1 2314 -0.3612 0.3673 1190 35 234 5.3 1351 30.4 2815 -0.2279 0.3632 1203 34 238 5.4 1589 35.8 3316 -0.0971 0.3602 1215 34 252 5.7 1841 41.4 3917 0.0318 0.3580 1227 34 219 4.9 2060 46.4 4418 0.1594 0.3567 1239 34 253 5.7 2313 52.0 4919 0.2865 0.3562 1251 34 232 5.2 2545 57.3 5520 0.4133 0.3564 1263 34 250 5.6 2795 62.9 6021 0.5407 0.3573 1275 34 233 5.2 3028 68.1 6622 0.6689 0.3590 1287 34 199 4.5 3227 72.6 7023 0.7987 0.3615 1299 34 213 4.8 3440 77.4 7524 0.9305 0.3648 1312 34 178 4.0 3618 81.4 7925 1.0650 0.3690 1324 35 157 3.5 3775 84.9 8326 1.2030 0.3743 1337 35 154 3.5 3929 88.4 8727 1.3456 0.3809 1351 36 131 2.9 4060 91.4 9028 1.4937 0.3892 1365 37 110 2.5 4170 93.8 9329 1.6491 0.3996 1379 38 97 2.2 4267 96.0 9530 1.8139 0.4128 1395 39 69 1.6 4336 97.6 9731 1.9911 0.4300 1412 41 45 1.0 4381 98.6 9832 2.1855 0.4529 1430 43 25 0.6 4406 99.1 9933 2.4045 0.4847 1451 46 15 0.3 4421 99.5 9934 2.6610 0.5307 1475 50 13 0.3 4434 99.8 9935 2.9790 0.6022 1505 57 6 0.1 4440 99.9 9936 3.4134 0.7272 1546 69 1 0.0 4441 99.9 9937 4.1366 1.0159 1614 96 2 0.0 4443 100.0 9938 5.3649 1.8361 1730 173 1 0.0 4444 100.0 99
Appendix N: Raw-to-Scaled Score Conversion Tables
2012 PSSA-M Technical Report N-5
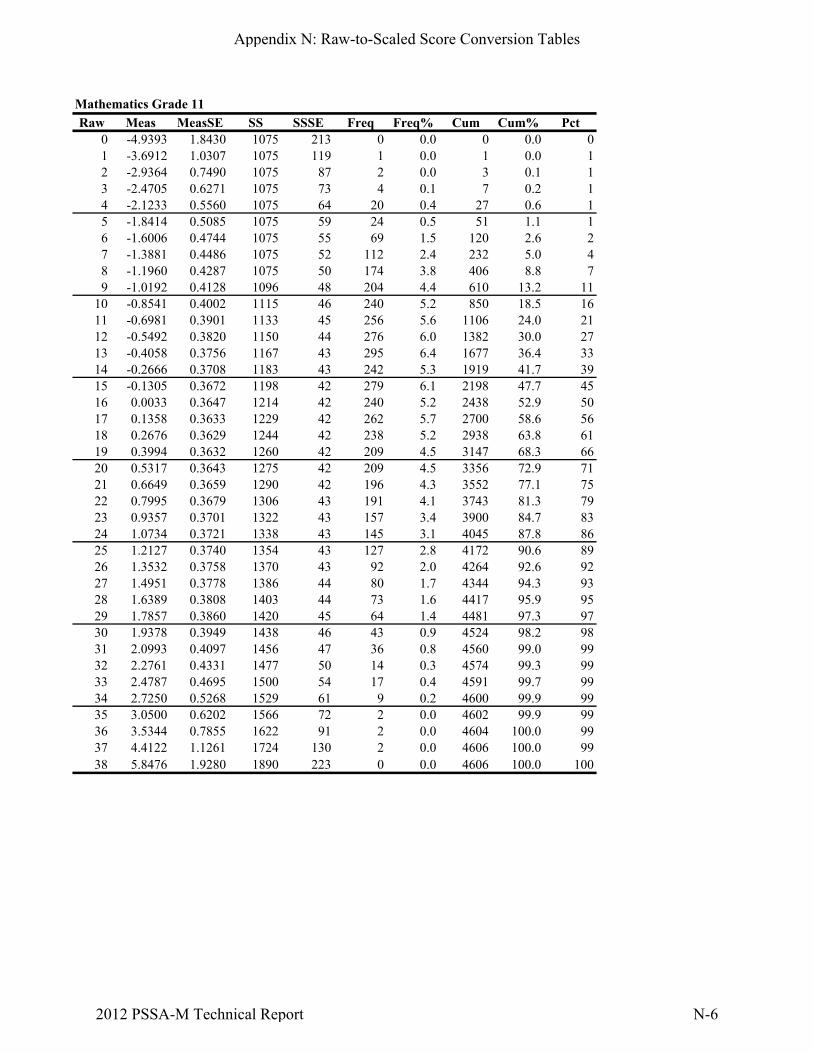
Mathematics Grade 11
Raw Meas MeasSE SS SSSE Freq Freq% Cum Cum% Pct0 -4.9393 1.8430 1075 213 0 0.0 0 0.0 01 -3.6912 1.0307 1075 119 1 0.0 1 0.0 12 -2.9364 0.7490 1075 87 2 0.0 3 0.1 13 -2.4705 0.6271 1075 73 4 0.1 7 0.2 14 -2.1233 0.5560 1075 64 20 0.4 27 0.6 15 -1.8414 0.5085 1075 59 24 0.5 51 1.1 16 -1.6006 0.4744 1075 55 69 1.5 120 2.6 27 -1.3881 0.4486 1075 52 112 2.4 232 5.0 48 -1.1960 0.4287 1075 50 174 3.8 406 8.8 79 -1.0192 0.4128 1096 48 204 4.4 610 13.2 11
10 -0.8541 0.4002 1115 46 240 5.2 850 18.5 1611 -0.6981 0.3901 1133 45 256 5.6 1106 24.0 2112 -0.5492 0.3820 1150 44 276 6.0 1382 30.0 2713 -0.4058 0.3756 1167 43 295 6.4 1677 36.4 3314 -0.2666 0.3708 1183 43 242 5.3 1919 41.7 3915 -0.1305 0.3672 1198 42 279 6.1 2198 47.7 4516 0.0033 0.3647 1214 42 240 5.2 2438 52.9 5017 0.1358 0.3633 1229 42 262 5.7 2700 58.6 5618 0.2676 0.3629 1244 42 238 5.2 2938 63.8 6119 0.3994 0.3632 1260 42 209 4.5 3147 68.3 6620 0.5317 0.3643 1275 42 209 4.5 3356 72.9 7121 0.6649 0.3659 1290 42 196 4.3 3552 77.1 7522 0.7995 0.3679 1306 43 191 4.1 3743 81.3 7923 0.9357 0.3701 1322 43 157 3.4 3900 84.7 8324 1.0734 0.3721 1338 43 145 3.1 4045 87.8 8625 1.2127 0.3740 1354 43 127 2.8 4172 90.6 8926 1.3532 0.3758 1370 43 92 2.0 4264 92.6 9227 1.4951 0.3778 1386 44 80 1.7 4344 94.3 9328 1.6389 0.3808 1403 44 73 1.6 4417 95.9 9529 1.7857 0.3860 1420 45 64 1.4 4481 97.3 9730 1.9378 0.3949 1438 46 43 0.9 4524 98.2 9831 2.0993 0.4097 1456 47 36 0.8 4560 99.0 9932 2.2761 0.4331 1477 50 14 0.3 4574 99.3 9933 2.4787 0.4695 1500 54 17 0.4 4591 99.7 9934 2.7250 0.5268 1529 61 9 0.2 4600 99.9 9935 3.0500 0.6202 1566 72 2 0.0 4602 99.9 9936 3.5344 0.7855 1622 91 2 0.0 4604 100.0 9937 4.4122 1.1261 1724 130 2 0.0 4606 100.0 9938 5.8476 1.9280 1890 223 0 0.0 4606 100.0 100
Appendix N: Raw-to-Scaled Score Conversion Tables
2012 PSSA-M Technical Report N-6

Reading Grade 4
Raw Meas MeasSE SS SSSE Freq Freq% Cum Cum% Pct0 -4.7638 1.8358 1075 195 0 0.0 0 0.0 01 -3.5339 1.0184 1075 108 1 0.0 1 0.0 12 -2.8033 0.7334 1075 78 2 0.1 3 0.1 13 -2.3596 0.6099 1075 65 5 0.1 8 0.2 14 -2.0329 0.5380 1075 57 16 0.4 24 0.6 15 -1.7699 0.4901 1099 52 33 0.9 57 1.5 16 -1.5470 0.4558 1123 48 52 1.4 109 2.9 27 -1.3513 0.4300 1143 46 102 2.7 211 5.7 48 -1.1753 0.4099 1162 43 124 3.3 335 9.0 79 -1.0140 0.3939 1179 42 145 3.9 480 12.9 11
10 -0.8640 0.3810 1195 40 170 4.6 650 17.5 1511 -0.7229 0.3706 1210 39 195 5.3 845 22.8 2012 -0.5888 0.3621 1224 38 191 5.1 1036 27.9 2513 -0.4603 0.3553 1238 38 189 5.1 1225 33.0 3014 -0.3360 0.3499 1251 37 165 4.4 1390 37.5 3515 -0.2151 0.3458 1264 37 176 4.7 1566 42.2 4016 -0.0967 0.3428 1276 36 204 5.5 1770 47.7 4517 0.0201 0.3410 1289 36 174 4.7 1944 52.4 5018 0.1361 0.3403 1301 36 181 4.9 2125 57.3 5519 0.2521 0.3407 1313 36 166 4.5 2291 61.7 5920 0.3686 0.3423 1326 36 168 4.5 2459 66.3 6421 0.4866 0.3450 1338 37 182 4.9 2641 71.2 6922 0.6069 0.3489 1351 37 159 4.3 2800 75.5 7323 0.7305 0.3543 1364 38 138 3.7 2938 79.2 7724 0.8583 0.3612 1378 38 119 3.2 3057 82.4 8125 0.9918 0.3698 1392 39 130 3.5 3187 85.9 8426 1.1324 0.3805 1407 40 131 3.5 3318 89.4 8827 1.2821 0.3937 1423 42 106 2.9 3424 92.3 9128 1.4435 0.4102 1440 43 81 2.2 3505 94.4 9329 1.6200 0.4308 1458 46 62 1.7 3567 96.1 9530 1.8166 0.4571 1479 48 58 1.6 3625 97.7 9731 2.0411 0.4920 1503 52 39 1.1 3664 98.7 9832 2.3062 0.5403 1531 57 27 0.7 3691 99.5 9933 2.6358 0.6126 1566 65 12 0.3 3703 99.8 9934 3.0833 0.7363 1613 78 5 0.1 3708 99.9 9935 3.8188 1.0210 1691 108 3 0.1 3711 100.0 9936 5.0526 1.8374 1822 195 0 0.0 3711 100.0 100
Appendix N: Raw-to-Scaled Score Conversion Tables
2012 PSSA-M Technical Report N-7

Reading Grade 5
Raw Meas MeasSE SS SSSE Freq Freq% Cum Cum% Pct0 -4.8172 1.8413 1075 191 0 0.0 0 0.0 01 -3.5739 1.0273 1075 107 0 0.0 0 0.0 02 -2.8263 0.7440 1075 77 2 0.0 2 0.0 13 -2.3680 0.6209 1075 65 9 0.2 11 0.2 14 -2.0286 0.5488 1075 57 21 0.4 32 0.7 15 -1.7546 0.5006 1075 52 40 0.9 72 1.5 16 -1.5219 0.4658 1097 48 59 1.3 131 2.8 27 -1.3174 0.4395 1118 46 88 1.9 219 4.7 48 -1.1335 0.4189 1137 44 117 2.5 336 7.2 69 -0.9651 0.4025 1155 42 145 3.1 481 10.3 9
10 -0.8085 0.3893 1171 40 138 3.0 619 13.2 1211 -0.6612 0.3786 1187 39 152 3.3 771 16.5 1512 -0.5212 0.3699 1201 38 179 3.8 950 20.3 1813 -0.3871 0.3629 1215 38 167 3.6 1117 23.9 2214 -0.2574 0.3574 1229 37 157 3.4 1274 27.3 2615 -0.1312 0.3533 1242 37 176 3.8 1450 31.0 2916 -0.0075 0.3503 1254 36 169 3.6 1619 34.7 3317 0.1145 0.3485 1267 36 198 4.2 1817 38.9 3718 0.2356 0.3478 1280 36 165 3.5 1982 42.4 4119 0.3566 0.3481 1292 36 200 4.3 2182 46.7 4520 0.4783 0.3496 1305 36 198 4.2 2380 50.9 4921 0.6014 0.3522 1318 37 225 4.8 2605 55.8 5322 0.7267 0.3560 1331 37 209 4.5 2814 60.2 5823 0.8552 0.3612 1344 38 227 4.9 3041 65.1 6324 0.9880 0.3679 1358 38 199 4.3 3240 69.3 6725 1.1263 0.3763 1372 39 205 4.4 3445 73.7 7226 1.2717 0.3867 1387 40 217 4.6 3662 78.4 7627 1.4262 0.3997 1404 42 196 4.2 3858 82.6 8028 1.5923 0.4159 1421 43 197 4.2 4055 86.8 8529 1.7736 0.4364 1440 45 160 3.4 4215 90.2 8930 1.9752 0.4627 1461 48 158 3.4 4373 93.6 9231 2.2050 0.4976 1485 52 106 2.3 4479 95.9 9532 2.4759 0.5460 1513 57 95 2.0 4574 97.9 9733 2.8121 0.6184 1548 64 62 1.3 4636 99.2 9934 3.2673 0.7420 1595 77 22 0.5 4658 99.7 9935 4.0120 1.0260 1672 107 13 0.3 4671 100.0 9936 5.2536 1.8407 1801 191 1 0.0 4672 100.0 99
Appendix N: Raw-to-Scaled Score Conversion Tables
2012 PSSA-M Technical Report N-8

Reading Grade 6
Raw Meas MeasSE SS SSSE Freq Freq% Cum Cum% Pct0 -4.7836 1.8368 1075 176 0 0.0 0 0.0 01 -3.5511 1.0204 1075 98 0 0.0 0 0.0 02 -2.8162 0.7364 1075 70 0 0.0 0 0.0 03 -2.3680 0.6137 1075 59 5 0.1 5 0.1 14 -2.0364 0.5427 1075 52 7 0.2 12 0.3 15 -1.7681 0.4957 1075 47 21 0.5 33 0.7 16 -1.5394 0.4623 1075 44 37 0.8 70 1.5 17 -1.3376 0.4373 1089 42 62 1.4 132 2.9 28 -1.1549 0.4182 1106 40 91 2.0 223 4.9 49 -0.9865 0.4032 1122 39 118 2.6 341 7.5 6
10 -0.8289 0.3913 1137 37 116 2.6 457 10.1 911 -0.6795 0.3818 1152 37 134 2.9 591 13.0 1212 -0.5367 0.3744 1165 36 127 2.8 718 15.8 1413 -0.3988 0.3686 1178 35 145 3.2 863 19.0 1714 -0.2647 0.3641 1191 35 156 3.4 1019 22.4 2115 -0.1333 0.3610 1204 35 183 4.0 1202 26.5 2416 -0.0038 0.3589 1216 34 163 3.6 1365 30.0 2817 0.1246 0.3579 1229 34 184 4.1 1549 34.1 3218 0.2526 0.3579 1241 34 194 4.3 1743 38.4 3619 0.3811 0.3589 1253 34 229 5.0 1972 43.4 4120 0.5106 0.3609 1265 35 206 4.5 2178 47.9 4621 0.6419 0.3640 1278 35 221 4.9 2399 52.8 5022 0.7758 0.3682 1291 35 220 4.8 2619 57.6 5523 0.9134 0.3737 1304 36 239 5.3 2858 62.9 6024 1.0555 0.3806 1318 36 235 5.2 3093 68.1 6525 1.2036 0.3892 1332 37 243 5.3 3336 73.4 7126 1.3591 0.3998 1347 38 213 4.7 3549 78.1 7627 1.5240 0.4129 1362 40 246 5.4 3795 83.5 8128 1.7010 0.4291 1379 41 219 4.8 4014 88.4 8629 1.8937 0.4495 1398 43 178 3.9 4192 92.3 9030 2.1073 0.4758 1418 46 124 2.7 4316 95.0 9431 2.3497 0.5105 1441 49 115 2.5 4431 97.5 9632 2.6342 0.5587 1469 53 63 1.4 4494 98.9 9833 2.9851 0.6307 1502 60 29 0.6 4523 99.6 9934 3.4566 0.7535 1547 72 14 0.3 4537 99.9 9935 4.2197 1.0355 1620 99 5 0.1 4542 100.0 9936 5.4757 1.8466 1741 177 1 0.0 4543 100.0 99
Appendix N: Raw-to-Scaled Score Conversion Tables
2012 PSSA-M Technical Report N-9

Reading Grade 7
Raw Meas MeasSE SS SSSE Freq Freq% Cum Cum% Pct0 -4.8196 1.8377 1075 198 0 0.0 0 0.0 01 -3.5850 1.0216 1075 110 1 0.0 1 0.0 12 -2.8482 0.7373 1075 79 0 0.0 1 0.0 13 -2.3990 0.6141 1075 66 3 0.1 4 0.1 14 -2.0674 0.5423 1075 58 9 0.2 13 0.3 15 -1.7999 0.4945 1075 53 31 0.7 44 1.0 16 -1.5728 0.4602 1075 50 42 0.9 86 1.9 17 -1.3732 0.4344 1075 47 73 1.6 159 3.5 38 -1.1934 0.4144 1095 45 107 2.3 266 5.8 59 -1.0285 0.3985 1112 43 124 2.7 390 8.5 7
10 -0.8748 0.3858 1129 42 137 3.0 527 11.5 1011 -0.7300 0.3756 1144 40 178 3.9 705 15.4 1312 -0.5921 0.3674 1159 40 174 3.8 879 19.2 1713 -0.4596 0.3609 1174 39 200 4.4 1079 23.6 2114 -0.3312 0.3558 1187 38 196 4.3 1275 27.9 2615 -0.2060 0.3520 1201 38 184 4.0 1459 31.9 3016 -0.0831 0.3494 1214 38 206 4.5 1665 36.4 3417 0.0384 0.3479 1227 38 214 4.7 1879 41.1 3918 0.1592 0.3474 1240 37 232 5.1 2111 46.2 4419 0.2800 0.3480 1253 38 221 4.8 2332 51.0 4920 0.4016 0.3496 1266 38 208 4.6 2540 55.6 5321 0.5248 0.3523 1280 38 223 4.9 2763 60.5 5822 0.6502 0.3562 1293 38 218 4.8 2981 65.2 6323 0.7788 0.3614 1307 39 211 4.6 3192 69.8 6824 0.9118 0.3681 1321 40 210 4.6 3402 74.4 7225 1.0503 0.3764 1336 41 202 4.4 3604 78.9 7726 1.1958 0.3868 1352 42 195 4.3 3799 83.1 8127 1.3503 0.3997 1369 43 178 3.9 3977 87.0 8528 1.5162 0.4156 1387 45 170 3.7 4147 90.7 8929 1.6971 0.4358 1406 47 126 2.8 4273 93.5 9230 1.8980 0.4617 1428 50 119 2.6 4392 96.1 9531 2.1266 0.4960 1452 53 78 1.7 4470 97.8 9732 2.3955 0.5437 1481 59 42 0.9 4512 98.7 9833 2.7286 0.6153 1517 66 32 0.7 4544 99.4 9934 3.1791 0.7381 1566 80 21 0.5 4565 99.9 9935 3.9166 1.0218 1645 110 3 0.1 4568 100.0 9936 5.1513 1.8376 1778 198 2 0.0 4570 100.0 99
Appendix N: Raw-to-Scaled Score Conversion Tables
2012 PSSA-M Technical Report N-10
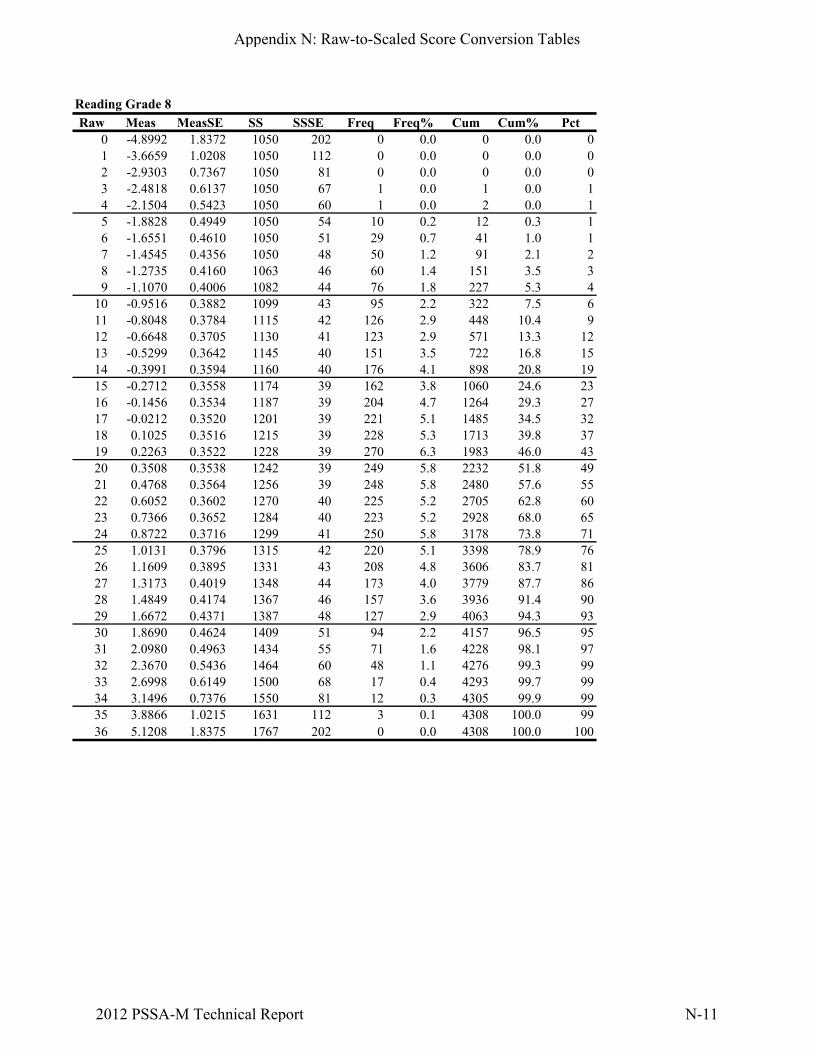
Reading Grade 8
Raw Meas MeasSE SS SSSE Freq Freq% Cum Cum% Pct0 -4.8992 1.8372 1050 202 0 0.0 0 0.0 01 -3.6659 1.0208 1050 112 0 0.0 0 0.0 02 -2.9303 0.7367 1050 81 0 0.0 0 0.0 03 -2.4818 0.6137 1050 67 1 0.0 1 0.0 14 -2.1504 0.5423 1050 60 1 0.0 2 0.0 15 -1.8828 0.4949 1050 54 10 0.2 12 0.3 16 -1.6551 0.4610 1050 51 29 0.7 41 1.0 17 -1.4545 0.4356 1050 48 50 1.2 91 2.1 28 -1.2735 0.4160 1063 46 60 1.4 151 3.5 39 -1.1070 0.4006 1082 44 76 1.8 227 5.3 4
10 -0.9516 0.3882 1099 43 95 2.2 322 7.5 611 -0.8048 0.3784 1115 42 126 2.9 448 10.4 912 -0.6648 0.3705 1130 41 123 2.9 571 13.3 1213 -0.5299 0.3642 1145 40 151 3.5 722 16.8 1514 -0.3991 0.3594 1160 40 176 4.1 898 20.8 1915 -0.2712 0.3558 1174 39 162 3.8 1060 24.6 2316 -0.1456 0.3534 1187 39 204 4.7 1264 29.3 2717 -0.0212 0.3520 1201 39 221 5.1 1485 34.5 3218 0.1025 0.3516 1215 39 228 5.3 1713 39.8 3719 0.2263 0.3522 1228 39 270 6.3 1983 46.0 4320 0.3508 0.3538 1242 39 249 5.8 2232 51.8 4921 0.4768 0.3564 1256 39 248 5.8 2480 57.6 5522 0.6052 0.3602 1270 40 225 5.2 2705 62.8 6023 0.7366 0.3652 1284 40 223 5.2 2928 68.0 6524 0.8722 0.3716 1299 41 250 5.8 3178 73.8 7125 1.0131 0.3796 1315 42 220 5.1 3398 78.9 7626 1.1609 0.3895 1331 43 208 4.8 3606 83.7 8127 1.3173 0.4019 1348 44 173 4.0 3779 87.7 8628 1.4849 0.4174 1367 46 157 3.6 3936 91.4 9029 1.6672 0.4371 1387 48 127 2.9 4063 94.3 9330 1.8690 0.4624 1409 51 94 2.2 4157 96.5 9531 2.0980 0.4963 1434 55 71 1.6 4228 98.1 9732 2.3670 0.5436 1464 60 48 1.1 4276 99.3 9933 2.6998 0.6149 1500 68 17 0.4 4293 99.7 9934 3.1496 0.7376 1550 81 12 0.3 4305 99.9 9935 3.8866 1.0215 1631 112 3 0.1 4308 100.0 9936 5.1208 1.8375 1767 202 0 0.0 4308 100.0 100
Appendix N: Raw-to-Scaled Score Conversion Tables
2012 PSSA-M Technical Report N-11

Reading Grade 11
Raw Meas MeasSE SS SSSE Freq Freq% Cum Cum% Pct0 -5.0548 1.8409 1000 217 0 0.0 0 0.0 01 -3.8119 1.0273 1000 121 1 0.0 1 0.0 12 -3.0634 0.7453 1000 88 0 0.0 1 0.0 13 -2.6025 0.6236 1000 74 2 0.0 3 0.1 14 -2.2592 0.5529 1000 65 3 0.1 6 0.1 15 -1.9801 0.5061 1000 60 6 0.1 12 0.3 16 -1.7415 0.4725 1000 56 24 0.6 36 0.8 17 -1.5304 0.4472 1000 53 28 0.7 64 1.5 18 -1.3394 0.4276 1000 50 37 0.9 101 2.4 29 -1.1633 0.4121 1018 49 63 1.5 164 3.9 3
10 -0.9988 0.3996 1037 47 62 1.5 226 5.3 511 -0.8432 0.3895 1056 46 83 2.0 309 7.3 612 -0.6948 0.3813 1073 45 95 2.2 404 9.5 813 -0.5521 0.3747 1090 44 100 2.4 504 11.8 1114 -0.4137 0.3695 1106 44 96 2.3 600 14.1 1315 -0.2788 0.3654 1122 43 128 3.0 728 17.1 1616 -0.1464 0.3625 1138 43 116 2.7 844 19.8 1817 -0.0157 0.3606 1153 43 162 3.8 1006 23.6 2218 0.1140 0.3597 1169 42 158 3.7 1164 27.4 2519 0.2433 0.3597 1184 42 193 4.5 1357 31.9 3020 0.3730 0.3607 1199 43 191 4.5 1548 36.4 3421 0.5037 0.3627 1215 43 208 4.9 1756 41.3 3922 0.6363 0.3658 1230 43 230 5.4 1986 46.7 4423 0.7716 0.3701 1246 44 217 5.1 2203 51.8 4924 0.9106 0.3757 1263 44 274 6.4 2477 58.2 5525 1.0544 0.3830 1280 45 247 5.8 2724 64.0 6126 1.2045 0.3922 1297 46 283 6.7 3007 70.7 6727 1.3628 0.4038 1316 48 268 6.3 3275 77.0 7428 1.5316 0.4185 1336 49 242 5.7 3517 82.7 8029 1.7144 0.4374 1357 52 223 5.2 3740 87.9 8530 1.9162 0.4620 1381 54 180 4.2 3920 92.1 9031 2.1444 0.4951 1408 58 143 3.4 4063 95.5 9432 2.4119 0.5418 1440 64 95 2.2 4158 97.7 9733 2.7424 0.6127 1479 72 59 1.4 4217 99.1 9834 3.1892 0.7353 1531 87 32 0.8 4249 99.9 9935 3.9224 1.0195 1618 120 5 0.1 4254 100.0 9936 5.1536 1.8362 1763 217 1 0.0 4255 100.0 99
Appendix N: Raw-to-Scaled Score Conversion Tables
2012 PSSA-M Technical Report N-12

Science Grade 8
Raw Meas MeasSE SS SSSE Freq Freq% Cum Cum% Pct0 -4.8790 1.8393 1050 214 0 0.0 0 0.0 01 -3.6402 1.0247 1050 119 0 0.0 0 0.0 02 -2.8968 0.7419 1050 86 0 0.0 0 0.0 03 -2.4407 0.6199 1050 72 0 0.0 0 0.0 04 -2.1017 0.5492 1050 64 4 0.1 4 0.1 15 -1.8266 0.5023 1050 58 6 0.2 10 0.3 16 -1.5915 0.4689 1050 54 12 0.3 22 0.6 17 -1.3836 0.4440 1050 52 34 1.0 56 1.6 18 -1.1953 0.4248 1050 49 39 1.1 95 2.7 29 -1.0215 0.4097 1070 48 52 1.5 147 4.1 3
10 -0.8586 0.3978 1088 46 82 2.3 229 6.4 511 -0.7043 0.3883 1106 45 72 2.0 301 8.5 712 -0.5564 0.3809 1124 44 109 3.1 410 11.5 1013 -0.4137 0.3752 1140 44 110 3.1 520 14.6 1314 -0.2745 0.3710 1156 43 122 3.4 642 18.1 1615 -0.1380 0.3681 1172 43 152 4.3 794 22.3 2016 -0.0032 0.3664 1188 43 162 4.6 956 26.9 2517 0.1308 0.3659 1203 43 181 5.1 1137 32.0 2918 0.2648 0.3666 1219 43 197 5.5 1334 37.5 3519 0.3999 0.3684 1235 43 217 6.1 1551 43.6 4120 0.5367 0.3715 1251 43 218 6.1 1769 49.8 4721 0.6762 0.3759 1267 44 223 6.3 1992 56.0 5322 0.8197 0.3818 1283 44 206 5.8 2198 61.8 5923 0.9682 0.3893 1301 45 232 6.5 2430 68.4 6524 1.1234 0.3989 1319 46 222 6.2 2652 74.6 7125 1.2871 0.4109 1338 48 214 6.0 2866 80.6 7826 1.4620 0.4261 1358 49 182 5.1 3048 85.8 8327 1.6516 0.4454 1380 52 165 4.6 3213 90.4 8828 1.8607 0.4704 1404 55 123 3.5 3336 93.9 9229 2.0973 0.5038 1432 59 88 2.5 3424 96.3 9530 2.3739 0.5506 1464 64 66 1.9 3490 98.2 9731 2.7145 0.6213 1504 72 42 1.2 3532 99.4 9932 3.1724 0.7432 1557 86 15 0.4 3547 99.8 9933 3.9178 1.0257 1643 119 7 0.2 3554 100.0 9934 5.1581 1.8399 1787 214 0 0.0 3554 100.0 100
Appendix N: Raw-to-Scaled Score Conversion Tables
2012 PSSA-M Technical Report N-13

Science Grade 11
Raw Meas MeasSE SS SSSE Freq Freq% Cum Cum% Pct0 -4.8871 1.8382 1100 166 0 0.0 0 0.0 01 -3.6510 1.0229 1100 92 0 0.0 0 0.0 02 -2.9111 0.7397 1100 67 0 0.0 0 0.0 03 -2.4579 0.6177 1100 56 4 0.1 4 0.1 14 -2.1215 0.5471 1100 49 20 0.5 24 0.6 15 -1.8483 0.5005 1100 45 46 1.2 70 1.9 16 -1.6149 0.4674 1100 42 56 1.5 126 3.4 37 -1.4083 0.4427 1118 40 86 2.3 212 5.7 58 -1.2209 0.4238 1135 38 137 3.7 349 9.3 79 -1.0478 0.4091 1151 37 146 3.9 495 13.2 11
10 -0.8852 0.3975 1165 36 176 4.7 671 17.9 1611 -0.7310 0.3883 1179 35 177 4.7 848 22.7 2012 -0.5832 0.3812 1193 34 186 5.0 1034 27.6 2513 -0.4400 0.3757 1205 34 218 5.8 1252 33.5 3114 -0.3004 0.3718 1218 34 189 5.1 1441 38.5 3615 -0.1633 0.3691 1230 33 192 5.1 1633 43.6 4116 -0.0276 0.3677 1243 33 186 5.0 1819 48.6 4617 0.1074 0.3674 1255 33 203 5.4 2022 54.0 5118 0.2427 0.3683 1267 33 180 4.8 2202 58.8 5619 0.3790 0.3703 1279 33 174 4.6 2376 63.5 6120 0.5172 0.3735 1292 34 174 4.6 2550 68.1 6621 0.6583 0.3781 1305 34 168 4.5 2718 72.6 7022 0.8035 0.3841 1318 35 162 4.3 2880 77.0 7523 0.9539 0.3918 1331 35 143 3.8 3023 80.8 7924 1.1111 0.4015 1345 36 137 3.7 3160 84.4 8325 1.2770 0.4137 1360 37 129 3.4 3289 87.9 8626 1.4543 0.4289 1376 39 110 2.9 3399 90.8 8927 1.6464 0.4483 1394 40 108 2.9 3507 93.7 9228 1.8583 0.4735 1413 43 82 2.2 3589 95.9 9529 2.0978 0.5070 1434 46 51 1.4 3640 97.3 9730 2.3779 0.5539 1460 50 46 1.2 3686 98.5 9831 2.7224 0.6246 1491 56 37 1.0 3723 99.5 9932 3.1847 0.7463 1532 67 16 0.4 3739 99.9 9933 3.9350 1.0283 1600 93 3 0.1 3742 100.0 9934 5.1794 1.8415 1712 166 0 0.0 3742 100.0 100
Appendix N: Raw-to-Scaled Score Conversion Tables
2012 PSSA-M Technical Report N-14

Appendix O:
PSSA and PSSA-M Demographics Comparison


PSSA and PSSA-M Demographics Comparison In response to a recommendation by Pennsylvania’s Technical Advisory Committee (TAC), tables were assembled to provide a demographic comparison of students taking the PSSA-Modified (PSSA-M) assessment for the current year with those of the previous year. The recommendation included the advisability of comparisons with students taking the standard assessment (PSSA). The following tables contain the percent of assessed students contributing to state summary statistics for gender and ethnicity categories for 2012 and 2011 for the PSSA-M and PSSA for Mathematics, Reading, and Science. Tables providing a gender and ethnicity breakdown by subject, type of test, and year are the following: Mathematics • 2012 PSSA-M • 2011 PSSA-M • 2012 PSSA • 2011 PSSA
Reading • 2012 PSSA-M • 2011 PSSA-M • 2012 PSSA • 2011 PSSA
Science • 2012 PSSA-M • 2011 PSSA-M • 2012 PSSA • 2011 PSSA
Demographic Comparisons for PSSA-M and PSSA Averaged Across Grade Levels
The percent of students in major demographic categories were averaged across the assessed grade levels (Grades 4-8, 11 for PSSA-M and PSSA Mathematics and Reading and Grades 8 and 11 for PSSA-M and PSSA Science). The consistent finding for each subject in both 2011 and 2012, as noted in the table below, is that the demographic composition of the PSSA-M group was clearly more male and minority (black and Latino/Hispanic) than those taking the standard PSSA. A comparison of the two years revealed that those taking the PSSA-M in 2012 were slightly more male and minority with white students dropping by approximately two percent.
Average Percent of Students in Selected Demographic Categories Receiving Scores on the 2012 PSSA-M or the 2012 PSSA
Subject Test Male Black Latino/Hispanic White
2012 2011 2012 2011 2012 2011 2012 2011 Mathematics PSSA-M 60.1 59.2 22.6 21.7 10.2 9.6 64.1 66.2 PSSA 50.8 50.9 14.6 14.8 8.1 7.4 72.4 73.3Reading PSSA-M 63.4 62.9 21.2 20.1 9.9 9.4 65.9 67.9 PSSA 50.7 50.7 14.5 14.8 8.1 7.7 72.4 72.9Science PSSA-M 62.7 62.4 21.1 19.4 9.9 9.4 66.9 68.8 PSSA 50.6 50.4 13.4 13.9 7.2 6.8 74.7 75.0
Demographic Comparisons for PSSA-M and PSSA by Grade and Subject Area A direct comparison of 2012 and 2011 demographic data for students taking the standard PSSA with those receiving the PSSA-M is comparable since both were obtained from Post-Appeals files. In the following tables displaying PSSA-M results by grade level for 2011 and 2012, the following may be observed:
• The number of students participating in the PSSA-M rose slightly from 2011 to 2012. • The demographic composition of those assessed in by the PSSA-M in 2012 appear similar in terms of
gender composition; however the percentage of white students decreased by approximately one to nearly four percent points depending on subject and grade level while decreases for students taking the PSSA were typically less than one percent.
Appendix O: PSSA and PSSA-M Demographics Comparison
2012 PSSA-M Technical Report O-1

Gender and Ethnicity Percent Breakdown for 2012 PSSA-M: Mathematics Demographic or Educational Characteristic
Gr. 4 Gr. 5 Gr. 6 Gr. 7 Gr. 8 Gr. 11
Gender Female 39.9 39.8 41.0 40.1 38.1 40.2Male 60.0 60.1 58.9 59.8 61.8 59.7 Race/Ethnicity Amer. Indian or Alaskan Native 0.2 0.2 0.3 0.2 0.2 0.2Asian or Pacific Islander 1.1 0.9 1.2 1.1 0.9 1.1Black/African American non-Hispanic 23.8 23.9 23.7 20.9 21.0 22.4Latino/Hispanic 11.0 10.7 10.3 10.5 9.8 8.6White non-Hispanic 61.1 62.2 62.8 65.6 66.2 66.7Multi-Racial/Ethnic 2.6 2.1 1.7 1.6 1.7 0.8Assessed Students in State Summaries 2,708 3,726 4,061 4,283 4,444 4,606
Gender and Ethnicity Percent Breakdown for 2011 PSSA-M: Mathematics
Demographic or Educational Characteristic
Gr. 4 Gr. 5 Gr. 6 Gr. 7 Gr. 8 Gr. 11
Gender Female 40.3 42.8 41.2 39.8 40.7 39.6Male 59.6 57.1 58.8 60.0 59.1 60.3 Race/Ethnicity Amer. Indian or Alaskan Native 0.3 0.2 0.1 0.3 0.0 0.2Asian or Pacific Islander 0.8 1.1 0.8 0.8 1.0 0.7Black/African American non-Hispanic 23.7 23.0 20.7 21.7 21.0 20.2Latino/Hispanic 11.1 10.5 10.2 8.5 9.6 7.6White non-Hispanic 62.2 64.1 66.7 66.9 67.1 70.1Multi-Racial/Ethnic 1.8 0.9 1.4 1.6 1.1 0.9Assessed Students in State Summaries 2,375 3,366 3,600 3,972 4,114 4,269
Appendix O: PSSA and PSSA-M Demographics Comparison
2012 PSSA-M Technical Report O-2
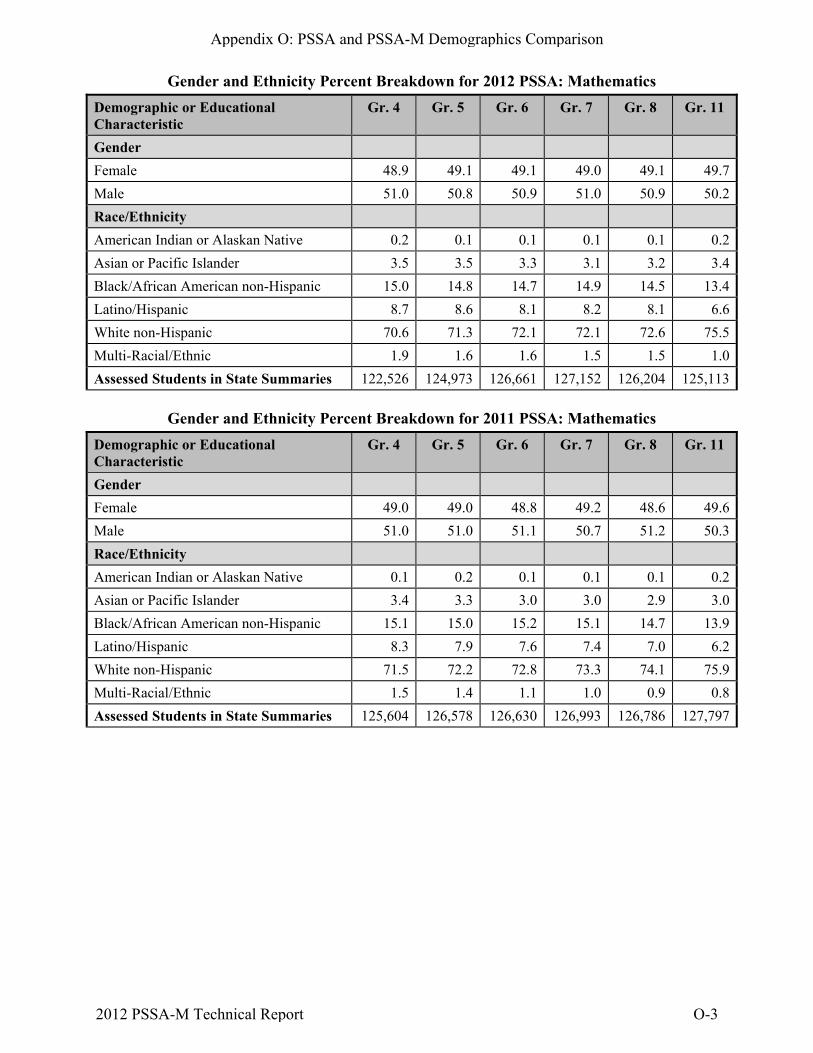
Gender and Ethnicity Percent Breakdown for 2012 PSSA: Mathematics
Demographic or Educational Characteristic
Gr. 4 Gr. 5 Gr. 6 Gr. 7 Gr. 8 Gr. 11
Gender
Female 48.9 49.1 49.1 49.0 49.1 49.7
Male 51.0 50.8 50.9 51.0 50.9 50.2
Race/Ethnicity
American Indian or Alaskan Native 0.2 0.1 0.1 0.1 0.1 0.2
Asian or Pacific Islander 3.5 3.5 3.3 3.1 3.2 3.4
Black/African American non-Hispanic 15.0 14.8 14.7 14.9 14.5 13.4
Latino/Hispanic 8.7 8.6 8.1 8.2 8.1 6.6
White non-Hispanic 70.6 71.3 72.1 72.1 72.6 75.5
Multi-Racial/Ethnic 1.9 1.6 1.6 1.5 1.5 1.0
Assessed Students in State Summaries 122,526 124,973 126,661 127,152 126,204 125,113
Gender and Ethnicity Percent Breakdown for 2011 PSSA: Mathematics
Demographic or Educational Characteristic
Gr. 4 Gr. 5 Gr. 6 Gr. 7 Gr. 8 Gr. 11
Gender
Female 49.0 49.0 48.8 49.2 48.6 49.6
Male 51.0 51.0 51.1 50.7 51.2 50.3
Race/Ethnicity
American Indian or Alaskan Native 0.1 0.2 0.1 0.1 0.1 0.2
Asian or Pacific Islander 3.4 3.3 3.0 3.0 2.9 3.0
Black/African American non-Hispanic 15.1 15.0 15.2 15.1 14.7 13.9
Latino/Hispanic 8.3 7.9 7.6 7.4 7.0 6.2
White non-Hispanic 71.5 72.2 72.8 73.3 74.1 75.9
Multi-Racial/Ethnic 1.5 1.4 1.1 1.0 0.9 0.8
Assessed Students in State Summaries 125,604 126,578 126,630 126,993 126,786 127,797
Appendix O: PSSA and PSSA-M Demographics Comparison
2012 PSSA-M Technical Report O-3

Gender and Ethnicity Percent Breakdown for 2012 PSSA-M: Reading Demographic or Educational Characteristic
Gr. 4 Gr. 5 Gr. 6 Gr. 7 Gr. 8 Gr. 11
Gender Female 35.8 35.2 37.7 37.8 35.5 37.1Male 64.1 64.7 62.2 62.1 64.5 62.8 Race/Ethnicity American Indian or Alaskan Native 0.2 0.1 0.3 0.2 0.2 0.1Asian or Pacific Islander 1.2 1.2 1.2 1.0 1.1 1.2Black/African American non-Hispanic 20.8 21.3 21.9 19.7 20.5 23.2Latino/Hispanic 10.0 10.1 9.6 10.8 10.0 9.0White non-Hispanic 65.4 65.7 65.4 66.8 66.6 65.4
Multi-Racial/Ethnic 2.3 1.6 1.6 1.4 1.6 0.9
Assessed Students in State Summaries 3,711 4,672 4,543 4,570 4,308 4,255
Gender and Ethnicity Percent Breakdown for 2011 PSSA-M: Reading Demographic or Educational Characteristic
Gr. 4 Gr. 5 Gr. 6 Gr. 7 Gr. 8 Gr. 11
Gender Female 35.2 38.5 37.2 37.5 37.6 36.2Male 64.8 61.4 62.8 62.4 62.3 63.4 Race/Ethnicity American Indian or Alaskan Native 0.2 0.3 0.1 0.3 0.1 0.2Asian or Pacific Islander 0.9 1.2 0.7 1.1 1.2 0.8Black/African American non-Hispanic 19.9 21.0 19.0 19.4 20.5 21.0Latino/Hispanic 9.9 9.5 9.9 9.4 9.9 8.0White non-Hispanic 67.7 66.8 68.8 68.2 67.4 68.7
Multi-Racial/Ethnic 1.4 1.2 1.3 1.5 1.0 0.8
Assessed Students in State Summaries 3,388 3,947 3,983 3,974 3,647 3,919
Appendix O: PSSA and PSSA-M Demographics Comparison
2012 PSSA-M Technical Report O-4

Gender and Ethnicity Percent Breakdown for 2012 PSSA: Reading
Demographic or Educational Characteristic
Gr. 4 Gr. 5 Gr. 6 Gr. 7 Gr. 8 Gr. 11
Gender
Female 49.1 49.4 49.2 49.1 49.2 49.8
Male 50.8 50.6 50.8 50.8 50.8 50.1
Race/Ethnicity
American Indian or Alaskan Native 0.2 0.1 0.1 0.1 0.1 0.2
Asian or Pacific Islander 3.5 3.5 3.4 3.1 3.2 3.3
Black/African American non-Hispanic 15.0 14.8 14.7 14.9 14.5 13.3
Latino/Hispanic 8.7 8.6 8.2 8.2 8.1 6.6
White non-Hispanic 70.6 71.3 72.0 72.1 72.6 75.5
Multi-Racial/Ethnic 1.9 1.6 1.6 1.5 1.5 1.0
Assessed Students in State Summaries 121,479 124,007 126,146 126,765 126,250 125,380
Gender and Ethnicity Percent Breakdown for 2011 PSSA: Reading
Demographic or Educational Characteristic
Gr. 4 Gr. 5 Gr. 6 Gr. 7 Gr. 8 Gr. 11
Gender
Female 49.2 49.2 49.1 49.0 49.4 49.7
Male 50.8 50.8 50.9 51.0 50.6 50.3
Race/Ethnicity
American Indian or Alaskan Native 0.1 0.2 0.2 0.1 0.1 0.2
Asian or Pacific Islander 3.4 3.3 3.1 3.1 3.0 3.0
Black/African American non-Hispanic 15.2 15.0 15.2 14.9 14.8 13.9
Latino/Hispanic 8.4 7.9 8.0 7.9 7.6 6.2
White non-Hispanic 71.4 72.2 72.2 72.7 73.3 75.9
Multi-Racial/Ethnic 1.5 1.4 1.3 1.3 1.1 0.8
Assessed Students in State Summaries 124,535 125,963 126,170 126,902 127,125 127,997
Appendix O: PSSA and PSSA-M Demographics Comparison
2012 PSSA-M Technical Report O-5

Gender and Ethnicity Percent Breakdown for 2012 PSSA-M: Science
Demographic or Educational Characteristic
Gr. 8 Gr. 11
Gender
Female 36.9 37.7
Male 63.1 62.2
Race/Ethnicity
American Indian or Alaskan Native 0.2 0.2
Asian or Pacific Islander 0.9 1.0
Black/African American non-Hispanic 19.6 22.6
Latino/Hispanic 10.0 8.8
White non-Hispanic 67.5 66.2
Multi-Racial/Ethnic 1.7 1.0
Assessed Students in State Summaries 3,554 3,742
Gender and Ethnicity Percent Breakdown for 2011 PSSA-M: Science
Demographic or Educational Characteristic
Gr. 8 Gr. 11
Gender
Female 38.2 36.7
Male 61.7 63.1
Race/Ethnicity
American Indian or Alaskan Native 0.1 0.3
Asian or Pacific Islander 1.3 0.8
Black/African American non-Hispanic 19.1 19.7
Latino/Hispanic 10.4 8.3
White non-Hispanic 67.9 69.7
Multi-Racial/Ethnic 1.0 1.0
Assessed Students in State Summaries 3,252 3,540
Appendix O: PSSA and PSSA-M Demographics Comparison
2012 PSSA-M Technical Report O-6
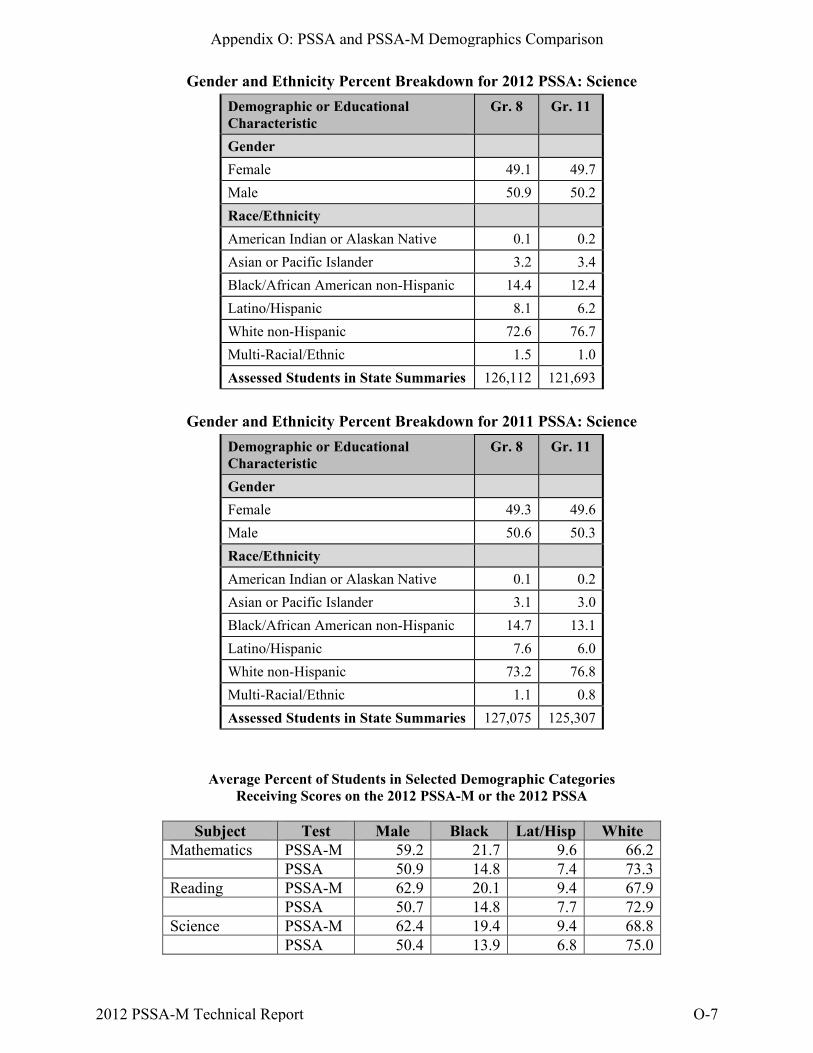
Gender and Ethnicity Percent Breakdown for 2012 PSSA: Science
Demographic or Educational Characteristic
Gr. 8 Gr. 11
Gender
Female 49.1 49.7
Male 50.9 50.2
Race/Ethnicity
American Indian or Alaskan Native 0.1 0.2
Asian or Pacific Islander 3.2 3.4
Black/African American non-Hispanic 14.4 12.4
Latino/Hispanic 8.1 6.2
White non-Hispanic 72.6 76.7
Multi-Racial/Ethnic 1.5 1.0
Assessed Students in State Summaries 126,112 121,693
Gender and Ethnicity Percent Breakdown for 2011 PSSA: Science
Demographic or Educational Characteristic
Gr. 8 Gr. 11
Gender
Female 49.3 49.6
Male 50.6 50.3
Race/Ethnicity
American Indian or Alaskan Native 0.1 0.2
Asian or Pacific Islander 3.1 3.0
Black/African American non-Hispanic 14.7 13.1
Latino/Hispanic 7.6 6.0
White non-Hispanic 73.2 76.8
Multi-Racial/Ethnic 1.1 0.8
Assessed Students in State Summaries 127,075 125,307
Average Percent of Students in Selected Demographic Categories
Receiving Scores on the 2012 PSSA-M or the 2012 PSSA
Subject Test Male Black Lat/Hisp White Mathematics PSSA-M 59.2 21.7 9.6 66.2 PSSA 50.9 14.8 7.4 73.3 Reading PSSA-M 62.9 20.1 9.4 67.9 PSSA 50.7 14.8 7.7 72.9 Science PSSA-M 62.4 19.4 9.4 68.8 PSSA 50.4 13.9 6.8 75.0
Appendix O: PSSA and PSSA-M Demographics Comparison
2012 PSSA-M Technical Report O-7

Appendix O: PSSA and PSSA-M Demographics Comparison
2012 PSSA-M Technical Report O-8


