
EPA 2012 Recreational Water Quality Criteria
69
OFFICE OF WATER 820-F-12-058 Recreational Water Quality Criteria
Transcript of EPA 2012 Recreational Water Quality Criteria

OFFICE OF WATER 820-F-12-058
Recreational Water Quality
Criteria

NOTICES
This document has been drafted and approved for publication by the Health and Ecological
Criteria Division, Office of Science and Technology, United States (U.S.) Environmental
Protection Agency (EPA), and is approved for publication. Mention of trade names or
commercial products does not constitute endorsement or recommendation for use.
FOREWORD
Under §304(a)(l) of the Clean Water Act (CWA) of 1977 (P.L. 95-217) the Administrator of the
EPA is directed to develop and publish water quality criteria (WQC) that accurately reflect the
latest scientific knowledge on the kind and extent of all identifiable effects on health and welfare
that might be expected from the presence of pollutants in any body of water, including
groundwater. CWA §304(a)(9) directs the Administrator to publish new or revised WQC for
pathogens and pathogen indicators (including a revised list of testing methods, as appropriate),
based on the results of the studies conducted under §104(v) of the CWA, for the purpose of
protecting human health in coastal recreation waters. Coastal recreation waters (“coastal waters”)
are defined under §502(21) of the CWA as the Great Lakes and marine coastal waters (including
coastal estuaries) that are designated by a state for use for swimming, bathing, surfing, or similar
water contact activities. This document includes WQC recommendations for pathogens and
pathogen indicators based on the results of the studies conducted under §104(v) of the CWA for
both coastal recreational waters and other waters designated for primary contact recreation
(“non-coastal waters”). As such this document is published pursuant to §304(a)(1) and
§304(a)(9) of the CWA and it includes EPA’s recommended final recreational water quality
criteria (RWQC) for the protection of primary contact recreation in both coastal and non-coastal
waters, based upon consideration of all available information relating to the effects of fecal
contamination on human health, including the studies conducted under CWA §104(v).
The term "water quality criteria" is used in two sections of the CWA: §304 (i.e., §304(a)(1) and
304(a)(9)) and §303(c)(2). The term has a different program impact in each section. CWA §304
criteria are developed by EPA based on the latest scientific information on the relationship that
the effect of a constituent concentration has on particular aquatic species and/or human health.
They are a non-regulatory, scientific assessment of effects on human health or aquatic life. The
criteria recommendations presented in this document are such scientific assessments. The term
“criteria,” as used in §303(c)(2), refers to elements of state water quality standards (WQS),
expressed as constituent concentrations, levels, or narrative statements, representing a quality of
water that supports a particular use. When criteria are met, water quality will generally protect
the designated use. If WQC uses are adopted by a state or promulgated by EPA WQS under
§303, they become the relevant standard for developing permit limits, assessing waters, and
developing total maximum daily loads (TMDLs) for waters that do not meet the WQS. It is not
until their adoption as part of state WQS that 303(c) criteria have a regulatory impact.
In establishing WQC for adoption in WQS, states could establish numerical values based on
EPA’s §304(a) recommendations, or the 304(a) recommendations modified to reflect site-
specific conditions, or other scientifically defensible methods. In all cases, the criteria adopted by
states must be scientifically defensible and protective of designated uses. Guidelines to assist in

modifying the criteria recommendations presented in this document are contained in the Water
Quality Standards Handbook (U.S. EPA, 2012a). This handbook and additional guidance on the
development of WQS and other water-related programs of this agency have been developed by
EPA.
The contents of this final document include only EPA recommendations and additional
information for use by states in developing or implementing RWQC. This document does not
establish or affect legal rights or obligations. It does not establish a binding norm and cannot be
finally determinative of the issues addressed. Agency decisions to approve or disapprove WQC
adopted into state WQS in any particular situation will be made by applying the CWA and EPA
regulations on the basis of specific facts presented and currently available scientific information.

Table of Contents
Notices ................................................................................................................................ 2 Foreword ............................................................................................................................. 2 Appendices .......................................................................................................................... 5 Acronyms ............................................................................................................................ 6 1.0 Executive Summary ...................................................................................................... 1
1.1 Contents of this Document ........................................................................................1 1.2 EPA’s Recommended §304(a) Water Quality Criteria ..............................................4
2.0 Applicability and Scope of the 2012 RWQC ................................................................ 6 3.0 Basis of the 2012 RWQC .............................................................................................. 9
3.1 Indicators of Fecal Contamination .............................................................................9 3.1.1 Enumeration Methods in RWQC ..................................................................... 10
3.2 Linking Water Quality with GI Illness and Health ..................................................12
3.2.1 Historical Perspectives in Criteria Development ............................................. 12 3.2.2 Human Health Endpoint .................................................................................. 13 3.2.3 Relationship Between Water Quality and Illness ............................................ 15 3.2.4 Developing Enterococci Measured by Culture Criteria and Comparable Values
for Culturable E. coli and Enterococcus spp. Measured by qPCR ............. 20 3.3 Scope of Protected Population .................................................................................30 3.4 Waterbody Type ......................................................................................................33 3.5 Sources of Fecal Contamination ..............................................................................35
3.5.1 Zoonotic Potential ............................................................................................ 36 3.5.2 Differential Health Risks from Human versus Nonhuman Sources ................ 36
3.6 Expression of Criteria ..............................................................................................38 3.6.1 EPA’s 1986 Ambient Water Quality Criteria for Bacteria .............................. 38 3.6.2 The 2012 RWQC ............................................................................................. 39
3.6.3 Criteria Magnitude, Duration, and Frequency for CWA Purposes .................. 40 3.6.4 Application of State WQS based on EPA’s 2012 RWQC for NPDES
Permitting, 303(d) Listing, TMDL Development, and Beach Notification
Programs ..................................................................................................... 41 3.6.5 Practical Considerations for Implementing State WQS based on the 2012
RWQC ........................................................................................................ 42 4.0 Recreational Water Quality Criteria ........................................................................... 42
5.0 Supplemental Elements for Enhanced Protection of Recreational Waters ................. 43 5.1 Beach Action Value (BAV) .....................................................................................44 5.2 Rapid Method: Enterococcus spp. as measured by qPCR (EPA Method 1611) ....44
6.0 Tools to Support States and Tribes in Evaluating and Managing Recreational Waters
and for Considering Alternative Water Quality Criteria........................................... 46
6.1 Tools for Evaluating and Managing Recreational Waters .......................................47 6.1.1 Sanitary Survey ................................................................................................ 47
6.1.2 Predictive Models ............................................................................................ 48 6.2 Tools for Developing Alternative Criteria ...............................................................48
6.2.1 Epidemiological Studies .................................................................................. 49 6.2.2 Quantitative Microbial Risk Assessment ......................................................... 50 6.2.3 Alternative Indicators or Methods ................................................................... 51
References ......................................................................................................................... 53

Appendices
APPENDIX A. Translation of 1986 Criteria Risk to Equivalent Risk Levels for Use with New
Health Data Developed Using Rapid Methods for Measuring Water Quality, U.S. EPA 2011.
APPENDIX B. NEEAR data used for comparison to EPA's epidemiological studies from the late
1970s and early 1980s
APPENDIX C. Analysis of NEEAR culture data: combining marine and fresh waters.
Acronyms
BAV beach action value
BEACH Beaches Environmental Assessment and Coastal Health
cce calibrator cell equivalent
CDC U.S. Centers for Disease Control and Prevention
cfu colony forming units
CI confidence interval
CSO combined sewer overflow
Ct cycle threshold
CWA
DNA
Clean Water Act
deoxyribonucleic acid
E. coli Escherichia coli
EPA Environmental Protection Agency
E.U. European Union
FIB fecal indicator bacteria, which includes fecal coliforms, E. coli, enterococci, or
Enterococcus spp.
GI gastrointestinal
GM geometric mean
HCGI highly credible gastrointestinal illness
mL milliliters
MPN most probable number
NEEAR National Epidemiological and Environmental Assessment of Recreational Water
NGI NEEAR-GI illness
NOAEL no observed adverse effect level
NPDES National Pollutant Discharge Elimination System
PC prospective cohort
PCR polymerase chain reaction
QMRA quantitative microbial risk assessment
qPCR quantitative polymerase chain reaction
RCT randomized control trial
RT reverse transcriptase
RWQC recreational water quality criteria
SCCWRP
SSM
Southern California Coastal Water Research Project
single sample maximum
States states, tribes, and territories of the United States
STV statistical threshold value
TMDL total maximum daily load
TSM technical support material
U.S. United States
WERF Water Environment Research Foundation
WHO
WQBEL
WQC
WQS
World Health Organization (United Nations)
water quality-based effluent limits
water quality criteria
water quality standard(s)
WWTP wastewater treatment plant

1
1.0 Executive Summary
The CWA, as amended by the Beaches
Environmental Assessment and Coastal Health
(BEACH) Act in 2000, requires the U.S. EPA
under §104(v) and §304(a)(9) to conduct studies
associated with pathogens and human health
and to publish new or revised WQC
recommendations for these pathogens and
pathogen indicators based on those studies. This
document was prepared following an extensive
review of the available scientific literature and
evaluation of new information from studies EPA
conducted pursuant to CWA §104(v) and after
public notice and comment on the 2011 draft
RWQC. This document provides EPA’s
recommended CWA §304(a) RWQC for states,
lays out the science related to the 2012 RWQC,
describes how these scientific findings were used
during the development of the 2012 RWQC, and
describes the water quality methods associated
with the 2012 RWQC. It also includes
information for states that would prefer to adopt
WQC that differ from EPA’s 2012 RWQC
recommendations. The additional information is
intended to assist those states in developing
alternative WQC that are scientifically defensible
and protective of the primary contact recreational
use.
1.1 Contents of this Document
Section 1 provides an executive summary and
introductory information regarding the history of
EPA’s WQC recommendations and the CWA.
Section 2 provides an overview of the most
recent scientific findings used to support the
criteria and explains the scope of the 2012
RWQC. The studies and projects EPA conducted
as part of the 2012 RWQC development are
described in the Critical Path Science Plan and
other documents (U.S. EPA 2010a, 2010b; see
appendices A, B, and C). The projects align into
the following major categories: epidemiological
studies, QMRA, site characterization studies, indicators/methods development and validation
What is new or different in the 2012 RWQC)
compared to the 1986 Criteria?
The 2012 RWQC consists of both a
geometric mean (GM) and a statistical
threshold value (STV).
The 2012 RWQC are now comprised of a
magnitude, duration, and frequency of
excursion for both the GM and STV.
The 2012 RWQC were developed based on
the studies utilized in creating the 1986
WQC as well as more recent scientific
information including the National
Epidemiological and Environmental
Assessment of Recreational Water
(NEEAR) data.
EPA is including two sets of recommended
criteria values that protect the designated
use of primary contact recreation.
The criteria recommendations for marine
and fresh waters are no longer based on
different illness rates.
There are no longer different criteria
recommendations for different use
intensities.
EPA is providing information for states that
want to adopt WQS based on a quantitative
polymerase chain reaction (qPCR) method
that EPA has developed and validated.
EPA is providing states with Beach Action
Values (BAVs) for use in notification
programs.
EPA is providing additional information on
tools for assessing and managing
recreational waters, such as predictive
modeling and sanitary surveys.
EPA is providing information on tools for
developing alternative RWQC on a site-
specific basis, such as epidemiological
studies in both marine and fresh waters and
quantitative microbial risk assessment
(QMRA).

2
studies, modeling, level of public health protection, and literature reviews. EPA also considered
relevant studies conducted by independent researchers.
Section 3 describes the science that was considered during the development of the 2012 RWQC.
This includes indicators of fecal contamination and enumeration methods, linking water quality
and health, scope of protected populations, types of waterbodies, sources of fecal contamination,
and the expression of the 2012 RWQC.
In the 2012 RWQC, EPA recommends using the fecal indicator bacteria (FIB) enterococci and
Escherichia coli (E. coli) as indicators of fecal contamination for fresh water and enterococci for
marine water. Section 3.1 explains that EPA recommends culture-based methods be used to
detect the presence of either indicator and that states adopt standards for these indicators as
measured by culture methods, expressed in colony forming units (cfu). Section 3.1 also includes
information and recommendations for states that would like to adopt standards for Enterococcus
spp., as measured by a rapid qPCR method. Because of the limited experience with this method
and concerns with interference, EPA recommends that states evaluate qPCR performance in
ambient waters in which it would be employed prior to developing new or revised standards
based on the qPCR method. EPA will provide separate guidance on how to evaluate qPCR
performance.
Section 3.2.1 provides a historical overview of how WQC that protect the designated use of
primary contact recreation have changed throughout the past century. Scientific advancements in
microbiological, statistical, and epidemiological methods have demonstrated that culturable
enterococci and E. coli are better indicators of fecal contamination than the previously used
general indicators, total coliforms and fecal coliforms. Fecal contamination in recreational waters
is associated with an increased risk of gastrointestinal (GI) illness and less often identified
respiratory illness. As such, fecal contamination and its indicators are considered “pathogen
indicators,” as defined by §502(23) of the CWA.
Section 3.2.2 discusses the various human health endpoints that EPA and others have examined
in epidemiological studies. Additionally, EPA’s two different GI illness definitions are
discussed. EPA’s 1986 criteria recommendations correspond to a level of water quality that is
associated with an estimated illness rate expressed in terms of the number of highly credible
gastrointestinal illnesses (HCGI) per 1,000 primary contact recreators. EPA’s NEEAR study
used a more comprehensive definition of GI illness, referred to as NEEAR-GI (NGI). Because
NGI is broader than HCGI (i.e., NGI includes diarrhea without the requirement of fever), more
illness cases were reported and associated with aquatic recreation in the NEEAR study using the
NGI definition of illness, at the same level of water quality observed using the previous illness
definition (i.e., HCGI).
Section 3.2.3 provides an overview of the epidemiological studies conducted by EPA as part of
the NEEAR study. Seven studies were performed at temperate beaches primarily impacted by
wastewater treatment plants (WWTPs) discharging effluent from treated municipal sewage.
Three of those beaches were marine water and four were fresh water. Studies also were
performed at two additional beaches: a temperate beach in Surfside, South Carolina impacted by

3
urban runoff sources, and a tropical beach in Boquerón, Puerto Rico. EPA also considered
epidemiological studies from other research efforts in developing these recreation criteria.
Section 3.2.4 describes the process EPA used to derive the culturable enterococci criterion value
and comparable illness rates for E. coli measured by culture and Enterococcus spp. measured by
qPCR thresholds. Based on the selected illness rates, EPA derived qPCR values for
Enterococcus spp. comparable to the culture-based values for both marine and fresh waters,
computed from the regression model derived from the NEEAR epidemiological study in marine
and fresh waters.
Section 3.3 discusses subpopulations that participated in recreational activities in the NEEAR
study. Children aged ten years and younger showed a higher rate of illnesses than adults in fresh
water, but did not for marine water exposures. The sample sizes in the epidemiological data were
not large enough to evaluate potential differences for persons over 55 years of age, pregnant
women, or other vulnerable individuals. EPA’s 2012 RWQC recommendations are based on the
general population, which includes children. Because children may be more exposed and/or more
sensitive to pathogens in recreational waters, it is important to have effective risk communication
outreach to mitigate their exposure to contaminated recreational waters. EPA is also providing
BAVs that are the 75th
percentile value of a water quality distribution based on these new
criteria. These values, while not recommended for determining use attainment, are provided for
states to use as a precautionary tool to provide an early alert to beachgoers, including families
with children.
Section 3.4 describes EPA’s review of the available information comparing coastal (including
Great Lakes and marine) and non-coastal (including flowing and non-flowing inland) waters to
evaluate whether EPA should recommend that states use the 2012 RWQC in developing
recreational WQS in all waterbody types. Based on EPA’s evaluation of the body of information
described in section 3.4, EPA recommends the 2012 RWQC for use in both coastal and non-
coastal waterbodies. While some differences may exist between coastal and non-coastal waters,
the recommended indicators, enumeration methods, and criteria values are scientifically
defensible and protective of the primary contact use in coastal and non-coastal waters. Therefore,
EPA’s 2012 RWQC recommendations are national recommendations for all waterbody types
designated for swimming, bathing, surfing, or similar water contact activities (referred to
throughout this document as “primary contact recreational use”).
Section 3.5 describes EPA’s evaluation of how different fecal sources may influence risks to
human health. Human pathogens are often present in animal fecal matter, and thus, there are
risks associated with recreating in animal-impacted waters. However, quantifying that level of
risk associated with animal fecal material is difficult, and the methods necessary to distinguish
between human and nonhuman fecal sources, with the appropriate level of confidence, are still
under development. Thus, EPA believes that the 2012 RWQC are protective of public health,
regardless of the source of fecal contamination. EPA is not developing recommendations that
take source of fecal contamination into account. Rather, states interested in adopting different
standards to address the variability in human health risks associated with different sources of
fecal contamination on a site-specific basis should refer to section 6, where EPA describes
methods for developing site-specific standards.

4
Section 3.6 describes the statistical expression of the 2012 RWQC. As part of the 2012 RWQC,
EPA is recommending criteria expressed using two components: the GM and the STV. For each
of the sets of criteria values, EPA computed the STV based on the water quality distribution
observed during EPA’s epidemiological studies. The STV approximates the 90th
percentile of the
water quality distribution and is intended to be a value that should not be exceeded by more than
10% of the samples used to calculate the GM. Because densities of FIB are highly variable in
ambient waters, distributional estimates are more robust than single point estimates.
Section 4 presents EPA’s recommended WQC consisting of the magnitude, duration, and
frequency of excursions for enterococci and E. coli as measured by culture-based methods. EPA
provides two sets of recommended criteria, each of which correspond to two different illness
rates. The designated use of primary contact recreation would be protected if either set of criteria
recommendations in section 4.0 are adopted into state WQS and approved by EPA.
Section 5 provides additional elements for states’ use to enhance public health protection. These
elements include BAVs and values for Enterococcus spp. as measured by qPCR.
Section 6 describes the additional tools that can be used to manage recreational waters and derive
site-specific criteria. The tools listed in section 6 will not only provide states with additional
tools for revising their WQS for primary contact recreation, but will also help states gain a better
understanding of their surrounding watersheds and of appropriate management strategies.
Section 6.1 describes sanitary surveys and provides an overview of predictive models. Section
6.2 provides an overview of options for states to develop site-specific criteria. Tools described in
section 6 will be further developed and explained in technical support material(s) (TSM) that are
being developed by EPA. EPA will publish multiple TSM focusing on these tools as they are
available.
Appendices are also included that describe data and information used to evaluate the linking of
water quality and health. Appendix A provides a translation of the illness rates associated with
the1986 criteria to equivalent illness rates for use with new health data developed using rapid
methods for measuring water quality. Appendix B includes a comparison of NEEAR culturable
water quality and health effects to EPA’s epidemiological studies from the 1980s. Appendix C is
an analysis of the NEEAR marine and fresh water data for culturable enterococci.
1.2 EPA’s Recommended §304(a) Water Quality Criteria
An important goal of the CWA is to protect and restore waters for swimming. Section 304(a) of
the CWA directs EPA to publish and, from time to time, revise the WQC to accurately reflect the
latest scientific knowledge on the identifiable effects on health and welfare that might be
expected from the presence of pollutants in any body of water, including groundwater. These
recommendations are referred to as §304(a) criteria. Under §304(a)(9) of the CWA, EPA is
required to publish WQC for pathogens and pathogen indicators based on the results of the
studies conducted under §104(v), for the purpose of protecting human health in coastal recreation
waters, which are defined as marine and Great Lakes waters designated under CWA §303(c) for

5
use for swimming, bathing, surfing, or similar water contact activities (referred to throughout the
document as primary contact recreation).
CWA §304(a) criteria do not reflect consideration of economic impacts or the technological
feasibility of meeting pollutant concentrations in ambient water. The 2012 RWQC
recommendations are based on data and scientific conclusions on the relationship between FIB
density and GI illness. These criteria recommendations may be used by the states to establish
WQS, and if adopted in state WQS and approved by EPA, will ultimately provide a basis for
controlling the discharge or release of pollutants and assessing waterbodies. Additionally, the
criteria also provide guidance to EPA when promulgating WQS for states under CWA §303(c),
when such actions are necessary.
When states adopt new or revised WQC into WQS, they must be scientifically defensible and
protective of the designated uses of the waterbodies. EPA’s regulation 40 CFR §131.11(b)(1)
provides that “In establishing criteria, states should (1) Establish numerical values based on (i)
304(a) Guidance; or (ii) 304(a) Guidance modified to reflect site-specific conditions; or (iii)
Other scientifically defensible methods.” EPA’s 2012 RWQC recommendations describe the
desired ambient water quality conditions to support the designated use of primary contact
recreation.
EPA has a long history of using FIB for protecting people who use recreational waters. In the
1960s, the U.S. Public Health Service recommended using fecal coliform as FIB, and EPA
recommended fecal coliform bacteria in 1976 (U.S. EPA, 1976). In the late 1970s and early
1980s, EPA conducted epidemiological studies that evaluated the use of several organisms as
possible indicators of fecal contamination, including fecal coliform, E. coli, and enterococci
(Cabelli et al., 1983; Dufour, 1984). These studies showed that enterococci are good predictors
of GI illnesses in marine and fresh recreational waters, and E. coli are good predictors of GI
illnesses in fresh waters. As a result, EPA published EPA’s Ambient Water Quality Criteria for
Bacteria – 1986 (hereafter referred to as “the 1986 criteria”). The 1986 criteria document
includes EPA recommendations to use enterococci for marine and fresh recreational waters (a
GM of 33 enterococci cfu per 100 mL in fresh water and 35 enterococci cfu per 100 mL in
marine water) and E. coli for fresh recreational waters (a GM of 126 E. coli cfu per 100 mL)
(U.S. EPA, 1986). The 1986 recommendations replaced EPA’s previously recommended fecal
coliform criteria of 200 fecal coliform cfu per 100 mL (U.S. EPA, 1976). In the 2004 BEACH
Act Rule, EPA promulgated WQS for coastal recreational waters in the 21 states that had not yet
adopted standards as protective of human health as EPA’s 1986 criteria recommendations (U.S.
EPA, 2004).
Like past EPA recommendations for primary contact recreational uses, the 2012 criteria are
based on indicators of fecal contamination. A pathogen indicator, as defined in §502(23) of the
CWA, as amended by the BEACH Act, is defined as follows: “a substance that indicates the
potential for human infectious disease.” Most strains of enterococci and E. coli do not cause
human illness (that is, they are not human pathogens); rather, they indicate the presence of fecal
contamination. The basis for recommending criteria that use bacterial indicators of fecal
contamination is that pathogens often co-occur with indicators of fecal contamination.

6
EPA recommends that states make a risk management decision regarding illness rate which will
determine which set (based on illness rate selected) of criteria values are most appropriate for
their waters. The designated use of primary contact recreation would be protected if either set of
criteria (including a GM and related STV) shown in Table 1 is adopted into state WQS and
approved by EPA. EPA recommends states apply this risk management decision statewide. Note
that criteria for either enterococci or E. coli can be used for fresh waters. Selecting a mixture of
the GM and STV that are associated with different illness rates is not scientifically defensible
since the STV is derived from the water quality distribution as defined by the GM.
Table 1. Recommended 2012 RWQC.
Criteria
Elements
Estimated Illness Rate (NGI):
36 per 1,000 primary contact
recreators
OR
Estimated Illness Rate (NGI):
32 per 1,000 primary contact
recreators
Magnitude Magnitude
Indicator
GM
(cfu/100 mL)a
STV
(cfu/100 mL)a
GM
(cfu/100 mL)a
STV
(cfu/100 mL)a
Enterococci
– marine
and fresh 35 130 30 110
OR
E. coli
– fresh 126 410 100 320
Duration and Frequency: The waterbody GM should not be greater than the selected GM
magnitude in any 30-day interval. There should not be greater than a ten percent excursion
frequency of the selected STV magnitude in the same 30-day interval. a EPA recommends using EPA Method 1600 (U.S. EPA, 2002a) to measure culturable enterococci, or another
equivalent method that measures culturable enterococci and using EPA Method 1603 (U.S. EPA, 2002b) to measure
culturable E. coli, or any other equivalent method that measures culturable E. coli.
EPA is also providing information for developing site-specific criteria that measure enterococci
using EPA’s Enterococcus spp. qPCR Method 1611 (U.S. EPA, 2012b). For the purposes of
beach notification, EPA encourages the use of a BAV, which approximates the 75th
percentile of
a water-quality distribution based on the desired GM. See section 5.1 and 5.2 for ‘Supplemental
Elements.’
2.0 Applicability and Scope of the 2012 RWQC
EPA’s 2012 RWQC are for all waters in the United States including marine, estuarine, Great
Lakes, and inland waters that are designated for primary contact recreation. Primary contact
recreation typically includes activities where immersion and ingestion are likely and there is a
high degree of bodily contact with the water, such as swimming, bathing, surfing, water skiing,
tubing, skin diving, water play by children, or similar water-contact activities.
Since EPA last published recommended RWQC in 1986, scientific advances have been made in
the areas of epidemiology, molecular biology, microbiology, QMRA, and methods of analytical
assessment. EPA’s evaluation and consideration of these new scientific and technical advances

7
in the development of the 2012 RWQC strengthens the scientific foundation of EPA’s criteria
recommendations to protect the designated use of primary contact recreation.
In accordance with §104(v) of the CWA, as amended by the BEACH Act, EPA developed and
implemented a research plan to ensure that state-of-the-art science would be available to support
the development of the 2012 RWQC recommendations. To facilitate the identification of
research required to develop the 2012 RWQC, EPA held a five-day scientific workshop in 2007
to obtain a broad range of external scientific input. Forty-three domestic and international experts
provided input on near-term research requirements that would be needed in the next two to three
years to further develop the scientific foundation of new 2012 RWQC and implementation
guidance. The report from this workshop, Report of the Experts Scientific Workshop on Critical
Research Needs for the Development of New or Revised Recreational Water Quality Criteria
(U.S. EPA, 2007a), included chapters from the seven breakout groups, including: (1) approaches
to criteria development, (2) pathogens, pathogen indicators, and indicators of fecal
contamination, (3) methods development, (4) comparison of the risks of different contamination
sources to humans, (5) acceptable risk, (6) modeling applications for criteria development and
implementation, and (7) implementation realities.
The report from the Experts Scientific Workshop provided a core part of the information EPA
used to develop the Critical Path Science Plan for the Development of New or Revised
Recreational Water Quality Criteria (U.S. EPA, 2007b). The Critical Path Science Plan, which
was peer reviewed, includes 32 projects that EPA completed for the development of the 2012
RWQC. All projects included in the Critical Path Science Plan, were completed and considered
during the process of developing the 2012 RWQC. Projects included epidemiological studies to
provide data correlating illness with indicators, site-characterization studies to facilitate QMRA,
indicator and methods development and validation, water quality modeling, literature reviews,
and additional studies to support the recommended criteria values and associated level of public
health protection. EPA specific-projects included efforts in the following areas:1
Epidemiological Studies and QMRA
o o
o o
2003–2004 Temperate fresh water: four beach sites on the Great Lakes
2005–2007 Temperate marine: three beach sites: Alabama, Rhode Island,
Mississippi
2009 sites: Puerto Rico (tropical), South Carolina (urban runoff)
QMRA for fresh water impacted by agricultural animals
Site Characterization Studies
o o
o
o o
Development of site characterization tool for QMRA applications
Expanded data collection at epidemiological study locations to support modeling
and QMRA
Site selection evaluation for Puerto Rico and South Carolina epidemiological
studies
Study to better understand spatial and temporal variability
Pilot sanitary survey in the Great Lakes
Indicators/Methods Development and Validation Studies
1 EPA’s Recreational Water Quality Criteria website:
http://water.epa.gov/scitech/swguidance/standards/criteria/health/recreation/

8
o
o o o o o
o o
Evaluate multiple indicator/method combinations to develop quantifiable
relationships
Study the effects of sample holding time, storage, and preservation
Performance of qPCR signal in ambient water and wastewater (fate and transport)
Develop, refine, validate, and publish new ambient and wastewater methods
Publish a rapid test method that has been validated by multiple laboratories
Evaluate the suitability of individual combinations of indicators and methods for
different CWA purposes
Develop new and/or evaluate previously published source-identifying assays
Evaluate genetic markers for human, bovine, chickens, and gulls
Modeling
o o o o
Pilot test Virtual Beach Model Builder
Refine and validate existing models for fresh water beaches
Refine and validate other existing models for marine beaches
Develop technical protocol for site-specific application of predictive models
Recommended Level of Public Health Protection
o
o o
Evaluate 1986 recommendations for culturable enterococci and E. coli compared
to data collected in EPA studies and non-EPA studies
Evaluate applicability of EPA Great Lakes epidemiological data to inland waters
Evaluate available children’s health data
Literature Reviews
o
o
o
State-of-the-science reviews of published studies to characterize relative risk from
different fecal sources
State-of-the-science review on occurrence and cross-infectivity of specific
pathogens associated with animals
Comparison and evaluation of epidemiological study designs of health effects
associated with recreational water use
EPA conducted epidemiological investigations at U.S. beaches in 2003, 2004, 2005, 2007, and
2009, and as a group these investigations are referred to as the NEEAR study. The NEEAR study
enrolled 54,250 participants, encompassed nine locations, and collected and analyzed numerous
samples from a combination of fresh water, marine, tropical, and temperate beaches (U.S. EPA,
2010a; Wade et al., 2008, 2010).
EPA provided assistance and technical support to several additional projects: the Water
Environment Research Foundation (WERF) workshop, Experts Scientific Workshop on Critical
Research and Science Needs for the Development of Recreational Water Quality Criteria for
Inland Waters, to consider the significance of the differences between inland and coastal
recreational waters (WERF, 2009); and the Southern California Coastal Water Research Project
(SCCWRP) for epidemiological studies at the California beaches of Doheny (Colford et al.,
2012), Avalon, and Malibu.
Finally, EPA also considered other research and studies relevant to the development of the 2012
RWQC. These studies included epidemiological studies, research on the development of new and
improved water quality indicators and analytical methods, approaches to QMRA, water quality
predictive modeling, and microbial-source tracking. EPA considered all available data from the

9
open literature and water quality data received from SCCWRP on studies they conducted with
technical support from EPA at Doheny, Avalon, and Malibu beaches. These SCCWRP studies
were generally consistent with the NEEAR study findings. These studies are discussed further in
section 3 of this document.
3.0 Basis of the 2012 RWQC
To develop the 2012 RWQC, EPA considered indicators of fecal contamination, methods for
detecting and enumerating such indicators, the relationship between the occurrence of FIB in the
water and their human health effects, the populations to be protected by the 2012 RWQC,
waterbody types, sources of fecal contamination, and how the 2012 RWQC should be expressed
in terms of a magnitude, duration, and frequency. EPA also considered all of the comments
received on the December 2011 draft RWQC document (EPA, 2011). EPA’s responses to
comments will be available separately. In response to comments asserting that the allowable
illness rate in the 2011 draft RWQC was too high, EPA conducted additional analyses of the
NEEAR data. These analyses and EPA’s recommendations are presented in sections 3.0 and 4.0.
3.1 Indicators of Fecal Contamination
Public health agencies have long used FIB to identify potential for illness resulting from
recreational activities in surface waters contaminated by fecal pollution. EPA based its 1986
criteria for recreational marine and fresh waters on observed illness levels in swimmers and
corresponding levels of bacterial indicators of fecal contamination, specifically enterococci and
E. coli for fresh water and enterococci for marine water. Although most strains of FIB are not
pathogenic, they demonstrate characteristics that make them good indicators of fecal
contamination (i.e., often of fecal origin and simple methods of detection) and thus, indirectly
indicate the potential presence of fecal pathogens capable of causing GI illnesses. As such, FIB
are “pathogen indicators” as that term is defined by CWA §502(23) –“a substance that indicates
the potential for human infectious diseases” – even though they are not generally thought of as
“pathogen indicators,” as that term is typically used by the scientific community as direct
indicators of pathogens. EPA is not publishing criteria for “pathogens” because the state of the
science was not sufficient at the time of completion of these RWQC. In addition, there are
numerous pathogens that cause the full range of illnesses associated with primary contact
recreation. Pathogen-specific enumeration methods for environmental waters were not available
at the time of the NEEAR study, and thus health relationships with specific pathogens were not
established (U.S. EPA, 2010c, 2010d).
Microorganisms that are potential indicators of fecal contamination are normally present in fecal
material. Not all of these indicators, however, have a clear relationship to illness rates observed
in epidemiological studies. As discussed in section 3.2.3, two microorganisms that have
consistently performed well as indicators of illness in sewage-contaminated waters during
epidemiological studies are enterococci in both marine and fresh water and E. coli in fresh water
measured by culture (Prüss, 1998; Wade et al., 2003; Zmirou et al., 2003). Additionally, two
recent epidemiological studies also demonstrate the utility of E. coli as an indicator as
recommended in the 1986 criteria (Marion et al., 2010; Wiedenmann, 2006). Together the
available body of information supports EPA’s 2012 RWQC recommendations to use enterococci

10
and E. coli as indicators of fecal contamination. See section 6.2.3 for discussion of the use of
alternative indicators, such as E. coli measured by qPCR, which EPA has not specifically
included in the 2012 RWQC.
3.1.1 Enumeration Methods in RWQC
Indicators of fecal contamination are detected and enumerated using a variety of methods. Thus,
the chosen indicator and method combination is critical for determining a criterion value. The
important linkage between the organism and the method is captured throughout this document by
the use of the term “indicator/method” to refer to this combination.
FIB can be enumerated using various analytical methods including those in which the organisms
are grown (cultured) and those in which their deoxyribonucleic acid (DNA) is extracted from an
environmental sample, amplified, and quantified (using qPCR). These different enumeration
methods result in method-specific units and values. One culture-based method, membrane
filtration, results in the number of colonies that arise from bacteria captured on the membrane
filter per volume of water filtered. One colony can be produced from one or several cells
(clumped cells in the environmental sample). Another culture-based method, the defined
substrate method, produces a most probable number (MPN) per volume. MPN analyses estimate
the number of organisms in a sample using statistical probability tables, hence the term “most
probable number.” Bacterial densities MPN are based on the combination of positive and
negative test tube results that can be read from an MPN table (U.S. EPA, 1978). Culture-based
approaches for the enumeration of FIB, such as MPN and membrane filtration, generate results
following the culturing of a particular microbe for 18–24 hours, and in the case of MPN do not
result in a direct count or concentration density of the bacteria being enumerated but rather rely
on probabilities. Results from qPCR analyses are reported in units that are calculated based on
the target DNA sequences from test samples relative to those in calibrator samples that contain a
known quantity of target organisms (Haugland et al., 2005; Wade et al., 2010)2.
The results from each of these enumeration techniques (i.e., culture and qPCR) depend on the
method used. Each analytical technique focuses on different attributes of the fecal indicator and
results in a “signal” specific to that technique. For example, culture-based methods
fundamentally depend on the metabolic state (i.e., viability and activity) of the target organisms
for effective enumeration. Only the culturable sub-set of the target indicator is detected using
culture-based techniques. Alternatively, qPCR-based approaches detect specific sequences of
DNA that have been extracted from a water sample, and results contain sequences from both
viable and non-viable forms of the targeted indicator. In the context of the 2012 RWQC, the
results for enterococci determined using the culture-based methods are not the same as the results
for EPA’s Enterococcus spp. qPCR Method 1611 (U.S. EPA, 2012b). These results are not
directly interchangeable and require an explanation of each method’s results, as they relate to the
reported health effects (i.e., epidemiological relationships; see section 3.2).
2 Note that in some EPA NEEAR study publications, the term calibrator cell equivalent (cce) has been shortened to
cell equivalent (ce). EPA considers these terms to be synonymous and in all cases calibrator cells were used. EPA
used the delta-delta comparative cycle threshold (Ct) calibration model for estimating cce or ce in all NEEAR study
data (U.S. EPA, 2012b).

11
FIB, such as enterococci and E. coli, enumerated by culture-based methods, have an association
with GI illness from exposure to ambient recreational water as demonstrated previously (Cabelli
et al., 1982; Cabelli, 1983; Calderon et al., 1991; Dufour 1984; Marion et al., 2010; Wade et al.,
2003, 2006, 2008, 2010; Wiedenmann et al., 2006). Wade et al. (2008, 2010) did not show a
statistically significant correlation of illness rates with culturable enterococci as was shown in
the studies conducted in the 1980s. However, the NEEAR study did reaffirm an association with
health as indicated by increased illness above the 1986 criteria values. The early and more recent
studies conducted by EPA and others therefore support the establishment of WQC based on
culturable indicators (see section 3.2.4). Thus, culturable indicators are scientifically defensible
and are retained as the basis for the 2012 RWQC. FIB enumerated by culture-based methods also
provide a historical association with previous water-quality data in states that already have WQS
based on those indicators.
EPA is also providing information on how to use a more recently developed qPCR method.
Enterococci measured by EPA’s Enterococcus spp. qPCR Method (U.S. EPA, 2012b) showed a
statistically significant correlation with GI illness among primary contact recreators in both
marine and fresh recreational waters impacted by human fecal contamination (Wade et al., 2006,
2008, 2010). The technical literature demonstrates that enumeration of enterococci using this
technique can provide results more rapidly than culture-based methods with results available the
same day (Griffith and Weisberg, 2011).
As with other methods, the qPCR methodology may be affected by interference3 from substances
in different environmental matrices such as surface waters. Mitigation approaches discussed in
EPA’s Enterococcus spp. qPCR Method 1611 have been identified that show promise for
reducing the effects of interference in particularly problematic water samples, including those
that occurred in the tropical marine NEEAR study (Haugland et al., 2012; U.S. EPA, 2012b).
Although the fresh water NEEAR study sites in the Great Lakes and four temperate marine
beaches demonstrated minimal to no interference, EPA’s overall testing of this qPCR method
with different types of ambient waters and use by other laboratories has been limited.
Kinzelman et al. (2011) reported minimal incidences of unacceptable interference with EPA
Enterococcus spp. qPCR Method 1611 in Great Lakes coastal waters using a more stringent
definition of interference; however, increased incidences were observed in some inland water
locations. The highest frequency of incidences was seen at sites that were dominated by non-
point source pollution. Mitigation techniques, such as purification of the sample or follow-up
sample extract dilution, were able to resolve the interference in some of the samples; however,
these additional steps resulted in an increase in the amount of time necessary to generate results.
Other researchers have also reported inhibition or other types of interference in samples using
non-EPA qPCR methodologies (Noble et al., 2010).
3 Interference is any process that results in lower quantitative estimates than expected or actual values. Interference
can result from sample inhibition of the polymerase or binding of substances to the DNA, which prevents either the
primers from binding or polymerase function. EPA Enterococcus spp. qPCR Method 1611 (U.S. EPA, 2012b) has a
sample processing control assay that is performed on each sample to identify unacceptable levels of interference
(defined as a 3-Ct unit shift compared to corresponding control samples).

12
EPA believes that overall testing of the qPCR method with different types of ambient waters, and
by different laboratories, remains limited and anticipates that there may be situations at some
locations where the performance of the qPCR method may be inconsistent. EPA therefore
suggests that states evaluate the qPCR method with respect to laboratory performance and
sample interference in their prospective waters prior to developing new or revised standards
relying on this method. EPA will provide additional guidance on how to evaluate qPCR method
performance at a later date.
3.2 Linking Water Quality with GI Illness and Health
This section discusses the information that EPA considered during the course of evaluating the
association between measures of water quality and potential human health effects from exposure
to fecal contamination. There are many scenarios where human-derived fecal contamination can
impact a waterbody. The relationship between the presence of FIB and any of the enteric
pathogens that cause illness in humans can be highly variable, but has been described
mathematically as used in QMRA (Schoen and Ashbolt, 2010). The following four subsections
describe the lines of evidence EPA used to derive recommended criteria levels. The historical
perspectives subsection briefly discusses previous approaches to the development of WQC in the
U.S. The human health endpoint subsection explains how the definition of illness is important for
understanding the meaning of the associated 2012 RWQC illness rate levels. The water quality
and illness subsection presents the results of epidemiological studies that EPA considered when
developing the 2012 RWQC. The criteria values development subsection discusses the basis of
the 2012 RWQC values.
3.2.1 Historical Perspectives in Criteria Development
EPA’s previously recommended RWQC (i.e., the 1986 criteria) and the 2012 RWQC are based
on the observed association between the density of FIB and GI illnesses. FIB levels have long
served as the surrogate measure of fecal contamination and thus the presence of pathogens that
are commonly associated with fecal material.
In the 1960s, the U.S. Public Health Service recommended using fecal coliform bacteria as the
indicator of primary contact with FIB. Studies conducted by the U.S. Public Health Service
reported a detectable health effect when total coliforms density was about 2,300 per 100 mL
(Stevenson, 1953). In 1968, the National Technical Advisory Committee translated the total
coliform level to 400 fecal coliforms per 100 mL based on a ratio of total coliforms to fecal
coliforms and then halved that number to 200 fecal coliforms per 100 mL (U.S. EPA, 1986). The
National Technical Advisory Committee criteria for recreational waters were recommended by
EPA in 1976.
In the late 1970s and early 1980s, EPA conducted a series of epidemiological studies to evaluate
several additional organisms as possible indicators of fecal contamination including E. coli and
enterococci. These epidemiological studies showed that enterococci are a good predictor of GI
illnesses in fresh and marine recreational waters, and E. coli is a good predictor of GI illnesses in
fresh waters (Cabelli et al., 1982; Cabelli, 1983; Dufour, 1984).

13
The 1986 criteria values represented the desired ambient condition of the waterbody necessary to
protect the designated use of primary contact recreation. Those values were selected in order to
further carry forward the same level of water quality associated with EPA’s previous criteria
recommendations to protect the primary contact recreation use, which were for fecal coliform
(U.S. EPA, 1976). For that effort, the enterococci and E. coli criteria values from the existing
fecal coliform criteria were translated using the GM values for the FIB established in the
previous epidemiological studies (see Text Box 1, below) (Dufour and Schaub, 2007). The single
sample maximum (SSM) component of the 1986 criteria was computed using the GM values and
corresponding observed variances in the FIB obtained from water quality measurements taken
during the epidemiological studies from the late 1970s and early 1980s. Four different SSM
values (recommended to be used with different recreational use intensities) were provided and
corresponded to different percentiles of the water quality distribution around the GM.
The 1986 criteria values resulted in different water quality values and associated illness rates for
marine and fresh waters because the marine and fresh water epidemiological studies reported
different GMs for the FIB associated with the level of water quality corresponding to EPA’s
fecal coliform criteria recommendations.
Text Box 1. Translation of 1960s criteria to 1986 criteria.
For example, using the equation in Text Box 1, the marine enterococci 1986 criterion was
calculated as follows:
B = 20 cfu per 100 mL (observed GM enterococci)
C = 200 cfu per 100 mL (old fecal coliform criterion)
D = 115 cfu per 100 mL (observed GM of fecal coliforms)
Therefore, A = 35 cfu per 100 mL.
Using the observed relationships between the FIB densities and GI illness, EPA estimated in
1986 that the predicted level of illness associated with the criteria was 8 HCGI per 1,000 primary
contact recreators in fresh water (see section 3.2.2) and 19 HCGI per 1,000 primary contact
recreators in marine waters (U.S. EPA, 1986).
3.2.2 Human Health Endpoint
EPA’s 1986 criteria values correspond to a level of water quality associated with an estimated
illness rate that is expressed in terms of the number of HCGI. The HCGI case definition is “any
one of the following unmistakable or combinations of symptoms [within eight to ten days of
The 1986 criteria values (A) were derived as follows
A = (B*C) / D
Where
B is the observed GM enterococci (from epidemiological studies)
C is the criterion for fecal coliform (200 cfu per 100 mL)
D is the observed GM fecal coliform (from epidemiological studies)

14
swimming]: (1) vomiting (2) diarrhea with fever or a disabling condition (remained home,
remained in bed or sought medical advice because of symptoms), (3) stomachache or nausea
accompanied by a fever.”
EPA’s NEEAR epidemiological studies used a different and updated definition of GI illness,
defining a case of GI illness as “any of the following [within ten to 12 days after swimming]: (a)
diarrhea (three or more loose stools in a 24 hour period), (b) vomiting, (c) nausea and
stomachache, or (d) nausea or stomachache and impact on daily activity” (U.S. EPA, 2010a).
This illness definition is referred to as NGI and is the definition of illness associated with the
2012 RWQC.
The NGI case definition was broadened in that diarrhea, stomachache, or nausea is included
without requiring the occurrence of fever. Viruses are thought to be the etiologic agent
responsible for most of the GI illnesses that are contracted in recreational waters impacted by
sources of human fecal contamination (Cabelli, 1983; Sinclair et al., 2009; Soller et al., 2010a)
and viral gastroenteritis does not always present with a fever. Thus a GI illness case definition
that does not require fever should allow studies to more accurately capture cases caused by
viruses.
In addition, the NEEAR study extended the number of days following the swimming event in
which illness may have been observed to account for pathogens with longer incubation times.
For example, the incubation of Cryptosporidium spp. can be up to ten days, thus participants
contacted after eight days may not have developed the case definition symptoms. By calling
participants after ten to 12 days, the study design allowed for illness caused by pathogens
associated with longer incubation periods to be included as cases. Similar GI definitions are now
widely used nationally and internationally (Colford et al., 2002, 2007; Payment, 1991, 1997;
Sinigalliano et al., 2010; Wiedenmann et al., 2006).
Because the NGI definition is broader than HCGI, more illnesses qualify to be counted as
“cases” in the epidemiological studies than if the older HCGI definition were applied. Therefore,
at the same level of water quality, more NGI will be observed than HCGI illnesses. The relative
increase in rates of GI illness between the studies (i.e., HCGI versus NGI) is directly attributable
to the changes in how illness was defined and not due to an actual increase in the incidence of
illness among primary contact recreators at a given level of water quality.
EPA estimated how the GI illness rate associated with the two GI illness definitions can be
compared using the difference between (a) non-swimmer illness rates from the pre-1986
epidemiological data, and the (b) non-swimmer illness rates from the NEEAR study (U.S. EPA,
2011). The mean non-swimmer HCGI rate from pre-1986 epidemiological studies was 14
illnesses per 1,000 non-swimmer recreators, while the non-swimmer recreators mean NGI rate
from the NEEAR study was 63 illnesses per 1,000 non-swimmer recreators. Thus an illness rate
of 8 HCGI per 1,000 primary contact recreators is estimated to be equivalent with an illness rate
of approximately 36 NGI per 1,000 primary contact recreators (estimated translation factor of 4.5
NGI per HCGI4). See Appendix A for more information.
4 8 HCGI/1,000 primary contact recreators x 4.5 HCGI / 1 NGI = 36 NGI/1,000 primary contact recreators

15
Of all the adverse health effects considered, the NEEAR epidemiological studies found the
strongest association with GI illnesses (see section 3.2.3). In addition to NGI, the NEEAR
epidemiological studies evaluated other health endpoints that could have been caused by
pathogens found in fecal matter. These included the following:
1. “Upper respiratory illness,” which was defined as any two of the following: sore throat,
cough, runny nose, cold, or fever;
2. “Rash,” which was defined as a rash or itchy skin;
3. “Eye ailments,” which were defined as either an eye infection or a watery eye;
4. “Earache,” which was defined as ear pain, ear infection, or runny ears; and
5. “Infected cut,” which was defined as a cut or wound that became infected.
Results from the NEEAR study, and previous epidemiological studies, indicate that criteria based
on protecting the public from GI illness via the use of FIB will prevent most types of recreational
waterborne illnesses. In general, these other illnesses occur at a lower rate than GI illness (as
defined by any widely accepted definition) (Fleisher et al., 1998; Haile et al., 1999; McBride et
al., 1998; Wade et al., 2008). For example, Wade et al. (2008) reported a mean overall GI illness
incidence of 7.3 percent, upper respiratory infection incidence of 5.7 percent, rash incidence of
2.7 percent, and eye irritations and infections of 2.9 percent. Kay et al. (1994) and Fleisher et al.
(1998) reported 14.8 percent GI illness in swimmers and 9.7 percent in non-swimmers, 4.7
percent incidence of respiratory infection in swimmers and three percent in non-swimmers, and
4.2 percent incidence of ear ailments in swimmers and 4.8 percent and non-swimmers.
Non-EPA studies in waters not impacted by WWTPs reported correlations between other health
endpoints and water quality. For example, Sinigalliano et al. (2010) reported symptoms of
human subjects randomly assigned to marine water exposure with intensive environmental
monitoring, and compared them against other subjects who were not exposed. Their results
demonstrated an increase in GI, respiratory, and skin illnesses among bathers compared to non-
bathers. Among the bathers, a relationship was observed between increasing FIB and skin illness,
where skin illness was positively related to enterococci enumeration by culture-based methods.
3.2.3 Relationship Between Water Quality and Illness
For decades, epidemiological studies have been used to evaluate how FIB levels are associated
with health effects of primary contact recreation on a quantitative basis. The 1986 criteria
recommendations are supported by epidemiological studies conducted by EPA in the late 1970s
and early 1980s. In those studies, enterococci and E. coli exhibited the strongest correlation to
swimming-associated gastroenteritis (specifically HCGI, as discussed in section 3.2.2). Because
enterococci and E. coli correlate with illness, EPA recommended E. coli as the indicator to be
measured in fresh water and enterococci as the indicator to be measured in both marine and fresh
water. Both indicators continue to be used in epidemiological studies conducted throughout the
world, including in the European Union (E.U.) and Canada (EP/CEU, 2006; MNHW, 1992). The
World Health Organization (WHO) recommends the use of enterococci as water-quality
indicators for recreational waters (WHO, 2003). Meta-analyses and systematic reviews of
epidemiological studies conducted worldwide indicate that these indicators generally provided
substantial improvements over the indicators that were favored previously, such as total and fecal
coliforms (Prüss, 1998; Wade et al., 2003; Zmirou et al., 2003).

16
EPA NEEAR epidemiological study design and conclusions.
EPA conducted the NEEAR epidemiological studies at U.S. beaches in 2003, 2004, 2005, 2007,
and 2009 and reported the results in a series of research articles (U.S. EPA, 2010a; Wade et al.,
2006, 2008, 2010). The NEEAR study was a prospective cohort (PC) epidemiological study that
enrolled participants at the beach (the cohort) at a number of study sites and followed them for
an appropriate period of time to compare incidence of illness (i.e., NGI) between the exposed
(swimmers) and unexposed groups. This type of study can also include exposure response
analyses if varying degrees of exposure are present. The PC design used in the NEEAR study
was an enhancement of the cohort design previously employed by Cabelli (1983), Dufour
(1984), and numerous others (Calderon et al., 1991; Cheung et al., 1990; Colford et al., 2005,
2012; Corbett et al., 1993; Haile et al., 1999; McBride et al., 1998; Prieto et al., 2001; Seyfried et
al., 1985; von Schirnding et al., 1992).
EPA investigators considered several different epidemiological study designs, but only the
randomized controlled trial (described below) and PC designs were viewed as potentially viable
methods by EPA’s external expert advisory panel to address the specific goals of the study. The
goals of the study were to obtain and evaluate a new set of health and water quality data at a
number of beaches for the new rapid, state-of-the-art methods and to use the results to support
the development of new or revised criteria for the protection of primary contact recreation. The
NEEAR PC design enhanced and improved upon the PC design used for studies employed in the
development of the 1986 criteria (U.S. EPA, 1986).
Characteristics of the NEEAR study’s design were used to establish criteria to select the seven
beaches studied between 2003 and 2007:
1. The beach was an officially designated recreational area near a large population center;
2. The beach had an attendance large enough to support an epidemiological study (i.e., 300–
400 attendees/day);
3. The age range of the swimmers was broad (i.e., includes children, teenagers, and adults);
4. The beach generally met the state or local WQS with a range of indicator densities;
5. The range of indicator density was related to occasional contamination by an identified
human source of pollution (point-source); and
6. The swimming season was at least 90 days long.
For more information about the beach selection criteria, enrollment, administration of the health
survey, and other details on the study design, please see Wade et al. (2006; 2008; 2010).
Wade et al. (2008, 2010) also described the details on the statistical models used for the NEEAR
analysis. Statistical tests were conducted using several approaches and models to determine
whether the odds ratios for the different fresh water and marine beaches were statistically
different. Covariate analyses are discussed in U.S. EPA (2010a). Additionally, regression models
were used to determine the strength and the significance of the relationship between the indicator
measures and health effects. Nearly all the studies conducted in recent years have used similar
statistical models, usually logistic or log-linear models (Colford et al., 2012; Fleisher et al., 1993;
Haile et al., 1999; Kay et al., 1994; McBride et al., 1998; Prieto et al., 2001; Seyfried et al.,
1985).

17
As a result of the statistical analyses, EPA concluded that the Enterococcus spp. levels measured
by qPCR using EPA Method 1611 (U.S. EPA, 2012b) and GI illness data from the NEEAR
epidemiological studies of WWTP-impacted marine and temperate fresh water study sites could
be combined. A direct comparison of the slope parameters shows no significant difference (p =
0.44) between the marine and fresh water beaches. The results indicated that for the majority of
the range of exposures observed, there were no statistically significant differences in the
estimated risk levels for marine and fresh waters (see Appendix C; U.S. EPA, 2011).
For the NEEAR epidemiological study design, EPA collected data from seven WWTP-
influenced marine and temperate fresh water beaches at intervals throughout the day at different
water depths, resulting in 18 daily samples. The GM of the daily samples provided a single daily
water quality value for the health relationship analysis (U.S. EPA, 2010a). The association
between the GM of enterococci samples collected at 0800 hours and GI illness was nearly
identical to the daily GM of all samples collected. This association is important from an
implementation perspective because the results indicate that a sample taken at 0800 hours could
be used for beach-management decisions on that day.
A number of FIB were examined in the NEEAR study (see Table 2). The occurrence of GI
illness in swimmers was positively associated with exposure to levels of enterococci enumerated
with EPA’s Enterococcus spp. qPCR Method 1611 in marine and fresh water (U.S. EPA, 2012b;
Wade et al., 2008, 2010). GI illness in swimmers at marine water beaches was also associated
with exposure to levels of anaerobic bacteria of the order Bacteroidales enumerated with EPA’s
Bacteroidales qPCR method (Wade et al., 2010).
The association between GI illness and enterococci measured by culture in the NEEAR study
was positive, but not as strong as the qPCR relationship to illness. No associations between
adverse health outcomes and any of the other fecal indicator organisms were observed in either
the fresh water or marine beach studies. Culturable E. coli was not included in the NEEAR
epidemiological studies because EPA focused on evaluating a single indicator that could be used
by states in both marine and fresh waters. Although culturable E. coli samples were not included
in the NEEAR epidemiological studies, other researchers confirm that culturable E. coli is
associated with GI illness, and remains a useful indicator of contamination in fresh waters (Prüss,
1998; Marion et al., 2010; Wiedenmann et al., 2006).
In addition to the seven temperate, WWTP-influenced beaches, EPA conducted PC
epidemiological studies at two other beaches in 2009: a temperate beach in Surfside, South
Carolina that is impacted by urban runoff sources but has no WWTP sources, and a tropical
beach in Boquerón, Puerto Rico. Boquerón was selected as an epidemiological study site to
specifically examine the health relationships of the indicators in a tropical setting. For both
studies the FIB levels and illness rates were found to be low (U.S. EPA, 2010a). Results from
EPA studies at the urban-runoff and tropical beaches are consistent with NEEAR study results
from other geographical areas and other sources are consistent with EPA’s understanding of risk
associated with fecal indicators (i.e., low illness rate and low FIB counts). Thus, EPA believes
these criteria recommendations are scientifically defensible and protective of the use regardless
of source or climate.

18
Table 2. Fecal indicator organisms and enumeration methods tested in the NEEAR
epidemiological studies.
EPA Epidemiological
Study Indicator/Methods Tested in Study
Great Lakes
Enterococcus spp. measured by qPCR, enterococci measured
by culture, Bacteroidales measured by qPCR
Marine (2007)
Enterococcus spp. measured by qPCR, enterococci measured
by culture, E. coli measured by qPCR, Bacteroides
thetaiotamicro (potentially human associated) measured by
qPCR, Bacteroidales, male-specific coliphage measured by
antibody assay, Clostridium spp. measured by qPCR
Tropical
Same indicator/methods as 2007 marine, but no coliphage or
Clostridium spp.
Urban Runoff
Same indicator/methods as 2007 marine, but no coliphage or
Clostridium spp.
Other Epidemiological Studies.
Findings from epidemiological studies conducted by non-EPA researchers were also reviewed
and considered to the maximum extent possible during the development of the 2012 RWQC,
including all available data from the open literature, as well data from SCCWRP’s
epidemiological studies in Southern California (see below for description of these studies).
Numerous epidemiological investigations have been conducted since the 1950s to evaluate the
association between illness rate to recreational water users and the concentration of suitable fecal
indicators (reviewed in U.S. EPA, 2009b). These studies have been conducted in Australia,
Canada, Egypt, France, Hong Kong, Israel, the Netherlands, New Zealand, Spain, South Africa,
the U.S, and the United Kingdom. Most of these studies investigated waters that were impacted
or influenced by wastewater effluent. Several groups of researchers have compiled information
and generated broad and wide-ranging inferences from these epidemiological studies (Prüss,
1998; Wade et al., 2003; Zmirou et al., 2003). For example, a systematic review and meta-
analysis of 27 published studies evaluated the evidence linking specific microbial indicators of
recreational water quality to specific health outcomes under non-outbreak (endemic) conditions.
These studies concluded that: (1) good indicators of fecal contamination and demonstrated
predictors of GI illness in fresh waters are enterococci and E. coli, and enterococci in marine
water, but not fecal coliform; and (2) the risk of GI illness is considerably lower in studies where
enterococci and E. coli densities were below levels established by EPA in 1986 (Wade et al.,
2003).
Recently, SCCWRP conducted a series of PC epidemiological studies in Southern California, at
Doheny, Avalon, and Malibu beaches. Many specific characteristics of the SCCWRP studies
were designed to be similar to prior EPA and SCCWRP studies (Colford et al., 2007; Wade et
al., 2006, 2008, 2010). EPA received the data for the analysis conducted at Doheny beach
(Colford et al., 2012), a recreational marine beach impacted by urban runoff. The Doheny beach
study evaluated health-risk relationships between GI illness and enterococci using qPCR-based
(three different qPCR assays analyzed) and culture-based enumeration methods. Results
indicated that when urban runoff with potentially containing human enteric viruses flowed freely

19
into the marine water (berm open), the results were comparable and consistent with NEEAR
marine WWTP-impacted beaches. Additionally, when the FIB source was more diffuse (berm
closed), the relationship between enterococci and GI illness was not as strong as the relationship
observed when the berm was open. These diffuse source results are similar to those observed in
the NEEAR Surfside beach study (U.S. EPA, 2010a).
A PC epidemiological study at an Ohio reservoir (a fresh water inland beach) provided an
indicator-illness relationship for E. coli (Marion et al., 2010). In this small-scale study, E. coli
levels (EPA Method 1603; U.S. EPA, 2002b, 2010e) were associated with GI illness in a
statistically significant manner. As indicated previously, E. coli demonstrated a statistically
significant association with HCGI in EPA’s epidemiological studies in the late 1970s and early
1980s (Cabelli, 1983; Dufour, 1984).
Several epidemiological studies have been conducted using study designs that differ from the
NEEAR design, such as those referred to as randomized control trials (RCT) or randomized
exposure trials (see below). The RCT is an epidemiological study in which the study subjects are
randomly allocated to groups to receive an experimental procedure or intervention. For
recreational water exposures, the groups are bathers and non-bathers (swimmers vs. non-
swimmers). The bathers are given instructions detailing their time in the water and specific
activities, such as immersing their heads in the water. Similar to a PC study, bathers and non-
bathers must be followed for an appropriate time to evaluate illness incidence and to determine
the potential effect of other biases and potential confounders. Exposure-response analyses may
then be conducted.
RCT study designs are preferred by some researchers because they are intended to (1) better
account for the possibility that those who do not bathe choose not to do so based on factors other
than water quality; (2) associate individuals and the incidence of illness with the water quality at
the time and place of bathing, potentially reducing misclassification bias; and (3) account for
non-water-related risk factors (Kay, et al., 1994). One of the most significant limitations of RCT
is that the exposures in the study are not necessarily representative of those experienced by the
general population.
EPA reviewed and considered the results from these RCT studies to the maximum extent
possible. For example, the WHO and European Union (E.U.) used RCT epidemiological studies
to support their recommended water quality values (EP/CEU 2006; WHO, 2003). The RCT
studies were conducted over four bathing seasons (summers) at a different marine beach each
season in the United Kingdom. Trends in the gastroenteritis (equivalent to GI illness) rate with
increasing enterococci exposure were not significantly different between sites, and thus data
from the four beaches were pooled (Kay et al., 1994). The source of FIB in this study was
reported as domestic sewage. Gastroenteritis was defined as “all cases of vomiting or diarrhea or
all cases of nausea, indigestion, diarrhea or vomiting that was accompanied by a fever”. Rates of
gastroenteritis were significantly higher in the exposed group than the unexposed group and
adverse health effects were identified when fecal streptococci, of which enterococci are a
subgroup, density exceeded 32 per 100 mL (Fleisher et al., 1998; Kay et al., 1994). Another E.U.
randomized control trial at five fresh water bathing sites in Germany recommended guidance
values based on the no observable adverse effects levels (NOAELs) for gastroenteritis of 100 E.

20
coli cfu per 100 mL or 25 enterococci cfu per 100 mL (average values) (Wiedenmann et al.,
2006).
Additional RCT studies evaluated include Epibathe, a public health project funded under E.U.
Framework Programme 6 to produce “science support for policy,” which began in December
2005 and ended in March 2009. The imperative for this research effort was to improve the
relative paucity of E.U. data describing the health effects of controlled exposure (head
immersion) in E.U. fresh waters and Mediterranean marine waters. Both aquatic environments
provide important recreational resources throughout the E.U. (European Commission-Epibathe,
2009). Epibathe comprised a series of marine and fresh recreation water epidemiological studies
conducted in 2006 and 2007 in Spain and Hungary, respectively. Four riverine recreational sites
were evaluated in Hungary and four coastal sites were evaluated in Spain. All sites were in
compliance with the European standards specified in the E.U. bathing Water Directive (EP/CEU,
1976). For E.U. marine waters (Spain and the United Kingdom RCT studies), the clearest trend
in increasing illness rate with water quality was evident using enterococci measured by culture.
For fresh waters (German and Hungary RCT studies), the clearest indicator-illness relationship
between GI symptoms and water quality was seen by a threshold density of E. coli measured by
culture. Both analyses (marine and fresh water) suggest elevations in GI illness in the controlled
exposure (head immersion) cohorts. The authors concluded that the empirical field studies and
combined data analysis suggested that the WHO or E.U. WQS recommendations did not need to
be revised.
Finally, an RTC epidemiological study at a Florida marine beach not impacted by a WWTP was
considered. In this study, investigators found that swimmers randomized to head immersion were
approximately twice as likely to develop a skin rash when swimming in water with culturable
enterococci levels greater than or equal to 40 cfu per 100 mL than swimmers exposed to levels
less than 40 enterococci cfu per 100 mL (Fleming et al., 2008; Sinigalliano et al., 2010).
Not all epidemiological studies show clear or consistent correlations between indicator levels and
health outcomes. For example, in a 1989 PC epidemiological study at high-energy (surfing)
marine beaches impacted by sewage outfalls and stormwater overflows in Sydney, Australia, GI,
symptoms did not increase with increasing counts of fecal coliform or enterococci, however,
swimmers did exhibit increasing respiratory, ear, and eye symptoms with increasing levels of
FIB (Corbett et al., 1993). In a second independent study, respiratory and GI illnesses increased
with increasing densities of enterococci (Harrington et al., 1993). In a PC epidemiological study
at Mission Bay, California, impacted by non-point sources of fecal contamination, only male-
specific coliphage had a correlation with illness (Colford et al., 2005).
3.2.4 Developing Enterococci Measured by Culture Criteria and Comparable Values for
Culturable E. coli and Enterococcus spp. Measured by qPCR
The 2012 RWQC values for culturable levels of enterococci for marine and fresh waters and E.
coli for fresh waters, if adopted in state WQS and approved by EPA, would be protective of the
primary contact recreational use. The NEEAR study provided data to establish RWQC values for
culturable enterococci and to help estimate an illness rate associated with those values. The
NEEAR -based data were analyzed in several ways, some of which differed from the reported

21
NEEAR qPCR-based approach. EPA conducted these analyses, in part, to provide a comparison
with the data analysis underlying the 1986 criteria for recreational waters.
The illness definition used in these analyses is consistent with those reported in the NEEAR
study (i.e., NGI), rather than the illness definition (i.e., HCGI) used with the 1986 criteria (refer
to section 3.2.2). To facilitate comparisons between the results from 1986 and the 2012 criteria,
illness rates from 1986 (in terms of HCGI per 1,000 primary contact recreators) were translated
to NGI rates using a translation (factor of 4.5) of the definition of NGI to HCGI (U.S. EPA,
2011). See section 3.2.2.
The following is a description of EPA’s analytical approaches to develop recommended criteria
values for enterococci measured by culture and comparable values for culturable E. coli and
Enterococcus spp. measured by qPCR using EPA Method 1611 (U.S. EPA, 2012b). EPA was
constrained to criteria values above the level of quantification (i.e., 20 cfu per 100 mL for
culturable methods) (ASTM, 2012). Approach 1 analyzed the association between health and
water quality for culturable enterococci using the NEEAR regression analysis. A statistically
significant illness-exposure response relationship was not observed across the full range of
exposures (Wade et al., 2008, 2010). Approach 2 evaluated NEEAR swimming-associated
illness rates for exposures above and below the 1986 GM criteria values. These results indicated
that illness rates were higher when the criteria were exceeded compared to when those criteria
were not exceeded. Approach 3 compared the NEEAR study illness rates to those from 1986.
This analysis confirmed that swimming-associated illness rates in NEEAR marine and fresh
water studies were similar to each other and to those from the 1986 fresh water studies.
Approach 4 analyzed the NEEAR data using the 1986 analytical approach. The results provided
a linkage between NEEAR culturable enterococci data and GI illness. Approach 5 extended
Approach 2 to consider whether there are significant differences in GI illness rates at enterococci
densities lower than the 1986 criteria. The results indicate that water quality in the range of 30 to
35 enterococci cfu per 100 mL are the lowest water quality values reported to show statistically
significant differences in swimming-associated illness rates.
Taken together, these approaches along with the level of water quality described by the 1986
criteria provide the lines of evidence EPA is using to recommend either the culturable
enterococci GM criteria values of 30 or 35 cfu per 100 mL. The mean illness rates associated
with the 2012 RWQC water quality recommendations are approximately 32 cases of NGI per
1,000 primary contact recreators for a culturable enterococci GM criterion of 30 cfu per 100 mL
and 36 cases of NGI per 1,000 primary contact recreators for a culturable enterococci GM
criterion of 35 cfu per 100 mL, in both marine and fresh water. These illness rates were used to
estimate equivalent criteria values for culturable E. coli and supplemental water quality values
for enterococci using EPA’s Enterococcus spp. qPCR Method 1611 (U.S. EPA, 2012b).
Approach 1.
Culture-based measures of enterococci collected in the NEEAR study were analyzed using the
same rigorous statistical approach applied to the qPCR data (Wade et al., 2008, 2010). Although
a weak association between illness and water quality for culturable enterococci was observed
using this approach, the exposure-response relationship was not statistically significant over the
entire range of observed water quality measured by culturable enterococci using the marine and

22
fresh water beach datasets (Wade et al., 2008, 2010). Therefore, EPA is not relying
quantitatively on those exposure-response relationships for the 2012 RWQC because the
regression coefficients would not have sufficient predictive value.
Approach 2.
EPA evaluated illness rates when swimmers are exposed to water quality levels either above or
below the 1986 criteria values. Data from EPA’s fresh water NEEAR study sites indicated that
swimmers exposed above the 1986 criteria value of 33 cfu per 100 mL had higher risks than non-
swimmers or swimmers exposed below this value (Wade et al., 2008). At EPA’s marine water
NEEAR study sites, approximately 16 percent of the marine study days exceeded the 1986
criteria enterococci GM value of 35 cfu enterococci per 100 mL. On those study days, the odds
of diarrhea, respiratory illness and earache were elevated among swimmers compared to non-
swimmers (Wade et al., 2010). EPA used the NEEAR study results (Wade et al., 2008, 2010) to
compare the swimming-associated risk on days when enterococci levels were above and below
33 cfu per 100 mL and 35 cfu per 100 mL for fresh and marine sites, respectively. Those data
also indicate that on days when the 1986 criteria GM values were exceeded, illness rates were
similar at marine and fresh water sites (Figure 1a).
Approach 3.
EPA compared the full distribution of marine and fresh water swimming-associated illness rates
observed in the NEEAR study to that of the corresponding 1986 criteria illness rates. The
NEEAR study data (right side of Figure 1b) suggest that the marine swimming-associated illness
rate and fresh water swimming-associated illness rate are similar to each other and to the 1986
fresh water rate. In contrast, the 1986 marine swimming-associated illness rate was considerably
higher than the 1986 fresh water illness rate (left side of Figure 1b).
a) b)
Figure 1. Swimming-associated illness rates observed during EPA’s epidemiological
studies. a) risk on days with GM above 35 cfu per 100 mL at marine sites and above 33 cfu
per 100 mL at fresh water sites; b) swimming-associated illness observed during 1986 and
NEEAR study. Note: Boxes in Figure 1b represent the 25th
to the 75th
percentiles, the lines
within the boxes indicate the median values, and the whiskers represent the 10th
and 90th
percentiles.

23
EPA then evaluated whether culturable enterococci data from the marine and fresh water
NEEAR sites could be combined. The observed culturable enterococci data for each NEEAR
beach were plotted and analyzed (Figure 2). There was substantial overlap in the densities of
enterococci observed at beaches, even though there were statistically significant differences
between beaches. However, statistically derived beach groups (represented by variations in
shading in Figure 2) were not aligned strictly by their salinity classification, supporting the
finding that there is not a compelling distinction between marine and fresh water (see Appendix
C). The literature is consistent with this finding and indicates that of the factors influencing
enterococci fate in the environment, there is evidence that sunlight, temperature and predation
are more important in controlling enterococci concentrations than salinity (Noble et al., 2004).
Figure 2. NEEAR marine and fresh water culturable water quality results. White, grey, and
hatched boxes represent statistically different groups. Fresh water beach sites are Huntington
Beach (HB), Silver Beach (SB), West Beach (WB), Washington Park (WP); marine water beach
sites are Edgewater Beach (EB), Fairhope Beach (FB), Goddard Beach (GB), Boquerón Beach
(BB). Note: Boxes in Figure 1b represent the 25th
to the 75th
percentiles, the lines within the
boxes indicate the median values, and the whiskers represent the 10th
and 90th
percentiles.
Approach 4.
EPA conducted another analysis to develop a culture-based linkage between the NEEAR and
1986 studies. EPA could not reanalyze the 1980s data using the NEEAR statistical approaches
because the raw data from those earlier studies are no longer available. Therefore, EPA analyzed
the NEEAR culturable enterococci data using the same statistical approaches employed in the
1980s studies (Cabelli, 1983; Dufour, 1984).
In the 1986 criteria, quantitative relationships between the rates of swimming-associated illness
and FIB densities were determined using regression analysis. Linear relationships were estimated
from data grouped in two ways: (1) pairing the GM indicator density for a summer bathing
season at each beach with the corresponding swimming-associated GI rate for the same summer

24
(fresh water beaches), and (2) by sampling days with similar indicator densities from each study
location (marine beaches). The second approach, grouping by sampling days with similar
indicator densities, was not possible with the 1980s fresh water data because the variation of
bacterial indicator densities in fresh water samples was not large enough to allow such groupings
(U.S. EPA, 1986). For the 2012 RWQC, EPA evaluated both approaches (seasonal and days of
similar water quality) with the NEEAR culture-based enterococci data to estimate the illness
associated with the recommended levels of water quality.
EPA applied the 1986 fresh water analysis described above to the NEEAR culture-based
enterococci data. This analysis summarized each NEEAR beach as a seasonal GM of water
quality and its average seasonal illness rate estimate, using the entire body of culturable
enterococci data from the NEEAR study. Consistent with the 1986 fresh water analysis, this
approach did not account for covariates. These data points generally fell within the predicted
range of the published epidemiological regressions (Cabelli, 1983; Dufour, 1984) after
conversion to comparable GI case definitions (U.S. EPA, 2011). However, this analysis proved
to be insufficient to estimate NEEAR study illness rates, because it generated only seven data
points—one for each of the NEEAR beaches.
EPA then extended the seasonal analysis of the NEEAR culture-based enterococci data using the
1986 marine water analytical approach as described above. For this analysis, EPA aggregated
data by days of similar water quality (bins) for each beach (Cabelli, 1983; U.S. EPA 1986). The
NEEAR data were sorted by the observed GM for each beach day and the data for each beach
were then grouped according to natural breaks in these data. Bins of beach days were established
from these data to balance, to the extent feasible, the existence of natural breaks of days with
similar culturable enterococci GM and the number of study participants represented in each bin
(Table 3, Figures 3 and 4 - Illness rates in the 1986 criteria are presented as NGI equivalents for
comparative purposes). This analysis resulted in a total of 27 data points as compared to the
seven data points for the seasonal analysis. The raw data underlying these analyses are presented
in Appendix B.
EPA compared the binned fresh water and marine culture-based NEEAR indicator and health
data to the corresponding regressions in the 1986 criteria. Results indicated that the vast majority
of these data points fall within the 95th
percentile prediction intervals derived from the 1986
regression models (Figure 35). It should be noted that the NEEAR marine culture-based data
cluster at the lower end of the water quality and illness distribution, described by the 1986
criteria marine regression. Moreover, the NEEAR marine and fresh water culture-based data
exhibited a similar correspondence between water quality and illness as observed in the
freshwater studies (Figures 3 and 4).
5 The prediction intervals can be used to assess whether these NEEAR data fall within an expected range based on
the 1986 criteria data.

25
Table 3. NEEAR culture-based enterococci and illness rate data for each of the seven
beaches.
Beach
Daily
geometric
mean
Enterococcus
density
(cfu/100 mL)
Total
number
interviewed
Number
reporting
no water
contact
Number
reporting
immersion
Number
NGI
cases
no
contact
Number
NGI cases
immersion
Excess
illness (#
NGI/1000
swimmers)
above beach
average non-
swimmer
illness rates
West Beach
(fresh)
1.6 1122 360 556 21 60 58
9.2 726 144 468 2 39 33.4
25.1 463 101 299 8 28 43.7
110.4 553 117 344 5 42 72.2
Huntington
Beach (fresh)
4.7 731 426 186 43 18 1.0
9.2 733 391 208 27 33 62.9
15.7 526 251 167 31 22 35.9
81.1 850 467 196 46 28 47.1
Silver Beach
(fresh)
7.0 864 220 490 16 37 19.8
14.8 2203 603 1215 36 89 17.6
25.8 3128 900 1720 54 138 24.5
51.3 2525 808 1281 46 98 20.8
106.6 2152 843 945 36 68 16.3
Washington
Park Beach
(fresh)
8.4 722 198 398 15 30 12.6
17.2 789 171 488 10 45 29.4
27.9 1368 364 764 23 60 15.7
44.6 1465 524 710 31 71 37.2
Edgewater
Beach
(marine)
2.3 555 135 173 10 13 -9.1
10.0 239 66 77 7 10 45.7
18.9 441 152 139 13 19 52.5
77.7 108 27 40 2 5 40.8
Fairhope
Beach
(marine)
5.5 494 261 120 27 9 -11.8
12.7 541 200 186 19 20 20.7
24.1 351 126 114 5 11 9.7
81 629 266 225 23 22 11.0
Goddard
Beach
(marine)
2.6 2433 1322 596 58 33 9.3
18.8 535 262 183 15 15 35.9

26
Log 10 Enterococci density / 100mL
0.0 0.5 1.0 1.5 2.0 2.5 3.0 3.5
NG
I ra
te /
10
00
sw
imm
ne
rs
0
20
40
60
80
100
120
140
160
180
1986 freshwater data
1986 freshwater regrression
1986 95% prediction interval
NEEAR freshwater data
Log 10 Enterococci density / 100mL
0.0 0.5 1.0 1.5 2.0 2.5 3.0 3.5
NG
I ra
te /
10
00
sw
imm
ers
-40
-20
0
20
40
60
80
100
120
140
160
180
1986 marine data
1986 marine regression
1986 95% Prediction Interval
NEEAR marine data
a) b)
Figure 3. NEEAR study culture data aggregated by similar water quality and 1986 criteria
data for (a) fresh water beaches and (b) marine water beaches.
EPA used these analyses to 1) provide a linkage to illness estimates associated with the 1986
criteria and the historically accepted level of water quality for protecting the primary contact
recreation use, and to 2) estimate the potential levels of illness associated with the water quality
levels recommended in the 2012 RWQC for marine and fresh waters. Based on this analysis and
results illustrating the consistency between the culturable NEEAR epidemiological data to the
1986 fresh water studies, the corresponding mean estimate of illness associated with the 2012
RWQC recommendations is approximately 27 to 36 cases of NGI per 1,000 primary contact
recreators for both marine and fresh water (Figures 3 and 4). See section 3.2.2 for discussion of
illness rate conversion.
Log10 Enterococci density / 100mL
0.0 0.5 1.0 1.5 2.0 2.5 3.0 3.5
NG
I ra
te / 1
00
0 s
wim
me
rs
-20
-10
0
10
20
30
40
50
60
70
80
27 NGI (6 HCGI/1000)
36 NGI (8 HCGI/1000)
30 cfu/100mL
NEEAR marine data
NEEAR fresh data
Figure 4. NEEAR marine and fresh water culture-based enterococci and illness rate data
aggregated by days of similar water quality.
Approach 5

27
Based on public comments received on the draft RWQC document, EPA conducted an additional
analysis to determine if similar results to those found in Approach 2 would occur at lower (i.e.
below 35 cfu per 100 mL) enterococci densities. To achieve this, EPA extended the published
approaches by developing and conducting cut-point analyses, similar to those described by Wade
et al. (2003, 2008, 2010) and Colford et al. (2012), at multiple enterococci densities.
In this approach, EPA considered the daily GM culture-based enterococci data from the seven
NEEAR study sites by conducting cut-point analyses at multiple enterococci densities, ranging
from 5 cfu per 100 mL to 35 cfu per 100 mL, in five cfu increments and an NGI health end point.
Points above 35 cfu per 100 mL are not recommended because these values would be less
protective than the 1986 criteria values.
Adjusted risk estimates were developed for each of the individual cut-points, comparing
swimmers in the NEEAR study exposed above and below the selected enterococci cut-points.
Figure 5 presents odds ratios (and the corresponding 95% confidence intervals [CI]) for the
probabilities of GI illness for swimming in water with enterococci GM levels above each of the
cut-points compared to swimming in waters with enterococci GM levels below that cut-point.
These odds ratios were computed as the adjusted risk of NGI among swimmers above the cut-
point divided by the adjusted risk of NGI among swimmers below the cut-point. The adjusted
odds ratios account for important covariates from the NEEAR epidemiological model and were
calculated at the means of the covariate values (this approach is called the marginal average
effects approach). The adjusted risk of NGI for non-swimmers was 56 cases per 1,000 primary
contact recreators; the adjusted risk of NGI for swimmers was approximately 75-90 cases per
1,000 primary contact recreators depending on the level of water quality evaluated.
Cut Point (enterococci cfu/100mL)
0 5 10 15 20 25 30 35
Od
ds R
atio
co
mp
ari
ng
sw
imm
ers
ab
ove
cu
t p
oin
t to
sw
imm
ers
be
low
cu
t p
oin
t
0.5
0.6
0.7
0.8
0.9
1.0
1.1
1.2
1.3
1.4
1.5
1.6
1.7
White symbols P<0.05Black symbols P > 0.05
Figure 5. Adjusted odds ratios of GI illness for swimming above specific cut-points in
NEEAR marine and fresh water study sites.

28
The odds ratios for swimming-associated GI illness are statistically significant (that is, p ≤ 0.05)
at enterococci densities of 30 cfu per 100 mL and 35 cfu per 100 mL. None of the other
individual cut-points exhibited odds ratios that were statistically significant (lower 95% CI
values are less than one in all other cases). These results indicate that the illness rates for
swimming in waters with GMs in the narrow range of 30 to 35 cfu per 100 mL were significantly
greater than the illness rates for swimming in waters with GMs below those levels. Similar
illness rate changes are not seen outside this range.
Culturable Enterococcus conclusion
Taken together, the set of approaches described above provide lines of evidence to support the
recommendation of a GM criterion value of 30 or 35 cfu per 100 mL. These approaches also
provide evidence that the recommended RWQC are similarly protective of the designated use of
primary contact recreation in both marine and fresh water. EPA is presenting two sets of criteria
(consisting of a GM and related STV) associated with two different illness rates. EPA
recommends that states make a risk management decision to choose one or the other set.
Derivation of an equivalent E. coli value
Using the results from the culturable enterococci analyses described above, EPA derived criteria
values for culturable E. coli that are comparable to the two recommended enterococci GM
culture-based values. First, using the preceding approaches, 35 cfu per 100 mL culturable
enterococci corresponds to 36 NGI per 1,000 primary contact recreators. From the 1986 fresh
water relationship between swimming-associated illness (see equation below) and water quality,
36 NGI per 1,000 primary contact recreators (8 HCGI per 1,000 primary contact recreators)
corresponds to an E. coli density of 126 cfu per 100 mL.
Swimming-associated HCGI illness = − 11.74 + 9.397 (mean log10 E. coli per 100 mL)
Similarly, EPA derived an E. coli density comparable to 30 cfu enterococci per 100 mL by
solving the above equation at an illness rate of 7 HCGI per 1,000 primary contact recreators
(translated from approximately 32 NGI per 1,000 primary contact recreators which was the
estimated midpoint of the illness range derived in Approach 4) to yield an estimated E. coli
density of 99 cfu per 100 mL. EPA rounded this estimated density to 100 E. coli cfu per 100 mL.
EPA believes this rounding was appropriate, given the uncertainty surrounding the predicted
illness range of the recommended 2012 RWQC enterococci culture-based value. This
recommended criterion value (100 E. coli cfu per 100 mL) is consistent with the threshold
suggested by Wiedenmann et al. (2006) based on an E.U. RCT epidemiological study using
completely different data and statistical methods (as summarized in section 3.2.3).
Derivation of an equivalent qPCR value
EPA derived values for enterococci measured using EPA’s Enterococcus spp. qPCR Method
1611 (U.S. EPA, 2012b) in a manner similar to the derivation for E. coli at 32 NGI per 1,000
primary contact recreators described above. The qPCR values were computed from the combined
NEEAR epidemiological regression model (Figure 6) (see Appendix A; U.S. EPA, 2011). This
model was preferred over separate models for marine and fresh waters because EPA’s analysis
indicated that there was little evidence for differences in illness rate estimates obtained from
separate models from marine and fresh water beaches and because the beach-specific separate

29
models showed no statistical improvement over a single combined model (U.S. EPA, 2011). The
statistically significant relationship between swimming-associated illness in terms of NGI per
1,000 primary contact recreators and water quality developed from the combined marine and
fresh water data is defined as follows:
Swimming-associated NGI = -27.31 + 23.73 (mean log10 qPCR cce per 100 mL)
Based on the regression model, the following equation was used to derive the qPCR value:
qPCR Value =
where:
qPCR = qPCR value in units of cce per 100 mL
NGI = NGI rate6 in illnesses per 1,000 primary contact recreators
6 See U.S. EPA (2011) for translation information of HCGI illness rate into the NEEAR illness rate.
73.23
31.27
10
NGI

30
Figure 6. Swimming-associated NGI and daily average Enterococcus spp. measured by
qPCR (cce per 100 mL). All subjects, marine and fresh water beaches combined.
Thus, qPCR-based GM values of 301 and 466 cce enterococci per 100 mL correspond to
approximately 32 and 36 cases of NGI per 1,000 primary contact recreators, respectively. EPA
rounded 301 to 300 cce per 100 mL, and 466 to 470 cce per 100 mL to obtain a comparable
Enterococcus spp. measured by qPCR density to the enterococci measured by culture-based
value described above.
3.3 Scope of Protected Population
EPA’s 1986 criteria recommendations are supported by epidemiological studies that were
conducted in the late 1970s and early 1980s. Those studies enrolled participants according to the
following criteria: “Whenever possible, family units were sought because information on
multiple individuals could be obtained from one person, usually an adult member of a family.
During this initial contact, the following information was obtained on each participant: sex, age,
race and ethnicity” (Dufour, 1984). This enrollment strategy ensured that children were highly
represented in those epidemiological studies. Thus, the illness rates corresponding to the 1986
criteria recommendations are based on the epidemiological relationship for the general
population that is inclusive of children. EPA used a similar epidemiological approach for
deriving illness rates for the 2012 RWQC.
As in the previous EPA epidemiological studies, children were well represented in EPA’s
NEEAR study population. The proportions of individuals in the under five-year and five to ten-
year age categories that were enrolled in the epidemiological studies were greater than in the
U.S. demographic. According to the U.S. Census data for 2009, children younger than ten years

31
of age make up approximately 14 percent of the U.S. population (Census, 2010). At West Beach,
the proportion of children aged ten years and under made up 20 percent of the study sample. A
similar over-representation of children compared to the U.S. population is true for studies at the
other beaches, including Huntington (20 percent of the study sample), Washington Park (22
percent), Silver Beach (22 percent), Edgewater (17 percent), Fairhope (30 percent), and Goddard
(20 percent).
EPA conducted statistical analyses of the data from each of EPA’s epidemiological studies at
fresh water, marine, and tropical beaches to evaluate whether children at these sites were at an
increased risk of illness following exposure to recreational waters. The results for children were
compared to adults and other age groups. The age groups used for comparison included the
following: ten years and under, 11 to 55 years, and over 55 years of age. Other age groups for
children were not separately analyzed due to small sample sizes. Data for children (i.e., ten years
and under) were specifically analyzed to evaluate whether they exhibit different illness rates
compared to the general population.
In the NEEAR marine epidemiological studies, the association between water quality as
measured by qPCR and illness in children was not different from that observed for the general
population, despite a higher proportion of children age five to ten years (75 percent) immersed
their bodies or head in the water compared with adults over age 55 years (26 percent) (Wade et
al., 2010). Elevated GI illness rates were, however, observed among swimmers of all age groups
compared with non-swimmers on days that exceeded the enterococci GM value of 35 cfu per 100
mL (Wade et al., 2010). In the NEEAR fresh water epidemiological studies, the association
between GI illness and water quality, as measured by EPA’s Enterococcus spp. qPCR Method
1611 (U.S. EPA, 2012b), was stronger among children (age ten years and under) compared with
the NEEAR general population, which also included children. The reason for the stronger
association in children compared to the general population is not known. However, there are
several possible explanations. Relative to body size, children breathe more air and ingest more
food and water than adults (U.S. EPA, 2003). Children also exhibit behaviors that increase their
exposure to environmental contaminants, including increased head and body immersion in
recreational waters (U.S. EPA, 2010a; Wade et al., 2006, 2008) and hand-to-mouth contact (Xue
et al., 2007). The immature immune systems of children can also leave them particularly
vulnerable to the effects of environmental agents (Pond, 2005). Children also stay in the water
longer than adults (Wade et al., 2006, 2008) and often times ingest more water (Dufour et al.,
2006).
In data from the NEEAR fresh water study sites, there was considerable overlap in the CIs
associated with the estimated mean illness responses between children and the general
population. The CIs for the children’s curve were wider than the CIs for the general population.
When health effects were compared with water quality, as measured by culturable enterococci,
differences between children (age ten years and under) and the general population were not
observed (Wade et al., 2008). As indicated previously, swimmers exposed to water qualities
above densities of 33 enterococci cfu per 100 mL had an elevated risk of developing GI illness
compared with non-swimmers and swimmers exposed to water having densities less than 33
enterococci cfu per 100 mL. Both cohorts, including children (age ten years and under) and the

32
general population, demonstrated similar responses to water having more than 33 enterococci cfu
per 100 mL.
The epidemiological studies conducted by EPA in tropical regions (Boquerón Beach, Puerto
Rico) and temperate marine water that were impacted by urban runoff (Surfside Beach, South
Carolina) showed no evidence of increased illness in children or the general population
associated with increasing levels of FIB in the recreational waters (U.S. EPA, 2010a).
EPA considered developing criteria based specifically on the results for children. The collective
results of the NEEAR study, however, provide inconclusive evidence that children (age ten years
and under) exhibited a significantly different illness response given the range of water qualities
measured in these studies.
Participants over the age of 55 years were studied, but in numbers that were too low to be
evaluated separately. For example, in the fresh water studies, this subgroup represented seven
percent of the study population. This small sample size did not allow EPA to make any
conclusions about risk in the subpopulation over 55 years old. Additionally, EPA’s NEEAR
study were not designed to evaluate the effects on groups with compromised immune systems or
other vulnerable subpopulations.
EPA considered all the demographic data and results presented above and concluded that the
robustness of the estimates for the general population data provide a significant advantage over
the more uncertain and smaller sample set that consisted only of children. Importantly, the
general population data are weighted to include children in a robust manner. Thus, the general
population data provide an appropriate basis for deriving EPA’s recommended values for the
2012 RWQC.
This RWQC document includes information regarding several additional ways to protect
children at beaches through use of a lower value in beach notification programs (i.e., BAV),
rapid indicator methods, and predictive modeling. The BAVs are values that correspond to the
75th
percentile of a water quality distribution based on these criteria, and can be used by states to
make precautionary beach management decisions before there is an excursion of the applicable
WQS (see section 5.1). Rapid indicator detection methods, such as qPCR can allow beach
managers to make real-time decisions to protect families and their children, in contrast to
traditional culture methods, which provide estimates of water quality a day or two after the actual
exposure. The qPCR method can be performed in 2–6 hours and has been shown to be successful
when implementing same-day beach management decisions (Griffith and Weisberg, 2011).
Predictive models can also be used for rapid notification of potential water quality problems.
These models have been demonstrated to be useful tools for implementing beach notification
programs in the Great Lakes (Francy, 2009; Frick et al., 2008; Ge and Frick, 2009). Because
children may be more exposed and/or more sensitive to pathogens in recreational waters, it is
imperative that effective risk communication and health outreach be done to effectively mitigate
exposure to contaminated waters. Alerting families with children to the level of water quality on
a given beach day, in real time, will allow for better protection of children.
33
3.4 Waterbody Type
EPA’s 2012 RWQC recommendations are scientifically defensible for all surface waters of the
U.S. designated by a state for primary contact recreation. Historically, the scientific evidence
used to generate criteria recommendations has been based on data collected mostly from coastal,
temperate and Great Lakes fresh waters. The stakeholder community asked EPA to consider
whether EPA’s criteria recommendations could be used to develop state WQS for other types of
waters.
In response, EPA conducted a review of the available information comparing coastal (including
Great Lakes and marine) and non-coastal (including flowing and non-flowing inland waters,
such as streams, rivers, impoundments, and lakes) waters to evaluate whether EPA should
include recommendations in the 2012 RWQC for all waterbody types (U.S. EPA, 2010f).
Additionally, EPA considered the WERF Inland Water Workshop report (WERF, 2009) and
subsequent meeting report publication (Dorevitch et al., 2010). These publications concluded
that the inclusion of non-coastal waters in the 2012 criteria will result in public health protection,
by preventing illnesses associated with exposure to non-coastal waters. Specifically, these
studies found the distinction of non-coastal waters versus coastal waters is of less importance
than more fundamental variables, such as the source of fecal contamination, scale of the body of
water, and the effects of sediment, which translate into differences in the densities, transport, and
fate of indicators and pathogens (Dorevitch et al., 2010). Further, epidemiological studies in non-
coastal waters also support the inclusion of all waterbody types into the criteria. Outbreaks from
recreational exposure to non-coastal waters indicate a need for public health protection in such
settings. Historical use of culturable Enterococcus spp. and E. coli, paired by the recommended
1986 criteria, have been used to prevent the occurrence of outbreaks of severe illness as well as
the sporadic cases of illness that occur among swimmers. The next two subsections describe the
data that EPA considered in determining which waterbody types are covered by the 2012
RWQC. For additional information see the WERF Inland Water Workshop report (WERF,
2009).
Waterbody type and sources of fecal contamination.
EPA’s literature review identified the source of fecal pollution as a factor when considering the
potential differences between EPA epidemiological study sites and non-coastal waters (U.S.
EPA, 2010f). More information specifically concerning the source of fecal contamination is
found in section 3.5. Sources of fecal contamination are discussed in this section only insofar as
they potentially impact FIB in coastal versus non-coastal settings.
All surface waters may potentially receive FIB from point sources, diffuse sources (which may
consist of point source and non-point source pollution), direct deposition, and resuspension of
FIB contained in sediments. FIB loadings in WWTP-impacted coastal and non-coastal waters are
generally similar. WWTP discharges, which are known sources of human-derived pathogens and
indicators from fecal pollution, are relatively steady. Differences exist in FIB loadings between
waters that are WWTP-impacted and waters impacted by sources other than treated sewage
effluent. Due to differences in the physical and biological characteristics, FIB survival compared
to pathogen survival may differ between coastal and non-coastal waters. Some of the potential
34
differences between coastal and non-coastal waters that may impact survival include extent of
shading, hydrodynamics, potential for sedimentation, and microbial ecology.
Epidemiological studies in non-coastal waters.
EPA also evaluated the available epidemiological evidence in non-coastal waters. Only a handful
of studies have been conducted in small lakes and even fewer in inland flowing waters. Among
those, one of the epidemiological sites for earlier EPA studies (Dufour, 1984) was a small inland
lake in Oklahoma, which helped provide the basis for the 1986 criteria.
Ferley et al. (1989) conducted a retrospective study in the French Ardèche basin to determine the
relationship between swimming-related morbidity and the bacteriological quality of the
recreational water. Tourists (n = 5,737) in eight holiday camps were questioned about the
occurrence of illness and their bathing habits during the week preceding the interviews. GI
illness was higher in swimmers than in non-swimmers. Fecal streptococci were best correlated to
GI illness. Direct linear regression models and fecal coliforms did not predict risk as well. The
concentration of fecal streptococci above which bathers exhibited higher illness rates than non-
bathers was 20 fecal streptococci cfu per 100 mL.
A series of RCT epidemiological studies was conducted in Germany to establish the association
of illness with recreational use of designated fresh recreational waters (four lakes and one river)
(Wiedenmann et al., 2006). All study sites were in compliance with the European standards for
total coliform and fecal coliform for at least the three previous bathing seasons. Sources of fecal
contamination at the study sites included treated and untreated municipal sewage, non-point
source agricultural runoff, and fecal contamination from water fowl. Based on the water quality
measured as levels of E. coli, enterococci, somatic coliphages, or Clostridium perfringens and
observed health effects, the authors recommended guideline values for each of these fecal
indicator organisms. Their recommended guideline values for enterococci and E. coli are very
similar to the 2012 RWQC recommendations.
Epibathe evaluated the health effects of swimming in E.U. fresh and Mediterranean marine
waters (European Commission-Epibathe, 2009). Four riverine recreational sites were examined
in Hungary in 2007, which were in compliance with the European standards specified in the E.U.
bathing Water Directive (EP/CEU, 1976). For these fresh water studies, E. coli provided the best
indicator-illness relationship between GI symptoms and water quality. These data support the use
of E. coli as an effective fecal indicator for use in inland waters.
A PC study was recently conducted at a small inland lake in Ohio (Marion et al., 2010). The
study was undertaken to examine the illness rates among inland recreational water users. It also
evaluated the effectiveness of E. coli as an effective predictor of an increased GI illness rate
among recreators. Human health data were collected during the 2009 swimming season at East
Fork Lake, Ohio and adverse health outcomes were reported eight to nine days post-exposure.
The authors concluded that E. coli was significantly associated with an elevated GI illness rate
among swimmers compared to non-swimmers. The predicted illness rate increased among
swimmers with increasing densities of E. coli.

35
Based on the information summarized above, EPA has determined that the 2012 RWQC
recommendations are scientifically defensible and protective of the primary contact recreation
use in both coastal and non-coastal waterbodies. Although some differences may exist between
coastal and non-coastal waters, those differences were not significant enough to justify the
development of different WQC recommendations for non-coastal waters. States wishing to
address site-specific conditions or local waterbody characteristics in their WQS should refer to
section 6 of this document for suggestions on approaches.
3.5 Sources of Fecal Contamination
In §on 303(i)(2)(A) of the CWA, EPA was required to promulgate criteria that are as protective
of human health as EPA’s 1986 criteria where states had failed to do so for their coastal and
Great Lakes waters. When EPA promulgated WQS for those states based on the 1986 criteria in
2004, EPA evaluated the scientific understanding of the human health risks associated with
nonhuman sources of fecal contamination and concluded that although “[the] EPA’s scientific
understanding of pathogens and pathogen indicators has evolved since 1986, data characterizing
the public health risk associated with nonhuman sources is still too limited for the [EPA] to
promulgate [WQS for states based on] another approach.” Thus, the federally promulgated
criteria values in the 2004 BEACH Act Rule applied regardless of origin, unless a sanitary
survey shows that the sources of the indicator bacteria are nonhuman and an epidemiological
study shows that the indicator densities are not indicative of a human health risk. In addition, in
evaluating whether state standards were as protective of human health as EPA’s 1986 criteria,
EPA concluded that state WQS with exemptions for nonhuman sources were not as protective of
human health as EPA’s 1986 criteria (see 69 FR at 67228).
EPA has continued to examine the potential for illness from exposure to nonhuman fecal
contamination compared to the potential for illness from exposure to human fecal contamination.
One of the key topics discussed at the Experts Scientific Workshop on Critical Research Needs
for the Development of New or Revised Recreational Water Quality Criteria (U.S. EPA, 2007a)
was different sources of FIB, including human sources, and a variety of nonhuman sources (such
as agricultural animals). EPA further investigated sources of fecal contamination in Review of
Published Studies to Characterize Relative Risks from Different Sources of Fecal Contamination
in Recreational Waters (U.S. EPA, 2009b) and Review of Zoonotic Pathogens in Ambient Waters
(U.S. EPA, 2009a). EPA recognizes the public health importance of waterborne pathogens that
can affect both human and other species (zoonotic). However, the state of the science has only
recently allowed for the characterization of the potential health impacts from recreational
exposures to zoonotic pathogens relative to the risks associated with human sources of fecal
contamination. Overall, the aforementioned reviews indicate that both human and animal feces in
recreational waters do pose potential risks to human health, especially in immunocompromised
persons and vulnerable individuals. EPA has conducted analyses to characterize the potential
differences in magnitude of illness arising from different fecal sources. These analyses indicate
that the human health risk associated with exposure to waters impacted by animal sources can
vary substantially. In some cases these risks can be similar to exposure to human fecal
contamination, and in other cases, the risk is substantially lower. The criteria recommendations
do not address pollutants in sand, except to the degree that sand may serve as a source of FIB in
recreational waters.

36
3.5.1 Zoonotic Potential
Zoonotic diseases are those that are communicable from animals to humans. Fecal contamination
from nonhuman sources can transmit pathogens that can cause GI illnesses, such as those
reported in EPA’s NEEAR and other epidemiological studies.
Livestock and wildlife carry both human pathogens and FIB, and can transmit these microbes to
surface waters and other bodies of water (CDC, 1993, 1996, 1998, 2000, 2002, 2004, 2006,
2008; USDA, 2000). Additionally, many documented outbreaks of potential zoonotic pathogens,
such as Salmonella, Giardia, Cryptosporidium, and enterohemorrhagic E. coli O157:H7 could be
of either human or animal origin, although providing proper source attribution for these
outbreaks can be quite difficult. U.S. Centers for Disease Control and Prevention (CDC) reports
have documented instances of E. coli O157:H7 infection resulting from exposure to surface
waters, but the source of the contamination is not specified (CDC, 2000, 2002). Other studies
have linked recreational water exposure to outbreaks caused by potentially zoonotic pathogens,
but the sources of fecal contamination in these waters were not identified (Roy et al., 2004; U.S.
EPA, 2009a; Valderrama et al., 2009). Although formal surveillance information is not
comprehensive, Craun et al. (2005) estimated that 18 percent of the 259 recreational water
outbreaks reported to the CDC from 1970 to 2000 were associated with animals.
One study documenting a 1999 outbreak of E. coli O157:H7 at a lake in Vancouver, Washington
suggested that duck feces were the source of the pathogen causing the outbreak (Samadpour et
al., 2002). More than 100 samples of water, soil, sand, sediment, and animal feces were collected
in and around the lake and tested. E. coli O157:H7 was detected in both water and duck fecal
samples. Genetic analyses of the E. coli isolates demonstrated similar results in the water, duck
feces, and patient stool samples. Duck feces could not be confirmed as the primary source of the
zoonotic pathogens, however, because the ducks could have been infected by the same source of
contamination that was present in the lake. Other notable outbreaks are discussed in EPA’s
Review of Published Studies to Characterize Relative Risks from Difference Sources of Fecal
Contamination in Recreational Water (U.S. EPA, 2009b).
3.5.2 Differential Health Risks from Human versus Nonhuman Sources
EPA’s research indicates that the source of contamination appears to be an important factor for
understanding the human health risk associated with recreational waters and that the potential
human health risks from human versus nonhuman fecal sources can vary (Schoen and Ashbolt,
2010; Soller et al., 2010b).
Researchers have documented human health impacts in numerous epidemiological studies in
marine and fresh water primarily impacted by human sources of fecal contamination (see
sections 3.2 and 3.4 for a discussion of these studies). The cause of many of the illnesses,
particularly those resulting from exposure to WWTP effluent, is thought to be viral (Soller et al.,
2010a; U.S. EPA, 1986; WERF, 2011). These human viruses are generally unlikely to occur in
animal feces although pigs and birds may periodically carry zoonotic viruses.

37
Nonhuman sources of fecal contamination and the associated potential human health risks can
vary from site-to-site depending on factors such as: the nature of the nonhuman source(s), the
fecal load from the nonhuman source(s), and the fate and transport characteristics of the fecal
contamination from deposition to the point of exposure. Nonhuman fecal sources can
contaminate recreational bodies of water via direct fecal loading into the body of water, and
indirect contamination can occur via runoff from the land. The fate and transport characteristics
of the zoonotic pathogens and FIB present under these conditions can be different (such as,
differences in attachment to particulates or differences in susceptibility to environmental
parameters affecting survival) (U.S. EPA, 2011l). For more information on pathogenic risks from
nonhuman sources, see Review of Zoonotic Pathogens in Ambient Waters (U.S. EPA, 2009a).
However, only a few epidemiological studies have been conducted in waters impacted by
nonhuman sources of fecal contamination. The results of these studies are less clear than those
conducted in waters impacted by human sources, particularly as related to conventionally
enumerated FIB in those types of waters. For example, Calderon et al. (1991) found a lack of a
statistical association between swimmers’ illness risk and FIB levels in a rural fresh waterbody
impacted by animal fecal contamination; however, other researchers have commented that this
lack of statistical association may have been due to the small study size and not a lack of
potential human health risks (McBride, 1993). Another epidemiological study conducted at a
nonhuman, nonpoint source impacted beach at Mission Bay, California documented an increase
in diarrhea and skin rash in swimmers versus non-swimmers, but the incidence of illness was not
associated with any of the traditional FIB levels tested (Colford et al., 2007). On the other hand,
McBride et al. (1998) conducted an analysis of the impact on human sources versus animal
sources on New Zealand beach sites and concluded that the illness risks posed by animal versus
human fecal material were not substantially different. These studies collectively suggest that
waterbodies with substantial animal inputs may potentially result in human health risks that vary
based upon the relative proportion of the human and nonhuman fecal input and the nature of the
nonhuman source of infective agent(s).
Microbial risk assessment approaches are available to assist in characterizing potential human
health risks from nonhuman sources of fecal contamination (Roser et al., 2006; Soller et al.,
2010b; Schoen and Ashbolt, 2010; Till and McBride, 2004). For example, New Zealand, where
roughly 80 percent of the total reported illnesses are zoonotic and potentially waterborne,
recently updated its recreational fresh water guidelines based on a risk analysis of
campylobacteriosis (accounting for over half of the reported total notifiable disease burden in
that country) and using E. coli as a pathogen indicator (Till and McBride, 2004). Since those
waters were highly impacted by fecal contamination, in this case from agricultural sources, a
predictable relationship between the pathogen and the FIB could be developed. The correlation
between the occurrence of Campylobacter and E. coli is unlikely to hold in all waters, but this
relationship was demonstrated in parts of New Zealand, particularly in waters with high levels of
Campylobacter and E. coli.
The risk presented by fecal contamination from nonhuman sources has been shown in some
cases, to be potentially less than the risk presented by fecal contamination from human sources
(Schoen and Ashbolt, 2010; Soller et al., 2010a, b; WERF, 2011). EPA’s research also indicates
that some nonhuman fecal sources (cattle in particular) may pose risks comparable to those risks

38
from human sources (Soller et al., 2010a, b; U.S. EPA, 2010g). Human pathogens are present in
animal fecal matter, and there is, therefore, a potential risk from recreational exposure to human
pathogens in animal-impacted waters that must be accounted for in the 2012 RWQC. For waters
dominated by nonhuman sources and in the absence of site-specific criteria, EPA recommends
that the national criteria be used to develop WQS for all waters including those impacted by
point and nonpoint sources.
Because there have been few epidemiological studies, with mixed findings, in waters impacted
by nonhuman sources and QMRA shows that risks from some animals may be comparable to
humans, EPA is not developing separate national criteria for nonhuman sources. However, since
some studies have site-specifically shown less risk in waters impacted by nonhuman sources,
states interested in addressing the potential human health risk differences from different sources
of fecal contamination on a site-specific basis should refer to section 6.2.2 of this document for
suggestions on approaches.
Naturally occurring environmental sources of traditional FIB, another nonhuman source, may
exist, particularly under tropical conditions. Results of the EPA epidemiological beach study at
Boquerón, Puerto Rico did not refine EPA’s understanding of risk enough to justify a different
criteria recommendation for tropical waters. In addition to the epidemiological study at
Boquerón, Puerto Rico, EPA conducted a literature search and reported the results in the Review
of Fecal Indicator Organism Behavior in Ambient Waters and Alternative Indicators for
Tropical Regions (U.S. EPA, 2009c). The literature indicates that FIB, fecal coliforms,
enterococci, and E. coli are endemic to tropical, subtropical, and temperate regions. Studies
conducted in the tropics and subtropics show proliferation of E. coli, enterococci, and/or fecal
coliforms (Boehm, 2007; Byappanahalli, 2012; U.S. EPA, 2009c). Changing environmental
conditions in tidally-influenced sediments help support proliferation and elevated FIB in water
(U.S. EPA, 2009c).
Overall, EPA believes that the state of the science is not developed sufficiently to distinguish
environmental sources from other sources of FIB on a national basis. In some circumstances, the
presence of FIB in water is not necessarily an indication of recent fecal contamination or
potential health risk. Therefore, EPA has concluded that states adopting the 2012 RWQC would
result in WQS protective of the designated use of primary contact recreation. States wishing to
consider alternative indicators should refer to section 6.2 for information on how to develop
alternative criteria.
3.6 Expression of Criteria
EPA identified a number of opportunities to improve clarity and to enhance implementation of
the 2012 RWQC, which are discussed in the sections below.
3.6.1 EPA’s 1986 Ambient Water Quality Criteria for Bacteria
In 1986, EPA recommended criteria for enterococci and E. coli that contain two components: a
GM and an SSM. EPA derived the 1986 criteria values from beach water quality datasets that
were collected as part of EPA’s epidemiological studies conducted during the late 1970s and

39
early 1980s. The GM values were computed as described in section 3.2.1. The SSM values were
derived from upper percentiles of the water quality distribution around the GM criteria values.
Together, the 1986 criteria GM and SSM described a water quality distribution that would be
protective of primary contact recreation, based on the epidemiological studies conducted during
that period. Thus, the GM and SSM values in the 1986 criteria corresponded to the same illness
rate because they are both derived from the same water quality distribution.
The 1986 criteria contained four different SSM values corresponding to the 75th
, 82nd
, 90th
, and
95th
percentiles of the expected water quality sampling distribution at the GM criteria value. EPA
recommended using different SSM values on the basis of the use intensity of the recreational
water. However, treating the SSM as a never to be exceeded value for such an evaluation would
impart a level of protection much more stringent than intended by the 1986 criteria GM value.
For example, a marine beach that is in compliance with the 1986 GM criteria for enterococci
(GM = 35 cfu per 100 mL) would be expected to have 25% of the sample values above 104 cfu
per 100 mL (the 75th
percentile of the expected water quality sample distribution) because of
expected variability in individual water quality measurements. Expecting that beach to never
exceed 104 cfu per 100 mL would require an actual GM much lower, associated with a lower
illness rate, than the recommended GM criterion value.
3.6.2 The 2012 RWQC
In the 2012 RWQC, EPA is recommending the criteria magnitude be expressed as a GM value
corresponding to the 50th
percentile and a STV corresponding to the 90th
percentile of the same
water quality distribution, and thus associated with the same level of public health protection.
EPA’s criteria recommendations are both for a GM and STV (rather than just a GM or just an
STV) because used together they would indicate whether the water quality is protective of the
designated use of primary contact recreation.. Using the GM alone would not reflect spikes in
water quality because the GM alone is not sensitive to them.
EPA is recommending that the GM of a waterbody be calculated in the same way as
recommended in the 1986 criteria by taking the log10 of sample values,7 averaging those values,
and then raising that average to the power of 10. The STV is also derived in a manner similar to
how the 1986 criteria SSM was derived by estimating the percentile of the expected water
quality distribution around the GM criteria value.
EPA believes that the STV, used in conjunction with the GM, can help ensure the FIB densities
in recreational waters correspond to a water quality level protective the designated use of
primary contact recreation by constraining the number of high water quality values. The
distribution of FIB in water is highly variable and can generally be represented as a log10 normal
distribution (Bartram and Rees, 2000; Kay et al., 2004; Wyer et al., 1999). EPA derived the STV
from the observed pooled variance of the FIB data reported in EPA’s epidemiological studies.
The computed pooled variances represent a wide range of weather and hydrological conditions
because monitoring was conducted over the full course of the set of epidemiological studies.
EPA stratified the epidemiological data by beach and water depth (14 subgroups) because FIB
7 For data points reported below detectable limits, the GM calculation should be based on the assumption that those
observations were present at the detection limit.

40
distributions are known to differ systematically for these factors (Wade et al., 2008), and the
pooled variance was then calculated. For EPA’s Enterococcus spp. qPCR Method 1611, the
pooled variance resulted in a log standard deviation (the standard deviation of the base 10
logarithms of the data) of 0.49. From the NEEAR study sites, the pooled variance estimates for
culturable enterococci are 0.44 (the pooled variance for culturable E. coli was reported
previously (U.S. EPA, 1986) as 0.40).
For the STV, EPA selected the estimated 90th
percentile of the water quality distribution to take
into account the expected variability in water quality measurements, while limiting the number
samples allowed to exceed the STV, before deciding water quality is impaired. In addition, the
approach encourages monitoring because once an exceedance is observed, at least ten more
samples need to be below the STV before water quality is considered unimpaired.
Further, EPA is no longer utilizing the concept of “use intensity” as a basis for recommending
multiple SSM criteria. EPA’s recommends instead that states adopt both the GM and STV into
their WQS for all primary contact recreation waters.
EPA now specifically recommends a duration period over which the GM of samples should be
calculated and over which the STV should be compared against a recommended limit on the
frequency of excursions. EPA is recommending that states use a duration for the GM and STV of
30 days. The duration and frequency of excursion should be explicitly included in the state's
WQS as it is a component of the WQS.
EPA understands that a longer duration would typically allow for more samples to be collected
and that including more samples in calculation of the GM and STV improves the accuracy of the
characterization of water quality. However, because the designated use protected by this criterion
is primary contact recreation, EPA believes that a shorter duration (i.e., 30 days), used in a static
or rolling manner, coupled with limited excursions above the STV, allows for the detection of
transient fluctuations in water quality in a timely manner. In the development of their monitoring
program, EPA recommends that states consider the number of samples evaluated in order to
minimize the possibility of incorrect use attainment decisions (see section 3.6.4).
3.6.3 Criteria Magnitude, Duration, and Frequency for CWA Purposes
EPA recommends that RWQC consist of a magnitude, duration and frequency. Magnitude is the
numeric expression of the maximum amount of the pollutant that may be present in a waterbody
that supports the designated use. Duration is the period of time over which the magnitude is
calculated. Frequency of excursion describes the maximum number of times the pollutant may be
present above the magnitude over the specified time period (duration). A criterion is set in a
WQS such that the combination of magnitude, duration and frequency protect the designated use
(such as primary contact recreation).
41
EPA’s 2012 RWQC recommendations to protect primary contact recreation consist of a
magnitude, duration and frequency of exceedance.
Magnitude: GM and the STV (regardless of the sample size).
Duration and Frequency: The waterbody GM should not be greater than the selected
GM magnitude in any 30-day interval. There should not be greater than a ten percent
excursion frequency of the selected STV magnitude in the same 30-day interval.
3.6.4 Application of State WQS based on EPA’s 2012 RWQC for NPDES Permitting,
303(d) Listing, TMDL Development, and Beach Notification Programs
WQC in state WQS are used: to derive water quality-based effluent limits (WQBELs) for
National Pollutant Discharge Elimination System (NPDES) permits; to identify impaired and
threatened waters for waterbody assessments; to develop waste load allocations and load
allocations for TMDLs; and for beach notification programs under §406 of the CWA.
NPDES permitting purposes
The NPDES regulation at 40 CFR 122.44(d) requires the development of WQBELs as necessary
to attain WQS. Under §122.45(d), permit limits for continuous dischargers must include both
short- and long-term WQBELs unless there is a specific finding of “impracticability”. EPA
recommends that permitting authorities use an effluent limit derivation approach that considers
both the GM and STV in the limit calculations, and which results in short- and long-term effluent
limits that derive from and comply with all applicable criteria expressions. Once established,
pathogen indicator-based limits for continuous dischargers are applied and enforced in a manner
consistent with all other water quality parameters.
For non-continuous or episodic discharges, 40 CFR 122.45(e) requires WQBELs to reflect the
frequency of discharge; total mass; maximum discharge rate; and prohibition or limitation of
specified pollutants by mass, concentration, or other measure. Wet weather-related events
influence episodic discharges such as combined sewer overflows (CSOs). The 1994 CSO
Control Policy (reflected in §402(q) of the CWA) describes various approaches for addressing
CSO discharges in NPDES permits and should be consulted when establishing WQBELs for
intermittent dischargers. The CSO Policy also recommends WQS review and revision, as
appropriate, to reflect the site-specific wet weather impacts of CSOs. In conjunction with an
approved long-term CSO control plan, a WQS review could involve a use attainability analysis
(40 CFR 131.10(g)) and subsequent modification of a designated use.
Detailed approaches for deriving WQBELs to meet WQS based on EPA’s final 2012 RWQC
will be further explained in upcoming TSM.
Identification of Impaired and Threatened Waters
Under §303(d) of the CWA and EPA’s implementing regulation (40 CFR 130.7), states,
territories, and authorized tribes (hereafter referred to as states) are required to develop lists of
impaired and threatened waters that require TMDLs. Impaired waters are those waters for which
effluent limitations and other pollution control requirements are not stringent enough to
implement any WQS applicable to the waterbody. EPA recommends that states consider as
42
threatened those waters that are currently attaining WQS, but which are expected not to meet
WQS by the next listing cycle (every two years). Consistent with EPA recommendation, many
states consolidate their §303(d) and §305(b) reporting requirement into one “integrated” report.
For making these water quality attainment determinations, a state that adopts WQS consistent
with the 2012 RWQC would evaluate all readily available data and information to determine
whether a waterbody meets the WQS (i.e., whether the waterbody is in attainment). Both the GM
and the STV would be part of the WQS and therefore both targets would be used to determine
whether a waterbody meets the WQS for primary contact recreation. The waterbody condition
would need to be evaluated based on all existing and readily available data and information for
the specified duration. EPA’s regulation defines “all existing and readily available water quality
related data and information” at 40 CFR 130.7(b)(5). EPA expects that water quality attainment
determinations would include water quality monitoring data collected as part of a beach
notification program, as well as information regarding beach closures and advisories.
Beach Notification Programs
WQC in state WQS are the applicable targets for EPA grant funded state beach notification
programs under §406 of the CWA. The BAV is not a component of EPA’s recommended
criteria, but a tool that states may choose to use, without adopting it into their WQS as a “do not
exceed value” for beach notification purposes (i.e., advisories). While the GM and STV would
be the applicable WQS, a BAV could be used at the state’s discretion as a more conservative,
precautionary tool for beach management decisions. Similarly, states could also choose to use
the STV as a “do not exceed value” for the purposes of their beach notification program, without
adopting it as a “do not exceed value” in their WQS.
3.6.5 Practical Considerations for Implementing State WQS based on the 2012 RWQC
The number of samples, to be collected by a state in determining if WQS have been exceeded, is
not an approvable element of a WQS package (Florida Public Interest Research Group vs. EPA,
2007). Therefore states should not include a minimum sample size as part of their criteria
submission. When identifying sampling frequency as part of a state’s monitoring plan, a state
may consider that, typically, a larger dataset will more accurately characterize the water quality
in a waterbody, which may result in more meaningful attainment determinations. Therefore, EPA
is recommending that states conduct at least weekly sampling to evaluate the GM and STV over
a 30-day period and encourages more frequent sampling at more densely populated beaches.
4.0 Recreational Water Quality Criteria
EPA evaluated the available information and the results of the analyses presented above (section
3.2.4) and determined that the primary contact recreation designated use would be protected if
one of the following criteria sets consisting of a GM and an STV were adopted into a state’s
WQS and approved by EPA (see Table 4).
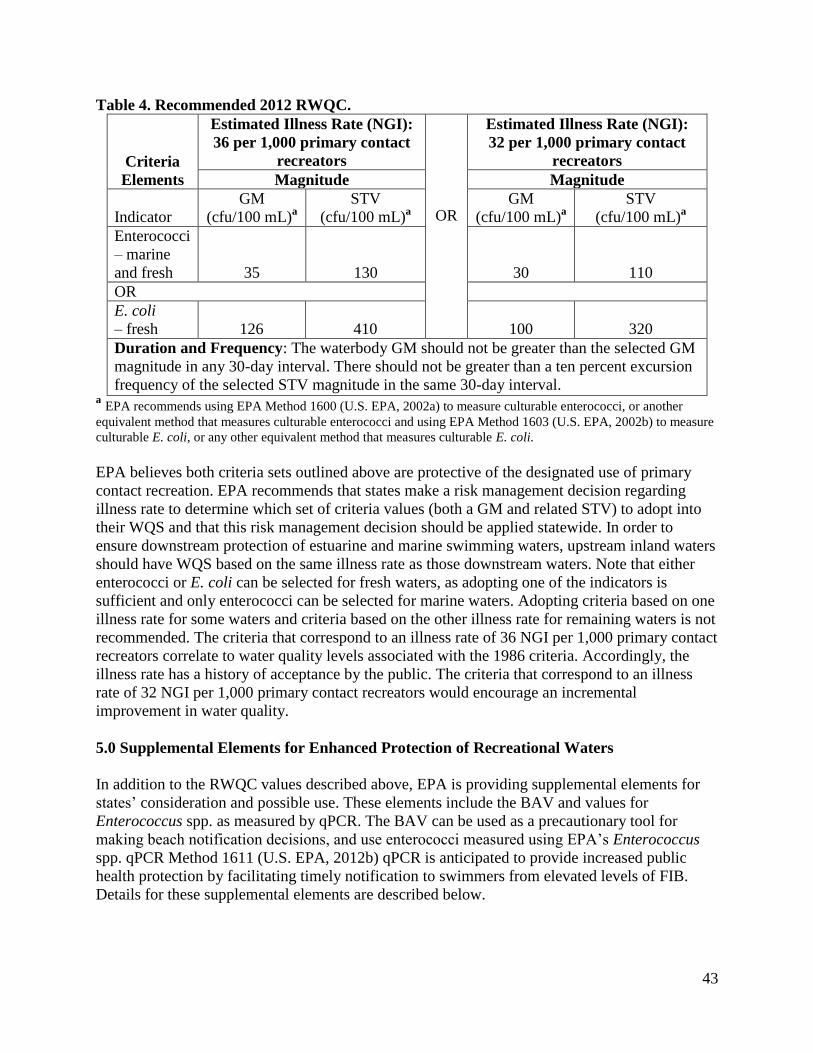
43
Table 4. Recommended 2012 RWQC.
Criteria
Elements
Estimated Illness Rate (NGI):
36 per 1,000 primary contact
recreators
OR
Estimated Illness Rate (NGI):
32 per 1,000 primary contact
recreators
Magnitude Magnitude
Indicator
GM
(cfu/100 mL)a
STV
(cfu/100 mL)a
GM
(cfu/100 mL)a
STV
(cfu/100 mL)a
Enterococci
– marine
and fresh 35 130 30 110
OR
E. coli
– fresh 126 410 100 320
Duration and Frequency: The waterbody GM should not be greater than the selected GM
magnitude in any 30-day interval. There should not be greater than a ten percent excursion
frequency of the selected STV magnitude in the same 30-day interval. a EPA recommends using EPA Method 1600 (U.S. EPA, 2002a) to measure culturable enterococci, or another
equivalent method that measures culturable enterococci and using EPA Method 1603 (U.S. EPA, 2002b) to measure
culturable E. coli, or any other equivalent method that measures culturable E. coli.
EPA believes both criteria sets outlined above are protective of the designated use of primary
contact recreation. EPA recommends that states make a risk management decision regarding
illness rate to determine which set of criteria values (both a GM and related STV) to adopt into
their WQS and that this risk management decision should be applied statewide. In order to
ensure downstream protection of estuarine and marine swimming waters, upstream inland waters
should have WQS based on the same illness rate as those downstream waters. Note that either
enterococci or E. coli can be selected for fresh waters, as adopting one of the indicators is
sufficient and only enterococci can be selected for marine waters. Adopting criteria based on one
illness rate for some waters and criteria based on the other illness rate for remaining waters is not
recommended. The criteria that correspond to an illness rate of 36 NGI per 1,000 primary contact
recreators correlate to water quality levels associated with the 1986 criteria. Accordingly, the
illness rate has a history of acceptance by the public. The criteria that correspond to an illness
rate of 32 NGI per 1,000 primary contact recreators would encourage an incremental
improvement in water quality.
5.0 Supplemental Elements for Enhanced Protection of Recreational Waters
In addition to the RWQC values described above, EPA is providing supplemental elements for
states’ consideration and possible use. These elements include the BAV and values for
Enterococcus spp. as measured by qPCR. The BAV can be used as a precautionary tool for
making beach notification decisions, and use enterococci measured using EPA’s Enterococcus
spp. qPCR Method 1611 (U.S. EPA, 2012b) qPCR is anticipated to provide increased public
health protection by facilitating timely notification to swimmers from elevated levels of FIB.
Details for these supplemental elements are described below.

44
5.1 Beach Action Value (BAV)
EPA suggests that states use a BAV as a conservative, precautionary tool for making beach
notification decisions. The BAV is not a component of EPA’s recommended criteria, but a tool
that states may choose to use, without adopting it into their WQS as a “do not exceed” value for
beach notification purposes (such as advisories). The BAV was developed from the same water
quality distribution (section 3.6.2) as the criteria values in section 4.0 and corresponds to the
estimated 75th
percentile of the enterococci and E. coli water quality distributions.
For states that choose to use a BAV (see Table 5), any single sample above the BAV could
trigger a beach notification until another sample below the BAV is collected. While the GM and
STV would be the applicable WQS, a BAV could be used at the state’s discretion as a more
conservative, precautionary tool for beach management decisions. This applies to all states,
including those with grants under §406 of the CWA.
EPA suggests that the state’s chosen criterion illness rate be used to determine the corresponding
BAV. For states that do not use a BAV, EPA suggests using the criteria STV values (provided in
Table 4) as “do not exceed” values for beach notification or retaining their current beach
notification values in their WQS. Additionally, if a state is not sampling during or immediately
after a rain event, the state should consider advising the public of the potential additional risk of
primary contact recreation when sources such as urban runoff or CSOs may be impairing water
quality.
Table 5. Beach Action Values (BAVs).
Indicator
Estimated Illness Rate
(NGI): 36 per 1,000
primary contact
recreators
OR
Estimated Illness Rate
(NGI): 32 per 1,000
primary contact
recreators
BAV
(Units per 100 mL)
BAV
(Units per 100 mL)
Enterococci – culturable
(fresh and marine)a
70 cfu
60 cfu
E. coli – culturable
(fresh)b
235 cfu 190 cfu
Enterococcus spp. –
qPCR (fresh and marine)c 1,000 cce 640 cce
a Enterococci measured using EPA Method 1600 (U.S. EPA, 2002a), or another equivalent method that measures
culturable enterococci. b E. coli measured using EPA Method 1603 (U.S. EPA, 2002b), or any other equivalent method that measures
culturable E. coli. c
EPA Enterococcus spp. Method 1611 for qPCR (U.S. EPA, 2012b). See section 5.2.
5.2 Rapid Method: Enterococcus spp. as measured by qPCR (EPA Method 1611)
EPA has developed a qPCR method to detect and quantify enterococci more rapidly than the
culture method for ambient waters. Introduction of EPA Enterococcus spp. qPCR Method 1611

45
is anticipated to provide increased public health protection by facilitating timely notification8 to
swimmers from elevated levels of FIB. Importantly, enterococci as measured by EPA
Enterococcus spp. qPCR Method 1611 have shown a stronger relationship to GI illness in the
recent EPA NEEAR epidemiological study compared to other methods tested (Wade et al., 2008;
U.S. EPA, 2010a, 2012b).
While EPA Enterococcus spp. qPCR Method 1611 (U.S. EPA, 2012b) offers some advantages,
EPA has limited experience with its performance across a broad range of environmental
conditions. States should be aware of the potential for qPCR interference (see section 3.1.1) in
various waterbodies, which may vary on a site-specific basis. Thus, EPA encourages a site-
specific analysis of the method’s performance prior to use in a beach notification program or
adoption of WQS based on the method. A “site” may be a beach, a waterbody, a particular
watershed, or a larger area (such as a state) that is shown to have uniform water quality
characteristics throughout. Considerations for determining how a qPCR-based WQS could be
developed will be provided in additional TSM. EPA’s Enterococcus spp. qPCR Method 1611
(U.S. EPA, 2012b) is not currently suggested for NPDES permitting or effluent-related
monitoring purposes because this method may not reflect the efficacy of WWTP disinfection
since it detects and enumerates both live and dead enterococci.
A state may adopt a WQS based on EPA’s Enterococcus spp. qPCR Method 1611 (U.S. EPA,
2012b) if it would be scientifically defensible and protect the designated use. As noted above,
prior to adoption EPA recommends a site-specific evaluation of the method’s performance. For
states interested in adopting a value for enterococci using EPA’s Enterococcus spp. qPCR
Method 1611 into their WQS, EPA is providing GM and STV values for use in marine and fresh
waters based on its epidemiological study data as shown in Table 6. The state’s chosen criterion
illness rate would determine the suggested corresponding qPCR values to be used by the state.
States may also choose a qPCR-based BAV for beach notification purposes (see Table 5).
This document includes only supplementary information about a WQS for Enterococcus spp.
measured by EPA’s Enterococcus spp. qPCR Method 1611 (U.S. EPA, 2012b) because of the
concerns discussed in section 3.1.1 of this document.
8 See section 5.2.1 for a discussion on the use of predictive models as an additional approach for achieving timely
notification.

46
Table 6. Values for qPCR in marine and fresh waters.
Element
Estimated Illness Rate
(NGI): 36/1,000 primary
contact recreators
OR
Estimated Illness Rate
(NGI): 32/1,000 primary
contact recreators
Magnitude Magnitude
GM
(cce per
100 mL)
STV
(cce per
100 mL)
GM
(cce per
100 mL)
STV
(cce per
100 mL)
qPCRa
470 2,000 300 1,280
Duration and Frequency: The waterbody GM should not be greater than the selected
GM magnitude in any 30-day interval. There should not be greater than a 10 percent
excursion frequency of the selected STV magnitude in the same 30-day interval. a
EPA Enterococcus spp. Method 1611 for qPCR (U.S. EPA, 2012b).
6.0 Tools to Support States and Tribes in Evaluating and Managing Recreational Waters
and for Considering Alternative Water Quality Criteria
EPA’s implementing regulations for §303 of the CWA provide that “states must adopt those
WQC that protect the designated use. Such criteria must be based on sound scientific rationale
and must contain sufficient parameters or constituents to protect the designated use” (40 CFR
§131.11(a)). EPA’s regulation stated in 40 CFR §131.11(b)(1) provides that “In establishing
criteria, states should (i) Establish numerical values based on (i) 304(a) Guidance; or (ii) 304(a)
Guidance modified to reflect site-specific conditions; or (iii) Other scientifically defensible
methods.” WQS can be established for waterbodies or a portion of a waterbody and therefore
they could be established for a specific site. A “site” may be a beach, a waterbody, a particular
watershed, or a larger area (such as a state) that is shown to have uniform water quality
characteristics throughout. When EPA reviews state WQS for approval or disapproval under the
CWA, EPA must ensure that the WQC in the standard (regardless of whether they are “site-
specific”) are scientifically defensible and protective of the designated use.
The tools discussed in this section fall into two main categories: (1) tools that states can use to
further evaluate and manage their waterbodies (see section 6.1); and (2) tools that can be used by
states in the development of WQC that differ from EPA’s recommended criteria (“alternative
criteria”) (see section 6.2). Alternative criteria could be developed on a site-specific basis, or
they could be developed using different indicators and analytical methods. State WQS including
alternative criteria would need to be scientifically defensible and protective of the use. Because
some alternative criteria for primary contact recreation could be based in part on assumptions
regarding the current state of a watershed such as current land uses, they should be revisited no
less frequently than triennially to ensure the site-specific criteria remain protective of the primary
contact recreation use. This section does not provide details on how to implement these tools.
Rather, detailed information on these tools will be provided in upcoming TSM.
The tools discussed below (and the corresponding subsections) include: (1) sanitary surveys
(section 6.1.1); (2) predictive models (section 6.1.2); (3) epidemiological studies (section 6.2.1);
(4) QMRA (section 6.2.2); and (5) approaches for developing criteria using alternative fecal
indicators and/or methods (section 6.2.3).

47
6.1 Tools for Evaluating and Managing Recreational Waters
EPA recognizes that advancements have been made since the publication of the 1986 criteria in
the area of managing recreational waters. This section discusses tools that states can use to
further evaluate and manage their waterbodies, which can aid in identifying days of poor water
quality on a site-specific basis. Specifically, this section discusses the use of sanitary surveys as a
tool for identifying sources of fecal contamination and the use of predictive models for timely
beach notification. EPA encourages the use of sanitary surveys by beach managers to better
understand and potentially control sources of fecal contamination and pathogens. EPA also
encourages the use of predictive models to supplement a sound beach notification program.
Predictive modeling has the potential to identify days of poor water quality in time to inform the
public of the potential risks. Together, the tools for evaluating and managing waters in this
section could be used by a state or locality to assess and communicate the risks associated with
fecally contaminated recreational waters. These tools would not be part of the adopted WQS and
do not result in different numerical criteria values.
6.1.1 Sanitary Survey
Water quality managers often use sanitary surveys to evaluate waters for fecal contamination
potential and to prioritize clean-up and remediation efforts. Sanitary surveys involve collecting
information about the surrounding watershed for the purpose of cataloging physical conditions
that may influence water quality in a watershed or at a beach. A sanitary survey is a detailed
process that compiles information on pollution sources (such as streams or stormwater outfalls),
physical features on or near a site, land use in adjacent areas and in the watershed that drains to
the site, and other information that could regularly influence water quality. Additional
observations may include the presence or absence of sanitary facilities or the nature of existing
management activities (such as beach cleaning). Molecular source tracking tools may also be
useful in verifying the results of the sanitary survey by confirming the presumed sources of fecal
contamination in the watershed.
A sanitary survey collects information that relates to the specific conditions at a site at a
particular time. Sanitary surveys are a snapshot of the conditions in a waterbody, which can
change due to factors including those listed above. Sanitary surveys help state and local water
quality managers and public health officials identify sources of fecal contamination, assess the
magnitude of the contamination, and designate priority locations for water testing. Observations
taken daily or at the time of water quality sampling can not only assist managers in evaluating
water quality conditions (such as, turbid water conditions, rainfall, source flow), but sanitary
survey data and measured FIB densities can be used to develop models to predict water quality.
Other information such as molecular source tracking and watershed information may be needed
to effectively delineate sources within the watershed.
Information on EPA’s sanitary survey approach is available at:
http://water.epa.gov/type/oceb/beaches/sanitarysurvey_index.cfm. EPA plans to include
additional information on developing and using sanitary surveys in TSM.

48
6.1.2 Predictive Models
EPA recognizes that, at some locations and under some conditions, use of culturable or
molecular enumeration methods, such as qPCR, are not feasible or are unlikely to provide timely
information for making a same-day beach notification decision (i.e., in locations where water
samples cannot be transported to laboratories for analysis in a timely manner). This section
describes predictive modeling, an approach that may supplement water quality monitoring results
to allow for timely beach notification decisions. Typically, states would use site-specific
predictive models, such as statistical models, rainfall threshold levels, or notification protocols
(U.S. EPA, 2010h, 2010i), to supplement monitoring using culture-based methods.
Predictive models are currently used in areas such as the Great Lakes and have proven to be an
effective means of implementing beach notification programs. These models draw on existing
culture-based monitoring data, are inexpensive to use, and allow for rapid water quality
management decisions (U.S. EPA, 2010h, 2010i).
Predictive modeling tools fall into the following categories: statistical regression models,
rainfall-based notifications, decision trees or notification protocols, deterministic models, and
combinations of tools. There are various considerations for developing and selecting predictive
models, and each has its own set of challenges (Boehm et al., 2007). To be effective, these
models should reflect site-specific conditions (i.e., inter-seasonal variations). Development of
predictive models typically requires monitoring data for establishing and maintaining statistical
relevance.
EPA conducted research and published a two-volume report to advance the use of predictive
models (U.S. EPA, 2010h, 2010i). Volume I summarizes the basic concepts for developing
predictive tools for coastal and non-coastal waters (U.S. EPA, 2010h). Volume II provides the
results of EPA’s research on the development of statistical models at research sites. It also
presents Virtual Beach, a software package designed to build statistical multivariate linear
regression predictive models (U.S. EPA, 2010i). EPA is expanding the Virtual Beach tool to
include other statistical approaches. Beyond these Virtual Beach improvements, other efforts,
such as linking watershed and statistical models, Cyterski's temporal synchronization approach
to incorporate time lags, and process-based transformations are being pursued to improve
predictive modeling efforts. More information on developing and using predictive models for
water quality management purposes will be provided in upcoming TSM.
6.2 Tools for Developing Alternative Criteria
States could adopt site-specific alternative criteria to reflect local environmental conditions and
human exposure patterns. An alternative WQS may involve the adoption of different numerical
value(s) that are based on: (1) an alternative health relationship derived using epidemiology with
or without QMRA; (2) QMRA results to determine water quality values associated with a
specific illness rate; or (3) a different indicator/method combination. EPA recommends that these
alternative criteria reflect the same risk management decision regarding illness rate, as discussed
in section 4.0. Such alternative criteria may be adopted into a state WQS provided that the

49
resulting site-specific WQS are scientifically defensible, protective of the use, and reviewed and
approved by EPA under CWA §303(c).
6.2.1 Epidemiological Studies
Recreational water epidemiological studies describe the risks associated with exposure to fecal
contamination as measured by FIB. Epidemiological studies with or without QMRA could be
used to develop an alternative health relationship for a waterbody. This alternative health
relationship could be used to develop site-specific alternative criteria.
EPA’s NEEAR epidemiological study were conducted in water primarily impacted human fecal
contamination, with the exception of one site that was impacted by urban runoff (U.S. EPA,
2010a; Wade et al., 2006, 2008, 2010). Statistically significant associations between water
quality, as determined using EPA’s Enterococcus spp. qPCR Method 1611 (U.S. EPA, 2012b),
and reported GI illness were observed in the temperate marine water and fresh water WWTP-
impacted beaches. Other agencies have also conducted recreational water epidemiological
studies. For example, epidemiological studies of recreational water exposures have been
conducted recently in Southern California (Colford et al., 2012), Southern Florida (Fleming,
2006; Sinigalliano, 2010), and Ohio (Marion et al., 2010).
Several factors can influence the potential epidemiological relationship between indicator density
and relative human health risk. Some of the potentially important factors include the source of
fecal contamination, age of the fecal contamination, solar radiation, water salinity, turbidity,
dissolved organic matter, water temperature, and nutrient content. Additionally, numerous
factors also affect the occurrence and distribution of FIB and pathogens, including but not
limited to: predation of bacteria by other organisms; differential interactions between microbes
and sediment, including the release and resuspension of bacteria from sediments in the water
column; and differential environmental effects on indicator organisms versus pathogens (U.S.
EPA, 2010a; WERF, 2009).
States or local agencies may choose to conduct epidemiological studies in their waterbodies and
use the results from those studies to derive alternative criteria, site-specifically. To derive
scientifically defensible alternative WQC for adoption into state standards, ideally the
epidemiological studies should be rigorous, comparable to those used to support the 2012
RWQC, and peer-reviewed. However, smaller scale epidemiological studies may also provide a
scientifically defensible foundation for alternative criteria. Additionally, QMRA (see section
6.2.2) has been identified as potentially useful for developing alternative criteria by enhancing
the interpretation and application of new or existing epidemiological data (Boehm et al., 2009;
Dorevitch et al., 2011). QMRA can supplement new or existing epidemiological results by
characterizing various exposure scenarios, interpreting potential etiological drivers for the
observed epidemiological results, and accounting for differences in risks posed by various types
of FIB sources.
Epidemiological studies are resource intensive and logistically difficult, although the results can
provide the data necessary for a scientifically defensible basis to allow the adoption of WQS
based on fecal indicator/methods that are not part of EPA’s national §304(a) recommendations.
Such studies may also support the development and adoption of alternative criteria based on
50
different health endpoints, such as respiratory illnesses, than EPA has used in its current
recommendations (i.e., GI illnesses). When the studies demonstrate a statistically significant
correlation between levels of water quality measured using particular FIB(s) and adverse health
outcomes, they may be scientifically defensible and, as such, could be used to develop and adopt
alternative criteria.
The epidemiological information underlying the recommended 2012 RWQC used a PC study
design. If a state wishes to develop alternative criteria using their own epidemiological studies,
EPA advises that the studies also be of the PC design to facilitate the interpretation of the
alternative health relationship and potential resulting alternative criteria. EPA will provide
additional information on the use of epidemiological studies in development of alternative
criteria in upcoming TSM.
6.2.2 Quantitative Microbial Risk Assessment
QMRA is a formal process, analogous to chemical risk assessment, of estimating human health
risks due to exposures to selected infectious pathogens (Haas et al., 1999; NRC, 1983). To the
greatest possible extent, the QMRA process should include the evaluation and consideration of
quantitative information; however, qualitative information is also used when appropriate (WHO,
1999). In general, QMRA can be initiated for a variety of reasons, including but not limited to,
the following:
To assess the potential for human risk associated with exposure to a known pathogen;
To determine critical points for control, such as watershed protection measures;
to evaluate specific treatment processes to reduce, remove, or inactivate various
pathogens;
To predict the consequences of various management options for reducing risk;
to determine appropriate criteria (regulatory) levels that will protect individuals and/or
populations to a specified risk level or range;
To identify and prioritize research needs; and
To assist in interpretation of epidemiological investigations.
QMRA methodologies have been applied to evaluate and manage pathogen risks for a range of
scenarios, including those from food, sludge/biosolids, drinking water, recycled water, and
recreational waters. Moreover, chemical risk assessment in general has been used extensively by
EPA for decades to establish human health criteria for a wide range of pollutants in water and
other media, and QMRA specifically has been used to inform EPA’s policy making for
microbiological pollutants in drinking water and biosolids, and by other U.S. and international
governmental agencies (such as, U.S. Department of Agriculture, U.S. Food and Drug
Administration, and WHO) to protect public health from exposure to microbial pollutants in food
and water.
Although EPA believes the 2012 RWQC are appropriate for waterbodies impacted by all
sources, QMRA can be used to develop alternative site-specific criteria, where sources are
characterized predominantly as nonhuman or nonfecal (U.S. EPA, 2009b). EPA’s research
indicates that understanding the predominant source of fecal contamination could help

51
characterize the human health risks associated with recreational water exposure. Various
epidemiological investigations, including EPA’s have documented human health effects in
waters impacted by human fecal contamination. QMRA studies have demonstrated that the
potential human health risks from human and nonhuman fecal sources could be different due to
the nature of the source, the type and number of pathogens from any given source, as well as
variations in the co-occurrence of pathogens and fecal indicators associated with different
sources (Roser et al., 2006; Schoen and Ashbolt, 2010; Soller et al., 2010b; Till and McBride,
2004; WERF, 2011). Additional information and case studies of QMRA for recreational waters
will be provided in upcoming TSM.
Further, research demonstrates that swimming-associated illnesses are caused by different
pathogens, which depend on the source of fecal contamination. For example, in human-impacted
recreational waters, human enteric viruses appear to cause a large proportion of illnesses (Soller
et al., 2010a). In recreational waters impacted by gulls and agricultural animals such as cattle,
pigs, and chickens, bacteria and protozoa are the etiologic agents of concern (Roser et al., 2006;
Schoen and Ashbolt, 2010; Soller et al., 2010b). The relative level of predicted human illness in
recreational waters impacted by nonhuman sources can also vary depending on whether the
contamination is direct or via runoff due to a storm event (U.S. EPA, 2010g). EPA is developing
TSM for QMRA to assist states in developing site-specific criteria to account for local scale,
nonhuman sources that are protective of the designated use of primary contact recreation.
To derive site-specific criteria that are considered scientifically defensible and protective of the
designated use, QMRA studies should be well documented, follow accepted practices, and rely
on scientifically defensible data. A sanitary characterization can provide detailed information on
the source(s) of fecal contamination in a waterbody to determine whether the predominant source
is human or nonhuman. EPA developed a QMRA-specific sanitary survey application, which
could be included in a sanitary characterization, to capture information directly applicable to a
QMRA. This sanitary characterization process will be described in upcoming QMRA TSM.
EPA’s QMRA framework can also be useful for informing human health relationships with
alternative FIBs (MFE, 2003; Viau et al., 2011) and may help to clarify epidemiological results
in scenarios where waterbodies are impacted by nonhuman sources or the epidemiological results
are inconclusive (see section 6.2.1).
6.2.3 Alternative Indicators or Methods
EPA anticipates that scientific advancements will provide new technologies for enumerating
fecal pathogens or FIB. New technologies may provide alternative ways to address
methodological considerations, such as rapidity, sensitivity, specificity, and method
performance. As new or alternative indicator and/or enumeration method combinations are
developed, states may want to consider using them to develop alternative criteria for adoption in
WQS.
Previously, EPA has used the evaluation of multiple indicators and enumeration methods to
describe a common level of water quality. For example, the derivation of the 1986 criteria values
was fundamentally based on the comparison of multiple indicators: fecal coliform, enterococci,

52
and E. coli. In those specific cases, comparisons were made among membrane filtration methods
specific to each target organism. Another example of this occurred when EPA approved the use
of the IDEXX-based methods for the detection of enterococci and E. coli. In this comparison,
results from a membrane-filtration method were compared to another method that relied on
substrate-utilization and MPN enumeration. Rapid methods, such as E. coli enumerated by
qPCR, have already been evaluated against culturable methods and demonstrated utility on a
site-specific basis (Lavender and Kinzelman, 2009).
Some examples of new enumeration methods for FIB include: immunomagnetic
separation/adenosine triphosphate (IMS/ATP), propidium monoazide (PMA) qPCR, reverse
transcriptase (RT) qPCR, covalently linked immunomagnetic separation/adenosine triphosphate
(COV-IMS-ATP), and transcription mediated amplification (TMA-RNA). New methods and
additional improvements to currently available methods, platforms and chemistries may also be
developed in the future.
Examples of possible alternative indicators include, but are not limited to: Bacteroidales,
Clostridium perfringens, human enteric viruses, and coliphages. These possible alternative
indicator organisms could be used with new methodologies or methodologies similar to those
recommended by the 2012 RWQC. For example, in one case, Bacteroidales measured by qPCR
were highly correlated with Enterococcus spp. and E. coli when either culture-based methods or
qPCR methods were used (WERF, 2011). The pathogens norovirus GI and GII have also been
shown to be predictors of the presence of other pathogens such as adenovirus measured by qPCR
(WERF, 2011).
If a state adopts WQS using alternative indicator/method combinations, EPA will review those
standards, including any technical information submitted to determine whether such standards
are scientifically defensible and protective of the primary contact recreation use. To facilitate
consideration of such standards, states may gather water quality data over one or more
recreational seasons for the indicator/method recommended in the 2012 RWQC and the proposed
alternative indicator/method combination. A robust relationship need not be established between
EPA’s recommendation and alternative indicator(s) for the whole range of indicator densities
(U.S. EPA, 2010e). It is, however, important that a consistent and predictable relationship exist
between the enumeration methods and an established indicator/health relationship in the range of
the recommended criteria. EPA will provide information on demonstrating the relationship
between two indicator/method combinations in upcoming TSM.
53
References
ASTM International (formerly known as American Society for Testing and Materials (ASTM)).
2012. Standard Practice for Determining Microbial Colony Counts from Waters Analyzed by
Plating Methods. Designation: D5465 – 93 (Reapproved 2012).
Bartram, J., Rees, G., editors. 2000. Monitoring bathing waters. Lopdon: E & F N Spon.
http://www.who.int/water_sanitation_health/bathing/monbathwat.pdf
Boehm, A.B. 2007. Enterococci concentrations in diverse coastal environments exhibit extreme
variability. Environ. Sci. Technol., 41: 8227-8232.
Boehm, A.B., Whitman, R.L., Nevers, M.B., Hou, D. Weisberg, S.B. 2007. Nowcasting
Recreational Water Quality, in Statistical Framework for Recreational Water Quality Criteria and
Monitoring (ed L. J. Wymer), John Wiley and Sons, Ltd, Chichester, UK.
Boehm, A.B., Ashbolt, N., Colford, J., Dunbar, L., Fleming, L., Gold, M., Hansel, J., Hunter,
P.R., Ichida, A., McGee, C., Soller, J.A., Weisberg, S.B. 2009. A Sea Change Ahead for
Recreational Water Quality Criteria. Journal of Water and Health 7(1): 9-20.
Byappanahalli, M.N., Roll, B.M., Fujioka, R.S. 2012. Evidence for Occurrence, Persistence, and
Growth Potential of Escherichia coli and Enterococci in Hawaii’s Soil Environments. Microbes
and Environments, 27(2): 164-170.
Cabelli, V.J., Dufour, A.P., McCabe, L.J., Levin, M.A. 1982. Swimming Associated
Gastroenteritis and Water Quality. American Journal of Epidemiology 115: 606-616.
Cabelli, V.J. 1983. Health Effects Criteria for Marine Recreational Waters, Technical Report.
U.S. Environmental Protection Agency, Health Effects Research Laboratory: Research Triangle
Park, NC. EPA 600/1-80-031.
Calderon, R.L., Mood, E.W., Dufour, A.P. 1991. Health effects of swimmers and nonpoint
sources of contaminated water. International Journal of Environmental Health Research 1: 21-31.
Census 2010. Table 1. Annual Estimates of the Resident Population by Sex and Five-Year Age
Groups for the United States: April 1, 2000 to July 1, 2009 (NC-EST2009-01) Source: U.S.
Census Bureau, Population Division. Release Date: June 2010.
CDC 1993. Moore, A.C., Herwaldt, B.L., Craun, G.F., Calderon, R.L., Highsmith, A.K.,
Jurankek, D.D. Surveillance for Waterborne Disease Outbreaks - United States, 1991-1992.
Morbidity and Mortality Weekly Report 42: 1-22.
CDC 1996. Kramer, M.H., Herwaldt, B.L., Craun, G.F., Calderon, R.L., Juranek, D.D.
Surveillance for Waterborne-Disease Outbreaks - United States, 1993-1994. Morbidity and
Mortality Weekly Report 45: 1-33.

54
CDC 1998. Levy, D.A., Bens, M.S., Craun, G.F., Calderon, R.L., aHerwaldt, B.L. Surveillance
for Waterborne-Disease Outbreaks - United States, 1995-1996. Morbidity and Mortality Weekly
Report 47: 1-33.
CDC 2000. Barwick, R.S., Levy, D.A., Craun, G.F., Beach, M.J., Calderon, R.L. Surveillance
for Waterborne Disease Outbreaks - United States, 1997-1998. Morbidity and Mortality Weekly
Report 49: 1-35.
CDC 2002. Lee, S.H., Levy, D.A., Craun, G.F., Beach, M.J., Calderon, R.L. Surveillance for
Waterborne-Disease Outbreaks - United States, 1999-2000. Morbidity and Mortality Weekly
Report 51: 1-48.
CDC 2004. Yoder, J.S., Blackburn, B.G., Craun, G.F., Hill, V., Levy, D.A., Chen, N., Lee, S.H.,
Calderon, R.L., Beach, M.J. Surveillance for Waterborne-Disease Outbreaks Associated with
Recreational Water - United States, 2001-2002. Morbidity and Mortality Weekly Report 53: 1-
22.
CDC 2006. Dziuban, E.J., Liang, J.L., Craun, G.F., Hill, V., Yu, P.A., Painter, J., Moore, M.R.,
Calderon, R.L., Roy, S.L., Beach, M.J. Surveillance for Waterborne Disease and Outbreaks
Associated with Recreational Water - United States, 2003-2004. Morbidity and Mortality
Weekly Report 55: 1-30.
CDC 2008. Yoder, J.S., Hlavsa, M.C., Craun, G.F., Hill, V., Roberts, V., Yu, P.A., Hicks, L.A.,
Alexander, N.T., Calderon, R.L., Roy, S.L., Beach, M.J. Surveillance for Waterborne Disease
and Outbreaks Associated with Recreational Water Use and Other Aquatic Facility-Associated
Health Events - United States, 2005-2006. Morbidity and Mortality Weekly Report 57: 1-38.
57: 1-38.
Cheung, W.H.S., Chang, K.C.K., Hung, R.P.S., Kleevens, J.W.L. 1990. Health Effects of Beach
Water Pollution in Hong Kong. Epidemiology and Infection 105(1): 139-162.
Colford, J.M., Jr., Rees, J.R., Wade, T.J., Khalakdina, A., Hilton, J.F., Ergas, I.J., Burns, S.,
Benker, A., Ma, C., Bowen, C., Mills, D.C., Vugia, D.J., Juranek, D.D., Levy, D.A. 2002.
Participant Blinding and Gastrointestinal Illness in a Randomized, Controlled Trial of an In-
Home Drinking Water Intervention. Emerging Infectious Diseases 8(1): 29-36.
Colford, J.M., Jr., Wade, T.J., Schift, K.C., Wright, C., Griffith, J.F., Sandhu, S.K., Weisberg,
S.B. 2005. Recreational Water Contact and Illness in Mission Bay, California. Southern
California Coastal Water Research Project, Technical Report 449.
Colford, J.M., Jr., Wade, T.J., Schiff, K.C., Wright, C.C., Griffith, J.F., Sandhu, S.K., Burns, S.,
Sobsey, M., Lovelace, G., and Weisberg, S.B., 2007. Water Quality Indicators and the Risk of
Illness at Beaches with Nonpoint Sources of Fecal Contamination. Epidemiology 18(1): 27-35.
Colford, J., Schiff, K.C., Griffith, J.F., Yau, V., Arnold, B.F., Wright, C.C., Gruber, J.S., Wade,
T.J., Burns, S., Hayes, J., McGee, C., Gold, M., Cao, Y., Noble, R.T., Haugland, R., Weisberg,
55
S.B. 2012. Using rapid indicators for Enterococcus to assess the risk of illness after exposure to
urban runoff contaminated marine water. Water Research, 46: 2176-2186.
Corbett, S.J., Rubin, G.L., Curry, G.K., Kleinbaum, D.G. and the Sydney Beach Users Study
Advisory Group 1993. The Health Effects of Swimming at Sydney Beaches. American Journal
of Public Health 83(12): 1701-1706.
Craig, D.L., Fallowfield, H.J., Cromar, N.J. 2003. Effectiveness of guideline faecal indicator
organism values in estimation of exposure risk at recreational coastal sites. Water Science and
Technology 47(3): 191-198.
Craun, G.F., Calderon, R.L., Craun, M.F. 2005. Outbreaks associated with recreational water in
the United States. International Journal of environmental Health Research. 15(4): 243-262.
Davies, C.M., Long, J.A.H., Donald, M., Ashbolt, N.J. 1995. Survival of fecal microorganisms
in marine and fresh water sediments. Applied and Environmental Microbiology, 61(5): 1888-
1896.
Dorevitch, S., Ashbolt, N.J., Ferguson, C.M., Fujioka, R., McGee, C.D., Soller, J.A., Whitman,
R.L. 2010. Meeting Report: Knowledge and Gaps in Developing Microbial Criteria for Inland
Recreational Waters. Environmental Health Perspectives 118(6): 871-876.
Dorevitch, S., Doi, M., Hsu, F.C., Lin, K.T., Roberts, J.D., Liu, L.C., Gladding, R., Vannoy, E.,
Li, H., Javor, M., Scheff, P.A. 2011. A comparison of rapid and conventional measures of
indicator bacteria as predictors of waterborne protozoan pathogen presence and density. Journal
of Environmental Monitoring Aug 8.
Dufour, A.P. 1984. Health Effects Criteria for Fresh Recreational Waters. EPA 600/1-84-004.
Dufour, A.P., Evans, O., Behymer, T., and Cantu, R. 2006. Water ingestion during swimming
activities in a pool: a pilot study. J Water Health 4(4): 425-430.
Dufour, A.P., Schaub, S. 2007. The Evolution of Water Quality Criteria in the United States
1922-2003, in Statistical Framework for Recreational Water Quality Criteria and Monitoring (ed
L. J. Wymer), John Wiley and Sons, Ltd, Chichester, UK.
EP/CEU (European Parliament/Council of the European Union) 1976. Directive 76/100/EEC of
the European Parliament and of the Council of 8 December 1975 concerning the quality of
bathing water. Available at: http://eur-
lex.europa.eu/LexUriServ/LexUriServ.do?uri=CELEX:31976L0160:EN:NOT
EP/CEU 2006. Directive 2006/7/EC of the European Parliament and of the Council of 15
February 2006 Concerning the Management of Bathing Water Quality and Repealing Directive
76/160/EEC. Official Journal of the European Union L64: 31-51. Available at:
http://europa.eu.int/eurlex/lex/LexUriServ/site/en/oj/2006/l_064/l_06420060304en00370051.pdf
56
European Commission-Epibathe, 2009. EpiBathe Report.
Ferley, J.P., Zmirou, D., Balducci, F., Baleux, B., Fera, P., Larbaigt, G., Jacq, E., Moissonnier,
B., Blineau, A., and Boudot, J. 1989. Epidemiological Significance of Microbiological Pollution
Criteria for River Recreational Waters. International Journal of Epidemiology 18(1): 198-205.
FL PIRG vs. EPA 2007. Florida Public Interest Research Group Citizen Lobby, Inc., et al. v.
U.S. EPA, et al., No. 4:02-cv-00408-WS-WCS (N.D. Fla. Feb 15, 2007) (Order Granting EPA's
Motion for Summary Judgment based on EPA's July 6, 2005 Determination on Referral
Regarding Florida Administrative Code Chapter 62-303, Identification of Impaired Surface
Waters).
Fleisher, J.M., Jones, F., Kay, D., Stanwell-Smith, R., Wyer, M., Morano, R. 1993. Water and
non-water-related risk factors for gastroenteritis among bathers exposed to sewage-contaminated
marine waters. International Journal of Epidemiology 22(4): 698-708.
Fleisher, J.M., Kay, D., Wyer, M.D., Godfree, A.F. 1998. Estimates of the Severity of Illnesses
Associated with Bathing in Marine Recreational Waters Contaminated with Domestic Sewage.
International Journal of Epidemiology 27(4): 722-726.
Fleming, L.E., Solo-Gabriele, H.M., Fleisher, J.M., Goodwin, K., Backer, L., Elmir, S., Wang, J.
2006. The Pilot Epidemiologic Assessment of Microbial Indicators for Monitoring Recreational
Water Quality in Marine Sub/Tropical Environments.
Fleming, L.E., Solo-Gabriele, H., Fleisher, J.M., Elmir, S., Sinigalliano, C., Plano, L., and Wang,
J. 2008. Final Report on the Pilot Epidemiologic Assessment of Microbial Indicators for
Monitoring Recreational Water Quality in Marine Sub/Tropical Environments. The NSF NIEHS
Oceans and Human Health Center, University of Miami.
Francy, D.S. 2009. Use of predictive models and rapid methods to Nowcast bacteria levels at
coastal beaches. Aquatic Ecosystem Health and Management 12(2): 177-182.
Frick, W.E., Z. Ge, Zepp, R.G. 2008. Nowcasting and Forecasting Concentrations of Biological
Contaminants at Beaches: A Feasibility and Case Study. Environmental Science and Technology
42(13): 4818-4824.
Ge, Z. Frick, W.E. 2009. Time-Frequency Analysis of Beach Bacteria Variations and its
Implication for Recreational Water Quality Modeling. Environmental Science and Technology
43(4): 1128-1133.
Griffith, J.F., Weisberg, S.B. 2011. Challenges in Implementing New Technology for Beach
Water Quality Monitoring: Lessons from a California Demonstration Project. Marine
Technology Society Journal 45: 65-73.
Haas, C.N., Rose, J., Gerba, C.P. 1999. Quantitative Microbial Risk Assessment. John Wiley and
Sons, Ltd, New York, NY.

57
Haile, R.W., Witte, J.S., Gold, M., Cressey, R., McGee, C., Millikan, R.C., Glasser, A., Harawa,
N, Ervin, C., Harmon, P., Harper, J., Dermand, J., Alamillo, J., Barrett, K., Nides, M., Wang,
G.Y. 1999. The Health Effects of Swimming in Ocean Water Contaminated by Storm Drain
Runoff. Epidemiology 10(4): 355-363.
Harrington J, Wilcox D, Giles P, Ashbolt N, Evans J, Kirton C. 1993. The health of Sydney
surfers: an epidemiological study. Water Science Technology 27(3-4): 175-182.
Haugland, R.A., Siefring, S.C., Wymer, L.J., Brenner, K.P., Durfour, A. 2005. Comparison of
Enterococcus measurements in fresh water at two recreational beaches by quantitative
polymerase chain reaction and membrane filter culture analysis. Water Research 39: 559-568.
Haugland, R.A., Siefring, S., Lavender, J., Varma, M. 2012. Influences of sample interference
and interference controls on quantification of enterococci fecal indicator bacteria in surface water
by the qPCR method. Water Research
http://dx.doi.org/10.1016/j.watres.2012.08.017.
Kay, D., Fleisher, J.M., Salmon, R.L., Jones, F., Wyer, M.D., Godfree, A.F., Zelenauch-
Jacquotte, Z., Shore, R. 1994. Predicting Likelihood of Gastroenteritis from Sea Bathing: Results
from Randomised Exposure. Lancet 344(8927): 905-909.
Kay, D., Bartram, J., Prüss, A., Ashbolt, N., D. Wyer, M.D., Fleisher, J.M., Fewtrell, L., Rogers,
A., Rees, G. 2004. Derivation of numerical values for the World Health Organization guidelines
for recreational waters, Water Research38(5): 1296-1304.
Kinzelman, J.L., Bushon, R.N., Dorevitch, S., Noble, R.T. 2011. Comparative evaluation of
molecular and culture methods for fecal indicator bacteria for use in inland recreational waters.
WERF PATH7R09.
Lavender, J. S., Kinzelman, J.L. 2009. A cross comparison of qPCR to agar-based or defined
substrate test methods for the determination of Escherichia coli and enterococci in municipal
water quality monitoring programs. Water Research 43: 4967-4979.
Marion, J.W., Lee, J., Lemeshow, S., Buckley, T.J. 2010. Association of Gastrointestinal Illness
and Recreational Water Exposure at an Inland U.S. Beach. Water Research 44(16): 4796-4804.
McBride, G.B., Salmond, C.E., Bandaranayake, D.R., Turner, S.J., Lewis, G.D., Till, D.G. 1998.
Health effects of marine bathing in New Zealand. International Journal of Environmental Health
Research 8(3): 173-189.
MFE (Ministry for the Environment, New Zealand) 2003. Microbiological Water Quality
Guidelines for Marine and Fresh water Recreational Areas. Available
at:http://www.mfe.govt.nz/publications/water/microbiological-quality-jun03/microbiological-
quality-jun03.pdf
58
MNHW (Minister of National Health and Welfare) 1992. Guidelines for Canadian Drinking
Water Quality. Fifth Edition. Canadian Government Publishing Center: Ottawa, Canada.
NRC (National Research Council) 1983. Risk Assessment in the Federal Government: Managing
the Process. National Research Council of the National Academies. National Academy Press:
Washington, DC.
Noble, R.T., Lee, I.M., Schiff, K.C. 2004. Inactivation of indicator micro-organisms from
various sources of faecal contamination in seawater and fresh water. Journal of Applied
Microbiology 96: 464-472.
Noble, R.T., Blackwood, A.D., Griffith, J.F., McGee, C.D., and Weisberg, S.B., 2010.
Comparison of Rapid Quantitative PCR-Based and Conventional Culture-Based Methods for
Enumeration of Enterococcus spp. and Escherichia coli in Recreational Waters. Applied and
Environmental Microbiology 76(22): 7437-7443.
Payment, P., Richardson, L., Siemiatycki, J., Dewar, R., Edrawrdes, M., Franco, E. 1991. A
Randomized Trial to Evaluate the Risk of Gastrointestinal Disease due to Consumption of
Drinking Water Meeting Current Microbiological Standards. American Journal of Public Health
81(6): 703-708.
Payment, P., Siemiatycki, J., Richardson, L., Renaud, G., Franco, E., Prévost, M. 1997. A
Prospective Epidemiological Study of Gastrointestinal Health Effects Due to the Consumption of
Drinking Water. International Journal of Environmental Health Research 7: 5-31.
Pond, K. 2005. Water Recreation and Disease Report: Plausibility of Associated Infections:
Acute Effects, Sequelae and Mortality. World Health Organization: Geneva, Switzerland.
Prieto, M.D., Lopez, B., Juanes, J.A., Revilla, J.A., Llorca, J., Delgado-Rodriguez, M., 2001.
Recreating in coastal waters: health risks associated with bathing in sea water. Journal of
Epidemiology and Community Health 5: 442-447.
Prüss, A. 1998. Review of Epidemiological Studies on Health Effects from Exposure to
Recreational Water. International Journal of Epidemiology 27(1): 1-9.
Roser, D. and N. Ashbolt. 2006. Microbial exposure assessment of an urban recreational lake: a
case study of the application of new risk-based guidelines. Water Science and Technology.
54:245-252.
Roy, S.L., DeLong, S.M., Stenzel, S.A., Shiferaw, B., Roberts, J.M., Khalakdina, A., Marcus, R.,
Segler, S.D., Shah, D.D., Thomas, S., Vugia, D.L., Zansky, S.M., Dietz, V., Beach, M.J., the
Emerging Infections Program FoodNet Working Group 2004. Risk Factors for Sporadic
Cryptosporidiosis Among Immunocompetent Persons in the United States from 1999 to 2001.
Journal of Clinical Microbiology 42(7): 2944-51.
Samadpour, M., Stewart, J., Steingart, K., Addy, C., Louderback, J., McGinn, M., Ellington, J.,

59
Newman, T. 2002. Laboratory investigation of an E. coli O157:H7 outbreak associated with
swimming in Battle Ground Lake, Vancouver, Washington. Journal of Environmental Health
64(10): 16-26.
Schoen, M.E., Ashbolt, N.J. 2010. Assessing Pathogen Risk to Swimmers at Non-Sewage
Impacted Recreational Beaches. Environmental Science and Technology 44(7): 2286-2291.
Seyfried, P.L., Tobin, R.S., Brown, N.E., and Ness, P.F., 1985. A Prospective Study of
Swimming-Related Illness I. Swimming-Associated Health Risk. American Journal of Public
Health 75(9):1068-1070.
Sinclair, R.G., Jones, E.L., Gerba, C.P. 2009. Viruses in recreational water-borne disease
outbreaks: a review. J Appl Microbiol 107(6): 1769-1780.
Sinigalliano, C.D., Fleisher, J.M., Gidley, M.L., Solo-Gabriele, H.M., Shibata, T., Plano, L.R.,
Elmir, S.M., Wanless, D., Bartkowiak, J., Boiteau, R., Withum, K., Abdelzaher, A.M., He, G.,
Ortega, C., Zhu, X., Wright, M.E., Kish, J., Hollenbeck, J., Scott, T., Backer, L.C., and Fleming,
L.E., 2010. Traditional and Molecular Analyses for Fecal Indicator Bacteria in Non-Point Source
Subtropical Recreational Marine Waters. Water Research 44(13): 3763-3772.
Soller, J.A., Bartrand, T., Ashbolt, N.J., Ravenscroft, J., Wade, T.J. 2010a. Estimating the
Primary Etiologic Agents in Recreational Fresh waters Impacted by Human Sources of Faecal
Contamination. Water Research 44(16): 4736-4747.
Soller, J.A., Schoen, M.E., Bartrand, T., Ravenscroft, J., Wade, T.J. 2010b. Estimated Human
Health Risks from Exposure to Recreational Waters Impacted by Human and Non-Human
Sources of Faecal Contamination. Water Research 44(16): 4674-4691.
Solo-Gabriele, H.M., Wolfert, M.A., Desmarais, T.R., Carol, J.P. 2000. Sources of Escherichia
coli in a coastal subtropical environment. Applied and Environmental Microbiology 66(1): 230-
237.
Stevenson, A.H. 1953. Studies of Bathing Water Quality and Health. American Journal of Public
Health 43: 429-538.
Till, D., McBride, G. 2004. Potential public health risk of Campylobacter and other zoonotic
waterborne infections in New Zealand. Chapter 12 in Waterborne Zoonoses: Identification,
causes and control. Cotruvo, J.A., Dufour, A., Rees, G., Bartram, J., Carr, R., Cliver, D.O.,
Craun, G.F., Fayer, R., Gannon, V.P.J., ed. 2004. World Health Organization (WHO). IWA
Publishing: London, UK.
USDA 2000. Waterborne Pathogens in Agricultural Watersheds. United States Department of
Agriculture, Natural Resources Conservation Service, Watershed Science Institute.
U.S. EPA 1976. Quality Criteria for Water. U.S. Environmental Protection Agency: Washington,
DC.

60
U.S. EPA 1978. Microbiological Methods for Monitoring the Environment: Water and Wastes.
U.S. Environmental Protection Agency, Office of Research and Development: Cincinnati, OH.
EPA 600-8-78-017.
U.S. EPA 1986. EPA’s Ambient Water Quality Criteria for Bacteria – 1986. U.S. Environmental
Protection Agency: Washington, DC. EPA440/5-84-002.
U.S. EPA. 1994. Water quality standards handbook: 2nd ed. EPA-823-B-94-005a,b. National
Technical Information Service, Springfield, VA.
U.S. EPA 2002a. Method 1600: Enterococci in Water by Membrane Filtration Using membrane-
Enterococcus Indoxyl-β-D-Glucoside Agar (mEI). Available at:
http://www.epa.gov/microbes/1600sp02.pdf
U.S. EPA 2002b. Method 1603: Escherichia coli (E. coli) in Water by Membrane Filtration
Using Modified Membrane-Thermotolerant Escherichia coli Agar (Modified mTEC). Available
at: http://www.epa.gov/microbes/1603sp02.pdf
U.S. EPA 2003. America’s Children and the Environment: Measures of Contaminants, Body
Burdens and Illnesses, 2nd
Edition. Available at:
http://yosemite1.epa.gov/ee/epa/eerm.nsf/vwGA/F042C8CE39DE432285256CD7006B8001
U.S. EPA 2004. Water Quality Standards for Coastal and Great Lakes Recreation Waters Rule
(BEACH Act). 69 FR 67217. November 16, 2004.
U.S. EPA 2007a. Report of the Expert Scientific Workshop on Critical Research Needs for the
Development of New or Revised Recreational Water Quality Criteria (Airlie Workshop). EPA-
823-R-07-006.
U.S. EPA 2007b. Critical Path Science Plan. EPA-823-R-08-002.
U.S. EPA 2009a. Review of Zoonotic Pathogens in Ambient Waters. EPA 822-R-09-002.
Available at:
http://water.epa.gov/scitech/swguidance/waterquality/standards/criteria/health/recreation/upload/
2009_07_16_criteria_recreation_zoonoticpathogensreview.pdf
U.S. EPA 2009b. Review of Published Studies to Characterize Relative Risks from Different
Sources of Fecal Contamination in Recreational Water, U.S. Environmental Protection Agency,
Office of Science and Technology: Washington, DC. EPA 822-R-09-001.
U.S. EPA 2009c. Fecal Indicator Organism Behavior in Ambient Waters and Alternative
Indicators for Tropical Regions, U.S. Environmental Protection Agency, Office of Science and
Technology: Washington, DC.
U.S. EPA 2010a. Report on 2009 National Epidemiologic and Environmental Assessment of

61
Recreational Water Epidemiology Studies (NEEAR 2010 - Surfside & Boquerón). EPA-600-R-
10-168. Available at: http://www.epa.gov/neear/files/Report2009v5_508comp.pdf
U.S. EPA 2010b. Comparison and Evaluation of Epidemiological Study Designs of Health
Effects Associated with Recreational Water Use.
U.S. EPA 2010c. A Study of the Various Parameters that Affect the Performance of the New
Rapid U.S. Environmental Protection Agency Quantitative Polymerase Chain Reaction (qPCR)
Method for Enterococcus Detection and Comparison with Other Methods and Pathogens in
Treated Wastewater Mixed with Ambient Water. EPA 600-R-10-149.
U.S. EPA 2010d. Evaluation of the Suitability of Individual Combinations of Indicators and
Methods for Different Clean Water Act Programs. EPA 823-R-10-004.
U.S. EPA 2010e. Effects of Holding Time, Storage, and the Preservation of Samples on Sample
Integrity for the Detection of Fecal Indicator Bacteria by Quantitative Polymerase Chain
Reaction. EPA/600/R-10/150. Available at:
http://water.epa.gov/scitech/swguidance/standards/criteria/health/recreation/upload/P16-Final-
Report.pdf
U.S. EPA 2010f. Applicability of Great Lakes NEEAR Dataset to Inland Recreational Water
Criteria; Summary of Key Studies. EPA-823-R1-0002.
U.S. EPA 2010g. Quantitative Microbial Risk Assessment to Estimate Illness in Fresh water
Impacted by Agricultural Animal Sources of Fecal Contamination. EPA 822-R-10-005.
Available at:
http://water.epa.gov/scitech/swguidance/standards/criteria/health/recreation/upload/P4-QMRA-
508.pdf
U.S. EPA 2010h. Predictive Tools for Beach monitoring Volume I: Review and Technical
Protocol. EPA-823-R-10-003. Available at:
http://water.epa.gov/scitech/swguidance/standards/criteria/health/recreation/upload/P26-Report-
Volume-I-Final_508.pdf
U.S. EPA 2010i. Predictive Modeling at Beaches Volume II: Predictive Tools for Beach
monitoring. EPA-600-R-10-176. Available at:
http://water.epa.gov/scitech/swguidance/standards/criteria/health/recreation/upload/P23-25-
Report-Volume-II-Final_508.pdf
U.S. EPA 2010j. Evaluation of Multiple Indicator Combinations to Develop Quantifiable
Relationships. EPA-822-R-10-004. Available at:
http://water.epa.gov/scitech/swguidance/standards/criteria/health/recreation/upload/P15-Report-
to-EPA-12-28-10.pdf
U.S. EPA 2011. Translation of 1986 Criteria Risk to Equivalent Risk Levels for Use with New
Health Data Developed Using Rapid Methods for Measuring Water Quality. In Preparation.

62
U.S. EPA 2012a. Water Quality Standards Handbook: Second Edition. EPA-823-B-12-002;
March 2012. Retrieved November 13, 2012 from
http://water.epa.gov/scitech/swguidance/standards/handbook/index.cfm
U.S. EPA 2012b. Method 1611: Enterococci in Water by TaqMan® Quantitative Polymerase
Chain Reaction (qPCR) Assay. EPA-821-R-12-008.
Valderrama, A.L., Hlavsa, M.C., Cronquist, A., Cosgrove, S., Johnston, S. P., Roberts, J.M.,
Stock, M.L., Xiao, L., Xavier, K., Beach, M.J. 2009. Multiple Risk Factors Associated with a
Large Statewide Increase in Cryptosporidiosis. Epidemiological Infections 137(12): 1781-8.
Viau, E.J.; Lee, D.; Boehm, A.B. 2011. Swimmer Risk of Gastrointestinal Illness from Exposure
to Tropical Coastal Waters Impacted by Terrestrial Dry-Weather Runoff. Environmental Science
and Technology 45: 7158-7165.
Von Schirnding, Y.E.R., Kfir, R., Cabelli, V., Franklin, L., Joubert, G. 1992. Morbidity among
bathers exposed to polluted seawater. South African Medical Journal 81:543-546.
Wade, T.J., Pai, N., Eisenberg, J.N.S., Colford, J.M., Jr. 2003. Do U.S. Environmental Protection
Agency Water Quality Guidelines for Recreational Waters Prevent Gastrointestinal Illness? A
Systematic Review and Meta-Analysis. Environmental Health Perspectives 111(8): 1102-1109.
Wade, T.J., Calderon, R.L., Sams, E., Beach, M., Brenner, K.P., Williams, A.H., Dufour, A.P.,
2006. Rapidly Measured Indicators of Recreational Water Quality Are Predictive of Swimming-
Associated Gastrointestinal Illness. Environmental Health Perspectives 114(1): 24-28.
Wade, T.J., Calderon, R.L., Brenner, K.P., Sams, E., Beach, M., Haugland, R., Wymer, L.,
Dufour, A.P. 2008. High Sensitivity of Children to Swimming-Associated Gastrointestinal
Illness – Results Using a Rapid Assay of Recreational Water Quality. Epidemiology 19(3): 375-
383.
Wade, T.J., Sams, E., Brenner, K.P., Haugland, R., Chern, E., Beach, M., Wymer, L., Rankin,
C.C., Love, D., Li, Q., Noble, R., Dufour, A.P. 2010. Rapidly Measured Indicators or
Recreational Water Quality and Swimming-Associated Illness at Marine Beaches: A Prospective
Cohort Study. Environmental Health 9: 66.
WERF 2009. Report on the Expert Scientific Workshop on Critical Research and Science Needs
for the Development of Recreational Water Quality Criteria for Inland Waters. PATH4W09.
WERF 2011. Final Report: Quantification of Pathogens and Sources of Microbial Indicators for
QMRA in Recreational waters. PATH2R08.
WHO 1999. Principles and Guidelines for the Conduct of Microbiological Risk Assessment,
CAC/GL-30. World Health Organization: Geneva, Switzerland. Available at:
http://www.who.int/foodsafety/publications/micro/cac1999/en/
63
WHO 2003. Guidelines for Safe Recreational Water Environments: Volume 1 Coastal and Fresh
Waters. Available at: http://www.who.int/water_sanitation_health/bathing/srwe1/en/
Wiedenmann, A., Krüger, P., Dietz, K., López-Pila, J.M., Szewzyk, R., Botzenhart, K. 2006. A
Randomized Controlled Trial Assessing Infectious Disease Risks from Bathing in Fresh
Recreational Waters in Relation to the Concentration of Escherichia coli, Intestinal Enterococci,
Clostridium perfringens, and Somatic Coliphages. Environmental Health Perspectives 114(2):
228-236.
Wyer M.D., Kay, D., Fleisher, J.M., Salmon, R.L., Jones, F., Godfree, A.F., Jackson, G., Rogers.
A. 1999. An experimental health-related classification for marine waters. Water Research 33:
715–22.
Xue, J., Zartarian, V., Moya, J., Freeman, N., Beamer, P., Black, K., Tulve, N., Shalat, S. 2007.
Meta-Analysis of Children’s Hand-to-Mouth Frequency Data for Estimating Nondietary
Ingestion Exposure. Risk Analysis 27(2): 411-420.
Zmirou, N., Pena, L., Ledrans, M., Leterte, A. 2003. Risks Associated with the Microbiological
Quality of Bodies of Fresh and Marine Water Used for Recreational Purposes: Summary
Estimates Based on Published Epidemiological Studies. Archives of Environmental Health


