EORTC STBSG
28
EORTC – ISG - AGITG Prognostic factors for initial and late resistance to Imatinib in patients with advanced GIST Martine Van Glabbeke, Jaap Verweij, Paolo G. Casali, John Zalcberg, Axel Le Cesne, Peter Reichardt, Jean- Yves Blay, Marcus Schlemmer, Allan T. van Oosterom, Pancras Hogendoorn, Konstantin Stoitchkov, Ian R. Judson EORTC EORTC STBSG STBSG
-
Upload
paula-burton -
Category
Documents
-
view
19 -
download
0
description
EORTC STBSG. - PowerPoint PPT Presentation
Transcript of EORTC STBSG

EORTC – ISG - AGITG
Prognostic factors for
initial and late resistance to Imatinib
in patients with advanced GIST
Martine Van Glabbeke, Jaap Verweij, Paolo G. Casali, John Zalcberg,
Axel Le Cesne, Peter Reichardt, Jean-Yves Blay, Marcus Schlemmer,
Allan T. van Oosterom, Pancras Hogendoorn, Konstantin Stoitchkov,
Ian R. Judson
EORTCEORTCSTBSGSTBSG

EORTC – ISG - AGITG
Background (1)
Progression free survival
0 3 6 9 12 15 18 21 24 27 30
0
10
20
30
40
50
60
70
80
90
100
400 mg o.d. 400 mg b.i.d.
Overall Logrank test: p=0.026
(months)
Same “shape” of the PFS curves in
Rankin et al, ASCO 2004
Demetri et al,NEJM 347, 2002
Verweij et al, Lancet 364, 2004
Imatinib in advanced / metastatic GIST

EORTC – ISG - AGITG
Background (2)
New mutations
Genomic amplification
Loss of KIT expression
Functional resistance
J. Fletcher, ASCO 2003
M. Debiec-Rychter,Gastroenterology, 2004
Different biological
mechanisms are
responsible for initial
and late resistance to
imatininb
Different mechanisms of resistance may be predicted by
different prognostic factors

EORTC – ISG - AGITG
Objectives of the analysis
Identify factors that may predict initial resistance to imatininb
Identify factors that may predict late resistance to imatininb
Explore the dose/efficacy relationship in the important prognostic subgroups

EORTC – ISG - AGITG
Material
EORTC – ISG – AGITC trial 62005
946 patients with advanced / metastatic GIST
Randomized to imatinib
400 mg o.d.
400 mg b.i.d.
Median follow-up: 25 months

EORTC – ISG - AGITG
End-points for each objective
Initial resistance :
documented progression within 3 months 116 progressions / 934 evaluable cases Logistic regression models
Late resistance :
time to progression after 3 months 3 months landmark period 347 progressions / 818 evaluable cases Cox regression model

EORTC – ISG - AGITG
Investigated co-factors Imatinib dose (randomized) Age, gender, PS Site of disease origin Site and size of lesions at entry Prior therapies Hematological and biological parameters
Results For each end-point: univariate and multivariate analysis Overall TTP curve for important prognostic factors Comparison of treatment arms in prognostic subgroups

EORTC – ISG - AGITG
Factor Univariate
OR P-value
Lung metasases 0.323 < 0.0001
Hemoglobin 1.421 < 0.0001
Granulocytes 0.926 0.0049
PS 0.734 0.0079
Platelets (/ 100) 0.845 0.0082
Albumin 1.040 0.0186
Liver metastases 1.611 0.0212
Time since diag 1.297 0.0488
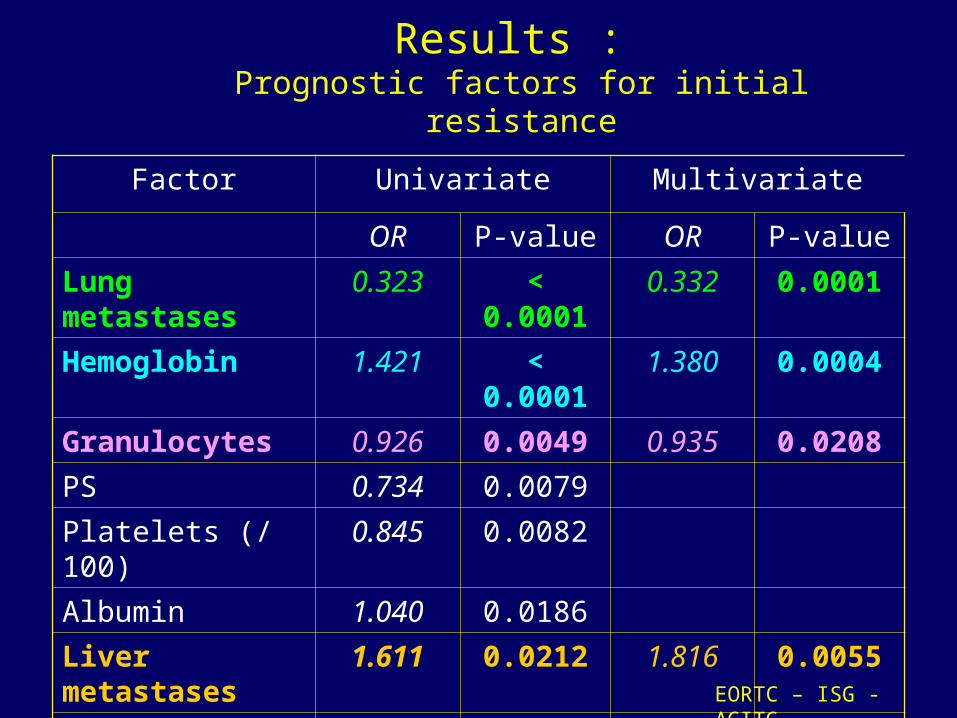
Results : Prognostic factors for initial resistance
EORTC – ISG - AGITG
Factor Univariate Multivariate
OR P-value OR P-value
Lung metastases 0.323 < 0.0001 0.332 0.0001
Hemoglobin 1.421 < 0.0001 1.380 0.0004
Granulocytes 0.926 0.0049 0.935 0.0208
PS 0.734 0.0079
Platelets (/ 100) 0.845 0.0082
Albumin 1.040 0.0186
Liver metastases 1.611 0.0212 1.816 0.0055
Time since diag 1.297 0.0488
Results : Prognostic factors for initial resistance
EORTC – ISG - AGITG
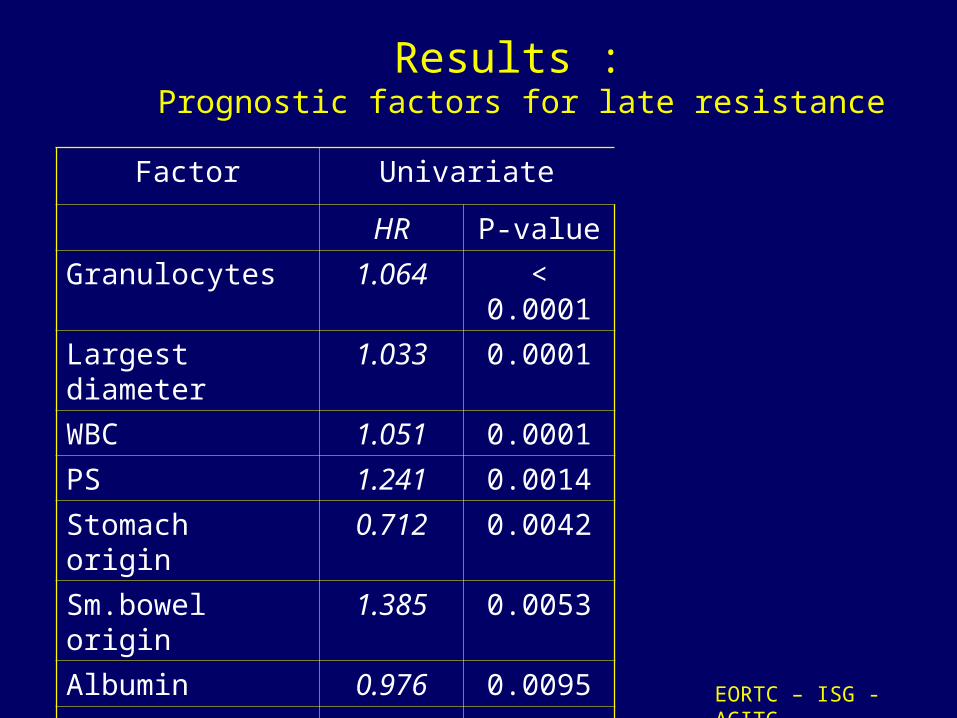
Results : Prognostic factors for late resistance
Factor Univariate
HR P-value
Granulocytes 1.064 < 0.0001
Largest diameter 1.033 0.0001
WBC 1.051 0.0001
PS 1.241 0.0014
Stomach origin 0.712 0.0042
Sm.bowel origin 1.385 0.0053
Albumin 0.976 0.0095
Prior chemo 1.298 0.0184
Imatinib dose 0.779 0.0202

EORTC – ISG - AGITG
Results : Prognostic factors for late resistance
Factor Univariate Multivariate
HR P-value HR P-value
Granulocytes 1.064 < 0.0001 1.051 0.0009
Largest diameter 1.033 0.0001 1.023 0.0095
WBC 1.051 0.0001
PS 1.241 0.0014
Stomach origin 0.712 0.0042 0.731 0.0088
Sm.bowel origin 1.385 0.0053
Albumin 0.976 0.0095
Prior chemo 1.298 0.0184
Imatinib dose 0.779 0.0202 0.754 0.0093

EORTC – ISG - AGITG
Summary : factors predicting resistance to imatininb
FactorInitial
resistance(P-value)
Late resistance(P-value)
Low imatinib dose ns 0.0093
High granulocytes 0.0208 0.0009
Low hemoglobin 0.0004 ns
Large lesions ns 0.0095
Origin outside of stomach ns 0.0088
Lung metastases 0.0001 ns
No liver metastases 0.0055 ns
EORTC – ISG - AGITG
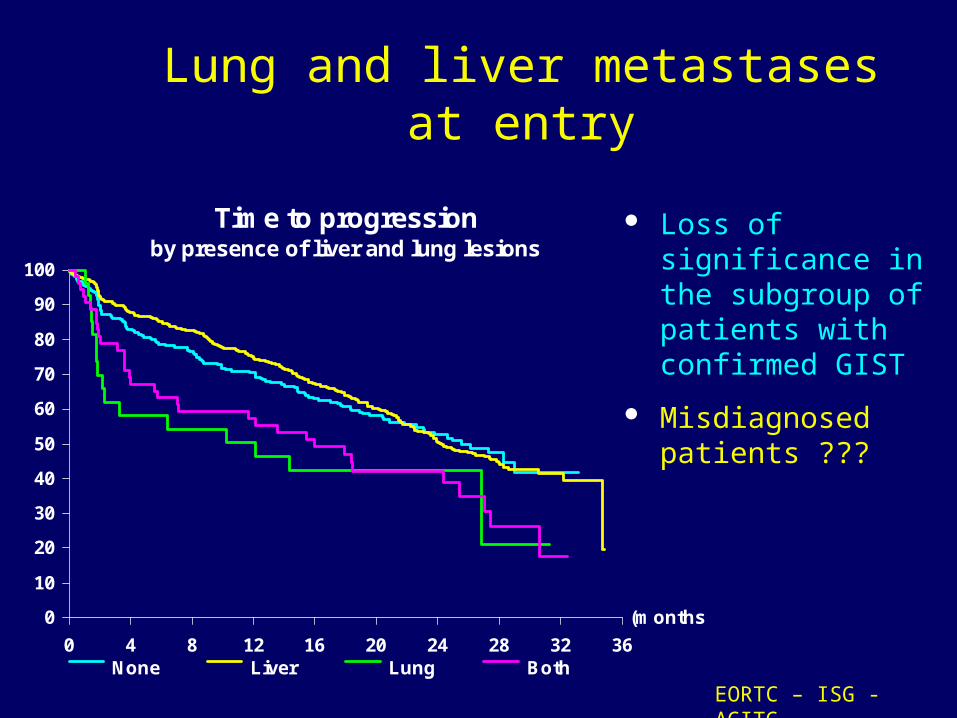
Lung and liver metastases at entry
(months)
0 4 8 12 16 20 24 28 32 36
0
10
20
30
40
50
60
70
80
90
100
None Liver Lung Both
Time to progressionby presence of liver and lung lesions
Loss of significance in the subgroup of patients with confirmed GIST
Misdiagnosed patients ???

EORTC – ISG - AGITG
Hemoglobin
Also a PF in CML
Influences PK
Advanced disease (mucosal ulceration, bleeding)
(months)
0 6 12 18 24 30 36
0
10
20
30
40
50
60
70
80
90
100
< 7 7 - 8 8 - 8.8 > 8.8
Time to progressionby initial hemoglobin level (mmol/l)
< 11.27 11.27 - 12.88 12.88 - 14.17 > 14.17 mg/100 ml
EORTC – ISG - AGITG
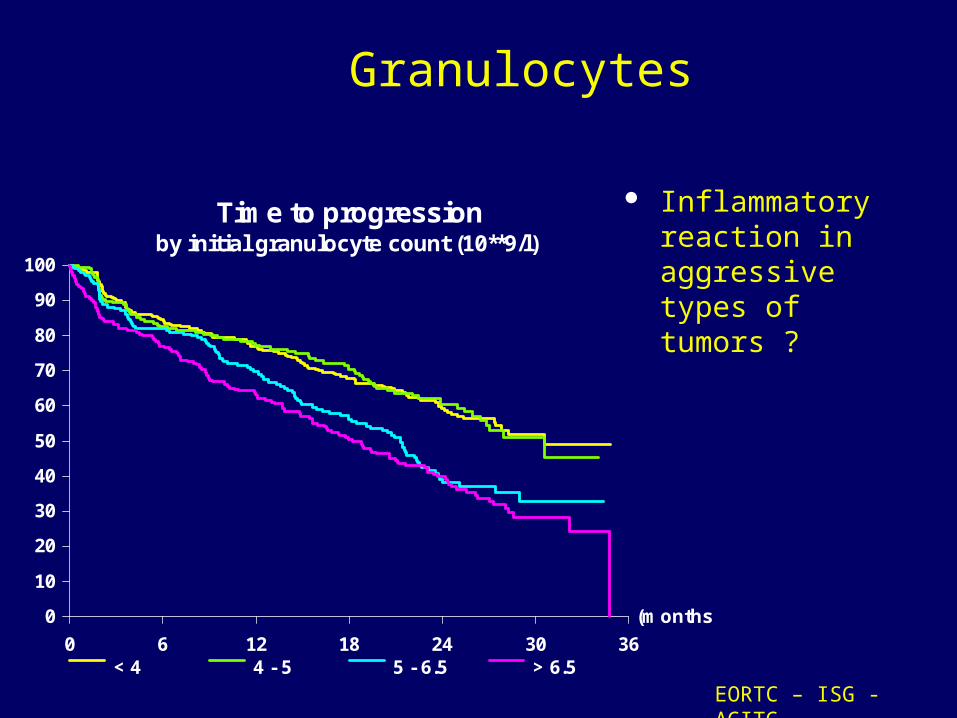
Granulocytes
Inflammatory reaction in aggressive types of tumors ?
(months)
0 6 12 18 24 30 36
0
10
20
30
40
50
60
70
80
90
100
< 4 4 - 5 5 - 6.5 > 6.5
Time to progressionby initial granulocyte count (10**9/l)
EORTC – ISG - AGITG
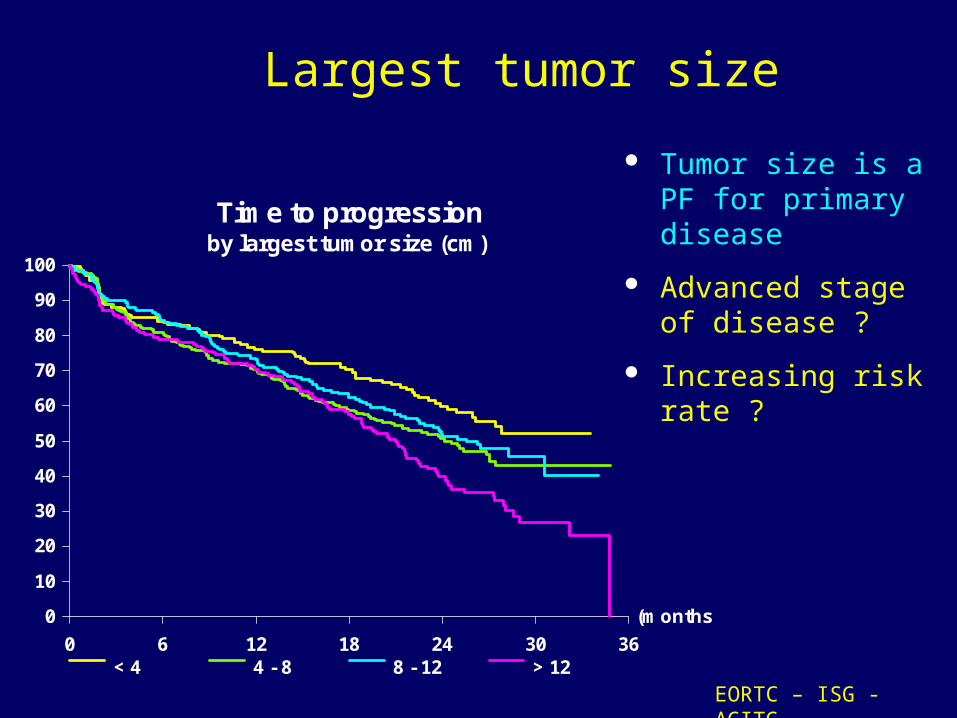
Largest tumor size
Tumor size is a PF for primary disease
Advanced stage of disease ?
Increasing risk rate ?
(months)
0 6 12 18 24 30 36
0
10
20
30
40
50
60
70
80
90
100
< 4 4 - 8 8 - 12 > 12
Time to progressionby largest tumor size (cm)

EORTC – ISG - AGITG
(months)
0 6 12 18 24 30 36
10
20
30
40
50
60708090
100
< 4 4 - 8 8 - 12 > 12
Time to progressionby largest tumor size (cm)
Largest tumor size – logarithmic scale
Increased risk of progression
At +/- 18 months
In large tumors
Delayed mechanism of resistance ?

EORTC – ISG - AGITG
Site of origin of disease Stomach vs
small bowel
PF for primary disease
% benign/malignant- high in stomach- low in sm.bowel
Correlation with mitotic index ?
(months)
0 6 12 18 24 30 36
0
10
20
30
40
50
60
70
80
90
100
Retro-int.abd. Stomach Small bowel Other GI
Extra abd.
Time to progressionby original tumor site

EORTC – ISG - AGITG
Impact of initial imatininb dose on TTP : subgroup analysis
Subgroup Total FailuresHazard
ratioP-value
All patients 946 463 0.801 0.017
Granulocytes < 5 109/l 514 207 0.874 0.3368
Granulocytes > 5 109/l 432 256 0.678 0.0020
Largest diam. < 12 cm 728 336 0.793 0.0337
Largest diam. > 12 cm 218 127 0.796 0.2025
Stomach origin 316 131 0.836 0.3077
Small bowel origin 238 130 1.025 0.8886
Other GI origin 239 121 0.576 0.0029

EORTC – ISG - AGITG
Patients with high granulocytes
(months)
0 6 12 18 24 30 36
0
10
20
30
40
50
60
70
80
90
100
400 mg o.d. 400 mg b.i.d.
Time to progressionPatients with high granulocytes count (> 5.10**9/l)

EORTC – ISG - AGITG
Tumors of “other” GI origin
(months)
0 6 12 18 24 30 36
0
10
20
30
40
50
60
70
80
90
100
400 mg o.d. 400 mg b.i.d.
Time to progressionTumors of GI origin outside stomach and small bowel
Duodenal 89 Omentum 47 Rectum 44 Colon 23 Esophag. 11 …. 25

EORTC – ISG - AGITG
Conclusions
Initial and late resistance are predicted by different factors
Initial imatinib dose has
No impact on initial resistance
Impact on late resistance In patients with high GRA In tumors of “unusual” GI origin Not in patients with small bowel origin
Hypotheses to be confirmed by immunohistochemical / molecular parameters
The models should be externally validated

EORTC – ISG - AGITG

EORTC – ISG - AGITG
Material : EORTC-ISG-AGITG phase III trial
Eligibility criteria Advanced or metastatic GIST; c-KIT positive PS 0-3; no upper age limit; any prior therapy HGB > 9 g/dl (5.6 mmol/l) - transfusion allowed
Randomization Imatinib, 400 mg od; cross-over if PD Imatinib, 400 mg bid (800 mg/day)
Data set 946 patients randomized Median follow-up: 25 months; 1 year: 98%; 2 years: 58%

EORTC – ISG - AGITG
Analyzed end-points
Initial resistance : progression within 3 months 3 months: includes 1st eval. / excludes 2nd eval. Binary variable: 116 PD / 818 no PD Exclude 11 early deaths (no PD) and 1 lfu (ineligible) Logistic model
Late resistance : progression after 3 months 3 months landmark period Time to event variable (event = progression) Deaths without progression censored 347 events – 24 death no PD – 447 alive & prog.free Cox model

EORTC – ISG - AGITG
Results : Prognostic factors for initial resistance
Factor Univariate Multivariate
OR P-value OR P-value
Lung metastases 0.323 < 0.0001 0.332 0.0001
Hemoglobin 1.421 < 0.0001 1.380 0.0004
Granulocytes 0.926 0.0049 0.935 0.0208
PS 0.734 0.0079
Platelets (/ 100) 0.845 0.0082
Albumin 1.040 0.0186
Liver metastases 1.611 0.0212 1.816 0.0055
Time since diag 1.297 0.0488

EORTC – ISG - AGITG
Results : Prognostic factors for late resistance
Factor Univariate Multivariate
HR P-value HR P-value
Granulocytes 1.064 < 0.0001 1.051 0.0009
Largest diameter 1.033 0.0001 1.023 0.0095
WBC 1.051 0.0001
PS 1.241 0.0014
Stomach origin 0.712 0.0042 0.731 0.0088
Sm.bowel origin 1.385 0.0053
Albumin 0.976 0.0095
Prior chemo 1.298 0.0184
Imatinib dose 0.779 0.0202 0.754 0.0093

EORTC – ISG - AGITG
Site of origin of disease Stomach vs
sm. bowel
PF for primary disease
% benign/malignant- high in stomach- low in sm.bowel
Correlation with mitotic index ?
(months)
0 6 12 18 24 30 36
0
10
20
30
40
50
60
70
80
90
100
Stomach Sm.bowel Other
Time to progression