JOIN KHALID AZIZ COACHING CLASSES ICMAP STAGE 1,2,3,4,5 ICAP MODULE A,B,C,D PIPFA BBA & MBA
Upload
pamela-gilbertCategory
view
233download
3
EOQ ModelEconomic Order Quantity

JOIN KHALID AZIZ ECONOMICS OF ICMAP, ICAP, MA-ECONOMICS,
B.COM. FINANCIAL ACCOUNTING OF ICMAP STAGE
1,3,4 ICAP MODULE B, B.COM, BBA, MBA & PIPFA.
COST ACCOUNTING OF ICMAP STAGE 2,3 ICAP MODULE D, BBA, MBA & PIPFA.
CONTACT: 0322-3385752 R-1173,ALNOOR SOCIETY, BLOCK 19,F.B.AREA,
KARACHI, PAKISTAN
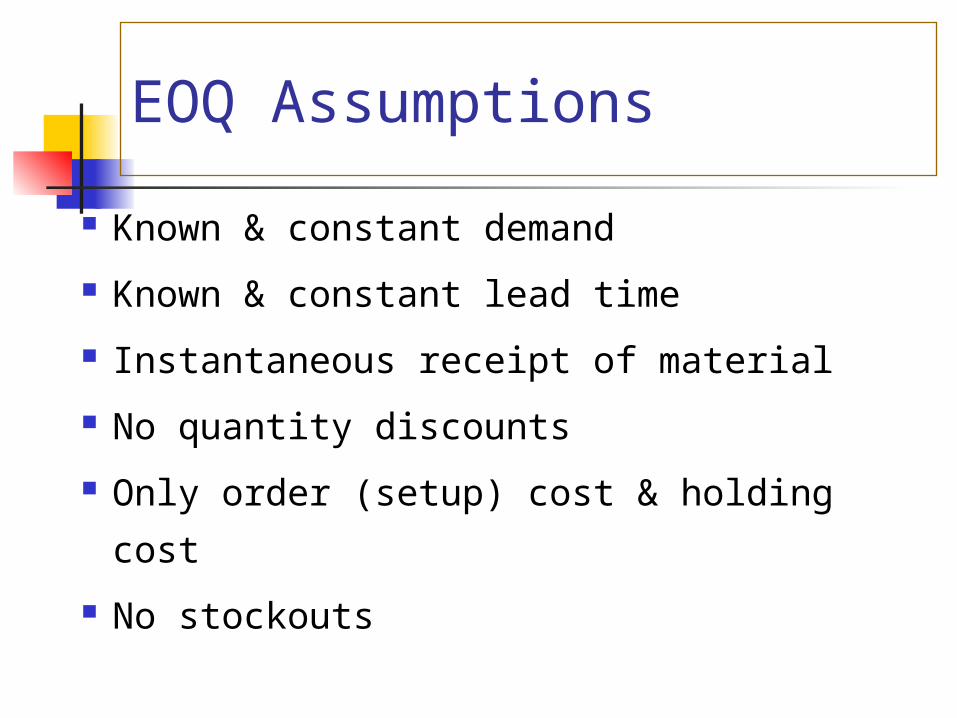
EOQ Assumptions
Known & constant demand
Known & constant lead time
Instantaneous receipt of material
No quantity discounts
Only order (setup) cost & holding
cost
No stockouts
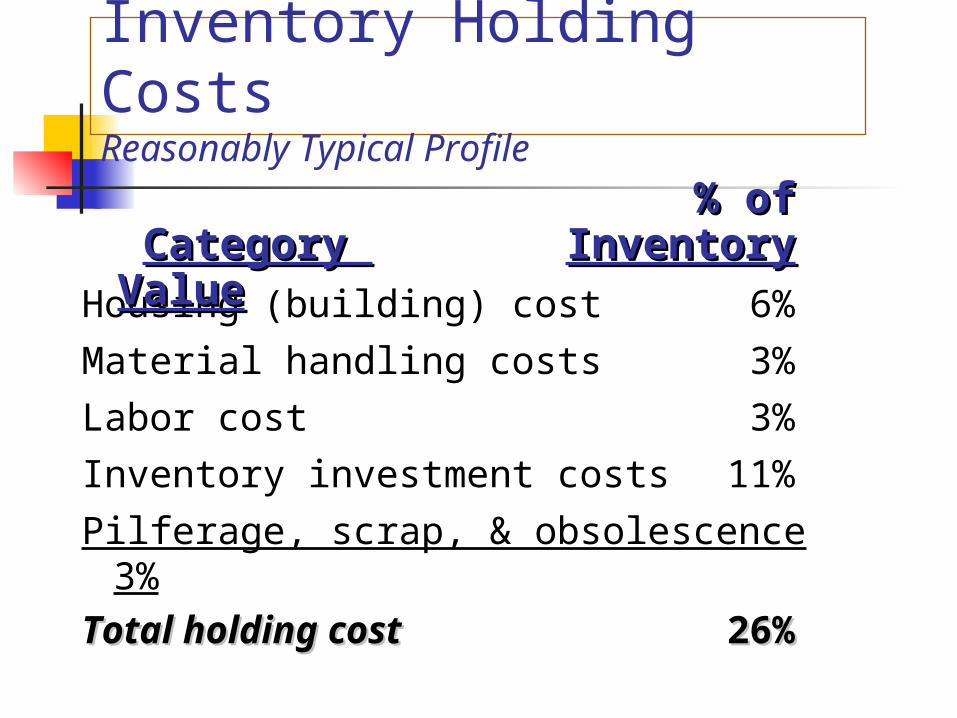
Inventory Holding CostsReasonably Typical Profile
Housing (building) cost 6%
Material handling costs 3%
Labor cost 3%
Inventory investment costs 11%
Pilferage, scrap, & obsolescence 3%
Total holding costTotal holding cost 26%26%
% of % of Category Category Inventory ValueInventory Value
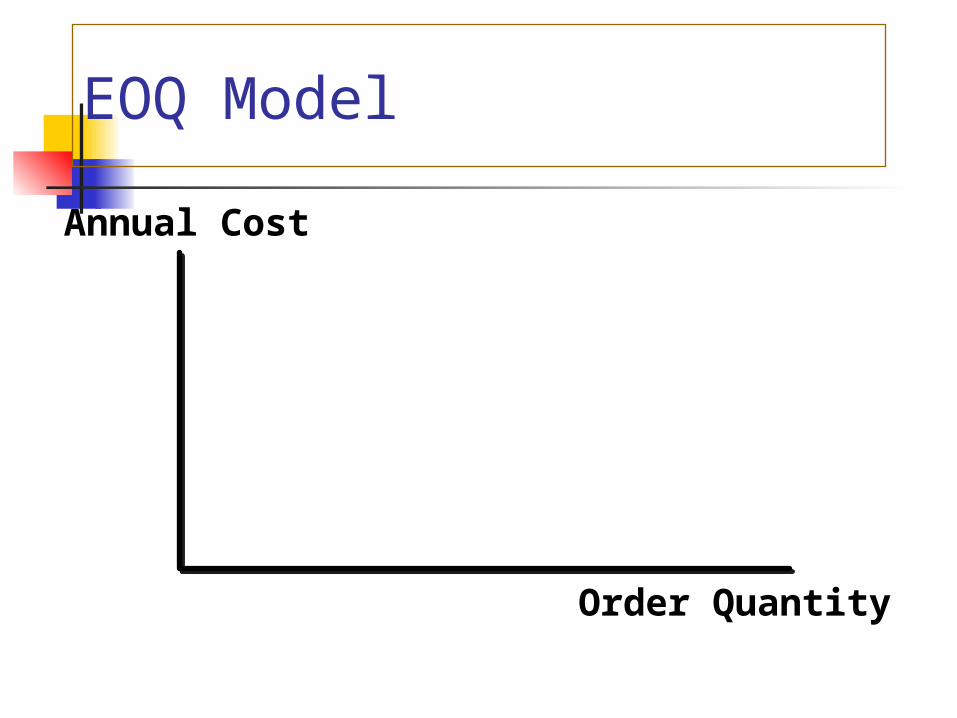
EOQ Model
Order Quantity
Annual Cost
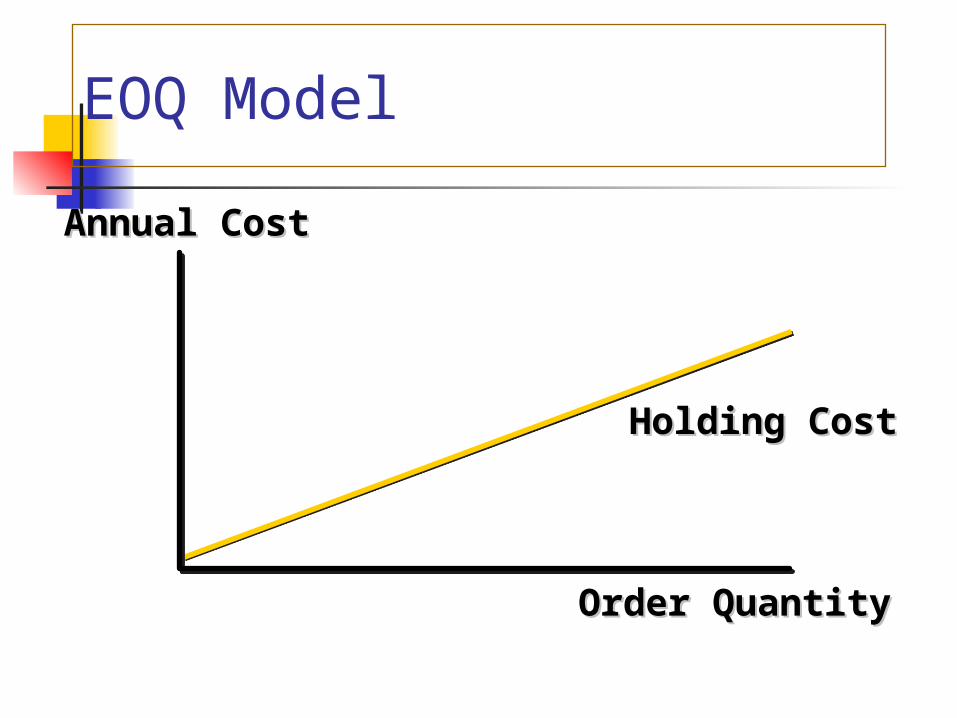
Order QuantityOrder Quantity
Annual CostAnnual Cost
Holding CostHolding Cost
EOQ Model
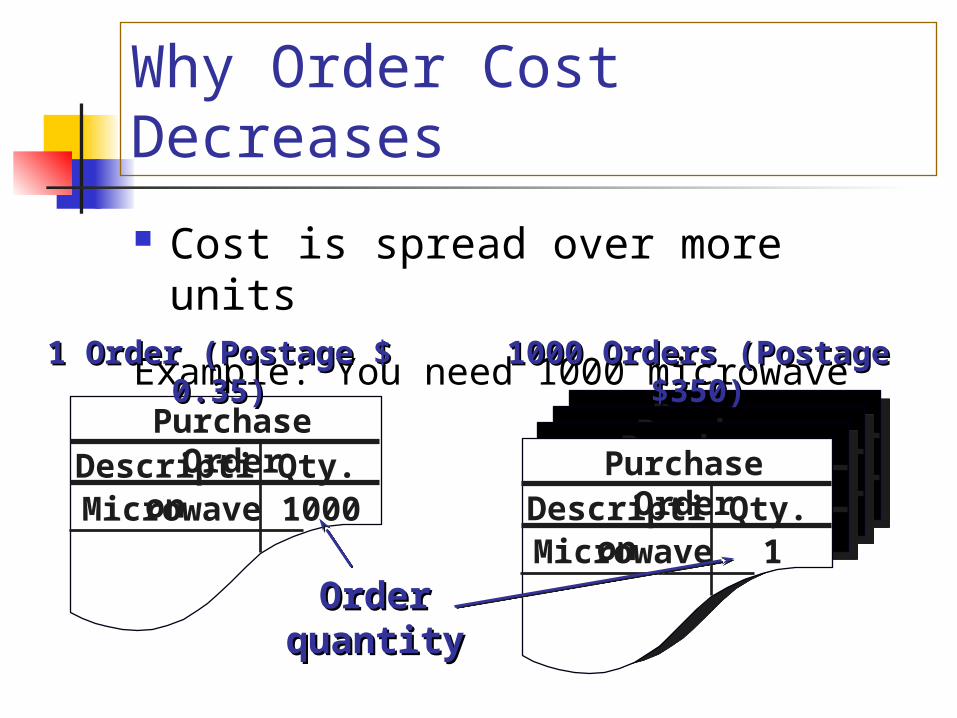
Why Order Cost Decreases
Cost is spread over more units
Example: You need 1000 microwave ovens
Purchase OrderDescription Qty.Microwave 1000
Purchase OrderDescription Qty.Microwave 1
Purchase OrderDescription Qty.Microwave 1
Purchase OrderDescription Qty.Microwave 1
Purchase OrderDescription Qty.Microwave 1
1 Order (Postage $ 0.35)1 Order (Postage $ 0.35) 1000 Orders (Postage $350)1000 Orders (Postage $350)
Order Order quantityquantity
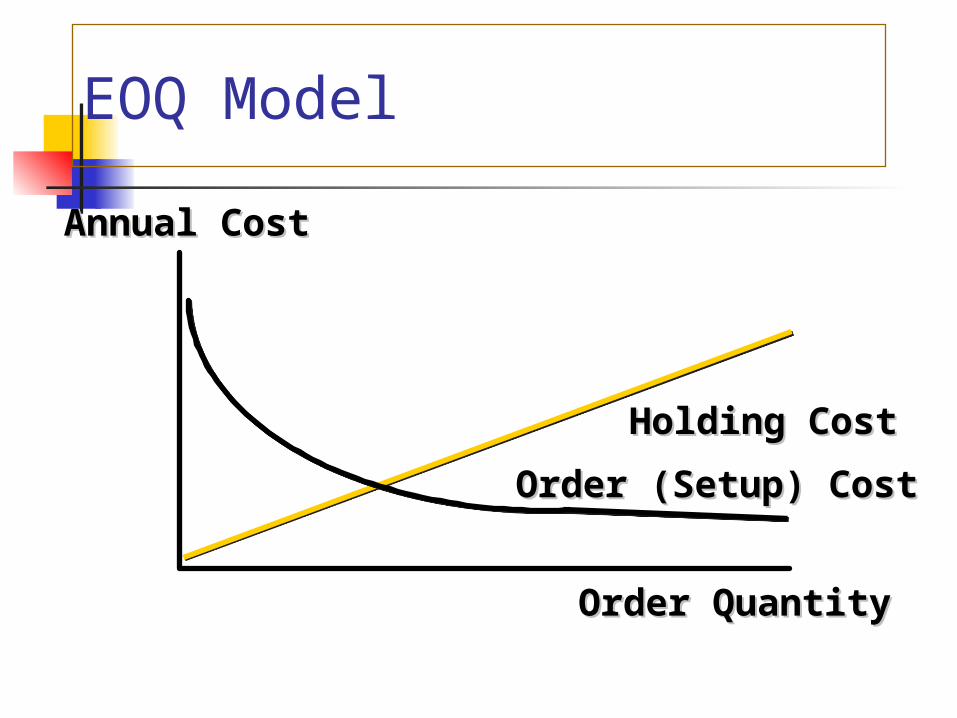
Order QuantityOrder Quantity
Annual CostAnnual Cost
Holding CostHolding Cost
Order (Setup) CostOrder (Setup) Cost
EOQ Model
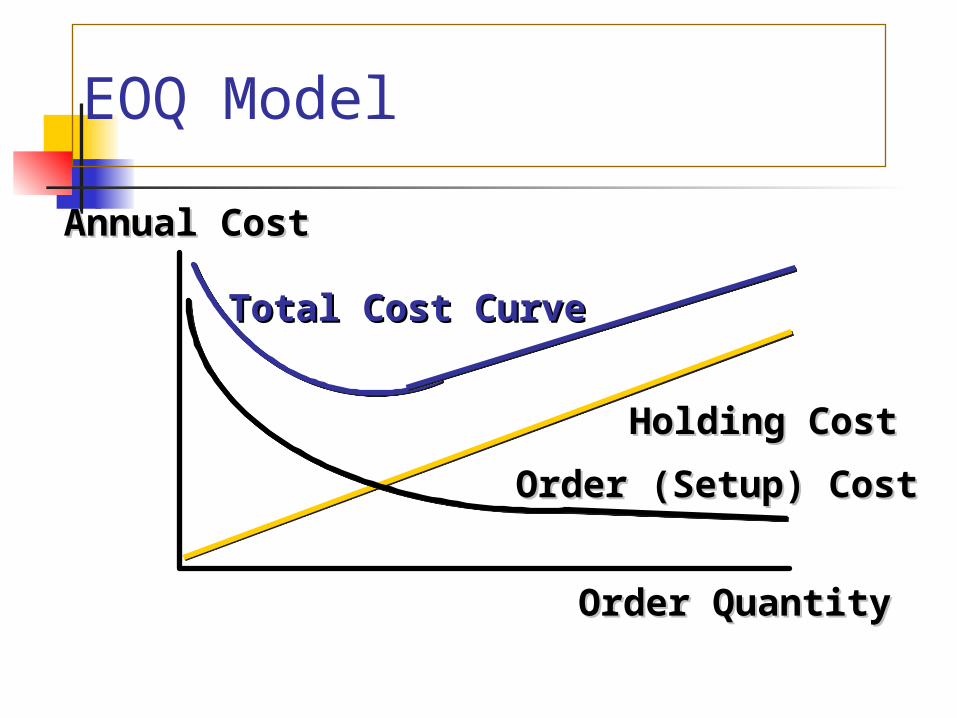
Order QuantityOrder Quantity
Annual CostAnnual Cost
Holding CostHolding Cost
Total Cost CurveTotal Cost Curve
Order (Setup) CostOrder (Setup) Cost
EOQ Model
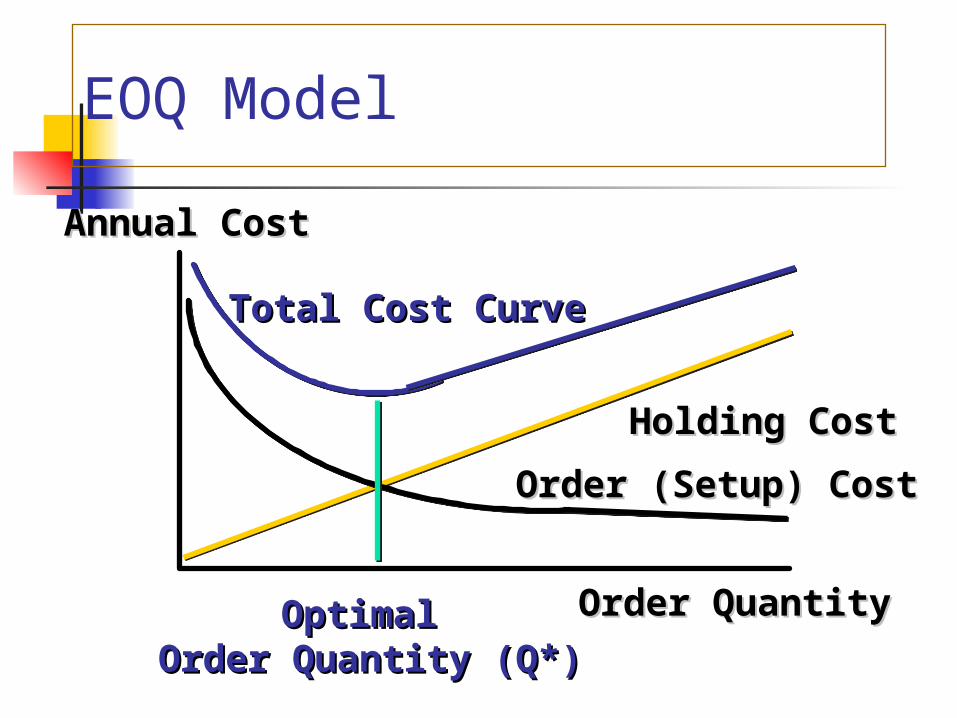
Order QuantityOrder Quantity
Annual CostAnnual Cost
Holding CostHolding Cost
Total Cost CurveTotal Cost Curve
Order (Setup) CostOrder (Setup) Cost
Optimal Optimal Order Quantity (Q*)Order Quantity (Q*)
EOQ Model

EOQ Formula DerivationD = Annual demand (units)C = Cost per unit ($)Q = Order quantity (units)S = Cost per order ($)I = Holding cost (%)H = Holding cost ($) = I x C
Number of Orders = D / QOrdering costs = S x (D / Q)
Average inventory units = Q / 2 $ = (Q / 2) x C
Cost to carry average inventory = (Q / 2) x I x C = (Q /2) x H
Total cost = (Q/2) x I x C + S x (D/Q) inv carry cost order cost
Take the 1st derivative:
d(TC)/d(Q) = (I x C) / 2 - (D x S) / Q²
To optimize: set d(TC)/d(Q) = 0
DS/ Q² = IC / 2
Q²/DS = 2 / IC
Q²= (DS x 2 )/ IC
Q = sqrt (2DS / IC)
H
SDEOQ
2
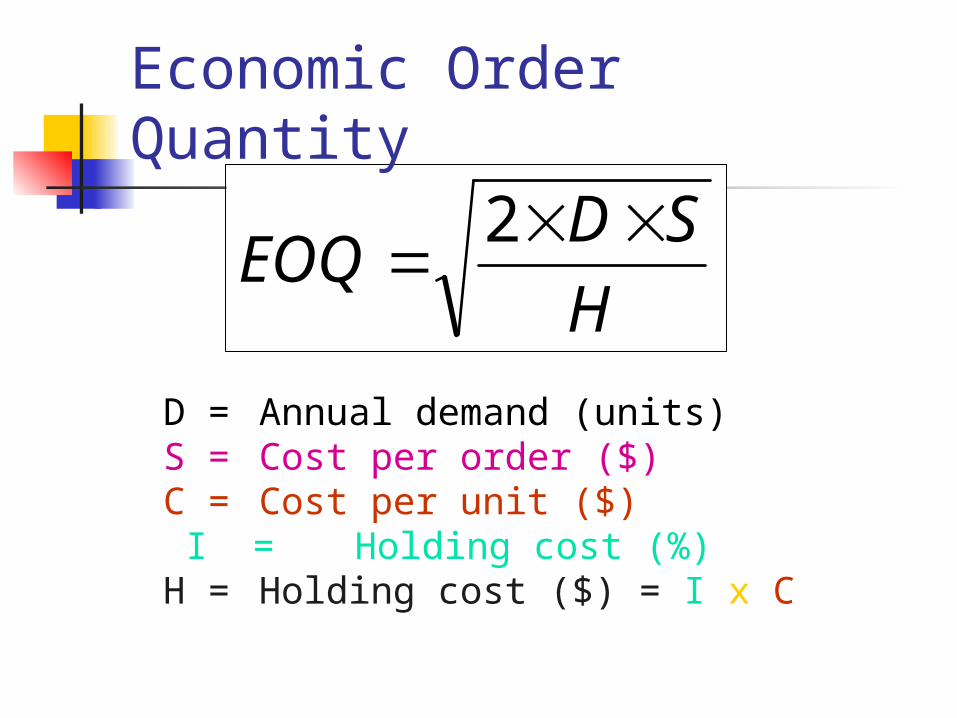
D = Annual demand (units)S = Cost per order ($) C = Cost per unit ($) I = Holding cost (%)H = Holding cost ($) = I x C
Economic Order Quantity
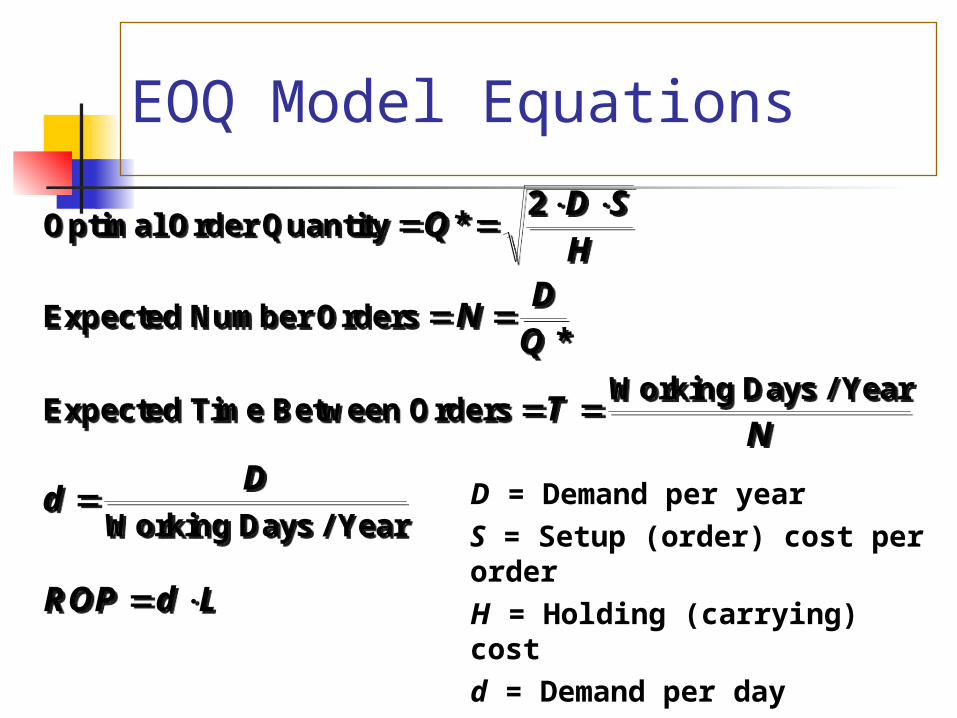
EOQ Model Equations
Optimal Order Quantity
Expected Number Orders
Expected Time Between OrdersWorking Days / Year
Working Days / Year
QD SH
ND
Q
TN
dD
ROP d L
*
*
2Optimal Order Quantity
Expected Number Orders
Expected Time Between OrdersWorking Days / Year
Working Days / Year
QD SH
ND
Q
TN
dD
ROP d L
*
*
2
D = Demand per year
S = Setup (order) cost per order
H = Holding (carrying) cost
d = Demand per day
L = Lead time in days
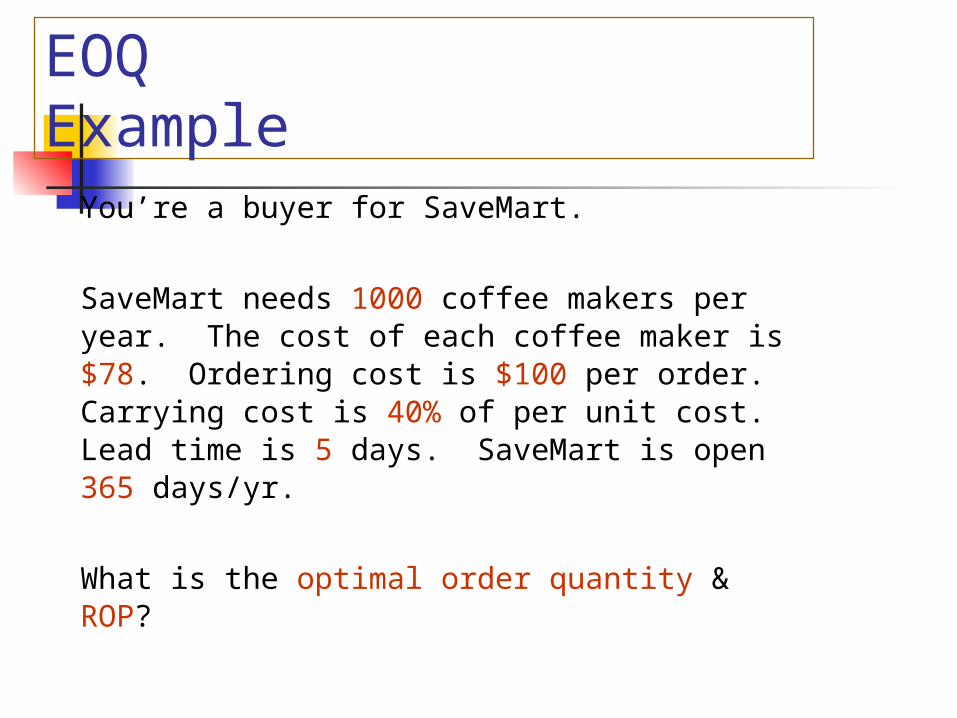
EOQ Example
You’re a buyer for SaveMart.
SaveMart needs 1000 coffee makers per year. The cost of each coffee maker is $78. Ordering cost is $100 per order. Carrying cost is 40% of per unit cost. Lead time is 5 days. SaveMart is open 365 days/yr.
What is the optimal order quantity & ROP?
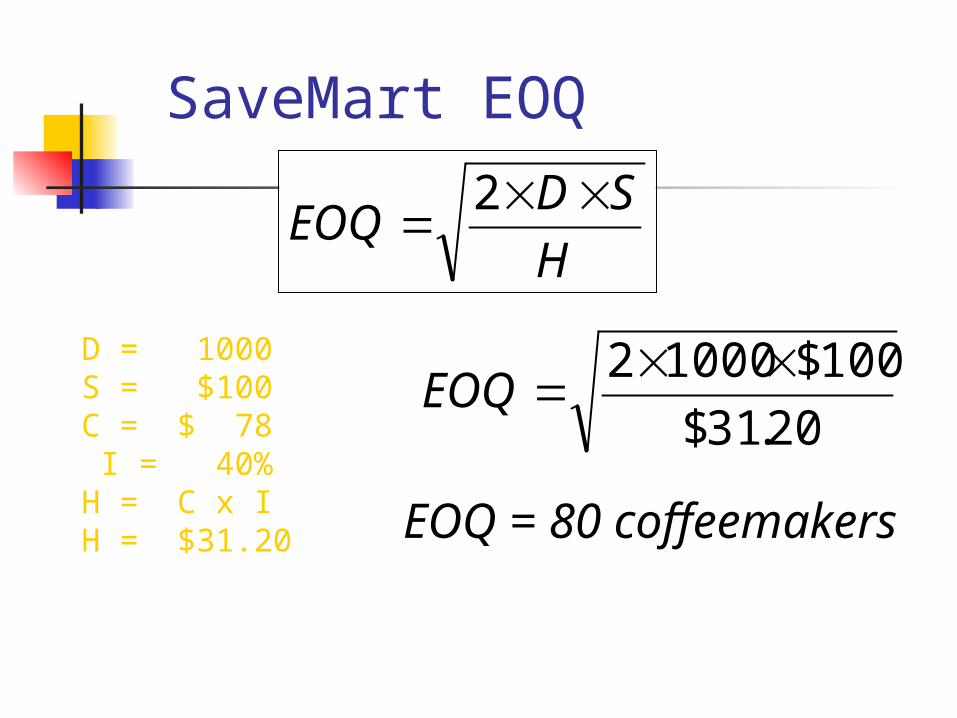
SaveMart EOQ
H
SDEOQ
2
20.31$
100$10002 EOQ
D = 1000S = $100C = $ 78 I = 40%H = C x IH = $31.20 EOQ = 80 coffeemakers
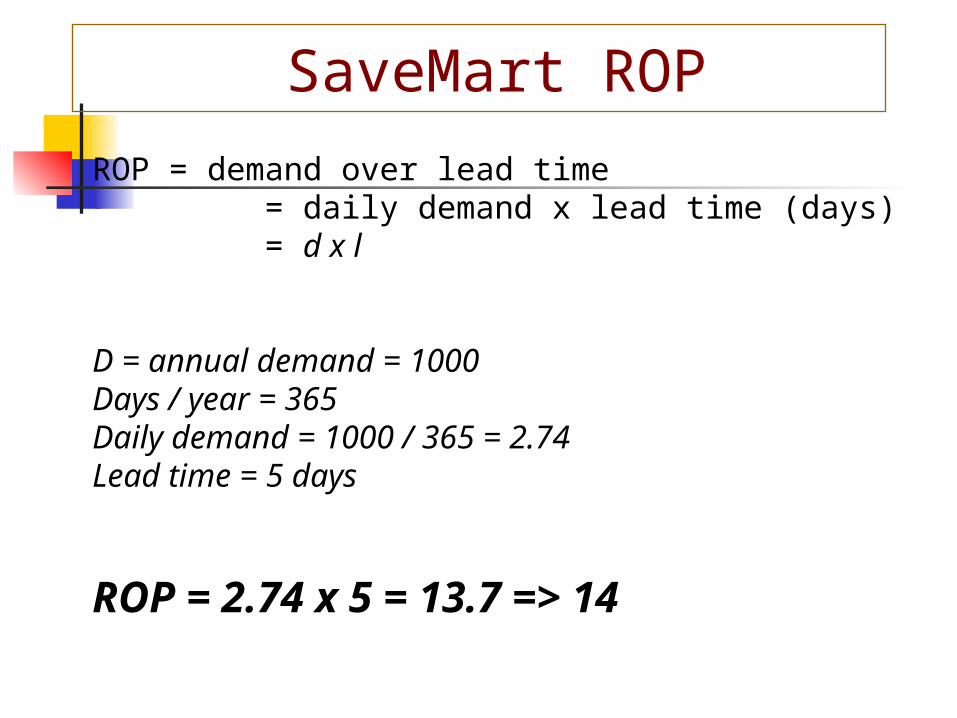
SaveMart ROP
ROP = demand over lead time = daily demand x lead time (days) = d x l
D = annual demand = 1000Days / year = 365Daily demand = 1000 / 365 = 2.74Lead time = 5 days
ROP = 2.74 x 5 = 13.7 => 14
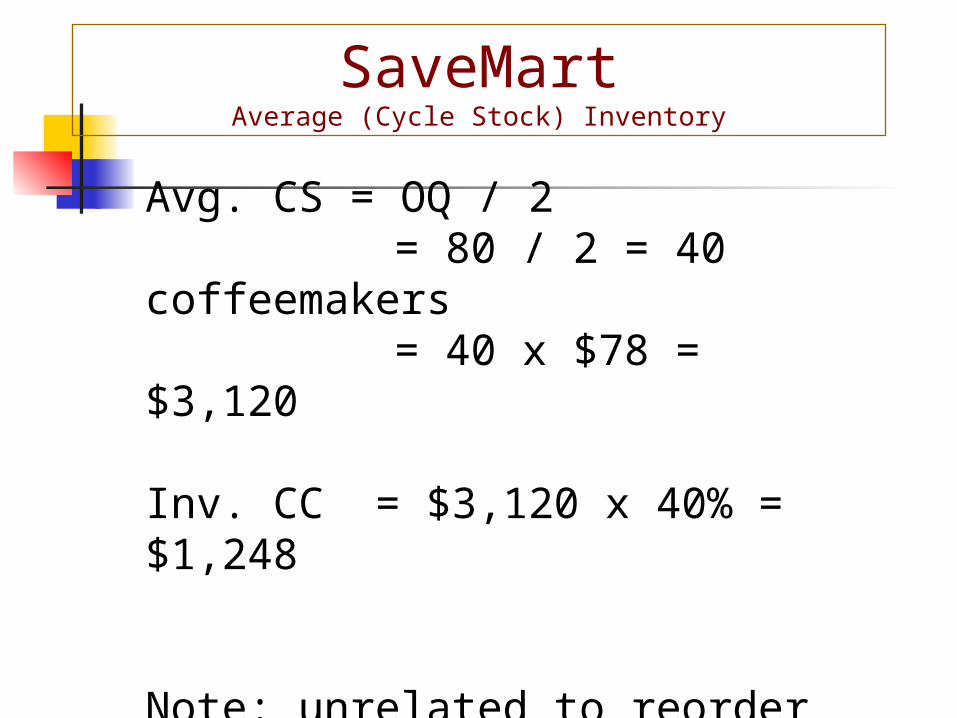
Avg. CS = OQ / 2 = 80 / 2 = 40 coffeemakers = 40 x $78 = $3,120
Inv. CC = $3,120 x 40% = $1,248
Note: unrelated to reorder point
SaveMart Average (Cycle Stock) Inventory

H
SDEOQ
2
D = Annual demand (units)S = Cost per order ($) C = Cost per unit ($) I = Holding cost (%)H = Holding cost ($) = I x C
Economic Order Quantity
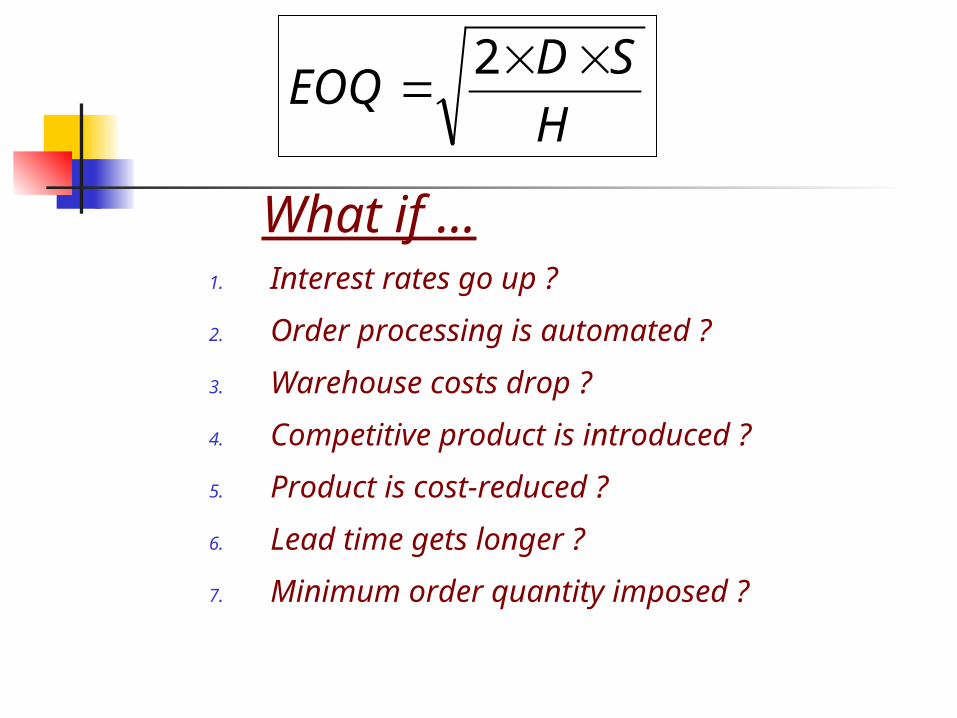
What if …1. Interest rates go up ?
2. Order processing is automated ?
3. Warehouse costs drop ?
4. Competitive product is introduced ?
5. Product is cost-reduced ?
6. Lead time gets longer ?
7. Minimum order quantity imposed ?
H
SDEOQ
2
JOIN KHALID AZIZ ECONOMICS OF ICMAP, ICAP, MA-ECONOMICS,
B.COM. FINANCIAL ACCOUNTING OF ICMAP STAGE
1,3,4 ICAP MODULE B, B.COM, BBA, MBA & PIPFA.
COST ACCOUNTING OF ICMAP STAGE 2,3 ICAP MODULE D, BBA, MBA & PIPFA.
CONTACT: 0322-3385752 R-1173,ALNOOR SOCIETY, BLOCK 19,F.B.AREA,
KARACHI, PAKISTAN