E.ON SE Financial Statements pursuant to German GAAP and ...
128
E.ON SE Financial Statements pursuant to German GAAP and Combined Group Management Report for the 2017 Financial Year
Transcript of E.ON SE Financial Statements pursuant to German GAAP and ...

E.ON SE Financial Statements pursuant to German GAAP and Combined Group
Management Report for the 2017 Financial Year

E.ON SE’s Financial Statements and Combined Group
Management Report for the 2017 fiscal year will be published
in the German Federal Gazette (“Bundes anzeiger”).
E.ON SE’s management report is combined with that of the Group.
4 Combined Group Management Report4 Corporate Profile
4 Business Model
5 Management System
6 Innovation
8 Business Report
8 Macroeconomic and Industry Environment
10 Earnings Situation
15 Financial Situation
19 Asset Situation
20 E.ON SE’s Earnings, Financial, and Asset Situation
22 Other Financial and Non-financial Performance Indicators
22 – ROCE and Value Added
24 – Corporate Sustainability
25 – Employees
33 Forecast Report
36 Risk and Chances Report
44 Business Segments
52 Internal Control System for the Accounting Process
54 Disclosures Regarding Takeovers
57 Corporate Governance Report
57 Corporate Governance Declaration
66 Compensation Report
84 Financial Statements of E.ON SE84 Balance Sheet
85 Income Statement
86 Notes
110 Disclosures on Companies in Which Share Investments Are Held
117 Declaration of the Board of Management
118 Auditors’ Report
Page references in the Combined Group Management Report refer to the 2017 E.ON Annual Report.
Contents

Business Report

Combined Group Management Report

4 Corporate Profile
Slovakia, and Turkey). This segment’s main tasks include operating
its power and gas networks safely and reliably, carrying out all
necessary maintenance and repairs, and expanding its networks,
which frequently involves adding customer connections.
Customer SolutionsThis segment serves as the platform for working with our cus-
tomers to actively shape Europe’s energy transition. This
includes supplying customers in Europe (excluding Turkey)
with power, gas, and heat as well as with products and ser-
vices that enhance their energy efficiency and autonomy and
provide other benefits. Our activities are tailored to the individ-
ual needs of all types of customers: residential, small and
medium-sized enterprises, large commercial and industrial,
and public entities. E.ON’s main presence in this business is in
Germany, the United Kingdom, Sweden, Italy, the Czech
Republic, Hungary, and Romania. E.ON Connecting Energies,
which provides customers with turn-key distributed-energy
solutions, is also part of this segment. We established a decen-
tralized procurement organization in all the regions where we
operate to procure the power and gas necessary to supply our
customers.
RenewablesThis segment consists of Onshore Wind/Solar and Offshore
Wind/Other. We plan, build, operate, and manage renewable
generation assets. We market their output in several ways: in
conjunction with renewable incentive programs, under long-term
electricity supply agreements with key customers, and directly to
the wholesale market.
Non-Core BusinessThis segment consists of our non-strategic activities. This
applies to the operation of our nuclear power stations in Ger-
many (which is managed by our PreussenElektra unit).
Corporate Profile
Business Model
E.ON is an investor-owned energy company with approximately
43,000 employee. Led by Group Management in Essen, our
operations are segmented into three operating units: Energy
Networks, Customer Solutions, and Renewables. Our non-stra-
tegic operations are reported under Non-Core Business.
Group ManagementThe main task of Group Management is to lead the E.ON
Group. This involves charting E.ON’s strategic course and man-
aging and funding its existing business portfolio. Group Man-
agement’s tasks include optimizing E.ON’s overall business
across countries and markets from a financial, strategic, and
risk perspective and conducting stakeholder management.
In view of our new strategy and the Annual Shareholders
Meeting’s vote to spin off Uniper, we reported Uniper activities
as a discontinued operation in 2016. When the Control Termi-
nation Agreement took effect, Uniper was deconsolidated
effective December 31, 2016. E.ON’s remaining Uniper stake
was recorded in our Consolidated Financial Statements as an
associated company and accounted for using the equity
method. Uniper’s earnings were reported under non-operating
earnings. In September 2017 E.ON and Finnish energy com-
pany Fortum concluded an agreement that gave E.ON the
option to sell its 46.65-percent stake in Uniper to Fortum in
early 2018 pursuant to a takeover offer (see the commentary
in Note 4 to the Consolidated Financial Statements). Effective
the end of September 2017, we classify our Uniper stake as an
asset held for sale. In January 2018 E.ON decided to tender its
46.65-percent stake in Uniper pursuant to the takeover offer,
thereby exercising its option. The closure of the transaction is
subject to regulatory approvals.
Energy NetworksThis segment consists of our power and gas distribution net-
works and related activities. It is subdivided into three regional
markets: Germany, Sweden, and East-Central Europe/Turkey
(which consists of the Czech Republic, Hungary, Romania,

5
Management System
Our corporate strategy aims to deliver sustainable growth in
shareholder value. We have in place a Group-wide planning and
controlling system to assist us in planning and managing E.ON
as a whole and our individual businesses with an eye to increas-
ing their value. This system ensures that our financial resources
are allocated efficiently. We strive to enhance our sustainability
performance efficiently and effectively as well. We have high
expectations for our sustainability performance. We embed
these expectations progressively more deeply into our organiza-
tion—across all organizational entities and all processes—by
means of binding company policies and minimum standards.
Our main key figures for managing our operating business are
adjusted EBIT and cash-effective investments. Other key fig-
ures for managing the E.ON Group—alongside adjusted net
income, and earnings per share (based on adjusted net
income)—are cash-conversion rate and ROCE.
Adjusted earnings before interest and taxes (“adjusted EBIT”) is
E.ON’s most important key figure for purposes of internal man-
agement control and as an indicator of its businesses’ long-
term earnings power. The E.ON Management Board is con-
vinced that adjusted EBIT is the most suitable key figure for
assessing operating performance because it presents a busi-
ness’s operating earnings independently of non-operating fac-
tors, interest, and taxes. The adjustments include net book
gains, certain restructuring expenses, impairment charges, and
other non-operating earnings, which include, among other
items, the marking to market of derivatives (see the explanatory
information on pages 37 and 38 of the Combined Group Man-
agement Report and in Note 33 of the Consolidated Financial
Statements).
Cash-effective investments are equal to the investment expen-
ditures shown in our Consolidated Statements of Cash Flows.
Cash-conversion rate is equal to operating cash flow before
interest and taxes divided by adjusted EBITDA. It indicates
whether our operating earnings are generating enough liquidity.
Return on capital employed (“ROCE”) assesses the value perfor-
mance of our operating business. ROCE is a pretax total return
on capital and is defined as the ratio of adjusted EBIT to annual
average capital employed.
Adjusted net income is an earnings figure after interest income,
income taxes, and non-controlling interests that has been
adjusted to exclude non-operating effects. Also excluded are
non-operating interest expense/income, taxes on operating
earnings, and non-controlling interests’ share of operating
earnings.
E.ON manages its capital structure by means of its debt factor
(see the section entitled Finance Strategy on page 33). Debt
factor is equal to our economic net debt divided by adjusted
EBITDA and is therefore a dynamic debt metric. Economic net
debt includes our net financial debt as well as our pension and
asset-retirement obligations.
Alongside our most important financial management key fig-
ures, this Combined Group Management Report includes other
financial and non-financial key performance indicators (“KPIs”)
to highlight aspects of our business performance and our
sustainability performance vis-à-vis all our stakeholders: our
employees, customers, shareholders, bond investors, and the
countries in which we operate. Operating cash flow and value
added are examples of our other financial KPIs. Among the KPIs of
our sustainability performance is TRIF (which measures reported
work-related injuries and illnesses). The Employees chapter
contains explanatory information about TRIF. However, this KPI
is not the focus of the ongoing management of our businesses.
6 Corporate Profile
In 2017 these included Cuculus, a software company based in
Ilmenau, Germany. We are partnering with Cuculus to develop
solutions for the smart home of the future. The solutions are
based on the Internet of Things (“IoT”), in which different
devices and systems can communicate with and control each
other via the Internet. Homes in the new energy world will typi-
cally have solar panels, battery storage systems (including vir-
tual storage solutions like the E. ON SolarCloud), electric vehi-
cles, and charging systems. All these systems have to be
continuously automated and coordinated so that energy is used
as efficiently as possible. This will make energy customers more
independent of their energy supplier and also relieve them of
the complex task of optimizing each individual system. Smart
meters and IoT technology enable the communication neces-
sary to coordinate the systems.
In 2017 we sold our stake in Greensmith, a battery solutions
provider, to Wärtsilä of Finland, a global leader in advanced
technologies for the marine and energy markets. E.ON began
working with Greensmith in 2015 on a 10-MW energy-storage
system in Tucson, Arizona. In September 2016 E.ON increased
its stake in Greensmith and also began installing two more
energy-storage systems in Texas.
Innovation
E.ON’s innovation activities reflect its strategy of focusing sys-
tematically on the new energy world of empowered and proac-
tive customers, renewables and distributed energy, energy effi-
ciency, local energy systems, and digital solutions. E.ON
therefore has the following Innovation Hubs:
• Retail and end-customer solutions: develop new business
models for distributed-energy supply, energy efficiency, and
mobility
• Renewables generation: increase the cost-effectiveness of
existing wind and solar assets and study new renewables
technologies
• Infrastructure and energy networks: develop energy-storage
and energy-distribution solutions for an increasingly distrib-
uted and volatile generation system
• Energy intelligence and energy systems: study potentially
fundamental changes to energy systems and the role of data
in the new energy world.
Strategic Co-Investments We want to identify promising energy technologies of the
future that will enhance our palette of offerings for our millions
of customers around Europe and will make us a pacesetter in
the operation of smart energy systems. We select new busi-
nesses that offer the best opportunities for partnerships, com-
mercialization, and equity investments. Our investments focus
on strategic technologies and business models that enhance
our ability to lead the move toward distributed, sustainable, and
innovative energy offerings. These arrangements benefit new
technology companies and E.ON, since we gain access to their
new business models and have a share in the value growth.

7
Sample Projects from 2017Customer SolutionsSince 2015 E.ON customers have been able to use E.ON Smart
Check, an app that provides transparency on their energy use.
Customers can use the app to compare and analyze their energy
consumption on a regular basis and thus, for example, avoid
unexpected supplementary payments.
The E.ON Smart Check’s features have been enhanced continu-
ally since its launch. Consumers who participated in a pilot proj-
ect in 2017 were able to automatically connect all electrical
appliances in their household to the app and receive important
information about them. In the project, for example, the app
was capable of indicating whether a washing machine was cal-
cified or living-room lighting was inefficient. E.ON Smart Check
is already used by more than 120,000 customers.
Distributed NetworksE.ON is one of 20 partners in InterFlex, a European smart-grid
project that is part of Horizon 2020, an EU framework program for
research and innovation. The purpose of InterFlex is to find new
ways to make the power supply more flexible and to optimize it at
the local level. In 2017 we launched two major InterFlex initiatives
in which we are testing a number of state-of-the-art solutions in
three demonstration projects in Germany and Sweden. They
include:
• islanding: operating and controlling autonomous microgrids
in real time, including the integration of distributed generat-
ing units and energy-storage devices
• peer-to-peer energy trading: self-generating renewable
power and trading it directly with a neighbor or another con-
sumer
• demand response: flexibly managing the demand for power
depending on how much of it is available on the market.
InterFlex is planned to run for three years. The E.ON Energy
Research Center is also involved in the project.
University SupportOur innovation activities include partnering with universities
and research institutes to conduct research projects in a variety
of areas. The purpose is to study ways to expand the horizons of
energy conservation and sustainable energy and to draw on this
research to develop new offerings and solutions for customers.
This research is conducted primarily at the E.ON Energy
Research Center, which focuses on renewables, technologically
advanced electricity networks, and efficient technology for
buildings.
8Business Report
in the total carbon price. The agreement also includes new rules
to support the introduction of national carbon prices. It enables
member states to voluntarily withdraw allowances from the
market in order to implement their own carbon-pricing policies.
The EU intends to enhance its position as the world’s leading
region for low-emission vehicles. It put forward legislative pro-
posals aimed at reducing the carbon intensity of Europe’s vehi-
cle fleet. The proposals center on electrification with the goal of
increasing the proportion of electric vehicles in the current fleet
to 7 percent by 2025. This would result in a considerable
expansion of, and demand for, the charging infrastructure for
these vehicles.
The EU continued the process of enacting the proposals con-
tained in the “Clean Energy for All Europeans” package of
energy and climate legislation. With a number of proposals
about to be enacted, it is clear that the EU will increase its tar-
gets for renewables use and energy efficiency. At the end of the
legislative process, the EU will focus on ensuring that member
states fulfill their obligations in the energy sector.
GermanyOn June 30, 2017, the German Bundestag passed the Grid Fee
Modernization Act which lays the legal foundation for transmis-
sion grid fees to be standardized nationwide and for changes to
be made in the compensation for avoided grid fees pursuant to
Section 18 of the Electricity Grid Charges Ordinance. The act,
which will be implemented gradually, will yield considerable
savings for our distribution-grid customers through 2023.
The German Federal Constitutional Court ruled that the nucle-
ar-fuel tax was invalid. This entitled E.ON to a tax refund of
approximately €2,850 million. The refund, which was paid in
full in June 2017, is recorded as other operating income and as
cash provided by operating activities of continuing operations.
Macroeconomic and Industry Environment
Macroeconomic EnvironmentThe OECD considers global economic activity to be more robust.
Monetary and fiscal incentives enabled most countries to achieve
improved economic growth. Private investments, however,
remain stagnant. The OECD estimates that the global economy
grew at a rate of 3.6 percent in 2017.
Energy Policy and Regulatory EnvironmentGlobalThe 23rd United Nations climate change conference took place in
Bonn, Germany, from November 6 to 17, 2017. It too focused on
the practical implementation of the Paris Agreement. Based on
scenarios developed by the World Energy Council and the Inter-
national Energy Agency, the Paris Agreement’s objective of limit-
ing the increase in global temperatures to under 2 degrees Celsius
can only be reached with greater efforts.
EuropeThe European Union completed a two-year legislative process
to reform the Emissions Trading System for the period 2021 to
2030. The new agreement calls for a steady decline in the over-
supply of emission allowances, which should lead to an increase
Germany
Italy
Euro zone
Sweden
United
Kingdom
USA
OECD
Turkey
0 1 2 3 4 5 6
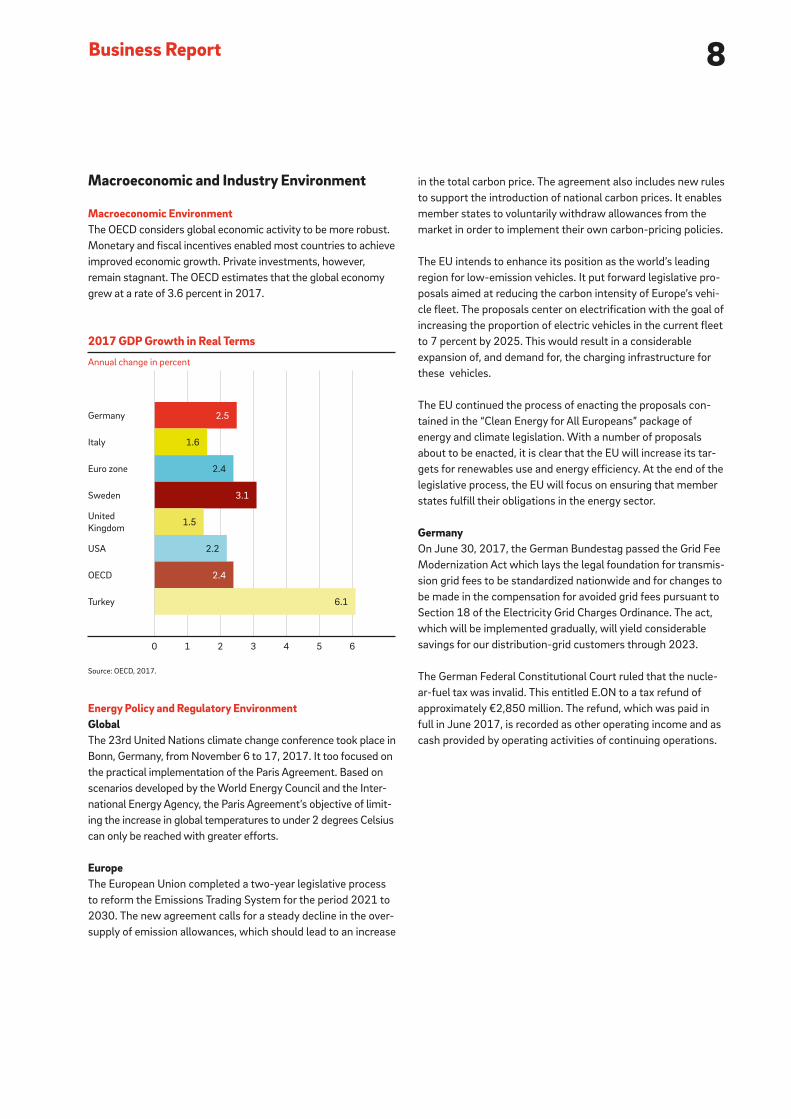
2.5
1.6
2.4
3.1
1.5
2.2
2.4
6.1
2017 GDP Growth in Real Terms
Annual change in percent
Source: OECD, 2017.

9
Under the amended Combined-Heat-and-Power (“CHP”) Act,
compensation for CHP units between 1 and 50 MW is deter-
mined by competitive tenders conducted by the Federal Net-
work Agency. This has intensified competition, reducing com-
pensation from 7 cents per kWh to about 4 cents per kWh.
CHP plants that entered service after August 1, 2014, had paid
40 percent of the full renewables levy. The European Commis-
sion intends to rescind approval of this limitation. An enforce-
ment ban has therefore been in effect since January 1, 2018,
and Germany will have to enact new legislation for new CHP
plants (Renewable Energy Law self-supply regulation pursuant
to Section 61b, Item 2, of the Renewable Energy Law). Until
such legislation is enacted and approved, all new CHP plants
will have to pay the full renewables levy.
The provisions for “renters’ power” introduced in the Renewable
Energy Law of 2017 (the subsidization of electricity supplied
directly from solar systems on apartment buildings) will enable
both renters and property owners to benefit from the expansion
of renewables, such as the installation of rooftop solar panels.
This will create new growth opportunities for the distribut-
ed-energy business.
The coalition agreement for the planned continuation of the
grand coalition in Germany commits the CDU, CSU, and SPD to
climate targets for 2030 and 2050. One target is for renewables
to meet about 65 percent of the country’s gross electricity con-
sumption by 2030. The agreement also foresees an ambitious
action plan for upgrading and expanding energy networks, rec-
ognizing the increased importance of distribution networks. The
scope for digital business models is to be expanded, with data
protection to be a top priority.
United KingdomThe U.K. government published draft legislation to cap the
standard tariff for residential customers by 2020. It is possible
that this deadline could be extended to 2023. Parliament is
currently considering the draft, which is expected to become law
in 2019. While the political scene remains dominated by the
Brexit negotiations, Britain’s future stance with regard to EU
energy policy and regulation remains uncertain. Nevertheless,
Britain intends to fulfill its own commitments and continue its
carbon-reduction policies. These include the further expansion of
electric cars, renewables, energy efficiency, and new technologies.
Italy The Italian Regulatory Authority for Electricity, Gas, and Water
wants to spur competition in the end-customer market and
intends to supplant regulated tariffs. In November 2017 the
Italian government published a national energy strategy for the
next ten years. The strategy seeks to promote energy-efficiency
measures, expand renewables, enhance supply security, reduce
Italy’s energy price premium relative to the rest of Europe, pro-
mote sustainable mobility and environmentally friendly fuels,
and phase out coal-fired generation.
SwedenSweden’s energy policy is focused on the implementation of the
targets and measures contained in the agreement on the coun-
try’s energy future reached in 2016. The extension of the sup-
port scheme for renewables through 2030, the development
of strategies for energy efficiency, solar energy, and demand
flexibility will all play important roles. In addition, the Swedish
government set ambitious climate targets for 2030 for the
transport sector and put in place new mechanisms to promote
e-mobility and gas-powered vehicles. Sweden’s energy regula-
tor presented proposals for new grid regulation starting in
2020 and a new market design for electricity suppliers.
East-Central EuropeIn late August 2016, the Czech Republic announced that it will
extend the current regulatory period for electricity and gas
prices by two years to 2020. The next regulatory period starts
in 2021. In it, the country’s regulatory agency wants to pro-
mote cost efficiency while also stimulating grid investments
through a mechanism that provides fair and stable returns on
investment. Romania continued its liberalization program. The
wholesale gas and power markets were fully liberalized on
April 1 and July 1, 2017, respectively. Hungary’s new electric-
ity and gas regulatory periods began in 2017 and had a posi-
tive impact on the distribution-grid business. They introduced
new methodologies for investments in power distribution net-
works, incentives to invest in renewables, and favorable tax
treatment for investments in energy-efficiency projects. The
government is also discussing ways to simplify and accelerate
grid-connection processes.
10Business Report
Acquisitions, Disposals, and Discontinued Operations in 2017We executed the following significant transactions in 2017.
Note 4 to the Consolidated Financial Statements contains
detailed information about them:
• Uniper stake
• Hamburg Netz
• E.ON Värme Lokala Energilösningar (small and medium-sized
district-heating networks in Sweden).
Disposals resulted in cash-effective items totaling €770 million
in 2017 (prior year: €836 million). This figure includes the sales
price for Hamburg Netz which was paid in 2017.
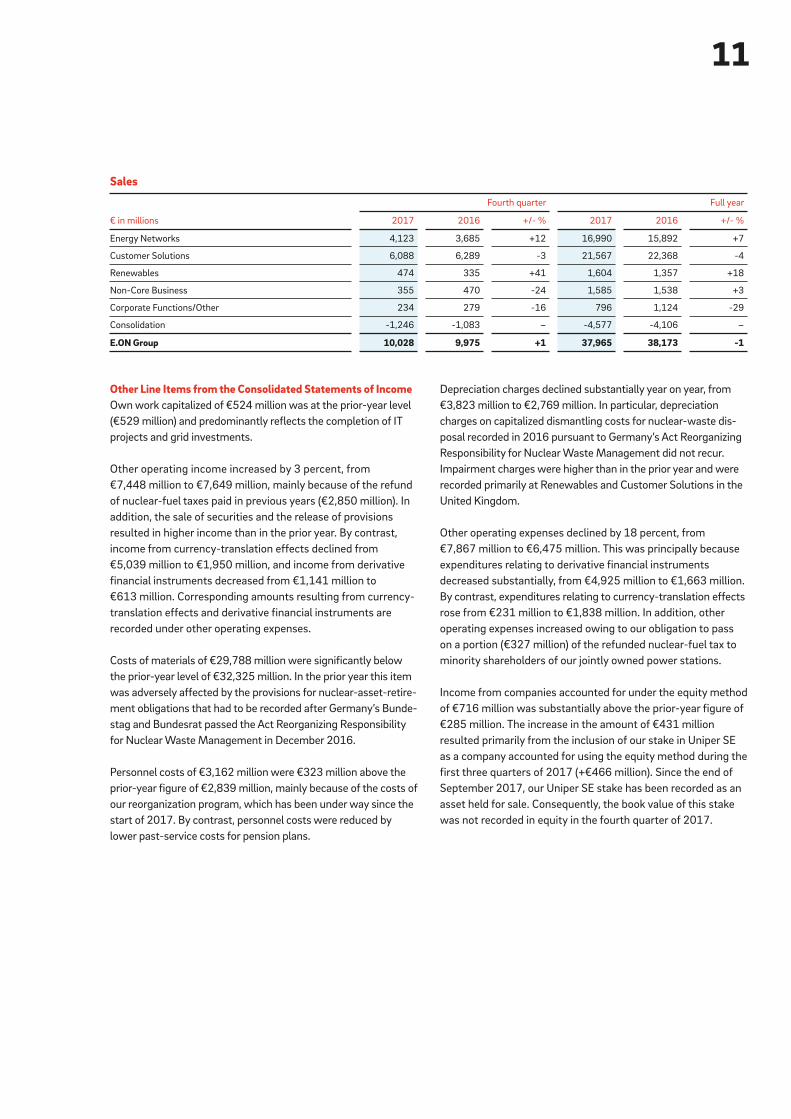
SalesOur sales declined by about €0.2 billion to €38 billion in 2017.
Energy Networks’ sales surpassed the prior-year figure by
€1.1 billion, primarily because of higher costs charged by
upstream grid operators in Germany that we passed through to
customers. Its sales were slightly higher in Sweden and
East-Central Europe/Turkey owing to volume and price factors.
Customer Solutions’ sales declined by €0.8 billion, principally
because of lower sales volume and currency-translation effects
in the United Kingdom as well as the expiration of supply con-
tracts for the wholesale-customer business in Germany, which
was transferred to Uniper. Sales at our Renewables segment
were up by about €250 million year on year, primarily because
of an increase in owned generation following the commission-
ing of new wind farms in the United States and favorable wind
conditions in Poland, Germany, the United Kingdom, and Swe-
den. Non-Core Business’s sales were at the prior-year level. The
prior-year figure for Corporate Functions/Other includes E&P
operations in the North Sea that were sold in 2016.
Earnings Situation
Business Performance in 2017In the 2017 financial year our operating business performed well.
Our sales of €38 billion were at the prior-year level. Adjusted
EBIT in our core business rose by €38 million to €2.6 billion.
Adjusted EBIT for the E.ON Group declined by €38 million to
€3.1 billion (if disposals are factored out, adjusted EBIT was
€9 million below the prior-year figure). Adjusted net income
increased by about €0.5 billion to €1.4 billion. Our adjusted EBIT
and adjusted net income were therefore at the upper end of our
forecast range of €2.8 to €3.1 billion and €1.2 to €1.45 billion,
respectively. In addition, our objective was to record a cash-
conversion rate of 80 percent. Cash-conversion rate is equal to
operating cash flow before interest and taxes divided by
adjusted EBITDA (roughly €5 billion). Operating cash flow
before interest and taxes, which was substantially affected by
extraordinary items such as our payment into Germany’s public
fund for nuclear-waste disposal and the refund of nuclear-fuel
taxes, amounted to -€2.2 billion in 2017. Adjusted for these
effects, our cash-conversion rate surpassed 100 percent. Our
ROCE was 10.5 percent, slightly higher than our forecast of
8 to 10 percent.
Our investments of €3.3 billion were slightly above the prior-year
figure of €3.2 billion but below the €3.6 billion foreseen for 2017
in our medium-term plan. The deviation is principally attributable
to our Renewables segment, which postponed certain payments
to 2018.
Our operating cash flow of -€3 billion was substantially below
the prior-year figure of €3 billion, primarily because of our pay-
ment into Germany’s public fund for nuclear-waste disposal in
July 2017.
11
Depreciation charges declined substantially year on year, from
€3,823 million to €2,769 million. In particular, depreciation
charges on capitalized dismantling costs for nuclear-waste dis-
posal recorded in 2016 pursuant to Germany’s Act Reorganizing
Responsibility for Nuclear Waste Management did not recur.
Impairment charges were higher than in the prior year and were
recorded primarily at Renewables and Customer Solutions in the
United Kingdom.
Other operating expenses declined by 18 percent, from
€7,867 million to €6,475 million. This was principally because
expenditures relating to derivative financial instruments
decreased substantially, from €4,925 million to €1,663 million.
By contrast, expenditures relating to currency-translation effects
rose from €231 million to €1,838 million. In addition, other
operating expenses increased owing to our obligation to pass
on a portion (€327 million) of the refunded nuclear-fuel tax to
minority shareholders of our jointly owned power stations.
Income from companies accounted for under the equity method
of €716 million was substantially above the prior-year figure of
€285 million. The increase in the amount of €431 million
resulted primarily from the inclusion of our stake in Uniper SE
as a company accounted for using the equity method during the
first three quarters of 2017 (+€466 million). Since the end of
September 2017, our Uniper SE stake has been recorded as an
asset held for sale. Consequently, the book value of this stake
was not recorded in equity in the fourth quarter of 2017.
Sales
€ in millions
Fourth quarter Full year
2017 2016 +/- % 2017 2016 +/- %
Energy Networks 4,123 3,685 +12 16,990 15,892 +7
Customer Solutions 6,088 6,289 -3 21,567 22,368 -4
Renewables 474 335 +41 1,604 1,357 +18
Non-Core Business 355 470 -24 1,585 1,538 +3
Corporate Functions/Other 234 279 -16 796 1,124 -29
Consolidation -1,246 -1,083 – -4,577 -4,106 –
E.ON Group 10,028 9,975 +1 37,965 38,173 -1
Other Line Items from the Consolidated Statements of IncomeOwn work capitalized of €524 million was at the prior-year level
(€529 million) and predominantly reflects the completion of IT
projects and grid investments.
Other operating income increased by 3 percent, from
€7,448 million to €7,649 million, mainly because of the refund
of nuclear-fuel taxes paid in previous years (€2,850 million). In
addition, the sale of securities and the release of provisions
resulted in higher income than in the prior year. By contrast,
income from currency-translation effects declined from
€5,039 million to €1,950 million, and income from derivative
financial instruments decreased from €1,141 million to
€613 million. Corresponding amounts resulting from currency -
translation effects and derivative financial instruments are
recorded under other operating expenses.
Costs of materials of €29,788 million were significantly below
the prior-year level of €32,325 million. In the prior year this item
was adversely affected by the provisions for nuclear-asset-retire-
ment obligations that had to be recorded after Germany’s Bunde-
stag and Bundesrat passed the Act Reorganizing Responsibility
for Nuclear Waste Management in December 2016.
Personnel costs of €3,162 million were €323 million above the
prior-year figure of €2,839 million, mainly because of the costs of
our reorganization program, which has been under way since the
start of 2017. By contrast, personnel costs were reduced by
lower past-service costs for pension plans.
12Business Report
included the unplanned outage of Brokdorf nuclear power sta-
tion and lower sales prices at PreussenElektra and the absence
of earnings streams from E&P operations in the North Sea
divested in 2016.
E.ON generates a significant portion of its adjusted EBIT in very
stable businesses. Regulated, quasi-regulated, and long-term
contracted businesses accounted for the overwhelming propor-
tion of our adjusted EBIT in 2017.
Our regulated business consists of operations in which reve-
nues are largely set by law and based on costs. The earnings on
these revenues are therefore extremely stable and predictable.
Our quasi-regulated and long-term contracted business con-
sists of operations in which earnings have a high degree of pre-
dictability because key determinants (price and/or volume) are
largely set by law or by individual contractual arrangements for
the medium to long term. Examples of such legal or contractual
arrangements include incentive mechanisms for renewables
and the sale of contracted generating capacity.
Our merchant activities are all those that cannot be subsumed
under either of the other two categories.
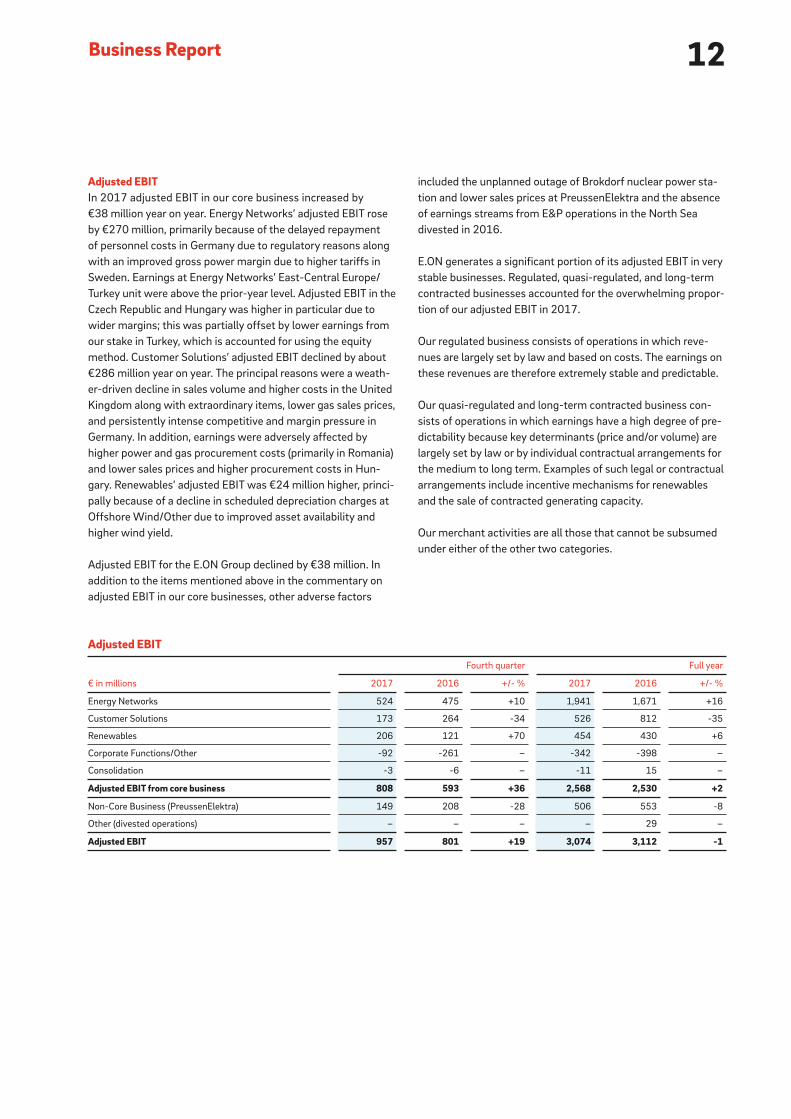
Adjusted EBITIn 2017 adjusted EBIT in our core business increased by
€38 million year on year. Energy Networks’ adjusted EBIT rose
by €270 million, primarily because of the delayed repayment
of personnel costs in Germany due to regulatory reasons along
with an improved gross power margin due to higher tariffs in
Sweden. Earnings at Energy Networks’ East-Central Europe/
Turkey unit were above the prior-year level. Adjusted EBIT in the
Czech Republic and Hungary was higher in particular due to
wider margins; this was partially offset by lower earnings from
our stake in Turkey, which is accounted for using the equity
method. Customer Solutions’ adjusted EBIT declined by about
€286 million year on year. The principal reasons were a weath-
er-driven decline in sales volume and higher costs in the United
Kingdom along with extraordinary items, lower gas sales prices,
and persistently intense competitive and margin pressure in
Germany. In addition, earnings were adversely affected by
higher power and gas procurement costs (primarily in Romania)
and lower sales prices and higher procurement costs in Hun-
gary. Renewables’ adjusted EBIT was €24 million higher, princi-
pally because of a decline in scheduled depreciation charges at
Offshore Wind/Other due to improved asset availability and
higher wind yield.
Adjusted EBIT for the E.ON Group declined by €38 million. In
addition to the items mentioned above in the commentary on
adjusted EBIT in our core businesses, other adverse factors
Adjusted EBIT
€ in millions
Fourth quarter Full year
2017 2016 +/- % 2017 2016 +/- %
Energy Networks 524 475 +10 1,941 1,671 +16
Customer Solutions 173 264 -34 526 812 -35
Renewables 206 121 +70 454 430 +6
Corporate Functions/Other -92 -261 – -342 -398 –
Consolidation -3 -6 – -11 15 –
Adjusted EBIT from core business 808 593 +36 2,568 2,530 +2
Non-Core Business (PreussenElektra) 149 208 -28 506 553 -8
Other (divested operations) – – – – 29 –
Adjusted EBIT 957 801 +19 3,074 3,112 -1
13
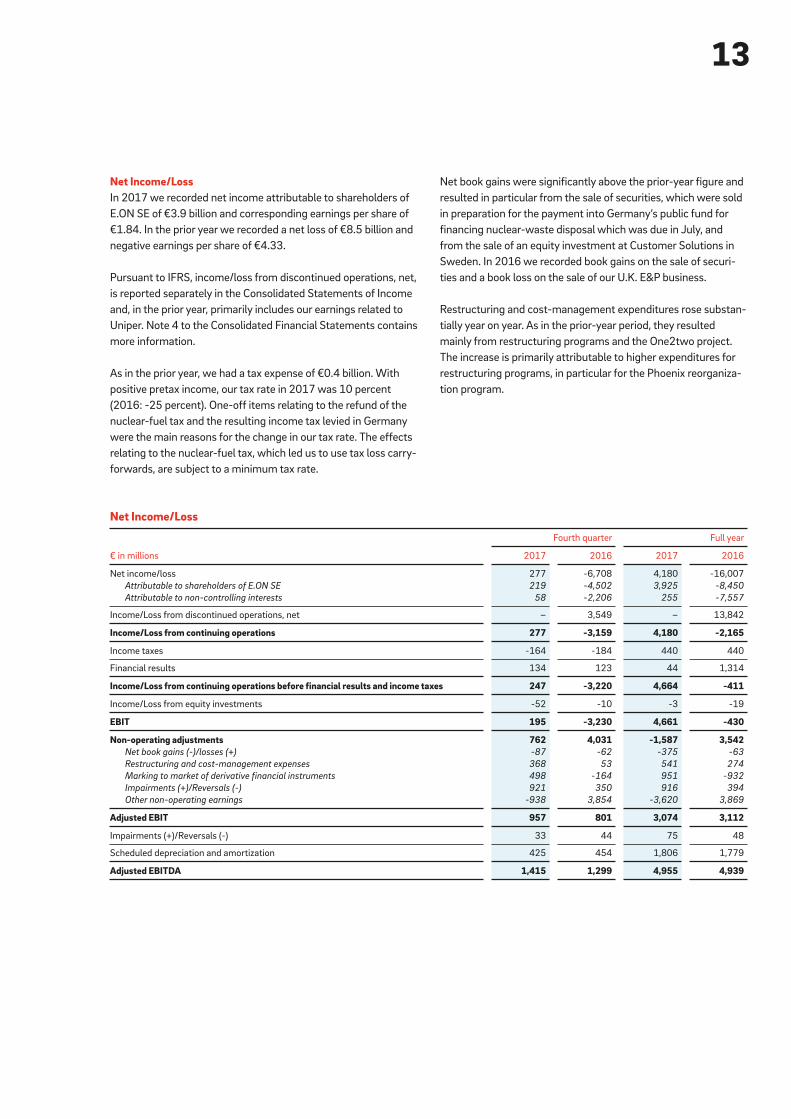
Net Income/LossIn 2017 we recorded net income attributable to shareholders of
E.ON SE of €3.9 billion and corresponding earnings per share of
€1.84. In the prior year we recorded a net loss of €8.5 billion and
negative earnings per share of €4.33.
Pursuant to IFRS, income/loss from discontinued operations, net,
is reported separately in the Consolidated Statements of Income
and, in the prior year, primarily includes our earnings related to
Uniper. Note 4 to the Consolidated Financial Statements contains
more information.
As in the prior year, we had a tax expense of €0.4 billion. With
positive pretax income, our tax rate in 2017 was 10 percent
(2016: -25 percent). One-off items relating to the refund of the
nuclear-fuel tax and the resulting income tax levied in Germany
were the main reasons for the change in our tax rate. The effects
relating to the nuclear-fuel tax, which led us to use tax loss carry-
forwards, are subject to a minimum tax rate.
Net book gains were significantly above the prior-year figure and
resulted in particular from the sale of securities, which were sold
in preparation for the payment into Germany’s public fund for
financing nuclear-waste disposal which was due in July, and
from the sale of an equity investment at Customer Solutions in
Sweden. In 2016 we recorded book gains on the sale of securi-
ties and a book loss on the sale of our U.K. E&P business.
Restructuring and cost-management expenditures rose substan-
tially year on year. As in the prior-year period, they resulted
mainly from restructuring programs and the One2two project.
The increase is primarily attributable to higher expenditures for
restructuring programs, in particular for the Phoenix reorganiza-
tion program.
Net Income/Loss
€ in millions
Fourth quarter Full year
2017 2016 2017 2016
Net income/loss 277 -6,708 4,180 -16,007
Attributable to shareholders of E.ON SE 219 -4,502 3,925 -8,450
Attributable to non-controlling interests 58 -2,206 255 -7,557
Income/Loss from discontinued operations, net – 3,549 – 13,842
Income/Loss from continuing operations 277 -3,159 4,180 -2,165
Income taxes -164 -184 440 440
Financial results 134 123 44 1,314
Income/Loss from continuing operations before financial results and income taxes 247 -3,220 4,664 -411
Income/Loss from equity investments -52 -10 -3 -19
EBIT 195 -3,230 4,661 -430
Non-operating adjustments 762 4,031 -1,587 3,542Net book gains (-)/losses (+) -87 -62 -375 -63
Restructuring and cost-management expenses 368 53 541 274
Marking to market of derivative financial instruments 498 -164 951 -932
Impairments (+)/Reversals (-) 921 350 916 394
Other non-operating earnings -938 3,854 -3,620 3,869
Adjusted EBIT 957 801 3,074 3,112
Impairments (+)/Reversals (-) 33 44 75 48
Scheduled depreciation and amortization 425 454 1,806 1,779
Adjusted EBITDA 1,415 1,299 4,955 4,939

14Business Report
The marking to market of the derivatives we use to shield our
operating business from price fluctuations and of other deriva-
tives resulted in a negative effect of €951 million (prior year:
+€932 million), mainly at Corporate Functions/Other, Customer
Solutions, and Non-Core Business. The positive effect in the prior
year was recorded primarily at Customer Solutions.
In 2017 we recorded impairment charges principally at Renew-
ables and Customer Solutions in the United Kingdom. In the prior
year we recorded impairment charges at Renewables and Cus-
tomer Solutions in the United Kingdom and on a gas storage
facility in Germany.
The significant increase in other non-operating earnings is attrib-
utable to effects resulting from the ruling by Germany’s highest
court on the invalidity of the nuclear-fuel tax and to the equity
earnings on our Uniper stake, which were included in this item
until the end of September 2017. In the prior year this line item
was adversely affected by items resulting from the Act Reorga-
nizing Responsibility for Nuclear Waste Management, which was
passed by Germany’s Bundestag and Bundesrat in December
2016. These items, including the concomitant impairment
charges, were recorded fully in the prior year.
Adjusted Net IncomeLike EBIT, net income also consists of non-operating effects,
such as the marking to market of derivatives. Adjusted net
income is an earnings figure after interest income, income taxes,
and non-controlling interests that has been adjusted to exclude
non-operating effects. In addition to the marking to market of
derivatives, the adjustments include book gains and book losses
on disposals, certain restructuring expenses, other material
non-operating income and expenses (after taxes and non-con-
trolling interests), and interest expense/income not affecting net
income, which consists of the interest expense/income resulting
from non-operating effects. Adjusted net income also does not
include income/loss from discontinued operations.
As a rule, the E.ON Management Board uses this figure generally
in conjunction with its consistent dividend policy. E.ON will
therefore aim for a payout ratio that is on par with its relevant
peer companies. E.ON will propose a dividend of €0.30 per
share for the 2017 financial year. In conjunction with the planned
acquisition of innogy via a wide-ranging exchange of assets with
RWE we decided to propose a fix dividend of €0.43 per share
for the 2018 fiscal year.
Adjusted Net Income
€ in millions
Fourth quarter Full year
2017 2016 2017 2016
Income/Loss from continuing operations before financial results and income taxes 247 -3,220 4,664 -411
Income/Loss from equity investments -52 -10 -3 -19
EBIT 195 -3,230 4,661 -430
Non-operating adjustments 762 4,031 -1,587 3,542
Adjusted EBIT 957 801 3,074 3,112
Interest expense shown in the consolidated statements of income -82 -113 -41 -1,295
Interest expense (+)/income (-) not affecting net income -87 -221 -703 -157
Operating earnings before interest and taxes 788 467 2,330 1,660
Taxes on operating earnings -227 -91 -613 -478
Operating earnings attributable to non-controlling interests -99 -113 -290 -278
Adjusted net income 462 263 1,427 904

15
Financial Situation
E.ON presents its financial condition using, among other finan-
cial measures, economic net debt, debt factor, and operating
cash flow.
Finance StrategyOur finance strategy focuses on E.ON’s capital structure. Ensur-
ing that E.ON has unrestricted access to capital markets is at
the forefront of this strategy.
With our target capital structure we aim to sustainably secure a
strong BBB/Baa rating.
We manage E.ON’s capital structure using our debt factor,
which is equal to our economic net debt divided by adjusted
EBITDA; it is therefore a dynamic debt metric. Economic net
debt includes not only our financial liabilities but also our provi-
sions for pensions and asset-retirement obligations.
The interest-rate environment remained extremely low. In some
cases this led to negative real interest rates on asset-retirement
obligations. As in the prior year, our provisions therefore
exceeded the amount of our asset-retirement obligations as
they stood at year-end 2017 without factoring in discounting
and cost-escalation effects. This limits the relevance of eco-
nomic net debt as a key figure. We want economic net debt to
serve as a useful key figure that aptly depicts our debt situation.
In the case of material provisions affected by negative real
interest rates, we therefore used the aforementioned actual
amount of the obligation instead of the balance-sheet figure to
calculate our economic net debt since the 2016 financial year.
For the medium term, we target a debt factor of 4.
Economic Net DebtCompared with the figure recorded at December 31, 2016
(€26.3 billion), our economic net debt declined significantly—by
€7.1 billion—to €19.2 billion.
The change in our net financial position predominantly reflects
the capital increase we conducted in March 2017 and our nega-
tive operating cash flow. The latter includes positive effects
from the refund of the nuclear-fuel tax and from our continuing
operations as well as negative effects from the payment into
Germany’s public fund for financing nuclear-waste disposal.
However, because we removed provisions for nuclear-waste
management in the same amount from our balance sheets, the
payment into the fund had no effect on our economic net debt.
Economic Net Debt
€ in millions
December 31
2017 2016
Liquid funds 5,160 8,573
Non-current securities 2,749 4,327
Financial liabilities -13,021 -14,227
FX hedging adjustment 114 390
Net financial position -4,998 -937
Provisions for pensions -3,620 -4,009
Asset-retirement obligations1 -10,630 -21,374
Economic net debt -19,248 -26,320
Adjusted EBITDA 4,955 4,939
Debt factor 3.9 5.3
1These figures are not the same as the asset-retirement obligations shown in our Consolidated
Balance Sheet (December 31, 2017: -€11,673; December 31, 2016: -€22,515 million). This
is because we calculate our economic net debt in part based on the actual amount of our
obligations.

16Business Report
In addition to our DIP, we have a €10 billion European Commer-
cial Paper (“CP”) program and a $10 billion U.S. CP program
under which we can issue short-term notes. As in the prior year,
E.ON had no CP outstanding at year-end 2017.
E.ON also has access to a five-year, €2.75 billion syndicated
revolving credit facility, which was concluded with 18 banks on
November 13, 2017, and which includes two options to extend
the facility, in each case for one year. This facility replaced the
former €3.5 billion facility. This facility is undrawn on and
rather serves as a reliable, ongoing general liquidity reserve for
the E.ON Group. The 18 banks that were invited all participate
in the credit facility and therefore constitute E.ON’s core group
of banks.
Alongside financial liabilities, E.ON has, in the course of its busi-
ness operations, entered into contingencies and other financial
obligations. These include, in particular, guarantees, obligations
from legal disputes and damage claims, current and non-cur-
rent contractual, legal, and other obligations. Notes 26, 27, and
31 to the Consolidated Financial Statements contain more
information about E.ON’s bonds as well as liabilities, contingen-
cies, and other commitments.
E.ON’s creditworthiness has been assessed by Standard &
Poor’s (“S&P”) and Moody’s with long-term ratings of BBB and
Baa2, respectively. In March 2017 both S&P and Moody’s
downgraded E.ON’s rating from BBB+ and Baa1 with a negative
outlook, respectively. The outlook on both ratings is now stable.
The new ratings reflect both agencies’ anticipation that in the
near to medium term E.ON will be able to maintain a leverage
ratio as required for these ratings. E.ON’s short-term ratings
have been unchanged with A-2 (S&P) and P-2 (Moody’s).
E.ON SE Ratings
Long term Short term Outlook
Moody’s Baa2 P-2 Stable
Standard & Poor’s BBB A-2 Stable
Funding Policy and InitiativesThe key objective of our funding policy is for E.ON to have access
to a variety of financing sources at all times. We achieve this
objective through different markets and debt instruments to
maximize the diversity of our investor base. We issue bonds with
tenors that give our debt portfolio a balanced maturity profile.
Moreover, we combine large-volume benchmark issues with
smaller issues that take advantage of market opportunities as
they arise. External funding is generally carried out by E.ON SE,
and the funds are subsequently on-lent in the Group. In the past,
external funding was also carried out by our Dutch finance sub-
sidiary, E.ON International Finance B.V. (“EIF”), under guarantee
of E.ON SE. In May 2017 E.ON SE issued a total of €2 billion in
bonds with maturities of 4.25, 7, and 12 years. In 2017 we also
paid back in full bonds of €0.9 billion and roughly €1.8 billion
that matured in May and October, respectively.
With the exception of a U.S.-dollar-denominated bond issued in
2008, all of E.ON SE and EIF’s currently outstanding bonds
were issued under our Debt Issuance Program (“DIP”). The DIP
enables us to issue debt to investors in public and private place-
ments. E.ON SE’s DIP was last updated in March 2017 with a
total volume of €35 billion, of which about €9 billion was utilized
at year-end 2017. E.ON SE intends to renew the DIP in 2018.
Financial Liabilities
€ in billions
December 31
2017 2016
Bonds1 10.7 11.9
EUR 4.0 4.7
GBP 3.9 4.0
USD 2.5 2.8
JPY 0.2 0.2
Other currencies 0.1 0.2
Promissory notes 0.4 0.4
Commercial paper – –
Other liabilities 1.9 1.9
Total 13.0 14.2
1Includes private placements.
17
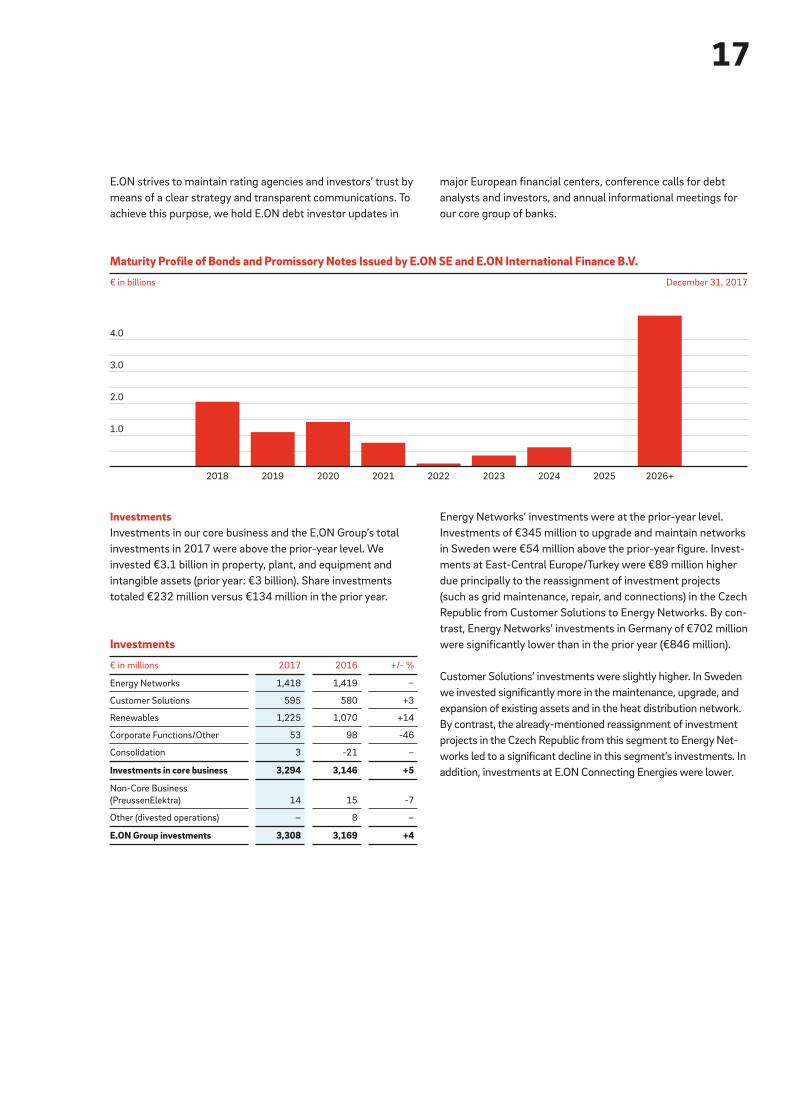
InvestmentsInvestments in our core business and the E.ON Group’s total
investments in 2017 were above the prior-year level. We
invested €3.1 billion in property, plant, and equipment and
intangible assets (prior year: €3 billion). Share investments
totaled €232 million versus €134 million in the prior year.
Investments
€ in millions 2017 2016 +/- %
Energy Networks 1,418 1,419 –
Customer Solutions 595 580 +3
Renewables 1,225 1,070 +14
Corporate Functions/Other 53 98 -46
Consolidation 3 -21 –
Investments in core business 3,294 3,146 +5
Non-Core Business
(PreussenElektra) 14 15 -7
Other (divested operations) – 8 –
E.ON Group investments 3,308 3,169 +4
Energy Networks’ investments were at the prior-year level.
Investments of €345 million to upgrade and maintain networks
in Sweden were €54 million above the prior-year figure. Invest-
ments at East-Central Europe/Turkey were €89 million higher
due principally to the reassignment of investment projects
(such as grid maintenance, repair, and connections) in the Czech
Republic from Customer Solutions to Energy Networks. By con-
trast, Energy Networks’ investments in Germany of €702 million
were significantly lower than in the prior year (€846 million).
Customer Solutions’ investments were slightly higher. In Sweden
we invested significantly more in the maintenance, upgrade, and
expansion of existing assets and in the heat distribution network.
By contrast, the already-mentioned reassignment of investment
projects in the Czech Republic from this segment to Energy Net-
works led to a significant decline in this segment’s investments. In
addition, investments at E.ON Connecting Energies were lower.
4.0
3.0
2.0
1.0
2018 2019 2020 2021 2022 2023 2024 2025 2026+
Maturity Profile of Bonds and Promissory Notes Issued by E.ON SE and E.ON International Finance B.V.
€ in billions December 31, 2017
E.ON strives to maintain rating agencies and investors’ trust by
means of a clear strategy and transparent communications. To
achieve this purpose, we hold E.ON debt investor updates in
major European financial centers, conference calls for debt
analysts and investors, and annual informational meetings for
our core group of banks.

18Business Report
(“VKE i.L.”). Cash-effective investments and disposals of
-€2.5 billion were slightly (-€0.2 billion) above the prior-year level
of -€2.3 billion. Disposals consisted mainly of the upcoming sale
of the operations of Hamburg Netz GmbH at Energy Networks
in Germany and the sale of E.ON Värme Lokala Energilösningar
AB at Customer Solutions in Sweden.
Cash provided by financing activities of continuing operations
amounted to +€0.5 billion compared with -€1.2 billion in the
prior year. The change of +€1.7 billion is primarily attributable
to measures to fund the payment we made in July into Germa-
ny’s public fund for financing nuclear-waste disposal. The mea-
sures consisted mainly of the issuance of €2 billion in bonds,
the €1.35 billion capital increase conducted by E.ON SE in
March 2017, and a €0.6 billion reduction in the dividend payout
to E.ON SE shareholders relative to the prior year. These items
were offset by the repayment of bonds in the fourth quarter of
2017 (-€1.9 billion).
Cash Flow1
€ in millions 2017 2016
Cash provided by (used for) operating
activities of continuing operations
(operating cash flow) -2,952 2,961
Operating cash flow before interest and
taxes -2,235 3,974
Cash provided by (used for) investing
activities -391 -3,041
Cash provided by (used for) financing
activities 540 -1,152
1From continuing operations.
Investments at Renewables were €155 million higher. Onshore
Wind/Solar’s investments increased by €103 million, primarily
because of expenditures for two large new-build projects (Rad-
ford’s Run and Bruenning’s Breeze), which entered service at
the end of 2017. Offshore Wind/Other’s investments increased
by a total of €52 million owing to expenditures in line with our
stake in the Arkona project.
Investments at Non-Core Business (nuclear energy operations
in Germany) were €1 million below the prior-year level.
Cash FlowCash provided by operating activities of continuing operations
of -€3 billion was €5.9 billion below the prior-year level. The
decline resulted primarily from the €10.3 billion payment made
in July 2017 into Germany’s public fund for financing nucle-
ar-waste disposal. This was partially offset by cash inflow in
conjunction with the refund of nuclear-fuel taxes, which, after a
portion of the refund was passed on to co-owners, amounts to
€3.1 billion. An improvement in working capital was another
positive factor.
Cash provided by investing activities of continuing operations of
-€0.4 billion was substantially higher than the prior-year figure
of -€3 billion. The +€2.6 billion change is mainly attributable to
higher net cash inflow from the sale of securities and fixed
deposits as well as the repayment of financial liabilities. Cash
provided by investing activities of continuing operations was
adversely affected by an increase in restricted funds to fulfill
insurance obligations of Versorgungskasse Energie VVaG i.L.

19
Asset Situation
Our total assets and liabilities of €56 billion were about €7.6 billion,
or 12 percent, below the figure from year-end 2016, mainly
because of developments at our nuclear energy business in
Germany which were described above in the commentary on
the change in our economic net debt.
Non-current assets of €40.3 billion were €6.1 billion lower rel-
ative to year-end 2016. The principal factors were the reclassi-
fication of the book value of our Uniper SE stake as an asset
held for sale and the sale of non-current securities.
Current assets decreased by 9 percent, from €17.4 billion to
€15.8 billion. A roughly €3.4 billion decline in liquid funds and a
roughly €1 billion decline in operating receivables and other
operating assets were largely offset, primarily by the reclassifi-
cation of the book value of our Uniper SE stake as an asset held
for sale. The decline in liquid funds is chiefly attributable to the
payment of €10.3 billion into Germany’s public fund for financ-
ing nuclear-waste disposal. To finance this payment, E.ON SE
conducted a roughly €1.35 billion capital increase in the first
quarter of 2017. Furthermore, liquid funds were increased by
the €2 billion bond issuance in the second quarter and the
refund of nuclear-fuel taxes paid in previous years plus interest.
Our equity ratio (including non-controlling interests) at year-end
2017 was 12 percent, which is about 10 percentage points
higher than at year-end 2016. This change reflects the already-
mentioned capital increase, the reduction in total assets and lia-
bilities, as well as our positive net income in 2017. In particular,
the refund of nuclear-fuel taxes paid in previous years had a
positive impact on net income. Equity attributable to shareholders
of E.ON SE was about €4 billion at year-end 2017. Equity
attributable to non-controlling interests was roughly €2.7 billion.
Non-current liabilities decreased by €4.1 billion, or 10 percent,
owing in particular to a reduction in liabilities relating to derivative
financial instruments, lower pension obligations, and a decline in
nuclear-asset-retirement obligations.
In line with Germany’s Act Reorganizing Responsibility for
Nuclear Waste Management, existing nuclear-asset-retirement
obligations at the end of 2016 were met through payment,
resulting in a substantial reduction—€9.1 billion—in current
liabilities relative to year-end 2016.
Consolidated Assets, Liabilities, and Equity
€ in millions
Dec. 31,
2017 %
Dec. 31,
2016 %
Non-current assets 40,164 72 46,296 73
Current assets 15,786 28 17,403 27
Total assets 55,950 100 63,699 100
Equity 6,708 12 1,287 2
Non-current liabilities 35,198 63 39,287 62
Current liabilities 14,044 25 23,125 36
Total equity and liabilities 55,950 100 63,699 100
Additional information about our asset situation is contained in
Notes 4 to 26 to the Consolidated Financial Statements.
20Business Report
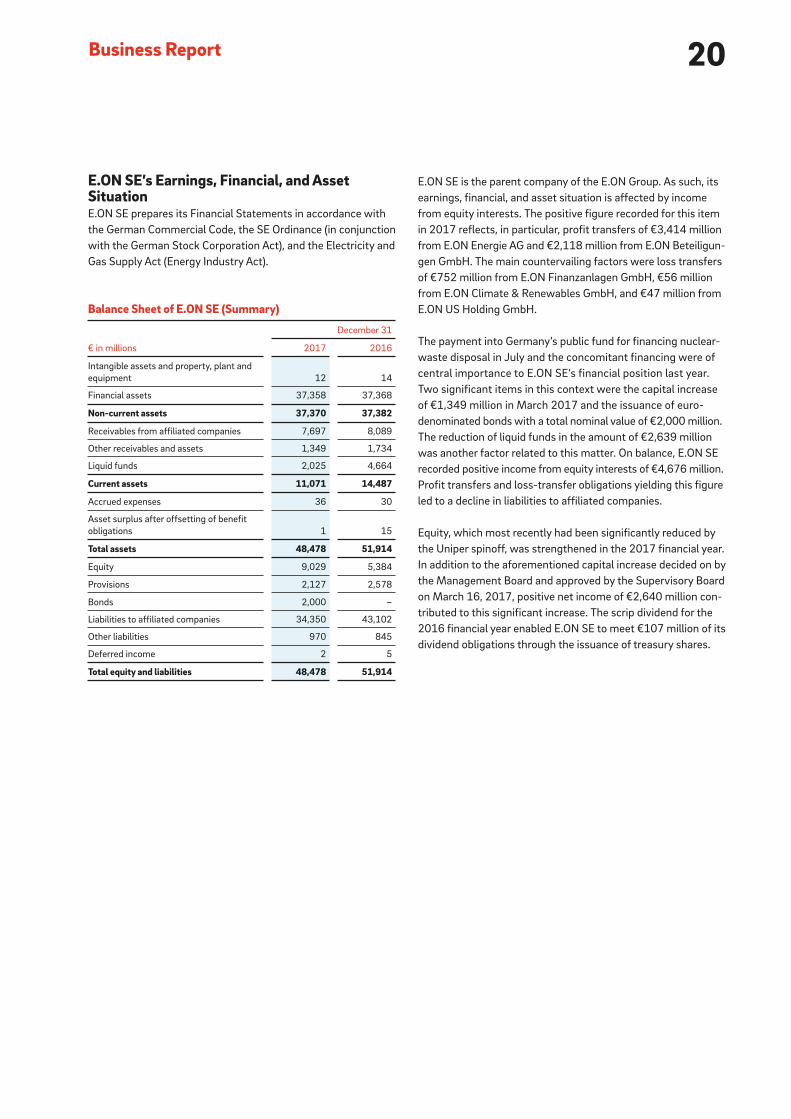
E.ON SE is the parent company of the E.ON Group. As such, its
earnings, financial, and asset situation is affected by income
from equity interests. The positive figure recorded for this item
in 2017 reflects, in particular, profit transfers of €3,414 million
from E.ON Energie AG and €2,118 million from E.ON Beteiligun-
gen GmbH. The main countervailing factors were loss transfers
of €752 million from E.ON Finanzanlagen GmbH, €56 million
from E.ON Climate & Renewables GmbH, and €47 million from
E.ON US Holding GmbH.
The payment into Germany’s public fund for financing nuclear-
waste disposal in July and the concomitant financing were of
central importance to E.ON SE’s financial position last year.
Two significant items in this context were the capital increase
of €1,349 million in March 2017 and the issuance of euro-
denominated bonds with a total nominal value of €2,000 million.
The reduction of liquid funds in the amount of €2,639 million
was another factor related to this matter. On balance, E.ON SE
recorded positive income from equity interests of €4,676 million.
Profit transfers and loss-transfer obligations yielding this figure
led to a decline in liabilities to affiliated companies.
Equity, which most recently had been significantly reduced by
the Uniper spinoff, was strengthened in the 2017 financial year.
In addition to the aforementioned capital increase decided on by
the Management Board and approved by the Supervisory Board
on March 16, 2017, positive net income of €2,640 million con-
tributed to this significant increase. The scrip dividend for the
2016 financial year enabled E.ON SE to meet €107 million of its
dividend obligations through the issuance of treasury shares.
E.ON SE’s Earnings, Financial, and Asset SituationE.ON SE prepares its Financial Statements in accordance with
the German Commercial Code, the SE Ordinance (in conjunction
with the German Stock Corporation Act), and the Electricity and
Gas Supply Act (Energy Industry Act).
Balance Sheet of E.ON SE (Summary)
€ in millions
December 31
2017 2016
Intangible assets and property, plant and
equipment 12 14
Financial assets 37,358 37,368
Non-current assets 37,370 37,382
Receivables from affiliated companies 7,697 8,089
Other receivables and assets 1,349 1,734
Liquid funds 2,025 4,664
Current assets 11,071 14,487
Accrued expenses 36 30
Asset surplus after offsetting of benefit
obligations 1 15
Total assets 48,478 51,914
Equity 9,029 5,384
Provisions 2,127 2,578
Bonds 2,000 –
Liabilities to affiliated companies 34,350 43,102
Other liabilities 970 845
Deferred income 2 5
Total equity and liabilities 48,478 51,914

21
This increased equity by the same amount. By contrast, equity
was reduced by the use of prior-year net income available for
distribution in the amount of €452 million.
Information on treasury shares can be found in Note 19 to the
Consolidated Financial Statements.
The decline in interest income is primarily attributable to the
payment of €754 million to compensate for market-value differ-
ences relating to the transfer of loans to E.ON Finanzholding SE &
Co. KG for the purpose of restructuring liabilities within the Group.
The negative figure recorded under other expenditures and
income results primarily from expenditures of €291 million for
third-party services, personnel expenditures of €163 million,
Income Statement of E.ON SE (Summary)
€ in millions 2017 2016
Income from equity interests 4,676 2,134
Interest income -1,368 -546
Other expenditures and income -497 -551
Taxes -171 -160
Net income 2,640 877
Withdrawal from capital reserve – 3,357
Withdrawals from retained earnings – 3,612
Income reduction from spinoff – -6,969
Net income transferred to retained earnings -1,320 -425
Net income available for distribution 1,320 452
expenditures of €157 million for consulting and auditing services,
and income of €88 million from a necessary adjustment for
certain environmental remediation obligations of predecessor
entities.
Tax expenses consist primarily of income taxes. Applying the
minimum tax rate resulted in corporate taxes of €147 million, a
solidarity surcharge of €8 million, and trade taxes of €167 million
in 2017. Tax income for previous years amounted to €165 million.
This item also includes an expense of €15 million for other taxes.
At the Annual Shareholders Meeting on May 9, 2018, manage-
ment will propose that net income available for distribution be
used to pay a cash dividend of €0.30 per ordinary share and
remaining income available for distribution of €670 million to
be brought forward as retained earnings.
Management’s proposal for the use of net income available for
distribution is based on the number of ordinary shares on
March 12, 2018, the date the Financial Statements of E.ON SE
were prepared.
The complete Financial Statements of E.ON SE, with an unqual-
ified opinion issued by the auditor, PricewaterhouseCoopers
GmbH, Wirtschaftsprüfungsgesellschaft, Düsseldorf, will be
announced in the Bundesanzeiger. Copies are available on
request from E.ON SE and at www.eon.com.

22Business Report
Analyzing Value Creation by Means of ROCE and Value Added ROCE is a pretax total return on capital and is defined as the
ratio of our adjusted EBIT to annual average capital employed.
Annual average capital employed represents the interest-bear-
ing capital invested in our operating business. It is calculated by
subtracting non-interest-bearing available capital from
non-current and current operating assets. Goodwill from acqui-
sitions is included at acquisition cost, as long as this reflects its
fair value. Changes to E.ON’s portfolio during the course of the
year are factored into capital employed.
Annual average capital employed does not include the marking
to market of other share investments. The purpose of excluding
this item is to provide us with a more consistent picture of our
ROCE performance.
Value added measures the return that exceeds the cost of capi-
tal employed. It is calculated as follows:
Value added = (ROCE – cost of capital) x annual average capital
employed.
Other Financial and Non-Financial Performance Indicators
ROCE and Value AddedCost of CapitalThe cost of capital is determined by calculating the weighed-
average cost of equity and debt. This average represents the
market-rate returns expected by stockholders and creditors.
The cost of equity is the return expected by an investor in E.ON
stock. The cost of debt equals the long-term financing terms
that apply in the E.ON Group. The parameters of the
cost-of-capital determination are reviewed on an annual basis.
Our review of the parameters in 2017 led us to increase our
after-tax cost of capital from 4 percent to 4.7 percent, mainly
because of a higher risk-free interest rate which reflected the
development of the overall interest-rate environment. By contrast,
the accompanying decline in the market-risk premium reduced
the cost of equity. The table below shows the derivation of cost
of capital before and after taxes.
Cost of Capital
2017 2016
Risk-free interest rate 1.25% 0.50%
Market premium1 6.25% 6.75%
Debt-free beta factor 0.50 0.50
Indebted beta factor2 1.01 0.92
Cost of equity after taxes 7.50% 6.70%
Average tax rate 27% 31%
Cost of equity before taxes 10.3% 9.7%
Cost of debt before taxes 2.4% 2.6%
Marginal tax rate 27% 31%
Cost of debt after taxes 1.80% 1.80%
Share of equity 50% 45%
Share of debt 50% 55%
Cost of capital after taxes 4.70% 4.00%
Cost of capital before taxes 6.40% 5.80%
1The market premium reflects the higher long-term returns of the stock market compared
with German treasury notes.2The beta factor is used as an indicator of a stock’s relative risk. A beta of more than one
signals a higher risk than the risk level of the overall market; a beta factor of less than one
signals a lower risk.
23
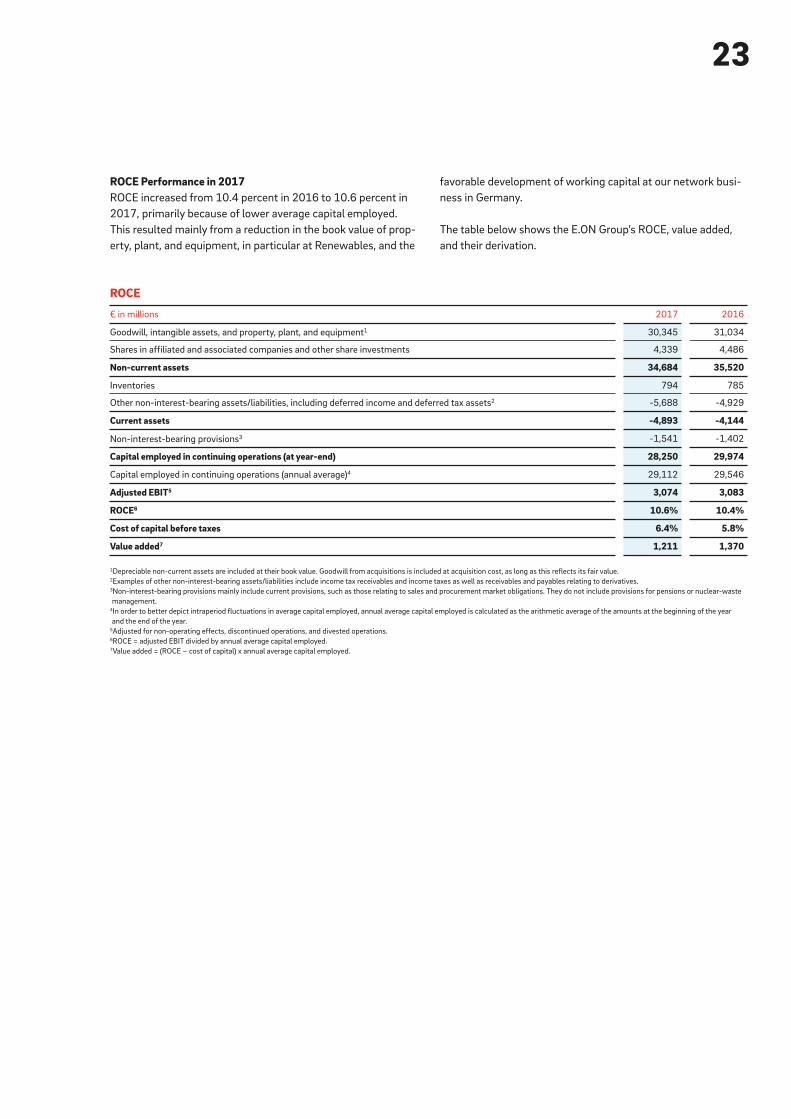
ROCE Performance in 2017ROCE increased from 10.4 percent in 2016 to 10.6 percent in
2017, primarily because of lower average capital employed.
This resulted mainly from a reduction in the book value of prop-
erty, plant, and equipment, in particular at Renewables, and the
favorable development of working capital at our network busi-
ness in Germany.
The table below shows the E.ON Group’s ROCE, value added,
and their derivation.
ROCE
€ in millions 2017 2016
Goodwill, intangible assets, and property, plant, and equipment1 30,345 31,034
Shares in affiliated and associated companies and other share investments 4,339 4,486
Non-current assets 34,684 35,520
Inventories 794 785
Other non-interest-bearing assets/liabilities, including deferred income and deferred tax assets2 -5,688 -4,929
Current assets -4,893 -4,144
Non-interest-bearing provisions3 -1,541 -1,402
Capital employed in continuing operations (at year-end) 28,250 29,974
Capital employed in continuing operations (annual average)4 29,112 29,546
Adjusted EBIT5 3,074 3,083
ROCE6 10.6% 10.4%
Cost of capital before taxes 6.4% 5.8%
Value added7 1,211 1,370
1Depreciable non-current assets are included at their book value. Goodwill from acquisitions is included at acquisition cost, as long as this reflects its fair value.2Examples of other non-interest-bearing assets/liabilities include income tax receivables and income taxes as well as receivables and payables relating to derivatives.3Non-interest-bearing provisions mainly include current provisions, such as those relating to sales and procurement market obligations. They do not include provisions for pensions or nuclear-waste
management.4In order to better depict intraperiod fluctuations in average capital employed, annual average capital employed is calculated as the arithmetic average of the amounts at the beginning of the year
and the end of the year. 5Adjusted for non-operating effects, discontinued operations, and divested operations.6ROCE = adjusted EBIT divided by annual average capital employed.7Value added = (ROCE – cost of capital) x annual average capital employed.

24Business Report
investor organizations. It helps investors assess whether a com-
pany adequately addresses climate change in its decisions and
business processes. Furthermore, E.ON continues to be listed in
both the European “Euronext Vigeo 120” indices.
Highlights in 2017We conduct our sustainability activities to address environ-
mental, social, and governance issues in a balanced way. Our
objective is to achieve continual improvement, thereby becom-
ing a leading sustainability company in our industry. We have
defined five material areas that are the focus of our Group-
wide sustainability activities:
• We listen to our customers and treat them fairly.
• We help customers optimize their energy usage.
• We build and integrate renewable generating capacity.
• We protect the health and safety of our customers and
colleagues.
• We foster diversity and inclusion in our workforce.
These activities also support the achievement of the United
Nations’ Sustainable Development Goals. In particular, we help
give access to affordable, reliable, sustainable, and clean
energy and help protect the earth’s climate.
Information about our sustainability approach, programs, and
progress as well as detailed information about our emissions
and climate-protection efforts can be found in our 2017 Sus-
tainability Report and the CNFR, which were published online
at eon.com/sustainabilityreport at the same time as this
Annual Report.1 The Sustainability Report and CNFR are not
part of the Combined Group Management Report.
Corporate SustainabilityMany and diverse stakeholders—customers and suppliers, poli-
cymakers and government agencies, employees and trade
unions, non-governmental organizations and regional interest
groups, equity analysts and investors—have high expectations of
us and the entire energy industry. We have therefore conducted
a systematic process at regular intervals since 2006. Its purpose
is to identify our stakeholders’ expectations of us. Our annual
online Sustainability Report describes the issues that are mate-
rial to our stakeholders and to us as a company as well as how
we address these issues. Our reporting is based on the Global
Reporting Initiative’s most recent Sustainability Reporting Stan-
dards (“GRI SRS”) from 2016.
In addition, this year we are disclosing, for the first time, a sepa-
rate Combined Non-Financial Report (“CNFR”), which will be
published as a separate document on our website. It too is based
on the GRI SRS and describes how we address environmental,
employee, and social matters as well as human rights and
anti-corruption. The CNFR complies with the reporting require-
ments of the German CSR Directive Implementation Act (Sec-
tions 289b–e, Section 315b-c of the German Commercial Code).
Sustainability Ratings and RankingsOur commitment to transparency includes subjecting our sus-
tainability performance to independent, detailed assessments
by specialized agencies and capital-market analysts. The results
of these assessments provide important guidance to investors
and to us. They help us identify our strengths and weaknesses
and further improve our performance.
In 2017 we were again included in the RobecoSAM Sustainabil-
ity Yearbook and, as a leading company, received a silver rating.
In addition, CDP (formerly the Carbon Disclosure Project)
awarded E.ON a high grade of A- for the quality, processes, and
transparency of our reporting on our carbon emissions and cli-
mate change. The CDP is one of the world’s largest international
1Direct link to the separate Combined Non-Financial Report 2017: www.eon.com/content/dam/eon/eon-com/Documents/en/sustainability-report/nonfinancialreport2017.pdf.

25
EmployeesPeople StrategyWe developed our People Strategy to enable E.ON to maintain
continuity in times of change, independent of how the organiza-
tion structures its business or how we adjust our strategic pri-
orities in order to meet customer needs.
The three focus areas of our People Strategy are: Preparing Our
People for the Future, Providing Opportunities, and Recognizing
Performance. In 2017 we continued to bring these focus areas
to life. The initiatives we implemented during the year included:
• implementing [email protected], a Group-wide framework for the
personal and professional development of our employees
and managers (Preparing for the Future)
• expanding our existing talent programs and establishing tal-
ent boards to ensure that the personal development plans of
our employees and managers are optimally tailored to
E.ON’s needs (Providing Opportunities)
• introducing the YES! Awards, a way we recognize outstand-
ing achievements as they happen and further motivate
employees (Recognizing Performance).
In addition, we continued the process of digitizing our HR offer-
ings. In particular, the basic components of [email protected] consist
of modern applications harnessing the potential of advanced IT
solutions, such as Cloud-based platforms that can be accessed
from anywhere.
In 2017 the HR team and the E.ON SE Management Board
developed and approved People Commitments to adopt an
appropriate approach to decentralization, which is a basic
principle of the Phoenix program. The People Commitments
establish twelve principles that articulate our values and how
we treat our employees. These principles are binding for the
entire E.ON Group. At the same time, we provide support to
E.ON units so that they can adopt these principles in a way that
reflects their particular legal, cultural, and business environment.
The goal of the People Commitments is to create a workplace:
• where E. ON’s values and leadership principles are put into
practice
• where employees can achieve outstanding results and realize
their potential
• where employees can develop their skills and talents
• that promotes a fair, diverse, and equitable work culture
• that systematically ensures that we comply with the law and
meet our customers’ needs.
Completion of Employee Assignments under One2twoAs planned, the assignment of employees under the One2two
program was completed in 2016. To ensure the continuity of IT
support, however, E.ON Business Services was not divided until
after the Uniper split. All employees of E.ON Business Services
were assigned to E.ON or Uniper. In line with the rules worked out
for One2two and by mutual agreement between management
and local employee representatives, employees were transferred
in two stages, on January 1 and July 1, 2017, respectively.
The employees assigned to E.ON remained at the same legal
entities; those assigned to Uniper were transferred to the
respective Uniper companies.

26Business Report
In addition, the Company and the Group Works Council of E.ON
SE concluded a Supplementary Agreement to the above-men-
tioned Joint Declaration and Framework Agreement of the
Management Board of E.ON SE, the Executive Committee of
the SE Works Council of E.ON SE, and the Group Works Council
of E.ON SE. The Supplementary Agreement affects E.ON
employees in Germany. It named the negotiators for the negoti-
ation of reconciliations of interests, created a mechanism for
early voluntary termination, established measures to ensure
business continuity for Group companies affected by Phoenix,
and defined principles for filling vacancies.
Collaborative Partnership with Employee Representatives Working with employee representatives as partners has a long
tradition at E.ON. This collaborative partnership is integral to our
corporate culture.
At a European level, E.ON management works closely with the
SE Works Council of E.ON SE, which consists of representatives
from all European countries in which E.ON operates. Under
the SE Agreement, the SE Works Council of E.ON SE is informed
and consulted about issues that transcend national borders.
A special emphasis is placed on early and open discussion of
employee matters.
Prior to E.ON’s adoption of a functionally oriented management
model, in 2014 management and the Group Works Council in
Germany concluded the Agreement on Future Social Partnership
in the Context of the Functionally Oriented Management Model.
The agreement, which stipulates the principles of the social
partnership at E.ON’s operations in Germany, manifests a shared
responsibility for the Company and its employees. It has proven
its worth and remains to this day the foundation for a successful
social partnership at E.ON.
Phoenix and the Involvement of Employee RepresentativesE.ON designed the Phoenix program in 2016 to make itself fit
for the future in the wake of the Uniper spinoff. The program
aims to optimize E.ON’s organizational setup and processes, to
reduce bureaucracy and complexity, to delegate authority, and
to make us faster, more agile, and closer to our customers. This
will give more decision-making authority to customer-proximate
functions and integrate support functions like IT and Procure-
ment more closely with our operating business. This restructuring
is aimed at eliminating tasks and thus up to 1,300 jobs across
E.ON, including up to 1,000 in Germany. In 2017 we negotiated
about 700 staff reductions with employee representatives. To
achieve these staff reductions we concluded individual, mutu-
ally acceptable agreements with employees. Negotiations for IT
(outsourcing) and Procurement will be concluded in 2018. In
the interest of all employees, new hiring will be actively limited
during Phoenix.
Phoenix too has been conducted in keeping with our well-es-
tablished tradition of working with employee representatives
and involving them early. A Joint Declaration and Framework
Agreement of the Management Board of E.ON SE, the Executive
Committee of the SE Works Council of E.ON SE, and the Group
Works Council of E.ON SE was agreed on in November 2016
and thus at a very early stage of Phoenix. This document will
serve as the foundation for management and employee repre-
sentatives to work together openly and constructively through-
out Phoenix. A Project Council consisting of high-ranking
employee representatives from the European SE Works Council
of E.ON SE and the German Group Works Council of E.ON SE
met periodically, was informed in advance of implementation
measures, and was thus actively involved in the project. If the
Project Council had suggestions about a measure, management
discussed these suggestion with the council and evaluated and
considered them before the measure was implemented.
27
vision continue to be translated into specific behaviors. In addi-
tion, we completely revised our talent landscape in order to give
all parts of E.ON the flexibility to individually plan professional
and career development and to provide them with tools to iden-
tify talented employees.
Professional DevelopmentFollowing the announcement of the Phoenix reorganization pro-
gram in March 2017, professional development at E.ON was
also largely decentralized. Group HR supported the program
with accompanying measures. For example, we adjusted the
HR Online Learning App, our learning platform launched in 2016,
and all its processes and data to meet the requirements of
decentralization. We also introduced CrossKnowledge, a new
Group-wide digital platform that makes selected e-Learning
programs available to E.ON employees. Furthermore, HR sup-
ported the Phoenix change process by making an online change
support package available to managers and employees. The
package contains tools that help them deal with the special
challenges of restructuring. Leadership 2020, a program launched
in 2016 to systematically prepare our leaders for the new lead-
ership requirements in the digital age, continued in 2017, as did
a streamlined version of our Learning Take-Away Days.
Consequently, the mechanisms are in place for mutually trustful,
respectful, and transparent dialog between management and
employee representatives at a European and national level. For
the benefit of our employees and our company, management
and employee representatives’ shared objective is for this proven
collaborative partnership to continue in the future.
Talent Management In 2017 E.ON again took a variety of successful steps to hire
highly qualified people and to foster our employees’ ongoing
personal and professional development.
E.ON’s status as a top employer was again confirmed by “Top
Employer” and other prestigious rankings.
This recognition was one of the reasons we were able to attract
outstanding talent, including recent university graduates. The
E.ON Graduate Program remained a very compelling offer for
graduates to join our company. Participants are assigned a
mentor, receive special training, and gain experience during
placements at their home E.ON unit as well as at other units in
the same country and elsewhere.
The foundation of our strategic, needs-oriented talent manage-
ment is the Management Review Process, which we conducted
again in 2017. It helps ensure the continued professional devel-
opment of managers and executives, our various units and job
families, and the entire organization. It also creates transparency
about our current talent situation and our needs for the future.
In 2017 we also introduced [email protected], our new Group-wide
competency model, and embedded it into our processes. Feed-
back is an important part of our corporate culture and is now
provided through [email protected], which includes solutions to sup-
port our employees’ development. [email protected] also plays a
role in filling vacancies, helping to ensure that the values of our

28Business Report
Our approach to promoting diversity is holistic, encompassing
all dimensions of diversity. It ensures equal opportunity for all
employees and fosters and harnesses diversity in an individual
way. However, we prioritize three dimensions: gender, age, and
internationality.
In 2017 we again implemented numerous measures to pro-
mote diversity at E.ON. An important purpose of these mea-
sures is to foster the career development of female managers.
We set new, ambitious targets to increase the proportion of
women in management positions. By year-end 2026, we want
the proportion of women in management positions to be the
same—32 percent—as the proportion of women in our overall
workforce was at year-end 2016. Each unit has specific targets,
and progress towards these targets is monitored at regular
intervals. We also have Group-wide recruiting and hiring guide-
lines for management positions. These guidelines require that
least one male and one female must be on the short list for a
vacant management position. Through these measures, the
proportion of women in management positions rose from just
over 11 percent in 2010 to 19.6 percent at year-end 2017 for
the Group as a whole and from 9 percent to 15.3 percent for
Germany. Our units have had support mechanisms for female
managers in place for a number of years. These mechanisms
include mentoring programs for female next-generation man-
agers, coaching, unconscious-bias training, the provision of
daycare, and flexible work schedules. Increasing the percentage
of women in our internal talent pool is a further prerequisite for
raising, over the long term, their percentage in management
and top executive positions.
Our central Learning Management System recorded 119,893
enrollments (prior year: 109,036) in formal learning offerings in
2017. This equals 91,503 days (prior year: 72,805 days) of
classroom training, which accounted for 60 percent (prior year:
70 percent) of our total training offerings. On average, each
employee received 2.1 days of training in 2017 (prior year:
1.7 days). We do not record the duration of use of our online
learning programs.
DiversityDiversity is a key element of E.ON’s competitiveness. Diversity
and an appreciative corporate culture promote creativity and
innovation. This is a central aspect of the E.ON vision as well.
E.ON brings together a diverse team of people who differ by
nationality, age, gender, disability, religion, and/or cultural and
social background. We foster and utilize diversity in specific
ways and create an inclusive work environment. Diversity is a
key success factor. Numerous studies have shown that hetero-
geneous teams outperform homogenous ones. Diversity is
equally crucial in view of demographic trends. Going forward,
only those companies that embrace diversity will be able to
remain attractive employers and be less affected by the short-
age of skilled workers. In addition, a diverse workforce enables
us to do an even better job of meeting our customers’ needs
and requirements. In 2006 we issued a Group Policy on Equal
Opportunity and Diversity. In 2016 E.ON along with the SE
Works Council of E.ON SE renewed this commitment to diver-
sity. In 2008 E.ON publicly affirmed its commitment to fairness
and respect by signing the German Diversity Charter, which
now has about 2,700 signatories. E.ON therefore belongs to a
large network of companies committed to diversity, tolerance,
fairness, and respect.

29
Energy Networks’ headcount increased principally because of
the transfer of employees from Customer Solutions in the
Czech Republic and the filling of vacancies (in Germany, pre-
dominantly with apprentices who had completed their training).
The number of employees at Customer Solutions increased
slightly. Although the transfer of employees to Uniper, to
non-consolidated companies, and to Energy Networks in the
Czech Republic reduced Customer Solutions’ headcount, this
was more than offset by the filling of vacancies in Hungary and
Romania and the hiring of staff for our service business in the
United Kingdom and for our sales business in Italy.
The expansion of Renewables’ business in the United States led
to a slight increase in its headcount.
In particular, the transfer of E.ON Business Services employees
to Uniper led to the significant decline in the number of
employees at Corporate Functions/Other.
Non-Core Business consists of our nuclear energy business in
Germany. Its headcount decreased mainly because of retire-
ments and the expiration of temporary employment contracts.
This was partially counteracted by the hiring of apprentices
who had completed their training.
We conducted activities and initiatives throughout 2017 to
enable all of our employees to experience difference and diver-
sity and to raise their awareness of the contribution made by
each individual. For example, we hosted an exhibition on dis-
ability and commemorated International Women’s Day across
our company.
Many of these measures are already having an impact. Our
progress is receiving recognition outside our company as well.
For example, E.ON received the Total E-Quality Seal for exem-
plary HR policies based on equal opportunity and diversity for
the third year in a row.
More information about E.ON’s compliance with Germany’s
Law for the Equal Participation of Women and Men in Leader-
ship Positions in the Private Sector and the Public Sector can be
found in the management’s statement regarding this law.
Workforce FiguresAt year-end 2017 the E.ON Group had 42,699 employees
worldwide, slightly less (-1 percent) than at year-end 2016.
E.ON also had 942 apprentices in Germany and 129 board
members and managing directors worldwide.
Employees1
Headcount
December 31
+/- %2017 2016
Energy Networks 17,281 16,814 +3
Customer Solutions 19,222 19,106 +1
Renewables 1,206 1,082 +11
Corporate Functions/Other2 3,078 4,102 -25
Core business 40,787 41,104 -1
Non-Core Business
(PreussenElektra) 1,912 2,034 -6
E.ON Group 42,699 43,138 -1
1Does not include board members, managing directors, or apprentices.2Includes E.ON Business Services.
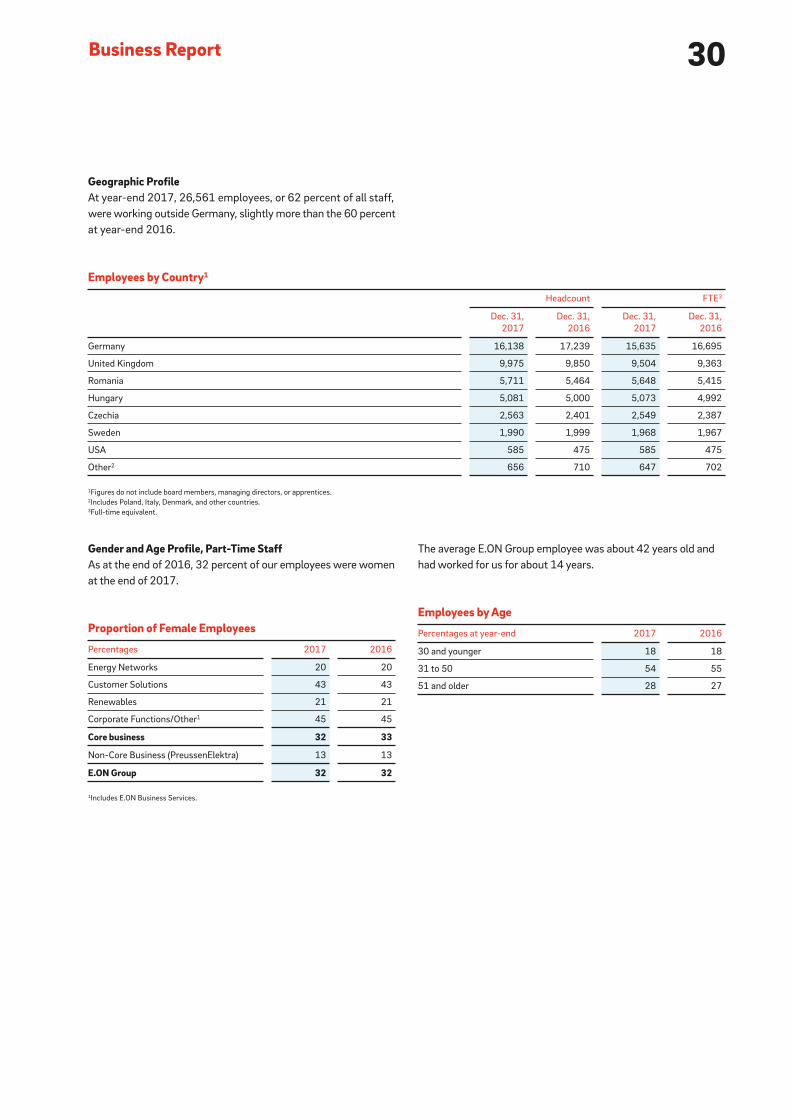
30Business Report
The average E.ON Group employee was about 42 years old and
had worked for us for about 14 years.
Employees by Age
Percentages at year-end 2017 2016
30 and younger 18 18
31 to 50 54 55
51 and older 28 27
Geographic ProfileAt year-end 2017, 26,561 employees, or 62 percent of all staff,
were working outside Germany, slightly more than the 60 percent
at year-end 2016.
Employees by Country1
Headcount FTE3
Dec. 31,
2017
Dec. 31,
2016
Dec. 31,
2017
Dec. 31,
2016
Germany 16,138 17,239 15,635 16,695
United Kingdom 9,975 9,850 9,504 9,363
Romania 5,711 5,464 5,648 5,415
Hungary 5,081 5,000 5,073 4,992
Czechia 2,563 2,401 2,549 2,387
Sweden 1,990 1,999 1,968 1,967
USA 585 475 585 475
Other2 656 710 647 702
1Figures do not include board members, managing directors, or apprentices.2Includes Poland, Italy, Denmark, and other countries. 3Full-time equivalent.
Gender and Age Profile, Part-Time Staff As at the end of 2016, 32 percent of our employees were women
at the end of 2017.
Proportion of Female Employees
Percentages 2017 2016
Energy Networks 20 20
Customer Solutions 43 43
Renewables 21 21
Corporate Functions/Other1 45 45
Core business 32 33
Non-Core Business (PreussenElektra) 13 13
E.ON Group 32 32
1Includes E.ON Business Services.

31
A total of 3,395 employees, or 8 percent of all E.ON Group
employees, were on a part-time schedule. Of these, 2,794, or
82 percent, were women.
The turnover rate resulting from voluntary terminations aver-
aged 4.6 percent across the organization, lower than in the prior
year (5.3 percent).
Part-Time Rate
Percentages 2017 2016
Energy Networks 5 4
Customer Solutions 11 11
Renewables 3 3
Corporate Functions/Other1 12 12
Core business 8 8
Non-Core Business (PreussenElektra) 6 5
E.ON Group 8 8
1Includes E.ON Business Services.
Turnover Rate
Percentages 2017 2016
Energy Networks 1.7 4.1
Customer Solutions 6.7 6.0
Renewables 9.3 8.1
Corporate Functions/Other1 8.6 7.7
Core business 4.8 5.5
Non-Core Business (PreussenElektra) 2.1 1.7
E.ON Group 4.6 5.3
1Includes E.ON Business Services.
Occupational Health and Safety Occupational health and safety have the highest priority at
E.ON. A key performance indicator (“KPI”) for our safety is total
recordable injury frequency (“TRIF”)—which measures the
number of reported fatalities, lost-time injuries, restricted-work
injuries, and medical-treatment injuries that occur on the job—per
million hours of work. Our TRIF figures also include E.ON com-
panies that are not fully consolidated but over which E.ON has
operational control. E.ON employees’ TRIF in 2017 was 2.3, the
same low level as in the prior year (2.5).
Unfortunately, three E.ON employees, one of whom was an
apprentice, died on the job in 2017, and another suffered fatal
injuries in a traffic accident. In addition, a contractor employee
died while working for us. The accidents occurred in Germany,
the United Kingdom, and Romania; regrettably, two employees
died in Turkey.
To continually improve their safety performance, our units have
in place certified health, safety, and environment (“HSE”) man-
agement systems in accordance with international standards.
They also develop HSE improvement plans based on a manage-
ment review. In addition, all units were required to participate in
a specially designed HSE leadership training module developed
in the prior year and to review risks posed by new customer
solutions.
The healthcare systems of the countries we operate in differ con-
siderably in terms of their delivery of medical care, their health-
insurance and pension systems, and their legal requirements for
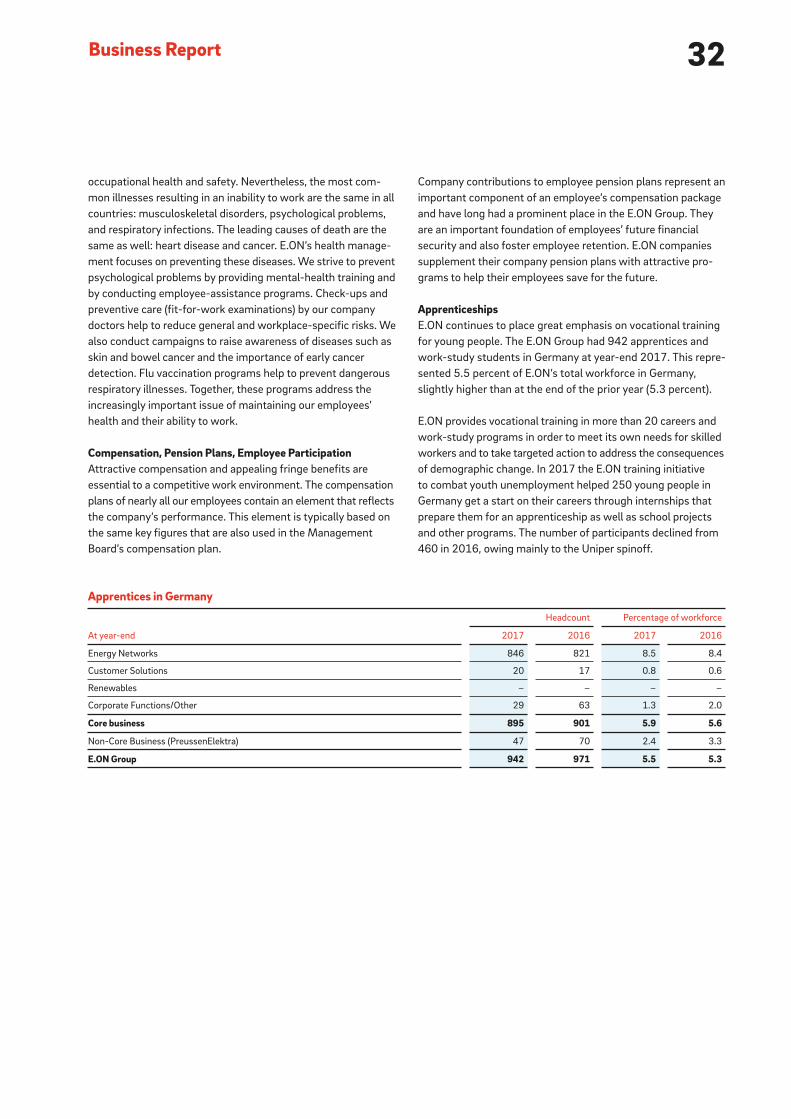
32Business Report
Company contributions to employee pension plans represent an
important component of an employee’s compensation package
and have long had a prominent place in the E.ON Group. They
are an important foundation of employees’ future financial
security and also foster employee retention. E.ON companies
supplement their company pension plans with attractive pro-
grams to help their employees save for the future.
ApprenticeshipsE.ON continues to place great emphasis on vocational training
for young people. The E.ON Group had 942 apprentices and
work-study students in Germany at year-end 2017. This repre-
sented 5.5 percent of E.ON’s total workforce in Germany,
slightly higher than at the end of the prior year (5.3 percent).
E.ON provides vocational training in more than 20 careers and
work-study programs in order to meet its own needs for skilled
workers and to take targeted action to address the consequences
of demographic change. In 2017 the E.ON training initiative
to combat youth unemployment helped 250 young people in
Germany get a start on their careers through internships that
prepare them for an apprenticeship as well as school projects
and other programs. The number of participants declined from
460 in 2016, owing mainly to the Uniper spinoff.
occupational health and safety. Nevertheless, the most com-
mon illnesses resulting in an inability to work are the same in all
countries: musculoskeletal disorders, psychological problems,
and respiratory infections. The leading causes of death are the
same as well: heart disease and cancer. E.ON’s health manage-
ment focuses on preventing these diseases. We strive to prevent
psychological problems by providing mental-health training and
by conducting employee-assistance programs. Check-ups and
preventive care (fit-for-work examinations) by our company
doctors help to reduce general and workplace-specific risks. We
also conduct campaigns to raise awareness of diseases such as
skin and bowel cancer and the importance of early cancer
detection. Flu vaccination programs help to prevent dangerous
respiratory illnesses. Together, these programs address the
increasingly important issue of maintaining our employees’
health and their ability to work.
Compensation, Pension Plans, Employee ParticipationAttractive compensation and appealing fringe benefits are
essential to a competitive work environment. The compensation
plans of nearly all our employees contain an element that reflects
the company’s performance. This element is typically based on
the same key figures that are also used in the Management
Board’s compensation plan.
Apprentices in Germany
At year-end
Headcount Percentage of workforce
2017 2016 2017 2016
Energy Networks 846 821 8.5 8.4
Customer Solutions 20 17 0.8 0.6
Renewables – – – –
Corporate Functions/Other 29 63 1.3 2.0
Core business 895 901 5.9 5.6
Non-Core Business (PreussenElektra) 47 70 2.4 3.3
E.ON Group 942 971 5.5 5.3
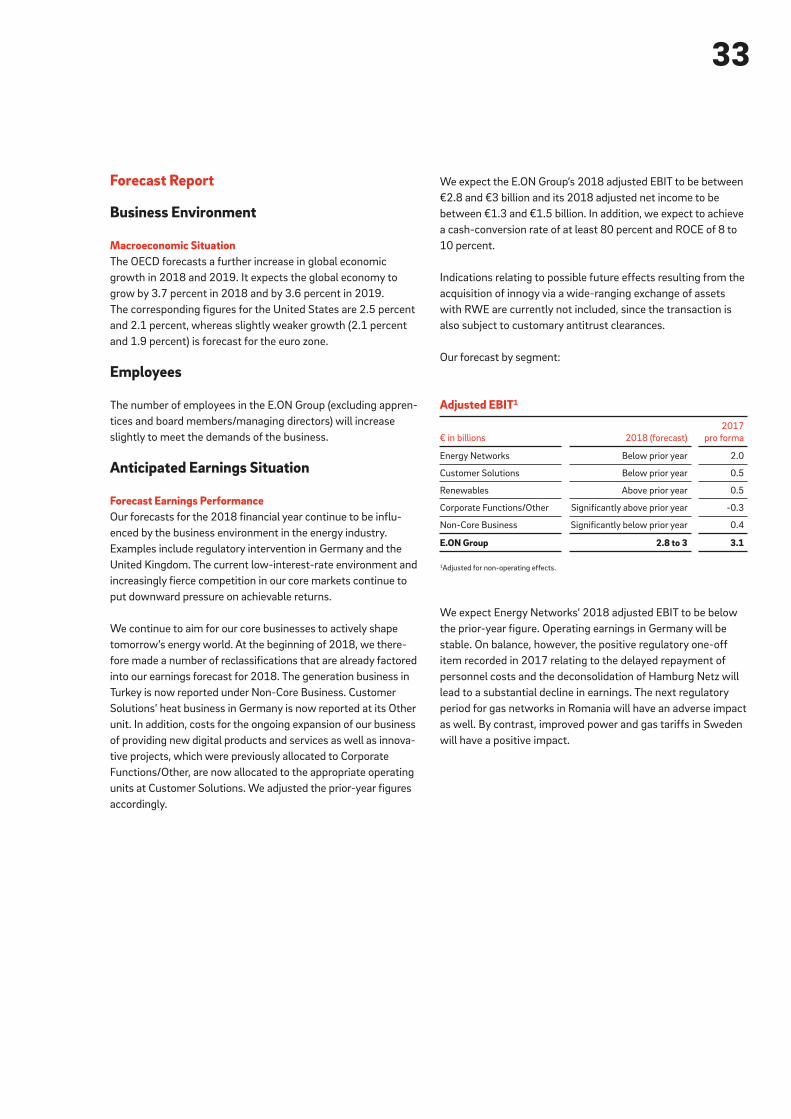
33
We expect the E.ON Group’s 2018 adjusted EBIT to be between
€2.8 and €3 billion and its 2018 adjusted net income to be
between €1.3 and €1.5 billion. In addition, we expect to achieve
a cash-conversion rate of at least 80 percent and ROCE of 8 to
10 percent.
Indications relating to possible future effects resulting from the
acquisition of innogy via a wide-ranging exchange of assets
with RWE are currently not included, since the transaction is
also subject to customary antitrust clearances.
Our forecast by segment:
We expect Energy Networks’ 2018 adjusted EBIT to be below
the prior-year figure. Operating earnings in Germany will be
stable. On balance, however, the positive regulatory one-off
item recorded in 2017 relating to the delayed repayment of
personnel costs and the deconsolidation of Hamburg Netz will
lead to a substantial decline in earnings. The next regulatory
period for gas networks in Romania will have an adverse impact
as well. By contrast, improved power and gas tariffs in Sweden
will have a positive impact.
Adjusted EBIT1
€ in billions 2018 (forecast)
2017
pro forma
Energy Networks Below prior year 2.0
Customer Solutions Below prior year 0.5
Renewables Above prior year 0.5
Corporate Functions/Other Significantly above prior year -0.3
Non-Core Business Significantly below prior year 0.4
E.ON Group 2.8 to 3 3.1
1Adjusted for non-operating effects.
Forecast Report
Business Environment
Macroeconomic Situation The OECD forecasts a further increase in global economic
growth in 2018 and 2019. It expects the global economy to
grow by 3.7 percent in 2018 and by 3.6 percent in 2019.
The corresponding figures for the United States are 2.5 percent
and 2.1 percent, whereas slightly weaker growth (2.1 percent
and 1.9 percent) is forecast for the euro zone.
Employees
The number of employees in the E.ON Group (excluding appren-
tices and board members/managing directors) will increase
slightly to meet the demands of the business.
Anticipated Earnings Situation
Forecast Earnings Performance Our forecasts for the 2018 financial year continue to be influ-
enced by the business environment in the energy industry.
Examples include regulatory intervention in Germany and the
United Kingdom. The current low-interest-rate environment and
increasingly fierce competition in our core markets continue to
put downward pressure on achievable returns.
We continue to aim for our core businesses to actively shape
tomorrow’s energy world. At the beginning of 2018, we there-
fore made a number of reclassifications that are already factored
into our earnings forecast for 2018. The generation business in
Turkey is now reported under Non-Core Business. Customer
Solutions’ heat business in Germany is now reported at its Other
unit. In addition, costs for the ongoing expansion of our business
of providing new digital products and services as well as innova-
tive projects, which were previously allocated to Corporate
Functions/Other, are now allocated to the appropriate operating
units at Customer Solutions. We adjusted the prior-year figures
accordingly.
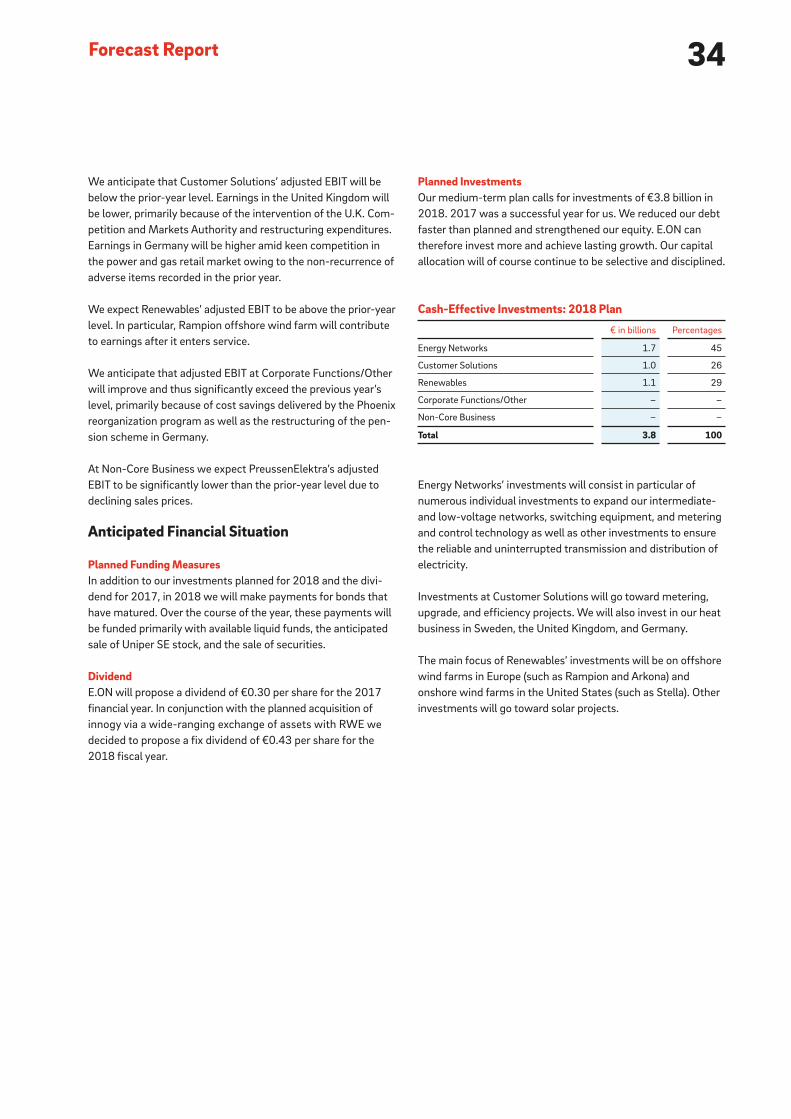
34Forecast Report
We anticipate that Customer Solutions’ adjusted EBIT will be
below the prior-year level. Earnings in the United Kingdom will
be lower, primarily because of the intervention of the U.K. Com-
petition and Markets Authority and restructuring expenditures.
Earnings in Germany will be higher amid keen competition in
the power and gas retail market owing to the non-recurrence of
adverse items recorded in the prior year.
We expect Renewables’ adjusted EBIT to be above the prior-year
level. In particular, Rampion offshore wind farm will contribute
to earnings after it enters service.
We anticipate that adjusted EBIT at Corporate Functions/Other
will improve and thus significantly exceed the previous year’s
level, primarily because of cost savings delivered by the Phoenix
reorganization program as well as the restructuring of the pen-
sion scheme in Germany.
At Non-Core Business we expect PreussenElektra’s adjusted
EBIT to be significantly lower than the prior-year level due to
declining sales prices.
Anticipated Financial Situation
Planned Funding MeasuresIn addition to our investments planned for 2018 and the divi-
dend for 2017, in 2018 we will make payments for bonds that
have matured. Over the course of the year, these payments will
be funded primarily with available liquid funds, the anticipated
sale of Uniper SE stock, and the sale of securities.
DividendE.ON will propose a dividend of €0.30 per share for the 2017
financial year. In conjunction with the planned acquisition of
innogy via a wide-ranging exchange of assets with RWE we
decided to propose a fix dividend of €0.43 per share for the
2018 fiscal year.
Planned InvestmentsOur medium-term plan calls for investments of €3.8 billion in
2018. 2017 was a successful year for us. We reduced our debt
faster than planned and strengthened our equity. E.ON can
therefore invest more and achieve lasting growth. Our capital
allocation will of course continue to be selective and disciplined.
Energy Networks’ investments will consist in particular of
numerous individual investments to expand our intermediate-
and low-voltage networks, switching equipment, and metering
and control technology as well as other investments to ensure
the reliable and uninterrupted transmission and distribution of
electricity.
Investments at Customer Solutions will go toward metering,
upgrade, and efficiency projects. We will also invest in our heat
business in Sweden, the United Kingdom, and Germany.
The main focus of Renewables’ investments will be on offshore
wind farms in Europe (such as Rampion and Arkona) and
onshore wind farms in the United States (such as Stella). Other
investments will go toward solar projects.
Cash-Effective Investments: 2018 Plan
€ in billions Percentages
Energy Networks 1.7 45
Customer Solutions 1.0 26
Renewables 1.1 29
Corporate Functions/Other – –
Non-Core Business – –
Total 3.8 100
35
“Let’s create a better tomorrow” and “Improve people’s lives”
are our promises for a better future. We want our customers to
feel that they are in better hands with us than with our compet-
itors. In addition, E.ON needs to be perceived as an even more
attractive employer by current and future employees. To get
there, we will continue to work together closely, including with
our employee representatives.
The planned sale of our Uniper stake is another important step
in the consolidation of our balance sheet. We now see an oppor-
tunity to surpass our debt-reduction target and invest in growth.
Our growth targets for E.ON and our strategy for achieving
them will enable our core businesses to continue to actively
shape tomorrow’s energy world: by making electricity grids
smarter, by designing individually tailored energy solutions for
our customers, and by adding more renewables. Each of these
businesses has a lot of potential. As we move forward, we
intend to make clearer what E.ON will stand for in the future.
Indications relating to possible future effects resulting from the
acquisition of innogy via a wide-ranging exchange of assets
with RWE are currently not included, since the transaction is
also subject to customary antitrust clearances.
General Statement on E.ON’s Future Development
The business environment in the energy industry—regulatory
interventions in Germany and the United Kingdom, the low-in-
terest-rate environment, and increasingly fierce competition in
our core markets, to name some examples—will continue to
adversely affect our operating business. But E.ON can look into
the future with optimism, even though we have forecast a
decline in the E.ON Group’s 2018 adjusted EBIT. We’re on the
right track. 2017 demonstrated this. We significantly reduced
our debt and strengthened our equity. We can invest more. We
can do so because we not only achieved our various financial
targets, we surpassed them by a wide margin. These are our
priorities in 2018:
A tangible improvement in our safety performance will help us
prevent serious accidents and, especially, fatalities among our
employees and contractors. We will therefore conduct safety
initiatives across E.ON. For example, all managers will receive
special HSE training. Managers bear a great deal of responsibility
for the health and safety of their employees.
This Combined Group Management Report contains certain forward-looking statements based on E.ON management’s current assumptions and forecasts and other currently available information.
Various known and unknown risks, uncertainties, and other factors could lead to material differences between E.ON’s actual future results, financial situation, development, or performance and the
estimates given here. E.ON assumes no liability whatsoever to update these forward-looking statements or to conform them to future events or developments.
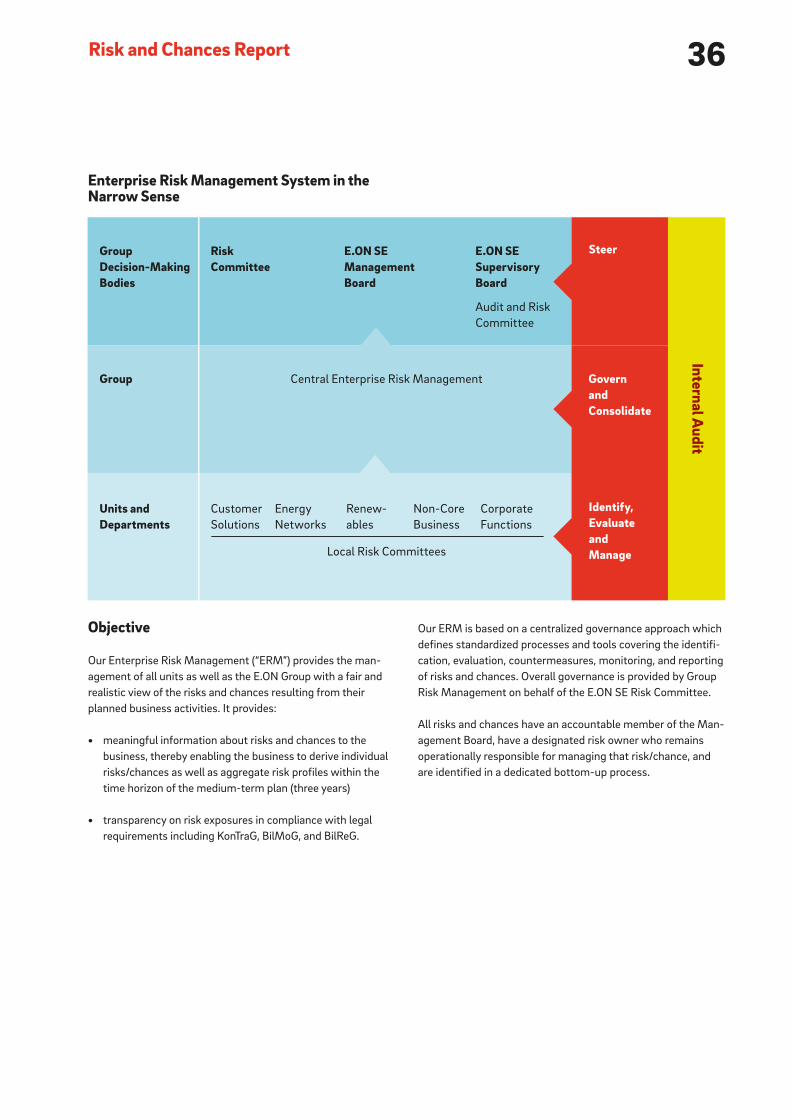
36Risk and Chances Report
Objective
Our Enterprise Risk Management (“ERM”) provides the man-
agement of all units as well as the E.ON Group with a fair and
realistic view of the risks and chances resulting from their
planned business activities. It provides:
• meaningful information about risks and chances to the
business, thereby enabling the business to derive individual
risks/chances as well as aggregate risk profiles within the
time horizon of the medium-term plan (three years)
• transparency on risk exposures in compliance with legal
requirements including KonTraG, BilMoG, and BilReG.
Enterprise Risk Management System in the Narrow Sense
Our ERM is based on a centralized governance approach which
defines standardized processes and tools covering the identifi-
cation, evaluation, countermeasures, monitoring, and reporting
of risks and chances. Overall governance is provided by Group
Risk Management on behalf of the E.ON SE Risk Committee.
All risks and chances have an accountable member of the Man-
agement Board, have a designated risk owner who remains
operationally responsible for managing that risk/chance, and
are identified in a dedicated bottom-up process.
GroupDecision-MakingBodies
Group
Units and Departments
E.ON SE Management Board
E.ON SE SupervisoryBoard
Audit and Risk
Committee
Energy
Networks
Renew-
ables
Non-Core
Business
Corporate
Functions
Central Enterprise Risk Management
Local Risk Committees
Risk Committee
Customer
Solutions
Internal Audit
Steer
Identify,Evaluate and Manage
Govern and Consolidate
37
Scope
Our risk management system in the broader sense has a total of
four components:
• an internal monitoring system
• a management information system
• preventive measures
• a risk management system in the narrow sense.
The purpose of the internal monitoring system is to ensure the
proper functioning of business processes. It consists of organi-
zational preventive measures (such as policies and work
instructions) and internal controls and audits (particularly by
Internal Audit).
The E.ON internal management information system identifies
risks early so that steps can be taken to actively address them.
Reporting by the Controlling, Finance, and Accounting depart-
ments as well as Internal Audit reports are of particular impor-
tance in early risk detection.
General Measures to Limit Risks
We take the following general preventive measures to limit risks.
Managing Legal and Regulatory RisksWe engage in intensive and constructive dialog with govern-
ment agencies and policymakers in order to manage the risks
resulting from the E.ON Group’s policy, legal, and regulatory
environment. Furthermore, we strive to conduct proper project
management so as to identify early and minimize the risks
attending our new-build projects.
We attempt to minimize the operational risks of legal proceedings
and ongoing planning processes by managing them appropriately
and by designing appropriate contracts beforehand.
Managing Operational and IT RisksTo limit operational and IT risks, we will continue to improve our
network management and the optimal dispatch of our assets.
At the same time, we are implementing operational and infra-
structure improvements that will enhance the reliability of our
generation assets and distribution networks, even under
extraordinarily adverse conditions. In addition, we have factored
the operational and financial effects of environmental risks into
our emergency plan. They are part of a catalog of crisis and sys-
tem-failure scenarios prepared for the Group by our incident
and crisis management team.
Our IT systems are maintained and optimized by qualified E.ON
Group experts, outside experts, and a wide range of technologi-
cal security measures. In addition, the E.ON Group has in place
a range of technological and organizational measures to counter
the risk of unauthorized access to data, the misuse of data, and
data loss.
Managing Health, Safety, Security, and Environmental (“HSSE”), Human Resources (“HR”), and Other RisksThe following are among the comprehensive measures we take
to address HSSE, HR, and other risks (also in conjunction with
operational and IT risks):
• systematic employee training, advanced training, and quali-
fication programs
• further refinement of our production procedures, processes,
and technologies
• regular facility and network maintenance and inspection
• company guidelines as well as work and process instructions
• quality management, control, and assurance
• project, environmental, and deterioration management
• crisis-prevention measures and emergency planning.
Should an accident occur despite the measures we take, we
have a reasonable level of insurance coverage.
38Risk and Chances Report
Note 30 to the Consolidated Financial Statements contains
detailed information about the use of derivative financial instru-
ments and hedging transactions. Note 31 describes the general
principles of our risk management and applicable risk metrics
for quantifying risks relating to commodities, credit, liquidity,
interest rates, and currency translation.
Enterprise Risk Management (“ERM”)
Our risk management system, which is the basis for the risks
and chances described in the next section, encompasses:
• systematic risk and chance identification
• risk and chance analysis and evaluation
• management and monitoring of risks and chances by
analyzing and evaluating countermeasures and preventive
systems
• documentation and reporting.
As required by law, our ERM’s effectiveness is reviewed regularly
by Internal Audit. In compliance with the provisions of Section
91, Paragraph 2, of the German Stock Corporation Act relating to
the establishment of a risk-monitoring and early warning system,
E.ON has a Risk Committee for the E.ON Group and for each of
its segments. The Risk Committee’s mission is to achieve a com-
prehensive view of our risk exposure at the Group and unit level
and to actively manage risk exposure in line with our risk strategy.
Our ERM applies to all fully consolidated E.ON Group companies
and all companies valued at equity whose book value in E.ON’s
Consolidated Financial Statements is greater than €50 million.
We take an inventory of our risks and chances at each quarterly
balance-sheet date.
To promote uniform financial reporting Group-wide, in 2017 we
put in place a central, standardized system that enables effective
and automated risk reporting. Company data are systematically
collected, transparently processed, and made available for analy-
sis both centrally and decentrally at the units.
Managing Market RisksWe use a comprehensive sales-management system and inten-
sive customer management to manage margin risks.
In order to limit our exposure to commodity price risks, we con-
duct systematic risk management. The key elements of our risk
management are, in addition to binding Group-wide policies
and a Group-wide reporting system, the use of quantitative key
figures, the limitation of risks, and the strict separation of func-
tions between departments. Furthermore, we utilize derivative
financial instruments that are commonly used in the market-
place. These instruments are transacted with financial institu-
tions, brokers, power exchanges, and third parties whose cred-
itworthiness we monitor on an ongoing basis. Our local sales
units and the remaining generation assets have set up local risk
management under central governance standards to monitor
these underlying commodity exposures and reduce them to
acceptable levels through forward hedging.
Managing Strategic RisksWe have comprehensive preventive measures in place to manage
potential risks relating to acquisitions and investments. To the
degree possible, these measures include, in addition to the rele-
vant company guidelines and manuals, comprehensive due dili-
gence, legally binding contracts, a multi-stage approvals process,
and shareholding and project controlling. Comprehensive post-
acquisition projects also contribute to successful integration.
Managing Finance and Treasury RisksThis category encompasses credit, interest-rate, currency, tax,
and asset-management risks and chances. We use systematic
risk management to monitor and control our interest-rate and
currency risks and manage these risks using derivative and
non-derivative financial instruments. Here, E.ON SE plays a cen-
tral role by aggregating risk positions through intragroup trans-
actions and hedging these risks in the market. Due to E.ON SE’s
intermediary role, its risk position is largely closed.
We use a Group-wide credit risk management system to sys-
tematically measure and monitor the creditworthiness of our
business partners on the basis of Group-wide minimum stan-
dards. We manage our credit risk by taking appropriate measures,
which include obtaining collateral and setting limits. The E.ON
Group’s Risk Committee is regularly informed about all credit
risks. A further component of our risk management is a conser-
vative investment strategy for financial funds and a broadly
diversified portfolio.
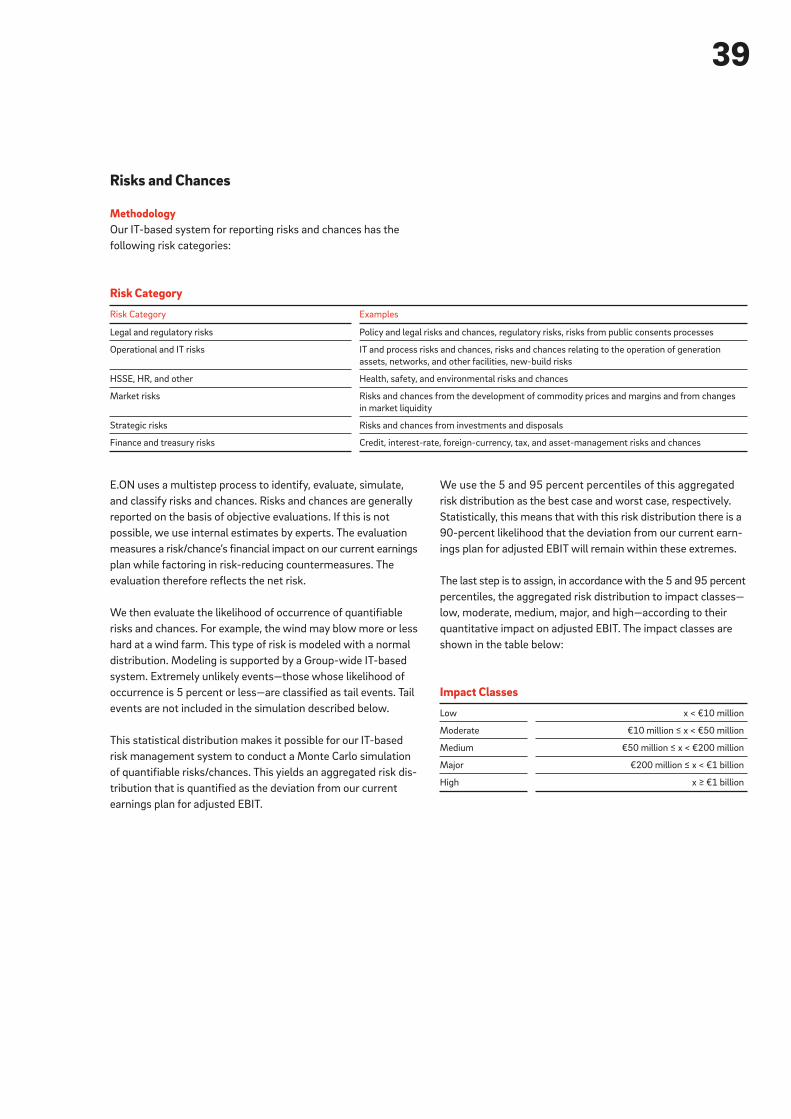
39
E.ON uses a multistep process to identify, evaluate, simulate,
and classify risks and chances. Risks and chances are generally
reported on the basis of objective evaluations. If this is not
possible, we use internal estimates by experts. The evaluation
measures a risk/chance’s financial impact on our current earnings
plan while factoring in risk-reducing countermeasures. The
evaluation therefore reflects the net risk.
We then evaluate the likelihood of occurrence of quantifiable
risks and chances. For example, the wind may blow more or less
hard at a wind farm. This type of risk is modeled with a normal
distribution. Modeling is supported by a Group-wide IT-based
system. Extremely unlikely events—those whose likelihood of
occurrence is 5 percent or less—are classified as tail events. Tail
events are not included in the simulation described below.
This statistical distribution makes it possible for our IT-based
risk management system to conduct a Monte Carlo simulation
of quantifiable risks/chances. This yields an aggregated risk dis-
tribution that is quantified as the deviation from our current
earnings plan for adjusted EBIT.
Risks and Chances
MethodologyOur IT-based system for reporting risks and chances has the
following risk categories:
We use the 5 and 95 percent percentiles of this aggregated
risk distribution as the best case and worst case, respectively.
Statistically, this means that with this risk distribution there is a
90-percent likelihood that the deviation from our current earn-
ings plan for adjusted EBIT will remain within these extremes.
The last step is to assign, in accordance with the 5 and 95 percent
percentiles, the aggregated risk distribution to impact classes—
low, moderate, medium, major, and high—according to their
quantitative impact on adjusted EBIT. The impact classes are
shown in the table below:
Impact Classes
Low x < €10 million
Moderate €10 million ≤ x < €50 million
Medium €50 million ≤ x < €200 million
Major €200 million ≤ x < €1 billion
High x ≥ €1 billion
Risk Category
Risk Category Examples
Legal and regulatory risks Policy and legal risks and chances, regulatory risks, risks from public consents processes
Operational and IT risks IT and process risks and chances, risks and chances relating to the operation of generation
assets, networks, and other facilities, new-build risks
HSSE, HR, and other Health, safety, and environmental risks and chances
Market risks Risks and chances from the development of commodity prices and margins and from changes
in market liquidity
Strategic risks Risks and chances from investments and disposals
Finance and treasury risks Credit, interest-rate, foreign-currency, tax, and asset-management risks and chances

40Risk and Chances Report
The E.ON Group has major risk positions in the following cate-
gories: legal and regulatory risks and market risks. As a result,
the aggregate risk position of E.ON SE as a Group is major. In
other words, the E.ON Group’s average annual adjusted EBIT
risk ought not to exceed -€200 million to -€1 billion in 95 percent
of all cases.
Risks and Chances by CategoryE.ON’s major risks and chances by risk category are described
below. Also described are major risks and chances stemming
from tail events as well as qualitative risks that would impact
adjusted EBIT by more than €200 million. Risks and chances
that would affect net income and/or cash flow by more than
€200 million are included as well.
Legal and Regulatory RisksThe policy, legal, and regulatory environment in which the E.ON
Group does business is also a source of external risks, such as
decisions by governments to phase out power generation using
certain fuels. As a result of the economic and financial crisis in
many EU member states, policy and regulatory intervention—
such as additional taxes, additional reporting requirements (for
example, EMIR, REMIT, MiFID2), price moratoriums, regulatory
price reductions, and changes to support schemes for renew-
ables—is becoming increasingly apparent. Such intervention
could pose a risk to E.ON’s operations in these countries. There
General Risk SituationThe table below shows the average annual aggregated risk
position (aggregated risk position) across the time horizon of
the medium-term plan for all quantifiable risks and chances
(excluding tail events) for each risk category based on our most
important financial key figure, adjusted EBIT:
Risk Category
Risk Category Worst Case (5 percent percentile) Best Case (95 percent percentil)
Legal and regulatory risks Major Moderate
Operational and IT risks Medium Moderate
HSSE, HR, and other Low Low
Market risks Major Major
Strategic risks Medium Low
Finance and treasury risks Moderate Medium
may also be final but major risks from obligations arising from
regulatory requirements following the Uniper split. Besides
these governmental risks and chances, this also includes the
risk of litigation, fines, and claims, governance- and compli-
ance-related issues as well as risks and chances related to con-
tracts and permits. Changes to this environment can lead to
considerable uncertainty with regard to planning and, under
certain circumstances, to impairment charges but also can cre-
ate chances. This results in a major risk position and a moderate
chance position.
PreussenElektraPreussenElektra’s business is substantially influenced by regu-
lation. In general, regulation can result in risks for its remaining
business activities. One example is the Fukushima nuclear acci-
dent. Policy measures taken in response to such events could
have a direct impact on the further operation of a nuclear power
plant (“NPP”) or trigger liabilities and significant payment obli-
gations stemming from the solidarity obligation agreed on
among German NPP operators. Furthermore, new regulatory
requirements, such as additional mandatory safety measures,

41
could lead to production outages and higher costs. In addition,
there may be lawsuits that fundamentally challenge the opera-
tion of NPPs. Regulation can also require an increase in provi-
sions for dismantling. This could pose major risks for E.ON.
In 2003, Section 6 of Germany’s Atomic Energy Act granted
consent for Unterweser NPP to store radioactive spent nuclear
fuel in an on-site intermediate storage facility. Lawsuits were
filed against the consent. The complainants asked that the
court rescind the consent on the grounds that the storage facil-
ity is not sufficiently protected against terrorist attacks. Settle-
ment talks are currently under way between the complainants
and the defendant agency. If the court rules definitively in favor
of the complainants, nuclear fuel could not be removed from
Unterweser NPP on schedule. This would significantly prolong
dismantling, thereby leading to higher costs. This could pose a
major risk.
On December 6, 2016, Germany’s Federal Constitutional Court
in Karlsruhe ruled that the thirteenth amended version of Ger-
many’s Atomic Energy Act (“the Act”) is fundamentally consti-
tutional. The Act’s only unconstitutional elements are that cer-
tain NPP operators will be unable to produce their electricity
allotment from 2002 and that it contains no mechanism for
compensating operators for investments to extend NPP operat-
ing lifetimes. Lawmakers have until June 30, 2018, to pass leg-
islation that redresses these elements. In addition, NPPs need
to have production rights, also known as a residual electricity
allotment, in order to operate until their closure dates prescribed
by law. These matters could yield a major chance and a major risk.
Customer SolutionsThe E.ON Group’s operations subject it to certain risks relating to
legal proceedings, ongoing planning processes, and regulatory
changes. For example, the current discussion about price caps in
the United Kingdom is causing additional uncertainty in the mar-
ketplace. But these risks also relate in particular to legal actions
and proceedings concerning contract and price adjustments to
reflect market dislocations or (including as a consequence of the
transformation of Germany’s energy system) an altered business
climate in the power and gas business, price increases, alleged
market-sharing agreements, and anticompetitive practices. This
could pose a major and a high risk.
Energy NetworksThe operation of energy networks in Germany, in Sweden, but
also in other countries is subject to a large degree of regulation.
New laws and regulatory periods cause uncertainty in this busi-
ness. For example, matters related to Germany’s Renewable
Energy Law, such as issues regarding solar energy, can cause
temporary fluctuations in our cash flow and adjusted EBIT. This
could create major chances and pose major risks.
RenewablesRegulatory and legal risks attend our renewables business as
well. For example, legal proceedings and approvals could pose a
major risk.
Operational and IT RisksThe operational and strategic management of the E.ON Group
relies heavily on complex information technology. This includes
risks and chances arising from information security.
Technologically complex production facilities are used in the
production and distribution of energy, resulting in risks from
procurement and logistics, construction, operations and main-
tenance of assets as well as general project risks. In case of
PreussenElektra, this also includes dismantling activities. Our
operations in and outside Germany could experience unantici-
pated operational or other problems leading to a power failure
or shutdown and/or higher costs and additional investments.
Operational failures or extended production stoppages of facilities
or components of facilities as well as environmental damage
could negatively impact our earnings, affect our cost situation,
and/or result in the imposition of fines. In unlikely cases, this
could lead to a high risk. Overall, it results in a medium risk posi-
tion and a moderate chance position in this category.
General project risks can include a delay in projects and increased
capital requirements. For our Renewables segment, a project
delay could lead to the loss of government subsidies and cause
potential partners to exit the project, which could, in unlikely
cases, likewise lead to a high risk.
42Risk and Chances Report
higher customer churn rates, and temporary volume effects in
the network business. This results in a major risk position and a
major chance position in this category.
The demand for electric power and natural gas is seasonal, with
our operations generally experiencing higher demand during
the cold-weather months of October through March and lower
demand during the warm-weather months of April through
September. As a result of these seasonal patterns, our sales and
results of operations are higher in the first and fourth quarters
and lower in the second and third quarters. Sales and results of
operations for all of our energy operations can be negatively
affected by periods of unseasonably warm weather during the
autumn and winter months. We expect seasonal and weather-
related fluctuations in sales and results of operations to con-
tinue. Periods of exceptionally cold weather—very low average
temperatures or extreme daily lows—in the fall and winter
months can have a positive impact owing to higher demand for
electricity and natural gas.
E.ON’s portfolio of physical assets, long-term contracts, and
end-customer sales is exposed to uncertainty resulting from
fluctuations in commodity prices. This yields a major risk and a
major chance, although only for PreussenElektra. After the
Uniper spinoff, E.ON established procurement capabilities for
its sales business and thus ensured market access for its
remaining energy production in order to manage the remaining
commodity risks accordingly.
Strategic RisksOur business strategy involves acquisitions and investments in
our core business as well as disposals. This strategy depends in
part on our ability to successfully identify, acquire, and inte-
grate companies that enhance, on acceptable terms, our energy
business. In order to obtain the necessary approvals for acquisi-
tions, we may be required to divest other parts of our business
or to make concessions or undertakings that affect our business.
In addition, there can be no assurance that we will be able to
We could also be subject to environmental liabilities associated
with our power generation operations that could materially and
adversely affect our business. In addition, new or amended
environmental laws and regulations may result in increases in
our costs.
HSSE, HR, and Other RisksHealth and safety are important aspects of our day-to-day busi-
ness. Our operating activities can therefore pose risks in these
areas and create social and environmental risks and chances. In
addition, our operating business potentially faces risks resulting
from human error and employee turnover. It is important that
we act responsibly along our entire value chain and that we
communicate consistently, enhance the dialog, and maintain
good relationships with our key stakeholders. We actively con-
sider environmental, social, and corporate-governance issues.
These efforts support our business decisions and our public
relations. Our objective is to minimize our reputational risks and
garner public support so that we can continue to operate our
business successfully. These matters do not result in a major
risk or chance position.
In the past, predecessor entities of E.ON SE conducted mining
operations, resulting in obligations in North Rhine-Westphalia
and Bavaria. E.ON SE can be held responsible for damage. This
could lead to major individual risks that we currently only
evaluate qualitatively.
Market RiskOur units operate in an international market environment that
is characterized by general risks relating to the business cycle.
In addition, the entry of new suppliers into the marketplace
along with more aggressive tactics by existing market partici-
pants and reputational risks have created a keener competitive
environment for our electricity business in and outside Ger-
many, which could reduce our margins. However, market devel-
opments could also have a positive impact on our business.
Such factors include wholesale and retail price developments,
43
achieve the returns we expect from any acquisition or invest-
ment. It is also possible that we will not be able to realize our
strategic ambition of enlarging our investment pipeline and that
significant amounts of capital could be used for other opportu-
nities. Furthermore, investments and acquisitions in new geo-
graphic areas or lines of business require us to become familiar
with new sales markets and competitors and to address the
attending business risks.
In the case of planned disposals, E.ON faces the risk of disposals
not taking place or being delayed and the risk that E.ON receives
lower-than-anticipated disposal proceeds. In addition, after
transactions close we could face liability risks resulting from
contractual obligations.
The risk and chance position in this category was not major at the
balance-sheet date.
Finance and Treasury Risks E.ON is exposed to credit risk in its operating activities and
through the use of financial instruments. Credit risk results from
non-delivery or partial delivery by a counterparty of the agreed
consideration for services rendered, from total or partial failure
to make payments owing on existing accounts receivable, and
from replacement risks in open transactions. For example, E.ON’s
historical connection with Uniper continues to pose major, albeit
unlikely, risks. In addition, in unlikely cases joint and several lia-
bility for jointly operated power plants could lead to a high risk.
E.ON’s international business operations expose it to risks from
currency fluctuation. One form of this risk is transaction risk,
which arises when payments are made in a currency other than
E.ON’s functional currency. Another form of risk is translation
risk, which arises when currency fluctuations lead to accounting
effects when assets/liabilities and income/expenses of E.ON
companies outside the euro zone are translated into euros and
entered into our Consolidated Financial Statements. Currency-
translation risk results mainly from our positions in U.S. dollars,
pounds sterling, Swedish kronor, Czech krona, Romanian leus,
Hungarian forints, and Turkish lira. Positive developments in for-
eign-currency rates can also create chances for our operating
business.
E.ON faces earnings risks from financial liabilities and interest-
rate derivatives that are based on variable interest rates and
from asset-retirement obligations.
In addition, the price changes and other uncertainty relating
to the current and non-current investments E.ON makes to
cover its non-current obligations (particularly pension and
asset-retirement obligations) could, in individual cases, be major.
Declining or rising discount rates could lead to increased or
reduced provisions for pensions and asset-retirement obliga-
tions, including non-current liabilities. This can create a high
degree of uncertainty for E.ON.
In principle, E.ON could also encounter tax risks and chances; in
individual cases, the chances could be high.
This category’s overall risk and chance position is not major.
Management Board’s Evaluation of the Risk Situation
The overall risk situation of the E.ON Group’s operating busi-
ness at year-end 2017 remained nearly unchanged relative to
year-end 2016. Although the average annual risk for the E.ON
Group’s adjusted EBIT is classified as major, from today’s per-
spective we do not perceive any risk position that could threaten
the existence of the E.ON Group or individual segments.

44Business Segments
Energy Networks Below we report on a number of important non-financial key
figures for this segment, such as power and gas passthrough,
system length, and number of connections.
Energy Passthrough
Billion kWh
Germany Sweden
East-Central Europe/
Turkey Total
2017 2016 2017 2016 2017 2016 2017 2016
Fourth quarter
Power 35.6 35.1 9.6 9.8 9.7 9.5 54.9 54.4
Line loss, station use, etc. 1.1 1.1 0.3 0.4 0.7 0.8 2.1 2.3
Gas 35.1 31.8 0.8 1.0 15.2 16.7 51.1 49.5
Full year
Power 119.2 117.2 36.9 37.3 37.3 36.3 193.4 190.8
Line loss, station use, etc. 3.8 3.7 1.1 1.1 2.8 2.8 7.7 7.6
Gas 110.6 106.8 3.9 4.9 45.2 44.3 159.7 156.0
Power and Gas PassthroughPower passthrough in 2017 was about 2.6 billion kWh above
the prior-year level. Unlike in the prior year, power passthrough
in 2017 includes the 110 kV level of the network. This also applies
to system losses and station use. We adjusted the prior-year
figures accordingly. Gas passthrough rose by 3.7 billion kW.
Power passthrough and system losses in Germany of
119.2 billion kWh and 3.8 billion kWh, respectively, were at the
prior-year level. Gas passthrough was also at the prior-year level.
Power passthrough in Sweden was at the prior-year level,
whereas gas passthrough declined owing to the closure of a
power station in Malmö and the transfer of a company to
Customer Solutions.
At East-Central Europe/Turkey, power passthrough in the Czech
Republic, Romania, and Hungary was at the prior-year level.
System Length and Connections System length in Germany—about 350,000 kilometers for
power and about 60,000 kilometers for gas—was roughly at the
prior-year level. At year-end we had about 5.7 million connection
points for power and about 0.9 million for gas.
The length of our power system in Sweden was roughly
136,900 kilometers, slightly higher than the prior-year figure
of 136,400 kilometers. The length of the gas distribution
system was 1,900 kilometers, less than the prior-year figure of
2,100 kilometers. The number of connection points in the
power distribution system was unchanged at roughly 1 million.
System length in East-Central Europe/Turkey—about 232,000
kilometers for power and about 45,000 kilometers for gas—was
at the prior-year level, as were the roughly 4.7 million connec-
tion points for power and the roughly 1.3 million for gas.
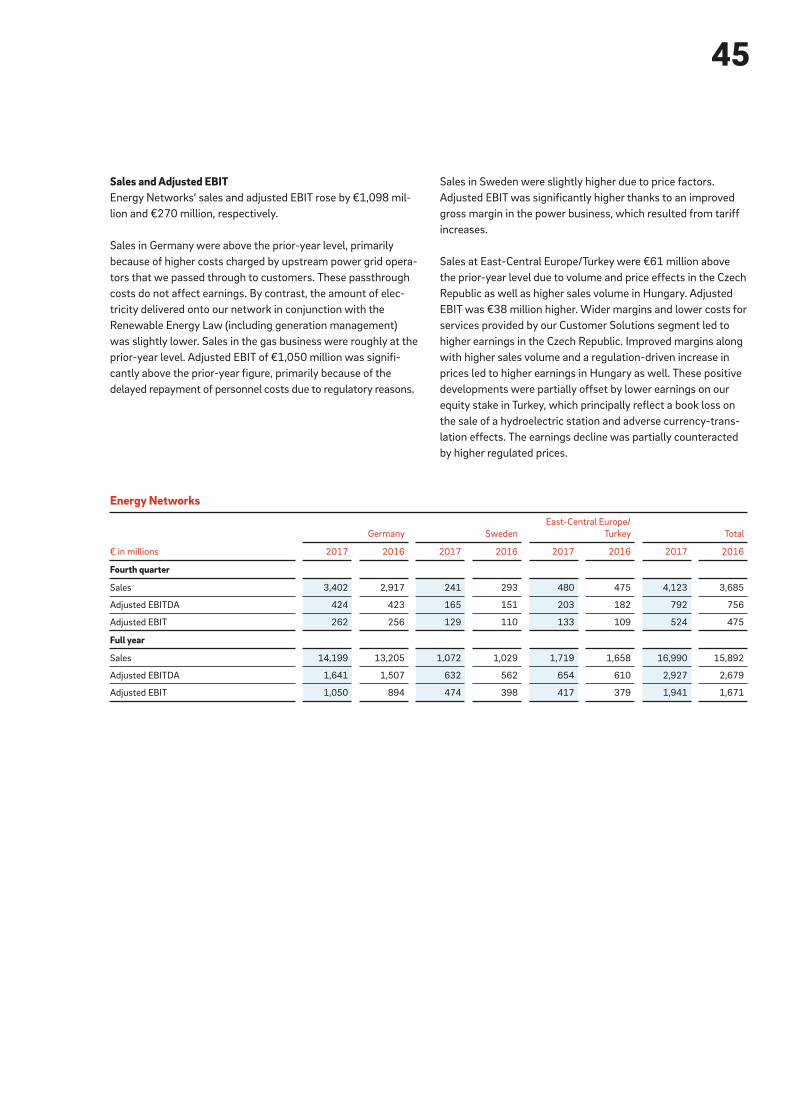
45
Sales and Adjusted EBITEnergy Networks’ sales and adjusted EBIT rose by €1,098 mil-
lion and €270 million, respectively.
Sales in Germany were above the prior-year level, primarily
because of higher costs charged by upstream power grid opera-
tors that we passed through to customers. These passthrough
costs do not affect earnings. By contrast, the amount of elec-
tricity delivered onto our network in conjunction with the
Renewable Energy Law (including generation management)
was slightly lower. Sales in the gas business were roughly at the
prior-year level. Adjusted EBIT of €1,050 million was signifi-
cantly above the prior-year figure, primarily because of the
delayed repayment of personnel costs due to regulatory reasons.
Sales in Sweden were slightly higher due to price factors.
Adjusted EBIT was significantly higher thanks to an improved
gross margin in the power business, which resulted from tariff
increases.
Sales at East-Central Europe/Turkey were €61 million above
the prior-year level due to volume and price effects in the Czech
Republic as well as higher sales volume in Hungary. Adjusted
EBIT was €38 million higher. Wider margins and lower costs for
services provided by our Customer Solutions segment led to
higher earnings in the Czech Republic. Improved margins along
with higher sales volume and a regulation-driven increase in
prices led to higher earnings in Hungary as well. These positive
developments were partially offset by lower earnings on our
equity stake in Turkey, which principally reflect a book loss on
the sale of a hydroelectric station and adverse currency-trans-
lation effects. The earnings decline was partially counteracted
by higher regulated prices.
Energy Networks
€ in millions
Germany Sweden
East-Central Europe/
Turkey Total
2017 2016 2017 2016 2017 2016 2017 2016
Fourth quarter
Sales 3,402 2,917 241 293 480 475 4,123 3,685
Adjusted EBITDA 424 423 165 151 203 182 792 756
Adjusted EBIT 262 256 129 110 133 109 524 475
Full year
Sales 14,199 13,205 1,072 1,029 1,719 1,658 16,990 15,892
Adjusted EBITDA 1,641 1,507 632 562 654 610 2,927 2,679
Adjusted EBIT 1,050 894 474 398 417 379 1,941 1,671

46Business Segments
Customer Solutions Below we report on a number of important non-financial key
figures for this segment, such as power and gas sales volume
and customer numbers.
Power Sales
Billion kWh
Germany United Kingdom Other 1 Total
2017 2016 2017 2016 2017 2016 2017 2016
Fourth quarter
Residential and SME 4.7 5.1 5.2 5.7 5.9 5.9 15.8 16.7
I&C 1.6 2.4 3.7 3.8 6.9 7.0 12.2 13.2
Sales partners 0.1 0.1 – – 0.5 0.6 0.6 0.7
Customer groups 6.4 7.6 8.9 9.5 13.3 13.5 28.6 30.6
Wholesale market 4.5 4.7 0.5 0.4 2.8 1.9 7.8 7.0
Total 10.9 12.3 9.4 9.9 16.1 15.4 36.4 37.6
Full year
Residential and SME 17.0 18.0 18.9 21.2 21.7 21.0 57.6 60.2
I&C 8.3 9.4 14.8 15.1 26.4 27.6 49.5 52.1
Sales partners 0.4 0.9 – – 2.2 2.3 2.6 3.2
Customer groups 25.7 28.3 33.7 36.3 50.3 50.9 109.7 115.5
Wholesale market 14.2 18.0 1.1 1.1 9.5 7.2 24.8 26.3
Total 39.9 46.3 34.8 37.4 59.8 58.1 134.5 141.8
1Excludes E.ON Connecting Energies.
Gas Sales
Billion kWh
Germany United Kingdom Other 1 Total
2017 2016 2017 2016 2017 2016 2017 2016
Fourth quarter
Residential and SME 7.0 8.2 11.8 12.8 9.8 10.9 28.6 31.9
I&C 1.6 1.4 2.1 2.4 6.4 6.9 10.1 10.7
Sales partners – – – – 1.5 0.5 1.5 0.5
Customer groups 8.6 9.6 13.9 15.2 17.7 18.3 40.2 43.1
Wholesale market 3.5 3.5 – – 1.2 0.5 4.7 4.0
Total 12.1 13.1 13.9 15.2 18.9 18.8 44.9 47.1
Full year
Residential and SME 21.9 23.9 34.8 39.8 28.9 28.0 85.6 91.7
I&C 5.0 5.0 7.7 8.6 20.9 20.2 33.6 33.8
Sales partners – – – – 2.2 1.3 2.2 1.3
Customer groups 26.9 28.9 42.5 48.4 52.0 49.5 121.4 126.8
Wholesale market 17.0 12.0 – – 2.7 4.0 19.7 16.0
Total 43.9 40.9 42.5 48.4 54.7 53.5 141.1 142.8
1Excludes E.ON Connecting Energies.
47
Power and Gas Sales VolumeIn 2017 this segment’s power and gas sales declined by
7.3 billion kWh and 1.7 billion kWh, respectively.
Power sales in Germany of 39.9 billion kWh were 14 percent
below the prior-year level. Power sales to residential and small
and medium enterprise (“SME”) customers were lower due to
keener competition. The decline in power sales to industrial and
commercial (“I&C”) customers resulted mainly from the transfer
of the remaining wholesale customers to Uniper. Power sales to
sales partners were lower, chiefly because of the end of deliveries
to a municipal utility and changes in reporting. Power sales to
the wholesale market were below the prior-year level due to the
expiration of procurement contracts for wholesale customers,
which were reassigned from E.ON to Uniper. Gas sales volume
of 43.9 billion kWh increased by 7 percent. Gas sales to residen-
tial and SME customers were lower due to keener competition.
Gas sales to the wholesale market were higher due to a change
in how we classify resales to Uniper, which in 2016 were
included on the procurement side.
Power sales in the United Kingdom decreased by 2.6 billion kWh.
Declining customer numbers led to lower power sales to resi-
dential and SME customers. A reduction in sales volume and in
the number of customer facilities served was the reason for the
decline in power sales to I&C customers. Gas sales decreased
by 5.9 billion kWh. Lower customer numbers and, in part, a
weather-driven decline in demand were responsible for the reduc-
tion in gas sales to residential and SME customers. The reason
for the decline in gas sales to I&C customers is the same as for
power.
Power sales at the Other unit (Sweden, Hungary, the Czech
Republic, Romania, and Italy) rose by 1.7 billion kWh, primarily
because of the acquisition of new customers in Romania and
Hungary. By contrast, power sales in Italy declined owing to
lower demand. Gas sales were 1.2 billion kWh higher. This is
chiefly attributable to a weather-driven increase in sales vol-
ume to residential and SME and I&C customers in Romania and
slightly higher demand from I&C and sales-partner customers
in Italy. By contrast, gas sales were lower in Sweden due to the
end of deliveries to a large customer.
Customer NumbersThis segment had about 21.1 million customers at year-end 2017,
fewer than the prior-year figure of 21.4 million. The number of
customers in the United Kingdom declined from 7 to 6.8 million;
power customers accounted most of the customer losses. In
Germany they decreased from 6.1 million in 2016 to 5.9 million
in 2017; of these, 5.1 million were power customers and
0.8 million gas customers (2016: 5.3 million power customers,
0.8 million gas customers). The positive trend in customer
acquisition limited customer losses in an increasingly competi-
tive marketplace.

48Business Segments
Lower sales volume due to regulatory intervention, declining
customer numbers, reduced demand, unfavorable weather con-
ditions, and currency-translation effects caused sales in the
United Kingdom to decline by €586 million. Adjusted EBIT
decreased owing to a weather-driven decline in sales volume
and higher costs in conjunction with regulatory energy-effi-
ciency obligations.
Other’s sales rose by €114 million, primarily because of a
weather-driven increase in sales volume in Romania and the
taking on of a company from Energy Networks in Sweden.
Sales declined in Italy on lower price. Adjusted EBIT decreased
by €57 million, principally because of higher power and gas
procurement costs, primarily in Romania. In addition, lower
sales prices and higher procurement costs adversely affected
earnings in Hungary.
Sales and Adjusted EBITCustomer Solutions’ sales and adjusted EBIT decreased by
€801 million and €286 million, respectively.
Sales in Germany declined, primarily because of the expiration
of procurement contracts of wholesale customers who were
reassigned to Uniper. Lower power sales volume to residential
customers and lower gas sales volume to residential and SME
customers also had an adverse impact on sales. Adjusted EBIT
was below the prior-year level, primarily because of extraordinary
items. Earnings were also adversely affected by a reduction in
gas sales prices in November 2016 and by persistently intense
competitive and margin pressure.
Customer Solutions
€ in millions
Germany United Kingdom Other Total
2017 2016 2017 2016 2017 2016 2017 2016
Fourth quarter
Sales 2,028 2,255 2,122 2,115 1,938 1,919 6,088 6,289
Adjusted EBITDA 45 107 135 163 83 77 263 347
Adjusted EBIT 25 88 106 138 42 38 173 264
Full year
Sales 7,452 7,781 7,205 7,791 6,910 6,796 21,567 22,368
Adjusted EBITDA 192 299 353 460 302 351 847 1,110
Adjusted EBIT 118 232 250 365 158 215 526 812

49
Renewables Below we report on a number of important non-financial key
figures for this segment, such as generating capacity, power
generation, and power sales volume.
Fully Consolidated and Attributable Generating Capacity
December 31
MW
Fully Consolidated Attributable
2017 2016 2017 2016
Wind 522 510 479 471
Solar – – – –
Germany 522 510 479 471
Wind 4,179 3,647 4,625 4,084
Solar 15 19 27 19
Outside Germany 4,194 3,666 4,652 4,103
Generating capacity 4,716 4,176 5,131 4,574
Generating Capacity At year-end 2017 this segment’s fully consolidated generating
capacity rose by 13 percent to 4,716 MW (2016: 4,176 MW); its
attributable generating capacity rose by 12 percent to 5,131 MW
(2016: 4,574 MW). The principal reason for the increase was the
commissioning of Bruenning’s Breeze and Radford’s Run wind
farms at the end of 2017.
Power Generation and Sales VolumeThis segment’s owned generation rose by 0.9 billion kWh.
Onshore Wind/Solar’s owned generation was 0.7 billion kWh
higher. The principal factors in the United States were the com-
missioning of Bruenning’s Breeze and Radford’s Run wind farms
and the fact that in 2017 Colbeck’s Corner wind farm was, for
the first time, operational for the entire year. Output in Europe
was higher due to favorable wind conditions, particularly in the
United Kingdom, Sweden, Germany, and Poland. This unit’s
fourth-quarter owned generation rose year on year owing to
favorable wind conditions in Poland and the United Kingdom
and the addition of new wind farms in the United States. At
94.6 percent, asset availability in 2017 was at the prior-year
level of 94.2 percent.
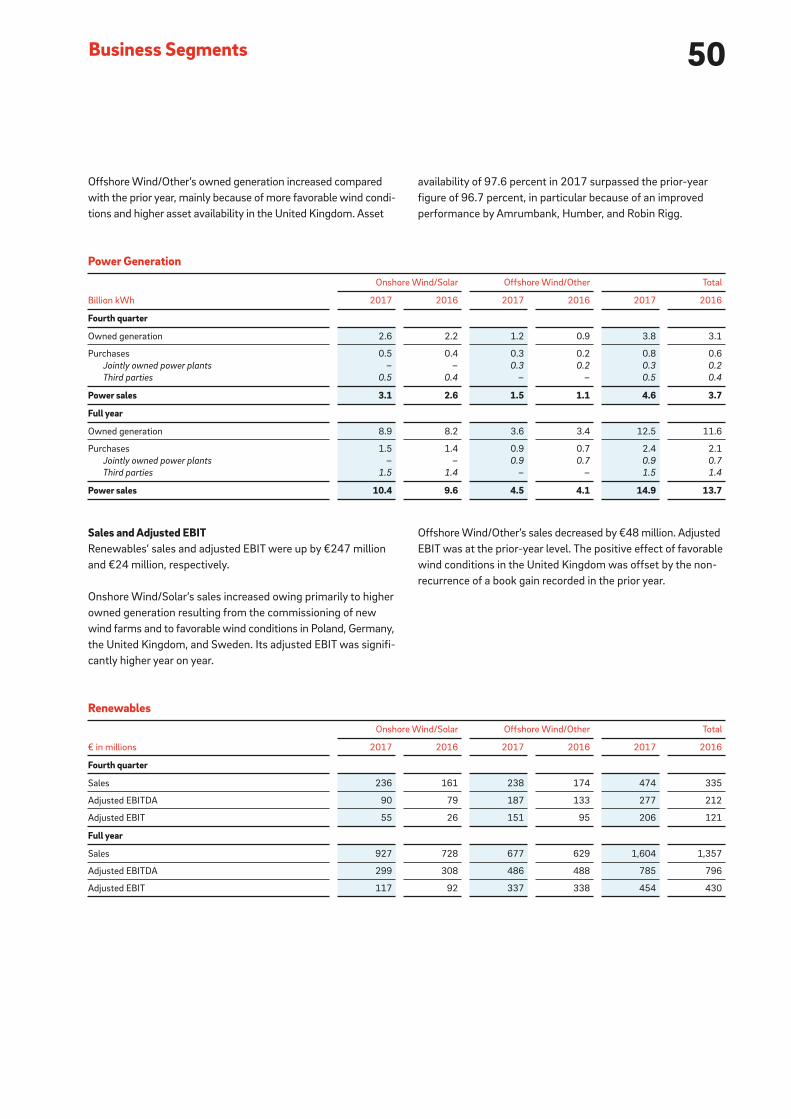
50Business Segments
Renewables
€ in millions
Onshore Wind/Solar Offshore Wind/Other Total
2017 2016 2017 2016 2017 2016
Fourth quarter
Sales 236 161 238 174 474 335
Adjusted EBITDA 90 79 187 133 277 212
Adjusted EBIT 55 26 151 95 206 121
Full year
Sales 927 728 677 629 1,604 1,357
Adjusted EBITDA 299 308 486 488 785 796
Adjusted EBIT 117 92 337 338 454 430
Sales and Adjusted EBITRenewables’ sales and adjusted EBIT were up by €247 million
and €24 million, respectively.
Onshore Wind/Solar’s sales increased owing primarily to higher
owned generation resulting from the commissioning of new
wind farms and to favorable wind conditions in Poland, Germany,
the United Kingdom, and Sweden. Its adjusted EBIT was signifi-
cantly higher year on year.
Offshore Wind/Other’s sales decreased by €48 million. Adjusted
EBIT was at the prior-year level. The positive effect of favorable
wind conditions in the United Kingdom was offset by the non-
recurrence of a book gain recorded in the prior year.
Offshore Wind/Other’s owned generation increased compared
with the prior year, mainly because of more favorable wind condi-
tions and higher asset availability in the United Kingdom. Asset
availability of 97.6 percent in 2017 surpassed the prior-year
figure of 96.7 percent, in particular because of an improved
performance by Amrumbank, Humber, and Robin Rigg.
Power Generation
Billion kWh
Onshore Wind/Solar Offshore Wind/Other Total
2017 2016 2017 2016 2017 2016
Fourth quarter
Owned generation 2.6 2.2 1.2 0.9 3.8 3.1
Purchases 0.5 0.4 0.3 0.2 0.8 0.6
Jointly owned power plants – – 0.3 0.2 0.3 0.2
Third parties 0.5 0.4 – – 0.5 0.4
Power sales 3.1 2.6 1.5 1.1 4.6 3.7
Full year
Owned generation 8.9 8.2 3.6 3.4 12.5 11.6
Purchases 1.5 1.4 0.9 0.7 2.4 2.1
Jointly owned power plants – – 0.9 0.7 0.9 0.7
Third parties 1.5 1.4 – – 1.5 1.4
Power sales 10.4 9.6 4.5 4.1 14.9 13.7

51
Sales and Adjusted EBITThis segment’s sales were up €47 million year on year. The
adverse impact of lower sales prices and the expiration of
supply contracts was more than offset by higher sales volume
to Uniper and one-off items, in particular in conjunction with a
legal proceeding. The decline in fourth-quarter sales is attrib-
utable to lower sales prices.
Adjusted EBIT of €506 million was below the prior-year figure
of €553 million. The adverse impact of the unplanned outage
at Brokdorf, lower sales prices, and higher depreciation
charges on fixed assets was partially offset by the expiration
of the nuclear-fuel tax at the end of 2016 and by one-off items.
The decline in fourth-quarter adjusted EBIT is attributable to
lower sales prices.
Non-Core Business
€ in millions
PreussenElektra
2017 2016
Fourth quarter
Sales 355 470
Adjusted EBITDA 157 234
Adjusted EBIT 149 208
Full year
Sales 1,585 1,538
Adjusted EBITDA 654 644
Adjusted EBIT 506 553
Non-Core Business (PreussenElektra) Below we report on a number of important non-financial key
figures for this segment, such as generating capacity, power
generation, and power sales volume.
Fully Consolidated and Attributable Generating Capacity PreussenElektra’s fully consolidated generating capacity declined
to 4,150 MW from the prior year owing to the scheduled
decommissioning of Gundremmingen B nuclear power station
on December 31, 2017, as stipulated by Germany’s Atomic
Energy Act. Its attributable generating capacity declined to
3,808 MW for the same reason.
Power Generation and Sales VolumeThis segment’s power procured (owned generation and pur-
chases) of 37.4 billion kWh was at the prior-year level. The
reduction in owned generation is principally attributable to the
unplanned extension of the overhaul at Brokdorf nuclear power
station due to a thicker oxide layer on some fuel elements.
The increase in power procured reflects the purchase of power
to meet delivery obligations. Fourth-quarter power procured
was also at the prior-year level. Power sales in 2017 and in the
fourth quarter of 2017 were at the prior-year level as well.
Power Generation
Billion kWh
PreussenElektra
2017 2016
Fourth quarter
Owned generation 8.6 9.3
Purchases 1.4 0.8
Jointly owned power plants 0.3 0.3
Third parties 1.1 0.5
Total power procurement 10.0 10.1
Station use, line loss, etc. -0.1 –
Power sales 9.9 10.1
Full year
Owned generation 27.5 32.4
Purchases 9.9 4.3
Jointly owned power plants 1.3 1.3
Third parties 8.6 3.0
Total power procurement 37.4 36.7
Station use, line loss, etc. -0.2 -0.1
Power sales 37.2 36.6
52 Internal Control System for the Accounting Process
subsidiaries belonging to E.ON’s scope of consolidation are
audited by the subsidiaries’ respective independent auditor.
E.ON SE then combines these statements into its Consolidated
Financial Statements using uniform SAP consolidation soft-
ware. Group Accounting is responsible for conducting the con-
solidation and for monitoring adherence to guidelines for
scheduling, processes, and contents. Monitoring of system-
based automated controls is supplemented by manual checks.
In conjunction with the year-end closing process, additional
qualitative and quantitative information is compiled. Further-
more, dedicated quality-control processes are in place for all
relevant departments to discuss and ensure the completeness
of relevant information on a regular basis.
E.ON SE’s Financial Statements are also prepared with SAP
software. The accounting and preparation processes are divided
into discrete functional steps. Bookkeeping processes are han-
dled by our Business Service Centers: Cluj has responsibility for
processes relating to subsidiary ledgers and several bank activi-
ties, Regensburg for those relating to the general ledgers. Auto-
mated or manual controls are integrated into each step. Defined
procedures ensure that all transactions and the preparation of
E.ON SE’s Financial Statements are recorded, processed,
assigned on an accrual basis, and documented in a complete,
timely, and accurate manner. Relevant data from E.ON SE’s
Financial Statements are, if necessary, adjusted to conform
with IFRS and then transferred to the consolidation software
system using SAP-supported transfer technology.
The following explanations about our internal control system,
and our general IT controls apply to the Consolidated Financial
Statements and E.ON SE’s Financial Statements.
Internal Control System Internal controls are an integral part of our accounting processes.
Guidelines define uniform financial-reporting requirements and
procedures for the entire E.ON Group. These guidelines encom-
pass a definition of the guidelines’ scope of application; a Risk
Catalog (“ICS Model”); standards for establishing, documenting,
Disclosures Pursuant to Section 289, Para-graph 4, and Section 315, Paragraph 4 of the German Commercial Code on the Internal Control System for the Accounting Process
General PrinciplesWe apply Section 315e, Paragraph 1, of the German Commer-
cial Code and prepare our Consolidated Financial Statements in
accordance with International Financial Reporting Standards
(“IFRS”) and the interpretations of the IFRS Interpretations
Committee that were adopted by the European Commission for
use in the EU as of the end of the fiscal year and whose applica-
tion was mandatory as of the balance-sheet date (see Note 1
to the Consolidated Financial Statements). Energy Networks
(Germany, Sweden, and East-Central Europe/Turkey), Customer
Solutions (Germany, United Kingdom, Other), Renewables, Non-
Core Business, and Corporate Functions/Other are our IFRS
reportable segments.
E.ON SE prepares its Financial Statements in accordance with
the German Commercial Code, the SE Ordinance (in conjunc-
tion with the German Stock Corporation Act), and the German
Energy Act.
We prepare a Combined Group Management Report which
applies to both the E.ON Group and E.ON SE.
Accounting Process All companies included in the Consolidated Financial Statements
must comply with our uniform Accounting and Reporting Guide-
lines for the Annual Consolidated Financial Statements and the
Interim Consolidated Financial Statements. These guidelines
describe applicable IFRS accounting and valuation principles.
They also explain accounting principles typical in the E.ON
Group, such as those for nuclear-waste management, the treat-
ment of financial instruments, and the treatment of regulatory
obligations. We continually analyze amendments to laws, new
or amended accounting standards, and other pronouncements
for their relevance to, and consequences for, our Consolidated
Financial Statements and, if necessary, update our guidelines
and systems accordingly.
Group Management defines and oversees the roles and respon-
sibilities of various Group entities in the preparation of E.ON SE’s
Financial Statements and the Consolidated Financial Statements.
These roles and responsibilities are described in detail in a
Group Policy document.
E.ON Group companies are responsible for preparing their finan-
cial statements in a proper and timely manner. They receive
substantial support from Business Service Centers in Regens-
burg, Germany, and Cluj, Romania. The financial statements of

53
and evaluating internal controls; a Catalog of ICS Principles; a
description of the test activities of our Internal Audit division;
and a description of the final Sign-Off process. We believe that
compliance with these rules provides sufficient certainty to pre-
vent error or fraud from resulting in material misrepresentations
in the Financial Statements, the Combined Group Management
Report, and the Interim Reports.
COSO FrameworkOur internal control system is based on the globally recognized
COSO framework, in the version published in May 2013 (COSO:
The Committee of Sponsoring Organizations of the Treadway
Commission). The Central Risk Catalog (ICS Model), which
encompasses company- and industry-specific aspects, defines
possible risks for accounting (financial reporting) in the functional
areas of our units and thus serves as a check list and provides
guidance for the establishment, documentation, and implemen-
tation of internal controls.
The Catalog of ICS Principles is another key component of our
internal control system, defining the minimum requirements
for the system to function. These principles encompass over-
arching principles for matters such as authorization, segregation
of duties, and master data management as well as specific
requirements for managing risks in a range of issue areas and
processes, such as contractor management, project manage-
ment, audit, and transactions.
ScopeEach year, we conduct a process using qualitative criteria and
quantitative materiality metrics to define which E.ON units
must document and evaluate their financial-reporting-related
processes and controls in a central documentation system.
Central Documentation SystemThe E.ON units to which the internal control system applies use
a central documentation system to document key controls. The
system defines the scope, detailed documentation require-
ments, the assessment requirements for process owners, and
the final Sign-Off process.
AssessmentAfter E.ON units have documented their processes and controls,
the individual process owners conduct an annual assessment of
the design and the operational effectiveness of the processes as
well as the controls embedded in these processes.
Tests Performed by Internal AuditThe management of E.ON units relies on the assessment per-
formed by the process owners and on testing of the internal
control system performed by Internal Audit. These tests are a
key part of the process. Using a risk-oriented audit plan, Inter-
nal Audit tests the E.ON Group’s internal control system and
identifies potential deficiencies (issues). On the basis of its own
evaluation and the results of tests performed by Internal Audit,
an E.ON unit’s management carries out the final Sign-Off.
Sign-Off ProcessThe final step of the internal evaluation process is the submission
of a formal written declaration called a Sign-Off confirming the
effectiveness of the internal control system. The Sign-Off pro-
cess is conducted at all levels of the Group before E.ON SE, as
the final step, conducts it for the Group as a whole. The Chair-
man of the E.ON SE Management Board and the Chief Financial
Officer make the final Sign-Off for the E.ON Group.
Internal Audit regularly informs the E.ON SE Supervisory Board’s
Audit and Risk Committee about the internal control system for
financial reporting and any significant issue areas it identifies in
the E.ON Group’s various processes.
General IT ControlsAn E.ON unit called E.ON Business Services and external service
providers provide IT services for the majority of the units at the
E.ON Group. The effectiveness of the automated controls in the
standard accounting software systems and in key additional appli-
cations depends to a considerable degree on the proper function-
ing of IT systems. Consequently, IT controls are embedded in our
documentation system. These controls primarily involve ensuring
the proper functioning of IT-related access-control mechanisms
of systems and applications, of daily IT operations (such as emer-
gency measures), of the program change process.
54Disclosures Regarding Takeovers
The Supervisory Board appoints members to the Management
Board for a term not exceeding five years; reappointment is per-
missible. If more than one person is appointed as a member of
the Management Board, the Supervisory Board may appoint
one of the members as Chairperson of the Management Board.
If there is a vacancy on the Management Board for a required
member, the court makes the necessary appointment upon
petition by a concerned party in the event of an urgent matter.
The Supervisory Board may revoke the appointment of a mem-
ber of the Management Board and of the Chairperson of the
Management Board for serious cause (for further details, see
Sections 84 and 85 of the AktG).
Resolutions of the Shareholders Meeting require a majority of
the valid votes cast unless mandatory law or the Articles of
Association explicitly prescribe otherwise. An amendment to
the Articles of Association requires a two-thirds majority of
the votes cast or, in cases where at least half of the share cap-
ital is represented, a simple majority of the votes cast unless
mandatory law explicitly prescribes another type of majority.
The Supervisory Board is authorized to decide by resolution on
amendments to the Articles of Association that affect only their
wording (Section 10, Paragraph 7, of the Articles of Association).
Furthermore, the Supervisory Board is authorized to revise the
wording of Section 3 of the Articles of Association upon utiliza-
tion of authorized or conditional capital.
Disclosures Pursuant to Section 289a, Paragraph 1, and Section 315a, Paragraph 1, of the German Commercial Code
Composition of Share CapitalThe share capital totals €2,201,099,000.00 and consists of
2,201,099,000 registered shares without nominal value. In the
2017 financial year, the share capital was increased by
€200,099,000.00, from 2,001,000,000.00 to €2,201,099,000.00,
through partial use of Authorized Capital 2012. Information
about the capital increase can be found in Note 19 to the Con-
solidated Financial Statements. Each share of stock grants the
same rights and one vote at a Shareholders Meeting.
Restrictions on Voting Rights or the Transfer of SharesShares acquired by an employee under the Company-sponsored
employee stock purchase program are subject to a blackout
period that begins the day ownership of such shares is trans-
ferred to the employee and that ends on December 31 of the
next calendar year plus one. As a rule, an employee may not sell
such shares until the blackout period has expired.
Pursuant to Section 71b of the German Stock Corporation Act
(“AktG”), the Company’s treasury shares give it no rights, includ-
ing no voting rights.
Legal Provisions and Rules of the Company’s Articles of Associ-ation Regarding the Appointment and Removal of Management Board Members and Amendments to the Articles of AssociationPursuant to the Company’s Articles of Association, the Man-
agement Board consists of at least two members. The Super-
visory Board decides on the number of members as well as on
their appointment and dismissal.
55
Management Board’s Power to Issue or Buy Back SharesPursuant to a resolution of the Shareholders Meeting of May 10,
2017, the Company is authorized, until May 9, 2022, to acquire
treasury shares. The shares acquired and other treasury shares
that are in possession of or to be attributed to the Company
pursuant to Sections 71a et seq. of the AktG must altogether at
no point account for more than 10 percent of the Company’s
share capital.
At the Management Board’s discretion, the acquisition may be
conducted:
• through a stock exchange
• by means of a public offer directed at all shareholders or a
public solicitation to submit offers
• by means of a public offer or a public solicitation to submit
offers for the exchange of liquid shares that are admitted to
trading on an organized market, within the meaning of the
German Securities Purchase and Takeover Law, for Company
shares
• by use of derivatives (put or call options or a combination of
both).
These authorizations may be utilized on one or several occasions,
in whole or in partial amounts, in pursuit of one or more objec-
tives by the Company and also by its affiliated companies or by
third parties for the Company’s account or one of its affiliate’s
account.
With regard to treasury shares that will be or have been acquired
based on the above-mentioned authorization and/or prior
authorizations by the Shareholders Meeting, the Management
Board is authorized, subject to the Supervisory Board’s consent
and excluding shareholder subscription rights, to use these
shares—in addition to a disposal through a stock exchange or an
offer granting a subscription right to all shareholders—as follows:
• to be sold and transferred against cash consideration
• to be sold and transferred against contribution in kind
• to be used in order to satisfy the rights of creditors of bonds
with conversion or option rights or, respectively, conversion
obligations issued by the Company or its Group companies
or
• to be offered, with or without consideration, for purchase
and transferred to individuals who are or were employed
by the Company or one of its affiliates as well as to board
members of affiliates of the Company
• to be used for the purpose of a scrip dividend where share-
holders may choose to contribute their dividend entitlement
to the Company in the form of a contribution in kind in
exchange for new shares.

56Disclosures Regarding Takeovers
Scrip Dividend in 2017In 2017 E.ON SE shareholders were again given the option of
exchanging a portion of their €0.21 dividend for shares of E.ON SE
stock. Shareholders could exchange €0.15 of their per share
dividend. The remaining €0.06 was paid out in cash or, if neces-
sary, withheld to cover tax obligations. Shareholders’ formal
subscription rights were excluded. The acceptance rate was
about 33 percent. A total of 14,653,833 shares of stock were
used for the scrip dividend and issued to shareholders.
Significant Agreements to Which the Company Is a Party That Take Effect on a Change of Control of the Company Following a Takeover BidDebt issued since 2007 contains change-of-control clauses
that give the creditor the right of cancellation. This applies, inter
alia, to bonds issued by E.ON SE and E.ON International Finance
B.V. and guaranteed by E.ON SE, promissory notes issued by
E.ON SE, and other instruments such as credit contracts. Granting
change-of-control rights to creditors is considered good corpo-
rate governance and has become standard market practice.
Further information about financial liabilities is contained in the
section of the Combined Group Management Report entitled
Financial Situation and in Note 26 to the Consolidated Financial
Statements.
Settlement Agreements between the Company and Management Board Members or Employees in the Case of a Change-of-Control EventIn the event of a premature loss of a Management Board posi-
tion due to a change-of-control event, the service agreements
of Management Board members entitle them to severance and
settlement payments (see the detailed presentation in the
Compensation Report).
A change-of-control event would also result in the early payout
of virtual shares under the E.ON Share Matching Plan and the
E.ON Performance Plan.
These authorizations may be utilized on one or several occa-
sions, in whole or in partial amounts, separately or collectively,
including with respect to treasury shares acquired by affiliated
companies or companies majority-owned by the Company or by
third parties for their account or the Company’s account.
In addition, the Management Board is authorized to cancel trea-
sury shares, without such cancellation or its implementation
requiring an additional resolution by the Shareholders Meeting.
In each case, the Management Board will inform the Share-
holders Meeting about the utilization of the aforementioned
authorization, in particular about the reasons for and the purpose
of the acquisition of treasury shares, the number of treasury
shares acquired, the amount of the registered share capital
attributable to them, the portion of the registered share capital
represented by them, and their equivalent value.
By shareholder resolution adopted at the Annual Shareholders
Meeting of May 10, 2017, the Management Board was autho-
rized, subject to the Supervisory Board’s approval, to increase
until May 9, 2022, the Company’s share capital by a total of up
to €460 million through one or more issuances of new registered
no-par-value shares against contributions in cash and/or in
kind (authorized capital pursuant to Sections 202 et seq. AktG,
Authorized Capital 2017). Subject to the Supervisory Board’s
approval, the Management Board is authorized to exclude share-
holders’ subscription rights. Authorized Capital 2017 was not
utilized.
At the Annual Shareholders Meeting of May 10, 2017, share-
holders approved a conditional increase of the capital stock
(with the option to exclude shareholders’ subscription rights) in
the amount of €175 million, which is authorized until May 9,
2022. The conditional capital increase will be implemented
only to the extent that holders of option or conversion rights or
persons obliged to conversion under option or convertible
bonds, profit-participation rights or profit-participating bonds
issued or guaranteed by the Company or a Group company of
the Company as defined in Section 18 AktG exercise their
option or conversion rights or, if they are obliged to conversion
or exercise of the option, fulfill their conversion obligation or,
as the case may be, their obligation to exercise the option. The
conditional capital increase was not utilized.

57
Corporate Governance Declaration in Accor-dance with Section 289f and Section 315d of the German Commercial Code
Declaration Made in Accordance with Section 161 of the German Stock Corporation Act by the Management Board and the Supervisory Board of E.ON SE The Board of Management and the Supervisory Board hereby
declare that E.ON SE will comply in full with the recommen-
dations of the “Government Commission German Corporate
Governance Code,” dated February 7, 2017, published by the
Federal Ministry of Justice and for Consumer Protection in the
official section of the Federal Gazette (Bundesanzeiger).
The Board of Management and the Supervisory Board further-
more declare that E.ON SE has been in compliance in full with
the recommendations of the “Government Commission German
Corporate Governance Code,” dated May 5, 2015, published by
the Federal Ministry of Justice and for Consumer Protection in
the official section of the Federal Gazette (Bundesanzeiger)
since the last declaration on December 16, 2016.
Essen, December 18, 2017
For the Supervisory Board of E.ON SE
Dr. Karl-Ludwig Kley
(Chairman of the Supervisory Board of E.ON SE)
For the Management Board of E.ON SE
Dr. Johannes Teyssen
(Chairman of the Management Board of E.ON SE)
This declaration and those of the previous five years are contin-
uously available to the public on the Company’s Internet page
at www.eon.com.
Relevant Information about Management Practices Corporate Governance E.ON views good corporate governance as a central foundation
of responsible and value-oriented management, efficient
collaboration between the Management Board and the Super-
visory Board, transparent disclosures, and appropriate risk
management.
In the past financial year the Management Board and Super-
visory Board paid close attention to E.ON’s compliance with the
German Corporate Governance Code’s recommendations and
suggestions. They determined that E.ON SE fully complies with
all of the Code’s recommendations and with nearly all of its
suggestions.
Transparent Management Transparency is a high priority of the Management Board and
Supervisory Board. Our shareholders, all capital market partici-
pants, financial analysts, shareholder associations, and the media
regularly receive up-to-date information about the situation of,
and any material changes to, the Company. We primarily use the
Internet to help ensure that all investors have equal access to
comprehensive and timely information about the Company.
E.ON SE issues reports about its situation and earnings by the
following means:
• Interim Reports
• Annual Reports
• Annual press conference
• Press releases
• Telephone conferences held on release of the quarterly Interim
Reports and the Annual Report
• Numerous events for financial analysts in and outside Germany.
A financial calendar lists the dates on which the Company’s
financial reports are released.
In addition to the Company’s periodic financial reports, the
Company issues ad hoc statements when events or changes
occur at E.ON SE that could have a significant impact on the
price of E.ON stock.
The financial calendar and ad hoc statements are available on
the Internet at www.eon.com.
58Corporate Governance Report
Someone who has reached the general retirement age should
not be a member of the Management Board. The Management
Board has in place policies and procedures for the business it
conducts and, in consultation with the Supervisory Board, has
assigned task areas to its members.
The Management Board regularly reports to the Supervisory
Board on a timely and comprehensive basis on all relevant issues
of strategy, planning, business development, risk situation, risk
management, and compliance. It also submits the Group’s invest-
ment, finance, and personnel plan for the next financial year as
well as the medium-term plan to the Supervisory Board, generally
at the last meeting of each financial year.
The Chairperson of the Management Board informs, without
undue delay, the Chairperson of the Supervisory Board of import-
ant events that are of fundamental significance in assessing the
Company’s situation, development, and management and of any
defects that have arisen in the Company’s monitoring systems.
Transactions and measures requiring the Supervisory Board’s
approval are also submitted to the Supervisory Board in a timely
manner.
Members of the Management Board are also required to promptly
report conflicts of interest to the Executive Committee of the
Supervisory Board and to inform the other members of the Man-
agement Board. Members of the Management Board may only
assume other corporate positions, particularly appointments to
the supervisory boards of non-Group companies, with the con-
sent of the Executive Committee of the Supervisory Board. There
were no conflicts of interest involving members of the E.ON SE
Management Board in 2017. Any material transactions between
the Company and members of the Management Board, their rela-
tives, or entities with which they have close personal ties require
the consent of the Executive Committee of the Supervisory Board.
No such transactions took place in the reporting period.
The Management Board has no board committees but has estab-
lished a number of committees that support it in the fulfillment of
its tasks. The members of these committees are senior represen-
tatives of various departments of E.ON SE whose experience,
responsibilities, and expertise make them particularly suited for
their committee’s tasks. Among these committees are the follow-
ing:
Managers‘ Transactions Persons with executive responsibilities, in particular members
of E.ON SE’s Management Board and Supervisory Board, and
persons closely related to them, must disclose specific dealings
in E.ON stock or bonds, related derivatives, or other related
financial instruments pursuant to Article 19 of the EU Market
Abuse Regulation in conjunction with Section 26, Paragraph 2, of
the German Securities Trading Act. Such dealings that took place
in 2017 have been disclosed on the Internet at www.eon.com.
Integrity Our actions are grounded in integrity and a respect for the law.
The basis for this is the Code of Conduct established by the Man-
agement Board. It emphasizes that all employees must comply
with laws and regulations and with Company policies. These
relate to dealing with business partners, third parties, and govern-
ment institutions, particularly with regard to antitrust law, the
granting and accepting of benefits, the involvement of intermedi-
aries, and the selection of suppliers and service providers. Other
rules address issues such as the avoidance of conflicts of interest
(such as the prohibition to compete, secondary employment,
material financial investments) and handling company informa-
tion, property, and resources. The policies and procedures of our
compliance organization ensure the investigation, evaluation, ces-
sation, and punishment of reported violations by the appropriate
Compliance Officers and the E.ON Group’s Chief Compliance Offi-
cer. Violations of the Code of Conduct can also be reported anony-
mously (for example, by means of a whistleblower report). The
Code of Conduct is published on www.eon.com.
Description of the Functioning of the Management Board and Supervisory Board and of the Composition and Functioning of Their CommitteesManagement BoardThe E.ON SE Management Board manages the Company’s
businesses, with all its members bearing joint responsibility for
its decisions. It establishes the Company’s objectives, sets its
fundamental strategic direction, and is responsible for corpo-
rate policy and Group organization.
In 2017 the Management Board consisted of five members ini-
tially and, after the end of Mr. Sen’s service, effective April 1,
2017, of four members. It had one Chairman. No Management
Board member has more than three supervisory board member-
ships in listed non-Group companies or on the supervisory bodies
of non-Group companies that require a similar commitment.

59
The Management Board has established a Disclosure Commit-
tee and an Ad Hoc Committee for issues relating to financial dis-
closures. These committees ensure that such information is dis-
closed in a correct and timely fashion.
A Risk Committee ensures the correct application and imple-
mentation of the legal requirements of Section 91 of the Ger-
man Stock Corporation Act (“AktG”). This committee monitors
the E.ON Group’s risk situation and its risk-bearing capacity and
devotes particular attention to the early-warning system to
ensure the early identification of going-concern risks in order to
avoid developments that could potentially threaten the Group’s
continued existence. In this context, the Risk Committee also
deals with risk-mitigation strategies (including hedging strate-
gies). In collaboration with relevant departments, the committee
ensures and refines the implementation of, and compliance with,
the Company’s reporting policies with regard to commodity
risks, credit risks, and enterprise risk management.
Supervisory BoardThe E.ON SE Supervisory Board had eighteen members in the
2017 financial year. Pursuant to E.ON SE’s Articles of Associa-
tion, it is composed of an equal number of shareholder and
employee representatives. The shareholder representatives are
elected by the shareholders at the Annual Shareholders Meet-
ing; the Supervisory Board nominates candidates for this pur-
pose. As a rule, the Annual Shareholders Meeting decides on
the elections by individual vote. Pursuant to the agreement
regarding employees’ involvement in E.ON SE, the other cur-
rently nine members of the Supervisory Board are appointed by
the SE Works Council, with the provision that at least three dif-
ferent countries are represented and one member is selected by
a trade union that is represented at E.ON SE or one of its sub-
sidiaries in Germany. Persons are not eligible as Supervisory
Board members if they:
• are already supervisory board members in ten commercial
companies that are required by law to form a supervisory
board,
• are legal representatives of an enterprise controlled by the
Company,
• are legal representatives of another corporation whose
supervisory board includes a member of the Company’s
Management Board, or
• were a member of the Company’s Management Board in the
past two years, unless the person concerned is nominated
by shareholders who hold more than 25 percent of the Com-
pany’s voting rights.
The members of the E.ON SE Supervisory Board fulfill these
requirements. Pursuant to the AktG, at least one member of the
Supervisory Board must have expertise in preparing or auditing
financial statements. The Supervisory Board believes that, in
particular, Dr. Theo Siegert and Andreas Schmitz meet this
requirement. The Supervisory Board believes that its members
in their entirety are familiar with the sector in which the Com-
pany operates.
The Supervisory Board oversees the Company’s management
and advises the Management Board on an ongoing basis. The
Management Board requires the Supervisory Board’s prior
approval for significant transactions and measures, such as the
Group’s investment, finance, and personnel plans; the acquisi-
tion or sale of companies, equity interests, or parts of compa-
nies whose fair value or, in the absence of a fair value, whose
book value exceeds €300 million; financing measures that
exceed €1 billion and have not been covered by Supervisory
Board resolutions regarding finance plans; and the conclusion,
amendment, or termination of affiliation agreements. The
Supervisory Board examines the Financial Statements of E.ON
SE, the Management Report, and the proposal for profit appro-
priation and, on the basis of the Audit and Risk Committee’s
preliminary review, the Consolidated Financial Statements and
the Combined Group Management Report and the separate
Non-Financial Report and the separate Combined Non-Finan-
cial Report. The Supervisory Board provides to the Annual
Shareholders Meeting a written report on the results of this
examination.
The Supervisory Board has established policies and procedures
for itself, which are available on the Company’s Internet page. It
holds at least four regular meetings in each financial year. Its
policies and procedures include mechanisms by which, if neces-
sary, a meeting of the Supervisory Board or one of its commit-
tees can be called at any time by a member or by the Manage-
ment Board. Shareholder representatives and employee
representatives can prepare for Supervisory Board meetings
separately. In the event of a tie vote on the Supervisory Board,
the Chairperson has the tie-breaking vote.
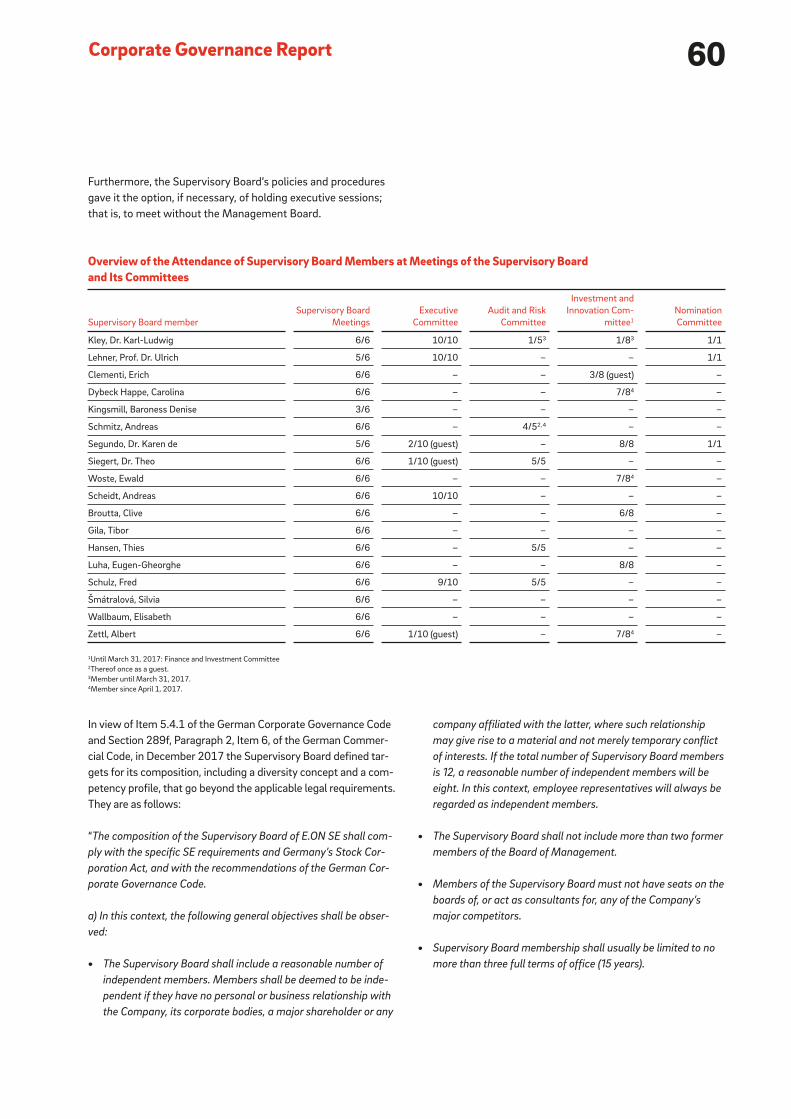
60Corporate Governance Report
Furthermore, the Supervisory Board’s policies and procedures
gave it the option, if necessary, of holding executive sessions;
that is, to meet without the Management Board.
In view of Item 5.4.1 of the German Corporate Governance Code
and Section 289f, Paragraph 2, Item 6, of the German Commer-
cial Code, in December 2017 the Supervisory Board defined tar-
gets for its composition, including a diversity concept and a com-
petency profile, that go beyond the applicable legal requirements.
They are as follows:
“The composition of the Supervisory Board of E.ON SE shall com-
ply with the specific SE requirements and Germany’s Stock Cor-
poration Act, and with the recommendations of the German Cor-
porate Governance Code.
a) In this context, the following general objectives shall be obser-
ved:
• The Supervisory Board shall include a reasonable number of
independent members. Members shall be deemed to be inde-
pendent if they have no personal or business relationship with
the Company, its corporate bodies, a major shareholder or any
company affiliated with the latter, where such relationship
may give rise to a material and not merely temporary conflict
of interests. If the total number of Supervisory Board members
is 12, a reasonable number of independent members will be
eight. In this context, employee representatives will always be
regarded as independent members.
• The Supervisory Board shall not include more than two former
members of the Board of Management.
• Members of the Supervisory Board must not have seats on the
boards of, or act as consultants for, any of the Company’s
major competitors.
• Supervisory Board membership shall usually be limited to no
more than three full terms of office (15 years).
Overview of the Attendance of Supervisory Board Members at Meetings of the Supervisory Board and Its Committees
Supervisory Board member
Supervisory Board
Meetings
Executive
Committee
Audit and Risk
Committee
Investment and
Innovation Com-
mittee1
Nomination
Committee
Kley, Dr. Karl-Ludwig 6/6 10/10 1/53 1/83 1/1
Lehner, Prof. Dr. Ulrich 5/6 10/10 – – 1/1
Clementi, Erich 6/6 – – 3/8 (guest) –
Dybeck Happe, Carolina 6/6 – – 7/84 –
Kingsmill, Baroness Denise 3/6 – – – –
Schmitz, Andreas 6/6 – 4/52, 4 – –
Segundo, Dr. Karen de 5/6 2/10 (guest) – 8/8 1/1
Siegert, Dr. Theo 6/6 1/10 (guest) 5/5 – –
Woste, Ewald 6/6 – – 7/84 –
Scheidt, Andreas 6/6 10/10 – – –
Broutta, Clive 6/6 – – 6/8 –
Gila, Tibor 6/6 – – – –
Hansen, Thies 6/6 – 5/5 – –
Luha, Eugen-Gheorghe 6/6 – – 8/8 –
Schulz, Fred 6/6 9/10 5/5 – –
Šmátralová, Silvia 6/6 – – – –
Wallbaum, Elisabeth 6/6 – – – –
Zettl, Albert 6/6 1/10 (guest) – 7/84 –
1Until March 31, 2017: Finance and Investment Committee2Thereof once as a guest.3Member until March 31, 2017.4Member since April 1, 2017.

61
• All Supervisory Board members must have sufficient time
available to perform their duties on the boards of various com-
panies. Persons who are members of the board of manage-
ment of a listed company shall only be eligible as members of
E.ON’s Supervisory Board if they do not have seats on a total
of more than two supervisory boards of listed non-Group com-
panies or of comparable supervisory bodies.
b) In addition, the Supervisory Board has adopted the following
diversity concept so as to ensure a balanced structure of the
Supervisory Board in terms of age, gender, personality, educatio-
nal background and professional experience.
• In the search for qualified Supervisory Board members, due
consideration shall be given to diversity. When preparing nom-
inations for the election of Supervisory Board members, due
consideration shall be given in each case to the question as to
whether complementary academic profiles, professional and
life experience, a balanced age mix, various personalities and
a reasonable gender balance benefit the Supervisory Board’s
work. In this context, care shall be taken to ensure that a gen-
der quota of 30 percent will be achieved; this shall apply to the
Supervisory Board as a whole and to the shareholders’ and
employees’ representatives separately.
• An upper age limit of 75 years shall apply to members of the
Supervisory Board; candidates shall not be older than 72 years
when they are elected.
• Four Supervisory Board members shall have international
experience, i.e. they shall have spent, for instance, many years
of their professional career outside Germany.
c) In addition, the following skills profile shall apply; especially the
Nominations Committee will strive to apply the skills profile when
preparing nominations of candidates for the shareholders’ repre-
sentatives to be proposed to the Annual General Meeting.
• The shareholders’ representatives should have leadership
experience in companies or other large organizations by the
majority. At least four members shall have experience, as
management or supervisory board members, in the strategic
management or supervision of listed organizations and shall
be familiar with the functioning of capital and financial mar-
kets.
• At least two members shall be familiar, in particular, with
innovation, disruption and digitization and the associated new
business models and cultural change.
• At least four members shall have specific expertise in the busi-
nesses and markets that are particularly relevant for E.ON.
This includes in particular the energy sector, the sales and
retail business, regulated industries, new technology as well as
relevant customer sectors.
• At least two independent representatives of the shareholders
shall have expertise in the fields of accounting, risk manage-
ment and auditing of financial statements.
• At least two members shall be familiar with legal and compli-
ance, HR, IT and sustainability.“
Current Compositiona) The Supervisory Board believes that all of its members are
independent. No former Management Board member sits on
the Supervisory Board. Furthermore, no member has a seat on
the boards of, or acts as a consultant for, any of the Company’s
major competitors or has been on the Supervisory Board for
more than three full terms of office (15 years). The Supervisory
Board believes that in the case of no Supervisory Board mem-
ber is there specific indications of relevant situations or rela-
tionships that could give rise to a conflict of interests. No man-
agement board member of a listed company sits on the
Supervisory Board.
b) In its current composition the Supervisory Board meets the
objectives of its diversity concept. The Supervisory Board’s com-
position of women and men complies with the legal require-
ments for minimum percentages, although separate compliance
with the statutory gender quota is not expected to occur until
the Annual Shareholders Meeting in 2018. The age range of the
Supervisory Board is currently between 42 and 71 years, with
an average age of 59. At least four members have international
experience.
c) The members bring a wide range of specific knowledge to
committee work and have special expertise in one or more busi-
nesses and markets relevant to the Company.
Current CVs of Supervisory Board members are published on
the Company’s Internet page.

62Corporate Governance Report
The Audit and Risk Committee consists of four members. The
Supervisory Board believes that, in their entirety, the members
of the Audit and Risk Committee are familiar with the sector in
which the Company operates. According to the AktG, the Audit
and Risk Committee must include one Supervisory Board mem-
ber who has expertise in accounting and/or auditing. The
Supervisory Board believes that Dr. Theo Siegert and Andreas
Schmitz fulfill these requirements. Pursuant to the recommen-
dations of the German Corporate Governance Code, the Chair-
person of the Audit and Risk Committee should have special
knowledge and experience in the application of accounting
principles and internal control processes. In addition, this per-
son should be independent and should not be a former Man-
agement Board member whose service on the Management
Board ended less than two years ago. The Supervisory Board
believes that the Chairman of the Audit and Risk Committee, Dr.
Theo Siegert, fulfills these requirements. In particular, the Audit
and Risk Committee deals with accounting issues (including the
accounting process), risk management, compliance, the neces-
sary independence of the independent auditor, the issuance of
the audit mandate to the independent auditor, the definition of
the audit priorities, the agreement regarding the independent
auditor’s fees, and any additional services performed by the
independent auditor. The committee’s monitoring of risk man-
agement encompasses reviewing the effectiveness of the inter-
nal control system, internal risk management, and the internal
audit system. The committee also prepares the Supervisory
Board’s decision on the approval of the Financial Statements of
E.ON SE and the Consolidated Financial Statements. It is
responsible for the preliminary review of the Financial State-
ments of E.ON SE, the Management Report, the Consolidated
Financial Statements, the Combined Group Management
Report and the proposal for profit appropriation of profits as
At the close of the 2018 Annual Shareholders Meeting, the
Supervisory Board will be reduced to twelve members in accor-
dance with Sections 8 and 8a of E.ON SE’s Articles of Associa-
tion. The Management Board and the Supervisory Board intend
to propose to the Annual Shareholders Meeting that the num-
ber of Supervisory Board members be increased by two persons
so that in the future the Supervisory Board can continue to fully
meet the objectives for its composition, including the diversity
concept and the competency profile, despite the end of service
of long-standing members. In view of continually changing
business requirements, the Supervisory Board will continue to
identify necessary competencies early to ensure that it has
them.
The Supervisory Board has established the following commit-
tees and defined policies and procedures for them:
The Executive Committee consists of four members: the Super-
visory Board Chairperson, his or her two Deputies, and a further
employee representative. It prepares the meetings of the
Supervisory Board and advises the Management Board on mat-
ters of general policy relating to the Company’s strategic devel-
opment. In urgent cases (in other words, if waiting for the
Supervisory Board’s prior approval would materially prejudice
the Company), the Executive Committee acts on the full Super-
visory Board’s behalf. In addition, a key task of the Executive
Committee is to prepare the Supervisory Board’s personnel
decisions and resolutions for setting the respective total com-
pensation of individual Management Board members within the
meaning of Section 87, AktG. Furthermore, it is responsible for
the conclusion, alteration, and termination of the service agree-
ments of Management Board members and for presenting the
Supervisory Board with a proposal for a resolution on the Man-
agement Board’s compensation plan and its periodic review. In
addition, it prepares the Supervisory Board’s decision on the
Group’s investment, financial, and personnel plan for the next
financial year. It also deals with corporate-governance matters
and reports to the Supervisory Board, generally once a year, on
the status and effectiveness of, and possible ways of improving,
the Company’s corporate governance and on new requirements
and developments in this area.

63
well as—if these are not already part of the (Combined Group)
Management Report—the separate Non-Financial Report and
the separate Combined Non-Financial Report. It discusses the
half-yearly reports and quarterly notifications or financial
reports with the Management Board prior to their publication.
The effectiveness of the internal control mechanisms for the
accounting process used at E.ON SE and its units is tested on a
regular basis by our Internal Audit division; the Audit and Risk
Committee regularly monitors the work done by the Internal
Audit division and the definition of audit priorities. The Audit
and Risk Committee may commission an external review of the
contents of the Non-Financial Statement or the separate
Non-Financial Report or the Combined Non-Financial State-
ment or the separate Combined Non-Financial Report. In addi-
tion, the Audit and Risk Committee prepares the proposal on
the selection of the Company’s independent auditor for the
Annual Shareholders Meeting. In order to ensure the auditor’s
independence, the Audit and Risk Committee secures a state-
ment from the proposed auditor detailing any facts that could
lead to the audit firm being excluded for independence reasons
or otherwise conflicted.
In being assigned the audit task, the independent auditor agrees
to:
• promptly inform the Chairperson of the Audit and Risk Com-
mittee should any such facts arise during the course of the
audit unless such facts are resolved in a satisfactory manner
• promptly inform the Supervisory Board of anything it
becomes aware of during the course of the audit that is of
relevance to the Supervisory Board’s duties
• inform the Chairperson of the Audit and Risk Committee, or
to note in the audit report, if the audit has led to findings
that contradict the Declaration of Compliance with the Ger-
man Corporate Governance Code by the Management Board
or Supervisory Board.
The Investment and Innovation Committee (until March 31,
2017: the Finance and Investment Committee) generally con-
sists of four members; from April 1, 2017, to the end of the
2018 Annual Shareholders Meeting it consists of six members.
It advises the Management Board on all issues of Group
financing and investment planning as well as issues relating to
market developments and innovation. It decides on behalf of
the Supervisory Board on the approval of the acquisition and
disposition of companies, equity interests, and parts of compa-
nies whose value exceeds €300 million but does not exceed
€600 million. In addition, it decides on behalf of the Supervi-
sory Board on the approval of financing measures whose value
exceeds €1 billion but not €2.5 billion if such measures are not
covered by the Supervisory Board’s resolutions regarding
finance plans. If the value of any such transactions or measures
exceeds the above-mentioned thresholds, the committee pre-
pares the Supervisory Board’s decision.
The Nomination Committee consists of three shareholder-rep-
resentative members. Its Chairperson is the Chairperson of the
Supervisory Board. Its task is to recommend to the Supervisory
Board, taking into consideration the Supervisory Board’s tar-
gets for its composition, suitable candidates for election to the
Supervisory Board by the Annual Shareholders Meeting.
All committees meet at regular intervals and when specific cir-
cumstances require it under their policies and procedures. The
Report of the Supervisory Board (on pages 8 to 9) contains
information about the activities of the Supervisory Board and
its committees in 2017. Pages 222 and 223 show the compo-
sition of the Supervisory Board and its committees.

64Corporate Governance Report
Shareholders and Annual Shareholders Meeting E.ON SE shareholders exercise their rights and vote their shares
at the Annual Shareholders Meeting. The convening of the
Annual Shareholders Meeting and the reports and documents
required by law for the Annual Shareholders Meeting, including
the Annual Report, are published on the Company’s Internet
page together with the agenda and the explanation of the con-
ditions of participation, shareholders’ rights, and any counter-
motions and election proposals submitted by shareholders. The
Company’s financial calendar, which is published in the Annual
Report, in the quarterly notifications or financial reports, and on
the Internet at www.eon.com, regularly informs shareholders
about important Company dates.
At the Annual Shareholders Meeting, shareholders may vote
their shares themselves, through a proxy of their choice, or
through a Company proxy who is required to follow the share-
holder’s voting instructions.
As stipulated by German law, the Annual Shareholders Meeting
votes to select the Company’s independent auditor.
At the Annual Shareholders Meeting on May 10, 2017, Price-
waterhouseCoopers GmbH, Wirtschaftsprüfungsgesellschaft,
was selected to be E.ON SE’s independent auditor for the 2017
financial year and to audit the Condensed Consolidated Interim
Financial Statements and Interim Group Management Report
for the 2017 financial year and the first quarter of 2018. The
independent auditors with signing authority for the Annual
Financial Statements of E.ON SE and the Consolidated Financial
Statements are Markus Dittmann (since the 2014 financial
year) and Aissata Touré (since the 2015 financial year).
Women and Men in Leadership Positions Pursuant to Section 76, Paragraph 4, and Section 111, Paragraph 5, of the German Stock Corporation Act In the reporting period, the Management Board consisted ini-
tially of five and subsequently of four men. In December 2016
the Supervisory Board set a new target of 20 percent for the
proportion of women on the Management Board and a deadline
of December 31, 2021, for implementation.
In 2015, for E.ON SE the Management Board set a target of
23 percent for the proportion of women in the first level of
management below the Management Board and a target of
17 percent for the second level of management below the
Management Board. The deadline for achieving both targets
was June 30, 2017. At the time of the deadline, the proportion
of women in first and second levels of management below the
Management Board was 19 percent and 27 percent, respec-
tively. During the implementation period, E.ON took specific
steps to increase the proportion of women in management
positions. However, turnover in management was lower than in
previous years. Despite the positive trend, not yet all targets
were achieved.
In May 2017 the Management Board set new targets of 30 per-
cent for the proportion of women in the first level of manage-
ment below the Management Board and a target of 35 percent
for the second level of management below the Management
Board. The deadline for achieving both targets is June 30, 2022.
65
For all other E.ON Group companies concerned, targets and dead-
lines pursuant to the Law for the Equal Participation of Women
and Men in Leadership Positions in the Private Sector and the
Public Sector were set for the proportion of women on these com-
panies’ supervisory board and management board or team of
managing directors as well as in the next two levels of manage-
ment. The deadline for achieving these targets is June 30, 2022.
Diversity Concept for the Management Board
At its meeting in December 2017 the E.ON SE Supervisory
Board passed a resolution on the following succession plan-
ning/diversity concept for the Management Board:
In cooperation with the Executive Committee and the Manage-
ment Board, the Supervisory Board is in charge of long-term
succession planning for the Management Board. With regard to
the Management Board’s composition, the Supervisory Board
of E.ON SE has developed a diversity concept that is in line with
the relevant recommendations of the German Corporate Gover-
nance Code.
Appointment Objectives
• When appointing members of the Management Board, the
candidates’ outstanding professional qualifications, long-
term leadership experience and past performance, as well as
value-driven management shall be of paramount impor-
tance. Members shall be capable of taking forward-looking
strategic decisions. In particular, they shall be capable of
managing businesses sustainably and of ensuring that they
are consistently focused on customer needs.
• The Management Board as a whole must have expertise and
experience in the energy sector as well as in the fields of
finance and digitization.
• The members of the Management Board shall be leaders
and as such shall act as role models for the employees
through their own performance and conduct.
• Attention shall be paid to diversity when appointing mem-
bers of the Management Board. For the Supervisory Board,
diversity means, in particular, different complementary aca-
demic profiles, professional and personal experience, per-
sonalities, as well as internationality and a reasonable age
and gender structure. The Supervisory Board has therefore
adopted a target quota of 20 percent for the share of women
on the Management Board; this target shall be achieved by
December 31, 2021.
• The appointment period of a member of the Management
Board shall generally end at the end of the month on which
the Management Board member reaches the general retire-
ment age but at the close of the subsequent Annual Share-
holders Meeting at the latest.
Achievement of Objectives
With the exception of the target quota regarding the share of
women, which is to be achieved by December 31, 2021, the
current composition of the Management Board already meets
the appointment objectives described above.
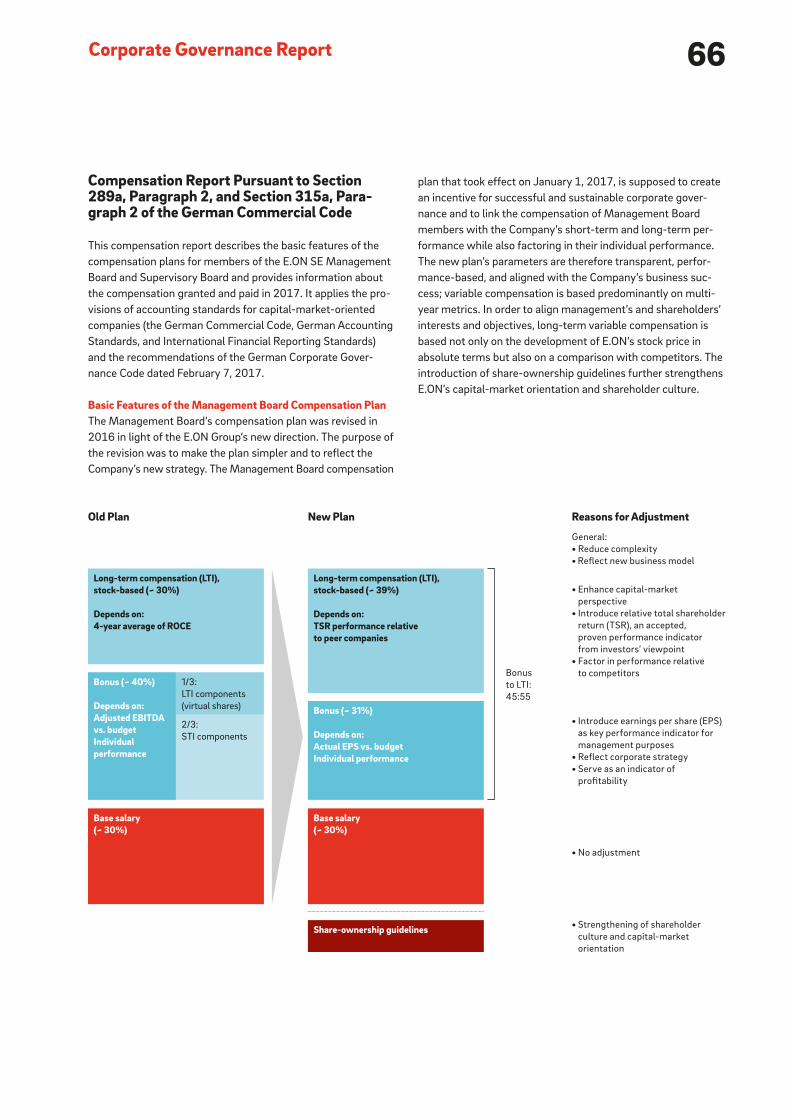
66Corporate Governance Report
plan that took effect on January 1, 2017, is supposed to create
an incentive for successful and sustainable corporate gover-
nance and to link the compensation of Management Board
members with the Company’s short-term and long-term per-
formance while also factoring in their individual performance.
The new plan’s parameters are therefore transparent, perfor-
mance-based, and aligned with the Company’s business suc-
cess; variable compensation is based predominantly on multi-
year metrics. In order to align management’s and shareholders’
interests and objectives, long-term variable compensation is
based not only on the development of E.ON’s stock price in
absolute terms but also on a comparison with competitors. The
introduction of share-ownership guidelines further strengthens
E.ON’s capital-market orientation and shareholder culture.
Compensation Report Pursuant to Section 289a, Paragraph 2, and Section 315a, Para-graph 2 of the German Commercial Code
This compensation report describes the basic features of the
compensation plans for members of the E.ON SE Management
Board and Supervisory Board and provides information about
the compensation granted and paid in 2017. It applies the pro-
visions of accounting standards for capital-market-oriented
companies (the German Commercial Code, German Accounting
Standards, and International Financial Reporting Standards)
and the recommendations of the German Corporate Gover-
nance Code dated February 7, 2017.
Basic Features of the Management Board Compensation Plan The Management Board’s compensation plan was revised in
2016 in light of the E.ON Group’s new direction. The purpose of
the revision was to make the plan simpler and to reflect the
Company’s new strategy. The Management Board compensation
Bonus (~ 40%)
Depends on: Adjusted EBITDA vs. budgetIndividual performance
Bonus (~ 31%)
Depends on:Actual EPS vs. budgetIndividual performance
Long-term compensation (LTI), stock-based (~ 30%)
Depends on:4-year average of ROCE
Long-term compensation (LTI), stock-based (~ 39%)
Depends on:TSR performance relative to peer companies
1/3:
LTI components
(virtual shares)
2/3:
STI components
• Enhance capital-market
perspective
• Introduce relative total shareholder
return (TSR), an accepted,
proven performance indicator
from investors’ viewpoint
• Factor in performance relative
to competitors
• Introduce earnings per share (EPS)
as key performance indicator for
management purposes
• Refl ect corporate strategy
• Serve as an indicator of
profi tability
General:
• Reduce complexity
• Refl ect new business model
Old Plan New Plan Reasons for Adjustment
Bonus
to LTI:
45:55
• Strengthening of shareholder
culture and capital-market
orientation
• No adjustment
Base salary(~ 30%)
Base salary(~ 30%)
Share-ownership guidelines
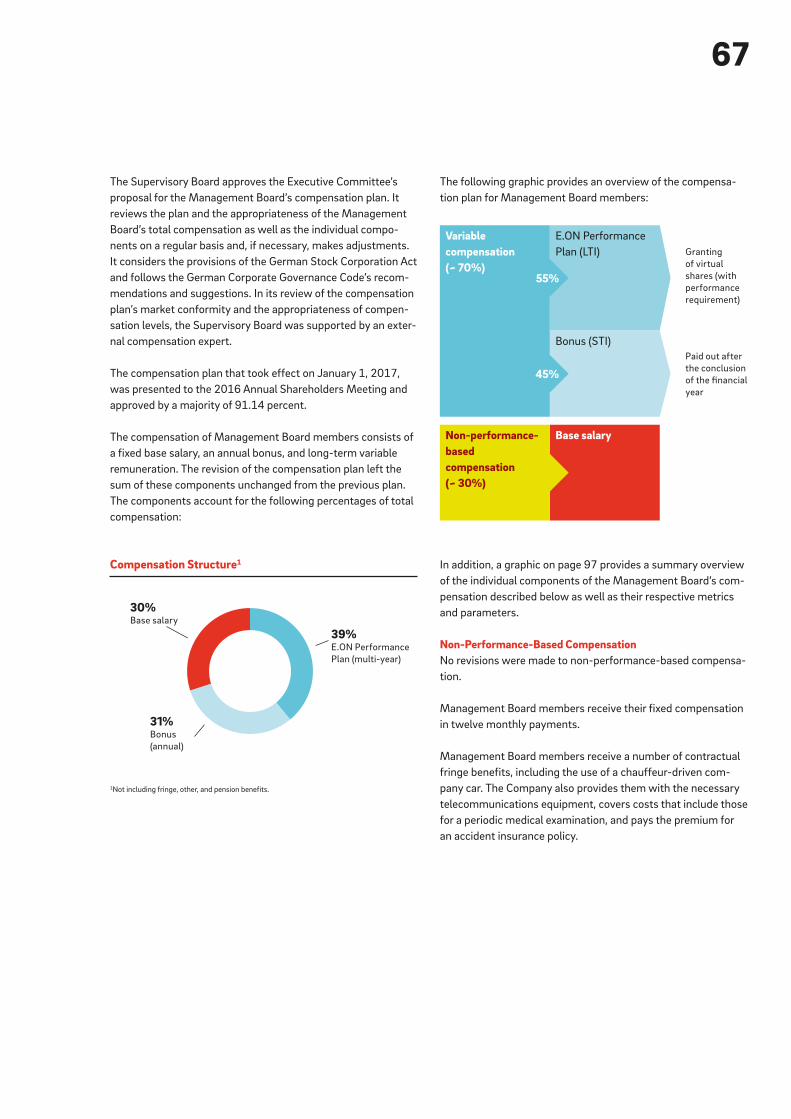
67
The Supervisory Board approves the Executive Committee’s
proposal for the Management Board’s compensation plan. It
reviews the plan and the appropriateness of the Management
Board’s total compensation as well as the individual compo-
nents on a regular basis and, if necessary, makes adjustments.
It considers the provisions of the German Stock Corporation Act
and follows the German Corporate Governance Code’s recom-
mendations and suggestions. In its review of the compensation
plan’s market conformity and the appropriateness of compen-
sation levels, the Supervisory Board was supported by an exter-
nal compensation expert.
The compensation plan that took effect on January 1, 2017,
was presented to the 2016 Annual Shareholders Meeting and
approved by a majority of 91.14 percent.
The compensation of Management Board members consists of
a fixed base salary, an annual bonus, and long-term variable
remuneration. The revision of the compensation plan left the
sum of these components unchanged from the previous plan.
The components account for the following percentages of total
compensation:
Compensation Structure1
1Not including fringe, other, and pension benefits.
30%Base salary
39%E.ON Performance
Plan (multi-year)
31%Bonus
(annual)
The following graphic provides an overview of the compensa-
tion plan for Management Board members:
In addition, a graphic on page 97 provides a summary overview
of the individual components of the Management Board’s com-
pensation described below as well as their respective metrics
and parameters.
Non-Performance-Based CompensationNo revisions were made to non-performance-based compensa-
tion.
Management Board members receive their fixed compensation
in twelve monthly payments.
Management Board members receive a number of contractual
fringe benefits, including the use of a chauffeur-driven com-
pany car. The Company also provides them with the necessary
telecommunications equipment, covers costs that include those
for a periodic medical examination, and pays the premium for
an accident insurance policy.
Variable compensation (~ 70%)
Non-performance-based compensation (~ 30%)
E.ON Performance
Plan (LTI)
Bonus (STI)
Granting
of virtual
shares (with
performance
requirement)
Paid out after
the conclusion
of the fi nancial
year
55%
45%
Base salary
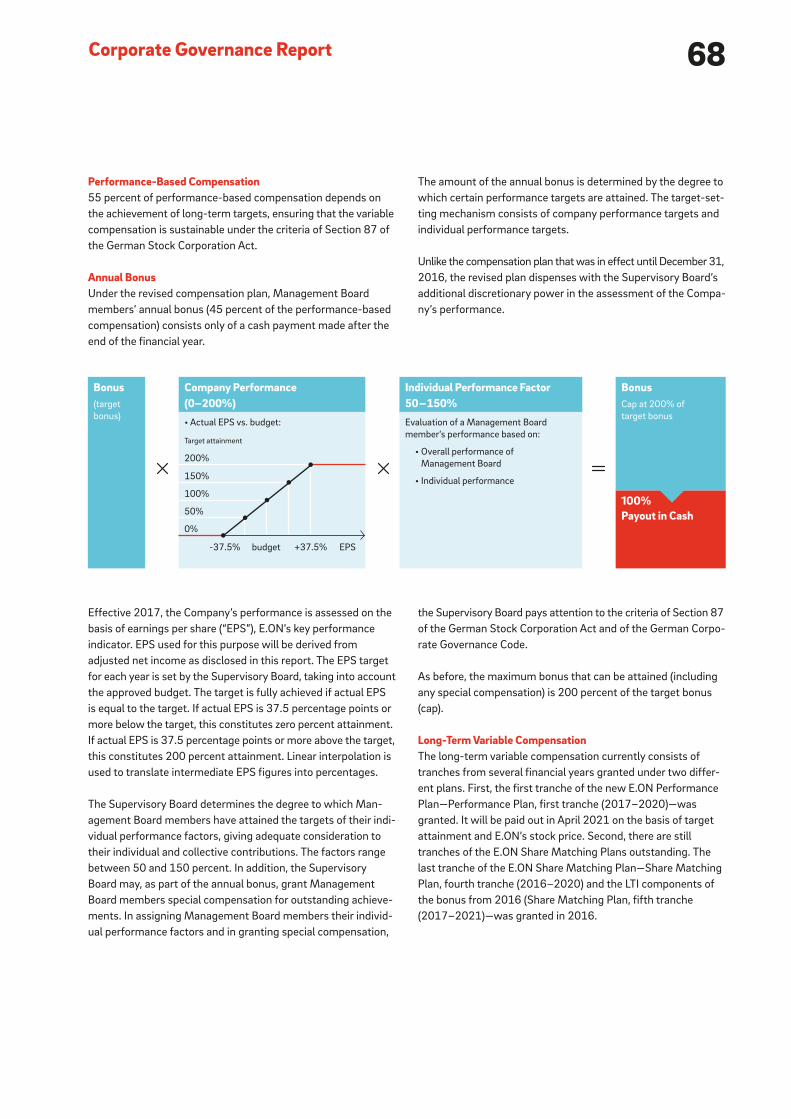
68Corporate Governance Report
Performance-Based Compensation55 percent of performance-based compensation depends on
the achievement of long-term targets, ensuring that the variable
compensation is sustainable under the criteria of Section 87 of
the German Stock Corporation Act.
Annual BonusUnder the revised compensation plan, Management Board
members’ annual bonus (45 percent of the performance-based
compensation) consists only of a cash payment made after the
end of the financial year.
Effective 2017, the Company’s performance is assessed on the
basis of earnings per share (“EPS”), E.ON’s key performance
indicator. EPS used for this purpose will be derived from
adjusted net income as disclosed in this report. The EPS target
for each year is set by the Supervisory Board, taking into account
the approved budget. The target is fully achieved if actual EPS
is equal to the target. If actual EPS is 37.5 percentage points or
more below the target, this constitutes zero percent attainment.
If actual EPS is 37.5 percentage points or more above the target,
this constitutes 200 percent attainment. Linear interpolation is
used to translate intermediate EPS figures into percentages.
The Supervisory Board determines the degree to which Man-
agement Board members have attained the targets of their indi-
vidual performance factors, giving adequate consideration to
their individual and collective contributions. The factors range
between 50 and 150 percent. In addition, the Supervisory
Board may, as part of the annual bonus, grant Management
Board members special compensation for outstanding achieve-
ments. In assigning Management Board members their individ-
ual performance factors and in granting special compensation,
the Supervisory Board pays attention to the criteria of Section 87
of the German Stock Corporation Act and of the German Corpo-
rate Governance Code.
As before, the maximum bonus that can be attained (including
any special compensation) is 200 percent of the target bonus
(cap).
Long-Term Variable Compensation The long-term variable compensation currently consists of
tranches from several financial years granted under two differ-
ent plans. First, the first tranche of the new E.ON Performance
Plan—Performance Plan, first tranche (2017–2020)—was
granted. It will be paid out in April 2021 on the basis of target
attainment and E.ON’s stock price. Second, there are still
tranches of the E.ON Share Matching Plans outstanding. The
last tranche of the E.ON Share Matching Plan—Share Matching
Plan, fourth tranche (2016–2020) and the LTI components of
the bonus from 2016 (Share Matching Plan, fifth tranche
(2017–2021)—was granted in 2016.
The amount of the annual bonus is determined by the degree to
which certain performance targets are attained. The target-set-
ting mechanism consists of company performance targets and
individual performance targets.
Unlike the compensation plan that was in effect until December 31,
2016, the revised plan dispenses with the Supervisory Board’s
additional discretionary power in the assessment of the Compa-
ny’s performance.
Company Performance (0–200%)• Actual EPS vs. budget:
Target attainment
200%
150%
100%
50%
0%
-37.5% budget +37.5% EPS
Bonus (target
bonus)
100%Payout in Cash
Bonus Cap at 200% of
target bonus
Individual Performance Factor50–150%Evaluation of a Management Board
member’s performance based on:
• Overall performance of
Management Board
• Individual performance

69
E.ON’s Performance Plan (Granted from 2017)Management Board members receive stock-based, long-term
variable compensation under the E.ON Performance Plan, which
replaced the E.ON Share Matching Plan as the Company’s new
long-term compensation plan effective January 1, 2017. Each
tranche of the E.ON Performance Plan has a vesting period of
four years to serve as a long-term incentive for sustainable
business performance. Vesting periods start on January 1.
The Supervisory Board grants virtual shares to each member of
the Management Board in the amount of the contractually
agreed-on target. The conversion into virtual shares is based on
the fair market value on the date when the shares are granted.
The fair market value is determined by applying methods
accepted in financial mathematics, taking into account the
expected future payout, and hence, the volatility and risk asso-
ciated with the E.ON Performance Plan. The number of granted
virtual shares may change in the course of the four-year vesting
period depending on the total shareholder return (“TSR”) of
E.ON stock compared with the TSR of the companies in a peer
group (“relative TSR”).
TSR is the yield of E.ON stock. It takes into account the stock
price, including the assumption that dividends are reinvested,
and is adjusted to exclude changes in capital. The peer group
used for relative TSR will be the other companies in E.ON’s peer
index, the STOXX® Europe 600 Utilities.
During a tranche’s vesting period, E.ON’s TSR performance is
measured once a year in comparison with the companies in the
peer group and set for that year. E.ON SE’s TSR performance in
a given year determines the final number of one fourth of the
virtual shares granted at the beginning of the vesting period.
For this purpose, the TSRs of all companies are ranked, and
E.ON SE’s relative position is determined based on the percen-
tile reached. If target attainment in a year is below the threshold
defined by the Supervisory Board at the time of granting, the
number of virtual shares granted is reduced by one quarter. If
E.ON’s performance is at the upper cap or above, the quarter of
virtual shares granted for that particular year increases to a
maximum of 150 percent. Linear interpolation is used to trans-
late intermediate figures into percentage.
The resulting number of virtual shares at the end of the vesting
period is multiplied by the average price of E.ON stock in the
final 60 days of the vesting period. This amount is increased by
the dividends distributed on E.ON stock during the vesting
period and then paid out. The sum of the payouts is capped at
200 percent of the contractually agreed-on target.
Initial Number of Granted Share Units
Share Price+Dividends
Payout Amount Cap at 200%
of target value
TSR Performance Relative to Peer Group
Lower threshold Target value Upper threshold
TSR of the E.ON share compared to the companies
of the STOXX® Europe 600 Utilities index (yearly lock-in)
Target achievement
200%
175%
150%
125%
100%
75%
50%
25%
0%
Percentile
achieved
by E.ON

70Corporate Governance Report
share that resulted from base matching. The arithmetical total
target value allocated at the start of the vesting period, which
began on April 1 of the year in which a tranche was allocated,
was therefore the sum of the value of the LTI component, base
matching, and performance matching (depending on the degree
of attainment of a predefined company performance target).
For the purpose of performance matching, the company perfor-
mance metric for tranches granted from 2013 to 2015 was ini-
tially E.ON’s average ROACE during the four-year vesting period
compared with a target ROACE set in advance by the Supervi-
sory Board for the entire four-year period at the time it allo-
cated a new tranche. Pursuant to a Supervisory Board resolu-
tion, from the 2016 financial year onward these performance
targets were based on ROCE. In view of the Uniper spinoff, this
adjustment was necessary because the ROACE targets were
based on old planning figures that did not foresee the Uniper
spinoff. Furthermore, from the start of 2016, the Company no
longer used ROACE as a key performance indicator and it was
therefore no longer available. In addition, the anticipated reduc-
tion in E.ON’s stock price resulting from the Uniper spinoff had
to be factored in by means of a conversion method.
Extraordinary events are not factored into the determination of
target attainment for company performance. Depending on the
degree of target attainment for the company performance met-
ric, each virtual share resulting from base matching may be
matched by up to two additional virtual shares at the end of the
vesting period. If the predetermined company performance tar-
get is fully attained, Management Board members receive one
additional virtual share for each virtual share resulting from
base matching. Linear interpolation is used to translate inter-
mediate figures.
At the end of the vesting period, the virtual shares held by Man-
agement Board members are assigned a cash value based on
E.ON’s average stock price during the final 60 days of the vest-
ing period. To each virtual share is then added the aggregate
per-share dividend paid out during the vesting period. This
total—cash value plus dividends—is then paid out. Payouts are
capped at 200 percent of the arithmetical total target value.
E.ON Share Matching Plan (Granted until 2016)Until the introduction of the new compensation plan on January 1,
2017, Management Board members received stock-based
compensation under the E.ON Share Matching Plan. At the
beginning of each financial year, the Supervisory Board decided,
based on the Executive Committee’s recommendation, on the
allocation of a new tranche, including the respective targets and
the number of virtual shares granted to individual members of
the Management Board. To serve as a long-term incentive for
sustainable business performance, each tranche had a vesting
period of four years. The tranche started on April 1 of each year.
Following the Supervisory Board’s decision to allocate a new
tranche, Management Board members initially received vested
virtual shares equivalent to the amount of the LTI component of
their bonus. The determination of the LTI component took into
consideration the overall target attainment of the old compen-
sation plan’s bonus for the preceding financial year. The number
of virtual shares was calculated on the basis of the amount of
their LTI component and E.ON’s average stock price during the
first 60 days prior to the four-year vesting period. Furthermore,
Management Board members could receive, on the basis of
annual Supervisory Board decisions, a base matching of addi-
tional non-vested virtual shares in addition to the virtual shares
that resulted from their LTI component. In addition, Manage-
ment Board members could, depending on the company’s per-
formance during the vesting period, receive performance
matching of up to two additional non-vested virtual shares per
ROCE4-year
average in %
PerformanceMatching
BaseMatching
Stock PriceplusDividends
Vesting period: 4 years
1/3: LTIcomponent
€

71
The last complete tranche of the E.ON Share Matching Plan
(LTI components of prior-year bonus as well as base and perfor-
mance matching) was granted in the 2016 financial year and
runs through 2020 (Share Matching Plan, fourth tranche
(2016–2020)). Because the old compensation plan was in effect
until year-end 2016, in 2017 Management Board members
were granted virtual shares based on the LTI components of
their bonuses for the 2016 financial year under the terms of the
E.ON Share Matching Plan. This tranche runs through 2021
(Share Matching Plan, fifth tranche (2017–2021)).
Overall CapIn line with the German Corporate Governance Code’s recommen-
dation, Management Board members’ annual compensation
has an overall cap. This means that the sum of the individual com-
pensation components in one year may not exceed 200 percent
of the total agreed target compensation, which consists of base
salary, target bonus, and the target allocation value of long-
term variable compensation. The cap increases in accordance
with the amounts of fringe benefits and pension benefits from
the respective financial year.
Share-Ownership GuidelinesTo further strengthen E.ON’s capital-market focus and share-
holder-oriented culture, E.ON introduced share-ownership
guidelines effective 2017. The guidelines obligate Management
Board members to invest in E.ON stock equaling 200 percent of
base compensation (for the Management Board Chairperson)
and 150 percent of base compensation (for the other Manage-
ment Board members), to demonstrate that they have done so,
and to hold the stock until the end of their service on the Man-
agement Board.
Until the required investment is reached, Management Board
members are obligated to invest amounts equivalent to the net
payouts from their long-term compensation in actual E.ON
stock.
Chairperson:200% of base compensation
Base compensation
Other Management Board members:150% of base compensation
Pension EntitlementsMembers appointed to the Management Board since 2010 are
enrolled in the “Contribution Plan E.ON Management Board,”
which is a contribution-based pension plan.
The Company makes virtual contributions to Management
Board members’ pension accounts in an amount equal to a per-
centage of their pensionable income (base salary and annual
bonus). In April 2016 the Supervisory Board passed a resolution
to increase the percentages of the virtual contributions under
the contribution-based plan starting in 2017 in order to offset
the reduction in the sum of base compensation and annual
bonus under the new compensation plan that took effect in
2017 and to leave the amount of contributions essentially
unchanged in absolute terms. Effective the 2017 financial year,
the contribution percentage is at most 21 percent (formerly
18 percent). The annual contribution consists of a fixed base
percentage (16 percent; formerly 14 percent) and a matching
contribution (5 percent; formerly 4 percent).
The requirement for the matching contribution to be granted is
that the Management Board member contributes, at a mini-
mum, the same amount by having it withheld from his compen-
sation. The company-funded matching contribution is sus-
pended if and as long as the E.ON Group’s ROACE is less than
its cost of capital for three years in a row. The contributions are
capitalized using actuarial principles (based on a standard
retirement age of 62) and placed in Management Board mem-
bers’ pension accounts. The interest rate used for each year is
based on the return of long-term German treasury notes. At the
age of 62 at the earliest, a Management Board member (or his
survivors) may choose to have the pension account balance
paid out as a lifelong pension, in installments, or in a lump sum.
Capital contributions
Pension account
Contribution-Based Plan
5 Term in years4321

72Corporate Governance Report
Settlement Payments for Termination of Management Board DutiesIn line with the German Corporate Governance Code’s recom-
mendation, the service agreements of Management Board
members include a settlement cap. Under the cap, settlement
payments in conjunction with a termination of Management
Board duties may not exceed the value of two years’ total com-
pensation or the total compensation for the remainder of the
member’s service agreement.
In the event of a premature loss of a Management Board posi-
tion due to a change of control, Management Board members
are entitled to settlement payments. The change-of-control
agreements stipulate that a change in control exists in three
cases: a third party acquires at least 30 percent of the Compa-
ny’s voting rights, thus triggering the automatic requirement to
make an offer for the Company pursuant to Germany’s Stock
Corporation Takeover Law; the Company, as a dependent entity,
concludes a corporate agreement; the Company is merged with
a non-affiliated company. Management Board members are
entitled to a settlement payment if, within 12 months of the
change of control, their service agreement is terminated by
mutual consent, expires, or is terminated by them (in the latter
case, however, only if their position on the Management Board
is materially affected by the change in control). Management
Board members’ settlement payment consists of their base sal-
ary and target bonus plus fringe benefits for two years. To
reflect discounting and setting off of payment for services ren-
dered to other companies or organizations, payments will be
reduced by 20 percent. In accordance with the German Corpo-
rate Governance Code, the settlement payments for Manage-
ment Board members would be equal to 100 percent of the
above-described settlement cap.
The service agreements of Management Board members
include a non-compete clause. For a period of six months after
the termination of their service agreement, Management Board
members are contractually prohibited from working directly or
indirectly for a company that competes directly or indirectly
with the Company or its affiliates. Management Board mem-
bers receive a compensation payment for the period of the
non-compete restriction. The prorated payment is based on
100 percent of their contractually stipulated annual target
compensation (without long-term variable compensation) but
is, at a minimum, 60 percent of their most recently received
compensation.
Individual Management Board members’ actual resulting pen-
sion entitlement cannot be calculated precisely in advance. It
depends on a number of uncertain parameters, in particular the
changes in their individual salary, their total years of service, the
attainment of company targets, and interest rates. For a Man-
agement Board member enrolled in the plan at the age of 50,
the company-financed, contribution-based pension payment is
currently estimated to be between 30 and 35 percent of his or
her base salary (without factoring in pension benefits accrued
prior to being appointed to the Management Board).
The Company has agreed to a pension plan based on final salary
for the Management Board member, Dr. Johannes Teyssen,
who was appointed to the Management Board before 2010.
Following the end of his service for the Company, Dr. Johannes
Teyssen is entitled to receive lifelong monthly pension pay-
ments in three cases: reaching the age of 60, permanent inca-
pacitation, and a so-called third pension situation. The criteria
for this situation are met if the termination or non-extension of
Dr. Johannes Teyssen’s service agreement is not due to his mis-
conduct or rejection of an offer of extension that is at least on a
par with his existing service agreement. In the third pension sit-
uation, Dr. Johannes Teyssen would receive an early pension as
a transitional arrangement until he reaches the age of 60.
Dr. Johannes Teyssen’s pension entitlements provide for annual
pension payments equal to 75 percent of his annual base sal-
ary. The full amount of any pension entitlements from earlier
employment is offset against these payments. In addition, the
pension plan includes benefits for widows and widowers and
for surviving children that are equal to 60 percent and 15 per-
cent, respectively, of the deceased Management Board mem-
ber’s pension entitlement. Together, pension payments to a
widow or widower and children may not exceed 100 percent of
the deceased Management Board member’s pension.
Pursuant to the provisions of the German Occupational Pensions
Improvement Act, Management Board members’ pension enti-
tlements are not vested until they have been in effect for five
years. This applies to both contribution-based and final-salary-
based pension plans.
In line with the German Corporate Governance Code’s recom-
mendation, the Supervisory Board reviews, on a regular basis,
the benefits level of Management Board members and the
resulting annual and long-term expense and, if necessary,
adjusts the payments.

73
Management Board Compensation in 2017 The Supervisory Board reviewed the Management Board’s
compensation plan and the components of individual members’
compensation. It determined that the Management Board’s
compensation is appropriate from both a horizontal and vertical
perspective and passed a resolution on the performance-based
compensation described below. It made its determination of
customariness from a horizontal perspective by comparing the
compensation with that of companies of a similar size. Its
review of appropriateness included a vertical comparison of the
Management Board’s compensation with that of the Company’s
top management and the rest of its workforce. In the Supervi-
sory Board’s view, in the 2017 financial year there was no rea-
son to adjust the Management Board’s compensation.
Performance-Based Compensation in 2017The annual bonuses of Management Board members for 2017
totaled €5.8 million (2016: €4.3 million). In determining the
performance factor, the Supervisory Board discussed and
assessed the Management Board’s overall performance.
Stock-based Compensation
€
Value of virtual shares
at time of granting
Number of virtual
shares granted
Cumulative
expense (+)/income (-)2
2017 20161 2017 2016 2017 2016
Dr. Johannes Teyssen 1,732,500 1,827,516 296,661 138,762 3,423,608 1,008,670
Dr.-Ing. Leonhard Birnbaum 1,008,333 1,063,643 172,660 80,762 1,860,899 580,199
Michael Sen (until March 31, 2017) – 300,000 3 – – 323,469 181,636
Dr. Marc Spieker (since January 1, 2017) 825,000 – 141,268 – 276,179 –
Dr. Karsten Wildberger 825,000 675,000 141,268 52,144 641,804 265,966
Total 4,390,833 3,866,159 751,857 271,668 6,525,959 2,036,471
1Consists of the LTI component (based on the target bonus) for the respective financial year for which at the time of granting no amount of shares can be determined.2Expense/income pursuant to IFRS 2 for performance rights and virtual shares existing in the 2017 financial year.3Target value for the virtual stock that was part of the LTI component of Mr. Sen’s 2016 bonus. No other stock was granted under base or performance matching due to his resignation in 2017.
The Supervisory Board issued the first tranche of the E.ON Per-
formance Plan (2017–2020) for the 2017 financial year and
granted Management Board members virtual shares of E.ON
stock. The present value assigned to the virtual shares of E.ON
stock at the time of granting—€5.84 per share—is shown in the
following tables entitled “Stock-based Compensation” and
“Total Compensation.” The value performance of this tranche
will be determined by the performance of E.ON stock, per-share
dividends, and E.ON stock’s TSR relative to the TSR of the com-
panies in its peer index, the STOXX® 600, for the years 2017
through 2020. The actual payments made to Management
Board members in 2021 may deviate, under certain circum-
stances considerably, from the calculated figures disclosed
here.
The long-term variable compensation of Management Board
members resulted in the following expenses in 2017:
Long-term variable compensation granted for the 2017 finan-
cial year totaled €4.4 million. Note 11 to the Consolidated
Financial Statements contains additional details about stock-
based compensation.

74Corporate Governance Report
is calculated pursuant to IFRS and the German Commercial Code.
An actuarial interest rate of 2.1 percent (prior year: 2.1 percent)
was used for discounting; the actuarial interest rate pursuant
to the German Commercial Code was 3.68 percent (prior year:
4.01 percent).
Management Board Pensions in 2017The following table provides an overview of the current pension
obligations to Management Board members, the additions to pro-
visions for pensions, and the cash value of pension obligations
for the 2017 financial year. The cash value of pension obligations
Pensions of Management Board Members Pursuant to the German Commercial Code
Current pension entitlement at December 31 Additions to provisions for pensions Cash value at December 31
As a percentage
of annual base
compensation (€) (€)
Thereof interest cost
(€) (€)
2017 2016 2017 2016 2017 2016 2017 2016 2017 2016
Dr. Johannes Teyssen 75 75 930,000 930,000 1,823,372 478,740 686,225 647,067 18,936,224 17,112,854
Dr.-Ing. Leonhard Birnbaum 1 – – – – 95,578 161,367 39,868 32,398 1,089,787 994,209
Michael Sen
(until March 31, 2017) 1, 3 – – – – – 249,034 – 6,039 – 404,266
Dr. Marc Spieker
(since January 1, 2017) 1, 2 – – – – 148,005 – 19,481 – 633,809 –
Dr. Karsten Wildberger 1 – – – – 188,871 226,291 9,074 – 415,162 226,291
1Contribution Plan E.ON Management Board.2Dr. Spieker joined the E.ON SE Management Board effective January 1, 2017, but had been employed by the Company prior to that. Due to his previous years of service, the cash value of his pension entitlement
was €485,804 at December 31, 2016.3Under the termination agreement concluded with Mr. Sen, the benefit amount shown here expires at the conclusion of March 31, 2017.
Pensions of Management Board Members Pursuant to IFRS
Current pension entitlement at December 31 Additions to provisions for pensions Cash value at December 31
As a percentage
of annual base
compensation (€) (€)
Thereof interest cost
(€) (€)
2017 2016 2017 2016 2017 2016 2017 2016 2017 2016
Dr. Johannes Teyssen 75 75 930,000 930,000 1,369,019 1,338,260 504,248 558,800 24,767,846 24,011,814
Dr.-Ing. Leonhard Birnbaum 1 – – – – 398,343 407,044 26,775 26,455 1,329,403 1,275,012
Michael Sen
(until March 31, 2017) 1, 3 – – – – – 275,898 – 4,909 – 523,074
Dr. Marc Spieker
(since January 1, 2017) 1, 2 – – – – 50,303 – 16,367 – 830,032 –
Dr. Karsten Wildberger 1 – – – – 356,636 292,555 6,144 – 518,162 292,555
1Contribution Plan E.ON Management Board.2Dr. Spieker joined the E.ON SE Management Board effective January 1, 2017, but had been employed by the Company prior to that. Due to his previous years of service, the cash value of his pension entitlement
was €779,388 at December 31, 2016.3Under the termination agreement concluded with Mr. Sen, the benefit amount shown here expires at the conclusion of March 31, 2017.
Pursuant to IFRS and the German Commercial Code, the cash
values of Management Board pensions for which provisions are
required increased slightly relative to year-end 2016. This
resulted in part from increases in the number of years of service.
In the case of the figures pursuant to the German Commercial
Code, another reason is that the actuarial interest rate E.ON
uses for discounting was significantly below the prior-year figure.

75
Total Compensation of the Management Board
€
Fixed annual
compensation Bonus Other compensation
Value of stock-based
compensation granted1 Total
2017 2016 2017 2016 2017 2016 2017 2016 2017 2016
Dr. Johannes Teyssen 1,240,000 1,240,000 2,296,350 1,638,000 40,845 42,409 1,732,500 1,827,516 5,309,695 4,747,925
Dr.-Ing. Leonhard Birnbaum 800,000 800,000 1,336,500 953,333 27,117 25,138 1,008,333 1,063,643 3,171,950 2,842,114
Michael Sen
(until March 31, 2017) 175,000 700,000 – 780,000 17,100 181,065 – 300,000 192,100 1,961,065
Dr. Marc Spieker
(since January 1, 2017) 700,000 – 1,093,500 – 35,695 – 825,000 – 2,654,195 –
Dr. Karsten Wildberger 700,000 525,000 1,093,500 585,000 67,346 1,442,153 825,000 675,000 2,685,846 3,227,153
Total 3,615,000 3,265,000 5,819,850 3,956,333 188,103 1,690,765 4,390,833 3,866,159 14,013,786 12,778,257
1The present value assigned to the virtual shares of E.ON stock at the time of granting for the fourth tranche of the E.ON Share Matching Plan was €5.84 per share.
Total Compensation in 2017The total compensation of the members of the Management
Board in the 2017 financial year amounted to €14.0 million,
about 1.5 percent above the prior-year figure of €13.8 million
based on the Management Board’s total compensation dis-
closed in the 2016 Annual Report.
Under a termination agreement concluded in December 2016,
Mr. Sen’s service agreement ended by mutual consent effective
March 31, 2017, without payment of contractual claims for the
remaining period of his agreement, because Mr. Sen ended his
service on the E.ON SE Management Board on this date at his
own request. Because Mr. Sen did not reach the five-year vesting
period, he forfeited the company-funded entitlement to a com-
pany pension. He also forfeited the virtual stock granted to him
in 2015 and 2016 as part of the E.ON Share Matching Plans
with the exception of the virtual stock included in the LTI com-
ponent of his 2015 and 2016 bonuses. The latter will continue
until the normal end of the vesting period of their respective
tranches. No bonus and no tranche under the E.ON Performance
Plan were granted. The non-compete clause was waived with-
out compensation.
The individual members of the Management Board had the
following total compensation:
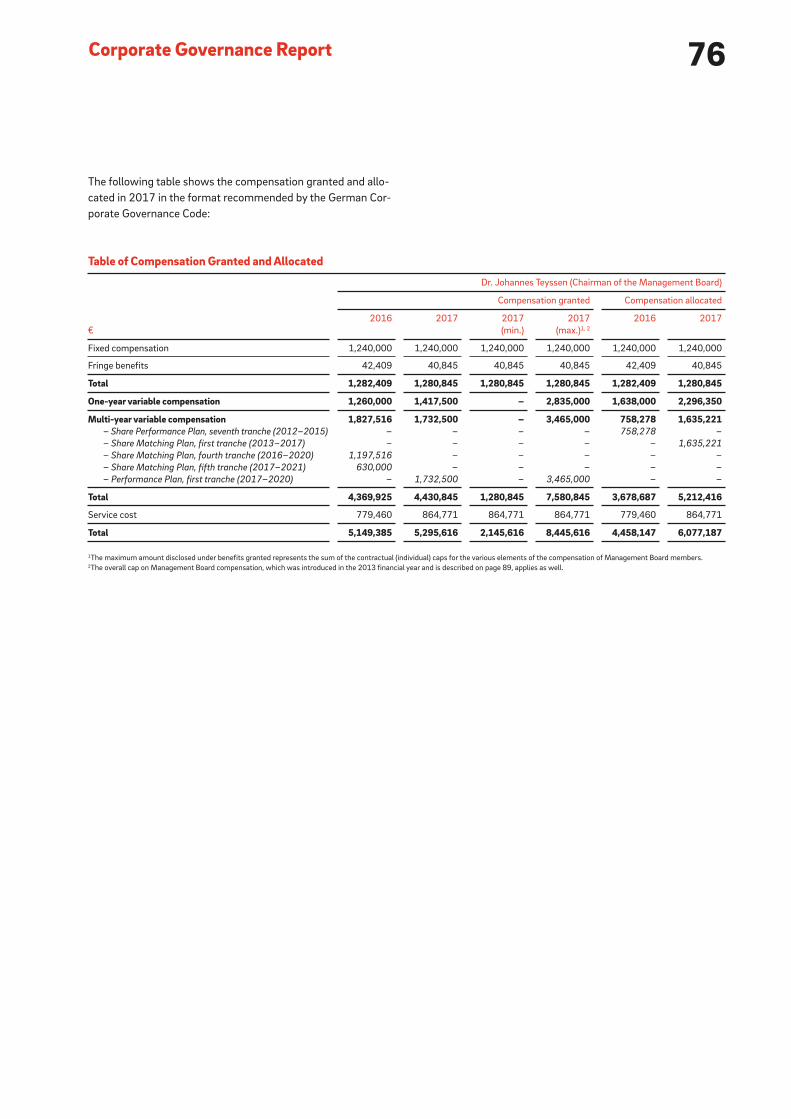
76Corporate Governance Report
The following table shows the compensation granted and allo-
cated in 2017 in the format recommended by the German Cor-
porate Governance Code:
Table of Compensation Granted and Allocated
€
Dr. Johannes Teyssen (Chairman of the Management Board)
Compensation granted Compensation allocated
2016 2017 2017
(min.)
2017
(max.)1, 2
2016 2017
Fixed compensation 1,240,000 1,240,000 1,240,000 1,240,000 1,240,000 1,240,000
Fringe benefits 42,409 40,845 40,845 40,845 42,409 40,845
Total 1,282,409 1,280,845 1,280,845 1,280,845 1,282,409 1,280,845
One-year variable compensation 1,260,000 1,417,500 – 2,835,000 1,638,000 2,296,350
Multi-year variable compensation 1,827,516 1,732,500 – 3,465,000 758,278 1,635,221 – Share Performance Plan, seventh tranche (2012–2015) – – – – 758,278 –
– Share Matching Plan, first tranche (2013–2017) – – – – – 1,635,221
– Share Matching Plan, fourth tranche (2016–2020) 1,197,516 – – – – –
– Share Matching Plan, fifth tranche (2017–2021) 630,000 – – – – –
– Performance Plan, first tranche (2017–2020) – 1,732,500 – 3,465,000 – –
Total 4,369,925 4,430,845 1,280,845 7,580,845 3,678,687 5,212,416
Service cost 779,460 864,771 864,771 864,771 779,460 864,771
Total 5,149,385 5,295,616 2,145,616 8,445,616 4,458,147 6,077,187
1The maximum amount disclosed under benefits granted represents the sum of the contractual (individual) caps for the various elements of the compensation of Management Board members.2The overall cap on Management Board compensation, which was introduced in the 2013 financial year and is described on page 89, applies as well.
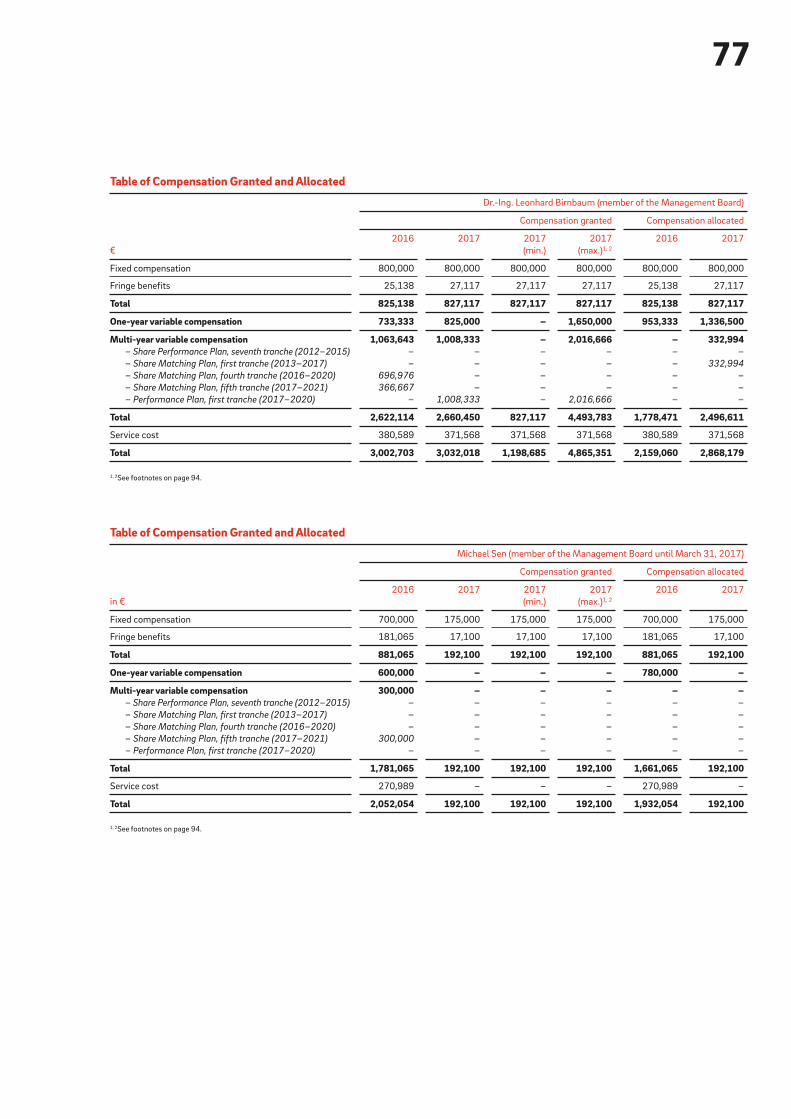
77
Table of Compensation Granted and Allocated
€
Dr.-Ing. Leonhard Birnbaum (member of the Management Board)
Compensation granted Compensation allocated
2016 2017 2017
(min.)
2017
(max.)1, 2
2016 2017
Fixed compensation 800,000 800,000 800,000 800,000 800,000 800,000
Fringe benefits 25,138 27,117 27,117 27,117 25,138 27,117
Total 825,138 827,117 827,117 827,117 825,138 827,117
One-year variable compensation 733,333 825,000 – 1,650,000 953,333 1,336,500
Multi-year variable compensation 1,063,643 1,008,333 – 2,016,666 – 332,994 – Share Performance Plan, seventh tranche (2012–2015) – – – – – –
– Share Matching Plan, first tranche (2013–2017) – – – – – 332,994
– Share Matching Plan, fourth tranche (2016–2020) 696,976 – – – – –
– Share Matching Plan, fifth tranche (2017–2021) 366,667 – – – – –
– Performance Plan, first tranche (2017–2020) – 1,008,333 – 2,016,666 – –
Total 2,622,114 2,660,450 827,117 4,493,783 1,778,471 2,496,611
Service cost 380,589 371,568 371,568 371,568 380,589 371,568
Total 3,002,703 3,032,018 1,198,685 4,865,351 2,159,060 2,868,179
1, 2See footnotes on page 94.
Table of Compensation Granted and Allocated
in €
Michael Sen (member of the Management Board until March 31, 2017)
Compensation granted Compensation allocated
2016 2017 2017
(min.)
2017
(max.)1, 2
2016 2017
Fixed compensation 700,000 175,000 175,000 175,000 700,000 175,000
Fringe benefits 181,065 17,100 17,100 17,100 181,065 17,100
Total 881,065 192,100 192,100 192,100 881,065 192,100
One-year variable compensation 600,000 – – – 780,000 –
Multi-year variable compensation 300,000 – – – – – – Share Performance Plan, seventh tranche (2012–2015) – – – – – –
– Share Matching Plan, first tranche (2013–2017) – – – – – –
– Share Matching Plan, fourth tranche (2016–2020) – – – – – –
– Share Matching Plan, fifth tranche (2017–2021) 300,000 – – – – –
– Performance Plan, first tranche (2017–2020) – – – – – –
Total 1,781,065 192,100 192,100 192,100 1,661,065 192,100
Service cost 270,989 – – – 270,989 –
Total 2,052,054 192,100 192,100 192,100 1,932,054 192,100
1, 2See footnotes on page 94.

78Corporate Governance Report
Table of Compensation Granted and Allocated
€
Dr. Marc Spieker (member of the Management Board since January 1, 2017)
Compensation granted Compensation allocated
2016 2017 2017
(min.)
2017
(max.)1, 2
2016 2017
Fixed compensation – 700,000 700,000 700,000 – 700,000
Fringe benefits – 35,695 35,695 35,695 – 35,695
Total – 735,695 735,695 735,695 – 735,695
One-year variable compensation – 675,000 – 1,350,000 – 1,093,500
Multi-year variable compensation – 825,000 – 1,650,000 – – – Share Performance Plan, seventh tranche (2012–2015) – – – – – –
– Share Matching Plan, first tranche (2013–2017) – – – – – –
– Share Matching Plan, fourth tranche (2016–2020) – – – – – –
– Share Matching Plan, fifth tranche (2017–2021) – – – – – –
– Performance Plan, first tranche (2017–2020) – 825,000 – 1,650,000 – –
Total – 2,235,695 735,695 3,735,695 – 1,829,195
Service cost – 33,936 33,936 33,936 – 33,936
Total – 2,269,631 769,631 3,769,631 – 1,863,131
1, 2See footnotes on page 94.
Table of Compensation Granted and Allocated
€
Dr. Karsten Wildberger (member of the Management Board)
Compensation granted Compensation allocated
2016 2017 2017
(min.)
2017
(max.)1, 2
2016 2017
Fixed compensation 525,000 700,000 700,000 700,000 525,000 700,000
Fringe benefits 1,442,153 67,346 67,346 67,346 1,442,153 67,346
Total 1,967,153 767,346 767,346 767,346 1,967,153 767,346
One-year variable compensation 450,000 675,000 – 1,350,000 585,000 1,093,500
Multi-year variable compensation 675,000 825,000 – 1,650,000 – –– Share Performance Plan, seventh tranche (2012–2015) – – – – – –
– Share Matching Plan, first tranche (2013–2017) – – – – – –
– Share Matching Plan, fourth tranche (2016–2020) 450,000 – – – – –
– Share Matching Plan, fifth tranche (2017–2021) 225,000 – – – – –
– Performance Plan, first tranche (2017–2020) – 825,000 – 1,650,000 – –
Total 3,092,153 2,267,346 767,346 3,767,346 2,552,153 1,860,846
Service cost 292,555 350,492 350,492 350,492 292,555 350,492
Total 3,384,708 2,617,838 1,117,838 4,117,838 2,844,708 2,211,338
1, 2See footnotes on page 94.
As in the prior year, E.ON SE and its subsidiaries granted no
loans to, made no advance payments to, nor entered into any
contingencies of behalf of the members of the Management
Board in the 2017 financial year. Page 224 contains additional
information about the members of the Management Board.
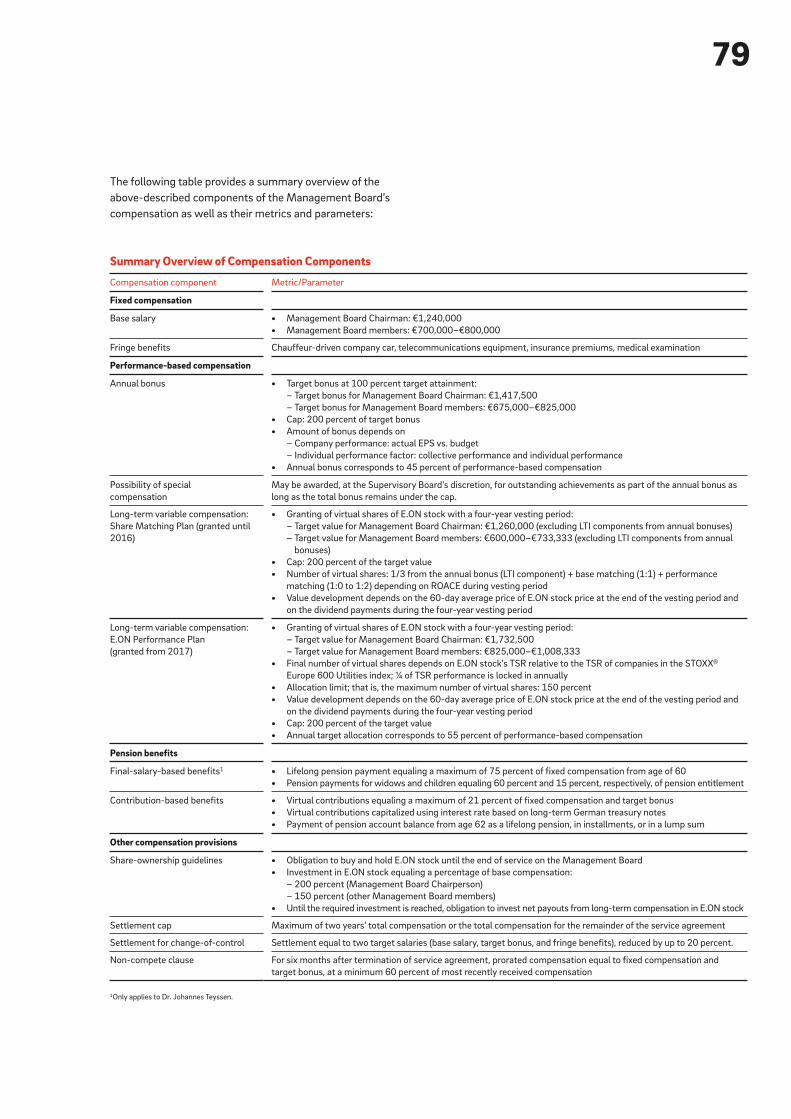
79
The following table provides a summary overview of the
above-described components of the Management Board’s
compensation as well as their metrics and parameters:
Summary Overview of Compensation Components
Compensation component Metric/Parameter
Fixed compensation
Base salary • Management Board Chairman: €1,240,000
• Management Board members: €700,000–€800,000
Fringe benefits Chauffeur-driven company car, telecommunications equipment, insurance premiums, medical examination
Performance-based compensation
Annual bonus • Target bonus at 100 percent target attainment:
– Target bonus for Management Board Chairman: €1,417,500
– Target bonus for Management Board members: €675,000–€825,000
• Cap: 200 percent of target bonus
• Amount of bonus depends on
– Company performance: actual EPS vs. budget
– Individual performance factor: collective performance and individual performance
• Annual bonus corresponds to 45 percent of performance-based compensation
Possibility of special
compensation
May be awarded, at the Supervisory Board’s discretion, for outstanding achievements as part of the annual bonus as
long as the total bonus remains under the cap.
Long-term variable compensation:
Share Matching Plan (granted until
2016)
• Granting of virtual shares of E.ON stock with a four-year vesting period:
– Target value for Management Board Chairman: €1,260,000 (excluding LTI components from annual bonuses)
– Target value for Management Board members: €600,000–€733,333 (excluding LTI components from annual
bonuses)
• Cap: 200 percent of the target value
• Number of virtual shares: 1/3 from the annual bonus (LTI component) + base matching (1:1) + performance
matching (1:0 to 1:2) depending on ROACE during vesting period
• Value development depends on the 60-day average price of E.ON stock price at the end of the vesting period and
on the dividend payments during the four-year vesting period
Long-term variable compensation:
E.ON Performance Plan
(granted from 2017)
• Granting of virtual shares of E.ON stock with a four-year vesting period:
– Target value for Management Board Chairman: €1,732,500
– Target value for Management Board members: €825,000–€1,008,333
• Final number of virtual shares depends on E.ON stock’s TSR relative to the TSR of companies in the STOXX®
Europe 600 Utilities index; ¼ of TSR performance is locked in annually
• Allocation limit; that is, the maximum number of virtual shares: 150 percent
• Value development depends on the 60-day average price of E.ON stock price at the end of the vesting period and
on the dividend payments during the four-year vesting period
• Cap: 200 percent of the target value
• Annual target allocation corresponds to 55 percent of performance-based compensation
Pension benefits
Final-salary-based benefits1 • Lifelong pension payment equaling a maximum of 75 percent of fixed compensation from age of 60
• Pension payments for widows and children equaling 60 percent and 15 percent, respectively, of pension entitlement
Contribution-based benefits • Virtual contributions equaling a maximum of 21 percent of fixed compensation and target bonus
• Virtual contributions capitalized using interest rate based on long-term German treasury notes
• Payment of pension account balance from age 62 as a lifelong pension, in installments, or in a lump sum
Other compensation provisions
Share-ownership guidelines • Obligation to buy and hold E.ON stock until the end of service on the Management Board
• Investment in E.ON stock equaling a percentage of base compensation:
– 200 percent (Management Board Chairperson)
– 150 percent (other Management Board members)
• Until the required investment is reached, obligation to invest net payouts from long-term compensation in E.ON stock
Settlement cap Maximum of two years’ total compensation or the total compensation for the remainder of the service agreement
Settlement for change-of-control Settlement equal to two target salaries (base salary, target bonus, and fringe benefits), reduced by up to 20 percent.
Non-compete clause For six months after termination of service agreement, prorated compensation equal to fixed compensation and
target bonus, at a minimum 60 percent of most recently received compensation
1Only applies to Dr. Johannes Teyssen.
80Corporate Governance Report
The Chairman of the Supervisory Board receives fixed compen-
sation of €440,000; the Deputy Chairmen, €320,000. The
other members of the Supervisory Board receive compensation
of €140,000. The Chairman of the Audit and Risk Committee
receives an additional €180,000; the members of the Audit and
Risk Committee, an additional €110,000. Other committee
chairmen receive an additional €140,000; committee mem-
bers, an additional €70,000. Members serving on more than
one committee receive the highest applicable committee com-
pensation only. In contradistinction to the compensation just
described, the Chairman and the Deputy Chairmen of the
Supervisory Board receive no additional compensation for their
committee duties. In addition, Supervisory Board members are
paid an attendance fee of €1,000 per day for meetings of the
Supervisory Board or its committees. Individuals who were
members of the Supervisory Board or any of its committees for
less than an entire financial year receive pro rata compensation.
Payments Made to Former Members of the Management BoardTotal payments made to former Management Board members
and to their beneficiaries amounted to €12.4 million in 2017
(prior year: €11.6 million). Provisions of €159.0 million (prior
year: €172.8 million)—pursuant to IFRS—have been provided
for pension obligations to former Management Board members
and their beneficiaries.
Compensation Plan for the Supervisory BoardThe compensation of Supervisory Board members is deter-
mined by the Annual Shareholders Meeting and governed by
Section 15 of the Company’s Articles of Association. The pur-
pose of the compensation plan is to enhance the Supervisory
Board’s independence for its oversight role. Furthermore, there
are a number of duties that Supervisory Board members must
perform irrespective of the Company’s financial performance.
Supervisory Board members—in addition to being reimbursed
for their expenses—therefore receive fixed compensation and
compensation for committee duties.

81
Supervisory Board Compensation in 2017 The total compensation of the members of the Supervisory Board
amounted to €4.5 million (prior year: €3.6 million pursuant to
the total compensation of the Supervisory Board reported in the
2016 Annual Report). As in the prior year, no loans were out-
standing or granted to Supervisory Board members in the 2017
financial year.
OtherThe Company has taken out D&O insurance for Management
Board and Supervisory Board members. In accordance with
the German Stock Corporation Act and the German Corporate
Governance Code’s recommendation, this insurance includes
a deductible of 10 percent of the respective damage claim for
Management Board and Supervisory Board members. The
deductible has a maximum cumulative annual cap of 150 percent
of a member’s annual fixed compensation.
Supervisory Board Compensation
€
Supervisory Board
compensation
Compensation for
committee duties Attendance fees
Supervisory Board
compensation from
affiliated companies Total
2017 2016 2017 2016 2017 2016 2017 2016 2017 2016
Dr. Karl-Ludwig Kley 440,000 256,667 – – 13,000 7,000 – – 453,000 263,667
Prof. Dr. Ulrich Lehner 320,000 320,000 – – 12,000 10,000 – – 332,000 330,000
Andreas Scheidt 320,000 320,000 – – 13,000 10,000 170,853 – 503,853 330,000
Clive Broutta 140,000 140,000 70,000 70,000 8,000 8,000 – – 218,000 218,000
Erich Clementi 140,000 70,000 – – 7,000 2,000 – – 147,000 72,000
Tibor Gila 140,000 70,000 – – 6,000 2,000 – 2,705 146,000 74,705
Thies Hansen 140,000 140,000 110,000 110,000 10,000 10,000 17,700 17,700 277,700 277,700
Carolina Dybeck Happe 140,000 81,667 52,500 – 10,000 2,000 – – 202,500 83,667
Baroness
Denise Kingsmill CBE 140,000 140,000 – – 3,000 6,000 – – 143,000 146,000
Eugen-Gheorghe Luha 140,000 140,000 70,000 70,000 10,000 8,000 13,114 13,483 233,114 231,483
Andreas Schmitz 140,000 70,000 82,500 – 9,000 3,000 – – 231,500 73,000
Fred Schulz 140,000 140,000 110,000 110,000 15,000 13,000 22,243 13,500 287,243 276,500
Silvia Šmátralová 140,000 70,000 – – 6,000 2,000 24,367 32,452 170,367 104,452
Dr. Karen de Segundo 140,000 140,000 122,500 70,000 11,000 8,000 – – 273,500 218,000
Dr. Theo Siegert 140,000 140,000 180,000 180,000 11,000 10,000 – – 331,000 330,000
Elisabeth Wallbaum 140,000 140,000 – – 6,000 6,000 – – 146,000 146,000
Ewald Woste 140,000 70,000 52,500 – 10,000 2,000 8,000 – 210,500 72,000
Albert Zettl 140,000 70,000 52,500 – 11,000 2,000 20,000 20,000 223,500 92,000
Total 3,180,000 2,518,333 902,500 610,000 171,000 111,000 276,277 99,841 4,529,777 3,339,174

Business Report

Financial Statements of E.ON SE

84Financial Statements of E.ON SE
Balance Sheet of E.ON SE
€ in millions Note
December 31
2017 2017 2016 2016
Intangible assets (1) 0.1 –
Property, plant and equipment (1) 11.5 14.1
Financial assets
Shares in affiliated companies (2) 35,394.8 35,394.7
Other financial assets (3) 1,963.4 1,973.3
Fixed assets (4) 37,369.8 37,382.1
Receivables and other assets
Receivables from affiliated companies (5) 7,697.2 8,089.3
Receivables from companies in which an interest is held (6) – 9.3
Other assets (7) 335.9 636.6
Securities (8) 1,013.3 1,087.3
Liquid funds (9) 2,024.8 4,664.2
Current assets 11,071.2 14,486.7
Accrued expenses (10) 36.4 30.5
Asset surplus after offsetting of benefit obligations (11) 0.5 15.0
Total assets 48,477.9 51,914.3
Capital stock (12) 2,201.1 2,001.0
Accounting value of treasury shares -33.9 -48.6
Issued capital 2,167.2 1,952.4
Additional paid-in capital (13) 3,657.1 2,508.6
Retained earnings (14) 1,884.2 471.8
Net income available for distribution (15) 1,320.3 452.0
Stockholders’ equity (16) 9,028.8 5,384.8
Provisions for pensions 312.3 300.1
Right of recourse (“Freistellungsanspruch”) -301.6 -300.1
(17) 10.7 –
Provisions for taxes (18) 1,067.0 1,320.4
Other provisions (19) 1,049.7 1,258.0
Provisions 2,127.4 2,578.4
Bonds 2,000.0 –
Bank loans 665.4 776.4
Liabilities to affiliated companies 34,349.6 43,101.8
Liabilities to companies in which an interest is held 5.4 4.1
Miscellaneous liabilities 299.7 64.2
Liabilities (20) 37,320.1 43,946.5
Deferred income 1.6 4.6
Total stockholders’ equity and liabilities 48,477.9 51,914.3

85
Income Statement of E.ON SE
€ in millions Note
January 1 to December 31
2017 2016
Income from equity investments (21) 4,676.4 2,133.8
Interest income (net) (22) -1,367.5 -545.5
Revenues (23) 53.6 43.8
Other operating income (24) 2,395.4 3,798.3
Cost of materials (25) -14.8 -7.8
Personnel expenses (26) -162.9 -146.4
Depreciation of property, plant and equipment -0.7 -0.7
Other operating expenses (27) -2,767.6 -4,238.7
Income taxes (28) -156.3 -163.4
After-tax results 2,655.6 873.4
Other taxes -15.3 3.1
Net income/net loss 2,640.3 876.5
Profit carryforward from the prior year¹ (15) 0.0 –
Withdrawal from additional paid-in capital (13) – 3,357.1
Withdrawals from retained earnings (14) – 3,611.5
Decrease in assets as a result of the spinoff – -6,968.6
Net income transferred to retained earnings (14) -1,320.0 -424.5
Net income available for distribution (15) 1,320.3 452.0
1Profit carryforward from fiscal year 2016 in the amount of €210.

86Notes
Commercial Code (EGHGB), was exercised and the declining-
balance method continues to be applied. Additions to property,
plant and equipment from the 2010 fiscal year forward are
depreciated over their average useful lives using exclusively the
straight-line method. Movable fixed assets are depreciated pro
rata temporis.
Average useful life assumptions are as follows:
Low-value assets with costs of up to €150 are expensed in full
in the year of acquisition. A collective item is created for assets
whose cost of acquisition is more than €150 and less than
€1,000. One fifth of the respective collective item is written
down and recognized in income in the year it is created and in
each of the subsequent four fiscal years.
Impairments are recognized in the event of a technical or eco-
nomic impairment. Impairments are reversed if the reasons for
the impairments no longer apply.
Shares in affiliated companies, equity interests and non-current
securities are generally accounted for at cost or at their fair
value, if lower. Acquisitions and mergers are recognized at book
values or fair values. Interest-bearing loans are carried at their
nominal values; long-term interest-free and low-interest loans
and receivables are carried at present value. If the carrying
amount of financial assets measured in accordance with these
principles exceeds their fair value at the balance sheet date,
impairments are recognized if the impairment is expected to be
permanent. If the reason for the impairment no longer applies,
the impairment is reversed.
Useful Lives of Property, Plant and Equipment
Intangible assets 3 years
Buildings 7 to 33 years
Technical equipment and machinery 10 to 20 years
Other equipment, fixtures and office equipment 3 to 20 years
Notes to the Financial Statements of E.ON SE
Basis of Presentation
With its entry in the commercial register on June 9, 2017,
E.ON SE moved its registered office from Düsseldorf to Essen
and is now registered at Essen District Court under number
HRB 28196. The resolution on the Company’s registered office
in accordance with the Articles of Association was adopted
by the Annual General Meeting on May 10, 2017. Section 1(1)
sentence 2 of the Company’s Articles of Association was
amended accordingly.
The annual financial statements have been prepared in accor-
dance with the provisions of the German Commercial Code
(“HGB”) and the Directive on the status of the European Com-
pany (SE) in conjunction with the German Stock Corporation
Act (“AktG”), and the German Energy Industry Act (“EnWG”).
E.ON SE is a large corporation as defined in Section 267 (3) HGB.
Individual balance sheet and income statement items have been
combined in order to improve the clarity of the presentation, in
accordance with Section 265 (7) no. 2, HGB. These items are
stated and explained separately in these Notes. The income
statement is prepared using the nature-of-expense method. The
structure of the income statement has been changed to improve
the clarity of the presentation in accordance with Section 265 (6)
HGB. In order to highlight the character of E.ON SE as a holding
company, derogations from the classification scheme pursuant
to Section 275 (2) HGB have been made in that the combined
items of income from equity investments and interest income
have been placed ahead of the remaining items.
The annual financial statements are prepared in euro (€) and
amounts are stated in millions of euro. Rounded-off amounts of
less than €0.1 million will be stated at €0.0 million and zero
values at €– million.
Accounting and Disclosure Policies
Intangible assets acquired against payment recognized within
non-current assets and property, plant and equipment are valued
at acquisition or production cost, less scheduled depreciation.
Unless otherwise specified, the useful lives applied correspond
to the average useful lives. For property, plant and equipment
that existed before January 1, 2010, and was depreciated using
the declining-balance method, the retention option pursuant to
Article 67 (4), sentence 1, of the Introductory Act to the German

87
The values of receivables and other assets are adjusted to
account for identifiable individual risks. Receivables are recognized
at their nominal values less appropriate valuation allowances
for potential default risks (lower fair value). Current securities
are accounted for at cost or at the lower of their market price or
redemption value.
Occupational retirement benefit obligations toward employees
and semiretirement pension credits and long-term working-time
accounts are covered by corresponding funds invested in fund
units and fixed-term deposits or liquid funds; in addition, there
are claims arising from assets pledged to beneficiaries (2016:
from reinsured pension obligations) against Versorgungskasse
Energie VVaG i.L. (“VKE”), Hanover, Germany. The fund units
are administered in trust for E.ON SE by E.ON Pension Trust e.V.
(2016: by E.ON Pension Trust e.V. and Pensionsabwicklungs-
trust e.V., both registered in Düsseldorf, Germany), and the
fixed-term deposits covering the semiretirement pension credits
by Energie-Sicherungstreuhand e.V., Hanover, Germany. The
assets concerned are designated exclusively for the fulfillment
of pension obligations and are shielded from all other creditors.
In fiscal year 2017, a resolution was passed by the members of
VKE to dissolve VKE at the end of December 30, 2017, and to
terminate the (reinsurance) insurance relationships accordingly
as of that date. The insurance assets will be transferred to a fol-
low-on solution in 2018. This does not change the classification
of the claim of the member company against VKE in respect
of the guarantee fund assets. The claim against VKE represents
a claim pledged to the beneficiaries.
Under the terms of the merger agreement dated July 10, 2017,
E.ON Pension Trust e.V., Düsseldorf, was merged with Pensions-
abwicklungstrust e.V., Düsseldorf, by registration in the com-
mercial register on July 24, 2017, and renamed E.ON Pension
Trust e.V. in November 2017, with the transfer of its registered
office to Essen.
Guarantee fund assets are measured at fair value. They are off-
set against the respective underlying obligations pursuant to
Section 246 (2) HGB. The associated expense and income from
interest effects and from the assets to be offset is treated in a
similar manner. The resulting accumulated benefit obligation is
recognized under provisions. Any surplus in the fair value of the
guarantee fund assets over the benefit obligations is recognized
in a separate line on the balance sheet called “Asset surplus
after offsetting of benefit obligations.”
Liquid funds are measured at fair value. Cash, current bank
accounts and contingencies denominated in foreign currency
are translated at the exchange rates applicable on the balance
sheet date. Pursuant to Section 256a HGB, assets and liabilities
denominated in foreign currency and having a residual term of
one year or less are translated at the mid-market spot rate
applicable on the balance sheet date. Other foreign- currency
items are measured at the rate applicable on the date of the
business transaction, except that the rate on the balance sheet
date is used if it produces a lower valuation. If hedged items are
aggregated with hedges to form closed positions, the hedged
rate is used for the valuation.
Amounts paid during the fiscal year for expenses incurred after
the balance sheet date are recognized on the assets side as pre-
paid expenses. The option to capitalize loan discounts pursuant
to Section 250 (3) HGB was exercised. Liabilities are amortized
over their terms according to schedule.
Derivative financial instruments are used to hedge against
interest and currency risks arising from booked, open and
planned underlying transactions. Booked and open underlying
transactions are aggregated with their associated hedges in
portfolios that are separated by currency and interest hedging
instrument for each currency (macro-hedges). Transactions
contained in a portfolio are valued separately at the balance
sheet date. The following valuation methods and assumptions
are used to determine market values:
• Foreign exchange forwards and swaps are valued at the
forward rate on the balance sheet date.
• Depending on their structure, currency options are measured
using either the Black-Scholes model or binomial models.
• Instruments used to hedge interest risks are measured by
discounting future cash flows using market interest rates
over the remaining terms of the instruments. Interest rate
swap amounts are recognized in the income statement on
the date of payment or accrual on the balance sheet date.

88Notes
With effect from December 31, 2006, MEON Pensions GmbH
& Co. KG, Grünwald, (MEON) entered into an agreement for the
assumption of a collateral promise towards active employees
and their beneficiaries, together with the assumption of benefit
obligations towards the company (co-assumption of liability).
MEON has indemnified the Company internally against liability
for the benefit obligations specified in the agreement. In return
for this right of recourse, the Company transferred assets of
equivalent value to MEON. The indemnity claim is measured in
the same manner as the underlying benefit obligation.
The indemnity claim is openly netted against the pension provi-
sions.
In 2014, E.ON SE implemented a contractual trust arrangement
(CTA) to hedge its pension obligations. To this end, E.ON SE
entered into a trust agreement and transferred guarantee fund
assets to the trustee. E.ON SE remains the immediate obligor
under the pension commitments. No payments were made into
the CTA in 2017.
Provisions for taxes and other provisions take into account all
identifiable and uncertain obligations. These provisions are
recognized at settlement amounts that are determined through
reasonable commercial estimates. Future increases in prices
and costs are also included in other provisions if sufficient
objective indications are available concerning such increases.
Provisions with a residual term of more than one year are dis-
counted at the average market interest rate for the past seven
years that corresponds to their residual term.
Liabilities are recognized at their settlement amount on the bal-
ance sheet date. Pension obligations are recognized at present
value using a mid-market interest rate for the past seven fiscal
years that is appropriate for the term. The values of liabilities from
financial guarantee contracts correspond to the loan amounts
as measured on the balance sheet date.
The valuation of the portfolio is derived from the difference
between market values and costs. According to accounting
principles under the German Commercial Code (HGB), the
negative valuation of a portfolio requires the establishment of
a provision for anticipated losses from open transactions,
while a positive valuation result is disregarded. In addition,
hedging transactions may be allocated directly to booked and
open underlying transactions and aggregated with them into
hedges (micro-hedges). E.ON SE accounts for these hedges
using the net hedge presentation method.
E.ON SE has established risk management guidelines for the
use of derivative financial instruments. Credit risks arising from
the use of derivative financial instruments are systematically
monitored and controlled throughout the E.ON Group.
Pensions and similar obligations are measured using the inter-
nationally recognized projected unit credit method. In this
method, the amount of the pension obligations is derived from
the benefit entitlement earned as of the balance sheet date,
taking into account future wage and salary increases. Because
of the application of Section 253 (2) HGB, pension obligations
and obligations similar to pensions that are valued as pension
components are discounted using the mid-market interest rate
for the past ten years as published by the Deutsche Bundes-
bank, with an assumed residual term of 15 years.
The wage and salary growth rate and pension increase rates
are also taken into consideration. The basis for the actuarial
calculations to determine the provisions is the 2005 G ver-
sions of the Klaus Heubeck biometric tables (“Richttafeln”).
The final age used for measurement purposes is the earliest
possible age limits under the statutory retirement pension
system in Germany, taking into account the provisions of the
Retirement Pension Age Limit Adjustment Act (“RV-Alters-
grenzenanpassungsgesetz”) of April 20, 2007. For employees
who have concluded early-retirement or semiretirement
arrangements, the contractually agreed final age is taken into
account. Furthermore, fluctuation probabilities customary in
the industry are also applied.
89
Foreign-currency liabilities with a residual term of more than
one year are measured at the price at the time of their initial
recognition or at the higher mid-market spot rate applicable on
the balance sheet date. Short-term foreign-currency liabilities
with a remaining term of one year or less were converted at the
closing rate at the mid-market spot rate without taking into
account the maximum or realization principle.
Income before the balance sheet date for income for a specific
period after that date is recognized as deferred income.
Pursuant to Section 274 (1) HGB, deferred taxes are determined
for temporary differences between valuations of assets, liabili-
ties and accruals for financial accounting under HGB and for tax
accounting purposes. E.ON SE takes into account not only the
differences from its own balance sheet items, but also those
carried by subsidiaries that are part of its tax group. In this respect,
deferred taxes may be recognized for temporary differences of
the tax group companies in the annual financial statements of
E.ON SE only for as long as the tax group is expected to continue
to exist.
In addition to these temporary differences, tax loss carryforwards
and interest expense carryforwards are also taken into account.
Deferred taxes are determined based on the combined income
tax rate, currently 30 percent. The combined income tax rate
includes corporate income tax, trade tax and the solidarity sur-
charge. For partnership interests, however, deferred taxes arising
from temporary differences are calculated using a different com-
bined income tax rate that includes only the corporate income
tax and solidarity surcharge; this rate is currently 16 percent.
Deferred taxes are netted for presentation on the balance
sheet (Section 274 (1), sentence 3, HGB). If the net result is a
tax credit (asset overhang), the recognition option pursuant
to Section 274 (1), sentence 2, HGB is not exercised. A net tax
liability is presented on the balance sheet as a deferred tax
liability. In the income statement, any change in the deferred
taxes reported on the balance sheet is presented under “Income
taxes” on a separate line. The net result for 2017 was a deferred
tax asset, which was not included on the balance sheet.
Notes on the Balance Sheet
(1) Intangible Assets and Property, Plant and EquipmentThe intangible assets recognized in the year under review relate
to software licenses and rights of use acquired for consideration.
Property, plant and equipment declined by €2.6 million from the
previous year. Additions of €0.5 million were offset by disposals
at carrying amounts of €2.5 million. The reported disposals
relate primarily to land and buildings. Scheduled depreciation of
property, plant and equipment amounted to €0.6 million in the
fiscal year.
(2) Shares in Affiliated CompaniesBy virtue of the shareholders’ agreement dated December 13,
2017, and entry in the commercial register on December 18,
2017, E.ON Finanzholding SE & Co. KG was founded with fixed
capital of €52,000. E.ON SE holds 99.9 percent of the shares as
general partner. The sole limited partner of E.ON Finanzholding SE
& Co. KG, with a fixed capital share of €50 (0.1 percent) is E.ON
Finanzholding Beteiligungs-GmbH. The cash contributions were
paid in on January 10, 2018.
The income and losses from equity investments are described
in detail in Note 21.
A list of the shareholdings of E.ON SE as of December 31,
2017, is included as part of these Notes on pages 110 et seq.
Section 286 (3), no. 1, HGB has been applied in that only those
holdings that are individually or collectively material to the
overall assessment of assets, financial condition and earnings
are listed.
(3) Other Financial AssetsOther financial assets consist of equity investments totaling
€8.9 million and long-term loans amounting to €1,954.5 million,
which did not change significantly in the fiscal year.

90Notes
(5) Receivables from Affiliated CompaniesReceivables from affiliated companies primarily relate to claims
from intragroup financing in the amount of €7,455.7 million
(2016: €7,810.6 million). This item includes liabilities from profit
and loss pooling agreements totaling €799.6 million. It also
includes trade receivables of €10.6 million (2016: €– million)
and other receivables of €230.9 million (2016: €278.7 million).
As in the previous year, all of the receivables have a residual
term of up to one year.
(6) Receivables from Companies in Which an Interest Is HeldThe receivables from Uniper SE reported in the prior year
totaled €9.3 million.
(4) Fixed AssetsThe classification and development of the items summarized on
the balance sheet are shown in the following table:
(7) Other ReceivablesThe other receivables item comprises trade receivables and
other assets. The item breaks down as follows:
Other assets mainly relates to corporate income tax refunds of
€146.2 million for 2016 and €10.8 million for 2017, in addition
to the solidarity surcharge. The reduction in tax receivables
totaling €266.8 million is mainly due to the final payment of the
corporation tax credit of around €86.6 million and refunds for
the 2015 assessment year of around €189.1 million.
The other receivables have a residual term of up to one year.
Other Receivables
€ in millions 2017 2016
Trade receivables 2.2 –
Other assets 333.7 636.6
Total 335.9 636.6
Development of Fixed Assets of E.ON SE
€ in millions
Acquisition and production costs
January 1, 2017 Additions Disposals December 31, 2017
Concessions acquired for consideration, commercial
proprietary rights and similar rights – 0.2 – 0.2
Intangible assets – 0.2 – 0.2
Real estate, leasehold rights and buildings, including
buildings on land owned by third parties 11.0 0.1 2.4 8.7
Technical equipment, plant and machinery 0.1 – 0.1 –
Other plant, fixtures, furniture and office equipment 13.7 0.4 0.5 13.6
Property, plant and equipment 24.8 0.5 3.0 22.3
Shares in affiliated companies 38,355.9 0.1 – 38,356.0
Long-term loans to affiliated companies 1,964.2 – 9.8 1,954.4
Equity investments 8.9 – – 8.9
Other long-term loans 0.3 – 0.1 0.2
Financial assets 40,329.3 0.1 9.9 40,319.5
Fixed assets 40,354.1 0.8 12.9 40,342.0
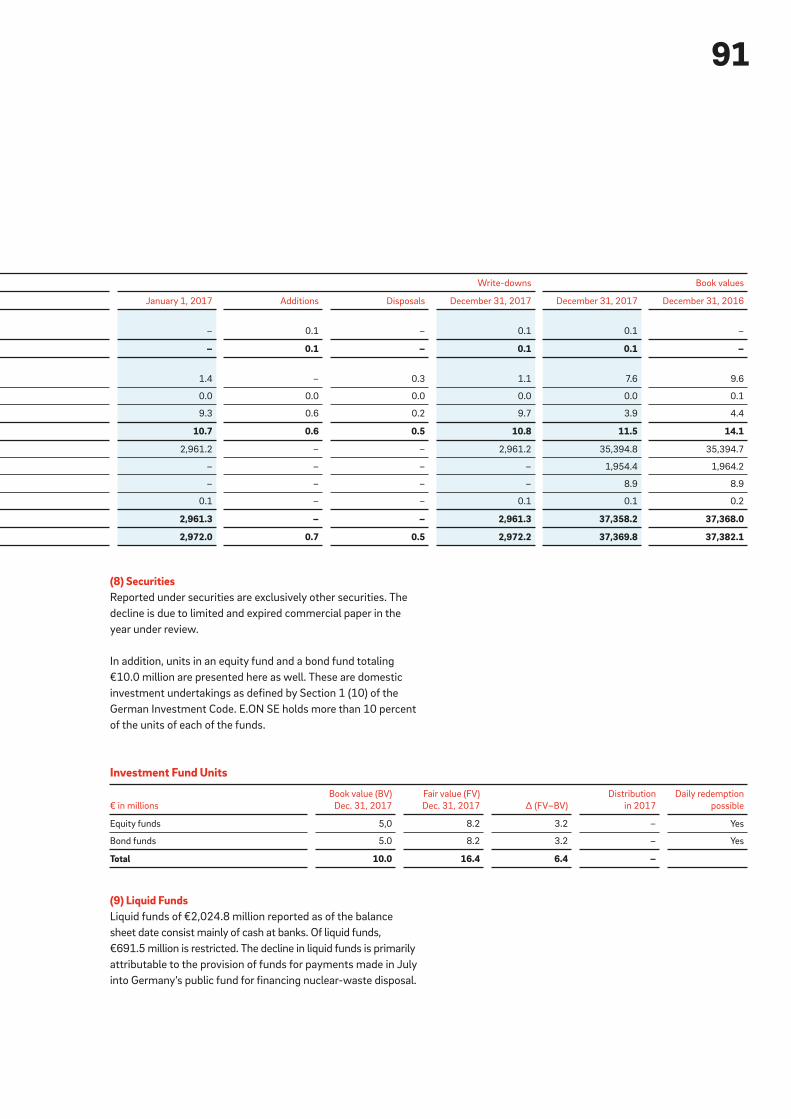
91
(8) SecuritiesReported under securities are exclusively other securities. The
decline is due to limited and expired commercial paper in the
year under review.
In addition, units in an equity fund and a bond fund totaling
€10.0 million are presented here as well. These are domestic
investment undertakings as defined by Section 1 (10) of the
German Investment Code. E.ON SE holds more than 10 percent
of the units of each of the funds.
(9) Liquid FundsLiquid funds of €2,024.8 million reported as of the balance
sheet date consist mainly of cash at banks. Of liquid funds,
€691.5 million is restricted. The decline in liquid funds is primarily
attributable to the provision of funds for payments made in July
into Germany’s public fund for financing nuclear-waste disposal.
Write-downs Book values
January 1, 2017 Additions Disposals December 31, 2017 December 31, 2017 December 31, 2016
– 0.1 – 0.1 0.1 –
– 0.1 – 0.1 0.1 –
1.4 – 0.3 1.1 7.6 9.6
0.0 0.0 0.0 0.0 0.0 0.1
9.3 0.6 0.2 9.7 3.9 4.4
10.7 0.6 0.5 10.8 11.5 14.1
2,961.2 – – 2,961.2 35,394.8 35,394.7
– – – – 1,954.4 1,964.2
– – – – 8.9 8.9
0.1 – – 0.1 0.1 0.2
2,961.3 – – 2,961.3 37,358.2 37,368.0
2,972.0 0.7 0.5 2,972.2 37,369.8 37,382.1
Investment Fund Units
€ in millions
Book value (BV)
Dec. 31, 2017
Fair value (FV)
Dec. 31, 2017 Δ (FV–BV)
Distribution
in 2017
Daily redemption
possible
Equity funds 5,0 8.2 3.2 – Yes
Bond funds 5.0 8.2 3.2 – Yes
Total 10.0 16.4 6.4 –

92Notes
May 2, 2017, by a total of up to €460 million through one or
more issuances of new registered no-par-value shares against
contributions in cash and/or in kind (authorized capital pursuant
to Sections 202 et seq. AktG, Authorized Capital 2012). One of
the components of the Authorized Capital 2012 was an autho-
rization of the Management Board, with the approval of the
Supervisory Board, to increase shareholders’ subscription rights
in accordance with Section 186 (3)(4) AktG in the case of capital
increases against cash contributions, if the issue price of the new
shares is not significantly lower than the stock exchange price
and the shares issued in connection with this authorization to
exclude subscription rights do not exceed a total of 10 percent
of the share capital, either at the time the authorization
becomes effective or at the time it is exercised.
On March 16, 2017, the Management Board decided, with the
approval of the Supervisory Board, to make partial use of the
Authorized Capital 2012 and to increase the Company’s capital
stock, excluding shareholder subscription rights, in accordance
with Sections 203 (2) and 186 (3)(4) of the German Stock Cor-
poration Act (AktG), from €2,001,000,000 by €200,099,000 to
€2,201,099,000 through the issue of 200,099,000 new regis-
tered shares with no-par value with profit participation rights
as of January 1, 2016, against cash contributions. This corre-
sponds to an increase in the Company’s existing capital stock of
slightly less than 10 percent (1,000 shares less than 10 percent)
both at the time the Authorized Capital 2012 becomes effective
and at the time the Authorized Capital 2012 is used. Through
the issue of the new shares with profit participation rights as
from January 1, 2016, these shares will bear the same profit
participation rights as existing shares when issued.
The capital increase became effective on March 20, 2017, when
its implementation was entered in the Company’s commercial
register. The related transaction costs of €8.8 million are included
in other operating expenses. The capital stock is now subdivided
into 2,201,099,000 registered ordinary shares with no par value
(“no-par-value shares”) and amounts to €2,201,099,000. By
shareholder resolution adopted at the Annual Shareholders
Meeting of May 10, 2017, the Management Board was autho-
rized, subject to the Supervisory Board’s approval, to increase
the Company’s capital stock by May 9, 2022, by a total of up to
€460 million through one or more issuances of new registered
no-par-value shares against contributions in cash and/or in kind
(with the option to restrict shareholders’ subscription rights).
Subject to the Supervisory Board’s approval, the Management
Board is authorized to exclude shareholders’ subscription rights.
The Authorized Capital 2017 has not been used.
(10) Accrued ExpensesThe item consists of €22.7 million in discounts (2016:
€21.3 million), which mainly relate to various loans granted by
E.ON International Finance B.V. and bonds issued in the year
under review. A further €13.7 million resulted from the accrual
of prepaid commitment fees and other expenses (2016:
€9.2 million) during the period.
(11) Asset Surplus after Offsetting of Benefit ObligationsThe offsetting of the guarantee fund assets against pension
obligations secured by Versorgungskasse Energie VVaG (VKE)
i.L. via claims pledged to the beneficiaries and the settlement
backlog arising from semiretirement arrangements covered by
these assets has produced a surplus of €0.5 million. In the prior
year, this item also included the offsetting of the guarantee
fund assets in connection with pension obligations not rein-
sured by VKE. In 2017, the corresponding offsetting amount is
reported under pension provisions.
Receivables pledged to beneficiaries against VKE i.L. in the
amount of €2.8 million represent guarantee fund assets and are
netted against the corresponding portion of pension obligations
(€2.3 million). The offsetting results in an asset surplus of
€0.5 million (2016: €0.7 million). The fair values of the pledged
receivables correspond to their acquisition cost. In the prior
year, the pension liability insurance claims corresponded to the
capital reserve documented by the insurer, which is the acquisi-
tion cost.
The settlement backlog from partial retirement agreements
with Energie-Sicherungstreuhand e.V. in the amount of
€0.3 million is offset against the fair value of the guarantee
fund assets in the amount of €0.3 million. The offsetting of the
guarantee fund assets against the settlement backlog arising
from semiretirement arrangements covered by these assets has
produced a minimal surplus (2016: €0.1 million). The fair values
of the fixed-term deposits correspond to their acquisition cost.
(12) Capital StockBy shareholder resolution adopted at the Annual Shareholders
Meeting of May 3, 2012, the Management Board of E.ON SE
was authorized under agenda item 7, subject to the Supervisory
Board’s approval, to increase the Company’s capital stock by
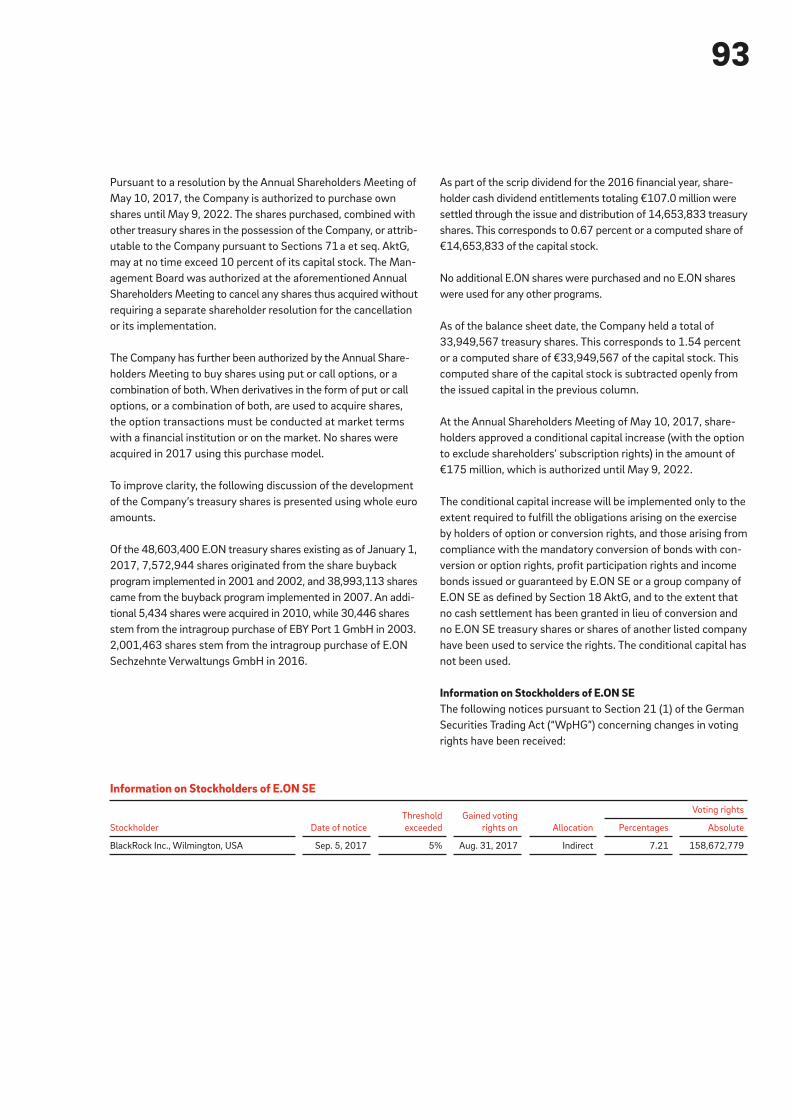
93
Pursuant to a resolution by the Annual Shareholders Meeting of
May 10, 2017, the Company is authorized to purchase own
shares until May 9, 2022. The shares purchased, combined with
other treasury shares in the possession of the Company, or attrib-
utable to the Company pursuant to Sections 71 a et seq. AktG,
may at no time exceed 10 percent of its capital stock. The Man-
agement Board was authorized at the aforementioned Annual
Shareholders Meeting to cancel any shares thus acquired without
requiring a separate shareholder resolution for the cancellation
or its implementation.
The Company has further been authorized by the Annual Share-
holders Meeting to buy shares using put or call options, or a
combination of both. When derivatives in the form of put or call
options, or a combination of both, are used to acquire shares,
the option transactions must be conducted at market terms
with a financial institution or on the market. No shares were
acquired in 2017 using this purchase model.
To improve clarity, the following discussion of the development
of the Company’s treasury shares is presented using whole euro
amounts.
Of the 48,603,400 E.ON treasury shares existing as of January 1,
2017, 7,572,944 shares originated from the share buyback
program implemented in 2001 and 2002, and 38,993,113 shares
came from the buyback program implemented in 2007. An addi-
tional 5,434 shares were acquired in 2010, while 30,446 shares
stem from the intragroup purchase of EBY Port 1 GmbH in 2003.
2,001,463 shares stem from the intragroup purchase of E.ON
Sechzehnte Verwaltungs GmbH in 2016.
As part of the scrip dividend for the 2016 financial year, share-
holder cash dividend entitlements totaling €107.0 million were
settled through the issue and distribution of 14,653,833 treasury
shares. This corresponds to 0.67 percent or a computed share of
€14,653,833 of the capital stock.
No additional E.ON shares were purchased and no E.ON shares
were used for any other programs.
As of the balance sheet date, the Company held a total of
33,949,567 treasury shares. This corresponds to 1.54 percent
or a computed share of €33,949,567 of the capital stock. This
computed share of the capital stock is subtracted openly from
the issued capital in the previous column.
At the Annual Shareholders Meeting of May 10, 2017, share-
holders approved a conditional capital increase (with the option
to exclude shareholders’ subscription rights) in the amount of
€175 million, which is authorized until May 9, 2022.
The conditional capital increase will be implemented only to the
extent required to fulfill the obligations arising on the exercise
by holders of option or conversion rights, and those arising from
compliance with the mandatory conversion of bonds with con-
version or option rights, profit participation rights and income
bonds issued or guaranteed by E.ON SE or a group company of
E.ON SE as defined by Section 18 AktG, and to the extent that
no cash settlement has been granted in lieu of conversion and
no E.ON SE treasury shares or shares of another listed company
have been used to service the rights. The conditional capital has
not been used.
Information on Stockholders of E.ON SEThe following notices pursuant to Section 21 (1) of the German
Securities Trading Act (“WpHG”) concerning changes in voting
rights have been received:
Information on Stockholders of E.ON SE
Stockholder Date of notice
Threshold
exceeded
Gained voting
rights on Allocation
Voting rights
Percentages Absolute
BlackRock Inc., Wilmington, USA Sep. 5, 2017 5% Aug. 31, 2017 Indirect 7.21 158,672,779

94Notes
In the year under review, €1,320.0 million (2016: €424.5 million)
was transferred from net income of €2,640.3 million (2016:
€876.5 million) to other retained earnings.
The change in other retained earnings from treasury shares is the
result of the issue of shares in connection with the scrip dividend
(see Note 12).
In order to fulfill retirement benefit obligations, funds have been
invested as restricted, bankruptcy-remote assets in fund units
administered in trust by E.ON Pension Trust e.V., registered in
Essen, Germany. In accordance with Section 253 (1) HGB, they
are measured at fair value, which stood at €260.4 million on the
balance sheet date and, taking into account deferred tax liabilities
of €2.1 million, exceeded the acquisition costs of €243.2 million
by €15.1 million. The full amount of the €15.1 million difference
is due to increases in value. Taking into account deferred tax
assets, also in the amount of €2.1 million, which are based on
uncertain earnings and which are taken into account by netting
against deferred tax liabilities, this results in a dividend-restricted
amount of €17.2 million.
(13) Additional Paid-in CapitalAs a result of the capital increase described in Note 12, the cap-
ital reserve increased by €1,148.5 million in accordance with
Section 272 (2) No. 1 HGB and amounted to €3,657.1 million
(2016: €2,508.6 million) as of the balance sheet date.
(14) Retained EarningsRetained earnings developed as follows:
The dividend-restricted amount of the difference between the
recognition of provisions for pension obligations based on the
corresponding average market interest rate for the past ten
fiscal years (3.68 percent p.a.) and the recognition of these pro-
visions based on the corresponding average market interest rate
for the past seven fiscal years (2.80 percent p.a.) amounted to
€87.4 million as of December 31, 2017, for E.ON SE.
Both of the dividend-restricted amounts totaling €104.6 million
mentioned above are fully covered by a sufficient amount of
available reserves.
Accordingly, there is no restriction preventing payment in 2018
of the proposed dividend distribution, which is projected to be
in the amount of €650.1 million.
(15) Net Income Available for DistributionNet income available for distribution includes profit carried
forward of €210 from the 2016 financial year.
Retained Earnings
€ in millions
As of
Jan. 1, 2017 Withdrawal Addition
Change in
treasury shares
As of
Dec. 31, 2017
Legal reserves 45.3 – – – 45.3
Other retained earnings 426.5 – 1,320.0 92.4 1,838.3
Total 471.8 – 1,320.0 92.4 1,884.2
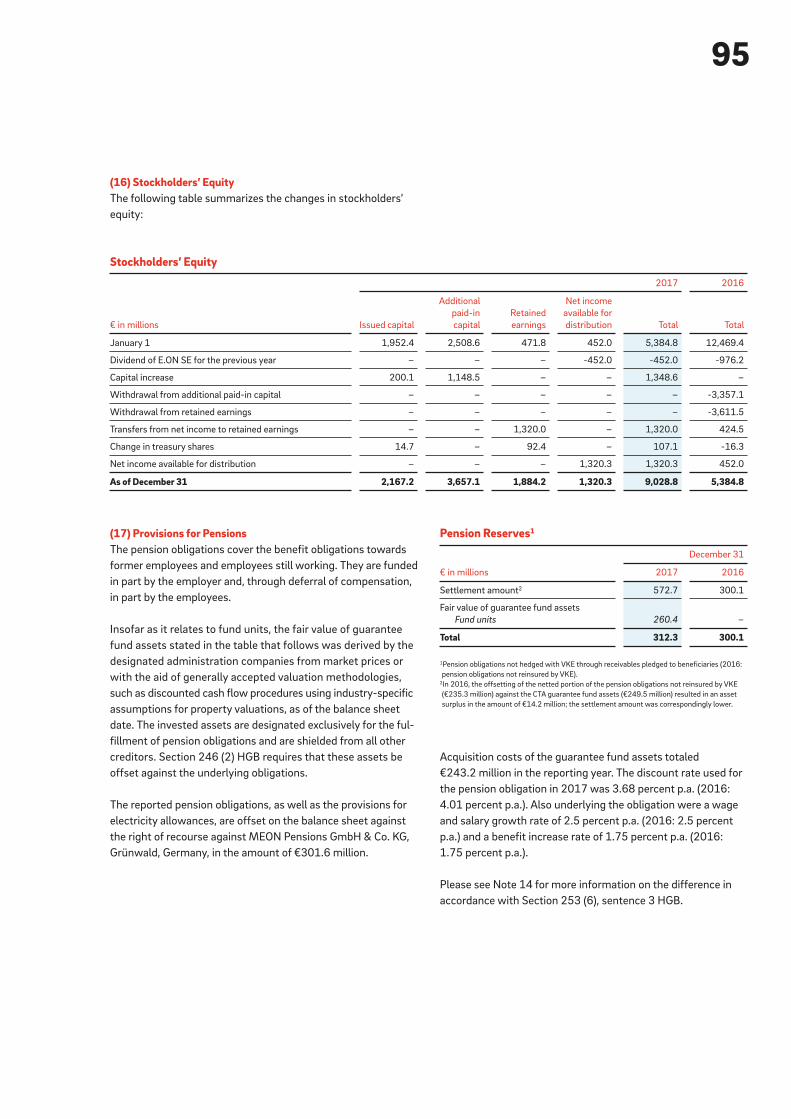
95
(17) Provisions for PensionsThe pension obligations cover the benefit obligations towards
former employees and employees still working. They are funded
in part by the employer and, through deferral of compensation,
in part by the employees.
Insofar as it relates to fund units, the fair value of guarantee
fund assets stated in the table that follows was derived by the
designated administration companies from market prices or
with the aid of generally accepted valuation methodologies,
such as discounted cash flow procedures using industry-specific
assumptions for property valuations, as of the balance sheet
date. The invested assets are designated exclusively for the ful-
fillment of pension obligations and are shielded from all other
creditors. Section 246 (2) HGB requires that these assets be
offset against the underlying obligations.
The reported pension obligations, as well as the provisions for
electricity allowances, are offset on the balance sheet against
the right of recourse against MEON Pensions GmbH & Co. KG,
Grünwald, Germany, in the amount of €301.6 million.
Acquisition costs of the guarantee fund assets totaled
€243.2 million in the reporting year. The discount rate used for
the pension obligation in 2017 was 3.68 percent p.a. (2016:
4.01 percent p.a.). Also underlying the obligation were a wage
and salary growth rate of 2.5 percent p.a. (2016: 2.5 percent
p.a.) and a benefit increase rate of 1.75 percent p.a. (2016:
1.75 percent p.a.).
Please see Note 14 for more information on the difference in
accordance with Section 253 (6), sentence 3 HGB.
Pension Reserves1
€ in millions
December 31
2017 2016
Settlement amount2 572.7 300.1
Fair value of guarantee fund assets
Fund units 260.4 –
Total 312.3 300.1
1Pension obligations not hedged with VKE through receivables pledged to beneficiaries (2016:
pension obligations not reinsured by VKE).2In 2016, the offsetting of the netted portion of the pension obligations not reinsured by VKE
(€235.3 million) against the CTA guarantee fund assets (€249.5 million) resulted in an asset
surplus in the amount of €14.2 million; the settlement amount was correspondingly lower.
Stockholders’ Equity
€ in millions
2017 2016
Issued capital
Additional
paid-in
capital
Retained
earnings
Net income
available for
distribution Total Total
January 1 1,952.4 2,508.6 471.8 452.0 5,384.8 12,469.4
Dividend of E.ON SE for the previous year – – – -452.0 -452.0 -976.2
Capital increase 200.1 1,148.5 – – 1,348.6 –
Withdrawal from additional paid-in capital – – – – – -3,357.1
Withdrawal from retained earnings – – – – – -3,611.5
Transfers from net income to retained earnings – – 1,320.0 – 1,320.0 424.5
Change in treasury shares 14.7 – 92.4 – 107.1 -16.3
Net income available for distribution – – – 1,320.3 1,320.3 452.0
As of December 31 2,167.2 3,657.1 1,884.2 1,320.3 9,028.8 5,384.8
(16) Stockholders’ EquityThe following table summarizes the changes in stockholders’
equity:

96Notes
(18) Provisions for TaxesProvisions for taxes relate primarily to taxes for previous years.
(19) Other ProvisionsOther provisions break down as follows:
Other Provisions
€ in millions
December 31
2017 2016
Environmental remediation obligations 518.7 607.3
Tax-related interest 320.5 479.1
Other personnel reserves 114.7 72.4
Various other reserves 95.8 99.2
Total 1,049.7 1,258.0
The provision for environmental improvement obligations relates
to possible remediation measures arising from the operation of
abandoned mines of predecessor companies. A comprehensive
review of the obligations was carried out in the fiscal year, which
led to a reduction of €88.6 million in the provision.
Other personnel-related provisions also include the allocation
to the Phoenix restructuring program in the amount of
€24.7 million.
(20) LiabilitiesIn the fiscal year three bonds with a total nominal value of
€2,000.0 million were issued.
Liabilities
€ in millions
December 31, 2017 December 31, 2016
With a remaining term of With a remaining term of
Total ≤ 1 year > 1 year > 5 years Total ≤ 1 year > 1 year
Bonds 2,000.0 – 750.0 1,250.0 – – –
Banks 665.4 615.4 50.0 – 776.4 405.9 370.5
Secured by collateral pledges
of other assets – – – – 86.5 86.5 –
Accounts payable 14.0 14.0 – – 29.1 29.1 –
Affiliated companies 34,349.6 23,655.8 6,232.7 4,461.1 43,101.8 31,985.9 11,115.9
Liabilities to companies in which an
interest is held 5.4 5.4 – – 4.1 4.1 –
Other liabilities 285.7 285.7 – – 35.1 35.1 –
Taxes 284.0 284.0 – – 2.7 2.7 –
Social security 0.3 0.3 – – – – –
Total 37,320.1 24,576.3 7,032.7 5,711.1 43,946.5 32,460.1 11,486.4
Liabilities to affiliated companies mainly result from intragroup
financing totaling €33,950.3 million (2016: €40,651.0 million).
This item includes receivables from profit transfer totaling
€5,532.2 million. In addition, trade payables of €189.4 million
(2016: €210.2 million) and other liabilities of €209.8 million
(2016: €2,240.6 million) are reported under liabilities to asso-
ciates. The other liabilities include liabilities from existing profit
and loss pooling agreements in the amount of €56.2 million
(2016: €1,990.3 million).
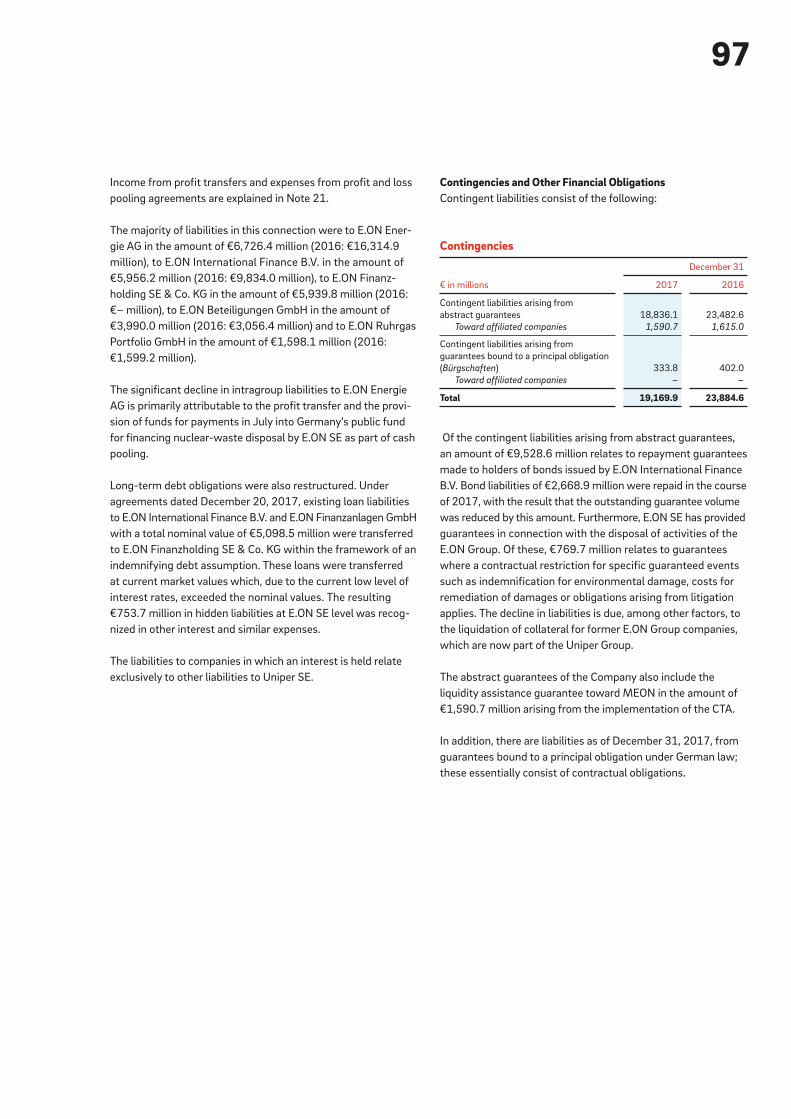
97
Contingencies and Other Financial ObligationsContingent liabilities consist of the following:
Of the contingent liabilities arising from abstract guarantees,
an amount of €9,528.6 million relates to repayment guarantees
made to holders of bonds issued by E.ON International Finance
B.V. Bond liabilities of €2,668.9 million were repaid in the course
of 2017, with the result that the outstanding guarantee volume
was reduced by this amount. Furthermore, E.ON SE has provided
guarantees in connection with the disposal of activities of the
E.ON Group. Of these, €769.7 million relates to guarantees
where a contractual restriction for specific guaranteed events
such as indemnification for environmental damage, costs for
remediation of damages or obligations arising from litigation
applies. The decline in liabilities is due, among other factors, to
the liquidation of collateral for former E.ON Group companies,
which are now part of the Uniper Group.
The abstract guarantees of the Company also include the
liquidity assistance guarantee toward MEON in the amount of
€1,590.7 million arising from the implementation of the CTA.
In addition, there are liabilities as of December 31, 2017, from
guarantees bound to a principal obligation under German law;
these essentially consist of contractual obligations.
Contingencies
€ in millions
December 31
2017 2016
Contingent liabilities arising from
abstract guarantees 18,836.1 23,482.6
Toward affiliated companies 1,590.7 1,615.0
Contingent liabilities arising from
guarantees bound to a principal obligation
(Bürgschaften) 333.8 402.0
Toward affiliated companies – –
Total 19,169.9 23,884.6
Income from profit transfers and expenses from profit and loss
pooling agreements are explained in Note 21.
The majority of liabilities in this connection were to E.ON Ener-
gie AG in the amount of €6,726.4 million (2016: €16,314.9
million), to E.ON International Finance B.V. in the amount of
€5,956.2 million (2016: €9,834.0 million), to E.ON Finanz-
holding SE & Co. KG in the amount of €5,939.8 million (2016:
€– million), to E.ON Beteiligungen GmbH in the amount of
€3,990.0 million (2016: €3,056.4 million) and to E.ON Ruhrgas
Portfolio GmbH in the amount of €1,598.1 million (2016:
€1,599.2 million).
The significant decline in intragroup liabilities to E.ON Energie
AG is primarily attributable to the profit transfer and the provi-
sion of funds for payments in July into Germany’s public fund
for financing nuclear-waste disposal by E.ON SE as part of cash
pooling.
Long-term debt obligations were also restructured. Under
agreements dated December 20, 2017, existing loan liabilities
to E.ON International Finance B.V. and E.ON Finanzanlagen GmbH
with a total nominal value of €5,098.5 million were transferred
to E.ON Finanzholding SE & Co. KG within the framework of an
indemnifying debt assumption. These loans were transferred
at current market values which, due to the current low level of
interest rates, exceeded the nominal values. The resulting
€753.7 million in hidden liabilities at E.ON SE level was recog-
nized in other interest and similar expenses.
The liabilities to companies in which an interest is held relate
exclusively to other liabilities to Uniper SE.
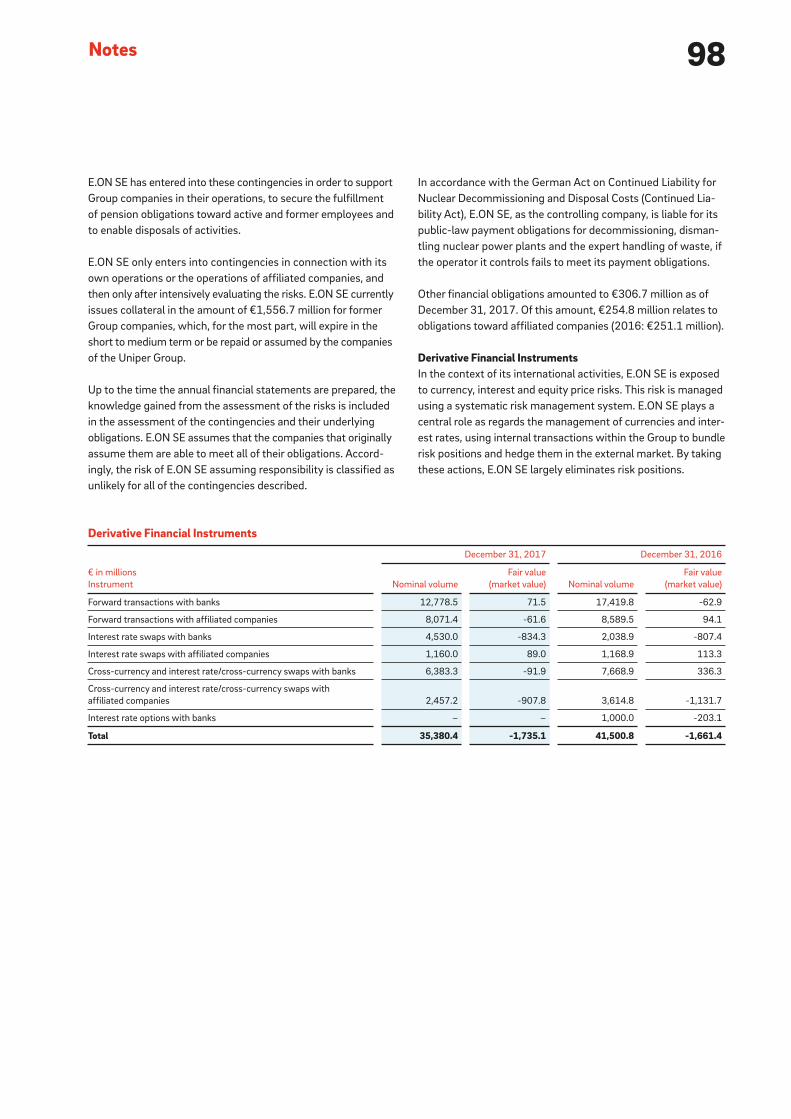
98Notes
In accordance with the German Act on Continued Liability for
Nuclear Decommissioning and Disposal Costs (Continued Lia-
bility Act), E.ON SE, as the controlling company, is liable for its
public-law payment obligations for decommissioning, disman-
tling nuclear power plants and the expert handling of waste, if
the operator it controls fails to meet its payment obligations.
Other financial obligations amounted to €306.7 million as of
December 31, 2017. Of this amount, €254.8 million relates to
obligations toward affiliated companies (2016: €251.1 million).
Derivative Financial InstrumentsIn the context of its international activities, E.ON SE is exposed
to currency, interest and equity price risks. This risk is managed
using a systematic risk management system. E.ON SE plays a
central role as regards the management of currencies and inter-
est rates, using internal transactions within the Group to bundle
risk positions and hedge them in the external market. By taking
these actions, E.ON SE largely eliminates risk positions.
E.ON SE has entered into these contingencies in order to support
Group companies in their operations, to secure the fulfillment
of pension obligations toward active and former employees and
to enable disposals of activities.
E.ON SE only enters into contingencies in connection with its
own operations or the operations of affiliated companies, and
then only after intensively evaluating the risks. E.ON SE currently
issues collateral in the amount of €1,556.7 million for former
Group companies, which, for the most part, will expire in the
short to medium term or be repaid or assumed by the companies
of the Uniper Group.
Up to the time the annual financial statements are prepared, the
knowledge gained from the assessment of the risks is included
in the assessment of the contingencies and their underlying
obligations. E.ON SE assumes that the companies that originally
assume them are able to meet all of their obligations. Accord-
ingly, the risk of E.ON SE assuming responsibility is classified as
unlikely for all of the contingencies described.
Derivative Financial Instruments
€ in millions
Instrument
December 31, 2017 December 31, 2016
Nominal volume
Fair value
(market value) Nominal volume
Fair value
(market value)
Forward transactions with banks 12,778.5 71.5 17,419.8 -62.9
Forward transactions with affiliated companies 8,071.4 -61.6 8,589.5 94.1
Interest rate swaps with banks 4,530.0 -834.3 2,038.9 -807.4
Interest rate swaps with affiliated companies 1,160.0 89.0 1,168.9 113.3
Cross-currency and interest rate/cross-currency swaps with banks 6,383.3 -91.9 7,668.9 336.3
Cross-currency and interest rate/cross-currency swaps with
affiliated companies 2,457.2 -907.8 3,614.8 -1,131.7
Interest rate options with banks – – 1,000.0 -203.1
Total 35,380.4 -1,735.1 41,500.8 -1,661.4
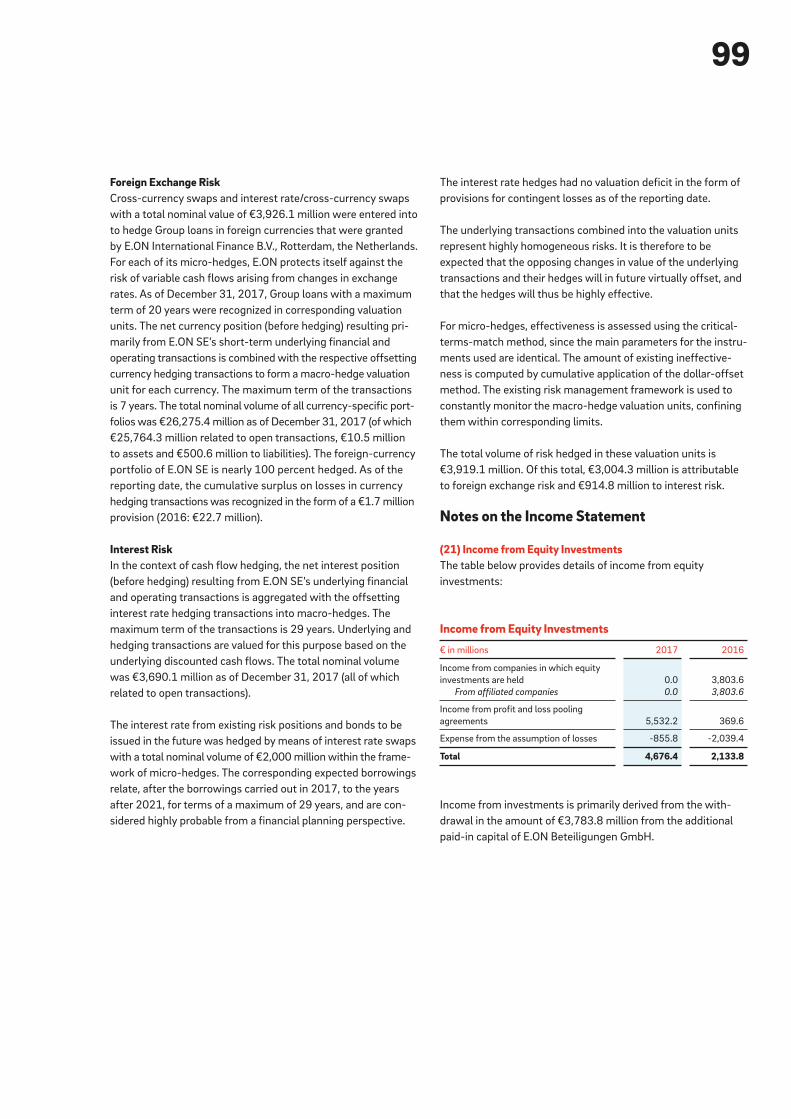
99
Foreign Exchange RiskCross-currency swaps and interest rate/cross-currency swaps
with a total nominal value of €3,926.1 million were entered into
to hedge Group loans in foreign currencies that were granted
by E.ON International Finance B.V., Rotterdam, the Netherlands.
For each of its micro-hedges, E.ON protects itself against the
risk of variable cash flows arising from changes in exchange
rates. As of December 31, 2017, Group loans with a maximum
term of 20 years were recognized in corresponding valuation
units. The net currency position (before hedging) resulting pri-
marily from E.ON SE’s short-term underlying financial and
operating transactions is combined with the respective offsetting
currency hedging transactions to form a macro-hedge valuation
unit for each currency. The maximum term of the transactions
is 7 years. The total nominal volume of all currency-specific port-
folios was €26,275.4 million as of December 31, 2017 (of which
€25,764.3 million related to open transactions, €10.5 million
to assets and €500.6 million to liabilities). The foreign-currency
portfolio of E.ON SE is nearly 100 percent hedged. As of the
reporting date, the cumulative surplus on losses in currency
hedging transactions was recognized in the form of a €1.7 million
provision (2016: €22.7 million).
Interest RiskIn the context of cash flow hedging, the net interest position
(before hedging) resulting from E.ON SE’s underlying financial
and operating transactions is aggregated with the offsetting
interest rate hedging transactions into macro-hedges. The
maximum term of the transactions is 29 years. Underlying and
hedging transactions are valued for this purpose based on the
underlying discounted cash flows. The total nominal volume
was €3,690.1 million as of December 31, 2017 (all of which
related to open transactions).
The interest rate from existing risk positions and bonds to be
issued in the future was hedged by means of interest rate swaps
with a total nominal volume of €2,000 million within the frame-
work of micro-hedges. The corresponding expected borrowings
relate, after the borrowings carried out in 2017, to the years
after 2021, for terms of a maximum of 29 years, and are con-
sidered highly probable from a financial planning perspective.
The interest rate hedges had no valuation deficit in the form of
provisions for contingent losses as of the reporting date.
The underlying transactions combined into the valuation units
represent highly homogeneous risks. It is therefore to be
expected that the opposing changes in value of the underlying
transactions and their hedges will in future virtually offset, and
that the hedges will thus be highly effective.
For micro-hedges, effectiveness is assessed using the critical-
terms-match method, since the main parameters for the instru-
ments used are identical. The amount of existing ineffective-
ness is computed by cumulative application of the dollar-offset
method. The existing risk management framework is used to
constantly monitor the macro-hedge valuation units, confining
them within corresponding limits.
The total volume of risk hedged in these valuation units is
€3,919.1 million. Of this total, €3,004.3 million is attributable
to foreign exchange risk and €914.8 million to interest risk.
Notes on the Income Statement
(21) Income from Equity InvestmentsThe table below provides details of income from equity
investments:
Income from investments is primarily derived from the with-
drawal in the amount of €3,783.8 million from the additional
paid-in capital of E.ON Beteiligungen GmbH.
Income from Equity Investments
€ in millions 2017 2016
Income from companies in which equity
investments are held 0.0 3,803.6
From affiliated companies 0.0 3,803.6
Income from profit and loss pooling
agreements 5,532.2 369.6
Expense from the assumption of losses -855.8 -2,039.4
Total 4,676.4 2,133.8
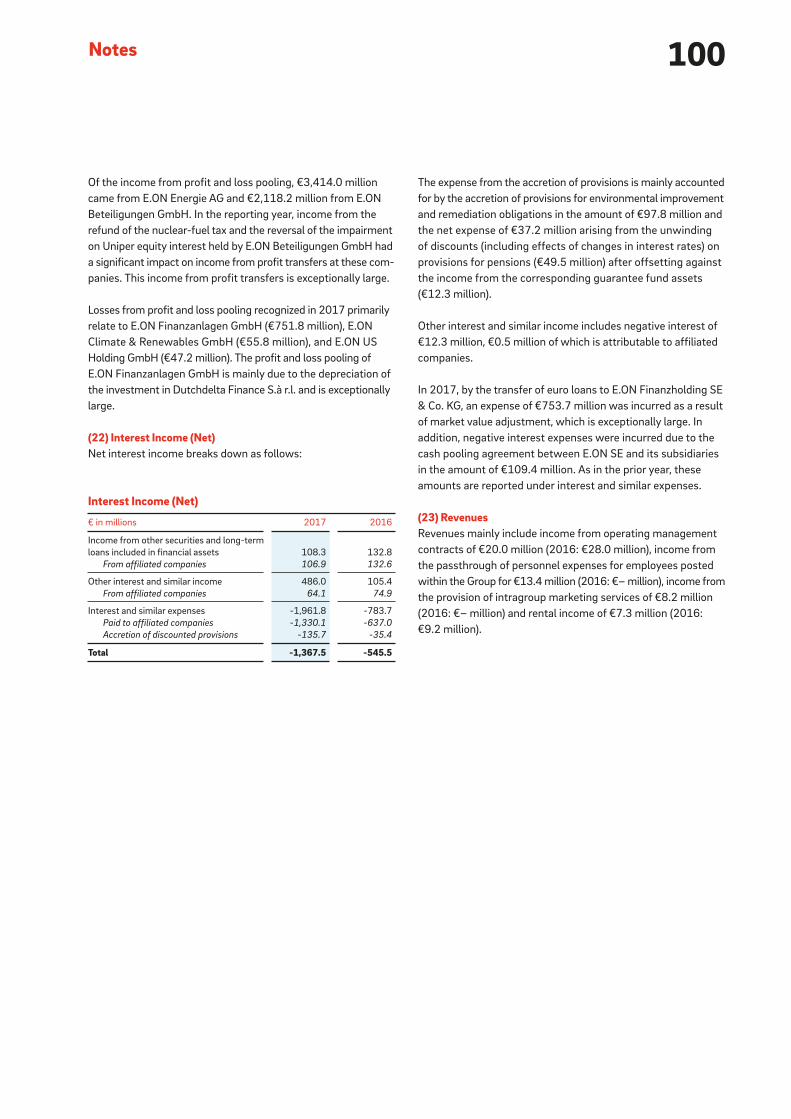
100Notes
The expense from the accretion of provisions is mainly accounted
for by the accretion of provisions for environmental improvement
and remediation obligations in the amount of €97.8 million and
the net expense of €37.2 million arising from the unwinding
of discounts (including effects of changes in interest rates) on
provisions for pensions (€49.5 million) after offsetting against
the income from the corresponding guarantee fund assets
(€12.3 million).
Other interest and similar income includes negative interest of
€12.3 million, €0.5 million of which is attributable to affiliated
companies.
In 2017, by the transfer of euro loans to E.ON Finanzholding SE
& Co. KG, an expense of €753.7 million was incurred as a result
of market value adjustment, which is exceptionally large. In
addition, negative interest expenses were incurred due to the
cash pooling agreement between E.ON SE and its subsidiaries
in the amount of €109.4 million. As in the prior year, these
amounts are reported under interest and similar expenses.
(23) RevenuesRevenues mainly include income from operating management
contracts of €20.0 million (2016: €28.0 million), income from
the passthrough of personnel expenses for employees posted
within the Group for €13.4 million (2016: €– million), income from
the provision of intragroup marketing services of €8.2 million
(2016: €– million) and rental income of €7.3 million (2016:
€9.2 million).
Of the income from profit and loss pooling, €3,414.0 million
came from E.ON Energie AG and €2,118.2 million from E.ON
Beteiligungen GmbH. In the reporting year, income from the
refund of the nuclear-fuel tax and the reversal of the impairment
on Uniper equity interest held by E.ON Beteiligungen GmbH had
a significant impact on income from profit transfers at these com-
panies. This income from profit transfers is exceptionally large.
Losses from profit and loss pooling recognized in 2017 primarily
relate to E.ON Finanzanlagen GmbH (€751.8 million), E.ON
Climate & Renewables GmbH (€55.8 million), and E.ON US
Holding GmbH (€47.2 million). The profit and loss pooling of
E.ON Finanzanlagen GmbH is mainly due to the depreciation of
the investment in Dutchdelta Finance S.à r.l. and is exceptionally
large.
(22) Interest Income (Net)Net interest income breaks down as follows:
Interest Income (Net)
€ in millions 2017 2016
Income from other securities and long-term
loans included in financial assets 108.3 132.8
From affiliated companies 106.9 132.6
Other interest and similar income 486.0 105.4
From affiliated companies 64.1 74.9
Interest and similar expenses -1,961.8 -783.7
Paid to affiliated companies -1,330.1 -637.0
Accretion of discounted provisions -135.7 -35.4
Total -1,367.5 -545.5

101
(26) Personnel ExpensesThe following table shows the structure of personnel expenses:
Personnel expenses of €162.9 million were €16.5 million higher
than in the prior year. This is primarily due to an increase in
expenses from the long-term variable compensation models.
As of the reporting date, a provision of €44.2 million has been
recognized for share-based payment (2016: €24.5 million).
This effect is only partially offset by lower pension expenses of
€0.5 million (2016: €15.1 million) compared to the previous
year. Personnel expenses do not include amounts resulting
from the accumulation of interest on personnel provisions, in
particular pension provisions and the effects of interest rate
changes. Both effects are recognized in net interest income.
Personnel Expenses
€ in millions 2017 2016
Wages and salaries 152.5 121.7
Social security contributions, pension costs
and other employee benefits 10.4 24.7
For pensions 0.5 15.1
Total 162.9 146.4
(24) Other Operating IncomeOther operating income breaks down as shown in the following
table:
Of the income from exchange rate differences reported,
€572.9 million originated from relationships with affiliated
companies and €1,020.2 million from external relationships.
Income from the reversal of provisions represents income not
related to the reporting period. The change in the fiscal year
results mainly from the release of a portion of the provision for
environmental improvement and remediation obligations in the
amount of €275.8 million and is exceptionally large.
(25) Cost of MaterialsThe cost of materials of €14.8 million (2016: €7.8 million)
relates exclusively to purchased services and is directly related
to the income recorded under revenues.
Other Operating Income
€ in millions 2017 2016
Exchange-rate differences 1,593.1 3,151.3
Cross-currency interest-rate swaps and
currency options 427.6 513.7
Reversal of provisions 292.4 25.9
Miscellaneous 82.3 107.4
Total 2,395.4 3,798.3
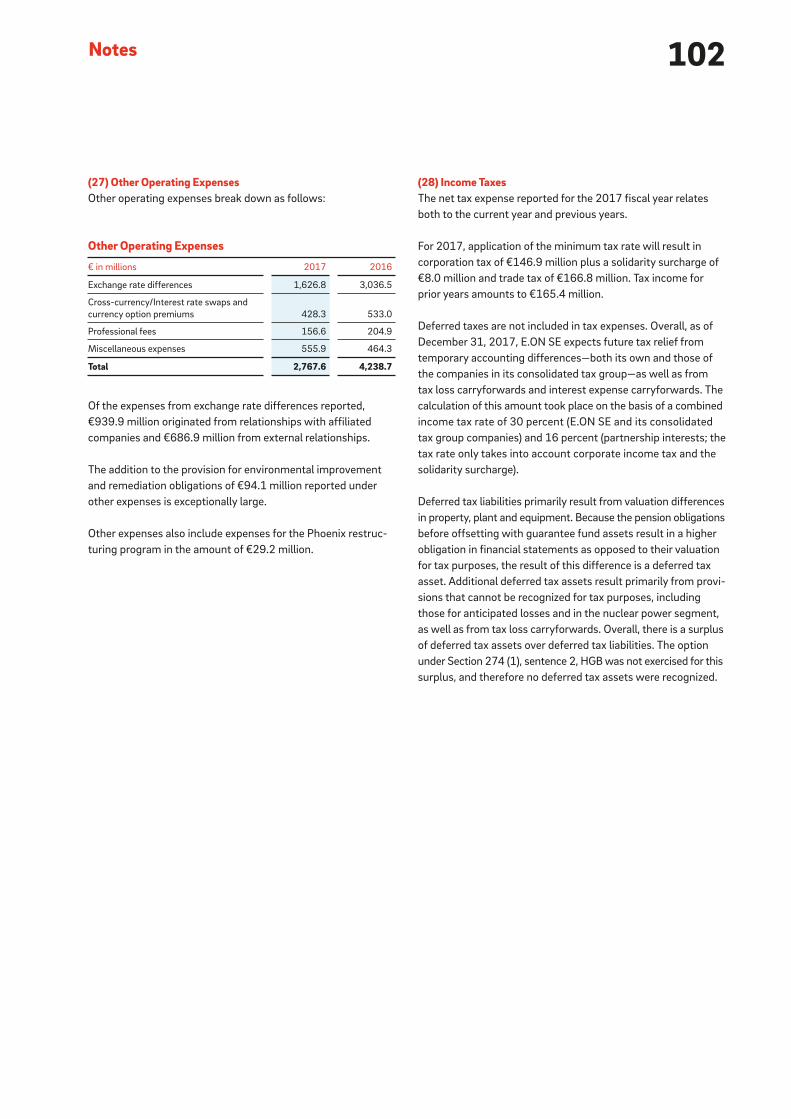
102Notes
(28) Income TaxesThe net tax expense reported for the 2017 fiscal year relates
both to the current year and previous years.
For 2017, application of the minimum tax rate will result in
corporation tax of €146.9 million plus a solidarity surcharge of
€8.0 million and trade tax of €166.8 million. Tax income for
prior years amounts to €165.4 million.
Deferred taxes are not included in tax expenses. Overall, as of
December 31, 2017, E.ON SE expects future tax relief from
temporary accounting differences—both its own and those of
the companies in its consolidated tax group—as well as from
tax loss carryforwards and interest expense carryforwards. The
calculation of this amount took place on the basis of a combined
income tax rate of 30 percent (E.ON SE and its consolidated
tax group companies) and 16 percent (partnership interests; the
tax rate only takes into account corporate income tax and the
solidarity surcharge).
Deferred tax liabilities primarily result from valuation differences
in property, plant and equipment. Because the pension obligations
before offsetting with guarantee fund assets result in a higher
obligation in financial statements as opposed to their valuation
for tax purposes, the result of this difference is a deferred tax
asset. Additional deferred tax assets result primarily from provi-
sions that cannot be recognized for tax purposes, including
those for anticipated losses and in the nuclear power segment,
as well as from tax loss carryforwards. Overall, there is a surplus
of deferred tax assets over deferred tax liabilities. The option
under Section 274 (1), sentence 2, HGB was not exercised for this
surplus, and therefore no deferred tax assets were recognized.
(27) Other Operating ExpensesOther operating expenses break down as follows:
Of the expenses from exchange rate differences reported,
€939.9 million originated from relationships with affiliated
companies and €686.9 million from external relationships.
The addition to the provision for environmental improvement
and remediation obligations of €94.1 million reported under
other expenses is exceptionally large.
Other expenses also include expenses for the Phoenix restruc-
turing program in the amount of €29.2 million.
Other Operating Expenses
€ in millions 2017 2016
Exchange rate differences 1,626.8 3,036.5
Cross-currency/Interest rate swaps and
currency option premiums 428.3 533.0
Professional fees 156.6 204.9
Miscellaneous expenses 555.9 464.3
Total 2,767.6 4,238.7
103
(29) Subsequent EventsOn March 12, 2018, E.ON SE agreed with RWE AG on an
acquisition of RWE’s 76.8 percent stake in innogy SE. The
acquisition will be carried out via a wide-ranging exchange of
assets and participations.
In exchange for the 76.8 percent stake in innogy SE, E.ON will
grant to RWE an effective participation of 16.67 percent in
E.ON SE. The shares will be issued by way of a 20 percent capital
increase against contribution in kind from existing authorised
capital. Furthermore, E.ON will transfer to RWE most of E.ON’s
renewables business and also the minority interests currently
held by E.ON’s subsidiary PreussenElektra in the RWE-operated
nuclear power plants Emsland and Gundremmingen. Further-
more, RWE will receive the entire innogy renewables business
and the innogy gas storage businesses and the stake in the
Austrian energy supplier Kelag. The transfer of businesses and
participations would be conducted with economic effect as of
January 1, 2018. The transaction further provides for a cash pay-
ment from RWE to E.ON in the amount of €1.5 billion.
E.ON will also make a voluntary public takeover offer in cash to
the shareholders of innogy SE. This offer includes as of today
a total value of €40 per share for the innogy shareholders. The
total value consists of an offer price of €36.76 per share plus
assumed dividends of innogy SE for the fiscal years 2017 and
2018 in the total amount of €3.24 per share. RWE will not par-
ticipate in the offer.
The transaction will be implemented in several steps and is
subject to customary antitrust clearances and is expected to
close in mid 2019.
There are no effects on the E.ON SE Financial Statements for
fiscal year 2017. Indications relating to possible future effects
resulting from the acquisition of innogy SE via a wide-ranging
exchange of assets with RWE AG are currently not included in
the Combined Management Report, since the transaction is
also subject to customary antitrust clearances.
Other Disclosures
EmployeesThe average number of persons employed in the 2017 fiscal year
by E.ON SE at its Group Management, at the Centers of Com-
petence and at the E.ON Deutschland unit was 872 (2016: 904).
This average does not include four members of the Management
Board and, with respect to the prior year, the apprentices. The
employees are divided into Group Management (368 employees),
Centers of Competence (394 employees) and E.ON Deutschland
(110 employees).
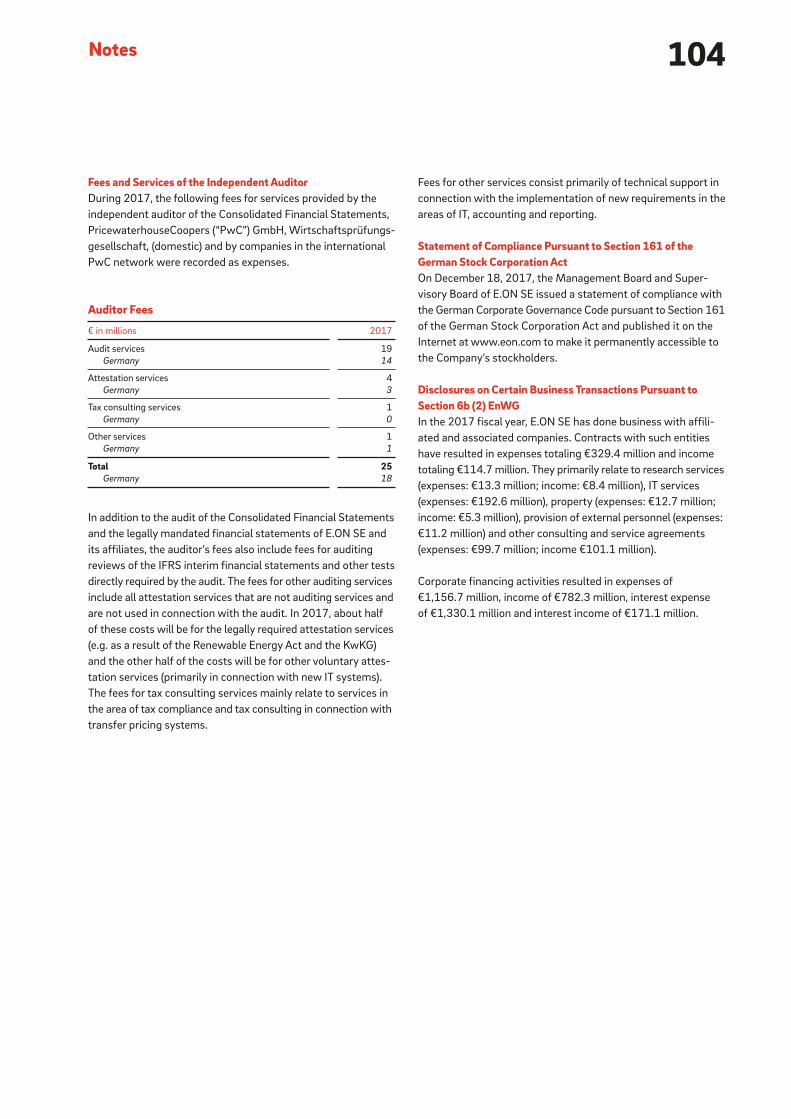
104Notes
Fees for other services consist primarily of technical support in
connection with the implementation of new requirements in the
areas of IT, accounting and reporting.
Statement of Compliance Pursuant to Section 161 of the German Stock Corporation ActOn December 18, 2017, the Management Board and Super-
visory Board of E.ON SE issued a statement of compliance with
the German Corporate Governance Code pursuant to Section 161
of the German Stock Corporation Act and published it on the
Internet at www.eon.com to make it permanently accessible to
the Company’s stockholders.
Disclosures on Certain Business Transactions Pursuant to Section 6b (2) EnWGIn the 2017 fiscal year, E.ON SE has done business with affili-
ated and associated companies. Contracts with such entities
have resulted in expenses totaling €329.4 million and income
totaling €114.7 million. They primarily relate to research services
(expenses: €13.3 million; income: €8.4 million), IT services
(expenses: €192.6 million), property (expenses: €12.7 million;
income: €5.3 million), provision of external personnel (expenses:
€11.2 million) and other consulting and service agreements
(expenses: €99.7 million; income €101.1 million).
Corporate financing activities resulted in expenses of
€1,156.7 million, income of €782.3 million, interest expense
of €1,330.1 million and interest income of €171.1 million.
Fees and Services of the Independent AuditorDuring 2017, the following fees for services provided by the
independent auditor of the Consolidated Financial Statements,
Pricewaterhouse Coopers (“PwC”) GmbH, Wirtschaftsprüfungs-
gesellschaft, (domestic) and by companies in the international
PwC network were recorded as expenses.
In addition to the audit of the Consolidated Financial Statements
and the legally mandated financial statements of E.ON SE and
its affiliates, the auditor’s fees also include fees for auditing
reviews of the IFRS interim financial statements and other tests
directly required by the audit. The fees for other auditing services
include all attestation services that are not auditing services and
are not used in connection with the audit. In 2017, about half
of these costs will be for the legally required attestation services
(e.g. as a result of the Renewable Energy Act and the KwKG)
and the other half of the costs will be for other voluntary attes-
tation services (primarily in connection with new IT systems).
The fees for tax consulting services mainly relate to services in
the area of tax compliance and tax consulting in connection with
transfer pricing systems.
Auditor Fees
€ in millions 2017
Audit services 19
Germany 14
Attestation services 4
Germany 3
Tax consulting services 1
Germany 0
Other services 1
Germany 1
Total 25Germany 18
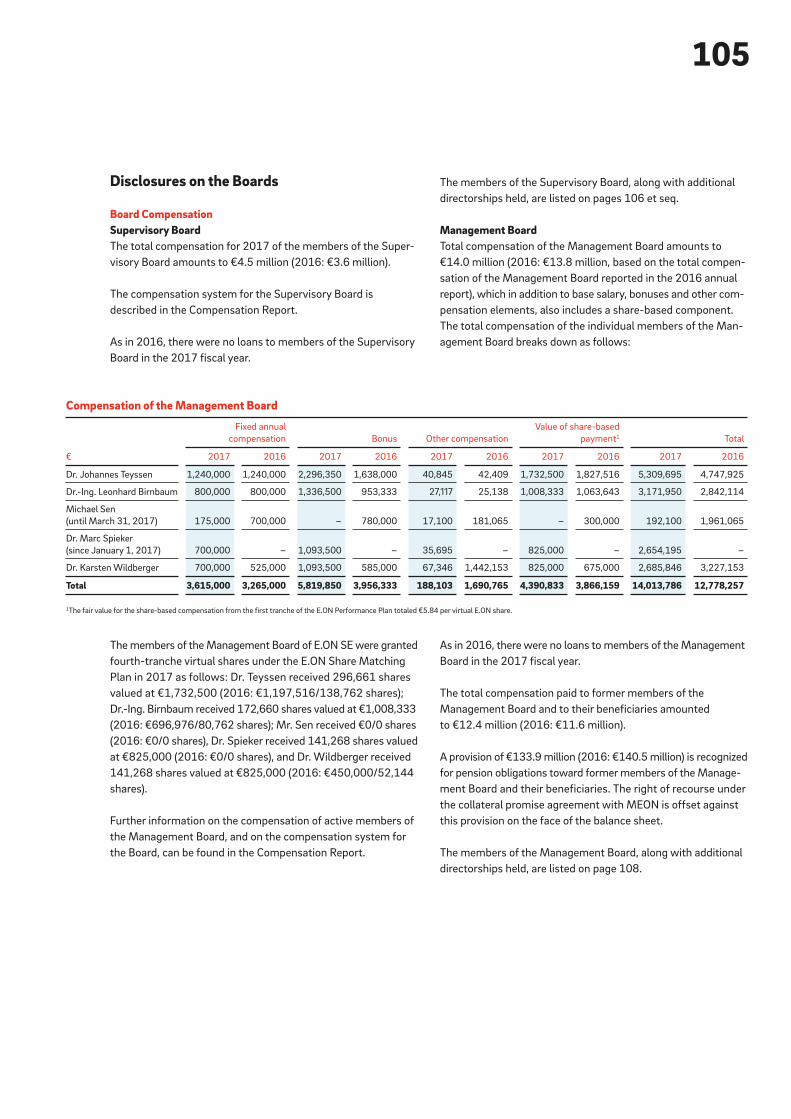
105
Disclosures on the Boards
Board CompensationSupervisory BoardThe total compensation for 2017 of the members of the Super-
visory Board amounts to €4.5 million (2016: €3.6 million).
The compensation system for the Supervisory Board is
described in the Compensation Report.
As in 2016, there were no loans to members of the Supervisory
Board in the 2017 fiscal year.
The members of the Management Board of E.ON SE were granted
fourth-tranche virtual shares under the E.ON Share Matching
Plan in 2017 as follows: Dr. Teyssen received 296,661 shares
valued at €1,732,500 (2016: €1,197,516/138,762 shares);
Dr.-Ing. Birnbaum received 172,660 shares valued at €1,008,333
(2016: €696,976/80,762 shares); Mr. Sen received €0/0 shares
(2016: €0/0 shares), Dr. Spieker received 141,268 shares valued
at €825,000 (2016: €0/0 shares), and Dr. Wildberger received
141,268 shares valued at €825,000 (2016: €450,000/52,144
shares).
Further information on the compensation of active members of
the Management Board, and on the compensation system for
the Board, can be found in the Compensation Report.
As in 2016, there were no loans to members of the Management
Board in the 2017 fiscal year.
The total compensation paid to former members of the
Management Board and to their beneficiaries amounted
to €12.4 million (2016: €11.6 million).
A provision of €133.9 million (2016: €140.5 million) is recognized
for pension obligations toward former members of the Manage-
ment Board and their beneficiaries. The right of recourse under
the collateral promise agreement with MEON is offset against
this provision on the face of the balance sheet.
The members of the Management Board, along with additional
directorships held, are listed on page 108.
Compensation of the Management Board
€
Fixed annual
compensation Bonus Other compensation
Value of share-based
payment1 Total
2017 2016 2017 2016 2017 2016 2017 2016 2017 2016
Dr. Johannes Teyssen 1,240,000 1,240,000 2,296,350 1,638,000 40,845 42,409 1,732,500 1,827,516 5,309,695 4,747,925
Dr.-Ing. Leonhard Birnbaum 800,000 800,000 1,336,500 953,333 27,117 25,138 1,008,333 1,063,643 3,171,950 2,842,114
Michael Sen
(until March 31, 2017) 175,000 700,000 – 780,000 17,100 181,065 – 300,000 192,100 1,961,065
Dr. Marc Spieker
(since January 1, 2017) 700,000 – 1,093,500 – 35,695 – 825,000 – 2,654,195 –
Dr. Karsten Wildberger 700,000 525,000 1,093,500 585,000 67,346 1,442,153 825,000 675,000 2,685,846 3,227,153
Total 3,615,000 3,265,000 5,819,850 3,956,333 188,103 1,690,765 4,390,833 3,866,159 14,013,786 12,778,257
1The fair value for the share-based compensation from the first tranche of the E.ON Performance Plan totaled €5.84 per virtual E.ON share.
The members of the Supervisory Board, along with additional
directorships held, are listed on pages 106 et seq.
Management BoardTotal compensation of the Management Board amounts to
€14.0 million (2016: €13.8 million, based on the total compen-
sation of the Management Board reported in the 2016 annual
report), which in addition to base salary, bonuses and other com-
pensation elements, also includes a share-based component.
The total compensation of the individual members of the Man-
agement Board breaks down as follows:

106Notes
Thies Hansen (until December 31, 2017)Chairman of the Combined Works Council, HanseWerk AG
Chairman of the Works Council Hamburg of HanseWerk AG
HanseWerk AG
Schleswig-Holstein Netz AG
Hamburg Netz GmbH
Carolina Dybeck Happe Chief Financial Officer of ASSA ABLOY AB
ASSA ABLOY Asia Holding AB (Chairperson)
ASSA ABLOY East Europe AB (Chairperson)
ASSA ABLOY Entrance Systems AB (Chairperson)
ASSA ABLOY Financial Services AB (Chairperson)
ASSA ABLOY Finans AB (Chairperson)
ASSA ABLOY IP AB (Chairperson)
ASSA ABLOY Kredit AB (Chairperson)
ASSA ABLOY Mobile Services AB (Chairperson)
Svensk Dörrinvest AB (Chairperson until September 6, 2017)
Baroness Denise Kingsmill CBEAttorney at the Supreme Court
Member of the House of Lords
Monzo Bank Ltd. (Chairperson)
Inditex S.A.
International Consolidated Airlines Group S.A.
(until June 16, 2017)
Telecom Italia S.p.A. (until May 10, 2017)
Eugen-Gheorghe LuhaChairman of Romanian Federation of Gas Unions at Gaz România
Chairman of Romanian employee representatives
Andreas Schmitz Chairman of the Supervisory Board of
HSBC Trinkaus & Burkhardt AG
Börse Düsseldorf AG (Chairman until April 25, 2017)
HSBC Trinkaus & Burkhardt AG (Chairman)
Scheidt & Bachmann GmbH (Chairman)
KfW
Dr. Karl-Ludwig Kley Chairman of the E.ON SE Supervisory Board
BMW AG
Deutsche Lufthansa AG
(Chairman since September 25, 2017)
Verizon Communications Inc.
Prof. Dr. Ulrich LehnerMember of the Shareholders’ Committee of
Henkel AG & Co. KGaA
Deputy Chairman of the E.ON SE Supervisory Board
Deutsche Telekom AG (Chairman)
thyssenkrupp AG (Chairman)
Porsche Automobil Holding SE
Henkel AG & Co. KGaA
Andreas ScheidtDeputy Chairman of the E.ON SE Supervisory Board
Member of National Board, Unified Service Sector Union, ver.di,
Director of Utility/Waste Management Section
Uniper SE (until June 8, 2017)
Clive Broutta Full-time Representative of the General, Municipal,
Boilermakers, and Allied Trade Union (GMB)
Erich Clementi Senior Vice President, Global Integrated Accounts and
Chairman, IBM Europe
Tibor Gila Chairman of the Combined Works Council of E.ON Hungária Zrt.
Deputy Chairman of the SE Works Council of E.ON SE
Chairman of the Works Council of E.ON Észak-dunántúli
Áramhálózati Zrt.
E.ON Észak-dunántúli Áramhálózati Zrt.
Supervisory Board (and Information on Other Directorships)
Unless otherwise indicated, information is as of December 31, 2017, or as of the date on which membership in the E.ON SE Supervisory Board ended.
Directorships/supervisory board memberships within the meaning of Section 100, Paragraph 2 of the German Stock Corporation Act.
Directorships/memberships in comparable domestic and foreign supervisory bodies of commercial enterprises.

107
Unless otherwise indicated, information is as of December 31, 2017, or as of the date on which membership in the E.ON SE Supervisory Board ended.
Directorships/supervisory board memberships within the meaning of Section 100, Paragraph 2 of the German Stock Corporation Act.
Directorships/memberships in comparable domestic and foreign supervisory bodies of commercial enterprises.
Fred SchulzChairman of the SE Works Council of E.ON SE
Deputy Chairman of the E.ON Group Works Council
Chairman of the General Works Council of E.DIS AG
Chairman of the Works Council of E.DIS Netz GmbH-Region East
E.DIS AG
Szczecińska Energetyka Cieplna Sp. z o.o.
Silvia Šmátralová Chairperson of the Works Council of Západoslovenská
energetika a.s. (ZSE)
Member of the SE Works Council of E.ON SE
Západoslovenská distribučná a.s.
Západoslovenská energetika a.s.
Dr. Karen de Segundo Attorney
Dr. Theo SiegertManaging Partner, de Haen-Carstanjen & Söhne
Henkel AG & Co. KGaA
Merck KGaA
DKSH Holding Ltd.
E. Merck KG
Elisabeth WallbaumExpert, SE Works Council of E.ON SE and
E.ON Group Works Council
Ewald Woste Management Consultant
TEAG Thüringer Energie AG (Chairman)
GASAG AG
GreenCom Networks AG (since August 3, 2017)
Deutsche Energie-Agentur GmbH (dena)
(since October 20, 2017)
Energie Steiermark AG
TEN Thüringer Energienetze GmbH & Co. KG
Albert Zettl Deputy Chairman of the SE Works Council of E.ON SE
Chairman of the E.ON Group Works Council
Chairman of the Division Works Council of Bayernwerk AG
Chairman of the Eastern Bavaria Works Council of Bayernwerk
Netz GmbH
Bayernwerk AG
Versorgungskasse Energie VVaG i.L.
Supervisory Board Committees
Executive CommitteeDr. Karl-Ludwig Kley, Chairman
Prof. Dr. Ulrich Lehner, Deputy Chairman
Andreas Scheidt, Deputy Chairman
Fred Schulz
Audit and Risk CommitteeDr. Theo Siegert, Chairman
Fred Schulz, Deputy Chairman
Thies Hansen (until December 31, 2017)
Dr. Karl-Ludwig Kley (until March 31, 2017)
Andreas Schmitz (since April 1, 2017)
Elisabeth Wallbaum (since January 1, 2018)
Investment and Innovation Committee (until March 31, 2017 Finance and Investment Committee)Dr. Karl-Ludwig Kley, Chairman (until March 31, 2017)
Dr. Karen de Segundo, Chairperson
(Chairperson since April 1, 2017)
Eugen-Gheorghe Luha, Deputy Chairman
(Deputy Chairman until August 1, 2017)
Albert Zettl, Deputy Chairman
(since April 1, 2017, Deputy Chairman since August 2, 2017)
Clive Broutta
Carolina Dybeck Happe (since April 1, 2017)
Ewald Woste (since April 1, 2017)
Nomination CommitteeDr. Karl-Ludwig Kley, Chairman
Prof. Dr. Ulrich Lehner, Deputy Chairman
Dr. Karen de Segundo
108Notes
Michael Sen (until March 31, 2017)Born in 1968 in Korschenbroich, Germany
Member of the Management Board since 2015
Finance, Mergers and Acquisitions, Risk Management,
Accounting and Controlling, Investor Relations, Tax, Uniper
Dr. Marc SpiekerBorn in 1975 in Essen, Germany
Member of the Management Board since January 1, 2017
Finance, Mergers and Acquisitions, Risk Management,
Accounting and Controlling, Investor Relations, Tax, Uniper
Uniper SE
Nord Stream AG (since June 1, 2017)
Dr. Karsten WildbergerBorn in 1969 in Gießen, Germany
Member of the Management Board since 2016
Regional Sales and Customer Solutions, Distributed Generation,
Energy Management, Marketing, Digital Transformation,
Innovation, IT
E.ON Business Services GmbH1
(Chairman since January 6, 2017)
E.ON Sverige AB2
E.ON Energie A.S.2 (Chairman, since June 1, 2017)
Dr. Johannes TeyssenBorn in 1959 in Hildesheim, Germany
Chairman of the Management Board and CEO since 2010
Member of the Management Board since 2004
Strategy and Corporate Development, Turkey, HR,
Political Affairs and Communications, Legal and Compliance,
Corporate Audit, Reorganization Project
Deutsche Bank AG
Uniper SE (until June 8, 2017)
Nord Stream AG (since June 1, 2017)
Dr.-Ing. Leonhard BirnbaumBorn in 1967 in Ludwigshafen, Germany
Member of the Management Board since 2013
Regional Energy Networks, Renewables, Regulation Policy,
Health/Safety and Environment, Sustainability, Procurement
and Real Estate Management, Consulting, PreussenElektra
E.ON Czech Holding AG1 (Chairman)
Georgsmarienhütte Holding GmbH
E.ON Sverige AB2 (Chairman)
E.ON Hungária Zrt.2 (Chairman)
Management Board (and Information on Other Directorships)
Unless otherwise indicated, information is as of December 31, 2017, or as of the date on which membership in the E.ON Management Board ended.
Directorships/supervisory board memberships within the meaning of Section 100, Paragraph 2 of the German Stock Corporation Act.
Directorships/memberships in comparable domestic and foreign supervisory bodies of commercial enterprises.1Exempted E.ON Group directorship within the meaning of Section 100, Paragraph 2, Sentence 2 of the German Stock Corporation Act. 2Other E.ON Group directorship.

109
Dividend Proposal
The Management Board proposes to the Annual Shareholders
Meeting that the €1,320,307,680.65 in net income available
for distribution for the 2017 fiscal year be used as follows:
The dividend proposal takes into account the dividend-paying
shares at the time the annual financial statements were pre-
pared on March 12, 2018.
€
Distribution of a dividend of €0.30
per share with dividend rights 650,144,829.90
Net income transferred to retained earnings 670,162,850.75
Total 1,320,307,680.65
110NotesNotes
Other Information
Disclosures pursuant to Section 285 No. 11 HGB of Companies in Which Equity Investments Are Held (as of December 31, 2017)
Name Location
Stake
%
Equity
€ in millions
Earnings
€ in millions
:agile accelerator GmbH 2, 9 DE, Düsseldorf 100.0 0.1 –
Abfallwirtschaftsgesellschaft Rendsburg-Eckernförde mbH 6 DE, Borgstedt 49.0 10.1 0.8
Amrum-Offshore West GmbH 1, 9 DE, Düsseldorf 100.0 0.1 –
Anacacho Wind Farm, LLC 1 US, Wilmington 100.0 129.0 -4.1
AV Packaging GmbH 1 DE, Munich 0.0 17.7 3.8
Avacon AG 1 DE, Helmstedt 61.5 1,323.5 226.2
Avacon Beteiligungen GmbH 1, 9 DE, Helmstedt 100.0 61.0 –
Avacon Hochdrucknetz GmbH 1, 9 DE, Helmstedt 100.0 14.5 –
Avacon Natur GmbH 1, 9 DE, Sarstedt 100.0 17.8 –
Avacon Netz GmbH 1, 9 DE, Helmstedt 100.0 907.6 –
AWE-Arkona-Windpark Entwicklungs-GmbH 4 DE, Hamburg 50.0 186.2 0.2
Bayernwerk AG 1, 9 DE, Regensburg 100.0 1,637.7 –
Bayernwerk Natur GmbH 1 DE, Unterschleißheim 100.0 75.1 3.4
Bayernwerk Netz GmbH 1, 9 DE, Regensburg 100.0 880.0 –
BMV Energie GmbH & Co. KG 6 DE, Fürstenwalde/Spree 25.6 16.9 0.3
Celle-Uelzen Netz GmbH 1, 9 DE, Celle 97.5 77.5 –
Champion WF Holdco, LLC 1 US, Wilmington 100.0 116.6 -10.4
Champion Wind Farm, LLC 1 US, Wilmington 100.0 116.6 -10.4
Charge-ON GmbH 1 DE, Essen 100.0 14.9 -5.1
Citigen (London) Limited 1 GB, Coventry 100.0 -26.6 -28.5
Colbeck’s Corner, LLC 1 US, Wilmington 100.0 243.3 -2.6
DD Turkey Holdings S.à r.l. 1 LU, Luxembourg 100.0 2,744.9 -0.1
Delgaz Grid S.A. 1 RO, Târgu Mureş 56.5 825.2 50.4
DOTI Deutsche Offshore-Testfeld- und Infrastruktur-GmbH & Co. KG 5 DE, Oldenburg 26.3 159.7 3.8
Dutchdelta Finance S.à r.l. 1 LU, Luxembourg 100.0 2,747.3 -0.4
E WIE EINFACH GmbH 1, 9 DE, Cologne 100.0 50.0 –
E.DIS AG 1 DE, Fürstenwalde/Spree 67.0 1,278.8 154.3
E.DIS Netz GmbH 1, 9 DE, Fürstenwalde/Spree 100.0 817.0 –
e.discom Telekommunikation GmbH 2 DE, Rostock 100.0 19.0 3.2
e.disnatur Erneuerbare Energien GmbH 1, 9 DE, Potsdam 100.0 3.2 –
e.distherm Wärmedienstleistungen GmbH 1 DE, Potsdam 100.0 29.9 2.0
e.kundenservice Netz GmbH 1 DE, Hamburg 100.0 39.4 1.5
E.ON Asset Management GmbH & Co. EEA KG 1, 8 DE, Grünwald 100.0 355.5 9.2
E.ON Beteiligungen GmbH 1, 8, 9 DE, Düsseldorf 100.0 17,890.5 –
E.ON Bioerdgas GmbH 1, 9 DE, Essen 100.0 0.0 –
E.ON Business Services Berlin GmbH 1, 9 DE, Berlin 100.0 11.5 –
E.ON Business Services GmbH 1, 9 DE, Hanover 100.0 557.2 –
1Consolidated affiliated company. · 2Non-consolidated affiliated company for reasons of immateriality (valued at cost). · 3Joint operations pursuant to IFRS 11. · 4Joint ventures pursuant to IFRS 11. 5Associated company (valued using the equity method). · 6Associated company (valued at cost for reasons of immateriality). · 7Other companies in which share investments are held. · 8This company
exercised its exemption option under Section 264, Paragraph 3 of the German Commercial Code or under Section 264b. · 9Profit and loss pooling agreement (earnings after pooling). · 10E.ON SE is an
unlimited-liability partner. · 11IFRS figures. · 12Founded in 2017.
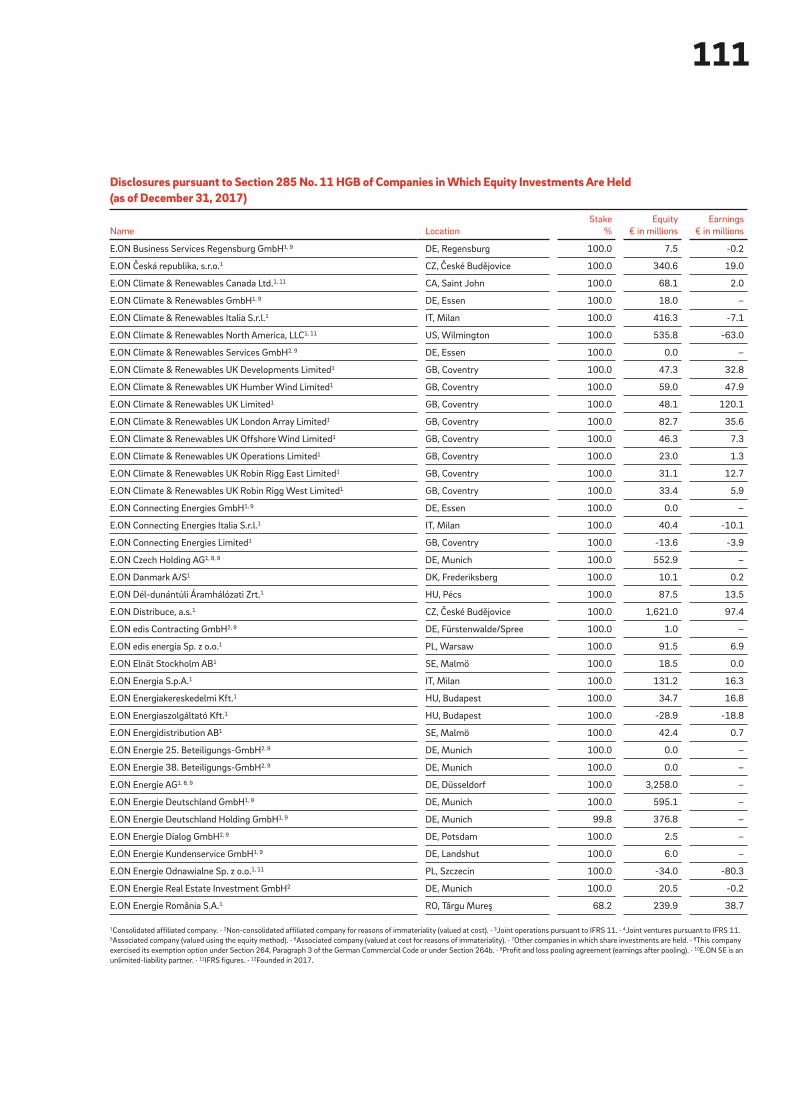
111
Disclosures pursuant to Section 285 No. 11 HGB of Companies in Which Equity Investments Are Held (as of December 31, 2017)
Name Location
Stake
%
Equity
€ in millions
Earnings
€ in millions
E.ON Business Services Regensburg GmbH 1, 9 DE, Regensburg 100.0 7.5 -0.2
E.ON Česká republika, s.r.o. 1 CZ, České Budějovice 100.0 340.6 19.0
E.ON Climate & Renewables Canada Ltd. 1, 11 CA, Saint John 100.0 68.1 2.0
E.ON Climate & Renewables GmbH 1, 9 DE, Essen 100.0 18.0 –
E.ON Climate & Renewables Italia S.r.l. 1 IT, Milan 100.0 416.3 -7.1
E.ON Climate & Renewables North America, LLC 1, 11 US, Wilmington 100.0 535.8 -63.0
E.ON Climate & Renewables Services GmbH 2, 9 DE, Essen 100.0 0.0 –
E.ON Climate & Renewables UK Developments Limited 1 GB, Coventry 100.0 47.3 32.8
E.ON Climate & Renewables UK Humber Wind Limited 1 GB, Coventry 100.0 59.0 47.9
E.ON Climate & Renewables UK Limited 1 GB, Coventry 100.0 48.1 120.1
E.ON Climate & Renewables UK London Array Limited 1 GB, Coventry 100.0 82.7 35.6
E.ON Climate & Renewables UK Offshore Wind Limited 1 GB, Coventry 100.0 46.3 7.3
E.ON Climate & Renewables UK Operations Limited 1 GB, Coventry 100.0 23.0 1.3
E.ON Climate & Renewables UK Robin Rigg East Limited 1 GB, Coventry 100.0 31.1 12.7
E.ON Climate & Renewables UK Robin Rigg West Limited 1 GB, Coventry 100.0 33.4 5.9
E.ON Connecting Energies GmbH 1, 9 DE, Essen 100.0 0.0 –
E.ON Connecting Energies Italia S.r.l. 1 IT, Milan 100.0 40.4 -10.1
E.ON Connecting Energies Limited 1 GB, Coventry 100.0 -13.6 -3.9
E.ON Czech Holding AG 1, 8, 9 DE, Munich 100.0 552.9 –
E.ON Danmark A/S 1 DK, Frederiksberg 100.0 10.1 0.2
E.ON Dél-dunántúli Áramhálózati Zrt. 1 HU, Pécs 100.0 87.5 13.5
E.ON Distribuce, a.s. 1 CZ, České Budějovice 100.0 1,621.0 97.4
E.ON edis Contracting GmbH 2, 9 DE, Fürstenwalde/Spree 100.0 1.0 –
E.ON edis energia Sp. z o.o. 1 PL, Warsaw 100.0 91.5 6.9
E.ON Elnät Stockholm AB 1 SE, Malmö 100.0 18.5 0.0
E.ON Energia S.p.A. 1 IT, Milan 100.0 131.2 16.3
E.ON Energiakereskedelmi Kft. 1 HU, Budapest 100.0 34.7 16.8
E.ON Energiaszolgáltató Kft. 1 HU, Budapest 100.0 -28.9 -18.8
E.ON Energidistribution AB 1 SE, Malmö 100.0 42.4 0.7
E.ON Energie 25. Beteiligungs-GmbH 2, 9 DE, Munich 100.0 0.0 –
E.ON Energie 38. Beteiligungs-GmbH 2, 9 DE, Munich 100.0 0.0 –
E.ON Energie AG 1, 8, 9 DE, Düsseldorf 100.0 3,258.0 –
E.ON Energie Deutschland GmbH 1, 9 DE, Munich 100.0 595.1 –
E.ON Energie Deutschland Holding GmbH 1, 9 DE, Munich 99.8 376.8 –
E.ON Energie Dialog GmbH 2, 9 DE, Potsdam 100.0 2.5 –
E.ON Energie Kundenservice GmbH 1, 9 DE, Landshut 100.0 6.0 –
E.ON Energie Odnawialne Sp. z o.o. 1, 11 PL, Szczecin 100.0 -34.0 -80.3
E.ON Energie Real Estate Investment GmbH 2 DE, Munich 100.0 20.5 -0.2
E.ON Energie România S.A. 1 RO, Târgu Mureş 68.2 239.9 38.7
1Consolidated affiliated company. · 2Non-consolidated affiliated company for reasons of immateriality (valued at cost). · 3Joint operations pursuant to IFRS 11. · 4Joint ventures pursuant to IFRS 11. 5Associated company (valued using the equity method). · 6Associated company (valued at cost for reasons of immateriality). · 7Other companies in which share investments are held. · 8This company
exercised its exemption option under Section 264, Paragraph 3 of the German Commercial Code or under Section 264b. · 9Profit and loss pooling agreement (earnings after pooling). · 10E.ON SE is an
unlimited-liability partner. · 11IFRS figures. · 12Founded in 2017.
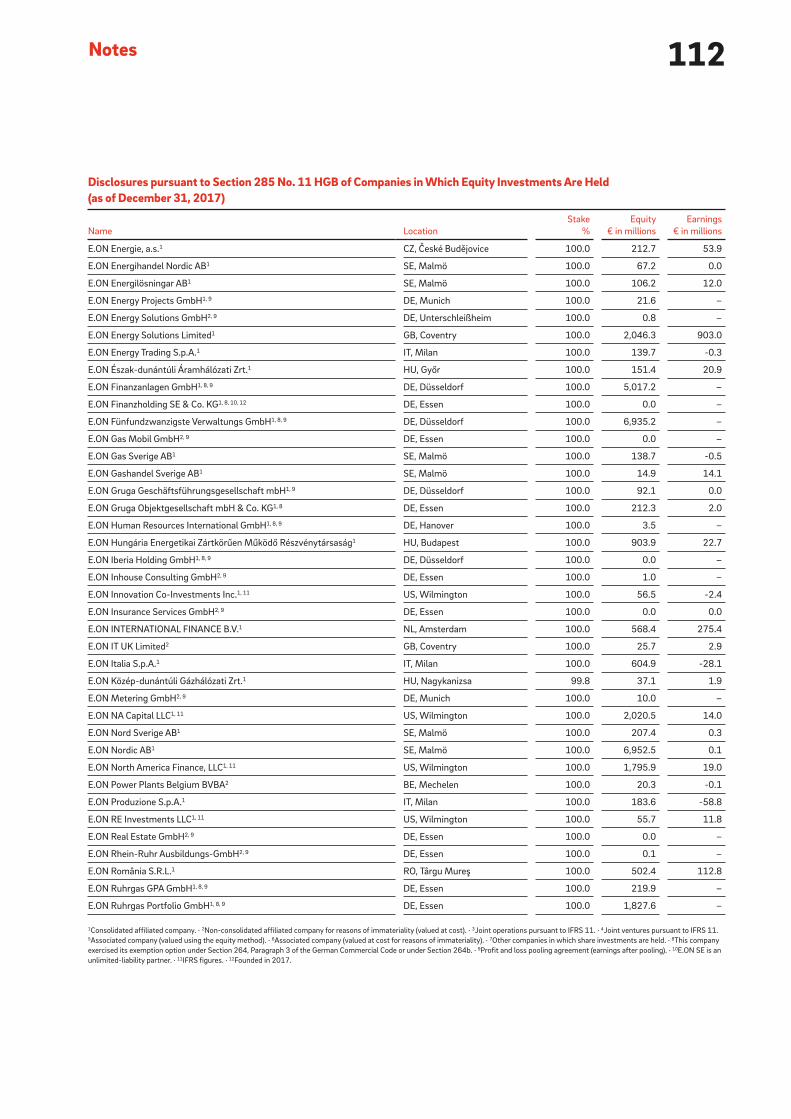
112Notes
Disclosures pursuant to Section 285 No. 11 HGB of Companies in Which Equity Investments Are Held (as of December 31, 2017)
Name Location
Stake
%
Equity
€ in millions
Earnings
€ in millions
E.ON Energie, a.s. 1 CZ, České Budějovice 100.0 212.7 53.9
E.ON Energihandel Nordic AB 1 SE, Malmö 100.0 67.2 0.0
E.ON Energilösningar AB 1 SE, Malmö 100.0 106.2 12.0
E.ON Energy Projects GmbH 1, 9 DE, Munich 100.0 21.6 –
E.ON Energy Solutions GmbH 2, 9 DE, Unterschleißheim 100.0 0.8 –
E.ON Energy Solutions Limited 1 GB, Coventry 100.0 2,046.3 903.0
E.ON Energy Trading S.p.A. 1 IT, Milan 100.0 139.7 -0.3
E.ON Észak-dunántúli Áramhálózati Zrt. 1 HU, Győr 100.0 151.4 20.9
E.ON Finanzanlagen GmbH 1, 8, 9 DE, Düsseldorf 100.0 5,017.2 –
E.ON Finanzholding SE & Co. KG 1, 8, 10, 12 DE, Essen 100.0 0.0 –
E.ON Fünfundzwanzigste Verwaltungs GmbH 1, 8, 9 DE, Düsseldorf 100.0 6,935.2 –
E.ON Gas Mobil GmbH 2, 9 DE, Essen 100.0 0.0 –
E.ON Gas Sverige AB 1 SE, Malmö 100.0 138.7 -0.5
E.ON Gashandel Sverige AB 1 SE, Malmö 100.0 14.9 14.1
E.ON Gruga Geschäftsführungsgesellschaft mbH 1, 9 DE, Düsseldorf 100.0 92.1 0.0
E.ON Gruga Objektgesellschaft mbH & Co. KG 1, 8 DE, Essen 100.0 212.3 2.0
E.ON Human Resources International GmbH 1, 8, 9 DE, Hanover 100.0 3.5 –
E.ON Hungária Energetikai Zártkörűen Működő Részvénytársaság 1 HU, Budapest 100.0 903.9 22.7
E.ON Iberia Holding GmbH 1, 8, 9 DE, Düsseldorf 100.0 0.0 –
E.ON Inhouse Consulting GmbH 2, 9 DE, Essen 100.0 1.0 –
E.ON Innovation Co-Investments Inc. 1, 11 US, Wilmington 100.0 56.5 -2.4
E.ON Insurance Services GmbH 2, 9 DE, Essen 100.0 0.0 0.0
E.ON INTERNATIONAL FINANCE B.V. 1 NL, Amsterdam 100.0 568.4 275.4
E.ON IT UK Limited 2 GB, Coventry 100.0 25.7 2.9
E.ON Italia S.p.A. 1 IT, Milan 100.0 604.9 -28.1
E.ON Közép-dunántúli Gázhálózati Zrt. 1 HU, Nagykanizsa 99.8 37.1 1.9
E.ON Metering GmbH 2, 9 DE, Munich 100.0 10.0 –
E.ON NA Capital LLC 1, 11 US, Wilmington 100.0 2,020.5 14.0
E.ON Nord Sverige AB 1 SE, Malmö 100.0 207.4 0.3
E.ON Nordic AB 1 SE, Malmö 100.0 6,952.5 0.1
E.ON North America Finance, LLC 1, 11 US, Wilmington 100.0 1,795.9 19.0
E.ON Power Plants Belgium BVBA 2 BE, Mechelen 100.0 20.3 -0.1
E.ON Produzione S.p.A. 1 IT, Milan 100.0 183.6 -58.8
E.ON RE Investments LLC 1, 11 US, Wilmington 100.0 55.7 11.8
E.ON Real Estate GmbH 2, 9 DE, Essen 100.0 0.0 –
E.ON Rhein-Ruhr Ausbildungs-GmbH 2, 9 DE, Essen 100.0 0.1 –
E.ON România S.R.L. 1 RO, Târgu Mureş 100.0 502.4 112.8
E.ON Ruhrgas GPA GmbH 1, 8, 9 DE, Essen 100.0 219.9 –
E.ON Ruhrgas Portfolio GmbH 1, 8, 9 DE, Essen 100.0 1,827.6 –
1Consolidated affiliated company. · 2Non-consolidated affiliated company for reasons of immateriality (valued at cost). · 3Joint operations pursuant to IFRS 11. · 4Joint ventures pursuant to IFRS 11. 5Associated company (valued using the equity method). · 6Associated company (valued at cost for reasons of immateriality). · 7Other companies in which share investments are held. · 8This company
exercised its exemption option under Section 264, Paragraph 3 of the German Commercial Code or under Section 264b. · 9Profit and loss pooling agreement (earnings after pooling). · 10E.ON SE is an
unlimited-liability partner. · 11IFRS figures. · 12Founded in 2017.

113
Disclosures pursuant to Section 285 No. 11 HGB of Companies in Which Equity Investments Are Held (as of December 31, 2017)
Name Location
Stake
%
Equity
€ in millions
Earnings
€ in millions
E.ON Sechzehnte Verwaltungs GmbH 1, 8, 9 DE, Düsseldorf 100.0 90.7 –
E.ON Service GmbH 2, 9 DE, Essen 100.0 3.4 –
E.ON Servisní, s.r.o. 1 CZ, České Budějovice 100.0 21.9 2.0
E.ON Slovensko, a.s. 1 SK, Bratislava 100.0 402.4 21.9
E.ON Sverige AB 1 SE, Malmö 100.0 3,613.4 174.9
E.ON Tiszántúli Áramhálózati Zrt. 1 HU, Debrecen 100.0 101.4 17.3
E.ON UK CoGeneration Limited 1 GB, Coventry 100.0 -16.7 -22.3
E.ON UK Energy Markets Limited 1 GB, Coventry 100.0 23.4 0.0
E.ON UK Holding Company Limited 1 GB, Coventry 100.0 1,923.7 -46.4
E.ON UK plc 1 GB, Coventry 100.0 2,814.8 0.2
E.ON US Corporation 1, 11 US, Wilmington 100.0 3,760.7 -15.6
E.ON US Holding GmbH 1, 8, 9 DE, Düsseldorf 100.0 1,168.9 –
E.ON Värme Sverige AB 1 SE, Malmö 100.0 211.2 5.1
E.ON Wind Kårehamn AB 1 SE, Malmö 100.0 36.6 10.6
E.ON Wind Service GmbH 2, 9 DE, Neubukow 100.0 1.2 0.0
E.ON Wind Sweden AB 1 SE, Malmö 100.0 47.3 2.0
E.ON Zweiundzwanzigste Verwaltungs GmbH 2, 9 DE, Düsseldorf 100.0 0.0 –
EBY Port 1 GmbH 1, 8, 9 DE, Munich 100.0 92.5 –
EBY Port 3 GmbH 1 DE, Regensburg 100.0 141.6 0.2
EC&R Asset Management, LLC 1, 11 US, Wilmington 100.0 -11.5 4.5
EC&R Canada Ltd. 1, 11 CA, Saint John 100.0 80.9 0.0
EC&R Development, LLC 1, 11 US, Wilmington 100.0 56.8 -4.8
EC&R Energy Marketing, LLC 1, 11 US, Wilmington 100.0 -46.9 -14.6
EC&R Investco Mgmt II, LLC 1, 11 US, Wilmington 100.0 316.3 0.3
EC&R Investco Mgmt, LLC 1, 11 US, Wilmington 100.0 1,261.7 1.4
EC&R Magicat Holdco, LLC 1, 11 US, Wilmington 100.0 68.5 8.0
EC&R NA Solar PV, LLC 1, 11 US, Wilmington 100.0 26.1 -4.7
EC&R Panther Creek Wind Farm III, LLC 1, 11 US, Wilmington 100.0 169.5 -4.4
EC&R Services, LLC 1, 11 US, Wilmington 100.0 28.0 -27.5
EC&R Solar Development, LLC 1, 11 US, Wilmington 100.0 10.8 -5.3
Economy Power Limited 1 GB, Coventry 100.0 28.4 –
Elektrizitätswerk Schwandorf GmbH 2 DE, Schwandorf 100.0 21.3 0.7
Elevate Wind Holdco, LLC 4, 11 US, Wilmington 50.0 204.4 -1.5
ENACO Energieanlagen- und Kommunikationstechnik GmbH 6 DE, Maisach 26.0 26.9 5.4
Energetyka Cieplna Opolszczyzny S.A. 6 PL, Opole 46.7 63.2 8.8
Energie und Wasser Potsdam GmbH 5 DE, Potsdam 35.0 93.3 6.5
Energie Vorpommern GmbH 6 DE, Trassenheide 49.0 16.0 0.9
Energieversorgung Alzenau GmbH (EVA) 6 DE, Alzenau 69.5 12.0 1.0
Enerjisa Enerji A.Ş. 4 TR, Istanbul 50.0 2,087.1 71.3
1Consolidated affiliated company. · 2Non-consolidated affiliated company for reasons of immateriality (valued at cost). · 3Joint operations pursuant to IFRS 11. · 4Joint ventures pursuant to IFRS 11. 5Associated company (valued using the equity method). · 6Associated company (valued at cost for reasons of immateriality). · 7Other companies in which share investments are held. · 8This company
exercised its exemption option under Section 264, Paragraph 3 of the German Commercial Code or under Section 264b. · 9Profit and loss pooling agreement (earnings after pooling). · 10E.ON SE is an
unlimited-liability partner. · 11IFRS figures. · 12Founded in 2017.

114Notes
Disclosures pursuant to Section 285 No. 11 HGB of Companies in Which Equity Investments Are Held (as of December 31, 2017)
Name Location
Stake
%
Equity
€ in millions
Earnings
€ in millions
EPS Polska Holding Sp. z o.o. 1 PL, Warsaw 100.0 17.5 -7.3
Ergon Overseas Holdings Limited 1 GB, Coventry 100.0 972.9 –
e-werk Sachsenwald GmbH 7 DE, Reinbek 16.0 27.6 4.2
EZV Energie- und Service GmbH & Co. KG Untermain 6 DE, Wörth am Main 28.9 10.0 1.9
Forest Creek Investco, Inc. 1, 11 US, Wilmington 100.0 -20.6 0.0
Forest Creek WF Holdco, LLC 1 US, Wilmington 100.0 97.6 -2.8
Forest Creek Wind Farm, LLC 1 US, Wilmington 100.0 97.6 -2.8
GASAG AG 5 DE, Berlin 36.9 492.4 -34.8
Gasversorgung im Landkreis Gifhorn GmbH 1 DE, Gifhorn 95.0 17.9 2.9
Gasversorgung Unterfranken Gesellschaft mit beschränkter Haftung 5 DE, Würzburg 49.0 40.6 11.7
Gelsenberg GmbH & Co. KG 1, 8 DE, Düsseldorf 100.0 143.5 –
Gelsenwasser Beteiligungs-GmbH 2, 9 DE, Munich 100.0 0.0 –
Gemeindewerke Wedemark GmbH 6 DE, Wedemark 49.0 12.7 0.5
Gemeinschaftskernkraftwerk Grohnde GmbH & Co. oHG 1 DE, Emmerthal 100.0 413.0 125.3
Gemeinschaftskraftwerk Weser GmbH & Co. oHG. 1 DE, Emmerthal 66.7 18.9 -104.9
Gesellschaft für Energie und Klimaschutz Schleswig-Holstein GmbH 6 DE, Kiel 33.3 20.8 -1.6
GNS Gesellschaft für Nuklear-Service mbH 6 DE, Essen 48.0 37.2 11.3
Grandview Wind Farm, LLC 4 US, Wilmington 50.0 331.3 9.6
Hamburg Netz GmbH 1, 9 DE, Hamburg 74.9 82.6 –
HanseGas GmbH 1, 9 DE, Quickborn 100.0 66.1 0.0
HanseWerk AG 1 DE, Quickborn 66.5 476.2 114.2
HanseWerk Natur GmbH 1, 9 DE, Hamburg 100.0 59.0 –
Harzwasserwerke GmbH 5 DE, Hildesheim 20.8 90.0 6.6
Herzo Werke GmbH 7 DE, Herzogenaurach 19.9 12.8 –
HEW HofEnergie+Wasser GmbH 7 DE, Hof 19.9 22.1 –
HGC Hamburg Gas Consult GmbH 2, 9 DE, Hamburg 100.0 3.1 –
iamsmart GmbH 2, 9 DE, Essen 100.0 0.5 –
Inadale Wind Farm, LLC 1, 11 US, Wilmington 100.0 144.3 -3.5
Induboden GmbH 2 DE, Düsseldorf 100.0 14.0 0.0
Induboden GmbH & Co. Grundstücksgesellschaft OHG 2, 10 DE, Essen 100.0 12.0 –
Industriekraftwerk Greifswald GmbH 6 DE, Kassel 49.0 26.2 1.0
infra fürth gmbh 7 DE, Fürth 19.9 70.4 –
InfraServ - Bayernwerk Gendorf GmbH 6 DE, Burgkirchen a.d.Alz 50.0 22.3 -0.1
Kalmar Energi Holding AB 4 SE, Kalmar 50.0 18.5 0.0
Kernkraftwerk Brokdorf GmbH & Co. oHG 1 DE, Hamburg 80.0 441.6 -60.5
Kernkraftwerk Brunsbüttel GmbH & Co. oHG 5 DE, Hamburg 33.3 125.7 -97.0
Kernkraftwerk Gundremmingen GmbH 5 DE, Gundremmingen 25.0 84.2 8.3
Kernkraftwerk Krümmel GmbH & Co. oHG 3 DE, Hamburg 50.0 220.2 -179.9
Kernkraftwerk Stade GmbH & Co. oHG 1 DE, Hamburg 66.7 53.0 -64.0
1Consolidated affiliated company. · 2Non-consolidated affiliated company for reasons of immateriality (valued at cost). · 3Joint operations pursuant to IFRS 11. · 4Joint ventures pursuant to IFRS 11. 5Associated company (valued using the equity method). · 6Associated company (valued at cost for reasons of immateriality). · 7Other companies in which share investments are held. · 8This company
exercised its exemption option under Section 264, Paragraph 3 of the German Commercial Code or under Section 264b. · 9Profit and loss pooling agreement (earnings after pooling). · 10E.ON SE is an
unlimited-liability partner. · 11IFRS figures. · 12Founded in 2017.
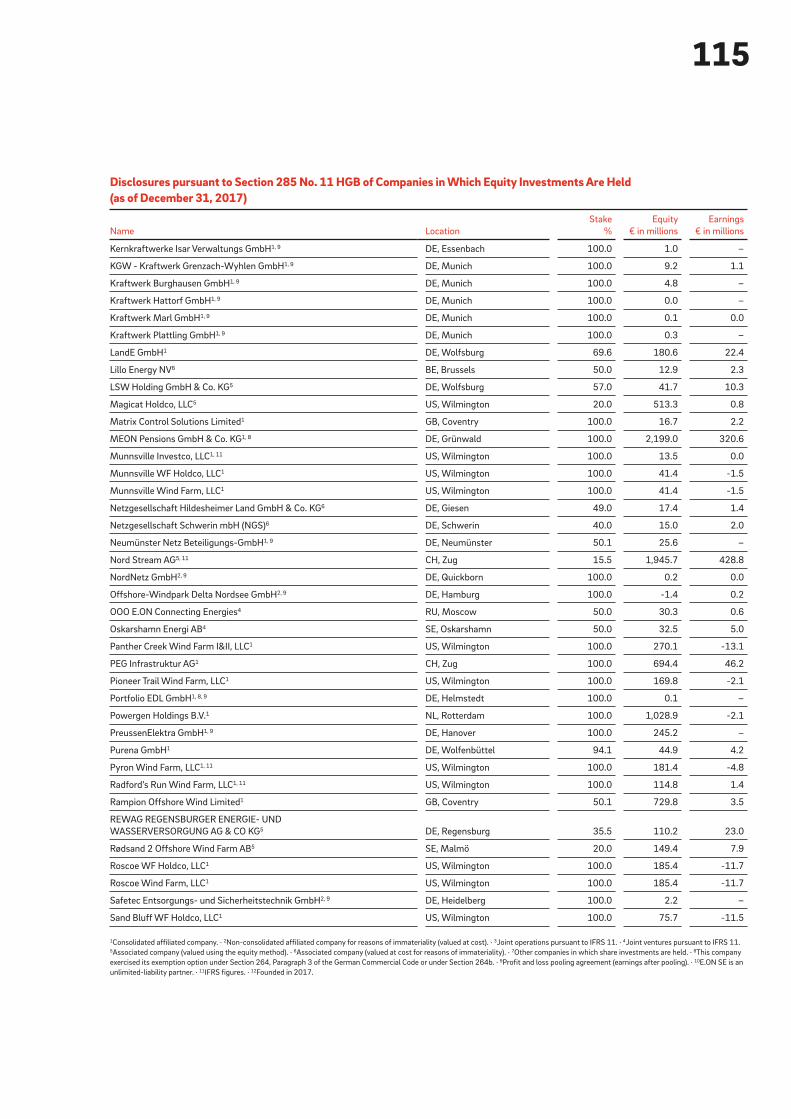
115
Disclosures pursuant to Section 285 No. 11 HGB of Companies in Which Equity Investments Are Held (as of December 31, 2017)
Name Location
Stake
%
Equity
€ in millions
Earnings
€ in millions
Kernkraftwerke Isar Verwaltungs GmbH 1, 9 DE, Essenbach 100.0 1.0 –
KGW - Kraftwerk Grenzach-Wyhlen GmbH 1, 9 DE, Munich 100.0 9.2 1.1
Kraftwerk Burghausen GmbH 1, 9 DE, Munich 100.0 4.8 –
Kraftwerk Hattorf GmbH 1, 9 DE, Munich 100.0 0.0 –
Kraftwerk Marl GmbH 1, 9 DE, Munich 100.0 0.1 0.0
Kraftwerk Plattling GmbH 1, 9 DE, Munich 100.0 0.3 –
LandE GmbH 1 DE, Wolfsburg 69.6 180.6 22.4
Lillo Energy NV 6 BE, Brussels 50.0 12.9 2.3
LSW Holding GmbH & Co. KG 5 DE, Wolfsburg 57.0 41.7 10.3
Magicat Holdco, LLC 5 US, Wilmington 20.0 513.3 0.8
Matrix Control Solutions Limited 1 GB, Coventry 100.0 16.7 2.2
MEON Pensions GmbH & Co. KG 1, 8 DE, Grünwald 100.0 2,199.0 320.6
Munnsville Investco, LLC 1, 11 US, Wilmington 100.0 13.5 0.0
Munnsville WF Holdco, LLC 1 US, Wilmington 100.0 41.4 -1.5
Munnsville Wind Farm, LLC 1 US, Wilmington 100.0 41.4 -1.5
Netzgesellschaft Hildesheimer Land GmbH & Co. KG 6 DE, Giesen 49.0 17.4 1.4
Netzgesellschaft Schwerin mbH (NGS) 6 DE, Schwerin 40.0 15.0 2.0
Neumünster Netz Beteiligungs-GmbH 1, 9 DE, Neumünster 50.1 25.6 –
Nord Stream AG 5, 11 CH, Zug 15.5 1,945.7 428.8
NordNetz GmbH 2, 9 DE, Quickborn 100.0 0.2 0.0
Offshore-Windpark Delta Nordsee GmbH 2, 9 DE, Hamburg 100.0 -1.4 0.2
OOO E.ON Connecting Energies 4 RU, Moscow 50.0 30.3 0.6
Oskarshamn Energi AB 4 SE, Oskarshamn 50.0 32.5 5.0
Panther Creek Wind Farm I&II, LLC 1 US, Wilmington 100.0 270.1 -13.1
PEG Infrastruktur AG 1 CH, Zug 100.0 694.4 46.2
Pioneer Trail Wind Farm, LLC 1 US, Wilmington 100.0 169.8 -2.1
Portfolio EDL GmbH 1, 8, 9 DE, Helmstedt 100.0 0.1 –
Powergen Holdings B.V. 1 NL, Rotterdam 100.0 1,028.9 -2.1
PreussenElektra GmbH 1, 9 DE, Hanover 100.0 245.2 –
Purena GmbH 1 DE, Wolfenbüttel 94.1 44.9 4.2
Pyron Wind Farm, LLC 1, 11 US, Wilmington 100.0 181.4 -4.8
Radford’s Run Wind Farm, LLC 1, 11 US, Wilmington 100.0 114.8 1.4
Rampion Offshore Wind Limited 1 GB, Coventry 50.1 729.8 3.5
REWAG REGENSBURGER ENERGIE- UND
WASSERVERSORGUNG AG & CO KG 5 DE, Regensburg 35.5 110.2 23.0
Rødsand 2 Offshore Wind Farm AB 5 SE, Malmö 20.0 149.4 7.9
Roscoe WF Holdco, LLC 1 US, Wilmington 100.0 185.4 -11.7
Roscoe Wind Farm, LLC 1 US, Wilmington 100.0 185.4 -11.7
Safetec Entsorgungs- und Sicherheitstechnik GmbH 2, 9 DE, Heidelberg 100.0 2.2 –
Sand Bluff WF Holdco, LLC 1 US, Wilmington 100.0 75.7 -11.5
1Consolidated affiliated company. · 2Non-consolidated affiliated company for reasons of immateriality (valued at cost). · 3Joint operations pursuant to IFRS 11. · 4Joint ventures pursuant to IFRS 11. 5Associated company (valued using the equity method). · 6Associated company (valued at cost for reasons of immateriality). · 7Other companies in which share investments are held. · 8This company
exercised its exemption option under Section 264, Paragraph 3 of the German Commercial Code or under Section 264b. · 9Profit and loss pooling agreement (earnings after pooling). · 10E.ON SE is an
unlimited-liability partner. · 11IFRS figures. · 12Founded in 2017.
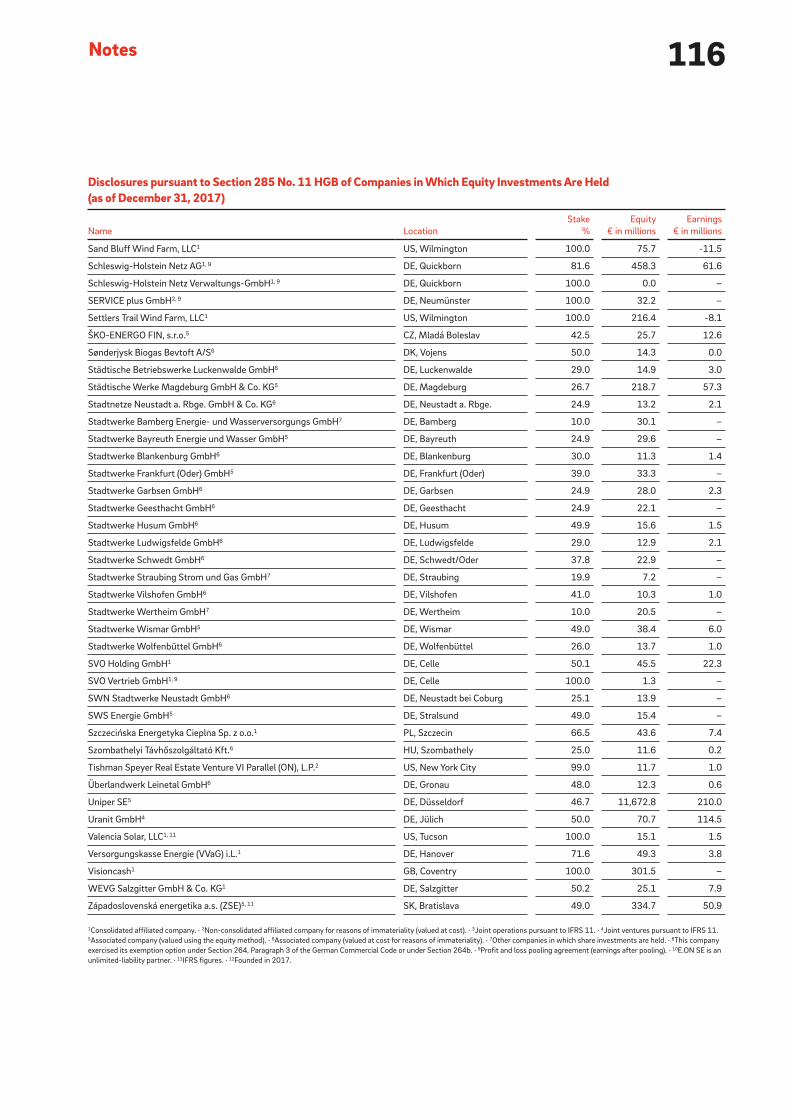
116Notes
Disclosures pursuant to Section 285 No. 11 HGB of Companies in Which Equity Investments Are Held (as of December 31, 2017)
Name Location
Stake
%
Equity
€ in millions
Earnings
€ in millions
Sand Bluff Wind Farm, LLC 1 US, Wilmington 100.0 75.7 -11.5
Schleswig-Holstein Netz AG 1, 9 DE, Quickborn 81.6 458.3 61.6
Schleswig-Holstein Netz Verwaltungs-GmbH 1, 9 DE, Quickborn 100.0 0.0 –
SERVICE plus GmbH 2, 9 DE, Neumünster 100.0 32.2 –
Settlers Trail Wind Farm, LLC 1 US, Wilmington 100.0 216.4 -8.1
ŠKO-ENERGO FIN, s.r.o. 5 CZ, Mladá Boleslav 42.5 25.7 12.6
Sønderjysk Biogas Bevtoft A/S 6 DK, Vojens 50.0 14.3 0.0
Städtische Betriebswerke Luckenwalde GmbH 6 DE, Luckenwalde 29.0 14.9 3.0
Städtische Werke Magdeburg GmbH & Co. KG 5 DE, Magdeburg 26.7 218.7 57.3
Stadtnetze Neustadt a. Rbge. GmbH & Co. KG 6 DE, Neustadt a. Rbge. 24.9 13.2 2.1
Stadtwerke Bamberg Energie- und Wasserversorgungs GmbH 7 DE, Bamberg 10.0 30.1 –
Stadtwerke Bayreuth Energie und Wasser GmbH 5 DE, Bayreuth 24.9 29.6 –
Stadtwerke Blankenburg GmbH 6 DE, Blankenburg 30.0 11.3 1.4
Stadtwerke Frankfurt (Oder) GmbH 5 DE, Frankfurt (Oder) 39.0 33.3 –
Stadtwerke Garbsen GmbH 6 DE, Garbsen 24.9 28.0 2.3
Stadtwerke Geesthacht GmbH 6 DE, Geesthacht 24.9 22.1 –
Stadtwerke Husum GmbH 6 DE, Husum 49.9 15.6 1.5
Stadtwerke Ludwigsfelde GmbH 6 DE, Ludwigsfelde 29.0 12.9 2.1
Stadtwerke Schwedt GmbH 6 DE, Schwedt/Oder 37.8 22.9 –
Stadtwerke Straubing Strom und Gas GmbH 7 DE, Straubing 19.9 7.2 –
Stadtwerke Vilshofen GmbH 6 DE, Vilshofen 41.0 10.3 1.0
Stadtwerke Wertheim GmbH 7 DE, Wertheim 10.0 20.5 –
Stadtwerke Wismar GmbH 5 DE, Wismar 49.0 38.4 6.0
Stadtwerke Wolfenbüttel GmbH 6 DE, Wolfenbüttel 26.0 13.7 1.0
SVO Holding GmbH 1 DE, Celle 50.1 45.5 22.3
SVO Vertrieb GmbH 1, 9 DE, Celle 100.0 1.3 –
SWN Stadtwerke Neustadt GmbH 6 DE, Neustadt bei Coburg 25.1 13.9 –
SWS Energie GmbH 5 DE, Stralsund 49.0 15.4 –
Szczecińska Energetyka Cieplna Sp. z o.o. 1 PL, Szczecin 66.5 43.6 7.4
Szombathelyi Távhőszolgáltató Kft. 6 HU, Szombathely 25.0 11.6 0.2
Tishman Speyer Real Estate Venture VI Parallel (ON), L.P. 2 US, New York City 99.0 11.7 1.0
Überlandwerk Leinetal GmbH 6 DE, Gronau 48.0 12.3 0.6
Uniper SE 5 DE, Düsseldorf 46.7 11,672.8 210.0
Uranit GmbH 4 DE, Jülich 50.0 70.7 114.5
Valencia Solar, LLC 1, 11 US, Tucson 100.0 15.1 1.5
Versorgungskasse Energie (VVaG) i.L. 1 DE, Hanover 71.6 49.3 3.8
Visioncash 1 GB, Coventry 100.0 301.5 –
WEVG Salzgitter GmbH & Co. KG 1 DE, Salzgitter 50.2 25.1 7.9
Západoslovenská energetika a.s. (ZSE) 5, 11 SK, Bratislava 49.0 334.7 50.9
1Consolidated affiliated company. · 2Non-consolidated affiliated company for reasons of immateriality (valued at cost). · 3Joint operations pursuant to IFRS 11. · 4Joint ventures pursuant to IFRS 11. 5Associated company (valued using the equity method). · 6Associated company (valued at cost for reasons of immateriality). · 7Other companies in which share investments are held. · 8This company
exercised its exemption option under Section 264, Paragraph 3 of the German Commercial Code or under Section 264b. · 9Profit and loss pooling agreement (earnings after pooling). · 10E.ON SE is an
unlimited-liability partner. · 11IFRS figures. · 12Founded in 2017.

117
To the best of our knowledge, we declare that, in accordance with
applicable financial reporting principles, the Annual Financial
Statements give a true and fair view of the assets, liabilities,
financial position and profit or loss of the Company, and the
Management Report of the Company, which is combined with
the Group Management Report, provides a fair review of the
development and performance of the business and the position
of the Company, together with a description of the principal
opportunities and risks associated with the expected develop-
ment of the Company.
Essen, Germany, March 12, 2018
The Management Board
Teyssen
Wildberger
Birnbaum
Spieker
Declaration of the Board of Management

118Independent Auditor’s Report
Audits promulgated by the Institut der Wirtschaftsprüfer [Insti-
tute of Public Auditors in Germany] (IDW). We performed the
audit of the annual financial statements in supplementary com-
pliance with the International Standards on Auditing (ISAs). Our
responsibilities under those requirements and principles and
standards are further described in the “Auditor’s Responsibili-
ties for the Audit of the Annual Financial Statements and of the
Management Report” section of our auditor’s report. We are
independent of the Company in accordance with the require-
ments of European law and German commercial and profes-
sional law, and we have fulfilled our other German professional
responsibilities in accordance with these requirements. In addi-
tion, in accordance with Article 10 (2) point (f) of the EU Audit
Regulation, we declare that we have not provided non-audit
services prohibited under Article 5 (1) of the EU Audit Regula-
tion. We believe that the audit evidence we have obtained is
sufficient and appropriate to provide a basis for our audit opin-
ions on the annual financial statements and on the manage-
ment report.
Key Audit Matters in the Audit of the Annual Financial Statements
Key audit matters are those matters that, in our professional
judgment, were of most significance in our audit of the annual
financial statements for the financial year from January 1 to
December 31, 2017. These matters were addressed in the con-
text of our audit of the annual financial statements as a whole,
and in forming our audit opinion thereon; we do not provide a
separate audit opinion on these matters.
In our view, the matters of most significance in our audit were
as follows:
1. Recoverability of shares in affiliated companies and net
investment income
2. Financing activities
Our presentation of these key audit matters has been struc-
tured in each case as follows:
a. Matter and issue
b. Audit approach and findings
c. Reference to further information
Hereinafter we present the key audit matters:
To E.ON SE, Essen
Report on the Audit of the Annual Financial Statements and of the Management Report
Audit Opinions
We have audited the annual financial statements of E.ON SE,
Essen, which comprise the balance sheet as at December 31,
2017, and the income statement for the financial year from
January 1, to December 31, 2017, and notes to the financial
statements, including the recognition and measurement poli-
cies presented therein. In addition, we have audited the man-
agement report of E.ON SE, which is combined with the Group
management report, for the financial year from January 1, to
December 31, 2017. We have not audited the content of those
parts of the management report listed in the “Other Informa-
tion” section of our auditor’s report in accordance with the Ger-
man legal requirements.
In our opinion, on the basis of the knowledge obtained in the
audit,
• the accompanying annual financial statements comply, in all
material respects, with the requirements of German com-
mercial law and give a true and fair view of the assets, liabili-
ties and financial position of the Company as at December
31, 2017 and of its financial performance for the financial
year from January 1 to December 31, 2017 in compliance
with German Legally Required Accounting Principles, and
• the accompanying management report as a whole provides
an appropriate view of the Company’s position. In all mate-
rial respects, this management report is consistent with the
annual financial statements, complies with German legal
requirements and appropriately presents the opportunities
and risks of future development. Our audit opinion on the
management report does not cover the content of those
parts of the management report listed in the “Other Infor-
mation” section of our auditor’s report.
Pursuant to § [Article] 322 Abs. [paragraph] 3 Satz [sentence] 1
HGB [Handelsgesetzbuch: German Commercial Code], we
declare that our audit has not led to any reservations relating to
the legal compliance of the annual financial statements and of
the management report.
Basis for the Audit Opinions
We conducted our audit of the annual financial statements and
of the management report in accordance with § 317 HGB and
the EU Audit Regulation (No. 537/2014, referred to subse-
quently as “EU Audit Regulation”) and in compliance with Ger-
man Generally Accepted Standards for Financial Statement
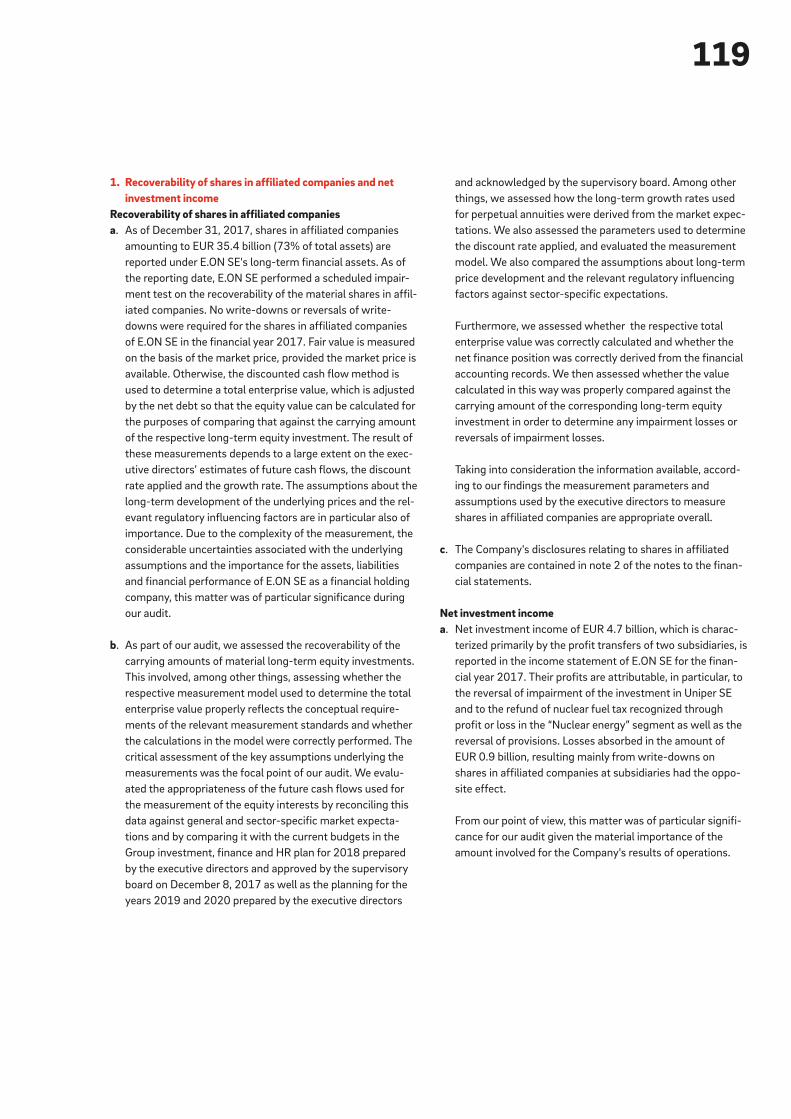
119
1. Recoverability of shares in affiliated companies and net investment income
Recoverability of shares in affiliated companiesa. As of December 31, 2017, shares in affiliated companies
amounting to EUR 35.4 billion (73% of total assets) are
reported under E.ON SE's long-term financial assets. As of
the reporting date, E.ON SE performed a scheduled impair-
ment test on the recoverability of the material shares in affil-
iated companies. No write-downs or reversals of write-
downs were required for the shares in affiliated companies
of E.ON SE in the financial year 2017. Fair value is measured
on the basis of the market price, provided the market price is
available. Otherwise, the discounted cash flow method is
used to determine a total enterprise value, which is adjusted
by the net debt so that the equity value can be calculated for
the purposes of comparing that against the carrying amount
of the respective long-term equity investment. The result of
these measurements depends to a large extent on the exec-
utive directors’ estimates of future cash flows, the discount
rate applied and the growth rate. The assumptions about the
long-term development of the underlying prices and the rel-
evant regulatory influencing factors are in particular also of
importance. Due to the complexity of the measurement, the
considerable uncertainties associated with the underlying
assumptions and the importance for the assets, liabilities
and financial performance of E.ON SE as a financial holding
company, this matter was of particular significance during
our audit.
b. As part of our audit, we assessed the recoverability of the
carrying amounts of material long-term equity investments.
This involved, among other things, assessing whether the
respective measurement model used to determine the total
enterprise value properly reflects the conceptual require-
ments of the relevant measurement standards and whether
the calculations in the model were correctly performed. The
critical assessment of the key assumptions underlying the
measurements was the focal point of our audit. We evalu-
ated the appropriateness of the future cash flows used for
the measurement of the equity interests by reconciling this
data against general and sector-specific market expecta-
tions and by comparing it with the current budgets in the
Group investment, finance and HR plan for 2018 prepared
by the executive directors and approved by the supervisory
board on December 8, 2017 as well as the planning for the
years 2019 and 2020 prepared by the executive directors
and acknowledged by the supervisory board. Among other
things, we assessed how the long-term growth rates used
for perpetual annuities were derived from the market expec-
tations. We also assessed the parameters used to determine
the discount rate applied, and evaluated the measurement
model. We also compared the assumptions about long-term
price development and the relevant regulatory influencing
factors against sector-specific expectations.
Furthermore, we assessed whether the respective total
enterprise value was correctly calculated and whether the
net finance position was correctly derived from the financial
accounting records. We then assessed whether the value
calculated in this way was properly compared against the
carrying amount of the corresponding long-term equity
investment in order to determine any impairment losses or
reversals of impairment losses.
Taking into consideration the information available, accord-
ing to our findings the measurement parameters and
assumptions used by the executive directors to measure
shares in affiliated companies are appropriate overall.
c. The Company's disclosures relating to shares in affiliated
companies are contained in note 2 of the notes to the finan-
cial statements.
Net investment incomea. Net investment income of EUR 4.7 billion, which is charac-
terized primarily by the profit transfers of two subsidiaries, is
reported in the income statement of E.ON SE for the finan-
cial year 2017. Their profits are attributable, in particular, to
the reversal of impairment of the investment in Uniper SE
and to the refund of nuclear fuel tax recognized through
profit or loss in the “Nuclear energy” segment as well as the
reversal of provisions. Losses absorbed in the amount of
EUR 0.9 billion, resulting mainly from write-downs on
shares in affiliated companies at subsidiaries had the oppo-
site effect.
From our point of view, this matter was of particular signifi-
cance for our audit given the material importance of the
amount involved for the Company's results of operations.
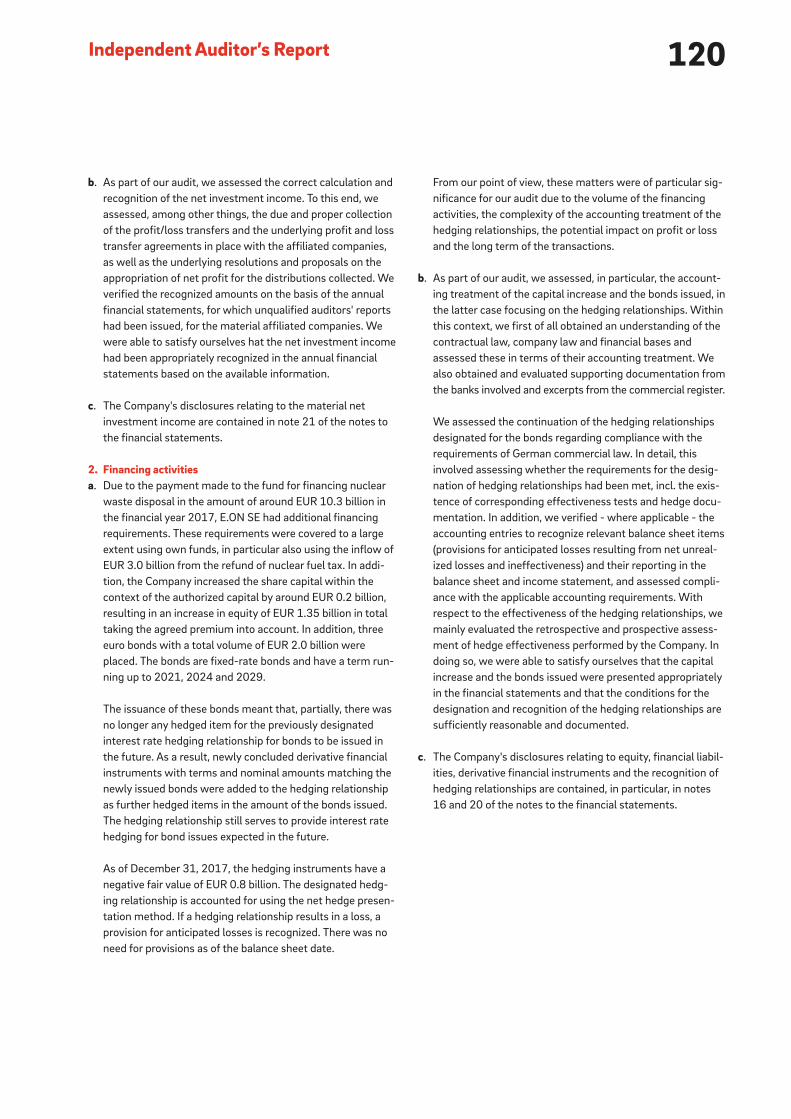
120Independent Auditor’s Report
From our point of view, these matters were of particular sig-
nificance for our audit due to the volume of the financing
activities, the complexity of the accounting treatment of the
hedging relationships, the potential impact on profit or loss
and the long term of the transactions.
b. As part of our audit, we assessed, in particular, the account-
ing treatment of the capital increase and the bonds issued, in
the latter case focusing on the hedging relationships. Within
this context, we first of all obtained an understanding of the
contractual law, company law and financial bases and
assessed these in terms of their accounting treatment. We
also obtained and evaluated supporting documentation from
the banks involved and excerpts from the commercial register.
We assessed the continuation of the hedging relationships
designated for the bonds regarding compliance with the
requirements of German commercial law. In detail, this
involved assessing whether the requirements for the desig-
nation of hedging relationships had been met, incl. the exis-
tence of corresponding effectiveness tests and hedge docu-
mentation. In addition, we verified - where applicable - the
accounting entries to recognize relevant balance sheet items
(provisions for anticipated losses resulting from net unreal-
ized losses and ineffectiveness) and their reporting in the
balance sheet and income statement, and assessed compli-
ance with the applicable accounting requirements. With
respect to the effectiveness of the hedging relationships, we
mainly evaluated the retrospective and prospective assess-
ment of hedge effectiveness performed by the Company. In
doing so, we were able to satisfy ourselves that the capital
increase and the bonds issued were presented appropriately
in the financial statements and that the conditions for the
designation and recognition of the hedging relationships are
sufficiently reasonable and documented.
c. The Company's disclosures relating to equity, financial liabil-
ities, derivative financial instruments and the recognition of
hedging relationships are contained, in particular, in notes
16 and 20 of the notes to the financial statements.
b. As part of our audit, we assessed the correct calculation and
recognition of the net investment income. To this end, we
assessed, among other things, the due and proper collection
of the profit/loss transfers and the underlying profit and loss
transfer agreements in place with the affiliated companies,
as well as the underlying resolutions and proposals on the
appropriation of net profit for the distributions collected. We
verified the recognized amounts on the basis of the annual
financial statements, for which unqualified auditors' reports
had been issued, for the material affiliated companies. We
were able to satisfy ourselves hat the net investment income
had been appropriately recognized in the annual financial
statements based on the available information.
c. The Company's disclosures relating to the material net
investment income are contained in note 21 of the notes to
the financial statements.
2. Financing activitiesa. Due to the payment made to the fund for financing nuclear
waste disposal in the amount of around EUR 10.3 billion in
the financial year 2017, E.ON SE had additional financing
requirements. These requirements were covered to a large
extent using own funds, in particular also using the inflow of
EUR 3.0 billion from the refund of nuclear fuel tax. In addi-
tion, the Company increased the share capital within the
context of the authorized capital by around EUR 0.2 billion,
resulting in an increase in equity of EUR 1.35 billion in total
taking the agreed premium into account. In addition, three
euro bonds with a total volume of EUR 2.0 billion were
placed. The bonds are fixed-rate bonds and have a term run-
ning up to 2021, 2024 and 2029.
The issuance of these bonds meant that, partially, there was
no longer any hedged item for the previously designated
interest rate hedging relationship for bonds to be issued in
the future. As a result, newly concluded derivative financial
instruments with terms and nominal amounts matching the
newly issued bonds were added to the hedging relationship
as further hedged items in the amount of the bonds issued.
The hedging relationship still serves to provide interest rate
hedging for bond issues expected in the future.
As of December 31, 2017, the hedging instruments have a
negative fair value of EUR 0.8 billion. The designated hedg-
ing relationship is accounted for using the net hedge presen-
tation method. If a hedging relationship results in a loss, a
provision for anticipated losses is recognized. There was no
need for provisions as of the balance sheet date.

121
In preparing the annual financial statements, the executive
directors are responsible for assessing the Company’s ability to
continue as a going concern. They also have the responsibility
for disclosing, as applicable, matters related to going concern.
In addition, they are responsible for financial reporting based on
the going concern basis of accounting, provided no actual or
legal circumstances conflict therewith.
Furthermore, the executive directors are responsible for the
preparation of the management report that as a whole provides
an appropriate view of the Company’s position and is, in all
material respects, consistent with the annual financial state-
ments, complies with German legal requirements, and appro-
priately presents the opportunities and risks of future develop-
ment. In addition, the executive directors are responsible for
such arrangements and measures (systems) as they have con-
sidered necessary to enable the preparation of a management
report that is in accordance with the applicable German legal
requirements, and to be able to provide sufficient appropriate
evidence for the assertions in the management report.
The supervisory board is responsible for overseeing the Compa-
ny’s financial reporting process for the preparation of the annual
financial statements and of the management report.
Auditor’s Responsibilities for the Audit of the Annual Financial Statements and of the Man-agement Report
Our objectives are to obtain reasonable assurance about
whether the annual financial statements as a whole are free
from material misstatement, whether due to fraud or error, and
whether the management report as a whole provides an appro-
priate view of the Company’s position and, in all material
respects, is consistent with the annual financial statements and
the knowledge obtained in the audit, complies with the German
legal requirements and appropriately presents the opportunities
and risks of future development, as well as to issue an auditor’s
report that includes our audit opinions on the annual financial
statements and on the management report.
Other Information
The executive directors are responsible for the other informa-
tion. The other information comprises the following non-au-
dited parts of the management report:
• the statement on corporate governance pursuant to § 289f
HGB and § 315d HGB included in section “Corporate Gover-
nance Report” of the management report
• the separate non-financial report pursuant to § 289b Abs. 3
HGB and § 315b Abs. 3 HGB
Our audit opinions on the annual financial statements and on
the management report do not cover the other information, and
consequently we do not express an audit opinion or any other
form of assurance conclusion thereon.
In connection with our audit, our responsibility is to read the
other information and, in so doing, to consider whether the
other information
• is materially inconsistent with the annual financial state-
ments, with the management report or our knowledge
obtained in the audit, or
• otherwise appears to be materially misstated.
If, based on the work we have performed, we conclude that
there is a material misstatement of this other information, we
are required to report that fact. We have nothing to report in
this regard.
Responsibilities of the Executive Directors and the Supervisory Board for the Annual Financial Statements and the Management Report
The executive directors are responsible for the preparation of
the annual financial statements that comply, in all material
respects, with the requirements of German commercial law,
and that the annual financial statements give a true and fair
view of the assets, liabilities, financial position and financial
performance of the Company in compliance with German
Legally Required Accounting Principles. In addition, the execu-
tive directors are responsible for such internal control as they, in
accordance with German Legally Required Accounting Princi-
ples, have determined necessary to enable the preparation of
annual financial statements that are free from material mis-
statement, whether due to fraud or error.

122
concern. If we conclude that a material uncertainty exists,
we are required to draw attention in the auditor’s report to
the related disclosures in the annual financial statements
and in the management report or, if such disclosures are
inadequate, to modify our respective audit opinions. Our
conclusions are based on the audit evidence obtained up to
the date of our auditor’s report. However, future events or
conditions may cause the Company to cease to be able to
continue as a going concern.
• Evaluate the overall presentation, structure and content of
the annual financial statements, including the disclosures,
and whether the annual financial statements present the
underlying transactions and events in a manner that the
annual financial statements give a true and fair view of the
assets, liabilities, financial position and financial perfor-
mance of the Company in compliance with German Legally
Required Accounting Principles.
• Evaluate the consistency of the management report with the
annual financial statements, its conformity with German
law, and the view of the Company’s position it provides.
• Perform audit procedures on the prospective information
presented by the executive directors in the management
report. On the basis of sufficient appropriate audit evidence
we evaluate, in particular, the significant assumptions used
by the executive directors as a basis for the prospective
information, and evaluate the proper derivation of the pro-
spective information from these assumptions. We do not
express a separate audit opinion on the prospective informa-
tion and on the assumptions used as a basis. There is a sub-
stantial unavoidable risk that future events will differ mate-
rially from the prospective information.
We communicate with those charged with governance regard-
ing, among other matters, the planned scope and timing of the
audit and significant audit findings, including any significant
deficiencies in internal control that we identify during our audit.
We also provide those charged with governance with a state-
ment that we have complied with the relevant independence
requirements, and communicate with them all relationships and
other matters that may reasonably be thought to bear on our
independence, and where applicable, the related safeguards.
Reasonable assurance is a high level of assurance, but is not a
guarantee that an audit conducted in accordance with § 317
HGB and the EU Audit Regulation and in compliance with Ger-
man Generally Accepted Standards for Financial Statement
Audits promulgated by the Institut der Wirtschaftsprüfer (IDW)
and supplementary compliance with the ISAs will always detect
a material misstatement. Misstatements can arise from fraud
or error and are considered material if, individually or in the
aggregate, they could reasonably be expected to influence the
economic decisions of users taken on the basis of these annual
financial statements and this management report.
We exercise professional judgment and maintain professional
skepticism throughout the audit. We also:
• Identify and assess the risks of material misstatement of the
annual financial statements and of the management report,
whether due to fraud or error, design and perform audit pro-
cedures responsive to those risks, and obtain audit evidence
that is sufficient and appropriate to provide a basis for our
audit opinions. The risk of not detecting a material misstate-
ment resulting from fraud is higher than for one resulting
from error, as fraud may involve collusion, forgery, inten-
tional omissions, misrepresentations, or the override of
internal controls.
• Obtain an understanding of internal control relevant to the
audit of the annual financial statements and of arrange-
ments and measures (systems) relevant to the audit of the
management report in order to design audit procedures that
are appropriate in the circumstances, but not for the purpose
of expressing an audit opinion on the effectiveness of these
systems of the Company.
• Evaluate the appropriateness of accounting policies used by
the executive directors and the reasonableness of estimates
made by the executive directors and related disclosures.
• Conclude on the appropriateness of the executive directors’
use of the going concern basis of accounting and, based on
the audit evidence obtained, whether a material uncertainty
exists related to events or conditions that may cast signifi-
cant doubt on the Company’s ability to continue as a going
Independent Auditor’s Report

123
Further Information pursuant to Article 10 of the EU Audit Regulation
We were elected as auditor by the annual general meeting on
May 10, 2017. We were engaged by the supervisory board on
May 23, 2017. We have been the auditor of the E.ON SE, Essen,
without interruption since the company first met the require-
ments as a public-interest entity within the meaning of § 319a
Abs. 1 Satz 1 HGB in the financial year 1965.
We declare that the audit opinions expressed in this auditor’s
report are consistent with the additional report to the audit
committee pursuant to Article 11 of the EU Audit Regulation
(long-form audit report).
Emphasis of Matter—Supplementary Audit
We issue this auditor’s report on the amended annual financial
statements and the amended management report on the basis
of our audit, duly completed as of 6 March 2018, and our sup-
plementary audit completed as of 12 March 2018 related to
the addition of disclosures regarding a matter that has become
known subsequent to the preparation of the annual financial
statements and the management report. We refer to the pre-
sentation of the amendments by the executive directors in the
section “Subsequent Events” in the amended notes to the finan-
cial statements as well as in the section “Earnings Situation"
and in the chapter "Forecast Report” in the amended manage-
ment report.
German Public Auditor Responsible for the Engagement
The German Public Auditor responsible for the engagement is
Aissata Touré.
Düsseldorf, 6 March 2018/limited to the above mentioned
adjustments: 12 March 2018
PricewaterhouseCoopers GmbH
Wirtschaftsprüfungsgesellschaft
(Markus Dittmann) (Aissata Touré)
Wirtschaftsprüfer Wirtschaftsprüferin
(German Public Auditor) (German Public Auditor)
From the matters communicated with those charged with
governance, we determine those matters that were of most sig-
nificance in the audit of the annual financial statements of the
current period and are therefore the key audit matters. We
describe these matters in our auditor’s report unless law or
regulation precludes public disclosure about the matter.
Other Legal and Regulatory Requirements
Report on the Audit of Compliance with the Accounting Obligations pursuant to § 6b Abs. 3 EnWG
We have audited the compliance with the accounting obliga-
tions pursuant to § 6b Abs. 3 EnWG [Energiewirtschaftsgesetz:
German Energy Industry Act], which require separate accounts
to be maintained for the activities pursuant to § 6b Abs. 3 EnWG.
In our opinion, the accounting obligations pursuant to § 6b Abs. 3
EnWG, which require separate accounts to be maintained for
the activities pursuant to § 6b Abs. 3 EnWG, have been fulfilled
in all material respects.
We conducted our audit in accordance with § 6b Abs. 5 EnWG
and in compliance with German Generally Accepted Standards
for Financial Statement Audits promulgated by the Institut der
Wirtschaftsprüfer (IDW). Our responsibilities under those
requirements and principles are further described below and in
section “Auditor’s Responsibilities for the Audit of the Annual
Financial Statements and of the Management Report.”
The executive directors are responsible for the compliance with
the obligations pursuant to § 6b Abs. 3 EnWG as well as for such
arrangements and measures (systems) as they have considered
necessary to comply with these obligations.
Our objectives are to obtain reasonable assurance about whether
the accounting obligations pursuant to § 6b Abs. 3 EnWG have
been fulfilled, in all material respects, as well as to issue a report
that includes our audit opinion on the compliance with the
accounting obligations pursuant to § 6b Abs. 3 EnWG. The audit
comprises an assessment of whether the amounts stated and
the classification of the accounts pursuant to § 6b Abs. 3 EnWG
are appropriate and comprehensible and whether the principle
of consistency has been observed.


Further information E.ON SE
Brüsseler Platz 1
45131 Essen
Germany
T +49 201-184-00
eon.com
Journalists
T +49 201-184-4236
Analysts and shareholders
T +49 201-184-2806
Bond investors
T +49 201-184-6526
The German version of E.ON SE‘s Financial Statements and Combined Group Management Report is legally binding.